tall ships america safety under sail forum: sailing vessel ... · pdf filesafety under sail...
TRANSCRIPT

Tall Ships America Safety Under Sail Forum:Sailing Vessel Stability
Part 3: SNAME-Pride II Approach
Moderator: Captain Rick Miller, MMAPanelists:
Bruce Johnson, Co-Chair Working Vessel Operations and Safety Panel O-49, SNAME
Jan C. Miles, Captain, Pride of Baltimore IIJason Quilter, Captain, R. C. Seamans
David Bank, Director of Marine Operations, SEA
Full-scale measurements on Pride II
For the past six years, The Society of Naval Architects and Marine Engineers (SNAME) has supported the full scale measurement of heel angles vs wind speed and direction using a variety of anemometers and locations on board the Pride of Baltimore II
These projects have the goal of eventually developing wind-heel operator guidance for skippers and crew that sail traditional rigged sailing vessels.

Pride of Baltimore II under full sail, WHSR=21

3D CFD Flow studies of Pride IIFlow streamlines in reaching with over-
trimmed sails
The traditional USCG worst case scenario- sails sheeted flat and wind on the beam
Since the sails can still generate lift, notice the clockwise circulation which streams off the stalled flow aft
The old anemometer location between the masts was influenced by the air dam effect of the sails, so the new location is well above the sail plan. Note how far to windward the effect extends. (Red is high velocity)

3D CFD Flow studies of Pride IIFlow streamlines in
the close hauled condition.
With all sails acting as lifting surfaces, the heeling component of the resultant forces contains both lift and drag components.
This is why the worst case heeling scenario is a wind shift in a squall gust to close reaching with the sails sheeted flat for going to windward.
The clockwise circulation produces quite a large low pressure – high velocity zone (red traces) and large heeling coefficients (1.5 vs 1.0-1.2)

The validity of the Operator Guidance charts depends on an accurate assessment of KG
(Pride II)
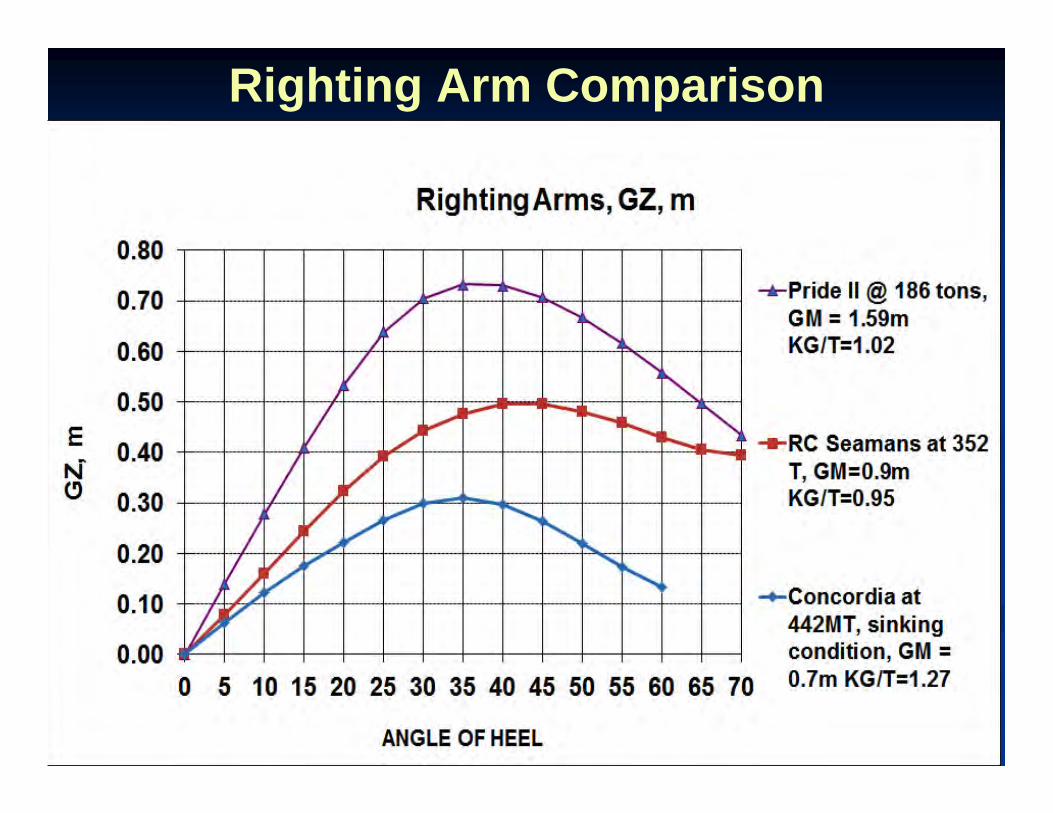
Righting Arm Comparison
Full-scale measurements on Pride II A useful parameter is to observe the variation in the Wind–
Heel Stiffness Ratio, WHSR=AWV2/HA, which appears to average out to a narrow range of values through a range of apparent wind angles for a given sail combination and sheeting situation when the heeling moment equals the vessel’s righting moment (near static equilibrium when not dominated by wave action).
Heeling Moment = constant x AWV2 is the basis for the CFD studies of both Pride II and the brig Niagara (Lasher 2007 & 2009).
The Wind-Heel Stiffness Ratio (WHSR) for each sail combination can be determined using the “Crazy Ivan” manoeuver (not related to clearing submarine baffles) in reasonably steady wind and wave conditions.
The purpose of Crazy Ivan is to clear up the wind-heel response of a sailing vessel by measuring it directly.
Systems Identification System identification uses statistical methods to
build mathematical models of dynamical systems from measured data.
A common approach is therefore to start from measurements of the behavior of the system and the external influences (such as wind speed and direction ) and try to determine a mathematical relation between wind speed and resulting heel angle without going into the details of what is actually happening inside the system.
The “Crazy Ivan” manoeuver attempts to do just that.
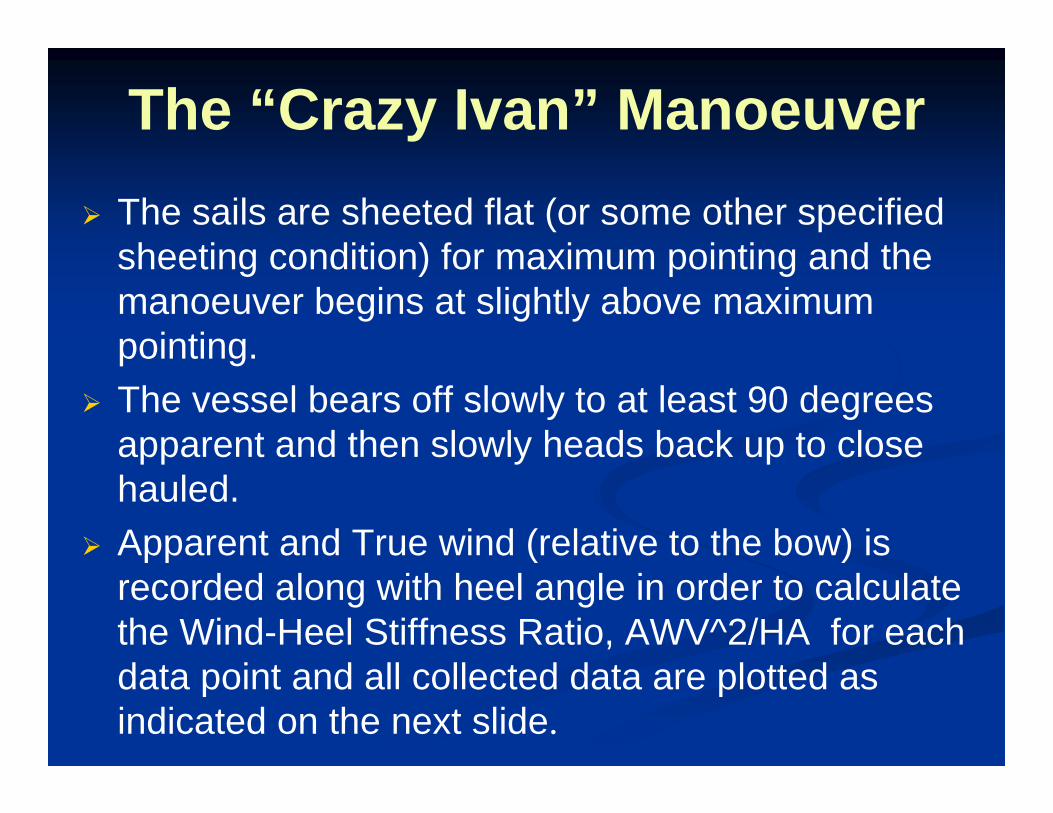
The “Crazy Ivan” Manoeuver The sails are sheeted flat (or some other specified
sheeting condition) for maximum pointing and the manoeuver begins at slightly above maximum pointing.
The vessel bears off slowly to at least 90 degrees apparent and then slowly heads back up to close hauled.
Apparent and True wind (relative to the bow) is recorded along with heel angle in order to calculate the Wind-Heel Stiffness Ratio, AWV^2/HA for each data point and all collected data are plotted as indicated on the next slide.
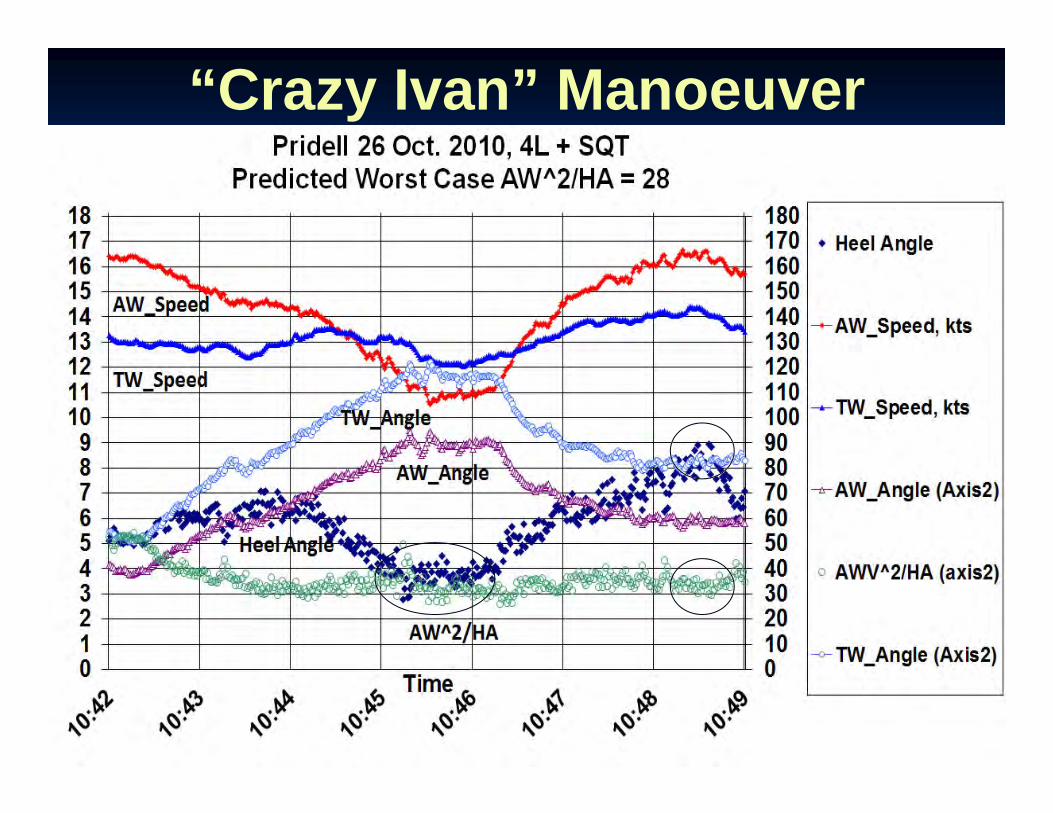
“Crazy Ivan” Manoeuver

Comments on the results from the “Crazy Ivan” Manoeuver on Pride II
Note that the ratio of WHSR (hollow green), the AW_Speed(red) squared divided by the heel angle (dark blue) is very consistent over the AW_Angles from 40 to 90 degrees.
The least stiff values of WHSR = AWV^2/HA occur at the lowest heel angles between 10:45 and 10:46 corresponding to the worst case WHSR = 28 rather than the worst case heel angle of 9 degrees@ 10:48+ which is closer to the significant AW^2/HA ≈ 30-32, a conservative estimate.
All the measurement were made with the anemometer on the main mast which measures a twisted apparent wind angle around 10 degrees closer to the wind than the foremast.
During the 2012 season, Pride II has twin anemometers on both masts and will repeat the manoeuver for various sheeting angles to better evaluate WHSR measurements.
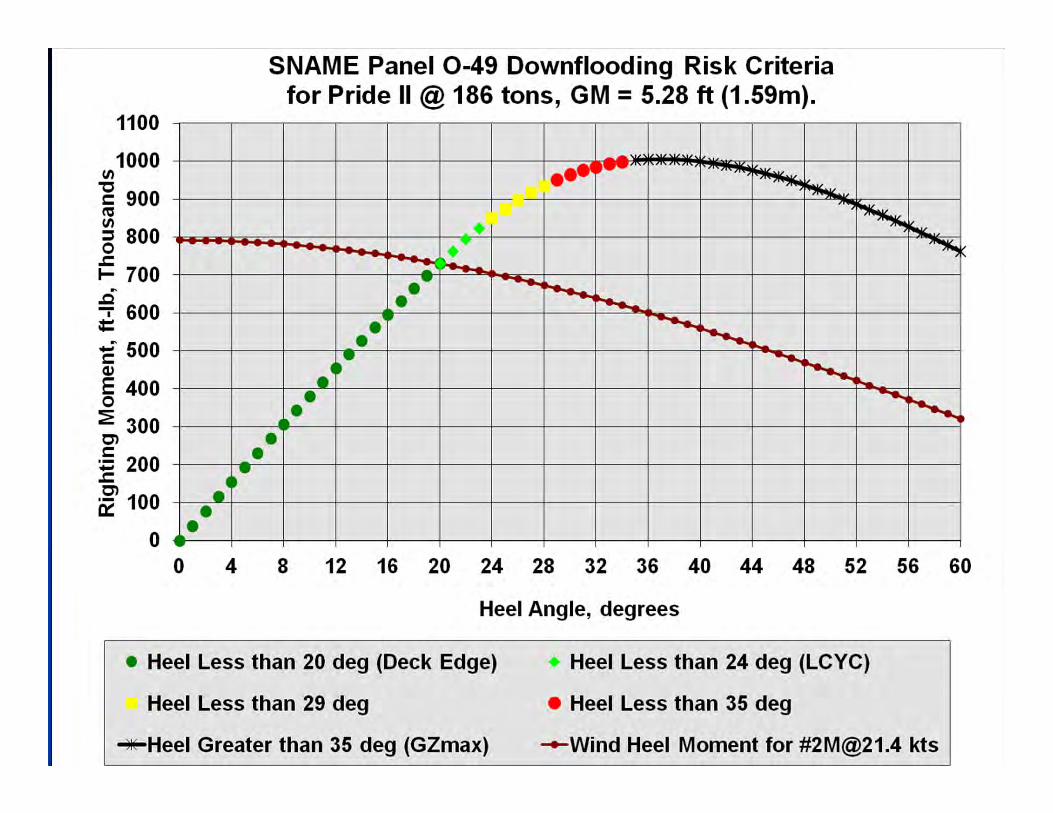
Pride II operator guidance criteria
The SNAME project assumes the wind velocity which produces a heel angle corresponding to Maximum righting arm (GZ) represents a high risk of capsize to downflooding (a gray or black area above the red high risk zone.)
The wind velocity which results in heeling to deck edge immersion represents a conservative upper limit of acceptable risk of capsizing to downflooding in a gust (the dark green area.)

SIGNIFICANT HEEL ANGLE ANALYSIS The statistical methods used for motion in waves include the
idea of significant wave height, significant roll analysis, etc. Significant is defined as the average of the third highest
waves, third highest heeling angles during rolls and so on. It is presumed that this is what “eyeball averaging” represents.
Note that the new method does not require using mast motion corrections to the anemometer data for determining WHSR = MWV2/HA1/3 for a given sail combination. This is illustrated in the following slides by the comparison of MWV2/HA1/3 with AWV2/HA1/3
The next slide (16) illustrates the consistency of the data when sailing with reduced sails in the shelter of Prince Edward Island. Slides 17 and 18 demonstrate how wave action in the open ocean complicates the interpretation of rolling caused by the wind and rolling caused by the waves (which dominate in slide 18).


Fortunately, the lower amount of scatter in the highest 1/3 of the heel angles (-14.9 to -5.9 , the first 4 grid lines of 12 grids on the x-axis) enables a visual centroid of the green markers to be estimated at 23, a number supported by the actual statistical analysis as in the previous slides.
Note that heel angle scatter appears to be only slightly dependent on wind velocity in the second chart indicating that much of the scatter is caused by wave action.

Scatter diagrams in gusting winds demonstrate far-from-equilibrium conditions

Pride of Baltimore II’s sail plan allows many sail combinations!!
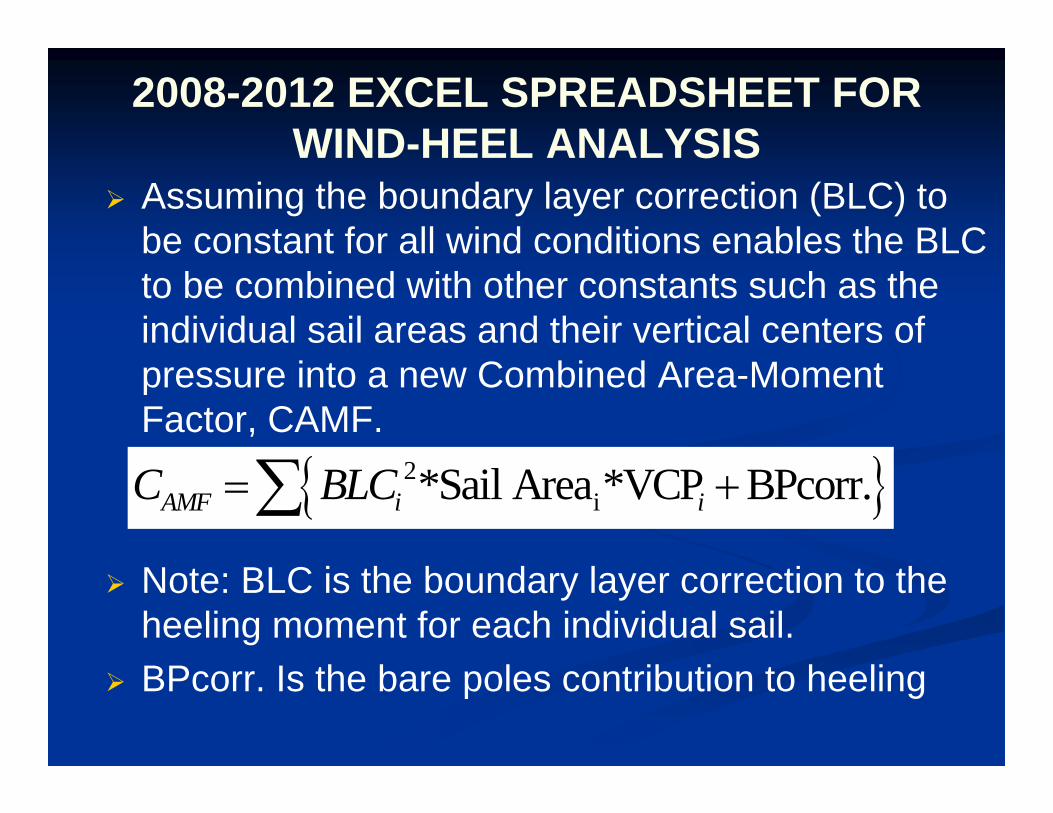
2008-2012 EXCEL SPREADSHEET FOR WIND-HEEL ANALYSIS
Assuming the boundary layer correction (BLC) to be constant for all wind conditions enables the BLC to be combined with other constants such as the individual sail areas and their vertical centers of pressure into a new Combined Area-Moment Factor, CAMF.
Note: BLC is the boundary layer correction to the heeling moment for each individual sail.
BPcorr. Is the bare poles contribution to heeling
2i*Sail Area *VCP BPcorr.AMF i iC BLC

*Pride II Sail Combinations
#2M CAMF Ratio=1.0
4L+JT+SQT+MGT
#3CAMF Ratio = 0.88
4L+JT+SQT
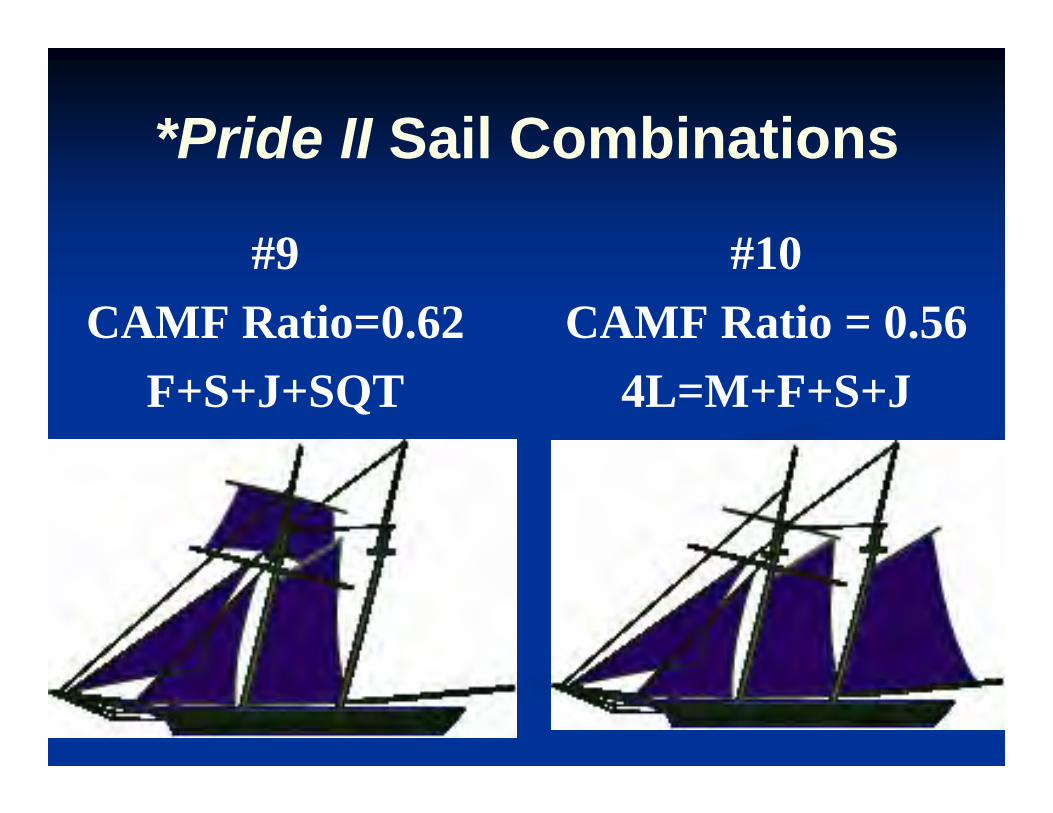
*Pride II Sail Combinations
#9 CAMF Ratio=0.62
F+S+J+SQT
#10CAMF Ratio = 0.56
4L=M+F+S+J
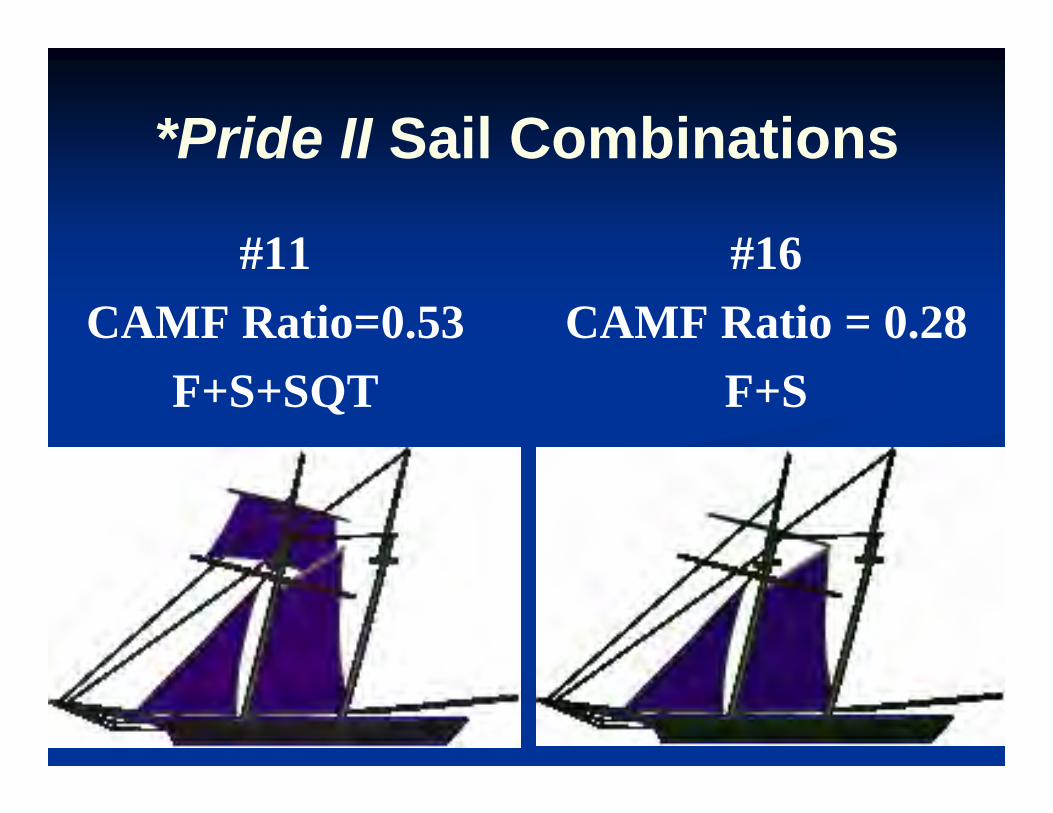
*Pride II Sail Combinations
#11 CAMF Ratio=0.53
F+S+SQT
#16CAMF Ratio = 0.28
F+S
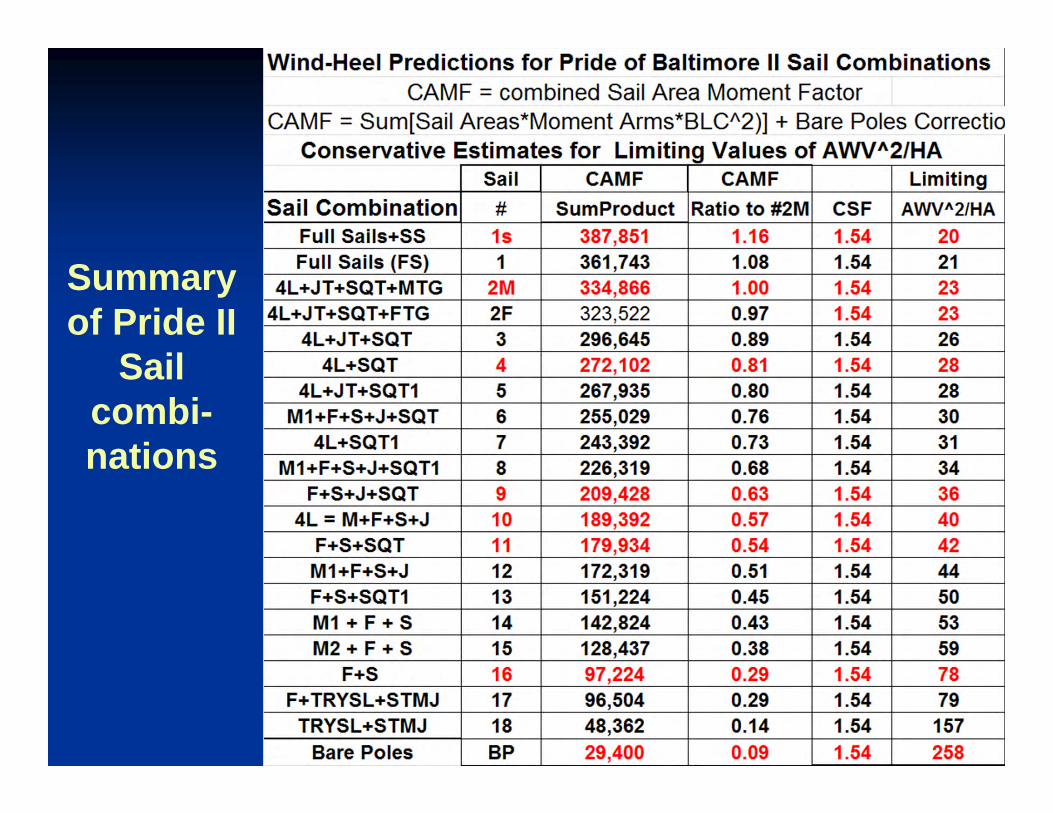
Summary of Pride II
Sail combi-nations

Passenger Comfort Guidance

Passenger Comfort Guidance Pride II’s passenger comfort guidance
chart can be used to select sail combinations for daysails involving occasional sailors who would be uncomfortable at large heel angles.
Note that the worst case tight sheeting for F+S allows 25 knots without exceeding 8 degrees of heel in a lifting wind shift. In the original Chesapeake Sailing Yacht Symposium 2007 chart the value was 28 knots, less conservative.
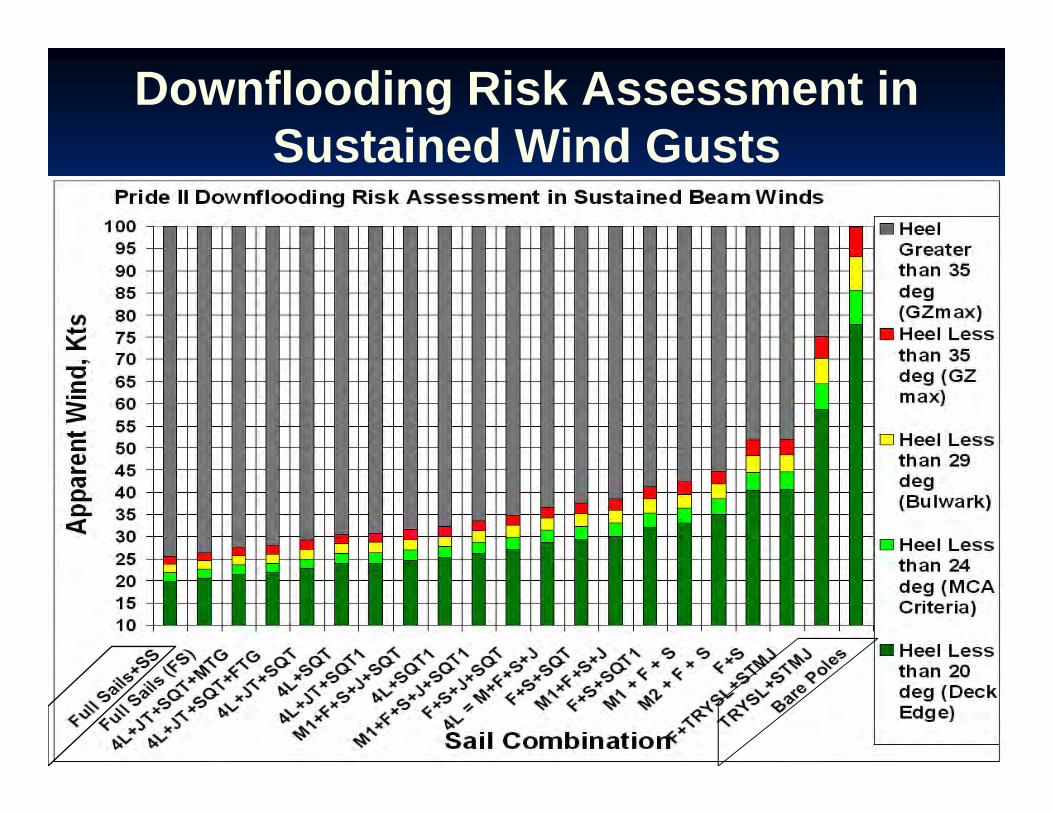
Downflooding Risk Assessment in Sustained Wind Gusts
Downflooding Risk Assessment in Sustained Wind Gusts
The resulting operator guidance chart is valid for open ocean sailing.
Bare poles on Pride II appears to survive in 100 knots on the beam
But a sustained gust over 75 knots should be taken with the storm trysail and storm jib set only while headed up.
Full Sails + SS is good to 22 knots on the beam but more in a broad reach as in the next slide, an expansion of the bar graph.
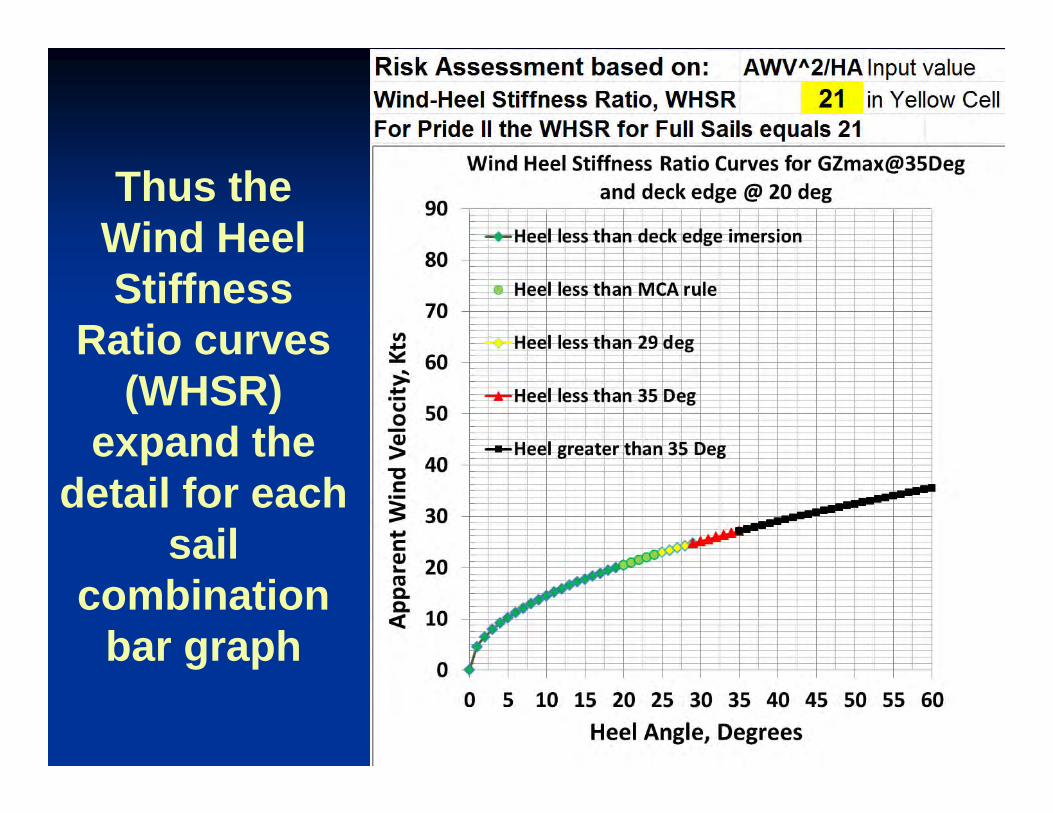
Thus the Wind Heel Stiffness
Ratio curves (WHSR)
expand the detail for each
sail combination
bar graph
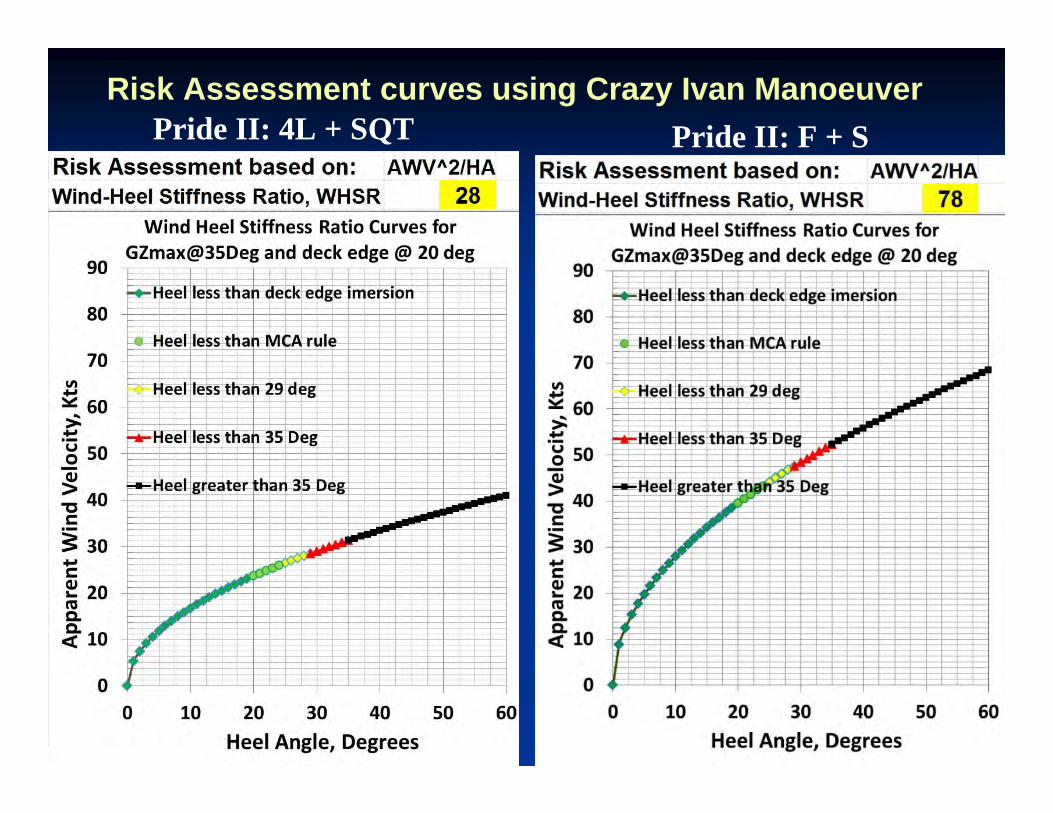
Risk Assessment curves using Crazy Ivan ManoeuverPride II: 4L + SQT Pride II: F + S
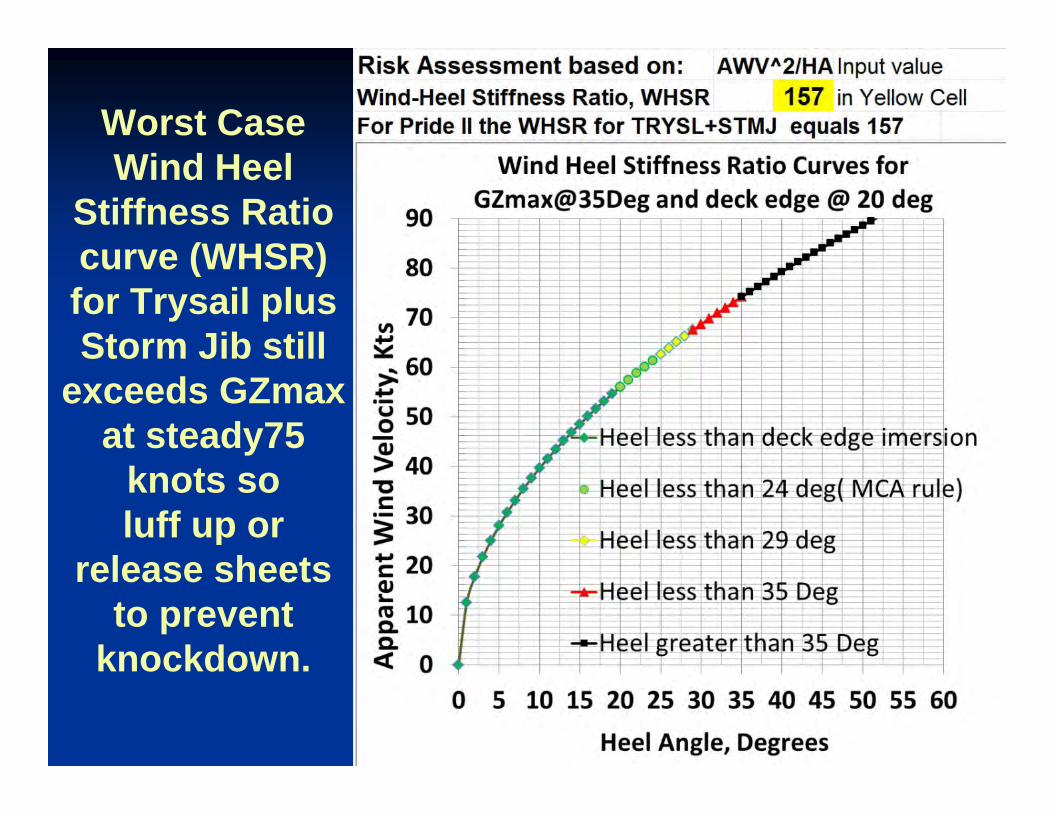
Worst CaseWind Heel
Stiffness Ratio curve (WHSR)for Trysail plus Storm Jib still
exceeds GZmaxat steady75
knots soluff up or
release sheets to prevent
knockdown.

Relationship to MCA Gust Curves The WHSR curves for a given vessel can pass
through the 30 and 60 knot MCA gust curves
2
2
30
2
60
=
Where Wind-Heel Stiffness Ratio for the MCA criteria is found from
30 /1.414
60 /1.414
kts
kts
AWVWHSRResultingHeelAngle
WHSRMaxSteadyHeelAngle
WHSRMaxSteadyHeelAngle
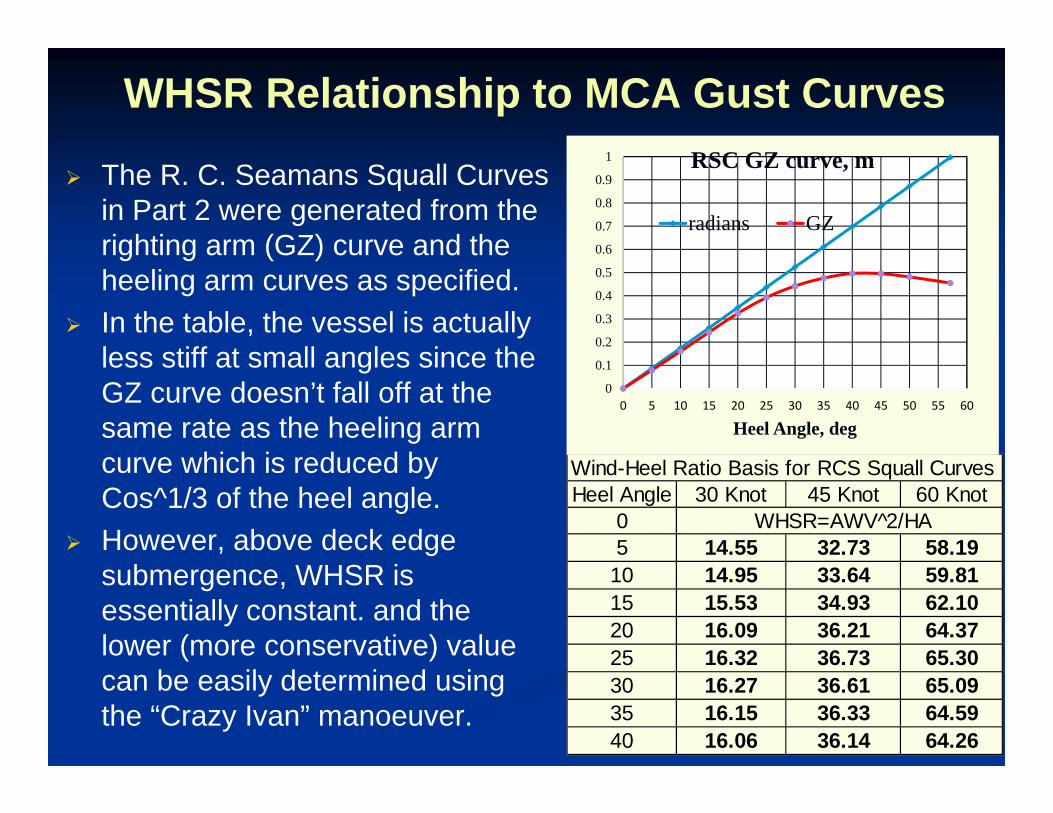
WHSR Relationship to MCA Gust Curves
Wind-Heel Ratio Basis for RCS Squall CurvesHeel Angle 30 Knot 45 Knot 60 Knot
0 WHSR=AWV^2/HA5 14.55 32.73 58.19
10 14.95 33.64 59.8115 15.53 34.93 62.1020 16.09 36.21 64.3725 16.32 36.73 65.3030 16.27 36.61 65.0935 16.15 36.33 64.5940 16.06 36.14 64.26
The R. C. Seamans Squall Curves in Part 2 were generated from the righting arm (GZ) curve and the heeling arm curves as specified.
In the table, the vessel is actually less stiff at small angles since the GZ curve doesn’t fall off at the same rate as the heeling arm curve which is reduced by Cos^1/3 of the heel angle.
However, above deck edge submergence, WHSR is essentially constant. and the lower (more conservative) value can be easily determined using the “Crazy Ivan” manoeuver.
0
0.1
0.2
0.3
0.4
0.5
0.6
0.7
0.8
0.9
1
0 5 10 15 20 25 30 35 40 45 50 55 60
Heel Angle, deg
RSC GZ curve, m
radians GZ

WHSR Relationship to MCA Gust Curves The R. C. Seamans Squall
Curves from Part 2 can be closely approximated using a single WHSR ratio for ≈ 20-25 degree heel angle data from the previous page.
Note that the 30 knot curve passes through 16/16 and the 45 knot curve passes through the 36.5/36.5 intersection.
When converted to constant WHSR format, the squall curve does not show less stiffness at small angles because the GZ curve doesn’t fall off at the same rate as the heeling arm curve which is reduced by Cos^1/3 of the heel angle.
Discussion
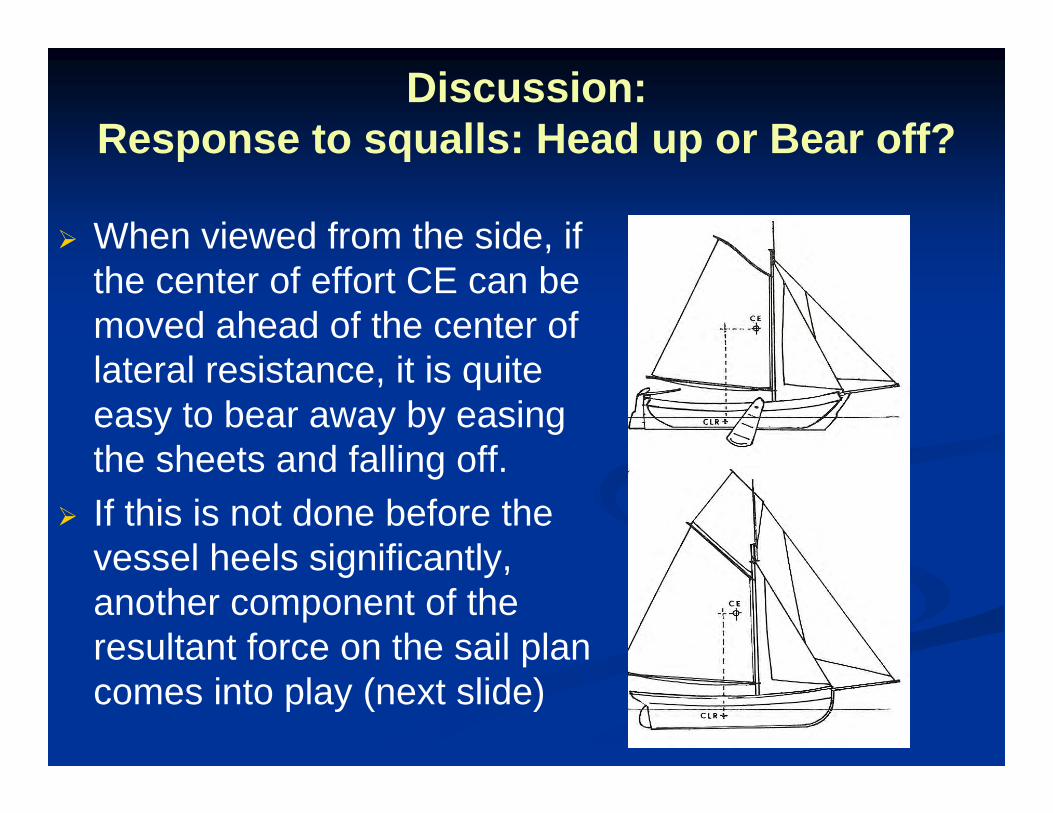
Discussion:Response to squalls: Head up or Bear off?
When viewed from the side, if the center of effort CE can be moved ahead of the center of lateral resistance, it is quite easy to bear away by easing the sheets and falling off.
If this is not done before the vessel heels significantly, another component of the resultant force on the sail plan comes into play (next slide)
Discussion:Response to squalls: Head up or Bear off?
FR
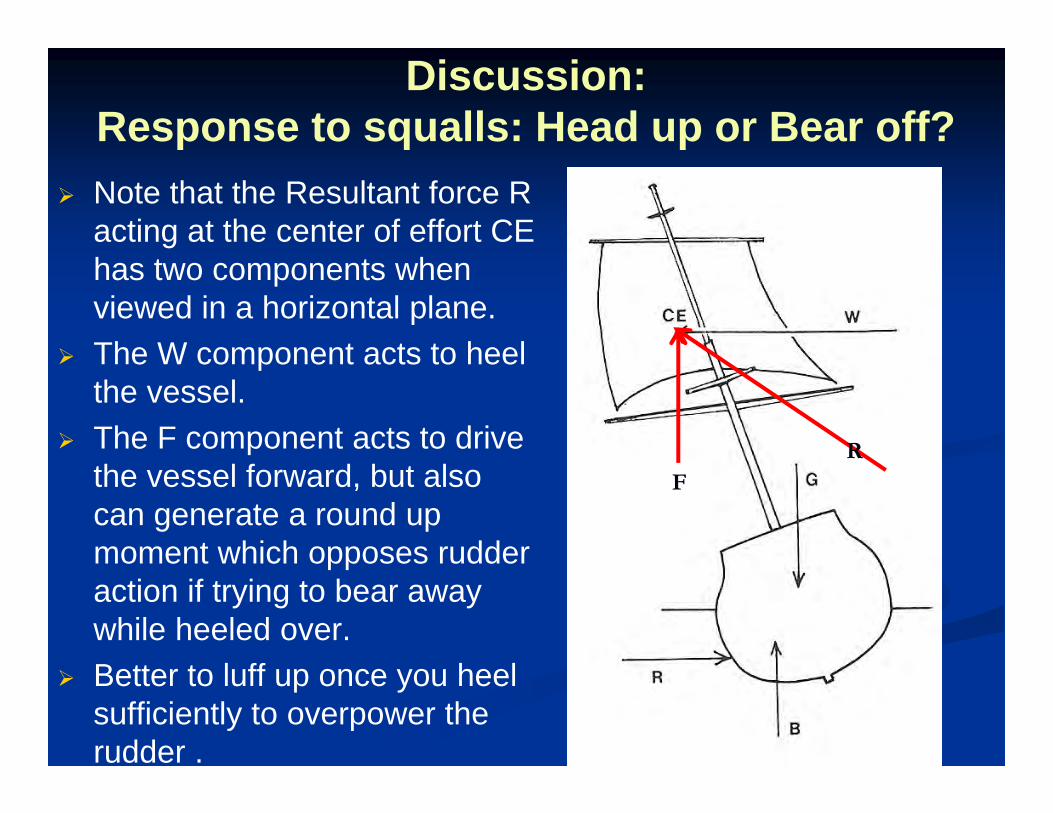
Note that the Resultant force R acting at the center of effort CE has two components when viewed in a horizontal plane.
The W component acts to heel the vessel.
The F component acts to drive the vessel forward, but also can generate a round up moment which opposes rudder action if trying to bear away while heeled over.
Better to luff up once you heel sufficiently to overpower the rudder .
Long Range Goals 1
Future research will include investigating if wind-heel characteristics are transferable among similar classes of traditionally-rigged sailing vessels such as a class of fore and aft rigged schooners like Virginia or square riggers like the brig Niagara, which is using a more affordable instrumentation package. It is hoped that the SEA vessels, Picton Castle and other tall ships will be willing to participate.

Long Range Goals 2 This research project attempted to solve
this dynamic stability problem through the development of a significant motion analysis technique to make sure the appropriate statistical averages were used.
The question of how much the value of AWV2/HA1/3 depends on wave action and sheeting angle is in need of further exploration.

Conclusions 1 This paper shows that a reasonably consistent
value of the parameter AWV2/HA1/3 indicates that the vessel may be considered to be in Near-equilibrium dynamic conditions.
However, more research on how to interpret gusty wind and wave conditions is required for additional metrics to be developed.
Conclusions 2 This new method is based on significant heel
angle analysis of AWV2/HA1/3 scatter diagrams from full scale tests using a number of sail combinations. Each combination is tested using the Crazy Ivan manoeuver for several sheeting angles.
This spreadsheet based method for predicting the sail forces and moments for various sail combinations as a function of full scale WHSR is more efficient and realistic than zero forward speed wind tunnel tests and CFD simulations which are too time-consuming for regular use.
Conclusions 3 The results of these limited data sets are then
used to predict the response of untested sail combinations using ratios of combined area moment factors (CAMF) unique to each sail combination in a standardized spreadsheet analysis.
The definition of the combined area moment factors is contained in slide 21. and its ratio to the reference sail combination enables one to predict the WHSR for that combination.
Conclusions 4 Note that the new WHSR method does not
require using mast motion corrections to the anemometer data for determining MWV2/HA1/3 for a given sail combination as illustrated by the comparison of MWV2/HA1/3with AWV2/HA1/3 in slides 16 and 17.
All that is needed is the vessel’s anemometer in a good location, a non-damped heel angle sensor ,a data logging system and use of a spreadsheet for data analysis.