talon™ lag screw - odi-naodi-na.com/media/talon_distalfix_vs_helical_blade.pdfdepuy synthes...
TRANSCRIPT

Talon™ Lag Screw
A Biomechanical Comparison with the
DePuy Synthes Helical Blade

Overview
The Talon™ Lag Screw has been in existence in various forms for over a decade. The latest
version, made of titanium, is used with the Talon™ DistalFix™ Proximal Femoral Nail for the
treatment of hip fractures. The four deployable Talons™ allow it to gain superior purchase in
the femoral head, even in osteoporotic bone. The goal of this testing was to evaluate the
pullout resistance (N), a surrogate for the compressive force that can be applied via the lag
screw, and ultimate torque to failure (N-m) of the Talon™ Lag Screw compared to the DePuy
Synthes Helical Blade. Tests were conducted using Fourth-Generation Composite Femurs
(Sawbones, Vashon, WA) with a core density of 8pcf to simulate an osteoporotic femur
(standard core density of these femurs is 17pcf). All femurs were implanted by an orthopedic
surgery resident using custom fixtures to ensure consistent implantation depth and
orientation of all lag screws/blades. Implantation of each device was done in accordance with
their respective technique guides.
0
100
200
300
400
500
600
700
0 5 10 15 20
Fo
rce
(N
)
Time (s)
Force (N) versus Time (s)
ODI 08
ODI 01
ODI 07
ODI 02
SYN 02
SYN 04
SYN 01
SYN 03
Pullout Resistance
Interfragmentary compression aids fracture healing
immensely, but is often difficult to achieve in the hip
fracture setting on account of poor trabecular bone
quality. The Talon™ Lag Screw, positioned slightly inferior
of center in the femoral head when viewed in the AP
plane, anchors into the cortex of the bone. This cortical
engagement translates to an ultimate pullout force, a
surrogate for compression, 63.6% greater than that of
the Helical Blade.
ODI 08 579.83
ODI 01 640.45
ODI 02 488.89
ODI 07 527.92
SYN 02 329.58
SYN 03 320.00
SYN 04 372.77
SYN 01 345.34
341.92
(23.07)
Ultimate
Pullout
Load (N)
SpecimenAverage
(SD)
559.27
(65.70)
(a) Schematic representation of Talon™ Lag Screw and Helical
Blade implantation position as seen in the AP plane and load
applied; (b) results of pullout resistance testing; (c) graphic
depiction of pullout resistance testing results. Implants were
subjected to a displacement of 1mm/sec.
(a)
(b) (c)
Full report on file at ODi-NA, Tampa, FL
0
1
2
3
4
5
6
7
0 10 20 30 40 50 60 70 80 90
To
rqu
e (
N-m
)
Rotation (deg)
Torque (N-m) versus Rotation (deg)
m) versus Rotation (deg)
SYN 04
SYN 01
SYN 02
SYN 03
ODI 04
ODI 03
ODI 05
ODI 06
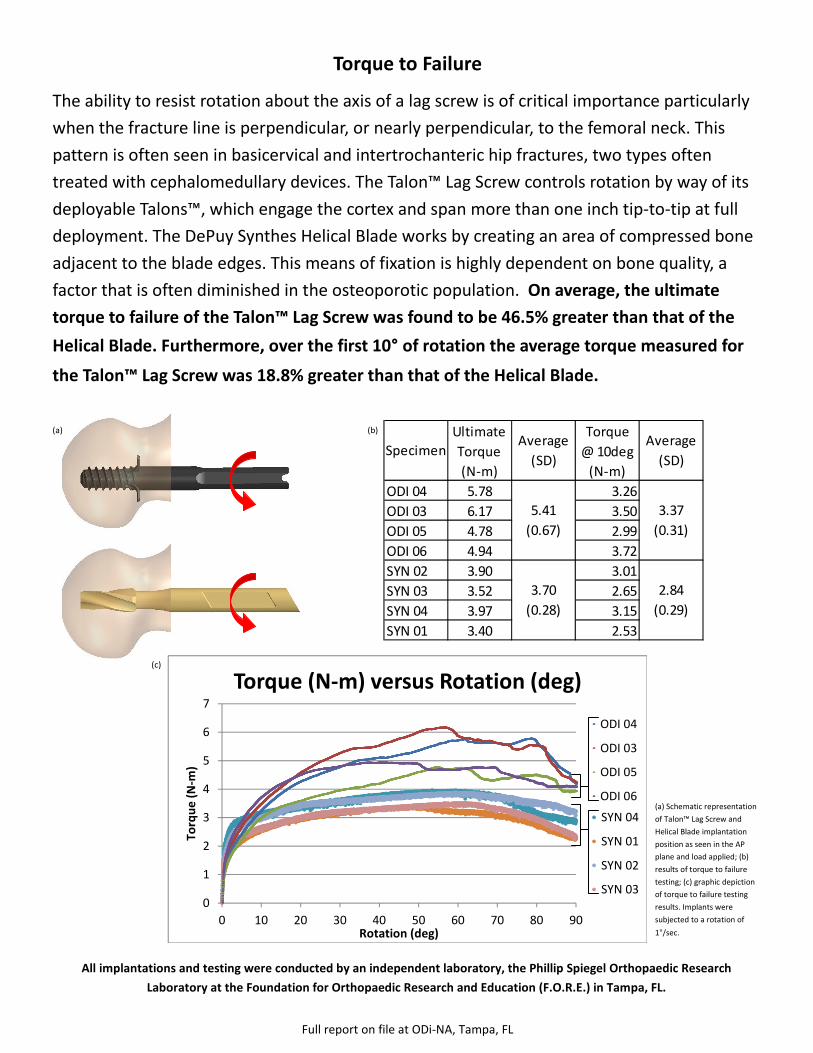
Torque to Failure
The ability to resist rotation about the axis of a lag screw is of critical importance particularly
when the fracture line is perpendicular, or nearly perpendicular, to the femoral neck. This
pattern is often seen in basicervical and intertrochanteric hip fractures, two types often
treated with cephalomedullary devices. The Talon™ Lag Screw controls rotation by way of its
deployable Talons™, which engage the cortex and span more than one inch tip-to-tip at full
deployment. The DePuy Synthes Helical Blade works by creating an area of compressed bone
adjacent to the blade edges. This means of fixation is highly dependent on bone quality, a
factor that is often diminished in the osteoporotic population. On average, the ultimate
torque to failure of the Talon™ Lag Screw was found to be 46.5% greater than that of the
Helical Blade. Furthermore, over the first 10° of rotation the average torque measured for
the Talon™ Lag Screw was 18.8% greater than that of the Helical Blade.
ODI 04 5.78 3.26
ODI 03 6.17 3.50
ODI 05 4.78 2.99
ODI 06 4.94 3.72
SYN 02 3.90 3.01
SYN 03 3.52 2.65
SYN 04 3.97 3.15
SYN 01 3.40 2.53
Average
(SD)
3.37
(0.31)
2.84
(0.29)
Specimen
Ultimate
Torque
(N-m)
Average
(SD)
5.41
(0.67)
3.70
(0.28)
Torque
@ 10deg
(N-m)
All implantations and testing were conducted by an independent laboratory, the Phillip Spiegel Orthopaedic Research
Laboratory at the Foundation for Orthopaedic Research and Education (F.O.R.E.) in Tampa, FL.
(a) Schematic representation
of Talon™ Lag Screw and
Helical Blade implantation
position as seen in the AP
plane and load applied; (b)
results of torque to failure
testing; (c) graphic depiction
of torque to failure testing
results. Implants were
subjected to a rotation of
1°/sec.
(a) (b)
(c)

5912-F Breckenridge Parkway
Tampa, FL 33610
Phone: (888) 635-8535 Fax: (888) 632-8047
www.odi-na.com
7009, 1.0 ©2012 Orthopedic Designs North America, Inc. All Rights Reserved
Caution: Federal law (USA) restricts this device to sale by or on the order of a physician.