tano south district - statistical service ahafo... · the district analytical report for the tano...
TRANSCRIPT
i
TANO SOUTH DISTRICT

ii
Copyright (c) 2014 Ghana Statistical Service

iii
PREFACE AND ACKNOWLEDGEMENT
No meaningful developmental activity can be undertaken without taking into account the
characteristics of the population for whom the activity is targeted. The size of the population
and its spatial distribution, growth and change over time, in addition to its socio-economic
characteristics are all important in development planning.
A population census is the most important source of data on the size, composition, growth
and distribution of a country’s population at the national and sub-national levels. Data from
the 2010 Population and Housing Census (PHC) will serve as reference for equitable
distribution of national resources and government services, including the allocation of
government funds among various regions, districts and other sub-national populations to
education, health and other social services.
The Ghana Statistical Service (GSS) is delighted to provide data users, especially the
Metropolitan, Municipal and District Assemblies, with district-level analytical reports based
on the 2010 PHC data to facilitate their planning and decision-making.
The District Analytical Report for the Tano South District is one of the 216 district census
reports aimed at making data available to planners and decision makers at the district level. In
addition to presenting the district profile, the report discusses the social and economic
dimensions of demographic variables and their implications for policy formulation, planning
and interventions. The conclusions and recommendations drawn from the district report are
expected to serve as a basis for improving the quality of life of Ghanaians through evidence-
based decision-making, monitoring and evaluation of developmental goals and intervention
programmes.
For ease of accessibility to the census data, the district report and other census reports
produced by the GSS will be disseminated widely in both print and electronic formats. The
report will also be posted on the GSS website: www.statsghana.gov.gh.
The GSS wishes to express its profound gratitude to the Government of Ghana for providing
the required resources for the conduct of the 2010 PHC. While appreciating the contribution
of our Development Partners (DPs) towards the successful implementation of the Census, we
wish to specifically acknowledge the Department for Foreign Affairs, Trade and
Development (DFATD) formerly the Canadian International Development Agency (CIDA)
and the Danish International Development Agency (DANIDA) for providing resources for
the preparation of all the 216 district reports. Our gratitude also goes to the Metropolitan,
Municipal and District Assemblies, the Ministry of Local Government, Consultant Guides,
Consultant Editors, Project Steering Committee members and their respective institutions for
their invaluable support during the report writing exercise. Finally, we wish to thank all the
report writers, including the GSS staff who contributed to the preparation of the reports, for
their dedication and diligence in ensuring the timely and successful completion of the district
census reports.
Dr. Philomena Nyarko
Government Statistician
iv
TABLE CONTENTS
PREFACE AND ACKNOWLEDGEMENT ....................................................................... iii
LIST OF TABLES ................................................................................................................. vi
LIST OF FIGURES .............................................................................................................. vii
ACRONYMS AND ABBREVIATIONS ............................................................................ viii
EXECUTIVE SUMMARY ................................................................................................... ix
CHAPTER ONE: INTRODUCTION ...................................................................................1 1.1 Background .................................................................................................................1 1.2 Location and Size ........................................................................................................1
1.3 Political and Administration........................................................................................2 1.4 Cultural and Social Structure ......................................................................................2 1.5 Economy......................................................................................................................4 1.6 Census Methodology, Concepts and Definitions ........................................................5
1.7 Organisation of the Report ........................................................................................15
CHAPTER TWO: DEMOGRAPHIC CHARACTERISTICS .........................................16 2.1 Introduction ...............................................................................................................16 2.2 Population Size and Distribution ..............................................................................16
2.3 Age-Sex Structure .....................................................................................................17 2.4 Fertility, Migration and Mortality .............................................................................18
CHAPTER THREE: SOCIAL CHARACTERISTICS ....................................................24 3.1 Introduction ...............................................................................................................24 3.2 Household Size, Composition and Headship ............................................................24
3.3 Marital Status ............................................................................................................26 3.4 Nationality .................................................................................................................29
3.5 Religious Affiliation ..................................................................................................30 3.6 Literacy and Education..............................................................................................30
CHAPTER FOUR: ECONOMIC CHARACTERISTICS ...............................................34 4.1 Introduction ...............................................................................................................34 4.2 Economic Activity Status ..........................................................................................34 4.3 Occupation ................................................................................................................36
4.4 Industry......................................................................................................................37 4.5 Employment Status ...................................................................................................38 4.6 Employment Sector ...................................................................................................39
CHAPTER FIVE: INFORMATION COMMUNICATION TECHNOLOGY ..............40 5.1 Introduction ...............................................................................................................40 5.2 Ownership of Mobile Phones ....................................................................................40 5.3 Use of Internet ...........................................................................................................40
5.4 Household ownership of Desktop or Laptop computer ............................................41
CHAPTER SIX: DISABILITY ...........................................................................................42 6.1 Introduction ...............................................................................................................42 6.2 Population with Disability .........................................................................................42 6.3 Type of Disability......................................................................................................43
v
6.4 Distribution by type of locality .................................................................................44
6.5 Disability and activity status .....................................................................................44 6.6 Disability, education and literacy ..............................................................................45
CHAPTER SEVEN: AGRICULTURAL ACTIVITIES ...................................................52 7.1 Introduction ...............................................................................................................52 7.2 Households in Agriculture ........................................................................................52 7.3 Types of Farming Activities ......................................................................................53 7.4 Types of Livestock and Other Animals reared ..........................................................53
CHAPTER EIGHT: HOUSING CONDITIONS ...............................................................55 8.1 Introduction ...............................................................................................................55 8.2 Housing Stock ...........................................................................................................55 8.3 Type of Dwelling and Ownership Status ..................................................................55 8.4 Construction Materials ..............................................................................................57
8.5 Room Occupancy ......................................................................................................58 8.6 Access to Utilities and Household Facilities .............................................................59 8.7 Main Source of Water for Drinking and for other Domestic Use .............................61 8.8 Bathing and Toilet Facilities .....................................................................................62
8.9 Method of Waste Disposal ........................................................................................64
CHAPTER NINE: SUMMARY OF FINDINGS, CONCLUSIONS AND POLICY
IMPLICATIONS ................................................................................65 9.1 Introduction ...............................................................................................................65 9.2 Summary of Findings ................................................................................................65 9.3 Conclusion .................................................................................................................67
9.4 Policy Implications ....................................................................................................67
REFERENCES .......................................................................................................................69
APPENDICES ........................................................................................................................70
LIST OF CONTRIBUTORS ................................................................................................75
vi
LIST OF TABLES
Table 2.1: Population by age, sex and type of locality ........................................................... 16
Table 2.2: Reported total fertility rate, general fertility rate and crude birth rate by district . 19
Table 2.3: Female population 12years and older by age, children ever born, children
surviving and sex of children ................................................................................. 20
Table 2.4: Total population, deaths in households and crude death rate by district ............... 22
Table 2.5: Birthplace by duration of residence of migrants .................................................... 23
Table 3.1: Household size by locality ..................................................................................... 24
Table 3.2: Household population by composition and sex ..................................................... 25
Table 3.3: Household structure by sex .................................................................................... 25
Table 3.4: Population 12 years and older by marital status, sex and age ............................... 27
Table 3.5: Persons 12 years and older by sex, marital status and level of education ............. 28
Table 3.6: Persons 12 years and older by sex, marital status and economic activity status ... 29
Table 3.7: Population by nationality and sex .......................................................................... 30
Table 3.8: Population by religion and sex .............................................................................. 30
Table 3.9: Population 11 years and older by sex, age and literacy status ............................... 31
Table 3.10:Population 3 years and older by level of education, school attendance and sex ... 33
Table 4.1: Population 15 years and older by activity status and sex ...................................... 34
Table 4.2: Population 15 years and older by sex, age and activity status ............................... 36
Table 4.3: Employed population 15 year and older by occupation and sex ........................... 37
Table 4.4: Employed Population 15 years and older by industry and sex .............................. 38
Table 4.5: Employed Population 15 years and older by employment status and sex ............. 39
Table 4.6: Employed population 15 years and older by employment sector and sex ............. 39
Table 5.1: Population 12 years and older by mobile phone ownership, internet facility
usage and sex ........................................................................................................ 40
Table 5.2: Households having desktop/laptop computers and sex of head ............................ 41
Table 6.1: Population by type of locality, disability type and sex .......................................... 43
Table 6.2: Persons 15 years and older with disability by economic activity status and sex ... 45
Table 6.3: Population 3 years and older by sex, disability type and level of education ......... 46
Table 7.1: Household by agricultural activity and locality ..................................................... 53
Table 7.2: Distribution of livestock, other animals and keepers............................................. 54
Table 8.1: Stock of houses and households by type of locality .............................................. 55
Table 8.2: Type of occupied dwelling unit by sex of household head and type of locality ... 56
Table 8.3: Ownership status of dwelling by sex of household head and type of locality ....... 57
Table 8.4: Main construction material for outer wall of dwelling unit by type of locality .... 57
Table 8.5: Construction material for the floor of dwelling unit by locality ............................ 58
Table 8.6: Main construction materials for roofing of dwelling unit by type of locality ....... 58
Table 8.7: Household size and number of sleeping rooms occupied in dwelling unit ........... 59
Table 8.8: Main source of lighting of dwelling unit by type of locality ................................. 60
Table 8.9: Main source of fuel for cooking and cooking space by type of locality ................ 61
Table 8.10:Main source of water of dwelling unit for drinking and other domestic purposes 62

vii
Table 8.11:Type of toilet and bathing facilities used by household and type of locality ........ 63
Table 8.12: Method of solid and liquid waste disposal by type of locality ............................. 64
Table A1: Household composition by type of locality ........................................................... 70
Table A2: Population 3 years and older by sex, disability type and level of education ......... 71
Table A3: Population by sex, number households and number of houses in the 20 largest
communities .......................................................................................................... 73
Table A4: Population by age group in the 20 largest communities ........................................ 74
LIST OF FIGURES
Figure 1.1: Map of Tano South District .................................................................................... 3
Figure 2.1: Population pyramid .............................................................................................. 17
Figure 2.2: Reported age specific death rate ........................................................................... 21
Figure 3.1: Population 12 years and older by marital status ................................................... 26
Figure 3.2: School attendance by sex for persons 3 years and older ...................................... 32
Figure 4.1: Population 15 years and older by activity status and sex ..................................... 35
Figure 6.1: Population with disability type ............................................................................. 44
Figure 7.1: Agricultural and non-agricultural households by locality .................................... 52

viii
ACRONYMS AND ABBREVIATIONS
ASBR Age Specific Birth Rate
ASDR Age Specific Death Rate
BARAR Brong Ahafo Regional Analytical Report
CHIPS Community Health Planning Services
CBR Crude Birth Rate
CDR Crude Death Rate
CEB Children Ever Born
CS Children Surviving
DPCU District Planning and Coordinating Unit
ECOWAS Economic Community of West African States
EA Enumeration Area
GFR General Fertility Rate
GDP Gross Domestic product
GSS Ghana Statistical Service
GES Ghana Education Service
ICT Information Communication Technology
JSS Junior Secondary School
MDGs Millennium Development Goals
NER Net Enrolment Ratio
NGOs Non-governmental Organizations
NCA National Communication Authority
NDPC National Development Planning Commissions
PHC Population and Housing Census
PWDs Persons with disabilities
PRB Population Reference Bureau
SSS Senior Secondary School
SHS Senior High School
UNDP United Nations Development Programme
WHO World Health Organization
WC Water Closet
ix
EXECUTIVE SUMMARY
Introduction
The District census report is the first of its kind since the first post-independence census was
conducted in 1960. The report provides basic information about the District. It gives a brief
background of the District, describing its physical features, political and administrative
structure, socio-cultural structure and economy. Using data from the 2010 Population and
Housing Census (2010 PHC), the report discusses the population characteristics of the District,
fertility, mortality, migration, marital status, literacy and education, economic activity status,
occupation, employment; Information Communication Technology (ICT), disability,
agricultural activities and housing conditions of the District. The key findings of the analysis
are as follows (references are to the relevant sections of the report):
Population size, structure and composition
The population of Tano South District, according to the 2010 Population and Housing Census,
is 78,129 with relatively more females (50.0%) than females (49.0%), giving a sex ratio of 96.2.
More than half (52.4%) of the population reside in urban areas while 47.6 percent are in the
rural areas. The population of the District is youthful with about two-fifth (42.4%) aged below
15 years and the elderly persons (aged 60 years and older) in smaller proportion (6.3%). Thus,
the District’s population pyramid has a broad base and tapers off with a small number of elderly
persons. The total age dependency ratio for the District is 88.7. The rural population has a
higher dependency ratio of 95.3 higher than the urban population of 83.1.
Fertility, mortality and migration
The Total Fertility Rate for the Tano District is 4.0 which is slightly higher than the regional
average of 3.6. The General Fertility Rate is 120.3 births per 1000 women aged 15-49 years
which is the second highest for the region. The Crude Birth Rate (CBR) is 29.1 per 1000
population. The crude death rate for the District is 6.9 per 1000 live births which is higher than
the regional average of 6.1 per 1000. Accident/violence/homicide/suicide accounted for 8.7
percent of all deaths while other causes constitute 91.3 percent of deaths in the District.
Majority of migrants (73.0%) living in the District were born elsewhere in another region while
27.0 percent were born elsewhere in the Brong Ahafo Region. For migrants born in another
region, those born in Central (30.5%) form the highest proportion followed by Ashanti (15.1%)
and Volta (13.8%).
Household Size, composition and structure
The District has a household population of 77,185 with a total number of 16,312 households.
The average household size in the District is 4.7 persons per household. Children constitute the
largest proportion of the household members accounting for 43.5 percent of the total household
population. Heads of households and grandchildren form about one-fifth (21.1%) and 11.4
percent respectively of the household population. Nuclear households (head, spouse(s) and
children) constitute 27.3 percent of the total number of households in the District.
Marital status
More than two-fifth (43.9%) of the population aged 12 years and older are married, two fifth
(39.5%) have never been married and 6.6 percent are in consensual unions. Among the
married population, two-fifth (40.2%) has no education and 48.8 percent have basic
x
education. For those who have never been married, only 11.9 percent have never been to
school and 68.0 percent has basic education. Nearly nine in ten (88.5%) of the married
population are employed, 1.2 percent are unemployed and 10.2 percent are economically not
active. For those who have never been married, 39.6 percent are employed, 2.1 percent are
unemployed and 58.3 percent are economically not active.
Nationality
The proportion of Ghanaians by birth in the District is 93.9 percent. Those who have dual
nationality constitute 2.4 percent and the non-Ghanaian population in the District is 3.0
percent.
Religious affiliation
Majority (72.2%) of the population in the District profess the Christians religion with
Pentecostal/charismatic dominating with a proportion of 26.9 percent, followed by the
Catholics (18.1%) and Protestant (16.1%). Persons who belong to Islam form 16.9 percent.
Those who profess to have no religion constitute eight percent of the population. The
proportion of females (75.6%) who are affiliated to the Christian religion is higher than that
of males (68.7%). On the contrary, the proportion of males (10.0%) who have no religion is
higher than that of the females (6.0%).
Literacy and education
Of the population 11 years and above, 71.6 percent are literate and 28.4 percent are non-
literate. Of the literate population, 16.2 percent are able to read and write in English language
only while 72.2 percent indicated they could read and write in both English and a Ghanaian
language. Of the population aged 3 years and older in the District, one-quarter (25.0%) has
never attended school, one-third (33.2%) have attended in the past and about two-fifth
(41.8%) are currently attending. Of those currently attending, 17.5 percent are in
Kindergarten, 47.7 percent are at primary level and 18.3 percent are in Junior High Schools.
Thus, 83.5 percent of the pupils in the District are in Basic schools.
Economic activity status
About three-quarters (75.5%) of the population aged 15 years and older are economically
active while one-quarter (24.5%) are economically not active. Of the economically active
population, 97.5 percent are employed while 2.5 percent are unemployed. Of the unemployed
population, 65.6 percent are seeking work for the first time. For those who are economically
not active, one-half (50.1%) are students and 25.7 percent perform household duties.
Occupation
Of the total workforce in the District, about two-thirds (67.4%) are engaged as Skilled
agricultural, forestry and fishery workers, 12.2 percent are engaged as Service and sales work
and 8.2 percent are engaged as Craft and related trades workers. Whereas females (19.5%)
are more likely than males (4.5%) to be engaged in service and sales work, males (70.9%) are
more likely than females (64.2%) to be engaged as Skilled agricultural, forestry and fishery
workers.
Industry
In terms of sector of employment of the workforce, 63.1 percent are employed by
Agriculture, 7.1 percent by Industry and 29.8 percent by Services sectors. Whereas more
xi
males than females are employed by the Agriculture and Industry sectors, more females
(34.1%) than males (25.4%) are employed by the Services sector.
Employment status and sector
Of the population 15 years and older 67.2 percent are self-employed without employees, 13.8
percent are 7.3 percent are contributing family workers and 12.5 percent are employees. The
proportion of male employees (17.3%) is more than twice the proportion of their female
counterparts (7.8%). The private informal sector is the largest employer in the District,
employing 91.4 percent of the population followed by the private formal sector with 6.2
percent.
Information Communication Technology
Of the population 12 years and above, 37.3 percent own mobile phones. Males who own
mobile phones constitute 43.8 percent as compared to 31.3 percent of females. Less than
three percent (2.4%) of the population 12 years and older use internet facilities in the District.
Twice as many females (1.5%) as males (3.4%) use internet. About four percent (3.9%) of
the total households in the District have desktop/laptop computers.
Two percent of the District’s total population has one form of disability or the other. The
main types of disability in the District are sight (31.7%) and physical (28.4%). Less than 60
percent (56.8%) of persons with disability are employed and 41.4 percent are economically
not active. Of the population with disability, 47.2 percent have never been to school and 47.5
percent have up to basic level of school education.
Agriculture
More than three-quarters (76.1%) of households in the District are engaged in agricultural
activities. An overwhelming majority (97.1%) of the households are involved in crop
farming and about one-third (32.9%) are also involved in livestock rearing. Poultry (61.1%)
is the dominant animal reared in the District.
Housing
The housing stock of Tano South District is 10,628 representing 3.2 percent of the total
number of houses in the Brong Ahafo Region. The average number of persons per house is
7.3 which is slightly higher than the regional average of 6.8.
Type, tenancy arrangement and ownership of dwelling units
Nearly six in ten (58.8%) of all dwelling units in the District are compound houses and 28.8
percent are separate houses. More than half (51.8%) of the dwelling units in the District are
owned by members of the household; 26.1 percent are owned by private individuals and 17.5
percent are owned by relatives who are not household members.
Material for construction of outer wall, floor and roof
The main construction material for outer walls of dwelling units in the District is
cement/concrete which constitutes 48.3 percent, followed by mud bricks/earth accounting for
46.3 percent of outer walls of dwelling units in the District. Cement (74.5%) and mud/earth
(23.8%) are the two main materials used in the construction of floors of dwelling units. Metal
sheets (84.6%) and thatch/palm leaf or raffia (10.3%) are the two main roofing materials for
dwelling units in the District.

xii
Room occupancy
One room constitutes the highest percentage (15.4%) of sleeping rooms occupied by
households in housing units in the District. About 7.4 percent of households with 10 or more
members occupy single rooms.
Utilities and household facilities
Electricity (56.4%) and flashlight/torch (26.8%) are the two main sources of lighting in
dwelling units in the District. The main source of fuel for cooking for most households in the
District is wood (65.6%), charcoal (21.3%) and gas (5.1%). Bore-hole/pump/tube well
constitutes the major (33.1%) source of drinking water for dwelling unit in the District. The
next major source of drinking water is public tap (23.8%) and pipe-borne outside dwelling
(14.7%).
Public toilet (55.5%) and pit latrine (19.8%) are the most widely used toilet facilities in the
District. More than one-tenth (11.3%) of households in the District have no toilet facility.
Waste disposal
The most widely method of solid waste disposal is by public dump in the open space
accounting for 56.0 percent. About one-fifth (22.8%) of households dump their solid waste in
public containers and 11.0 percent of households dump their solid waste indiscriminately. For
liquid waste disposal, throwing waste onto the compound (52.3%) and onto the street (38.5%)
are the commonest methods used by households in the District.
1
CHAPTER ONE
INTRODUCTION
1.1 Background
The Tano South District was carved from the Tano District which had Bechem as its capital.
By Legislative Instrument LI 1765 of 2004, the Tano District was split into two. Tano South
which maintained Bechem as its capital and Tano North with Duayaw Nkwanta as the
capital. Tano South District has 39 electoral areas, 5 area councils and 2 town councils with
the District Chief Executive as the political head.
1.2 Location and Size
The District lies in the Southern part of the Brong Ahafo Region between latitudes 7º00”N
and 7º25” N and longitudes 1º45” W and 2º15” W. The District is bordered to the North and
East by the Offinso and Ahafo-Ano South Districts. On the South by the Ahafo-Ano North
District and on its West and South-West by Tano North District. It covers an area of 489.0
square kilometres. The District capital, Bechem, is on the Sunyani-Kumasi first class road
(asphalt) and about 54 km from Sunyani and 76 km from Kumasi.
1.2.1 Physical features
The topography of the District is mostly made up of undulating land which rises gently from
a height of about 270m to a peak of 760m. The area to the East and South-East, in the
Kwamisa area bounded by the Ankaase-Techimantia-Bechem road, is particularly fairly high,
rising between 360m and 760m. The District has many rivers such as Atobiaso, Moku and
Kwasu. River Subri, a tributary of Tano River in the Tano South District, flows through
Subriso No. 3 and Techimantia. The Atobiaso River flows through Derma and River Moku,
through Techimantia and Dwomo. River Dwofo is a tributary of Kwasu River. Due to the
presence of the numerous rivers, land in the District is well drained and free from flooding. In
this regard, the land is ideal for vegetable and food crop cultivation. It is therefore not
surprising that the District’s vegetables output is one of the best in the region.
1.2.2 Geology and soils
The main geological formations that cover the District are the forest ochrosols and the
rubrisol /ochrosols intergrades which contain alkaline and are more richly supplied with
nutrients. They are also more clayey, have greater capacity to maintain water for plant use
and are therefore very ideal for the cultivation of forest crops like cocoa, coffee, oil palm and
food crops like plantain, maize, rice, cassava, and beans among others.
1.2.3 Climate (temperature and rainfall)
The District lies in the Semi-equatorial climatic zone which experiences double maximum
rainfall pattern. The first rainfall season is from April to June, with the heaviest in June. The
second period is from September to October. The annual rainfall is between 1250mm and
1800mm. The dry season is quiet pronounced and occurs from the months of November to
February. The mean monthly temperature ranges between 26ºC in August and 30ºC in March.
Relative humidity is generally high, ranging between 75-80 percent in the rainy season and
50-70 percent in the dry season. The severe harmattan (dry winds) brings about outbreak of
2
bushfires which sometimes cause serious crop losses and environmental hazards. The
relatively long wet (rainy) seasons as well as the abundant rains are favourable for the
cultivation of cash crops. This ensures food security throughout the year.
1.2.4 Vegetation and forest reserve cover
The District lies in the moist semi-deciduous forest zone. However, there are stretches of
savannah grassland in areas such as Techimantia and Subriso No. 3 where cattle rearing is
becoming an important economic activity. The District has three major forest reserves. These
are Bosomkese, Tinten and some parts of Apaape forest reserves. These forest reserves cover
a total land area of 157.45 square kilometres. In these reserves, one can find different tree
species such as Odum, Mahogany, Ceiba, Cassia and Akasaa.
1.3 Political and Administration
By statutory declaration as contained in section one of the Local Government Act 1993 (Act
462) under which it operates, stipulate that the Assembly exercises deliberative, legislative
and executive functions in the District. It is the highest political, administrative and planning
authority representing the Central Government in the District. The District Assembly is
subdivided into Two (2) Town Councils and five (5) Area Councils. The Town Councils are
Bechem and Techimantia with Brosankro, Derma, Ankaase/Adaa, Subriso No.3 and
Dwomo/Mansin being Area Councils. The Town/Area Councils have the responsibility to
strengthen the coordination of the development of the communities to ensure equitable
distribution of socio-economic programmes and projects in a manner that will promote
sustainable growth in the District. This facilitates effective participation in decision making at
the lowest level. There are also Unit Committees in each of the 39 electoral areas. Each Unit
Committee has 5 members who assist the Town / Area council to perform its functions.
1.4 Cultural and Social Structure
1.4.1 Traditional set up and culture
The Tano South District has one Traditional Council which is headed by the Paramount Chief
of the Traditional Area (Omanhene of Bechem), with the title “Kogyeabour”. The chiefs, who
are the custodians of culture and land, are the motivating force behind development projects
in many communities in the District. Fortunately, the District is not plagued with any serious
volatile disputes, land litigation and tribal conflicts which hamper development. The people
of Bechem celebrate the Adekyem festival in November every year in remembrance of their
ancestors who were hunters and always came to Bechem to “share” their game after the day’s
work and for development purposes. Traditionally, the District is part of the Ashanti
kingdom. In order to honour their great ancestors who played greater role in the development
of the Ashanti kingdom, they again celebrate the Akwasidae festival. Christianity form
majority of the entire population, followed by Islamic religion in the District.
1.4.2 Education
The District has a total of 85 public schools, of which 55 are Primary School, 29 Junior High
Schools, and 4 Second Cycle Schools including a School for the Deaf. In addition to these;
the District also has one tertiary institution as a College of Education. The District has 505
trained teachers and 348 untrained teachers in the public schools. The number of private
schools in the District is 18 (Source: GES, TSD-Annual School Census 2012/2013).
3
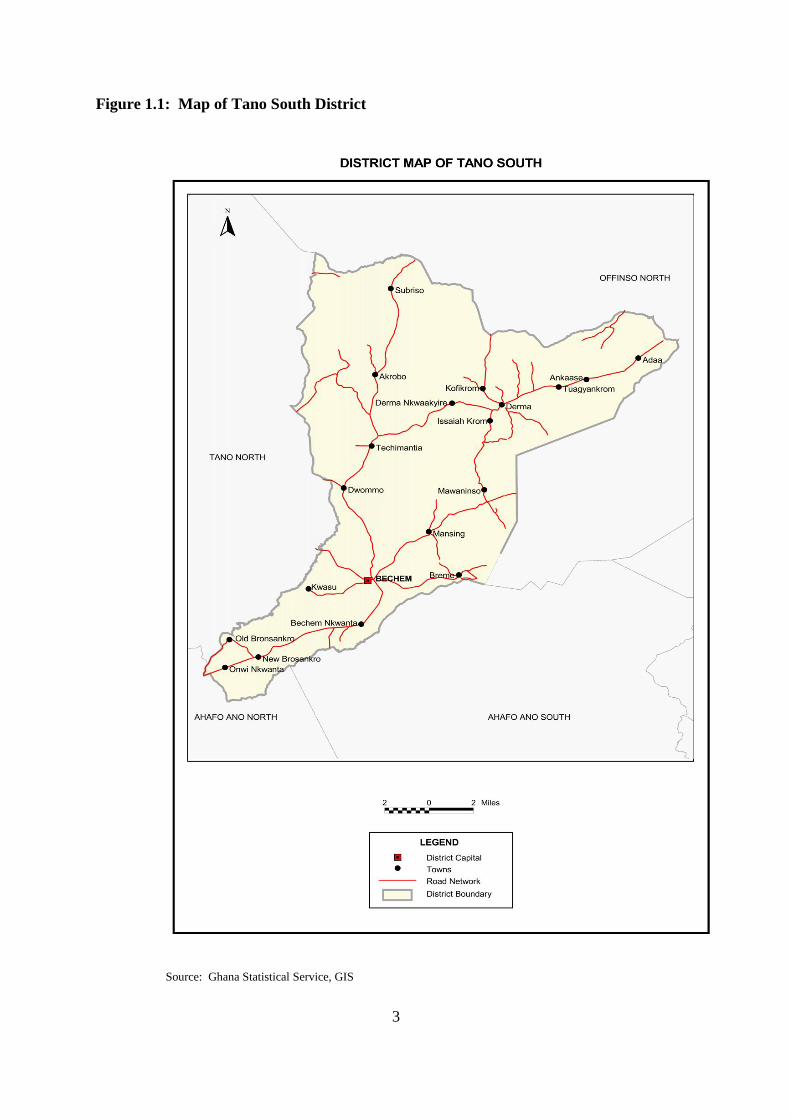
Figure 1.1: Map of Tano South District
Source: Ghana Statistical Service, GIS

4
1.4.3 Health
The District is fairly served in terms of health facilities and personnel availability. The
District is divided into 4 health sub-districts for effective and efficient service delivery. These
are Bechem, Techimantia, Brosankro and Derma. There are 7 health facilities in all, a
hospital, a polyclinic, 2 health centres, a clinic and 2 CHPS compound with 2 doctors and 97
beds. (Source: TSDA, DPCU REPORT-2010)
1.4.4 Ethnicity
The District is dominated by Akans/Asantes who forms more than half of the population.
Other minority groups are the Ahafos, Kusasis. Kokomba and pockets of other tribes.
(Source: 2010 PHC)
1.4.5 Religious composition
Christians form about 62.1 percent of the entire population whiles traditional religion forms
about 8.6 percent. Other dominant religion such as Islam is 26 percent whiles the other
religious groups form 3.9 percent.
1.5 Economy
1.5.1 Agriculture
The Tano South District is predominantly a rural economy, with agriculture as the main
economic activity for the daily sustenance of the people. The major food crops grown are
maize, cassava, plantain and cocoyam. Vegetables grown are garden egg, okro, pepper. The
major vegetable grown is tomatoes which are mainly produced in Derma. The District is the
highest producer of tomatoes in the region. It produces nearly 7,400 metric tons of tomatoes
annually and has the potential for expansion. Cash crops grown are cocoa, oil palm, coffee
and cashew. The District Assembly as the Planning Authority generates revenue from the
taxes it collects from rural agriculture producers especially during market days. The main
revenue generating centres are Derma, Bechem and Techimantia. The Tano South District
has the potential for large scale tomato processing factory; unfortunately this dream has not
been realized yet.
1.5.2 Industry
The District forest reserves are of scientific importance due to the conservation of
biodiversity and the benefits derived from ecosystem. The resource base of the District has
facilitated the establishment of small scale industries like table sawmills (Bechem), wood
carving (Techimantia and New Brosankro), weaving (Derma) and palm oil extraction
(Mansin and Bechem).
1.5.3 Financial institutions
The District has enormous economic potentials of which if harnessed could make the District
one of the richest in the country. The strategic importance of the District to the tomato
industry could be one of the pool factors that attract the services of a Commercial Bank
(Ghana commercial bank) and two rural banks operating in three communities, Bechem,
Derma and Techimantia. The Rural Banks are Derma and Bomaa Rural Banks (TSDA,
DPCU – 2010).
5
1.5.4 Information Communication Technology
All cellular phone firms in the country have coverage in the District. These are MTN, Tigo,
Vodafone, Expresso, Airtel and Glo. There are also internet facilities in the District. The
District Assembly in conjunction with the Ministry of Communication has established two
Community Information Centres (CIC), internet facilities at Bechem and Techimantia.
Private internet centres are also available to complement the two CICs. These facilities are
mainly patronized by students of basic schools for their studies. The high dependency on the
ICT in the District has improved business and other services, vis a vis sharing of information,
education and marketing. (TSDA, DPCU – 2010).
1.6 Census Methodology, Concepts and Definitions
1.6.1 Introduction
Ghana Statistical Service (GSS) was guided by the principle of international comparability
and the need to obtain accurate information in the 2010 Population and Housing Census
(2010 PHC). The Census was, therefore, conducted using all the essential features of a
modern census as contained in the United Nations Principles and Recommendations for
countries taking part in the 2010 Round of Population and Housing Censuses.
Experience from previous post independence censuses of Ghana (1960, 1970, 1984 and 2000)
was taken into consideration in developing the methodologies for conducting the 2010 PHC.
The primary objective of the 2010 PHC was to provide information on the number,
distribution and social, economic and demographic characteristics of the population of Ghana
necessary to facilitate the socio-economic development of the country.
1.6.2 Pre-enumeration activities
Development of census project document and work plans
A large scale statistical operation, such as the 2010 Population and Housing Census required
meticulous planning for its successful implementation. A working group of the Ghana
Statistical Service prepared the census project document with the assistance of two
consultants. The document contains the rationale and objectives of the census, census
organisation, a work plan as well as a budget. The project document was launched in
November 2008 as part of the Ghana Statistics Development Plan (GSDP) and reviewed in
November 2009.
Census secretariat and committees
A well-structured management and supervisory framework that outlines the responsibilities
of the various stakeholders is essential for the effective implementation of a population and
housing census. To implement the 2010 PHC, a National Census Secretariat was set up in
January 2008 and comprised professional and technical staff of GSS as well as staff of other
Ministries, Departments and Agencies (MDAs) seconded to GSS. The Census Secretariat was
primarily responsible for the day-to-day planning and implementation of the census activities.
The Secretariat had seven units, namely; census administration, cartography, recruitment and
training, publicity and education, field operations and logistics management, data processing,
and data analysis and dissemination.
The Census Secretariat was initially headed by an acting Census Coordinator engaged by the
United Nations Population Fund (UNFPA)in 2008 to support GSS in the planning of the
Census. In 2009, the Census Secretariat was re-organised with the Government Statistician as

6
the National Chief Census Officer and overall Coordinator, assisted by a Census
Management Team and a Census Coordinating Team. The Census Management Team had
oversight responsibility for the implementation of the Census. It also had the responsibility of
taking critical decisions on the census in consultation with other national committees. The
Census Coordinating Team, on the other hand, was responsible for the day-to-day
implementation of the Census programme.
A number of census committees were also set up at both national and sub-national levels to
provide guidance and assistance with respect to resource mobilization and technical advice.
At the national level, the committees were the National Census Steering Committee (NCSC),
the National Census Technical Advisory Committee (NCTAC) and the National Census
Publicity and Education Committee (NCPEC). At the regional and district levels, the
committees were the Regional Census Implementation Committee and the District Census
Implementation Committee, respectively.
The Regional and District Census Implementation Committees were inter-sectoral in their
composition. Members of the Committees were mainly from decentralized departments with
the Regional and District Coordinating Directors chairing the Regional Census
Implementation Committee and District Census Implementation Committee, respectively.
The Committees contributed to the planning of district, community and locality level
activities in areas of publicity and field operations. They supported the Regional and District
Census Officers in the recruitment and training of field personnel (enumerators and
supervisors), as well as mobilizing logistical support for the census.
Selection of census topics
The topics selected for the 2010 Population and Housing Census were based on
recommendations contained in the UN Principles and Recommendations for 2010 Round of
Population and Housing Censuses and the African Addendum to that document as well as the
needs of data users. All the core topics recommended at the global level, i.e., geographical
and internal migration characteristics, international migration, household characteristics,
demographic and social characteristics such as age, date of birth, sex, and marital status,
fertility and mortality, educational and economic characteristics, issues relating to disability
and housing conditions and amenities were included in the census.
Some topics that were not considered core by the UN recommendations but which were
found to be of great interest and importance to Ghana and were, therefore, included in the
2010 PHC are religion, ethnicity, employment sector and place of work, agricultural activity,
as well as housing topics, such as, type of dwelling, materials for outer wall, floor and roof,
tenure/holding arrangement, number of sleeping rooms, cooking fuel, cooking space and
Information Communication Technology (ICT).
Census mapping
A timely and well implemented census mapping is pivotal to the success of any population
and housing census. Mapping delineates the country into enumeration areas to facilitate
smooth enumeration of the population. The updating of the 2000 Census Enumeration Area
(EA) maps started in the last quarter of 2007 with the acquisition of topographic sheets of all
indices from the Survey and Mapping Division of the Lands Commission. In addition, digital
sheets were also procured for the Geographical Information System Unit.
7
The Cartography Unit of the Census Secretariat collaborated with the Survey and Mapping
Division of the Lands Commission and the Centre for Remote Sensing and Geographic
Information Services (CERSGIS) of the Department of Geography and Resource
Development, University of Ghana, to determine the viability of migrating from analogy to
digital mapping for the 2010 PHC, as recommended in the 2000 PHC Administrative Report.
Field cartographic work started in March 2008 and was completed in February 2010.
Development of questionnaire and manuals
For effective data collection, there is the need to design appropriate documents to solicit the
required information from respondents. GSS consulted widely with main data users in the
process of the questionnaire development. Data users including MDAs, research institutions,
civil society organisations and development partners were given the opportunity to indicate
the type of questions they wanted to be included in the census questionnaire.
Documents developed for the census included the questionnaire and manuals, and field
operation documents. The field operation documents included Enumerator’s Visitation
Record Book, Supervisor’s Record Book, and other operational control forms. These record
books served as operational and quality control tools to assist enumerators and supervisors to
control and monitor their field duties respectively.
Pre-tests and trial census
It is internationally recognized that an essential element in census planning is the pre-testing
of the questionnaire and related instructions. The objective of the pre-test is to test the
questionnaire, the definition of its concepts and the instructions for filling out the
questionnaire. The census questionnaire was pre-tested twice in the course of its
development. The first pre-test was carried out in March 2009 to find out the suitability of the
questions and the instructions provided. It also tested the adequacy and completeness of the
responses and how respondents understood the questions. The second pre-test was done in 10
selected enumeration areas in August, 2009. The objective of the second pre-test was to
examine the sequence of the questions, test the new questions, such as, date of birth and
migration, and assess how the introduction of ‘date of birth’ could help to reduce ‘age
heaping’. With regard to questions on fertility, the pre-tests sought to find out the difference,
if any, between proxy responses and responses by the respondents themselves. Both pre-tests
were carried in the Greater Accra Region. Experience from the pre-tests was used to improve
the final census questionnaire.
A trial census which is a dress rehearsal of all the activities and procedures that are planned
for the main census was carried out in October/November 2009. These included recruitment
and training, distribution of census materials, administration of the questionnaire and other
census forms, enumeration of the various categories of the population (household,
institutional and floating population), and data processing. The trial census was held in six
selected districts across the country namely; Saboba (Northern Region), Chereponi (Northern
Region), Sene (Brong Ahafo Region), Bia (Western Region), Awutu Senya (Central Region),
and Osu Klottey Sub-Metro (Greater Accra Region). A number of factors were considered in
selecting the trial census districts. These included: administrative boundary issues, ecological
zone, and accessibility, enumeration of floating population/outdoor-sleepers, fast growing
areas, institutional population, and enumeration areas with scattered settlements.

8
The trial census provided GSS with an opportunity to assess its plans and procedures as well
as the state of preparedness for the conduct of the 2010 PHC. The common errors found
during editing of the completed questionnaires resulted in modifications to the census
questionnaire, enumerator manuals and other documents. The results of the trial census
assisted GSS to arrive at technically sound decisions on the ideal number of persons per
questionnaire, number of persons in the household roster, migration questions, placement of
the mortality question, serial numbering of houses/housing structures and method of
collection of information on community facilities. Lessons learnt from the trial census also
guided the planning of the recruitment process, the procedures for training of census field
staff and the publicity and education interventions.
1.6.3 Census enumeration
Method of enumeration and field work
All post- independence censuses (1960, 1970, 1984, and 2000) conducted in Ghana used the
de facto method of enumeration where people are enumerated at where they were on census
night and not where they usually reside. The same method was adopted for the 2010 PHC.
The de facto count is preferred because it provides a simple and straight forward way of
counting the population since it is based on a physical fact of presence and can hardly be
misinterpreted. It is thought that the method also minimizes the risks of under-enumeration
and over enumeration. The canvasser method, which involves trained field personnel visiting
houses and households identified in their respective enumeration areas, was adopted for the
2010 PHC.
The main census enumeration involved the canvassing of all categories of the population by
trained enumerators, using questionnaires prepared and tested during the pre-enumeration
phase. Specific arrangements were made for the coverage of special population groups, such
as the homeless and the floating population. The fieldwork began on 21st September 2010
with the identification of EA boundaries, listing of structures, enumeration of institutional
population and floating population.
The week preceding the Census Night was used by field personnel to list houses and other
structures in their enumeration areas. Enumerators were also mobilized to enumerate
residents/inmates of institutions, such as, schools and prisons. They returned to the
institutions during the enumeration period to reconcile the information they obtained from
individuals and also to cross out names of those who were absent from the institutions on
Census Night. Out-door sleepers (floating population) were also enumerated on the Census
Night.
Enumeration of the household population started on Monday, 27th
September, 2010.
Enumerators visited houses, compounds and structures in their enumeration areas and started
enumerating all households including visitors who spent the Census Night in the households.
Enumeration was carried out in the order in which houses/structures were listed and where
the members of the household were absent, the enumerator left a call-back-card indicating
when he/she would come back to enumerate the household. The enumeration process took off
smoothly with enumerators poised on completing their assignments on schedule since many
of them were teachers and had to return to school. However, many enumerators ran short of
questionnaires after a few days’ work.
9
Enumeration resumed in all districts when the questionnaire shortage was resolved and by
17th
October, 2010, enumeration was completed in most districts. Enumerators who had
finished their work were mobilized to assist in the enumeration of localities that were yet to
be enumerated in some regional capitals and other fast growing areas. Flooded areas and
other inaccessible localities were also enumerated after the end of the official enumeration
period. Because some enumeration areas in fast growing cities and towns, such as, Accra
Metropolitan Area, Kumasi, Kasoa and Techiman were not properly demarcated and some
were characterized by large EAs, some enumerators were unable to complete their assigned
tasks within the stipulated time.
1.6.4 Post Enumeration Survey
In line with United Nations recommendations, GSS conducted a Post Enumeration Survey
(PES) in April, 2011 to check content and coverage error. The PES was also to serve as an
important tool in providing feedback regarding operational matters such as concepts and
procedures in order to help improve future census operations. The PES field work was
carried out for 21 days in April 2011 and was closely monitored and supervised to ensure
quality output. The main findings of the PES were that: 97 percent of all household residents
who were in the country on Census Night (26th
September, 2010) were enumerated. 1.3
percent of the population was erroneously included in the census.
Regional differentials are observed. Upper East region recorded the highest coverage rate of
98.2 percent while the Volta region had the lowest coverage rate of 95.7 percent. Males
(3.3%) were more likely than females (2.8%) to be omitted in the census. The coverage rate
for males was 96.7 percent and the coverage rate for females was 97.2 percent. Also, the
coverage rates (94.1%) for those within the 20-29 and 30-39 age groups are relatively lower
compared to the coverage rates of the other age groups. There was a high rate of agreement
between the 2010 PHC data and the PES data for sex (98.8%), marital status (94.6%),
relationship to head of household (90.5%) and age (83.0%).
1.6.5 Release and dissemination of results
The provisional results of the census were released in February 2011 and the final results in
May 2012. A National Analytical report, six thematic reports, a Census Atlas, 10 Regional
Reports and a report on Demographic, Social, Economic and Housing were prepared and
disseminated in 2013.
1.6.6 Concepts and definitions
Introduction
The 2010 Population and Housing Census of Ghana followed the essential concepts and
definitions of a modern Population and Housing Census as recommended by the United
Nations (UN). It is important that the concepts, definitions and recommendations are adhered
to since they form the basis upon which Ghana could compare her data with that of other
countries.
The concepts and definitions in this report cover all sections of the 2010 Population and
Housing Census questionnaires (PHC1A and PHC1B). The sections were: geographical
location of the population, Household and Non-household population, Literacy and
Education, Emigration, Demographic and Economic Characteristics, Disability, Information
Communication Technology (ICT), Fertility, Mortality, Agricultural Activity and Housing
Conditions.
10
The concepts and definitions are provided to facilitate understanding and use of the data
presented in this report. Users are therefore advised to use the results of the census within the
context of these concepts and definitions.
Region
There were ten (10) administrative regions in Ghana during the 2010 Population and Housing
Census as they were in 1984 and 2000.
District
In 1988, Ghana changed from the local authority system of administration to the district
assembly system. In that year, the then existing 140 local authorities were demarcated into
110 districts. In 2004, 28 new districts were created; this increased the number of districts in
the country to 138. In 2008, 32 additional districts were created bringing the total number of
districts to 170. The 2010 Population and Housing Census was conducted in these 170
administrative districts (these are made-up of 164 districts/municipals and 6 metropolitan
areas). In 2012, 46 new districts were created to bring the total number of districts to 216.
There was urgent need for data for the 46 newly created districts for planning and decision-
making. To meet this demand, the 2010 Census data was re-programmed into 216 districts
after carrying out additional fieldwork and consultations with stakeholders in the districts
affected by the creation of the new districts.
Locality
A locality was defined as a distinct population cluster (also designated as inhabited place,
populated centre, settlement) which has a NAME or LOCALLY RECOGNISED STATUS. It
included fishing hamlets, mining camps, ranches, farms, market towns, villages, towns, cities
and many other types of population clusters, which meet the above criteria. There were two
main types of localities, rural and urban. As in previous censuses, the classification of
localities into ‘urban’ and ‘rural’ was based on population size. Localities with 5,000 or more
persons were classified as urban while localities with less than 5,000 persons were classified
as rural.
Population
The 2010 Census was a “de facto” count and each person present in Ghana, irrespective of
nationality, was enumerated at the place where he/she spent the midnight of 26th September
2010.
Household
A household was defined as a person or a group of persons, who lived together in the same
house or compound and shared the same house-keeping arrangements. In general, a
household consisted of a man, his wife, children and some other relatives or a house help who
may be living with them. However, it is important to remember that members of a household
are not necessarily related (by blood or marriage) because non-relatives (e.g. house helps)
may form part of a household.
11
Head of household
The household head was defined as a male or female member of the household recognised as
such by the other household members. The head of household is generally the person who has
economic and social responsibility for the household. All relationships are defined with
reference to the head.
Household and non-household population
Household population comprised of all persons who spent the census night in a household
setting. All persons who did not spend the census night in a household setting (except
otherwise stated) were classified as non-household population. Persons who spent census
night in any of the under listed institutions and locations were classified as non-household
population:
(a) Educational Institutions
(b) Children's and Old People’s Homes
(c) Hospitals and Healing Centres
(d) Hotels
(e) Prisons
(f) Service Barracks
(g) Soldiers on field exercise
(h) Floating Population: The following are examples of persons in this category:
i. All persons who slept in lorry parks, markets, in front of stores and offices, public
bathrooms, petrol filling stations, railway stations, verandas, pavements, and all
such places which are not houses or compounds.
ii. Hunting and fishing camps.
iii. Beggars and vagrants (mentally sick or otherwise).
Age
The age of every person was recorded in completed years disregarding fractions of days and
months. For those persons who did not know their birthdays, the enumerator estimated their
ages using a list of district, regional and national historical events.
Nationality
Nationality is defined as the country to which a person belongs. A distinction is made
between Ghanaians and other nationals. Ghanaian nationals are grouped into Ghanaian by
birth, Ghanaian with dual nationality and Ghanaian by naturalization. Other nationals are
grouped into ECOWAS nationals, Africans other than ECOWAS nationals, and non-
Africans.

12
Ethnicity
Ethnicity refers to the ethnic group that a person belonged to. This information is collected
only from Ghanaians by birth and Ghanaians with dual nationality. The classification of
ethnic groups in Ghana is that officially provided by the Bureau of Ghana Languages and
which has been in use since the 1960 census.
Birthplace
The birthplace of a person refers to the locality of usual residence of the mother at the time of
birth. If after delivery a mother stayed outside her locality of usual residence for six months
or more or had the intention of staying in the new place for six or more months, then the
actual town/village of physical birth becomes the birthplace of the child.
Duration of residence
Duration of residence refers to the number of years a person has lived in a particular place.
This question is only asked of persons not born in the place where enumeration took place.
Breaks in duration of residence lasting less than 12 months are disregarded. The duration of
residence of persons who made multiple movements of one (1) year or more is assumed to be
the number of years lived in the locality (town or village) since the last movement.
Religion
Religion refers to the individual’s religious affiliation as reported by the respondent,
irrespective of the religion of the household head or the head’s spouse or the name of the
person. No attempt was made to find out if respondents actually practiced the faith they
professed.
Marital status
Marital status refers to the respondent’s marital status as at Census Night. The question on
marital status was asked only of persons 12 years and older. The selection of the age limit of
12 years was based on the average age at menarche and also on the practice in some parts of
the country where girls as young as 12 years old could be given in marriage.
Literacy
The question on literacy referred to the respondent's ability to read and write in any language.
A person was considered literate if he/she could read and write a simple statement with
understanding. The question on literacy was asked only of persons 11 years and older.
Education
School Attendance
Data was collected on school attendance for all persons three (3) years and older. School
attendance refers to whether a person has ever attended, was currently attending or has never
attended school. In the census, school meant an educational institution where a person
received at least four hours of formal education.
Although the lower age limit of formal education is six years for primary one, eligibility for
the school attendance question was lowered to three years because pre-school education has
become an important phenomenon in the country.

13
Level of Education
Level of education refers to the highest level of formal school that a person ever attended or
was attending. This information was obtained for persons 3 years and older.
Activity status
Activity status refers to economic or non-economic activity of respondents during the 7 days
preceding census night. Information on type of activity was collected on persons 5 years and
older. A person was regarded as economically active if he/she: Worked for pay or profit or
family gain for at least 1 hour within the 7 days preceding Census Night. This included
persons who were in paid employment or self- employment or contributing family workers.
Did not work, but had jobs to return to or were unemployed.
The economically not active were persons who did not work and were not seeking for work.
They were classified by reasons for not being economically active. Economically not active
persons included homemakers, students, retired persons, the disabled and persons who were
unable to work due to their age or ill-health.
Occupation
This referred to the type of work the person was engaged in at the establishment where he/she
worked. This was asked only of persons 5 years and older who worked 7 days before the
census night, and those who did not work but had a job to return to as well as those
unemployed who had worked before. All persons who worked during the 7 days before the
census night were classified by the kind of work they were engaged in. The emphasis was on
the work the person did during the reference period and not what he/she was trained to do.
For those who did not work but had a job to return to, their occupation was the job they
would go back to after the period of absence. Also, for persons who had worked before and
were seeking for work and available for work, their occupation was on the last work they did
before becoming unemployed. If a person was engaged in more than one occupation, only the
main one was considered.
Industry
Industry referred to the type of product produced or service rendered at the respondent’s work
place. Information was collected only on the main product produced or service rendered in
the establishment during the reference period.
Employment Status
Employment status refers to the status of a person in the establishment where he/she currently
works or previously worked. Eight employment status categories were provided: employee,
self-employed without employees, self-employed with employees, casual worker,
contributing family worker, apprentice, domestic employee (house help). Persons who could
not be classified under any of the above categories were classified as “other”.
Employment Sector
This refers to the sector in which a person worked. The employment sectors covered in the
census were public, private formal, private informal, semi-public/parastatal, NGOs and
international organizations.
14
Disability
Persons with disabilities were defined as those who were unable to or were restricted in the
performance of specific tasks/activities due to loss of function of some part of the body as a
result of impairment or malformation. Information was collected on persons with visual/sight
impairment, hearing impairment, mental retardation, emotional or behavioural disorders and
other physical challenges.
Information Communication Technology (ICT)
ICT questions were asked for both individuals and households. Persons having mobile
phones refer to respondents 12 years and older who owned mobile phones (irrespective of the
number of mobile phones owned by each person). Persons using internet facility refers to
those who had access to internet facility at home, internet cafe, on mobile phone or other
mobile device. Internet access is assumed to be not only via computer, but also by mobile
phones, PDA, game machine and digital television.
Households having Personal Computers/Laptops refer to households who own
desktops/laptop computers. The fixed telephone line refers to a telephone line connecting a
customer’s terminal equipment (e.g. telephone set, facsimile machine) to the public switch
telephone network.
Fertility
Two types of fertility data were collected: lifetime fertility and current fertility. Lifetime
fertility refers to the total number of live births that females 12 years and older had ever had
during their life time. Current fertility refers to the number of live births that females 12-54
years old had in the 12 months preceding the Census Night.
Mortality
Mortality refers to all deaths that occurred in the household during the 12 months preceding
the Census Night. The report presents information on deaths due to accidents, violence,
homicide and suicide. In addition, data were collected on pregnancy-related deaths of
females 12-54 years.
Agriculture
The census sought information on household members who are engaged in agricultural
activities, including the cultivation of crops or tree planting, rearing of livestock or breeding
of fish for sale or family consumption. Information was also collected on their farms, types of
crops and number and type of livestock.
Housing conditions and facilities
The UN recommended definition of a house as “a structurally separate and independent place
of abode such that a person or group of persons can isolate themselves from the hazards of
climate such as storms and the sun’’ was adopted. The definition, therefore, covered any type
of shelter used as living quarters, such as separate houses, semi-detached houses,
flats/apartments, compound houses, huts, tents, kiosks and containers.
Living quarters or dwelling units refer to a specific area or space occupied by a particular
household and therefore need not necessarily be the same as the house of which the dwelling
unit may be a part.

15
Information collected on housing conditions included the type of dwelling unit, main
construction materials for walls, floor and roof, holding/tenure arrangement, ownership type,
type of lighting, source of water supply and toilet facilities. Data was also collected on
method of disposal of solid and liquid waste.
1.7 Organisation of the Report
The report consists of nine chapters. Chapter one provides basic information about the
district. It gives a brief background of the district, describing its physical features, political
and administrative structure, social and cultural structure, economy and the methodology and
concepts used in the report. Chapter two discusses the population size, composition and age
structure. It further discusses the migratory pattern in the district as well as fertility and
mortality.
In chapter three, the focus is on household size, composition and headship as well as the
marital characteristics and nationality of the inhabitants of the district. The chapter also
discusses the religious affiliations and the educational statuses of the members of the district.
Chapter four focuses on economic characteristics such as economic activity status,
occupation, industries and the employment status and sectors that the people are employed.
Information Communication Technology (ICT) is discussed in chapter five. It analyses
mobile phone ownership, internet use and ownership of desktop/laptop computers while
chapter six is devoted to Persons living with disabilities (PWDs) and their socio-demographic
characteristics. Chapter seven concentrates on the agricultural activities of the households,
describing the types of farming activities, livestock rearing and numbers of livestock reared.
In chapter eight, housing conditions such as housing stock, type of dwelling and construction
materials, room occupancy, holding and tenancy, lighting and cooking facilities, bathing and
toilet facilities, waste disposal and source of water for drinking or for other domestic use in
the district are discussed and analyzed in detail. The final chapter, Chapter nine presents the
summary of findings and conclusions. It also discusses the policy implications of the findings
for the district.
16
CHAPTER TWO
DEMOGRAPHIC CHARACTERISTICS
2.1 Introduction
One of the most important indicators for assessing the changes in population is demographic
characteristics. These changes in a country’s population are mainly effected through fertility,
mortality and migration levels, which to a large extent, are influenced by age-sex
composition. The 2010 PHC, like all other population and housing censuses undertaken in the
country, was a "de facto" count of each person present in Ghana irrespective of nationality.
2.2 Population Size and Distribution
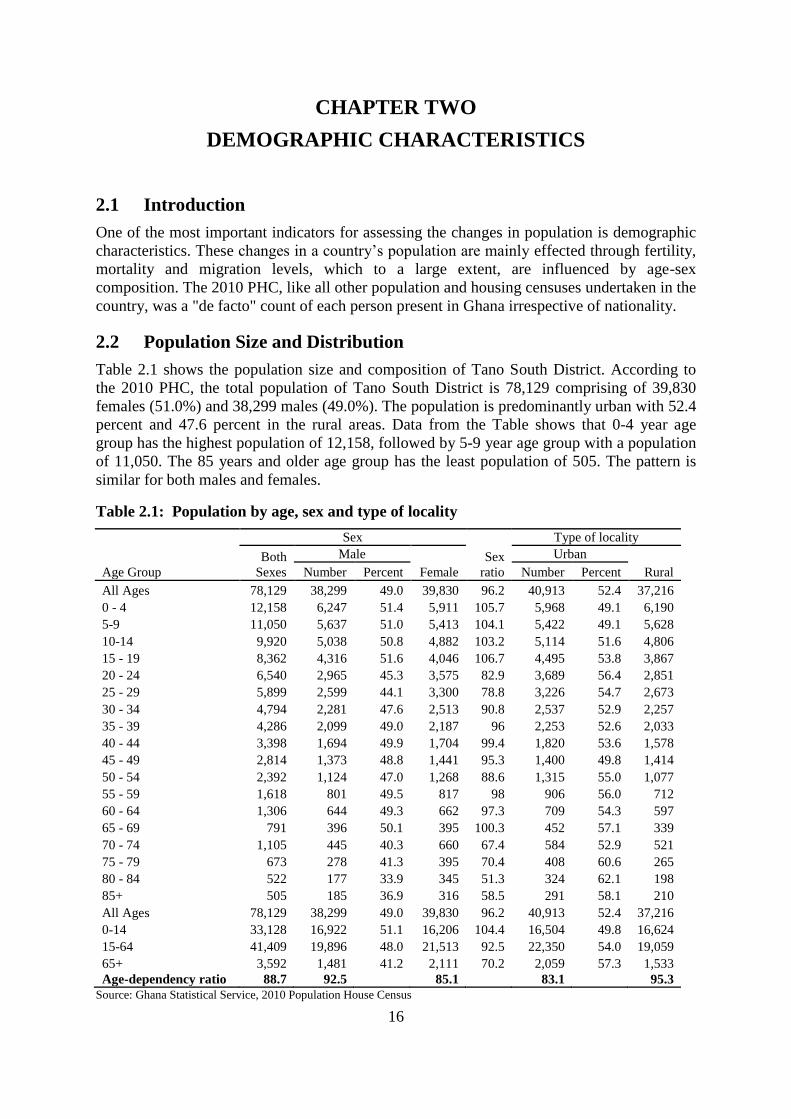
Table 2.1 shows the population size and composition of Tano South District. According to
the 2010 PHC, the total population of Tano South District is 78,129 comprising of 39,830
females (51.0%) and 38,299 males (49.0%). The population is predominantly urban with 52.4
percent and 47.6 percent in the rural areas. Data from the Table shows that 0-4 year age
group has the highest population of 12,158, followed by 5-9 year age group with a population
of 11,050. The 85 years and older age group has the least population of 505. The pattern is
similar for both males and females.
Table 2.1: Population by age, sex and type of locality
Age Group
Sex
Sex
ratio
Type of locality
Both
Sexes
Male
Urban
Number Percent Female Number Percent Rural
All Ages 78,129 38,299 49.0 39,830 96.2 40,913 52.4 37,216
0 - 4 12,158 6,247 51.4 5,911 105.7 5,968 49.1 6,190
5-9 11,050 5,637 51.0 5,413 104.1 5,422 49.1 5,628
10-14 9,920 5,038 50.8 4,882 103.2 5,114 51.6 4,806
15 - 19 8,362 4,316 51.6 4,046 106.7 4,495 53.8 3,867
20 - 24 6,540 2,965 45.3 3,575 82.9 3,689 56.4 2,851
25 - 29 5,899 2,599 44.1 3,300 78.8 3,226 54.7 2,673
30 - 34 4,794 2,281 47.6 2,513 90.8 2,537 52.9 2,257
35 - 39 4,286 2,099 49.0 2,187 96 2,253 52.6 2,033
40 - 44 3,398 1,694 49.9 1,704 99.4 1,820 53.6 1,578
45 - 49 2,814 1,373 48.8 1,441 95.3 1,400 49.8 1,414
50 - 54 2,392 1,124 47.0 1,268 88.6 1,315 55.0 1,077
55 - 59 1,618 801 49.5 817 98 906 56.0 712
60 - 64 1,306 644 49.3 662 97.3 709 54.3 597
65 - 69 791 396 50.1 395 100.3 452 57.1 339
70 - 74 1,105 445 40.3 660 67.4 584 52.9 521
75 - 79 673 278 41.3 395 70.4 408 60.6 265
80 - 84 522 177 33.9 345 51.3 324 62.1 198
85+ 505 185 36.9 316 58.5 291 58.1 210
All Ages 78,129 38,299 49.0 39,830 96.2 40,913 52.4 37,216
0-14 33,128 16,922 51.1 16,206 104.4 16,504 49.8 16,624
15-64 41,409 19,896 48.0 21,513 92.5 22,350 54.0 19,059
65+ 3,592 1,481 41.2 2,111 70.2 2,059 57.3 1,533
Age-dependency ratio 88.7 92.5 85.1 83.1 95.3
Source: Ghana Statistical Service, 2010 Population House Census
17
The age-dependency ratio for the District is 88.7, signifying relatively high dependence on
the working population. The rural population has a higher dependency ratio of 95.3 higher
than the urban population of 83.1. The sex ratio in the District is 96.2. This means that for
every 100 females, there are about 96 males, indicating that there are more females than
males.
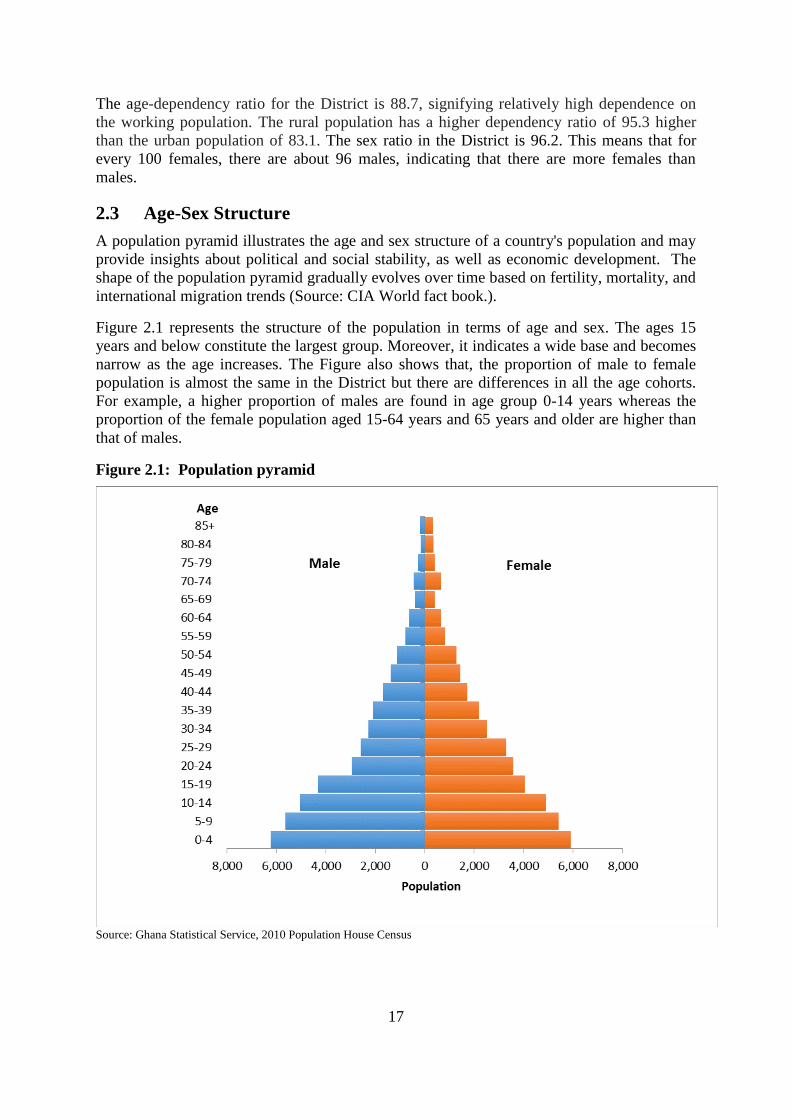
2.3 Age-Sex Structure
A population pyramid illustrates the age and sex structure of a country's population and may
provide insights about political and social stability, as well as economic development. The
shape of the population pyramid gradually evolves over time based on fertility, mortality, and
international migration trends (Source: CIA World fact book.).
Figure 2.1 represents the structure of the population in terms of age and sex. The ages 15
years and below constitute the largest group. Moreover, it indicates a wide base and becomes
narrow as the age increases. The Figure also shows that, the proportion of male to female
population is almost the same in the District but there are differences in all the age cohorts.
For example, a higher proportion of males are found in age group 0-14 years whereas the
proportion of the female population aged 15-64 years and 65 years and older are higher than
that of males.
Figure 2.1: Population pyramid
Source: Ghana Statistical Service, 2010 Population House Census

18
2.4 Fertility, Migration and Mortality
Other most essential components of population dynamics that influence the population
structure are migration, fertility and mortality. These components of population dynamics can
be influenced by demographic, economic, socio-cultural, environmental and political factors.
The 2010 census collected data on fertility, mortality and migration.
2.4.1 Fertility
Fertility refers to the number of live births women have. It is directly determined by a number
of factors that in turn are affected by many social, cultural, economic, health, and other
environmental factors. The following fertility measures were considered during the 2010
PHC. These include Crude Birth Rate (CBR) which indicates the number of live births per
1000 population in a given year. General Fertility Rate (GFR) is the number of live births per
1000 women between the ages 15-49 in a given year. The Total Fertility Rate (TFR) is the
average number of children that would be born to a woman by the time she ended
childbearing if she were to pass through all her childbearing years conforming to the age
specific fertility rates of a given year.
Table 2.2 shows the reported TFR, GFR and the CBR for the Brong Ahafo Region and Tano
South District. The District has a total population of 78,129 of which women between the
ages 15-49 are 22,890. The TFR in 2010 for Tano South District for women between the ages
15-49 is about 3.99 births per 1,000 women which is higher than the regional average of 3.58
births per 1,000 women. The GFR on the other hand for women between the ages 15-49 is
120.3 live births per 1,000 women, which is higher than the regional average of 105.9 births
per 1,000 women in the age range 15-49 years while the CBR is 26.6 live births per 1000
population in the Tano South District.

19
Table 2.2: Reported total fertility rate, general fertility rate and crude birth rate
by district
District Population
Number of
women 15-49
years Number of births
in last 12 months Total
Fertility
Rate
General
Fertility
Rate
Crude
Birth
Rate Number Percent Number Percent
All Districts 2,310,983 692,773 100.0
61,426 100.0 3.6 105.9 26.6
Asunafo South 95,580 26,721 3.9
2,732 4.4 4.0 122.4 28.6
Asunafo North
Municipal 124,685 36,428 5.3
3,479 5.7 3.9 115 27.9
Asutifi 105,843 30,324 4.4
2,999 4.9 4.0 117.1 28.3
Dormaa Municipal 159,789 49,101 7.1
4,390 7.1 3.6 105.9 27.5
Dormaa East 50,871 15,476 2.2
1,433 2.3 3.7 111.5 28.2
Tano South 78,129 22,890 3.3 2,275 3.7 4.0 120.3 29.1
Tano North 79,973 23,704 3.4
2,085 3.4 3.6 105.8 26.1
Sunyani Municipal 123,224 42,263 6.1
2,669 4.3 2.6 73.1 21.7
Sunyani West 85,272 27,031 3.9
2,174 3.5 3.2 95.8 25.5
Berekum Municipal 129,628 43,737 6.3
3,037 4.9 2.8 83.1 23.4
Jaman South 92,649 29,104 4.2
2,335 3.8 3.6 97.4 25.2
Jaman North 83,059 25,434 3.7
1,763 2.9 3.0 84.6 21.2
Tain 108,386 30,736 4.4
2,671 4.3 3.5 104.1 24.6
Wenchi Municipal 89,739 26,699 3.9
2,216 3.6 3.4 99.3 24.7
Techiman Municipal 206,856 66,143 9.5
5,750 9.4 3.5 103.3 27.8
Nkoranza South 100,929 29,784 4.3
3,030 4.9 4.0 121.1 30
Nkoranza North 65,895 18,220 2.6
1,942 3.2 4.4 129.6 29.5
Atebubu Amantin 105,938 29,933 4.3
2,973 4.8 4.0 118.7 28.1
Sene 118,810 32,273 4.7
3,375 5.5 4.2 123.2 28.4
Pru 129,248 36,721 5.3
3,026 4.9 3.4 98.5 23.4
Kintampo South 81,000 22,055 3.2
2,391 3.9 4.5 132.3 29.5
Kintampo North
Municipal 95,480 27,996 4.0 2,681 4.4 3.9 115.1 28.1 Source: Ghana Statistical Service, 2010 Population House Census
Note: * Number of live births per 1,000 women aged 15-49 years
** Number of live births per 1,000 population
2.4.2 Mortality
Mortality, as one of the three components of population growth, plays an important role in
determining the growth of a population. The level and pattern of mortality is a reflection of
the health status of a population. Thus, indices of mortality have been used as indicators of
socio-economic development. Mortality data are needed, among others, for the analysis of
potential growth of population and construction of population projections as well as to
formulate policies, develop, implement and evaluate public health programmes and projects.
They are also used in calculating probable life span of the population which are then used by
institutions such as insurance companies to set premiums.
Table 2.3 shows females 12 years and older totalling 26,480 and the number of children ever
born and those still surviving. The data indicates that children ever born and children

20
surviving are 75,565 and 65,386 respectively. For all the age categories, males (38,186)
dominate the females (37,379) for children ever born.
Again, the Table shows that children ever born to those aged 12-14 is significantly low with a
record of 11. As age increases from 15 to 60 years and older, the percentage of children ever
born increases up to age 35 to 39 years and started decreasing again but however reached its
peak at age 60 years and older with the highest record. Thus, women aged 60 years and older
recorded the highest number of children ever born and relatively higher child survivorship of
19,086 and 14,722 respectively.
Table 2.3: Female population 12years and older by age, children ever born,
children surviving and sex of children
Age
Number
of
Female
Children Ever Born Children Surviving
Both
Sexes Male Female
Both
Sexes Male Female
All Ages 26,480 75,565 38,186 37,379
65,386 32,719 32,667
10-14 2,856 11 6 5
11 6 5
15-19 4,046 580 293 287
519 254 265
20-24 3,575 3,321 1,662 1,659
3,056 1,499 1,557
25-29 3,300 6,664 3,388 3,276
6,167 3,104 3,063
30-34 2,513 8,310 4,200 4,110
7,643 3,843 3,800
35-39 2,187 9,055 4,553 4,502
8,243 4,098 4,145
40-44 1,704 8,437 4,241 4,196
7,622 3,821 3,801
45-49 1,441 7,844 4,096 3,748
6,880 3,530 3,350
50-54 1,268 7,318 3,685 3,633
6,335 3,208 3,127
55-59 817 4,939 2,499 2,440
4,188 2,115 2,073
60+ 2,773 19,086 9,563 9,523 14,722 7,241 7,481 Source: Ghana Statistical Service, 2010 Population and Housing Census
Age-specific death rates by sex
Age specific death rate is the number of deaths in a specific age group per 1,000 population
of that age group. Because mortality varies greatly by age and sex, age-specific death rates
are often given separately for males and females in a population.
Figure 2.2 shows the reported age specific death rates by sex in the Tano South District. The
trend shows that females generally experience higher mortality than males. Both males and
females experience higher death rates before age five. This could be due to the fact that
children are susceptible to sicknesses at that tender age. Between the age group 15 to 49
years, males registered fairly low death rate compared to females in the same age category.
Again, the relatively high female death rate may be due to the prevailing high maternal death
rates. At 50-54 years males registered higher death rate compared to females. The mortality
rate rises sharply and reaches its peak at age 70 years and older.
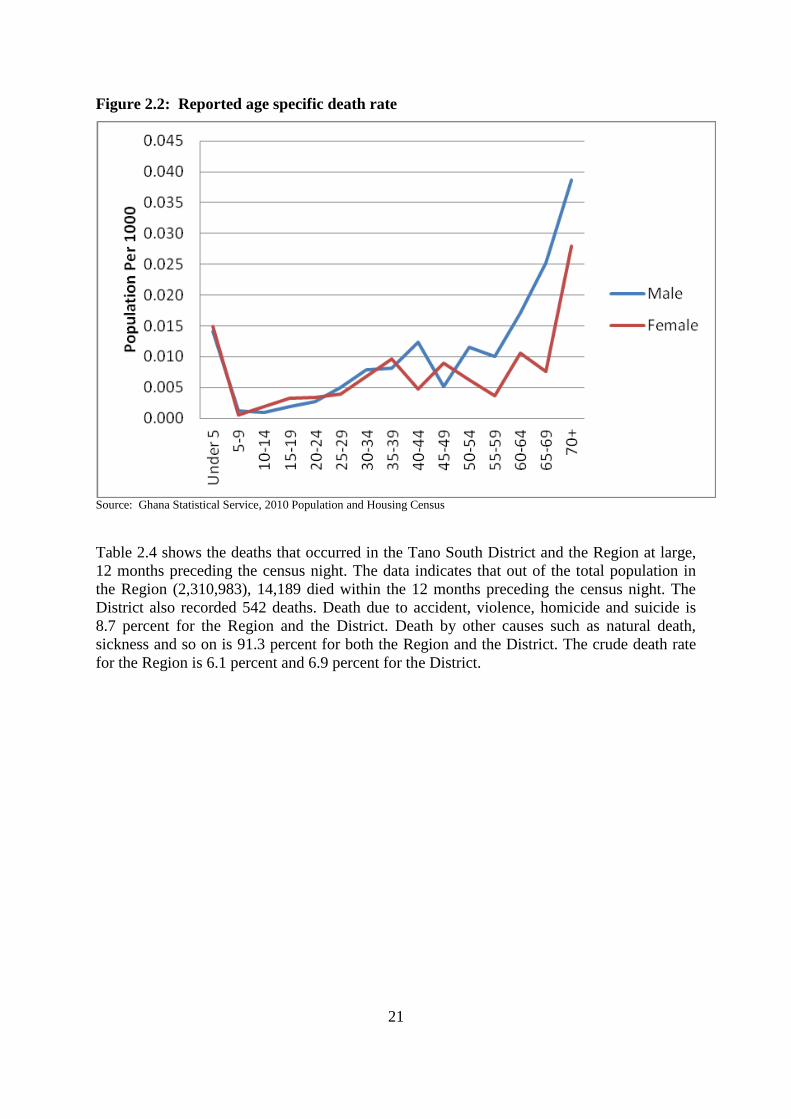
21
Figure 2.2: Reported age specific death rate
Source: Ghana Statistical Service, 2010 Population and Housing Census
Table 2.4 shows the deaths that occurred in the Tano South District and the Region at large,
12 months preceding the census night. The data indicates that out of the total population in
the Region (2,310,983), 14,189 died within the 12 months preceding the census night. The
District also recorded 542 deaths. Death due to accident, violence, homicide and suicide is
8.7 percent for the Region and the District. Death by other causes such as natural death,
sickness and so on is 91.3 percent for both the Region and the District. The crude death rate
for the Region is 6.1 percent and 6.9 percent for the District.
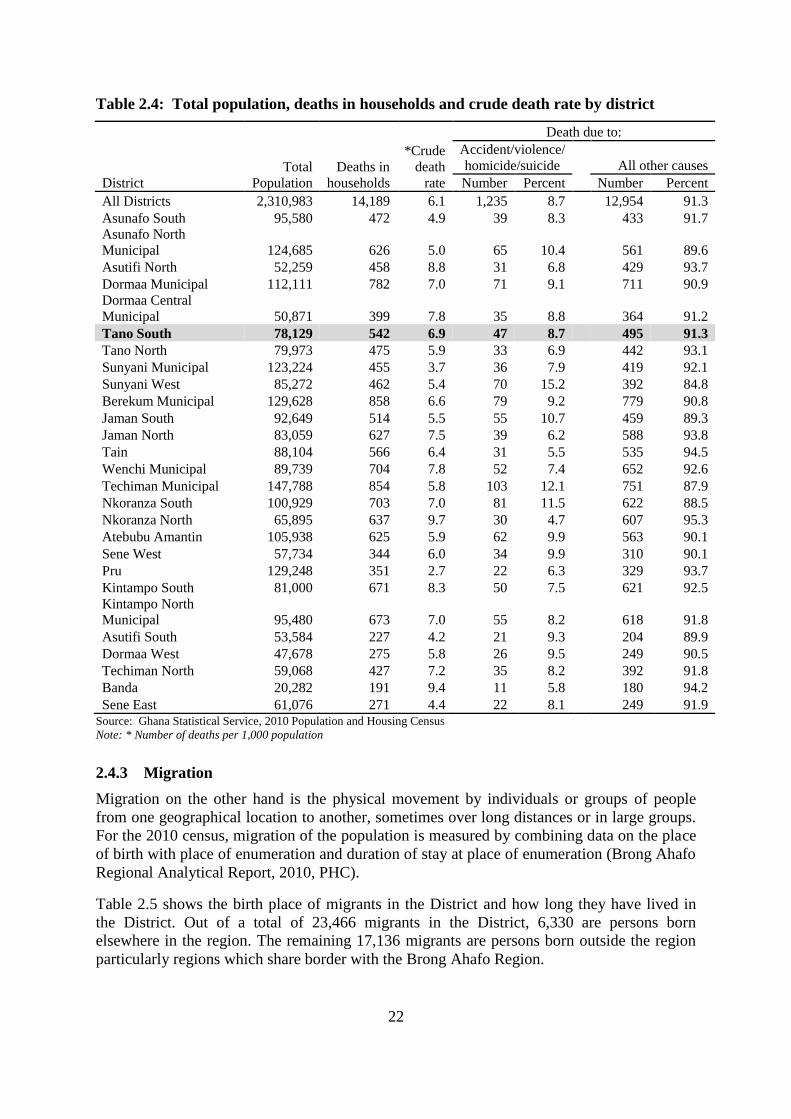
22
Table 2.4: Total population, deaths in households and crude death rate by district
District
Total
Population
Deaths in
households
*Crude
death
rate
Death due to:
Accident/violence/
homicide/suicide
All other causes
Number Percent Number Percent
All Districts 2,310,983 14,189 6.1 1,235 8.7
12,954 91.3
Asunafo South 95,580 472 4.9 39 8.3
433 91.7
Asunafo North
Municipal 124,685 626 5.0 65 10.4
561 89.6
Asutifi North 52,259 458 8.8 31 6.8
429 93.7
Dormaa Municipal 112,111 782 7.0 71 9.1
711 90.9
Dormaa Central
Municipal 50,871 399 7.8 35 8.8
364 91.2
Tano South 78,129 542 6.9 47 8.7 495 91.3
Tano North 79,973 475 5.9 33 6.9
442 93.1
Sunyani Municipal 123,224 455 3.7 36 7.9
419 92.1
Sunyani West 85,272 462 5.4 70 15.2
392 84.8
Berekum Municipal 129,628 858 6.6 79 9.2
779 90.8
Jaman South 92,649 514 5.5 55 10.7
459 89.3
Jaman North 83,059 627 7.5 39 6.2
588 93.8
Tain 88,104 566 6.4 31 5.5
535 94.5
Wenchi Municipal 89,739 704 7.8 52 7.4
652 92.6
Techiman Municipal 147,788 854 5.8 103 12.1
751 87.9
Nkoranza South 100,929 703 7.0 81 11.5
622 88.5
Nkoranza North 65,895 637 9.7 30 4.7
607 95.3
Atebubu Amantin 105,938 625 5.9 62 9.9
563 90.1
Sene West 57,734 344 6.0 34 9.9
310 90.1
Pru 129,248 351 2.7 22 6.3
329 93.7
Kintampo South 81,000 671 8.3 50 7.5
621 92.5
Kintampo North
Municipal 95,480 673 7.0 55 8.2
618 91.8
Asutifi South 53,584 227 4.2 21 9.3
204 89.9
Dormaa West 47,678 275 5.8 26 9.5
249 90.5
Techiman North 59,068 427 7.2 35 8.2
392 91.8
Banda 20,282 191 9.4 11 5.8
180 94.2
Sene East 61,076 271 4.4 22 8.1 249 91.9 Source: Ghana Statistical Service, 2010 Population and Housing Census
Note: * Number of deaths per 1,000 population
2.4.3 Migration
Migration on the other hand is the physical movement by individuals or groups of people
from one geographical location to another, sometimes over long distances or in large groups.
For the 2010 census, migration of the population is measured by combining data on the place
of birth with place of enumeration and duration of stay at place of enumeration (Brong Ahafo
Regional Analytical Report, 2010, PHC).
Table 2.5 shows the birth place of migrants in the District and how long they have lived in
the District. Out of a total of 23,466 migrants in the District, 6,330 are persons born
elsewhere in the region. The remaining 17,136 migrants are persons born outside the region
particularly regions which share border with the Brong Ahafo Region.
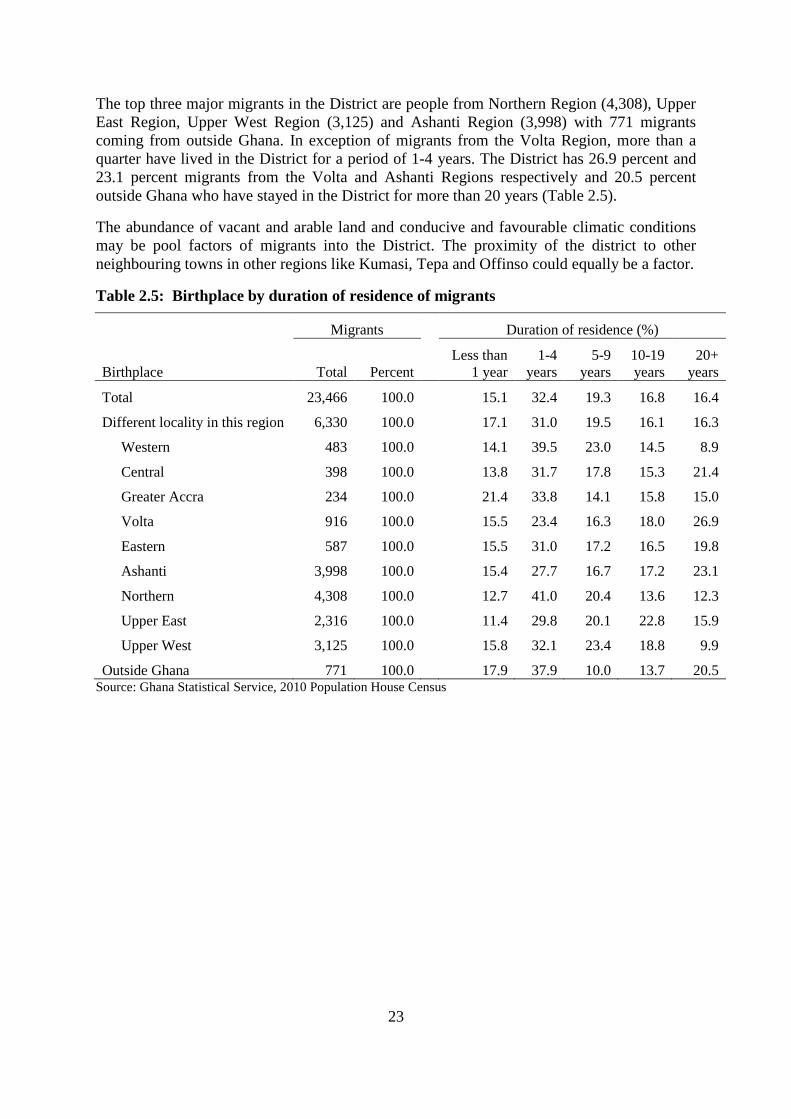
23
The top three major migrants in the District are people from Northern Region (4,308), Upper
East Region, Upper West Region (3,125) and Ashanti Region (3,998) with 771 migrants
coming from outside Ghana. In exception of migrants from the Volta Region, more than a
quarter have lived in the District for a period of 1-4 years. The District has 26.9 percent and
23.1 percent migrants from the Volta and Ashanti Regions respectively and 20.5 percent
outside Ghana who have stayed in the District for more than 20 years (Table 2.5).
The abundance of vacant and arable land and conducive and favourable climatic conditions
may be pool factors of migrants into the District. The proximity of the district to other
neighbouring towns in other regions like Kumasi, Tepa and Offinso could equally be a factor.
Table 2.5: Birthplace by duration of residence of migrants
Birthplace
Migrants Duration of residence (%)
Total Percent Less than
1 year 1-4
years 5-9
years 10-19
years 20+
years
Total 23,466 100.0
15.1 32.4 19.3 16.8 16.4
Different locality in this region 6,330 100.0
17.1 31.0 19.5 16.1 16.3
Western 483 100.0
14.1 39.5 23.0 14.5 8.9
Central 398 100.0
13.8 31.7 17.8 15.3 21.4
Greater Accra 234 100.0
21.4 33.8 14.1 15.8 15.0
Volta 916 100.0
15.5 23.4 16.3 18.0 26.9
Eastern 587 100.0
15.5 31.0 17.2 16.5 19.8
Ashanti 3,998 100.0
15.4 27.7 16.7 17.2 23.1
Northern 4,308 100.0
12.7 41.0 20.4 13.6 12.3
Upper East 2,316 100.0
11.4 29.8 20.1 22.8 15.9
Upper West 3,125 100.0
15.8 32.1 23.4 18.8 9.9
Outside Ghana 771 100.0 17.9 37.9 10.0 13.7 20.5 Source: Ghana Statistical Service, 2010 Population House Census
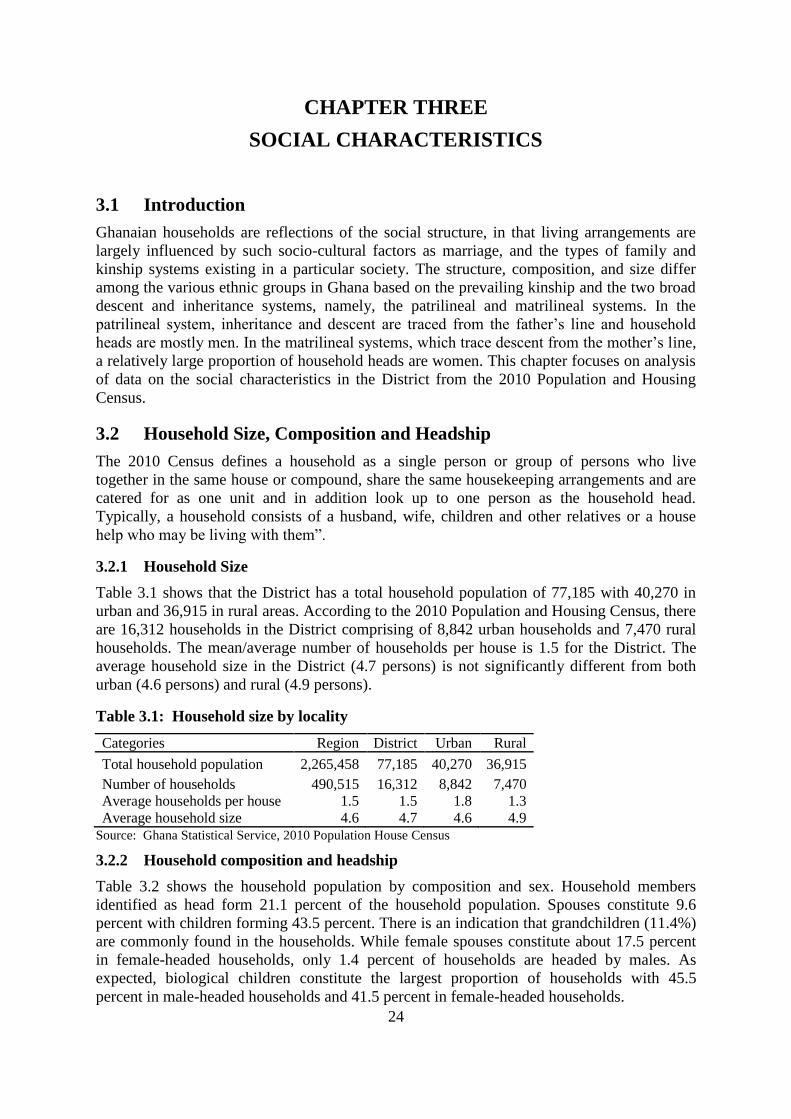
24
CHAPTER THREE
SOCIAL CHARACTERISTICS
3.1 Introduction
Ghanaian households are reflections of the social structure, in that living arrangements are
largely influenced by such socio-cultural factors as marriage, and the types of family and
kinship systems existing in a particular society. The structure, composition, and size differ
among the various ethnic groups in Ghana based on the prevailing kinship and the two broad
descent and inheritance systems, namely, the patrilineal and matrilineal systems. In the
patrilineal system, inheritance and descent are traced from the father’s line and household
heads are mostly men. In the matrilineal systems, which trace descent from the mother’s line,
a relatively large proportion of household heads are women. This chapter focuses on analysis
of data on the social characteristics in the District from the 2010 Population and Housing
Census.
3.2 Household Size, Composition and Headship
The 2010 Census defines a household as a single person or group of persons who live
together in the same house or compound, share the same housekeeping arrangements and are
catered for as one unit and in addition look up to one person as the household head.
Typically, a household consists of a husband, wife, children and other relatives or a house
help who may be living with them”.
3.2.1 Household Size
Table 3.1 shows that the District has a total household population of 77,185 with 40,270 in
urban and 36,915 in rural areas. According to the 2010 Population and Housing Census, there
are 16,312 households in the District comprising of 8,842 urban households and 7,470 rural
households. The mean/average number of households per house is 1.5 for the District. The
average household size in the District (4.7 persons) is not significantly different from both
urban (4.6 persons) and rural (4.9 persons).
Table 3.1: Household size by locality
Categories Region District Urban Rural
Total household population 2,265,458 77,185 40,270 36,915
Number of households 490,515 16,312 8,842 7,470
Average households per house 1.5 1.5 1.8 1.3
Average household size 4.6 4.7 4.6 4.9
Source: Ghana Statistical Service, 2010 Population House Census
3.2.2 Household composition and headship
Table 3.2 shows the household population by composition and sex. Household members
identified as head form 21.1 percent of the household population. Spouses constitute 9.6
percent with children forming 43.5 percent. There is an indication that grandchildren (11.4%)
are commonly found in the households. While female spouses constitute about 17.5 percent
in female-headed households, only 1.4 percent of households are headed by males. As
expected, biological children constitute the largest proportion of households with 45.5
percent in male-headed households and 41.5 percent in female-headed households.

25
Table 3.2: Household population by composition and sex
Household composition
Total Male Female
Number Percent Number Percent Number Percent
Total 77,185 100.0
37,865 100.0
39,320 100.0
Head 16,312 21.1
10,193 26.9
6,119 15.6
Spouse (wife/husband) 7,413 9.6
533 1.4
6,880 17.5
Child (son/daughter) 33,543 43.5
17,221 45.5
16,322 41.5
Parent/Parent in-law 617 0.8
95 0.3
522 1.3
Son/Daughter in-law 405 0.5
138 0.4
267 0.7
Grandchild 8,767 11.4
4,459 11.8
4,308 11.0
Brother/Sister 3,552 4.6
2,032 5.4
1,520 3.9
Step child 511 0.7
251 0.7
260 0.7
Adopted/Foster child 254 0.3
109 0.3
145 0.4
Other relative 4,329 5.6
1,943 5.1
2,386 6.1
Non-relative 1,482 1.9 891 2.4 591 1.5 Source: Ghana Statistical Service, 2010 Population and Housing Census
3.2.3 Household Structure
The household structure presented in this section refers to the type of relationship (whether
related or unrelated) among household members who were present on census night.
Classification of households depend on whether it is a single person household, household
that consists of head and spouse only, nuclear household (head, spouse(s) and their children)
or nuclear extended among other combinations. Table 3.3 shows that Nuclear family
households defined to include head, spouse(s) and children form 27.3 percent and Extended
family households (Head, spouse(s), children and Head's relatives) is 22 percent. Households
with heads only, that is, single person households, constitute 3.3 percent of the total number
of households in the District. In all the household structures, households headed by males
exceed their female counterparts in exception of the three single parent nuclear and extended
households. Nuclear family households constitute 28.6 percent for male headed households
and 26 percent for female headed households.
Table 3.3: Household structure by sex
Household structure
Total Male Female
Number Percent Number Percent Number Percent
Total 77,185 100.0
37,865 100.0
39,320 100.0
Head only 2,512 3.3
1,789 4.7
723 1.8
Head and a spouse only 1,128 1.5
562 1.5
566 1.4
Nuclear (Head, spouse(s) and children) 21,053 27.3
10,823 28.6
10,230 26.0
Extended (Head, spouse(s), children and
Head's relatives) 16,999 22.0
8,671 22.9
8,328 21.2
Extended and non-relatives 1,876 2.4
1,012 2.7
864 2.2
Head, spouse(s) and other composition 2,303 3.0
1,189 3.1
1,114 2.8
Single parent Nuclear 7,824 10.1
3,372 8.9
4,452 11.3
Single parent Extended 15,281 19.8
6,229 16.5
9,052 23.0
Single parent Extended and non-relative 1,941 2.5
912 2.4
1,029 2.6
Head and other composition but no
spouse 6,268 8.1 3,306 8.7 2,962 7.5
Source: Ghana Statistical Service, 2010 Population and Housing Census

26
3.3 Marital Status
Marriage may be defined as a social institution which establishes the legitimacy of children,
(Gough, 1959 cited in GSS 2013 PHC national analytical report). Marriage defined this way,
thus, serves as a tool for procreation, mutual support and companionship. The 2010 PHC
collected data on marital status for persons aged 12 years and older. The data is classified into
‘never married’, ‘consensual union’, ‘married’, separated’, ‘divorced’ and ‘widowed’.
Figure 3.1 shows that of the population aged 12 years and older, 44 percent are married while
39 percent have never been married. In addition, informal/consensual union/living together
constitutes 7 percent with 4 percent of the population divorced.
Figure 3.1: Population 12 years and older by marital status
Source: Ghana Statistical Service, 2010 Population and Housing Census
Table 3.4 shows the marital status by sex and age. From the data, the proportion of the age
group (12-14 years) who have never married is 93.4 percent while 4 percent are married. Age
group 65 years and above have the highest proportion of widowed with 37.1 percent.
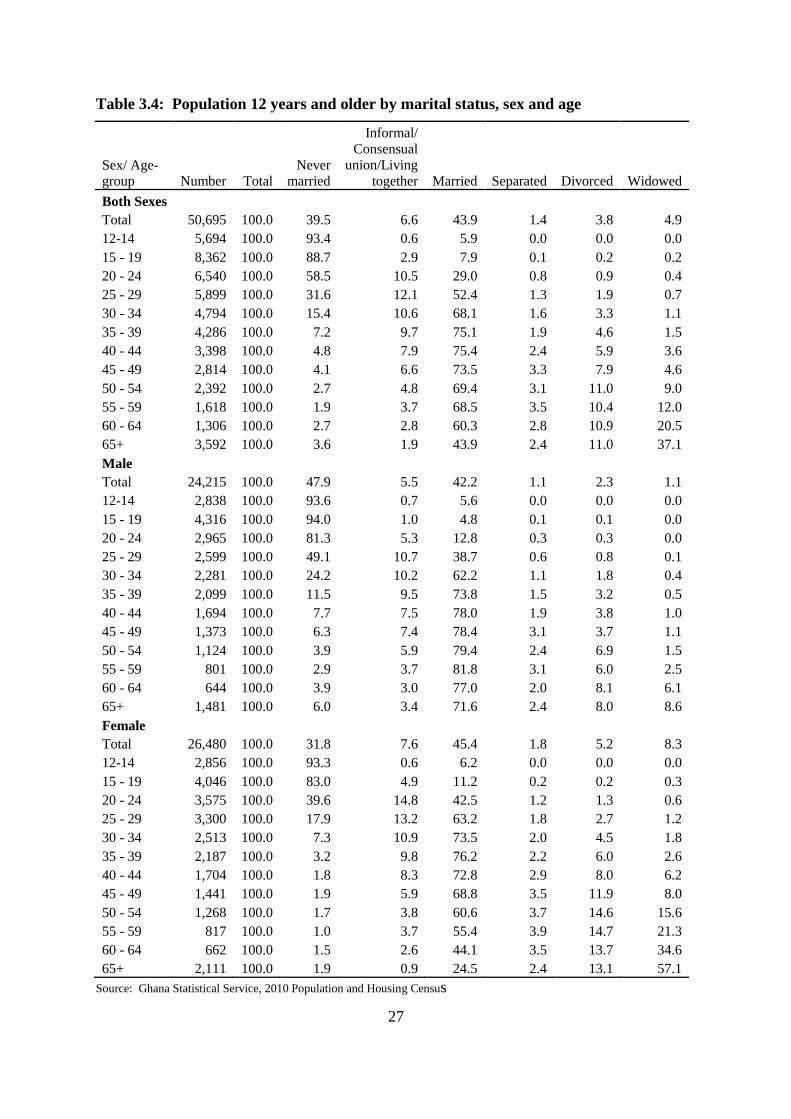
27
Table 3.4: Population 12 years and older by marital status, sex and age
Sex/ Age-
group Number Total
Never
married
Informal/
Consensual
union/Living
together Married Separated Divorced Widowed
Both Sexes
Total 50,695 100.0 39.5 6.6 43.9 1.4 3.8 4.9
12-14 5,694 100.0 93.4 0.6 5.9 0.0 0.0 0.0
15 - 19 8,362 100.0 88.7 2.9 7.9 0.1 0.2 0.2
20 - 24 6,540 100.0 58.5 10.5 29.0 0.8 0.9 0.4
25 - 29 5,899 100.0 31.6 12.1 52.4 1.3 1.9 0.7
30 - 34 4,794 100.0 15.4 10.6 68.1 1.6 3.3 1.1
35 - 39 4,286 100.0 7.2 9.7 75.1 1.9 4.6 1.5
40 - 44 3,398 100.0 4.8 7.9 75.4 2.4 5.9 3.6
45 - 49 2,814 100.0 4.1 6.6 73.5 3.3 7.9 4.6
50 - 54 2,392 100.0 2.7 4.8 69.4 3.1 11.0 9.0
55 - 59 1,618 100.0 1.9 3.7 68.5 3.5 10.4 12.0
60 - 64 1,306 100.0 2.7 2.8 60.3 2.8 10.9 20.5
65+ 3,592 100.0 3.6 1.9 43.9 2.4 11.0 37.1
Male
Total 24,215 100.0 47.9 5.5 42.2 1.1 2.3 1.1
12-14 2,838 100.0 93.6 0.7 5.6 0.0 0.0 0.0
15 - 19 4,316 100.0 94.0 1.0 4.8 0.1 0.1 0.0
20 - 24 2,965 100.0 81.3 5.3 12.8 0.3 0.3 0.0
25 - 29 2,599 100.0 49.1 10.7 38.7 0.6 0.8 0.1
30 - 34 2,281 100.0 24.2 10.2 62.2 1.1 1.8 0.4
35 - 39 2,099 100.0 11.5 9.5 73.8 1.5 3.2 0.5
40 - 44 1,694 100.0 7.7 7.5 78.0 1.9 3.8 1.0
45 - 49 1,373 100.0 6.3 7.4 78.4 3.1 3.7 1.1
50 - 54 1,124 100.0 3.9 5.9 79.4 2.4 6.9 1.5
55 - 59 801 100.0 2.9 3.7 81.8 3.1 6.0 2.5
60 - 64 644 100.0 3.9 3.0 77.0 2.0 8.1 6.1
65+ 1,481 100.0 6.0 3.4 71.6 2.4 8.0 8.6
Female
Total 26,480 100.0 31.8 7.6 45.4 1.8 5.2 8.3
12-14 2,856 100.0 93.3 0.6 6.2 0.0 0.0 0.0
15 - 19 4,046 100.0 83.0 4.9 11.2 0.2 0.2 0.3
20 - 24 3,575 100.0 39.6 14.8 42.5 1.2 1.3 0.6
25 - 29 3,300 100.0 17.9 13.2 63.2 1.8 2.7 1.2
30 - 34 2,513 100.0 7.3 10.9 73.5 2.0 4.5 1.8
35 - 39 2,187 100.0 3.2 9.8 76.2 2.2 6.0 2.6
40 - 44 1,704 100.0 1.8 8.3 72.8 2.9 8.0 6.2
45 - 49 1,441 100.0 1.9 5.9 68.8 3.5 11.9 8.0
50 - 54 1,268 100.0 1.7 3.8 60.6 3.7 14.6 15.6
55 - 59 817 100.0 1.0 3.7 55.4 3.9 14.7 21.3
60 - 64 662 100.0 1.5 2.6 44.1 3.5 13.7 34.6
65+ 2,111 100.0 1.9 0.9 24.5 2.4 13.1 57.1
Source: Ghana Statistical Service, 2010 Population and Housing Census

28
The Table also reveals that most males between the ages 15 to 19 are never married (94.0%)
compared to 83 percent of females of the same age group. This pre-supposes that this
category of the population is in school. Again, 75.4 percent of males in the age group 40-44
years are married. In addition, males aged 65 years and above have a lower proportion of
widowed (8.6%) compared to females 57.1 percent indicating that life expectancy of females
65 years and older is higher than males of the same age group. A higher proportion of males
(47.9%) than females (31.8%) have never been married as compared to 45.4 percent of the
females and 42.2 percent of males who are married. Again, the proportions of divorced
persons who are females (5.2%) are higher than that of the males (2.3%).
3.3.1 Marital status by educational level
Table 3.5 shows the marital status by sex and educational level in the District. More than half
of the population (56.7%) for persons 12 years and older have Basic education and nearly
one-tenth (9.5%) have secondary education.
More than two thirds (68.0%) of the population aged 12 years and older who have never
married attained basic education and a little over one-tenth (11.9%) have no education. For
those who are married, 40.2 percent have no education and 48.8 percent have basic education.
Sixty six percent of males who have never married have attained basic education and 12.4
percent have no formal educational. For those who are married, 34.4 percent have no
education and 50.2 percent have basic education. Overall, much lower proportion of all the
marital status groups attained tertiary level of education.
Table 3.5: Persons 12 years and older by sex, marital status and level of education
Sex/Marital status Number
All
levels
No
Education Basic1
Secon-
dary2
Voc/
Tech/
Comm
Post
middle/
secondary
certificate/
diploma3 Tertiary
4
Both Sexes Total 50,695 100.0 29.1 56.7 9.5 1.3 2.6 0.8
Never married 20,011 100.0 11.9 68.0 15.6 1.3 2.4 0.8
Informal/Consensual
union/Living together 3,336 100.0 21.3 65.6 7.9 2.2 2.5 0.5
Married 22,234 100.0 40.2 48.8 5.7 1.2 3.0 1.0
Separated 723 100.0 32.8 55.6 6.2 2.4 2.5 0.6
Divorced 1,930 100.0 40.0 53.3 3.3 1.1 1.8 0.5
Widowed 2,461 100.0 69.6 26.6 1.7 0.7 1.3 0.1 Source: Ghana Statistical Service, 2010 Population and Housing Census 1 Basic: Primary, Middle and JSS/JHS 2 Secondary: SSS/SHS and Secondary 3 Post Middle/ Sec. Cert./Diploma: Teacher training/ College of education, Agric, Nursing , University Diploma, HND, etc.
4 Tertiary: Bachelor’s Degree and Post Graduate or higher
3.3.2 Marital status and economic activity status
The marital status and economic activity status of persons 12 years and older is shown in
Table 3.6. More than half (67.3%) of persons from the marital status category are employed,
1.7 percent are unemployed and economically not active are about 31 percent. Higher
proportions of the never married (58.3%) population are economically not active compared to
the high proportion of married people who are employed (88.5%). All the marital status
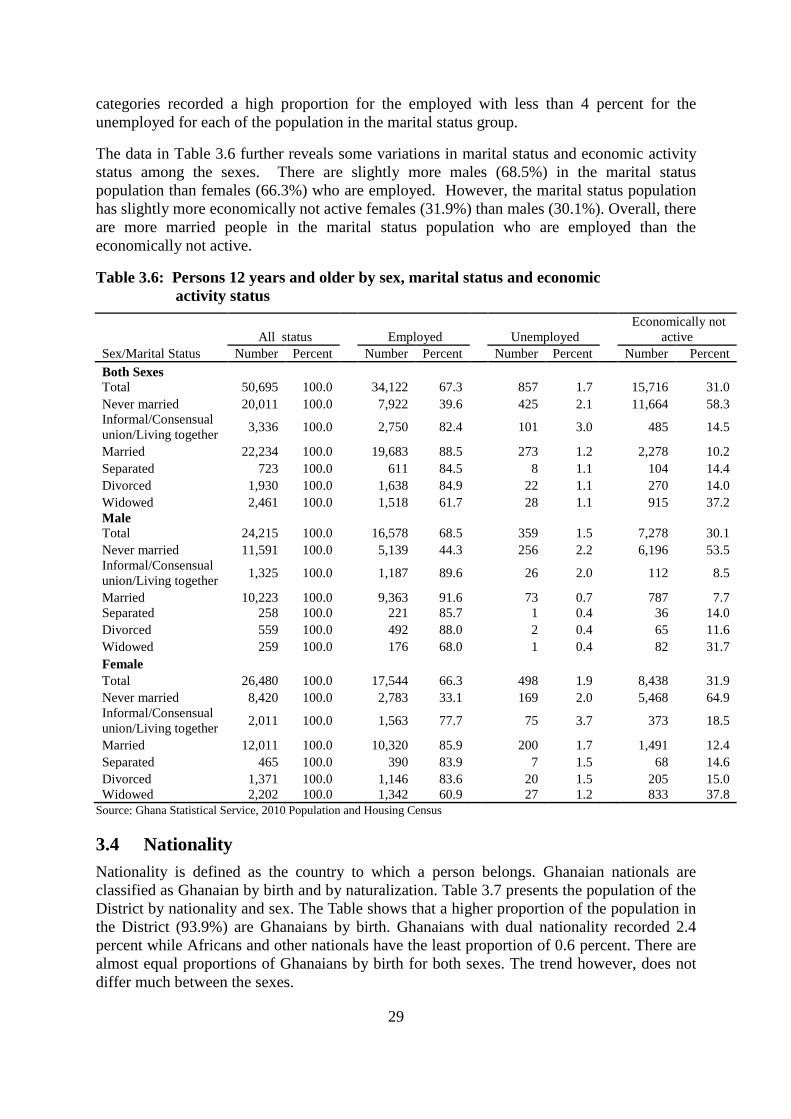
29
categories recorded a high proportion for the employed with less than 4 percent for the
unemployed for each of the population in the marital status group.
The data in Table 3.6 further reveals some variations in marital status and economic activity
status among the sexes. There are slightly more males (68.5%) in the marital status
population than females (66.3%) who are employed. However, the marital status population
has slightly more economically not active females (31.9%) than males (30.1%). Overall, there
are more married people in the marital status population who are employed than the
economically not active.
Table 3.6: Persons 12 years and older by sex, marital status and economic
activity status
Sex/Marital Status
All status Employed Unemployed
Economically not
active
Number Percent Number Percent Number Percent Number Percent
Both Sexes
Total 50,695 100.0
34,122 67.3
857 1.7
15,716 31.0
Never married 20,011 100.0
7,922 39.6
425 2.1
11,664 58.3
Informal/Consensual
union/Living together 3,336 100.0
2,750 82.4
101 3.0
485 14.5
Married 22,234 100.0
19,683 88.5
273 1.2
2,278 10.2
Separated 723 100.0
611 84.5
8 1.1
104 14.4
Divorced 1,930 100.0
1,638 84.9
22 1.1
270 14.0
Widowed 2,461 100.0
1,518 61.7
28 1.1
915 37.2
Male
Total 24,215 100.0
16,578 68.5
359 1.5
7,278 30.1
Never married 11,591 100.0
5,139 44.3
256 2.2
6,196 53.5
Informal/Consensual
union/Living together 1,325 100.0
1,187 89.6
26 2.0
112 8.5
Married 10,223 100.0
9,363 91.6
73 0.7
787 7.7
Separated 258 100.0
221 85.7
1 0.4
36 14.0
Divorced 559 100.0
492 88.0
2 0.4
65 11.6
Widowed 259 100.0
176 68.0
1 0.4
82 31.7
Female
Total 26,480 100.0
17,544 66.3
498 1.9
8,438 31.9
Never married 8,420 100.0
2,783 33.1
169 2.0
5,468 64.9
Informal/Consensual
union/Living together 2,011 100.0
1,563 77.7
75 3.7
373 18.5
Married 12,011 100.0
10,320 85.9
200 1.7
1,491 12.4
Separated 465 100.0
390 83.9
7 1.5
68 14.6
Divorced 1,371 100.0
1,146 83.6
20 1.5
205 15.0
Widowed 2,202 100.0 1,342 60.9 27 1.2 833 37.8
Source: Ghana Statistical Service, 2010 Population and Housing Census
3.4 Nationality
Nationality is defined as the country to which a person belongs. Ghanaian nationals are
classified as Ghanaian by birth and by naturalization. Table 3.7 presents the population of the
District by nationality and sex. The Table shows that a higher proportion of the population in
the District (93.9%) are Ghanaians by birth. Ghanaians with dual nationality recorded 2.4
percent while Africans and other nationals have the least proportion of 0.6 percent. There are
almost equal proportions of Ghanaians by birth for both sexes. The trend however, does not
differ much between the sexes.
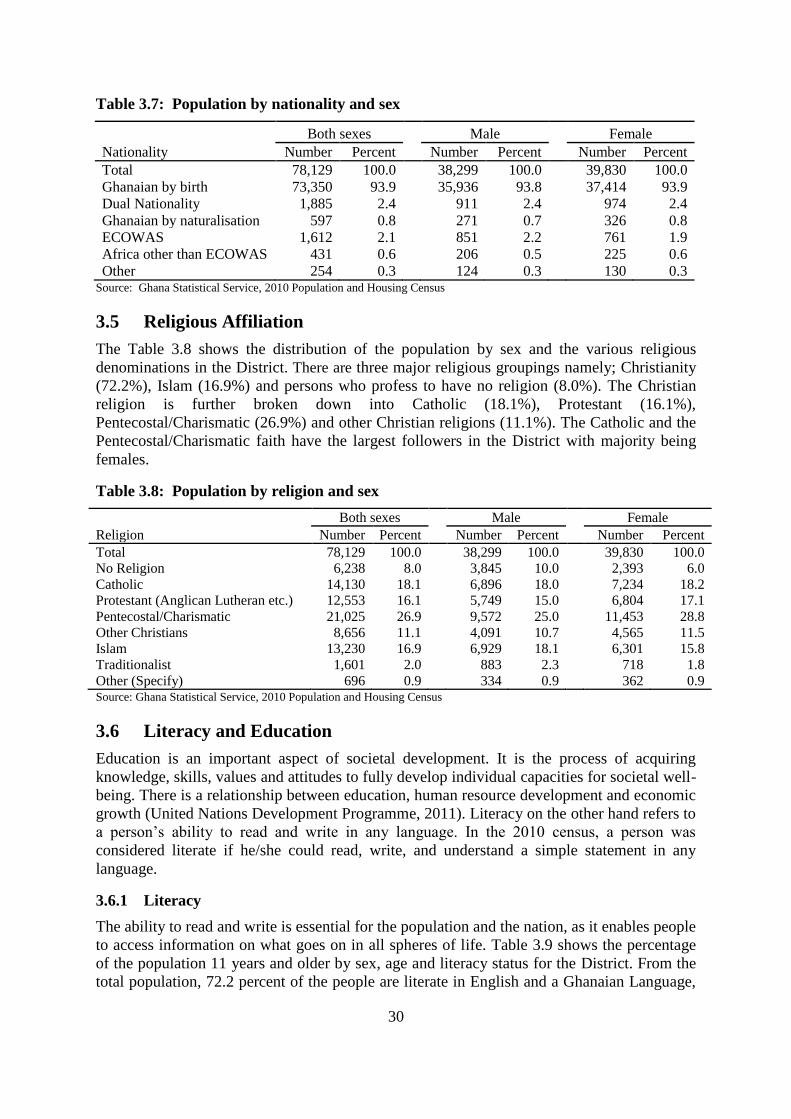
30
Table 3.7: Population by nationality and sex
Nationality
Both sexes Male Female
Number Percent Number Percent Number Percent
Total 78,129 100.0
38,299 100.0
39,830 100.0
Ghanaian by birth 73,350 93.9
35,936 93.8
37,414 93.9
Dual Nationality 1,885 2.4
911 2.4
974 2.4
Ghanaian by naturalisation 597 0.8
271 0.7
326 0.8
ECOWAS 1,612 2.1
851 2.2
761 1.9
Africa other than ECOWAS 431 0.6
206 0.5
225 0.6
Other 254 0.3 124 0.3 130 0.3 Source: Ghana Statistical Service, 2010 Population and Housing Census
3.5 Religious Affiliation
The Table 3.8 shows the distribution of the population by sex and the various religious
denominations in the District. There are three major religious groupings namely; Christianity
(72.2%), Islam (16.9%) and persons who profess to have no religion (8.0%). The Christian
religion is further broken down into Catholic (18.1%), Protestant (16.1%),
Pentecostal/Charismatic (26.9%) and other Christian religions (11.1%). The Catholic and the
Pentecostal/Charismatic faith have the largest followers in the District with majority being
females.
Table 3.8: Population by religion and sex
Religion
Both sexes Male Female
Number Percent Number Percent Number Percent
Total 78,129 100.0
38,299 100.0
39,830 100.0
No Religion 6,238 8.0
3,845 10.0
2,393 6.0
Catholic 14,130 18.1
6,896 18.0
7,234 18.2
Protestant (Anglican Lutheran etc.) 12,553 16.1
5,749 15.0
6,804 17.1
Pentecostal/Charismatic 21,025 26.9
9,572 25.0
11,453 28.8
Other Christians 8,656 11.1
4,091 10.7
4,565 11.5
Islam 13,230 16.9
6,929 18.1
6,301 15.8
Traditionalist 1,601 2.0
883 2.3
718 1.8
Other (Specify) 696 0.9 334 0.9 362 0.9 Source: Ghana Statistical Service, 2010 Population and Housing Census
3.6 Literacy and Education
Education is an important aspect of societal development. It is the process of acquiring
knowledge, skills, values and attitudes to fully develop individual capacities for societal well-
being. There is a relationship between education, human resource development and economic
growth (United Nations Development Programme, 2011). Literacy on the other hand refers to
a person’s ability to read and write in any language. In the 2010 census, a person was
considered literate if he/she could read, write, and understand a simple statement in any
language.
3.6.1 Literacy
The ability to read and write is essential for the population and the nation, as it enables people
to access information on what goes on in all spheres of life. Table 3.9 shows the percentage
of the population 11 years and older by sex, age and literacy status for the District. From the
total population, 72.2 percent of the people are literate in English and a Ghanaian Language,
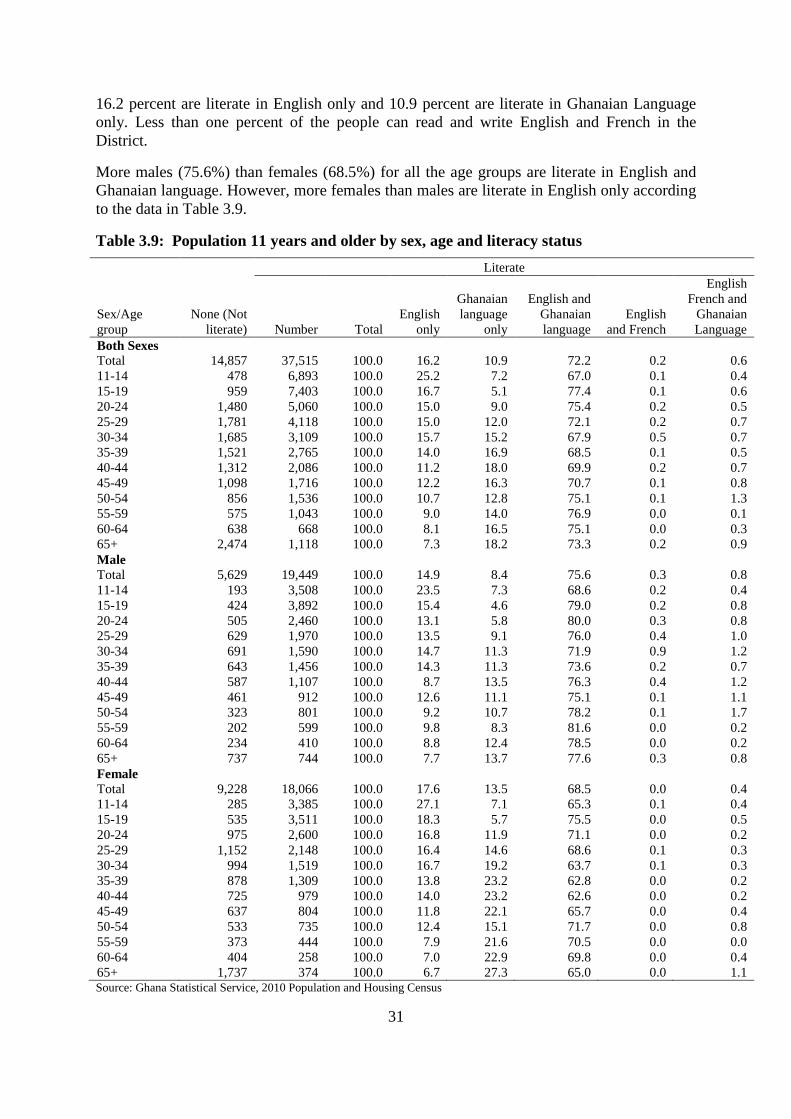
31
16.2 percent are literate in English only and 10.9 percent are literate in Ghanaian Language
only. Less than one percent of the people can read and write English and French in the
District.
More males (75.6%) than females (68.5%) for all the age groups are literate in English and
Ghanaian language. However, more females than males are literate in English only according
to the data in Table 3.9.
Table 3.9: Population 11 years and older by sex, age and literacy status
Sex/Age
group
Literate
None (Not
literate) Number Total
English
only
Ghanaian
language
only
English and
Ghanaian
language
English
and French
English
French and
Ghanaian
Language
Both Sexes
Total 14,857 37,515 100.0 16.2 10.9 72.2 0.2 0.6
11-14 478 6,893 100.0 25.2 7.2 67.0 0.1 0.4
15-19 959 7,403 100.0 16.7 5.1 77.4 0.1 0.6
20-24 1,480 5,060 100.0 15.0 9.0 75.4 0.2 0.5
25-29 1,781 4,118 100.0 15.0 12.0 72.1 0.2 0.7
30-34 1,685 3,109 100.0 15.7 15.2 67.9 0.5 0.7
35-39 1,521 2,765 100.0 14.0 16.9 68.5 0.1 0.5
40-44 1,312 2,086 100.0 11.2 18.0 69.9 0.2 0.7
45-49 1,098 1,716 100.0 12.2 16.3 70.7 0.1 0.8
50-54 856 1,536 100.0 10.7 12.8 75.1 0.1 1.3
55-59 575 1,043 100.0 9.0 14.0 76.9 0.0 0.1
60-64 638 668 100.0 8.1 16.5 75.1 0.0 0.3
65+ 2,474 1,118 100.0 7.3 18.2 73.3 0.2 0.9
Male
Total 5,629 19,449 100.0 14.9 8.4 75.6 0.3 0.8
11-14 193 3,508 100.0 23.5 7.3 68.6 0.2 0.4
15-19 424 3,892 100.0 15.4 4.6 79.0 0.2 0.8
20-24 505 2,460 100.0 13.1 5.8 80.0 0.3 0.8
25-29 629 1,970 100.0 13.5 9.1 76.0 0.4 1.0
30-34 691 1,590 100.0 14.7 11.3 71.9 0.9 1.2
35-39 643 1,456 100.0 14.3 11.3 73.6 0.2 0.7
40-44 587 1,107 100.0 8.7 13.5 76.3 0.4 1.2
45-49 461 912 100.0 12.6 11.1 75.1 0.1 1.1
50-54 323 801 100.0 9.2 10.7 78.2 0.1 1.7
55-59 202 599 100.0 9.8 8.3 81.6 0.0 0.2
60-64 234 410 100.0 8.8 12.4 78.5 0.0 0.2
65+ 737 744 100.0 7.7 13.7 77.6 0.3 0.8
Female
Total 9,228 18,066 100.0 17.6 13.5 68.5 0.0 0.4
11-14 285 3,385 100.0 27.1 7.1 65.3 0.1 0.4
15-19 535 3,511 100.0 18.3 5.7 75.5 0.0 0.5
20-24 975 2,600 100.0 16.8 11.9 71.1 0.0 0.2
25-29 1,152 2,148 100.0 16.4 14.6 68.6 0.1 0.3
30-34 994 1,519 100.0 16.7 19.2 63.7 0.1 0.3
35-39 878 1,309 100.0 13.8 23.2 62.8 0.0 0.2
40-44 725 979 100.0 14.0 23.2 62.6 0.0 0.2
45-49 637 804 100.0 11.8 22.1 65.7 0.0 0.4
50-54 533 735 100.0 12.4 15.1 71.7 0.0 0.8
55-59 373 444 100.0 7.9 21.6 70.5 0.0 0.0
60-64 404 258 100.0 7.0 22.9 69.8 0.0 0.4
65+ 1,737 374 100.0 6.7 27.3 65.0 0.0 1.1 Source: Ghana Statistical Service, 2010 Population and Housing Census
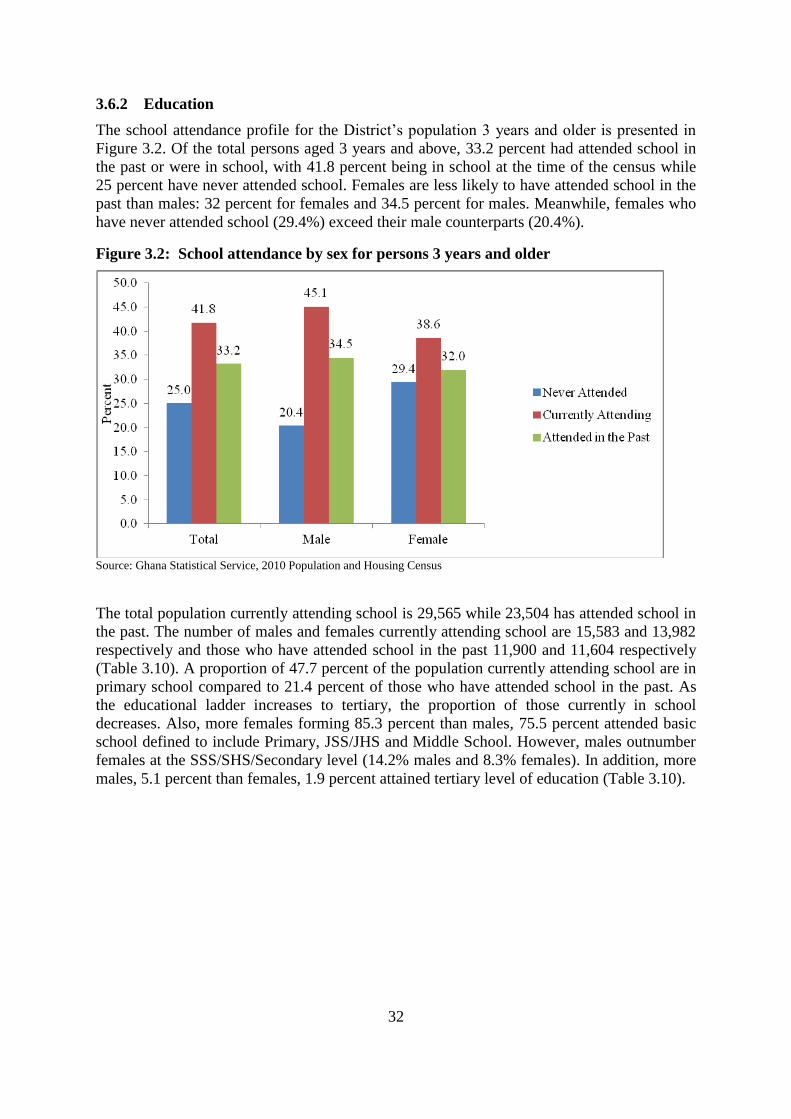
32
3.6.2 Education
The school attendance profile for the District’s population 3 years and older is presented in
Figure 3.2. Of the total persons aged 3 years and above, 33.2 percent had attended school in
the past or were in school, with 41.8 percent being in school at the time of the census while
25 percent have never attended school. Females are less likely to have attended school in the
past than males: 32 percent for females and 34.5 percent for males. Meanwhile, females who
have never attended school (29.4%) exceed their male counterparts (20.4%).
Figure 3.2: School attendance by sex for persons 3 years and older
Source: Ghana Statistical Service, 2010 Population and Housing Census
The total population currently attending school is 29,565 while 23,504 has attended school in
the past. The number of males and females currently attending school are 15,583 and 13,982
respectively and those who have attended school in the past 11,900 and 11,604 respectively
(Table 3.10). A proportion of 47.7 percent of the population currently attending school are in
primary school compared to 21.4 percent of those who have attended school in the past. As
the educational ladder increases to tertiary, the proportion of those currently in school
decreases. Also, more females forming 85.3 percent than males, 75.5 percent attended basic
school defined to include Primary, JSS/JHS and Middle School. However, males outnumber
females at the SSS/SHS/Secondary level (14.2% males and 8.3% females). In addition, more
males, 5.1 percent than females, 1.9 percent attained tertiary level of education (Table 3.10).
33
Table 3.10: Population 3 years and older by level of education, school attendance and sex
Level of education
Currently attending Attended in the past
Both sexes
Male
Female
Both sexes
Male
Female
Number Percent Number Percent Number Percent Number Percent Number Percent Number Percent
Total 29,565 100
15,583 100.0
13,982 100.0
23,504 100.0
11,900 100.0
11,604 100.0
Nursery 2,292 7.8
1,231 7.9
1,061 7.6
- -
- -
- -
Kindergarten 5,169 17.5
2,686 17.2
2,483 17.8
- -
- -
- -
Primary 14,098 47.7
7,236 46.4
6,862 49.1
5,034 21.4
2,024 17.0
3,010 25.9
JSS/JHS 5,401 18.3
2,896 18.6
2,505 17.9
7,438 31.6
3,418 28.7
4,020 34.6
Middle - -
- -
- -
6,429 27.4
3,549 29.8
2,880 24.8
SSS/SHS 2,157 7.3
1,259 8.1
898 6.4
2,003 8.5
1,212 10.2
791 6.8
Secondary - -
- -
- -
655 2.8
480 4.0
175 1.5
Vocational/ Technical/
Commercial 105 0.4
44 0.3
61 0.4
567 2.4
259 2.2
308 2.7
Post middle/
secondary certificate 84 0.3
52 0.3
32 0.2
542 2.3
348 2.9
194 1.7
Tertiary 259 0.9 179 1.1 80 0.6 836 3.6 610 5.1 226 1.9 Source: Ghana Statistical Service, 2010 Population and Housing Census
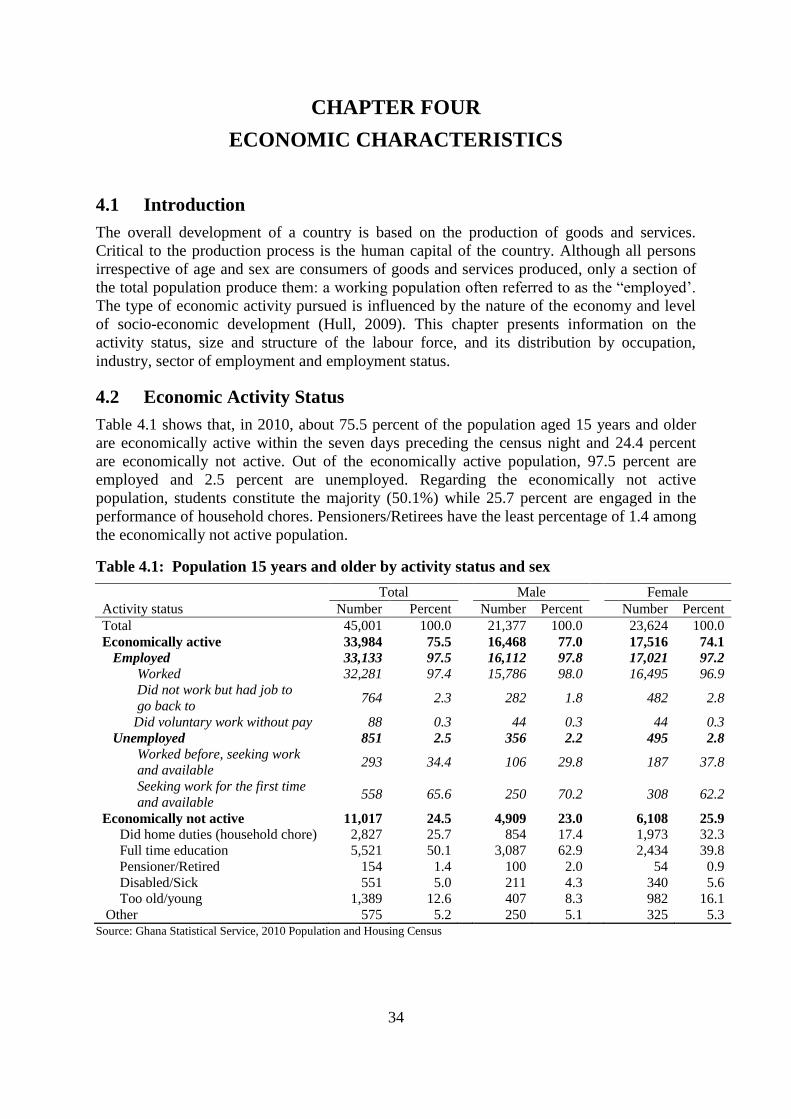
34
CHAPTER FOUR
ECONOMIC CHARACTERISTICS
4.1 Introduction
The overall development of a country is based on the production of goods and services.
Critical to the production process is the human capital of the country. Although all persons
irrespective of age and sex are consumers of goods and services produced, only a section of
the total population produce them: a working population often referred to as the “employed’.
The type of economic activity pursued is influenced by the nature of the economy and level
of socio-economic development (Hull, 2009). This chapter presents information on the
activity status, size and structure of the labour force, and its distribution by occupation,
industry, sector of employment and employment status.
4.2 Economic Activity Status
Table 4.1 shows that, in 2010, about 75.5 percent of the population aged 15 years and older
are economically active within the seven days preceding the census night and 24.4 percent
are economically not active. Out of the economically active population, 97.5 percent are
employed and 2.5 percent are unemployed. Regarding the economically not active
population, students constitute the majority (50.1%) while 25.7 percent are engaged in the
performance of household chores. Pensioners/Retirees have the least percentage of 1.4 among
the economically not active population.
Table 4.1: Population 15 years and older by activity status and sex
Activity status
Total Male Female
Number Percent Number Percent Number Percent
Total 45,001 100.0 21,377 100.0 23,624 100.0
Economically active 33,984 75.5 16,468 77.0 17,516 74.1
Employed 33,133 97.5 16,112 97.8 17,021 97.2
Worked 32,281 97.4 15,786 98.0 16,495 96.9 Did not work but had job to
go back to 764 2.3 282 1.8 482 2.8
Did voluntary work without pay 88 0.3 44 0.3 44 0.3
Unemployed 851 2.5 356 2.2 495 2.8
Worked before, seeking work and available
293 34.4 106 29.8 187 37.8
Seeking work for the first time
and available 558 65.6 250 70.2 308 62.2
Economically not active 11,017 24.5 4,909 23.0 6,108 25.9
Did home duties (household chore) 2,827 25.7 854 17.4 1,973 32.3
Full time education 5,521 50.1 3,087 62.9 2,434 39.8
Pensioner/Retired 154 1.4 100 2.0 54 0.9
Disabled/Sick 551 5.0 211 4.3 340 5.6
Too old/young 1,389 12.6 407 8.3 982 16.1
Other 575 5.2 250 5.1 325 5.3 Source: Ghana Statistical Service, 2010 Population and Housing Census
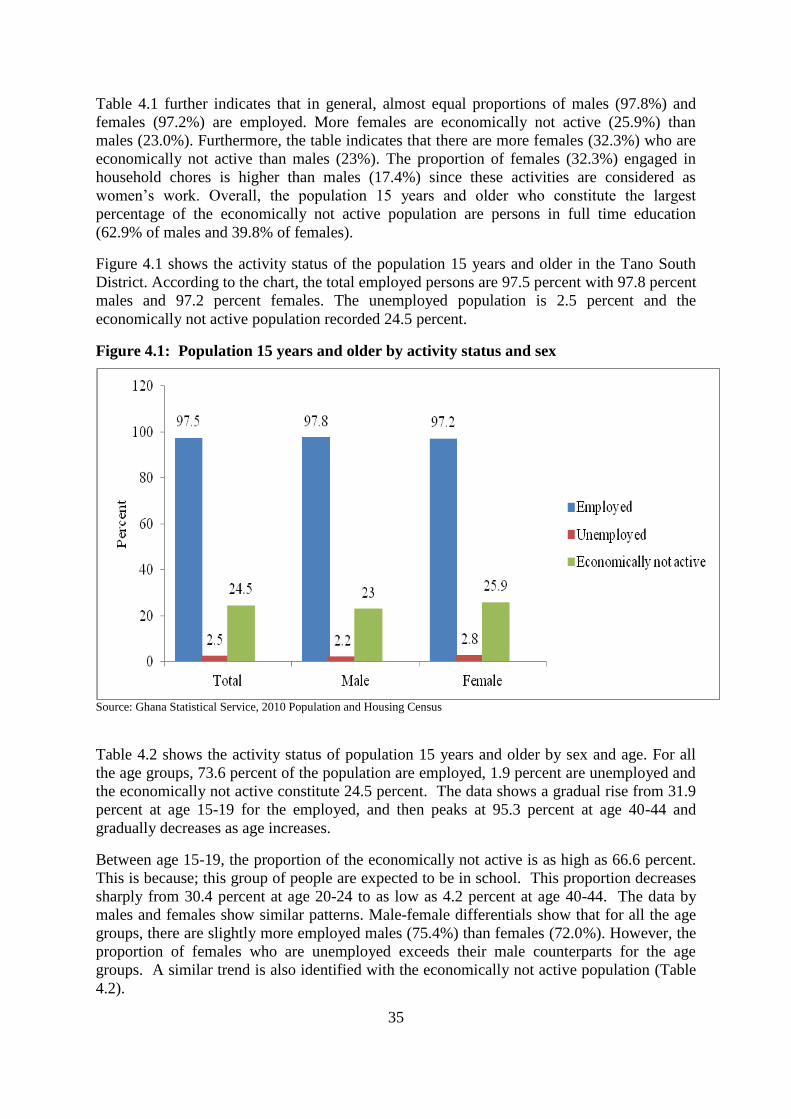
35
Table 4.1 further indicates that in general, almost equal proportions of males (97.8%) and
females (97.2%) are employed. More females are economically not active (25.9%) than
males (23.0%). Furthermore, the table indicates that there are more females (32.3%) who are
economically not active than males (23%). The proportion of females (32.3%) engaged in
household chores is higher than males (17.4%) since these activities are considered as
women’s work. Overall, the population 15 years and older who constitute the largest
percentage of the economically not active population are persons in full time education
(62.9% of males and 39.8% of females).
Figure 4.1 shows the activity status of the population 15 years and older in the Tano South
District. According to the chart, the total employed persons are 97.5 percent with 97.8 percent
males and 97.2 percent females. The unemployed population is 2.5 percent and the
economically not active population recorded 24.5 percent.
Figure 4.1: Population 15 years and older by activity status and sex
Source: Ghana Statistical Service, 2010 Population and Housing Census
Table 4.2 shows the activity status of population 15 years and older by sex and age. For all
the age groups, 73.6 percent of the population are employed, 1.9 percent are unemployed and
the economically not active constitute 24.5 percent. The data shows a gradual rise from 31.9
percent at age 15-19 for the employed, and then peaks at 95.3 percent at age 40-44 and
gradually decreases as age increases.
Between age 15-19, the proportion of the economically not active is as high as 66.6 percent.
This is because; this group of people are expected to be in school. This proportion decreases
sharply from 30.4 percent at age 20-24 to as low as 4.2 percent at age 40-44. The data by
males and females show similar patterns. Male-female differentials show that for all the age
groups, there are slightly more employed males (75.4%) than females (72.0%). However, the
proportion of females who are unemployed exceeds their male counterparts for the age
groups. A similar trend is also identified with the economically not active population (Table
4.2).

36
Table 4.2: Population 15 years and older by sex, age and activity status
Sex/Age
group
All status Employed Unemployed
Economically not
active
Number Percent Number Percent Number Percent Number Percent
Both Sexes
Total 45,001 100.0
33,133 73.6
851 1.9
11,017 24.5
15-19 8,362 100.0
2,667 31.9
124 1.5
5,571 66.6
20-24 6,540 100.0
4,255 65.1
297 4.5
1,988 30.4
25-29 5,899 100.0
4,960 84.1
190 3.2
749 12.7
30-34 4,794 100.0
4,334 90.4
91 1.9
369 7.7
35-39 4,286 100.0
4,004 93.4
48 1.1
234 5.5
40-44 3,398 100.0
3,237 95.3
19 0.6
142 4.2
45-49 2,814 100.0
2,657 94.4
26 0.9
131 4.7
50-54 2,392 100.0
2,254 94.2
17 0.7
121 5.1
55-59 1,618 100.0
1,500 92.7
12 0.7
106 6.6
60-64 1,306 100.0
1,116 85.5
17 1.3
173 13.2
65+ 3,592 100.0
2,149 59.8
10 0.3
1,433 39.9
Male
Total 21,377 100.0
16,112 75.4
356 1.7
4,909 23.0
15-19 4,316 100.0
1,453 33.7
48 1.1
2,815 65.2
20-24 2,965 100.0
1,833 61.8
124 4.2
1,008 34.0
25-29 2,599 100.0
2,255 86.8
88 3.4
256 9.8
30-34 2,281 100.0
2,131 93.4
39 1.7
111 4.9
35-39 2,099 100.0
2,022 96.3
18 0.9
59 2.8
40-44 1,694 100.0
1,639 96.8
8 0.5
47 2.8
45-49 1,373 100.0
1,306 95.1
7 0.5
60 4.4
50-54 1,124 100.0
1,092 97.2
6 0.5
26 2.3
55-59 801 100.0
752 93.9
4 0.5
45 5.6
60-64 644 100.0
566 87.9
12 1.9
66 10.2
65+ 1,481 100.0
1,063 71.8
2 0.1
416 28.1
Female
Total 23,624 100.0
17,021 72.0
495 2.1
6,108 25.9
15-19 4,046 100.0
1,214 30.0
76 1.9
2,756 68.1
20-24 3,575 100.0
2,422 67.7
173 4.8
980 27.4
25-29 3,300 100.0
2,705 82.0
102 3.1
493 14.9
30-34 2,513 100.0
2,203 87.7
52 2.1
258 10.3
35-39 2,187 100.0
1,982 90.6
30 1.4
175 8.0
40-44 1,704 100.0
1,598 93.8
11 0.6
95 5.6
45-49 1,441 100.0
1,351 93.8
19 1.3
71 4.9
50-54 1,268 100.0
1,162 91.6
11 0.9
95 7.5
55-59 817 100.0
748 91.6
8 1.0
61 7.5
60-64 662 100.0
550 83.1
5 0.8
107 16.2
65+ 2,111 100.0 1,086 51.4 8 0.4 1,017 48.2
Source: Ghana Statistical Service, 2010 Population and Housing Census
4.3 Occupation
Table 4.3 presents the distribution of the employed population 15 years and older by
occupation and sex in the District. More than half (67.4%) of the employed population are
skilled agricultural forestry and fishery workers. Service and sales workers came next with
12.2 percent and craft and “other occupations” which are not exactly classified have the least
number of employed persons (0.1%).
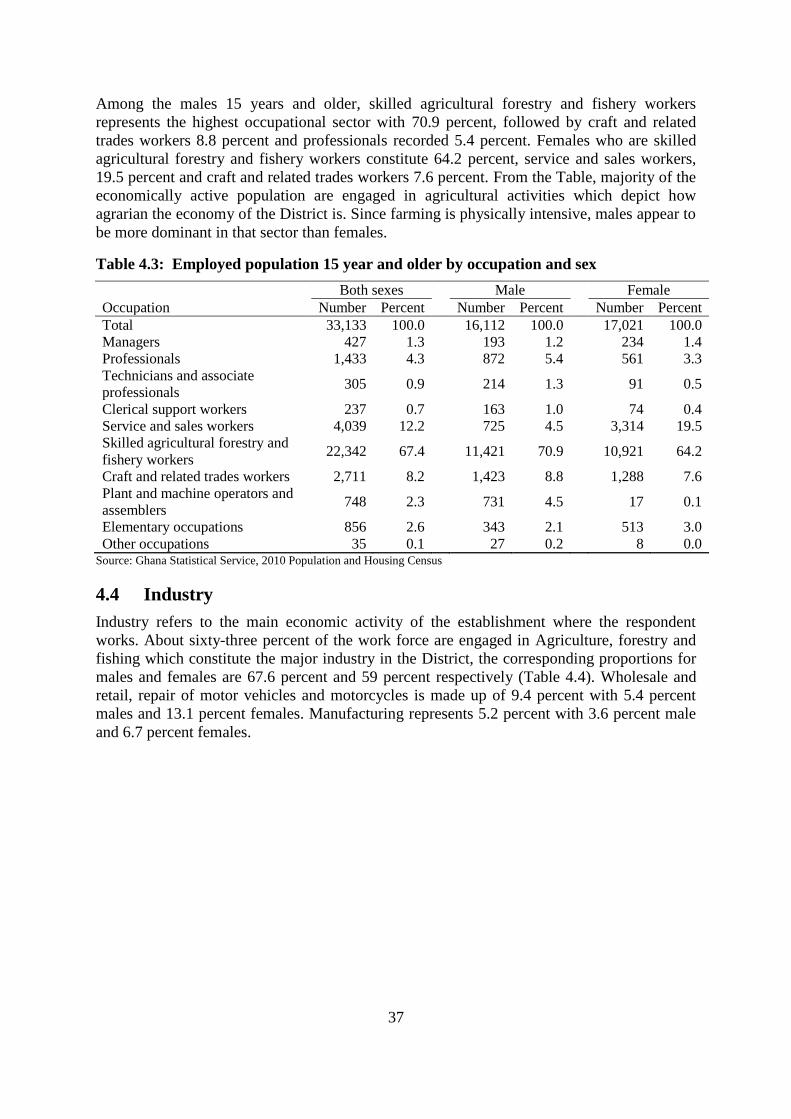
37
Among the males 15 years and older, skilled agricultural forestry and fishery workers
represents the highest occupational sector with 70.9 percent, followed by craft and related
trades workers 8.8 percent and professionals recorded 5.4 percent. Females who are skilled
agricultural forestry and fishery workers constitute 64.2 percent, service and sales workers,
19.5 percent and craft and related trades workers 7.6 percent. From the Table, majority of the
economically active population are engaged in agricultural activities which depict how
agrarian the economy of the District is. Since farming is physically intensive, males appear to
be more dominant in that sector than females.
Table 4.3: Employed population 15 year and older by occupation and sex
Occupation
Both sexes
Male
Female
Number Percent Number Percent Number Percent
Total 33,133 100.0
16,112 100.0
17,021 100.0
Managers 427 1.3
193 1.2
234 1.4
Professionals 1,433 4.3
872 5.4
561 3.3
Technicians and associate
professionals 305 0.9
214 1.3
91 0.5
Clerical support workers 237 0.7
163 1.0
74 0.4
Service and sales workers 4,039 12.2
725 4.5
3,314 19.5
Skilled agricultural forestry and
fishery workers 22,342 67.4
11,421 70.9
10,921 64.2
Craft and related trades workers 2,711 8.2
1,423 8.8
1,288 7.6
Plant and machine operators and
assemblers 748 2.3
731 4.5
17 0.1
Elementary occupations 856 2.6
343 2.1
513 3.0
Other occupations 35 0.1 27 0.2 8 0.0 Source: Ghana Statistical Service, 2010 Population and Housing Census
4.4 Industry
Industry refers to the main economic activity of the establishment where the respondent
works. About sixty-three percent of the work force are engaged in Agriculture, forestry and
fishing which constitute the major industry in the District, the corresponding proportions for
males and females are 67.6 percent and 59 percent respectively (Table 4.4). Wholesale and
retail, repair of motor vehicles and motorcycles is made up of 9.4 percent with 5.4 percent
males and 13.1 percent females. Manufacturing represents 5.2 percent with 3.6 percent male
and 6.7 percent females.

38
Table 4.4: Employed Population 15 years and older by industry and sex
Industry
Both sexes
Male
Female
Number Percent Number Percent Number Percent
Total 33,133 100.0
16,112 100.0
17,021 100.0
Agriculture forestry and fishing 20,923 63.1
10,886 67.6
10,037 59.0
Mining and quarrying 18 0.1
16 0.1
2 0.0
Manufacturing 1,716 5.2
583 3.6
1,133 6.7
Electricity gas stream and air
conditioning supply 23 0.1
22 0.1
1 0.0
Water supply; sewerage waste
management and remediation activities 52 0.2
21 0.1
31 0.2
Construction 505 1.5
499 3.1
6 0.0
Wholesale and retail; repair of motor
vehicles and motorcycles 3,114 9.4
877 5.4
2,237 13.1
Transportation and storage 663 2.0
637 4.0
26 0.2
Accommodation and food service
activities 1,027 3.1
98 0.6
929 5.5
Information and communication 30 0.1
18 0.1
12 0.1
Financial and insurance activities 71 0.2
51 0.3
20 0.1
Real estate activities 0 0.0
0 0.0
0 0.0
Professional scientific and technical
activities 193 0.6
73 0.5
120 0.7
Administrative and support service
activities 91 0.3
58 0.4
33 0.2
Public administration and defence;
compulsory social security 386 1.2
275 1.7
111 0.7
Education 1,295 3.9
752 4.7
543 3.2
Human health and social work activities 232 0.7
118 0.7
114 0.7
Arts entertainment and recreation 104 0.3
99 0.6
5 0.0
Other service activities 1,106 3.3
321 2.0
785 4.6
Activities of households as employers;
undifferentiated goods - and services -
producing activities of households for
own use
1,584 4.8
708 4.4
876 5.1
Activities of extraterritorial
organizations and bodies 0 0.0 0 0.0 0 0.0
Source: Ghana Statistical Service, 2010 Population and Housing Census
4.5 Employment Status
Figure 4.2 presents the distribution of the employed population 15 years and older by their
status of employment and sex. The self-employed without employee represents the highest
proportion (67.2%) with the proportion of females (68.1%) being slightly higher than that of
males (66.3%). The proportion of male employees (17.3%) is higher than that of females
(7.8%) with more of the females (17.9%) also serving as contributing family workers than
males (9.5%).

39
Table 4.5: Employed Population 15 years and older by employment status and sex
Employment Status
Both sexes Male Female
Number Percent Number Percent Number Percent
Total 33,935 100.0
16,649 100.0
17,286 100.0
Employee 4,229 12.5
2,881 17.3
1,348 7.8
Self-employed without employee(s) 22,799 67.2
11,035 66.3
11,764 68.1
Self-employed with employee(s) 932 2.7
510 3.1
422 2.4
Casual worker 475 1.4
345 2.1
130 0.8
Contributing family worker 4,672 13.8
1,577 9.5
3,095 17.9
Apprentice 606 1.8
173 1.0
433 2.5
Domestic employee (House-help) 183 0.5
111 0.7
72 0.4
Other 39 0.1 17 0.1 22 0.1 Source: Ghana Statistical Service, 2010 Population and Housing Census
4.6 Employment Sector
Table 4.6 shows that, majority of the labour force in the District (91.4%) are in the private
informal sector, whereas 6.2 percent are in the Public (Government) sector. About 88.9
percent of the males and 97.3 per cent of the females are found in the private informal sector.
With regards to those in the public sector, 7.9 percent are males and 4.6 percent are females.
It can be deduced from the data that the informal sector is the major source of employment
for many people in the District.
Table 4.6: Employed population 15 years and older by employment sector and sex
Employment Sector
Both sexes Male Female
Number Percent Number Percent Number Percent
Total 33,133 100.0
16,112 100.0
17,021 100.0
Public (Government) 2,049 6.2
1,266 7.9
783 4.6
Private Formal 698 2.1
457 2.8
241 1.4
Private Informal 30,267 91.4
14,324 88.9
15,943 93.7
Semi-Public/Parastatal 18 0.1
12 0.1
6 0.0
NGOs (Local and International) 93 0.3
45 0.3
48 0.3
Other International Organisations 8 0.0 8 0.0 0 0.0
Source: Ghana Statistical Service, 2010 Population and Housing Census

40
CHAPTER FIVE
INFORMATION COMMUNICATION TECHNOLOGY
5.1 Introduction
The speed with which Information Communication Technology (ICT) is developing and its
impact on socio-economic activities cannot be overemphasized. ICT has been defined to
include the full range of electronic technologies and techniques used to manage information
and knowledge. To understand some of these developments a module was included in the
2010 PHC on ownership and use of ICT facilities. This is the first time information on ICT at
household level has been collected in a PHC in the country. This chapter analyses access to
these ICT technologies/facilities by various socio-demographic characteristics such as age,
sex, education, locality of residence, and economic activity status. In addition, the chapter
looks at the availability of ICT in agricultural households. Information was sought from
persons 12 years and older on access to and the use of mobile phones, internet facilities and
households with desktops/laptop computers.
5.2 Ownership of Mobile Phones
Table 5.1 shows the percentage of persons who own mobile phones in the District. The Table
shows that the proportion of persons 12 years and older who own mobile phones in the
District is 37.3 percent. Furthermore, the table reveals that ownership of mobile phones in the
District is higher among males (43.8%) than females (31.3%).
5.3 Use of Internet
Table 5.1 also shows the percentage of persons who use internet facility in the District. The
Table shows that only 2.4 percent of the people use internet in the District. It also reveals
that, usage of internet facility in the District is much higher among male users (3.4%) than
female users (1.5%). The low usage of internet facility could be attributed to the lack of
internet facilities in the District or lack of knowledge in the use of internet.
Table 5.1: Population 12 years and older by mobile phone ownership,
internet facility usage and sex
Sex
Population 12
years and older
Population having
mobile phone
Population using
internet facility
Number Percent Number Percent Number Percent
Total 50,695 100.0
18,901 37.3
1,219 2.4
Male 24,215 100.0
10,601 43.8
813 3.4
Female 26,480 100.0 8,300 31.3 406 1.5 Source: Ghana Statistical Service, 2010 Population and Housing Census

41
5.4 Household ownership of Desktop or Laptop computer
Table 5.2 gives the percentage of households that reported owning a laptop and or desktop
computers. Only 3.9 percent of total households in the District are reported owning a laptop
and or desktop computers. Of the 629 households having desktop/laptop, 74.6 percent are
male headed households as compared to 25.4 percent of female headed households
Table 5.2: Households having desktop/laptop computers
and sex of head
Sex of
household
head
Number of
households
Households having
desktop/laptop
computers
Number Percent Number Percent
Total 16,312 100.0
629 3.9
Male 10,193 62.5
469 4.6
Female 6,119 37.5 160 2.6 Source: Ghana Statistical Service, 2010 Population and Housing Census

42
CHAPTER SIX
DISABILITY
6.1 Introduction
Persons with disabilities (PWD) have been defined as those who are unable to or are
restricted in the performance of specific tasks/activities due to loss of function of some part
of the body as a result of impairment or malformation (Ghana Statistical Service, 2012). As a
result, PWDs face a wide range of life challenges because disability, in whatever form or
type, can reduce an individual’s ability to function to his/her full potential. Disability can
limit an individual’s full participation in a number of activities in life.
The prevention of disability and ensuring care for PWDs and helping them to become
productive citizens is an important aspect of national development. The government has
enacted the Disability Act to address issues of high poverty among PWDs due to low levels
of education and lack of employable skills; inaccessible public transport; and unfriendly
environmental facilities such as the widespread absence of ramps for PWDs and uncovered
drains and gutters.
In an attempt to understand the situation of PWDs as a guide for policy formulation, the
Ghana Statistical Service, for the first time, collected specific data on PWDs in the 2010
Population and Housing Census. The areas discussed in this chapter are distribution of
population with disability, types of disability and distribution of disability population by type
of locality.
6.2 Population with Disability
Table 6.1 shows the population of PWDs in the District. In total, there are 78,129 PWDs
representing 2.0 percent of the District’s population of which the males (2.0%) slightly
outnumber the females (1.9%). The data on male and female PWDs by type of disability and
locality shows that the proportion of females with sight or hearing disability (34.5% and
20.3% respectively) is higher than the proportion of males (29.0% and 18.3%) with similar
disabilities. However, the proportion of male PWDs with emotional or intellectual disabilities
(17.1% and 20.2% respectively) is slightly higher than females (14.4% and 18.7%
respectively) with the same disabilities.

43
Table 6.1: Population by type of locality, disability type and sex
Disability Type
Both sexes Male Female
Number Percent
Number Percent Number Percent
All localities
Total 78,129 100.0
38,299 100.0
39,830 100.0
Without disability 76,601 98.0
37,521 98.0
39,080 98.1
With disability 1,528 2.0
778 2.0
750 1.9
Sight 485 31.7
226 29.0
259 34.5
Hearing 294 19.2
142 18.3
152 20.3
Speech 233 15.2
119 15.3
114 15.2
Physical 434 28.4
220 28.3
214 28.5
Intellect 297 19.4
157 20.2
140 18.7
Emotion 241 15.8
133 17.1
108 14.4
Other 194 12.7
100 12.9
94 12.5
Urban
Total 40,913 100.0
19,634 100.0
21,279 100.0
Without disability 40,078 98.0
19,232 98.0
20,846 98.0
With disability 835 2.0
402 2.0
433 2.0
Sight 279 33.4
120 29.9
159 36.7
Hearing 177 21.2
76 18.9
101 23.3
Speech 143 17.1
70 17.4
73 16.9
Physical 242 29.0
122 30.3
120 27.7
Intellect 194 23.2
96 23.9
98 22.6
Emotion 147 17.6
79 19.7
68 15.7
Other 97 11.6
50 12.4
47 10.9
Rural
Total 37,216 100.0
18,665 100.0
18,551 100.0
Without disability 36,532 98.2
18,289 98.0
18,234 98.3
With disability 684 1.8
376 2.0
317 1.7
Sight 206 30.1
106 28.2
100 31.5
Hearing 117 17.1
66 17.6
51 16.1
Speech 90 13.2
49 13.0
41 12.9
Physical 192 28.1
89 23.7
94 29.7
Intellect 103 15.1
61 16.2
42 13.2
Emotion 94 13.7
51 13.6
40 12.6
Other 97 14.2 50 13.3 47 14.8 Source: Ghana Statistical Service, 2010 Population and Housing Census
6.3 Type of Disability
The distribution of the population with disability types in the District is shown in Figure 6.1.
It is evident from the chart that sight disability is prevalent in the District with 22 percent. It
is followed by physical disability, 20 percent, intellectual disability, 14 percent, hearing,
emotional and speech disability in that order.
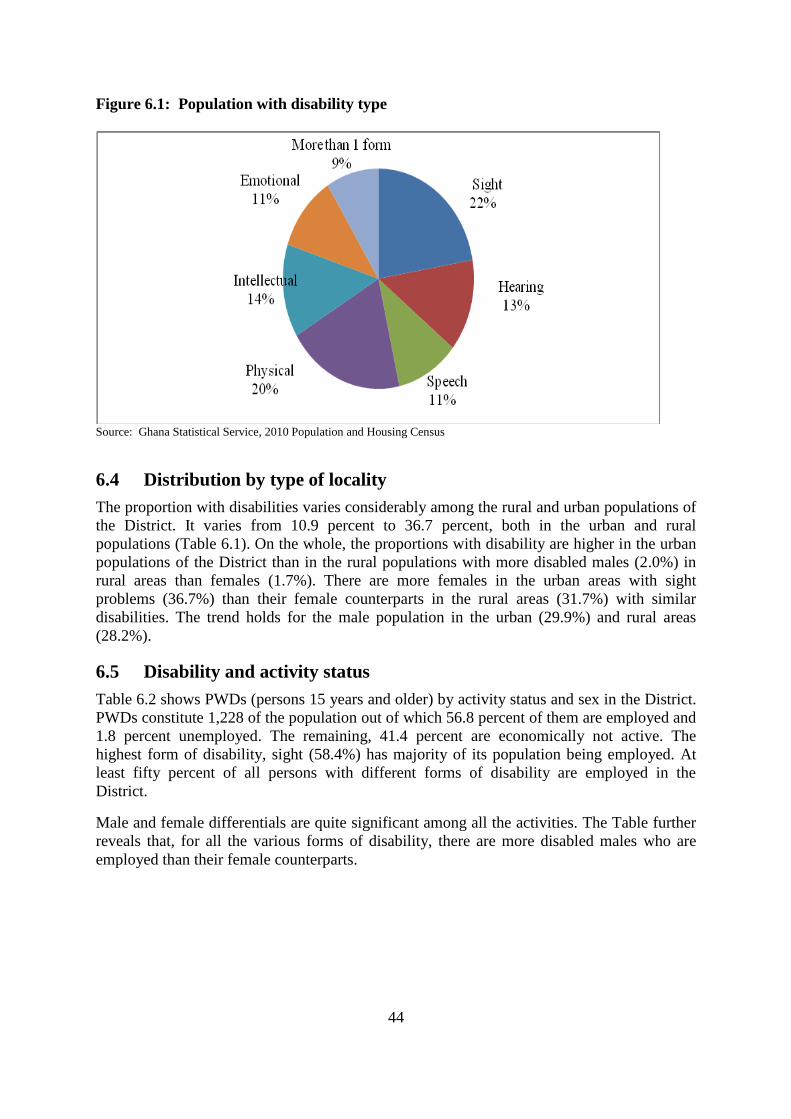
44
Figure 6.1: Population with disability type
Source: Ghana Statistical Service, 2010 Population and Housing Census
6.4 Distribution by type of locality
The proportion with disabilities varies considerably among the rural and urban populations of
the District. It varies from 10.9 percent to 36.7 percent, both in the urban and rural
populations (Table 6.1). On the whole, the proportions with disability are higher in the urban
populations of the District than in the rural populations with more disabled males (2.0%) in
rural areas than females (1.7%). There are more females in the urban areas with sight
problems (36.7%) than their female counterparts in the rural areas (31.7%) with similar
disabilities. The trend holds for the male population in the urban (29.9%) and rural areas
(28.2%).
6.5 Disability and activity status
Table 6.2 shows PWDs (persons 15 years and older) by activity status and sex in the District.
PWDs constitute 1,228 of the population out of which 56.8 percent of them are employed and
1.8 percent unemployed. The remaining, 41.4 percent are economically not active. The
highest form of disability, sight (58.4%) has majority of its population being employed. At
least fifty percent of all persons with different forms of disability are employed in the
District.
Male and female differentials are quite significant among all the activities. The Table further
reveals that, for all the various forms of disability, there are more disabled males who are
employed than their female counterparts.

45
Table 6.2: Persons 15 years and older with disability by economic activity status
and sex
Sex/Disability
type
All status Employed Unemployed
Economically not
active
Number Percent Number Percent Number Percent Number Percent
Both Sexes
Total 45,001 100.0
33,133 73.6
851 1.9
11,017 24.5
No disability 43,773 100.0
32,435 74.1
829 1.9
10,509 24.0
With a disability 1,228 100.0
698 56.8
22 1.8
508 41.4
Sight 399 100.0
233 58.4
3 0.8
163 40.9
Hearing 223 100.0
136 61.0
2 0.9
85 38.1
Speech 159 100.0
89 56.0
2 1.3
68 42.8
Physical 365 100.0
186 51.0
6 1.6
173 47.4
Intellectual 247 100.0
127 51.4
6 2.4
114 46.2
Emotional 196 100.0
107 54.6
6 3.1
83 42.3
Other 141 100.0
75 53.2
3 2.1
63 44.7
Male
Total 21,377 100.0
16,112 75.4
356 1.7
4,909 23.0
No disability 20,754 100.0
15,724 75.8
342 1.6
4,688 22.6
With a disability 623 100.0
388 62.3
14 2.2
221 35.5
Sight 180 100.0
117 65.0
2 1.1
61 33.9
Hearing 105 100.0
73 69.5
2 1.9
30 28.6
Speech 78 100.0
54 69.2
2 2.6
22 28.2
Physical 184 100.0
109 59.2
4 2.2
71 38.6
Intellectual 132 100.0
67 50.8
4 3.0
61 46.2
Emotional 111 100.0
67 60.4
3 2.7
41 36.9
Other 74 100.0
39 52.7
2 2.7
33 44.6
Female
Total 23,624 100.0
17,021 72.0
495 2.1
6,108 25.9
No disability 23,019 100.0
16,711 72.6
487 2.1
5,821 25.3
With a disability 605 100.0
310 51.2
8 1.3
287 47.4
Sight 219 100.0
116 53.0
1 0.5
102 46.6
Hearing 118 100.0
63 53.4
0 0.0
55 46.6
Speech 81 100.0
35 43.2
0 0.0
46 56.8
Physical 181 100.0
77 42.5
2 1.1
102 56.4
Intellectual 115 100.0
60 52.2
2 1.7
53 46.1
Emotional 85 100.0
40 47.1
3 3.5
42 49.4
Other 67 100.0 36 53.7 1 1.5 30 44.8 Source: Ghana Statistical Service, 2010 Population and Housing Census
6.6 Disability, education and literacy
Table 6.3 presents disabled persons 3 years and older by sex, disability type and level of
education. There are 1,478 PWDs aged 3 years and older in the District. Out of this, 40.2
percent have never attended school. The highest educational level attained among the
disabled population is Basic School defined to include Primary, Middle/JSS/JHS accounting
for about 46.2 percent of all disabled population in the District. The lowest percentage in the
educational level attained by PWDs in the District is Pre-school defined to include
Kindergarten and Nursery which accounts for 4.5 percent of the disabled population in the
District.
Among the disabled males in the District, 33.4 percent have never attended school while
females on the other hand are 47.2 percent. A slightly higher proportion of males (48.0%)
than females (44.3%) of all disabled population in the District attained Basic level of
education compared to 14.1 percent of males and 5.2 percent of females who attained Senior
High or Higher education (Table 6.3).
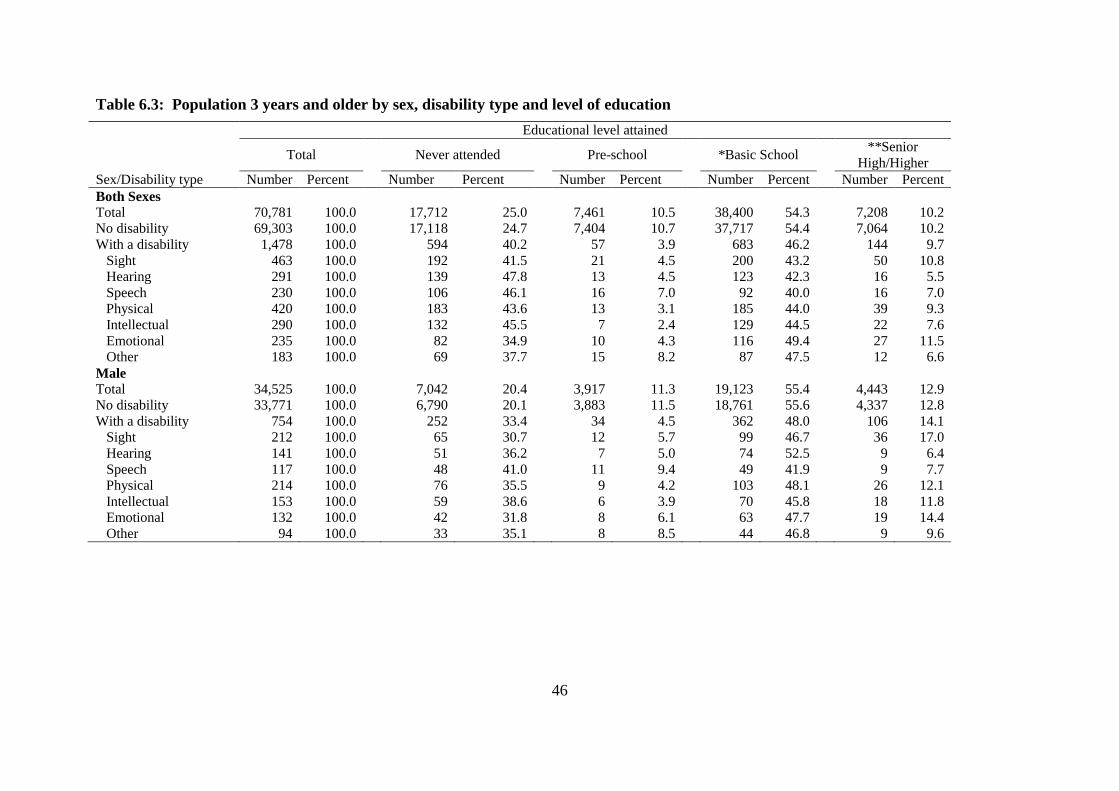
46
Table 6.3: Population 3 years and older by sex, disability type and level of education
Sex/Disability type
Educational level attained
Total
Never attended
Pre-school
*Basic School
**Senior
High/Higher
Number Percent Number Percent Number Percent Number Percent Number Percent
Both Sexes
Total 70,781 100.0
17,712 25.0
7,461 10.5
38,400 54.3
7,208 10.2
No disability 69,303 100.0
17,118 24.7
7,404 10.7
37,717 54.4
7,064 10.2
With a disability 1,478 100.0
594 40.2
57 3.9
683 46.2
144 9.7
Sight 463 100.0
192 41.5
21 4.5
200 43.2
50 10.8
Hearing 291 100.0
139 47.8
13 4.5
123 42.3
16 5.5
Speech 230 100.0
106 46.1
16 7.0
92 40.0
16 7.0
Physical 420 100.0
183 43.6
13 3.1
185 44.0
39 9.3
Intellectual 290 100.0
132 45.5
7 2.4
129 44.5
22 7.6
Emotional 235 100.0
82 34.9
10 4.3
116 49.4
27 11.5
Other 183 100.0
69 37.7
15 8.2
87 47.5
12 6.6
Male
Total 34,525 100.0
7,042 20.4
3,917 11.3
19,123 55.4
4,443 12.9
No disability 33,771 100.0
6,790 20.1
3,883 11.5
18,761 55.6
4,337 12.8
With a disability 754 100.0
252 33.4
34 4.5
362 48.0
106 14.1
Sight 212 100.0
65 30.7
12 5.7
99 46.7
36 17.0
Hearing 141 100.0
51 36.2
7 5.0
74 52.5
9 6.4
Speech 117 100.0
48 41.0
11 9.4
49 41.9
9 7.7
Physical 214 100.0
76 35.5
9 4.2
103 48.1
26 12.1
Intellectual 153 100.0
59 38.6
6 3.9
70 45.8
18 11.8
Emotional 132 100.0
42 31.8
8 6.1
63 47.7
19 14.4
Other 94 100.0
33 35.1
8 8.5
44 46.8
9 9.6

47
Table 6.3: Population 3 years and older by sex, disability type and level of education (cont’d)
Sex/Disability type
Educational level attained
Total
Never attended
Pre-school
*Basic School
**Senior
High/Higher
Number Percent Number Percent Number Percent Number Percent Number Percent
Female
Total 36,256 100.0
10,670 29.4
3,544 9.8
19,277 53.2
2,765 7.6
No disability 35,532 100.0
10,328 29.1
3,521 9.9
18,956 53.3
2,727 7.7
With a disability 724 100.0
342 47.2
23 3.2
321 44.3
38 5.2
Sight 251 100.0
127 50.6
9 3.6
101 40.2
14 5.6
Hearing 150 100.0
88 58.7
6 4.0
49 32.7
7 4.7
Speech 113 100.0
58 51.3
5 4.4
43 38.1
7 6.2
Physical 206 100.0
107 51.9
4 1.9
82 39.8
13 6.3
Intellectual 137 100.0
73 53.3
1 0.7
59 43.1
4 2.9
Emotional 103 100.0
40 38.8
2 1.9
53 51.5
8 7.8
Other 89 100.0 36 40.4 7 7.9 43 48.3 3 3.4 Source: Ghana Statistical Service, 2010 Population and Housing Census
* Includes Primary School, Middle/JSS/JHS
**Incudes Sec/SSS/SHS, Voc/Tec/Comm., Post sec, Bachelor Degree, Postgraduate (Cert., Diploma, Masters, PHD etc.)
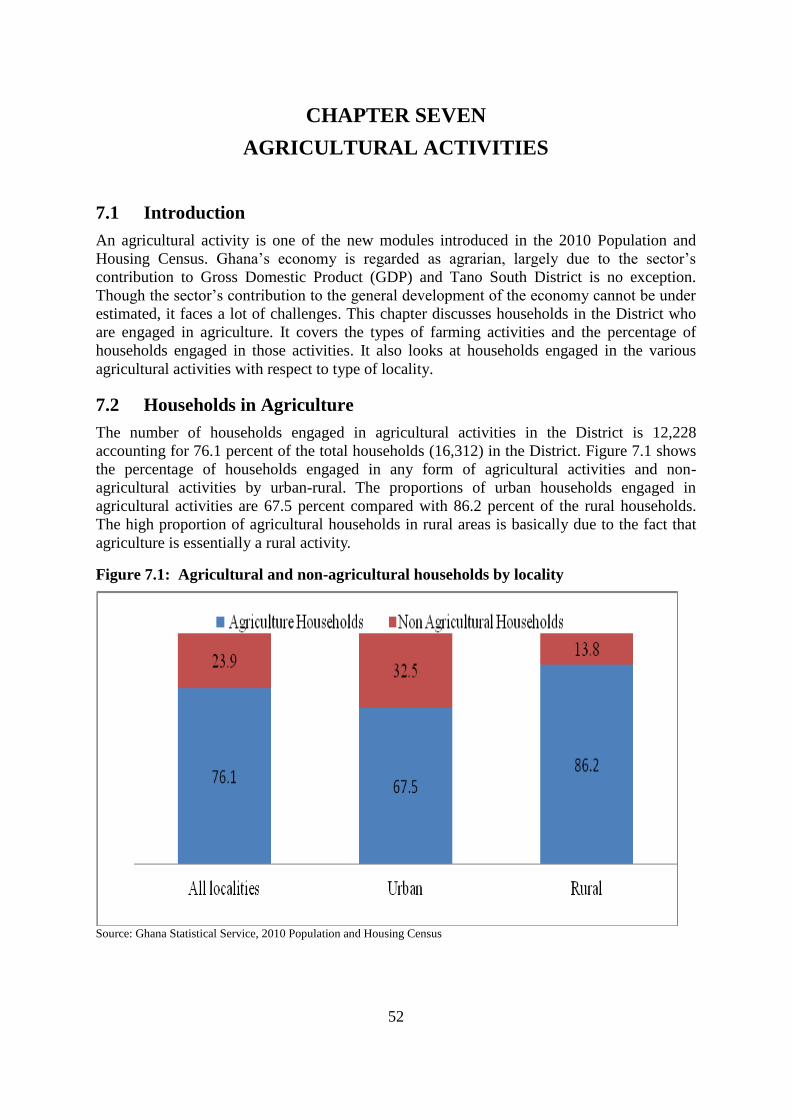
52
CHAPTER SEVEN
AGRICULTURAL ACTIVITIES
7.1 Introduction
An agricultural activity is one of the new modules introduced in the 2010 Population and
Housing Census. Ghana’s economy is regarded as agrarian, largely due to the sector’s
contribution to Gross Domestic Product (GDP) and Tano South District is no exception.
Though the sector’s contribution to the general development of the economy cannot be under
estimated, it faces a lot of challenges. This chapter discusses households in the District who
are engaged in agriculture. It covers the types of farming activities and the percentage of
households engaged in those activities. It also looks at households engaged in the various
agricultural activities with respect to type of locality.
7.2 Households in Agriculture
The number of households engaged in agricultural activities in the District is 12,228
accounting for 76.1 percent of the total households (16,312) in the District. Figure 7.1 shows
the percentage of households engaged in any form of agricultural activities and non-
agricultural activities by urban-rural. The proportions of urban households engaged in
agricultural activities are 67.5 percent compared with 86.2 percent of the rural households.
The high proportion of agricultural households in rural areas is basically due to the fact that
agriculture is essentially a rural activity.
Figure 7.1: Agricultural and non-agricultural households by locality
Source: Ghana Statistical Service, 2010 Population and Housing Census

53
7.3 Types of Farming Activities
It is important to note that some households engage in more than one agricultural activity and
therefore attempt should not be made to add up totals of households in various activities.
There are four farming activities in the District (Table 7.1). These are Crop farming (97.1%),
Tree planting (2.0%), Livestock rearing (32.9%) and Fish farming (0.1%). Tree planting and
Fish farming are not common agricultural activities in the District. Among the urban
households only 0.1 percent of households are into fish farming. On the other hand, even
though not significant, 2.3 percent of farmers are engaged in tree planting in the rural areas
compared to 1.7 percent in the urban areas.
Table 7.1: Household by agricultural activity and locality
Type of Farming Activity
Total Urban Rural
Number Percent Number Percent Number Percent
Total Households 16,312 100.0
8,842 100.0
7,470 100.0
Households engaged in
Agriculture 12,411 76.1
5,972 67.5
6,439 86.2
Crop Farming 12,052 97.1
5,738 96.1
6,314 98.1
Tree Planting 254 2.0
104 1.7
150 2.3
Livestock Rearing 4,078 32.9
1,468 24.6
2,610 40.5
Fish Farming 10 0.1 7 0.1
3 0.0 Source: Ghana Statistical Service, 2010 Population and Housing Census
7.4 Types of Livestock and Other Animals reared
Livestock rearing is the second most important agricultural activity after crop farming. Table
7.2 shows the types of livestock reared in the District. The 2010 census counted a total of
138,782 livestock of different species in the District. Out of this number, there are 6,829
keepers and an average of 20.3 livestock per keeper. Among the ruminants, the top three are
13.8 percent with 1,779 keepers for goat, 12.9 percent of sheep with 1,336 keepers and 3.1
percent of pig with 273 keepers. The average animal per keeper for goat, sheep and pig are
10.7, 13.4 and 15.8 respectively.

54
Table 7.2: Distribution of livestock, other animals and keepers
Livestock/keepers
Number of Animals
Number of
keepers
Average
Animal
per
Keeper Number Percent
Total 138,782 100.0 6,829 20.3
Beehives 248 0.2 16 15.5
Cattle 3,846 2.8 147 26.2
Chicken 84,769 61.1 2,767 30.6
Dove 844 0.6 22 38.4
Duck 1,938 1.4 159 12.2
Goat 19,096 13.8 1,779 10.7
Grass-cutter 1,065 0.8 19 56.1
Guinea fowl 2,978 2.1 204 14.6
Ostrich 128 0.1 3 42.7
Pig 4,324 3.1 273 15.8
Rabbit 301 0.2 34 8.9
Sheep 17,874 12.9 1,336 13.4
Silk worm 188 0.1 11 17.1
Snail 100 0.1 1 100.0
Turkey 170 0.1 23 7.4
Other (specify) 152 0.1 25 6.1
Fish farming 733 0.5 8 91.6
Inland fishing 8 0.0 1 8.0 Source: Ghana Statistical Service, 2010 Population and Housing Census

55
CHAPTER EIGHT
HOUSING CONDITIONS
8.1 Introduction
In many developing countries, where population increase has been rapid while economic
growth has been slow or stagnant, there have been deficits in the supply of facilities such as
housing. The situation in urban centres especially has worsened due to rapid rates of
urbanization. Concerns for human wellbeing conditions associated with housing led to the
introduction of housing questions into the 2000 Round of Population and Housing Census.
The 2010 Population and Housing Census is thus the second time questions on housing were
asked. A number of housing characteristics and associated conditions such as overcrowding,
supply of basic services such as drinking water and sanitation facilities (toilet and bathroom)
are important areas that are required for monitoring progress in human development.
This chapter presents the findings on housing and housing conditions that pertained in the
Tano South District in 2010. It examines the housing stock, type of dwelling, room
occupancy, holding and tenancy, lighting and cooking facilities, bathing and toilet facilities,
waste disposal and source of water for domestic use among others.
8.2 Housing Stock
The District has a total household population of 77,185 with 40,913 in the urban areas and
36,915 in the rural areas. There are a total of 10,628 houses in the District of which 4,922 are
found in the urban localities and 5,706 in the rural settings. According to the 2010 Population
and Housing Census, there are 16,312 households in the District comprising 8,842 urban
households and 7,470 rural households. The mean number of households per house is 1.5
and an average population per house of 7.3 persons. The average household size in the
District is 4.7 persons (Table 8.1).
Table 8.1: Stock of houses and households by type of locality
Categories Total country Region District Urban Rural
Total population 24,658,823 2,310,983 78,129 40,913 37,216
Total household population 24,076,327 2,265,458 77,185 40,270 36,915
Number of houses 3,392,745 331,967 10,628 4,922 5,706
Number of households 5,467,054 490,515 16,312 8,842 7,470
Average households per house 1.6 1.5 1.5 1.8 1.3
Population per house* 7.1 6.8 7.3 8.2 6.5
Average household size 4.4 4.6 4.7 4.6 4.9 Source: Ghana Statistical Service, 2010 Population and Housing Census
8.3 Type of Dwelling and Ownership Status
Table 8.2 presents the types of occupied dwelling units by sex of household head and type of
locality. The table shows that majority of households in the District, 58.8 percent live in
compound houses. This implies that, more than half of the District’s population live in
compound houses. Those who live in separate/detached/self-contained houses constitute 28.8
percent.

56
In the urban localities, far more than half (65.9%) of households live in compound houses
whereas in the rural areas the record is 50.3 percent. Few improvised homes like kiosks and
containers account for about 0.8 percent of houses in urban areas and 0.1 percent in rural
areas. The availability of improvised homes could be a sign of isolated characteristics of
slums especially in the District capital where migrant farmers from outside the region reside.
Table 8.2: Type of occupied dwelling unit by sex of household head and type of locality
Type of dwelling
Total
country Region
District
Total Male
headed
Female
headed Number Percent Urban Rural
Total
5,467,054 490,515 16,312 100.0 100.0 100.0 100.0 100.0
Separate house 1,471,391 162,809 4,700 28.8 30.9 25.3 24.2 34.3
Semi-detached house 391,548 27,079 635 3.9 4.1 3.5 2.9 5.1
Flat/Apartment 256,355 11,331 320 2.0 1.7 2.4 2.5 1.3
Compound house (rooms) 2,942,147 256,130 9,589 58.8 55.0 65.0 65.9 50.3
Huts/Buildings (same
compound) 170,957 20,955 609 3.7 4.9 1.8 2.0 5.7
Huts/Buildings(different
compound) 36,410 3,245 190 1.2 1.6 0.4 0.1 2.4
Tent
10,343 871 32 0.2 0.2 0.1 0.1 0.3
Improvised home
(kiosk/container etc) 90,934 2,393 75 0.5 0.5 0.5 0.8 0.1
Living quarters attached to
office/shop 20,499 1,102 39 0.2 0.3 0.2 0.3 0.2
Uncompleted building 66,624 3,850 105 0.6 0.7 0.6 1.1 0.1
Other 9,846 750 18 0.1 0.1 0.2 0.1 0.2
Source: Ghana Statistical Service, 2010 Population and Housing Census
Table 8.3 presents ownership status of dwelling units by household head and type of locality.
From the table, more than half (51.8%) of households own dwelling units they occupy. A
little more than a quarter (26.1%) of the households occupy dwellings that are owned by
other private individuals. Households staying in dwelling units that are owned by relative
who is not a household member constitute 17.5 percent.
A higher proportion of male headed households appear to own houses they occupy than
female headed households (52.3% and 51.0% respectively) as well as houses that are owned
by other private individuals (27.7% and 23.2% respectively). Female headed households who
occupy dwellings that are owned by relative and not household member is 21.9 percent as
compared to 14.9 percent for male headed households.
The proportion of those who live in houses that are owned by relative and not a household
member are 19.3 percent in the urban and 15.4 in the rural areas. The government owns only
2.1 percent of dwellings in the District with 2.4 percent located in the urban and 1.7 percent
in the rural areas.

57
Table 8.3: Ownership status of dwelling by sex of household head and type of locality
District
Total
Male
headed
Female
headed
Urban Rural Ownership status
Total
Country Region Number Percent
Total 5,467,054 490,515 16,312 100.0 100.0 100.0
100.0 100.0
Owned by household member 2,883,236 260,608 8,453 51.8 52.3 51.0
47.6 56.8
Being purchased (e.g.
mortgage) 45,630 3,448 162 1.0 1.0 1.0
1.1 0.9
Relative not a household
member 851,630 90,176 2,856 17.5 14.9 21.9
19.3 15.4
Other private individual 1,439,021 116,402 4,250 26.1 27.7 23.2
28.3 23.4
Private employer 83,610 9,509 126 0.8 1.1 0.2
0.4 1.2
Other private agency 21,123 1,390 69 0.4 0.5 0.3
0.6 0.2
Public/Government ownership 118,804 7,138 340 2.1 2.1 2.1
2.4 1.7
Other 24,000 1,844 56 0.3 0.4 0.3 0.2 0.5
Source: Ghana Statistical Service, 2010 Population and Housing Census
8.4 Construction Materials
In the 2010 PHC data was collected on the major construction materials for the various
dwelling units in relation to wall, floor and roofing. The material used affects the lifespan of
the buildings, appearance and quality.
8.4.1 Main construction material for outer Wall
Table 8.4 shows that in the Tano South District, walls of dwelling units are made of two
major construction materials: cement block/concrete (48.3%) and mud brick/earth (46.3%).
Stones and bamboos are the two outer wall materials less used in the District.
The proportion of dwelling units with outer walls of cement or concrete is more in urban
(67.3%) than rural areas (26.4%) in 2010. Comparatively, the use of mud brick/earth is more
in rural (27.8%) than urban areas (67.6%). These rural-urban differentials in building
materials could be due to the high cost of cement as compared to the availability of low-cost
local building materials such as wood, mud bricks/earth and so on.
Table 8.4: Main construction material for outer wall of dwelling
unit by type of locality
Material for Outer wall
Total
country Region
District
Total
Urban Rural Number Percent
Total 5,817,607 519,342 17,149 100.0 100.0 100.0
Mud brick/Earth 1,991,540 239,284 7,944 46.3 27.8 67.6
Wood 200,594 7,932 214 1.2 1.3 1.2
Metal sheet/Slate/Asbestos 43,708 2,447 65 0.4 0.5 0.2
Stone 11,330 814 16 0.1 0.1 0.1
Burnt bricks 38,237 5,062 84 0.5 0.5 0.5
Cement blocks/Concrete 3,342,462 241,282 8,280 48.3 67.3 26.4
Landcrete 104,270 18,808 444 2.6 2.2 3.0
Bamboo 8,206 523 11 0.1 0.1 0.1
Palm leaf/Thatch (grass)/Raffia 38,054 1,694 52 0.3 0.1 0.5
Other 39,206 1,496 39 0.2 0.1 0.4 Source: Ghana Statistical Service, 2010 Population and Housing Census
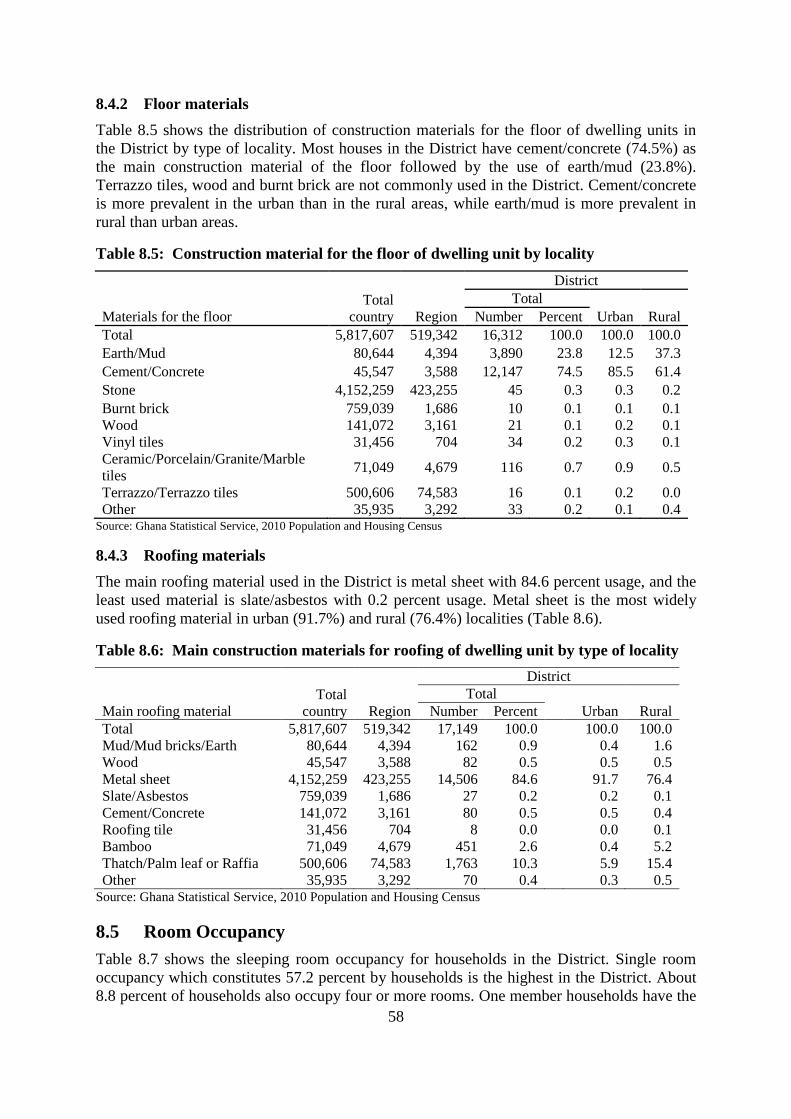
58
8.4.2 Floor materials
Table 8.5 shows the distribution of construction materials for the floor of dwelling units in
the District by type of locality. Most houses in the District have cement/concrete (74.5%) as
the main construction material of the floor followed by the use of earth/mud (23.8%).
Terrazzo tiles, wood and burnt brick are not commonly used in the District. Cement/concrete
is more prevalent in the urban than in the rural areas, while earth/mud is more prevalent in
rural than urban areas.
Table 8.5: Construction material for the floor of dwelling unit by locality
Materials for the floor
Total
country Region
District
Total
Urban Rural Number Percent
Total 5,817,607 519,342 16,312 100.0 100.0 100.0
Earth/Mud 80,644 4,394 3,890 23.8 12.5 37.3
Cement/Concrete 45,547 3,588 12,147 74.5 85.5 61.4
Stone 4,152,259 423,255 45 0.3 0.3 0.2
Burnt brick 759,039 1,686 10 0.1 0.1 0.1
Wood 141,072 3,161 21 0.1 0.2 0.1
Vinyl tiles 31,456 704 34 0.2 0.3 0.1
Ceramic/Porcelain/Granite/Marble
tiles 71,049 4,679 116 0.7 0.9 0.5
Terrazzo/Terrazzo tiles 500,606 74,583 16 0.1 0.2 0.0
Other 35,935 3,292 33 0.2 0.1 0.4 Source: Ghana Statistical Service, 2010 Population and Housing Census
8.4.3 Roofing materials
The main roofing material used in the District is metal sheet with 84.6 percent usage, and the
least used material is slate/asbestos with 0.2 percent usage. Metal sheet is the most widely
used roofing material in urban (91.7%) and rural (76.4%) localities (Table 8.6).
Table 8.6: Main construction materials for roofing of dwelling unit by type of locality
Main roofing material
Total
country Region
District
Total
Urban Rural Number Percent
Total 5,817,607 519,342 17,149 100.0
100.0 100.0
Mud/Mud bricks/Earth 80,644 4,394 162 0.9
0.4 1.6
Wood 45,547 3,588 82 0.5
0.5 0.5
Metal sheet 4,152,259 423,255 14,506 84.6
91.7 76.4
Slate/Asbestos 759,039 1,686 27 0.2
0.2 0.1
Cement/Concrete 141,072 3,161 80 0.5
0.5 0.4
Roofing tile 31,456 704 8 0.0
0.0 0.1
Bamboo 71,049 4,679 451 2.6
0.4 5.2
Thatch/Palm leaf or Raffia 500,606 74,583 1,763 10.3
5.9 15.4
Other 35,935 3,292 70 0.4 0.3 0.5 Source: Ghana Statistical Service, 2010 Population and Housing Census
8.5 Room Occupancy
Table 8.7 shows the sleeping room occupancy for households in the District. Single room
occupancy which constitutes 57.2 percent by households is the highest in the District. About
8.8 percent of households also occupy four or more rooms. One member households have the

59
highest single room occupancy (94.4%) whiles households with size of ten and above have
the lowest of 7.5 percent. Whereas the use of two rooms for sleeping ranges from 3.8 percent
to 39.7 percent for one member households to eight member households, the use of four
rooms for sleeping on the other hand ranges from 0.6 percent for one member household to
19.6 percent for ten or more member households. One member households to three member
households have predominantly one sleeping room. Households with membership of nine to
ten and above have the least occupancy for single rooms. Thus, many households may be
overcrowded in terms of available sleeping rooms. This could be dangerous in the event of an
outbreak of any infectious or contagious diseases like tuberculosis and cholera.
Table 8.7: Household size and number of sleeping rooms occupied in dwelling unit
House-
hold
size
Number of sleeping rooms
Total One
room
Two
rooms
Three
rooms
Four
rooms
Five
rooms
Six
rooms
Seven
rooms
Eight
rooms
Nine
rooms
or
more Number Percent
Total 16,312 100.0 57.2 24.2 9.9 4.6 1.9 1.0 0.6 0.3 0.4
1 2,512 100.0 94.4 3.8 1.0 0.6 0.0 0.0 0.1 0.0 0.0
2 1,873 100.0 79.2 17.1 2.0 1.0 0.3 0.1 0.2 0.1 0.0
3 2,146 100.0 73.1 19.7 5.7 1.0 0.2 0.0 0.1 0.0 0.1
4 2,143 100.0 63.7 26.1 7.3 1.9 0.5 0.2 0.3 0.0 0.0
5 1,980 100.0 55.1 30.5 9.7 3.0 1.0 0.2 0.2 0.2 0.2
6 1,674 100.0 41.5 35.4 14.8 5.1 2.1 0.7 0.4 0.0 0.1
7 1,326 100.0 30.5 38.6 18.3 7.2 2.8 1.6 0.4 0.1 0.5
8 862 100.0 21.9 39.7 19.0 10.6 4.5 2.1 1.3 0.9 0.0
9 581 100.0 12.4 37.3 25.6 14.6 5.3 2.8 1.5 0.0 0.3
10+ 1,215 100.0 7.5 23.5 22.5 19.8 9.9 6.8 3.3 2.8 4.0
Source: Ghana Statistical Service, 2010 Population and Housing Census
8.6 Access to Utilities and Household Facilities
The source of lighting is an indicator of the quality of life. As societies improve, the source of
lighting shifts from the use of low quality sources such as firewood to more efficient ones
such as electricity.
8.6.1 Main source of lighting
Table 8.8 shows the sources of lighting for dwelling units by type of locality. From the Table,
about 56.4 percent of households in the District use electricity from the mains as the main
source of lighting. Nearly 27 percent of households use flashlights/torch including
rechargeable lights as one of the sources while the use of solar and crop residue are
insignificantly used.
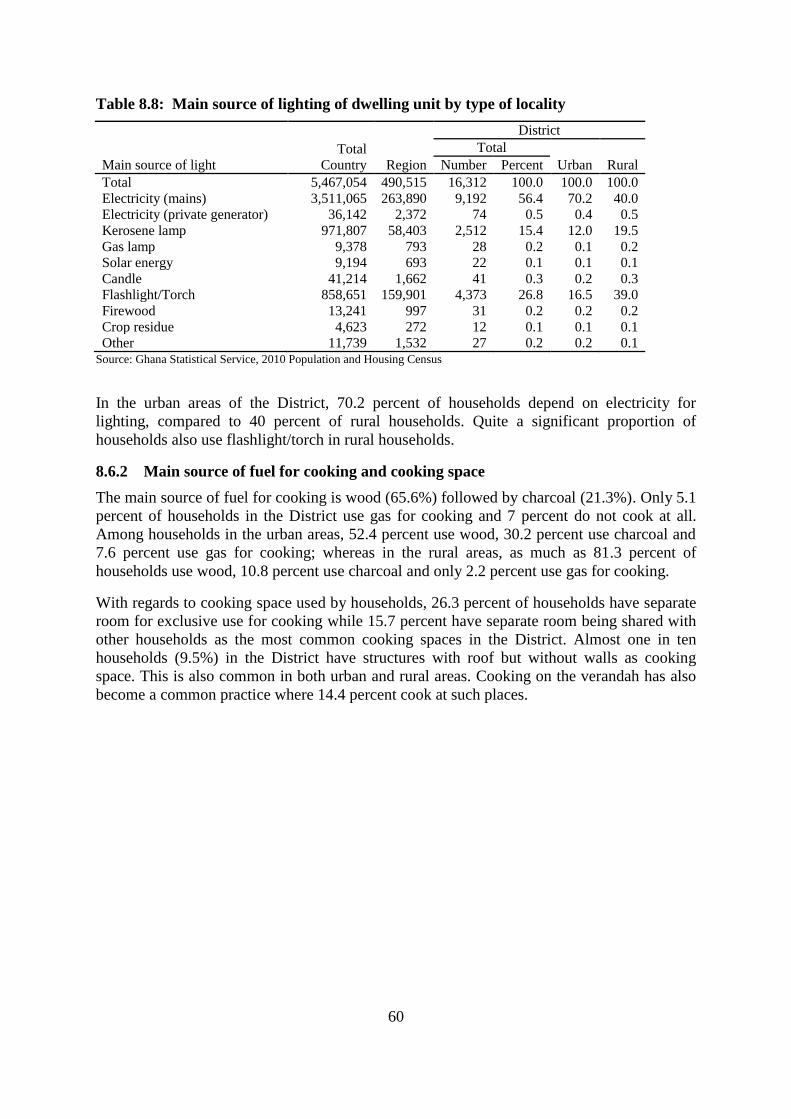
60
Table 8.8: Main source of lighting of dwelling unit by type of locality
Main source of light
Total
Country Region
District
Total
Urban Rural Number Percent
Total 5,467,054 490,515 16,312 100.0 100.0 100.0
Electricity (mains) 3,511,065 263,890 9,192 56.4 70.2 40.0
Electricity (private generator) 36,142 2,372 74 0.5 0.4 0.5
Kerosene lamp 971,807 58,403 2,512 15.4 12.0 19.5
Gas lamp 9,378 793 28 0.2 0.1 0.2
Solar energy 9,194 693 22 0.1 0.1 0.1
Candle 41,214 1,662 41 0.3 0.2 0.3
Flashlight/Torch 858,651 159,901 4,373 26.8 16.5 39.0
Firewood 13,241 997 31 0.2 0.2 0.2
Crop residue 4,623 272 12 0.1 0.1 0.1
Other 11,739 1,532 27 0.2 0.2 0.1 Source: Ghana Statistical Service, 2010 Population and Housing Census
In the urban areas of the District, 70.2 percent of households depend on electricity for
lighting, compared to 40 percent of rural households. Quite a significant proportion of
households also use flashlight/torch in rural households.
8.6.2 Main source of fuel for cooking and cooking space
The main source of fuel for cooking is wood (65.6%) followed by charcoal (21.3%). Only 5.1
percent of households in the District use gas for cooking and 7 percent do not cook at all.
Among households in the urban areas, 52.4 percent use wood, 30.2 percent use charcoal and
7.6 percent use gas for cooking; whereas in the rural areas, as much as 81.3 percent of
households use wood, 10.8 percent use charcoal and only 2.2 percent use gas for cooking.
With regards to cooking space used by households, 26.3 percent of households have separate
room for exclusive use for cooking while 15.7 percent have separate room being shared with
other households as the most common cooking spaces in the District. Almost one in ten
households (9.5%) in the District have structures with roof but without walls as cooking
space. This is also common in both urban and rural areas. Cooking on the verandah has also
become a common practice where 14.4 percent cook at such places.

61
Table 8.9: Main source of fuel for cooking and cooking space by type of
locality
Source of cooking fuel/cooking
space
Total
country Region
District
Total
Urban Rural Number Percent
Main source of cooking fuel for household
Total 5,467,054 490,515 16,312 100.0 100.0 100.0
No cooking 306,118 32,285 1,142 7.0 9.0 4.6
Wood 2,197,083 294,170 10,700 65.6 52.4 81.3
Gas 996,518 36,641 833 5.1 7.6 2.2
Electricity 29,794 1,073 23 0.1 0.1 0.2
Kerosene 29,868 929 36 0.2 0.2 0.2
Charcoal 1,844,290 122,190 3,478 21.3 30.2 10.8
Crop residue 45,292 1,788 74 0.5 0.3 0.6
Saw dust 8,000 1,023 21 0.1 0.2 0.0
Animal waste 2,332 87 1 0.0 0.0 0.0
Other 7,759 329 4 0.0 0.0 0.0
Cooking space used by household
Total 5,467,054 490,515 16,312 100.0 100.0 100.0
No cooking space 386,883 39,078 1,296 7.9 9.9 5.6
Separate room for exclusive use of
household 1,817,018 136,004 4,287 26.3 22.8 30.4
Separate room shared with other
household(s) 410,765 47,827 2,553 15.7 16.8 14.3
Enclosure without roof 117,614 7,195 270 1.7 1.3 2.1
Structure with roof but without walls 349,832 41,889 1,552 9.5 7.0 12.5
Bedroom/Hall/Living room) 74,525 1,575 63 0.4 0.4 0.4
Verandah 1,173,946 84,605 2,345 14.4 19.3 8.5
Open space in compound 1,115,464 130,728 3,884 23.8 22.1 25.8
Other 21,007 1,614 62 0.4 0.4 0.4 Source: Ghana Statistical Service, 2010 Population and Housing Census
8.7 Main Source of Water for Drinking and for other Domestic Use
The availability of and accessibility to improved drinking water is an important aspect of the
health of household members. The UN Millennium Development Goal (MDG) seven aimed
to reduce by half the proportion of people without sustainable access to safe drinking water
by 2015 based on 1990 levels. The source of water supply particularly for drinking has a
tremendous effect on burden of diseases. For instance, one of the main health benefits of
clean drinking water supply is the reduction in diarrhoea.
8.7.1 Main source of drinking water
The main source of drinking water for households in the District is bore-hole/pump/tube
according to Table 8.10. About 33.4 percent of households use water from this source for
drinking. In addition, drinking water from the following sources of pipe-borne water are
stand pipe (17.1%), pipe borne outside dwelling (13.9%) and pipe borne inside dwelling
(6.1%) are used by households. In all, 62.2 percent of urban households use pipe borne water
(pipe inside, outside dwelling or public tap) compared to 17.9 percent of rural households.
Majority of rural households 53.5 percent use water from bore hole compared to 15.8 percent
of urban households.

62
8.7.2 Main source of water for other domestic use
Further analysis indicates that, bore-hole/pump/tube well (31.7%) is used mainly by
households for other domestic purposes as well as public stand pipe which constitutes 17
percent. A higher proportion of households in the rural communities have access to bore-
hole/pump/tube well for domestic use (Table 8.10).
Table 8.10: Main source of water of dwelling unit for drinking and other
domestic purposes
Sources of water
Total
country Region
District
Total
Urban Rural Number Percent
Main source of drinking water
for household
Total 5,467,054 490,515 16,312 100.0 100.0 100.0
Pipe-borne inside dwelling 790,493 29,804 561 3.4 4.7 2.0
Pipe-borne outside dwelling 1,039,667 68,152 2,401 14.7 22.4 5.6
Public tap/Standpipe 712,375 83,741 3,880 23.8 35.1 10.3
Bore-hole/Pump/Tube well 1,267,688 163,629 5,393 33.1 15.8 53.5
Protected well 321,091 45,990 1,294 7.9 11.7 3.5
Rain water 39,438 1,044 61 0.4 0.4 0.4
Protected spring 19,345 1,498 32 0.2 0.2 0.1
Bottled water 20,261 777 25 0.2 0.2 0.1
Sachet water 490,283 13,356 277 1.7 1.4 2.1
Tanker supply/Vendor provided 58,400 288 3 0.0 0.0 0.0
Unprotected well 112,567 9,372 231 1.4 1.1 1.7
Unprotected spring 12,222 1,360 20 0.1 0.1 0.1
River/Stream 502,804 64,993 2,092 12.8 6.6 20.1
Dugout/Pond/Lake/Dam/Canal 76,448 6,268 41 0.3 0.2 0.3
Other 3,972 243 1 0.0 0.0 0.0
Main source of water for other
domestic use of household
Total 5,467,054 490,515 16,312 100.0 100.0 100.0
Pipe-borne inside dwelling 905,566 32,149 571 3.5 4.7 2.0
Pipe-borne outside dwelling 1,089,030 67,219 2,344 14.4 22.2 5.1
Public tap/Standpipe 704,293 83,208 3,869 23.7 35.3 10.0
Bore-hole/Pump/Tube well 1,280,465 156,073 5,175 31.7 14.3 52.3
Protected well 465,775 57,094 1,613 9.9 13.1 6.1
Rain water 39,916 965 12 0.1 0.1 0.0
Protected spring 18,854 1,626 42 0.3 0.4 0.1
Tanker supply/Vendor provided 100,048 651 21 0.1 0.1 0.1
Unprotected well 152,055 10,956 273 1.7 1.7 1.7
Unprotected spring 15,738 1,567 22 0.1 0.2 0.1
River/Stream 588,590 70,604 2,302 14.1 7.6 21.8
Dugout/Pond/Lake/Dam/Canal 96,422 7,421 45 0.3 0.2 0.3
Other 10,302 982 23 0.1 0.1 0.2 Source: Ghana Statistical Service, 2010 Population and Housing Census
8.8 Bathing and Toilet Facilities
An efficient and hygienic method of human waste disposal available in a dwelling unit is a
critical indicator of the sanitary condition of the dwelling unit and is an indirect measure of
the socio-economic status of a household.
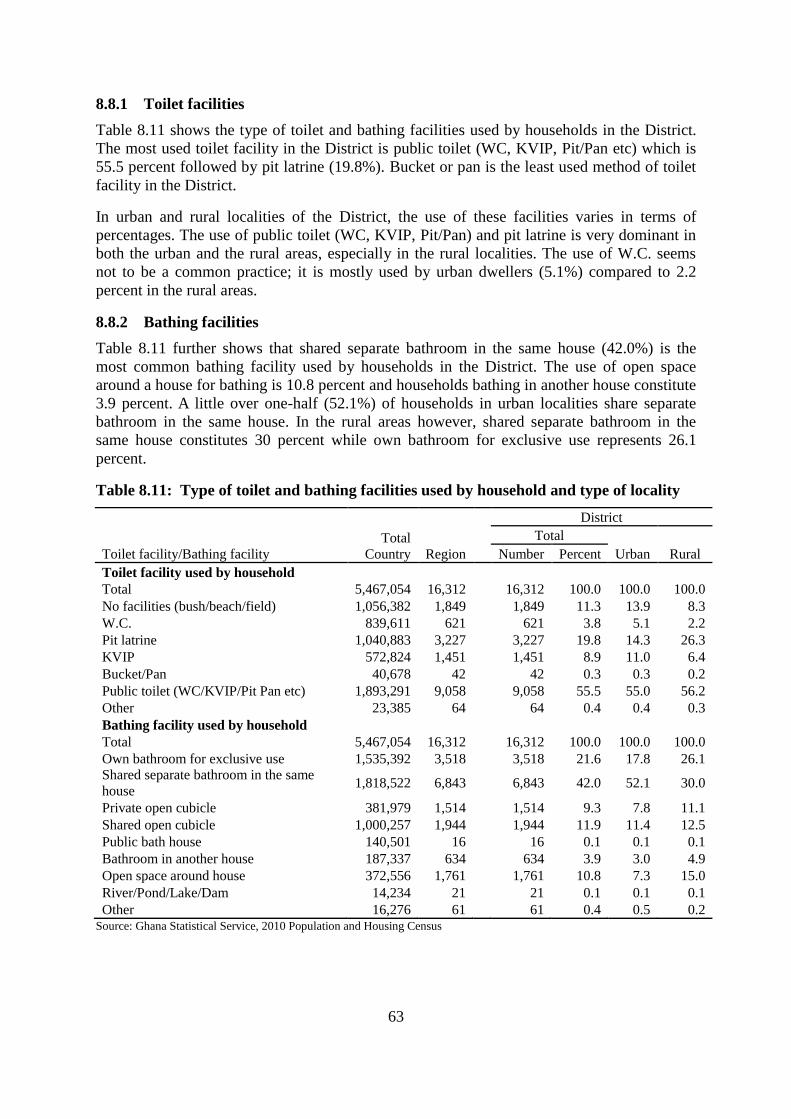
63
8.8.1 Toilet facilities
Table 8.11 shows the type of toilet and bathing facilities used by households in the District.
The most used toilet facility in the District is public toilet (WC, KVIP, Pit/Pan etc) which is
55.5 percent followed by pit latrine (19.8%). Bucket or pan is the least used method of toilet
facility in the District.
In urban and rural localities of the District, the use of these facilities varies in terms of
percentages. The use of public toilet (WC, KVIP, Pit/Pan) and pit latrine is very dominant in
both the urban and the rural areas, especially in the rural localities. The use of W.C. seems
not to be a common practice; it is mostly used by urban dwellers (5.1%) compared to 2.2
percent in the rural areas.
8.8.2 Bathing facilities
Table 8.11 further shows that shared separate bathroom in the same house (42.0%) is the
most common bathing facility used by households in the District. The use of open space
around a house for bathing is 10.8 percent and households bathing in another house constitute
3.9 percent. A little over one-half (52.1%) of households in urban localities share separate
bathroom in the same house. In the rural areas however, shared separate bathroom in the
same house constitutes 30 percent while own bathroom for exclusive use represents 26.1
percent.
Table 8.11: Type of toilet and bathing facilities used by household and type of locality
Toilet facility/Bathing facility
Total
Country Region
District
Total
Urban Rural Number Percent
Toilet facility used by household
Total 5,467,054 16,312
16,312 100.0 100.0 100.0
No facilities (bush/beach/field) 1,056,382 1,849
1,849 11.3 13.9 8.3
W.C. 839,611 621
621 3.8 5.1 2.2
Pit latrine 1,040,883 3,227
3,227 19.8 14.3 26.3
KVIP 572,824 1,451
1,451 8.9 11.0 6.4
Bucket/Pan 40,678 42
42 0.3 0.3 0.2
Public toilet (WC/KVIP/Pit Pan etc) 1,893,291 9,058
9,058 55.5 55.0 56.2
Other 23,385 64
64 0.4 0.4 0.3
Bathing facility used by household
Total 5,467,054 16,312
16,312 100.0 100.0 100.0
Own bathroom for exclusive use 1,535,392 3,518
3,518 21.6 17.8 26.1
Shared separate bathroom in the same
house 1,818,522 6,843
6,843 42.0 52.1 30.0
Private open cubicle 381,979 1,514
1,514 9.3 7.8 11.1
Shared open cubicle 1,000,257 1,944
1,944 11.9 11.4 12.5
Public bath house 140,501 16
16 0.1 0.1 0.1
Bathroom in another house 187,337 634
634 3.9 3.0 4.9
Open space around house 372,556 1,761
1,761 10.8 7.3 15.0
River/Pond/Lake/Dam 14,234 21
21 0.1 0.1 0.1
Other 16,276 61 61 0.4 0.5 0.2 Source: Ghana Statistical Service, 2010 Population and Housing Census

64
8.9 Method of Waste Disposal
Sanitation and for that matter solid and liquid wastes disposal in both rural and urban areas is
a matter of great concern to the District since it is one of the Millennium development goals
(MDGs) Ghana is expected to attain by the year 2015 and needs urgent solution.
8.9.1 Solid waste disposal
Table 8.12 shows the methods of household’s disposal of solid and liquid wastes by locality.
More than half (56%) of households dispose of their solid waste at the public dump (open
space). The best practice, refuse collection (1.5%) is not common in the District. In both rural
and urban areas, majority of households dump refuse using the public dump (open space).
Majority of dwelling units in the District as shown in Table 8.12 dispose of liquid waste in
two major ways: by throwing it unto compound (52.3%), and unto the street or outside
(38.5%). Only 1.5 percent of households dispose of their liquid waste through a sewerage
system in the District. Almost an equal proportion of households (37.8% and 39.3%) in urban
and rural areas respectively dispose of liquid waste by throwing unto the street/outside while
the majority dispose of by throwing unto compound in both localities but with higher urban
households than rural.
Table 8.12: Method of solid and liquid waste disposal by type of locality
Method of waste disposal
Total
country Region
District
Total
Urban Rural Number Percent
Solid waste
Total 5,467,054 16,312 16,312 100.0
100.0 100.0
Collected 785,889 250 250 1.5
1.5 1.5
Burned by household 584,820 735 735 4.5
4.5 4.5
Public dump (container) 1,299,654 3,713 3,713 22.8
35.1 8.2
Public dump (open space) 2,061,403 9,129 9,129 56.0
49.7 63.4
Dumped indiscriminately 498,868 1,801 1,801 11.0
6.8 16.0
Buried by household 182,615 529 529 3.2
1.4 5.4
Other 53,805 155 155 1.0
0.9 1.0
Liquid waste
Total 5,467,054 16,312 16,312 100.0
100.0 100.0
Through the sewerage system 183,169 246 246 1.5
2.2 0.7
Through drainage system into a gutter 594,404 349 349 2.1
3.6 0.4
Through drainage into a pit (soak
away) 167,555 109 109 0.7
0.8 0.5
Thrown onto the street/outside 1,538,550 6,278 6,278 38.5
37.8 39.3
Thrown into gutter 1,020,096 751 751 4.6
6.4 2.4
Thrown onto compound 1,924,986 8,531 8,531 52.3
48.7 56.5
Other 38,294 48 48 0.3 0.4 0.2 Source: Ghana Statistical Service, 2010 Population and Housing Census

65
CHAPTER NINE
SUMMARY OF FINDINGS, CONCLUSIONS AND
POLICY IMPLICATIONS
9.1 Introduction
The population census is the primary source of information about the population and its
characteristics. The 2010 Population and Housing Census collected data on the demographic,
social and economic characteristics, and housing conditions of the entire population of
Ghana. Geographically, the census covered, district, and sub-district levels such as localities,
villages, settlements and residential areas.
This report on Tano South District provides detailed analysis of the 2010 census data at the
District level. The aim is to provide useful data for planners and policy makers in designing
and implementing evidence-based strategies for development in the District. This chapter
discusses the summary of findings, conclusions and policy implications.
9.2 Summary of Findings
Population Size, Composition and Age-Sex Structure
Tano South District has a total population of 78,129 comprising of 49.1 percent of males and
50.9 percent of females. The population is predominantly urban (52.4%). The District has a
sex-ratio of 96.2 which is slightly higher than the regional ratio of 95.2. The population of the
District has a youthful age structure, with a dependency ratio of 96.2 persons to every 100
working population in the age range 15 to 64 years which is a little lower than the regional
average of 98.2.
Household Size, Structure and Composition
The nuclear family (head spouse(s) children) has the highest proportion of 27.3 percent, the
extended family (head spouse(s) children Heads relatives) is the second highest with 22
percent. The average household size is about five persons (4.7). The distribution of average
household size by locality does not differ much from that of the District as a whole. About
62.5 percent of households in the District are headed by males.
Fertility, Mortality and Migration
Three measures of fertility are employed. The crude birth rate (CBR), general fertility rate
(GFR) and the total fertility rate (TFR). In the District, women aged 15-49 are 29.3 percent of
the total population. The TFR for women aged 15-49 is about 4 births per 1,000 women, GFR
about 120 live births per 1,000 women and CBR given as 29.1 live births per 1,000
populations for the District.
The District recorded total deaths of 542, of which 47 are as a result of
accident/violence/homicide/suicide and other causes, 495 during the 12 months preceding the
2010 PHC. Crude Death Rate recorded 6.9 persons per 1,000 populations.
66
Among the 23,466 migrants resident in the District, 82.9 percent are from outside the Brong
Ahafo Region and 17.1 percent are from other districts within the region. High proportions of
the migrants from Northern, Ashanti, Upper East and Upper West Regions and outside Ghana
have stayed in the District for more than 20 years.
Marital Characteristics
Among the 50,695 persons aged 12 years and older, 43.9 percent are married and 39.5
percent have never married. The proportion of males (47.9%) who have never married is
lower than that of the females (31.8%). Persons with basic education and those with no
education (40.2%) are high among the married population.
Education and Literacy
Majority of persons in the District have attended Junior Secondary or Junior High School
(31.6%) in the past but currently, the largest proportion of the population of school going age
are in primary school (47.7%), followed by those in Junior Secondary or Junior High
(18.3%).
Economic Characteristics
Out of 45,001 persons 15 years and older in the District, 75.5 percent are economically active
(employed and unemployed) while 24.5 percent are economically not active. About 97.5
percent of the economically active is employed. Skilled agricultural, forestry and fishery form
majority of the employed persons (67.4%) in the District, followed by the service and sales
workers (12.6%).
Information Communication Technology
The 2010 PHC data shows that, out of 50,695 persons 12 years and older in the District, 37.3
percent have mobile phone and 2.4 percent use internet facility. About 43.8 percent of males
and 31.3 percent of females own mobile phones.
Disability
There are 1,528 PWDs in the District representing 2 percent of the population. About 33.4
percent of PWDs have sight or visual disability which is the major disability type, followed
by physical disability (29.0%).
Agricultural Activity
About 76.1 percent of households in the District are engaged in agriculture. Urban
communities (67.5%) have lower proportions of households engaged in agriculture than the
rural localities (86.2%). Crop farming (97.1%) and livestock rearing (32.9%) are the most
common agricultural activities in the District. The main crops grown in the District are
tomato, cocoa, cassava, plantain and oil palm.
Housing Conditions
The two major construction materials for outer walls are cement blocks/ concrete (48.3 %)
and mud/mud bricks or earth (46.3%). With respect to roofing, metal sheets are the most
widely used (84.6%), followed by thatch/palm leaf or raffia (10.3%). The main source of
lighting for dwelling units in the District is electricity from the mains (56.4%). A higher
proportion of urban households (70.2%) depend on the national electricity grid as compared
to 40 percent in the rural households.

67
Wood which constitutes 65.6 percent is the main source of fuel for cooking in the District.
Rural households depend more on wood (81.3%) as fuel for cooking than their urban (52.4%)
counterparts. Household drinking water is obtained from four major sources; bore-hole
including pump or tube well (33.1%), public tap or standpipe (23.8%), pipe-borne water
outside the dwelling (14.7%) and river or stream (12.5%). Nearly, 56 percent of households
in the District use public toilet (WC/KVIP/Pit/Pan), followed by pit latrine (19.8%). More
than half of the households dump their solid waste in an open space (56.0%) followed by
public dumb (22.8%). Most households throw their liquid waste onto the compound (52.3%).
9.3 Conclusion
From the discussions, it is observed that the Tano South District has a youthful population.
The youthful population suggests that there are lots of potential workers in the future. Health
is a major concern in the District. The under-five deaths are high. It can thus be said that there
are gaps in the measures that are being used to improve the health of persons in the District
especially children under five years. The high fertility rates reflect the low patronage of
contraceptives and other family planning methods.
Majority of the people are literate in one language or the other. Educational programmes
conducted in English or in Ghanaian language would be well communicated to greater
proportion of the populace. There are small proportions of households using desktop/laptop,
internet and fixed telephone lines.
The role of the private sector contribution to employment cannot be overemphasized. It
remains the main sector of employment in the District. Agriculture, especially food crop
farmers, is the main occupation of the people in the Tano South District. The advocacy for
household latrine as stipulated in the Millennium Development Goals (MDGs) is not really
extant in the District. Public toilets and open space defecation is still on the ascendancy in the
District. Few public containers have resulted in the disposal of refuse at open spaces and
these can lead to more sicknesses like malaria and diarrhoea. There are privately owned
houses in the District from which the District Assembly can tap sufficient revenue to improve
their revenue base.
9.4 Policy Implications
The data collected have provided the basis and platform for several policies whose effective
implementation will improve the standard of living in the District.
Education must be attractive to avoid children dropping out of school to work for
money.
There must be vocational and technical education to secure the youth in employment
after school. Pre-primary departments should be established in the basic schools so as
to lay a solid educational foundation for children in the District.
The District health committee should try to intensify health policies on family
planning and contraceptive use to check the rate of population growth especially
among the teenagers. Immunization policies and sensitization programmes should be
extended beyond the health centres and health posts to include platforms such as
community durbars, radio discussions and church visits.
Sanitation bye laws and policies should be intensified. More containers should be
68
provided in the various communities. The statutory planning committee and other
concerned bodies should insist on household latrine in building plans to reduce the
dependency on public toilets and open space defecation.
The various communities should be encouraged to use gas in cooking instead of wood
and charcoal which has some health hazard and also lead to deforestation. The District
assembly should endeavour to provide pipe borne water to more communities and
also more houses should be connected to the national grid (electricity) in order to
assist students to study after school.

69
REFERENCES
Afranie S. (2012), Household size, structure and composition. In: 2010 Population and
Housing census, Ghana. National Demographic Report, Ghana Statistical Service
Arthur Haupt, Thomas T. Kane, and Carl Haub (2011), Population Reference Bureau’s
Population Handbook, 6th
Edition Washington D.C
Ghana Federation of the Disabled (2008), Disability Situation in Ghana
Ghana Statistical Service, (2012), 2010 Population and Housing Census, National Analytical
Report
Ghana Statistical Service, (2012), 2010 Population and Housing Census, Brong Ahafo
Regional Analytical Report
Ghana Statistical Service, (2012), 2010 Population and Housing Census, Summary report of
final results
Ghana Statistical Service (2013), Compendium of Statistical Standards, Variables and
Concepts for Official Statistics in Ghana
Ghana Statistical Service (2005), 2000 Population and Housing Census, Eastern Region
Analysis of district data and implications for planning
Ghana Statistical Service (2005), 2000 Population and Housing Census, Ashanti Region
Analysis of district data and implications for planning
http://www.geocities.com/opokurob/mypage.html
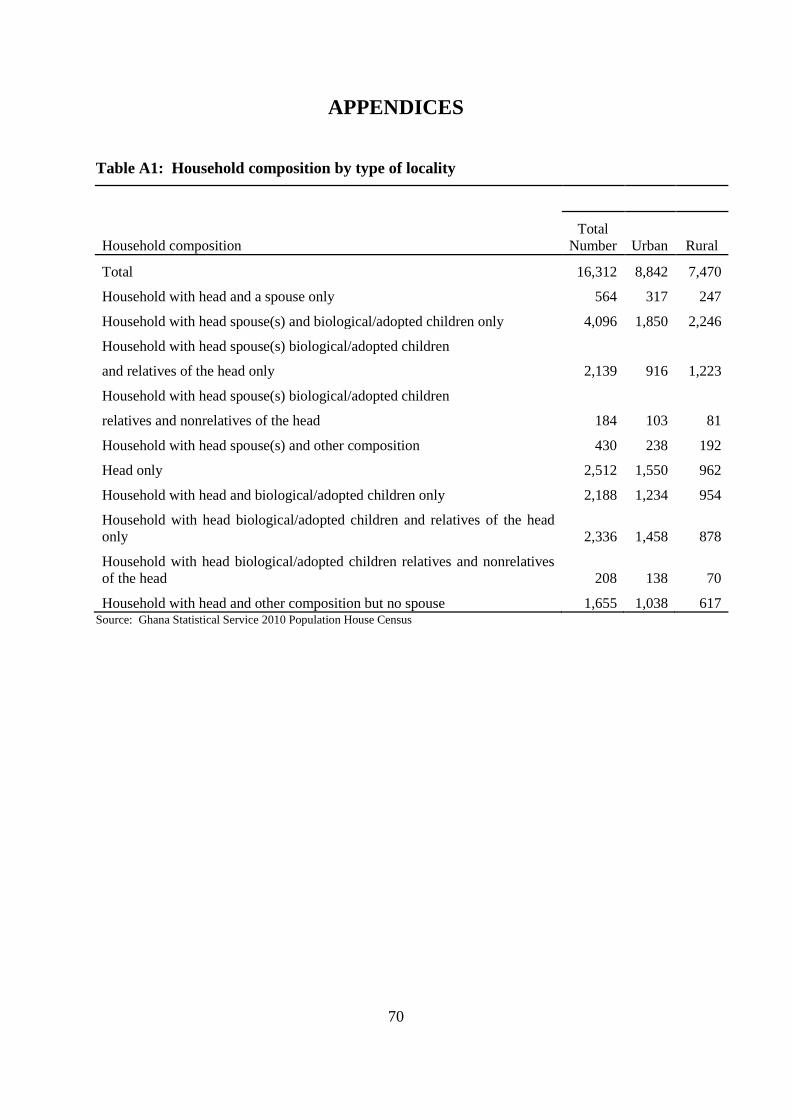
70
APPENDICES
Table A1: Household composition by type of locality
Household composition
Total
Number Urban Rural
Total 16,312 8,842 7,470
Household with head and a spouse only 564 317 247
Household with head spouse(s) and biological/adopted children only 4,096 1,850 2,246
Household with head spouse(s) biological/adopted children
2,139 916 1,223 and relatives of the head only
Household with head spouse(s) biological/adopted children
184 103 81 relatives and nonrelatives of the head
Household with head spouse(s) and other composition 430 238 192
Head only 2,512 1,550 962
Household with head and biological/adopted children only 2,188 1,234 954
Household with head biological/adopted children and relatives of the head
only 2,336 1,458 878
Household with head biological/adopted children relatives and nonrelatives
of the head 208 138 70
Household with head and other composition but no spouse 1,655 1,038 617 Source: Ghana Statistical Service 2010 Population House Census
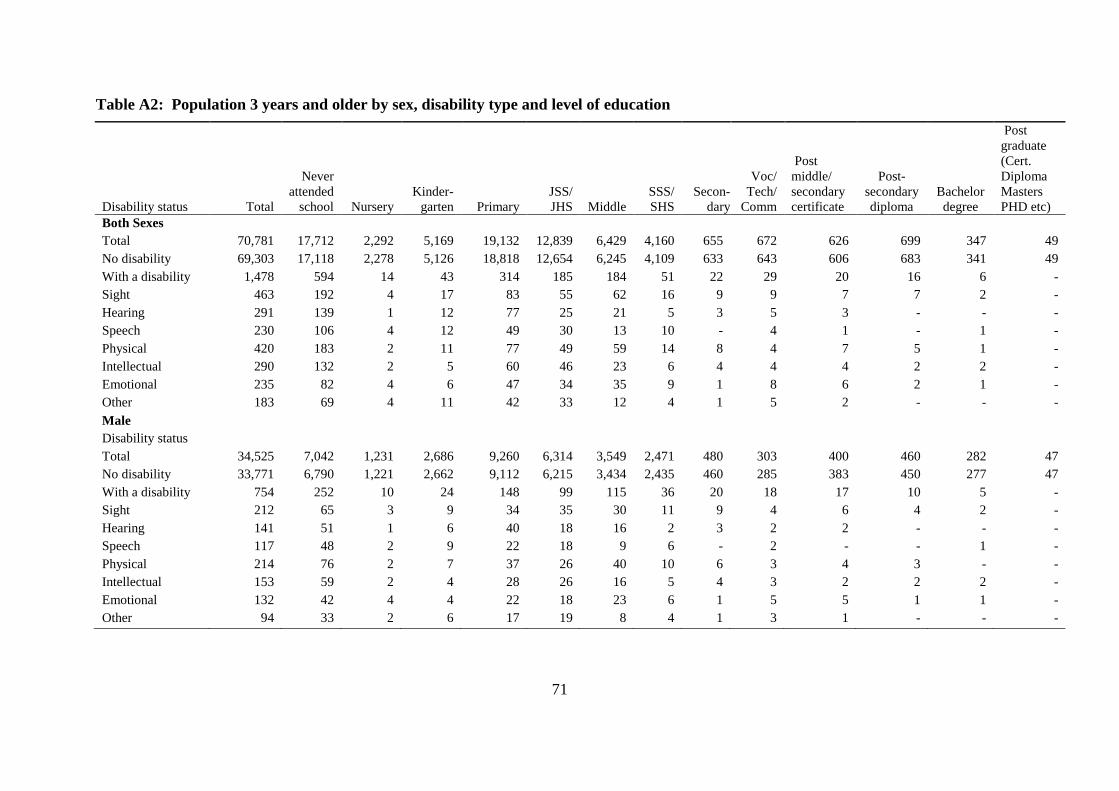
71
Table A2: Population 3 years and older by sex, disability type and level of education
Disability status Total
Never
attended
school
Nursery
Kinder-
garten Primary
JSS/
JHS
Middle
SSS/
SHS
Secon-
dary
Voc/
Tech/
Comm
Post
middle/
secondary
certificate
Post-
secondary
diploma
Bachelor
degree
Post
graduate
(Cert.
Diploma
Masters
PHD etc)
Both Sexes
Total 70,781 17,712 2,292 5,169 19,132 12,839 6,429 4,160 655 672 626 699 347 49
No disability 69,303 17,118 2,278 5,126 18,818 12,654 6,245 4,109 633 643 606 683 341 49
With a disability 1,478 594 14 43 314 185 184 51 22 29 20 16 6 -
Sight 463 192 4 17 83 55 62 16 9 9 7 7 2 -
Hearing 291 139 1 12 77 25 21 5 3 5 3 - - -
Speech 230 106 4 12 49 30 13 10 - 4 1 - 1 -
Physical 420 183 2 11 77 49 59 14 8 4 7 5 1 -
Intellectual 290 132 2 5 60 46 23 6 4 4 4 2 2 -
Emotional 235 82 4 6 47 34 35 9 1 8 6 2 1 -
Other 183 69 4 11 42 33 12 4 1 5 2 - - -
Male
Disability status
Total 34,525 7,042 1,231 2,686 9,260 6,314 3,549 2,471 480 303 400 460 282 47
No disability 33,771 6,790 1,221 2,662 9,112 6,215 3,434 2,435 460 285 383 450 277 47
With a disability 754 252 10 24 148 99 115 36 20 18 17 10 5 -
Sight 212 65 3 9 34 35 30 11 9 4 6 4 2 -
Hearing 141 51 1 6 40 18 16 2 3 2 2 - - -
Speech 117 48 2 9 22 18 9 6 - 2 - - 1 -
Physical 214 76 2 7 37 26 40 10 6 3 4 3 - -
Intellectual 153 59 2 4 28 26 16 5 4 3 2 2 2 -
Emotional 132 42 4 4 22 18 23 6 1 5 5 1 1 -
Other 94 33 2 6 17 19 8 4 1 3 1 - - -

72
Table A2: Population 3 years and older by sex, disability type and level of education (cont’d)
Disability status Total
Never
attended
school
Nursery
Kinder-
garten Primary
JSS/
JHS
Middle
SSS/
SHS
Secon-
dary
Voc/
Tech/
Comm
Post
middle/
secondary
certificate
Post-
secondary
diploma
Bachelor
degree
Post
graduate
(Cert.
Diploma
Masters
PHD etc)
Female
Disability status
Total 36,256 10,670 1,061 2,483 9,872 6,525 2,880 1,689 175 369 226 239 65 2
No disability 35,532 10,328 1,057 2,464 9,706 6,439 2,811 1,674 173 358 223 233 64 2
With a disability 724 342 4 19 166 86 69 15 2 11 3 6 1 -
Sight 251 127 1 8 49 20 32 5 - 5 1 3 - -
Hearing 150 88 - 6 37 7 5 3 - 3 1 - - -
Speech 113 58 2 3 27 12 4 4 - 2 1 - - -
Physical 206 107 - 4 40 23 19 4 2 1 3 2 1 -
Intellectual 137 73 - 1 32 20 7 1 - 1 2 - - -
Emotional 103 40 - 2 25 16 12 3 - 3 1 1 - -
Other 89 36 2 5 25 14 4 - - 2 1 - - -
Source: Ghana Statistical Service, 2010 Population and Housing Census
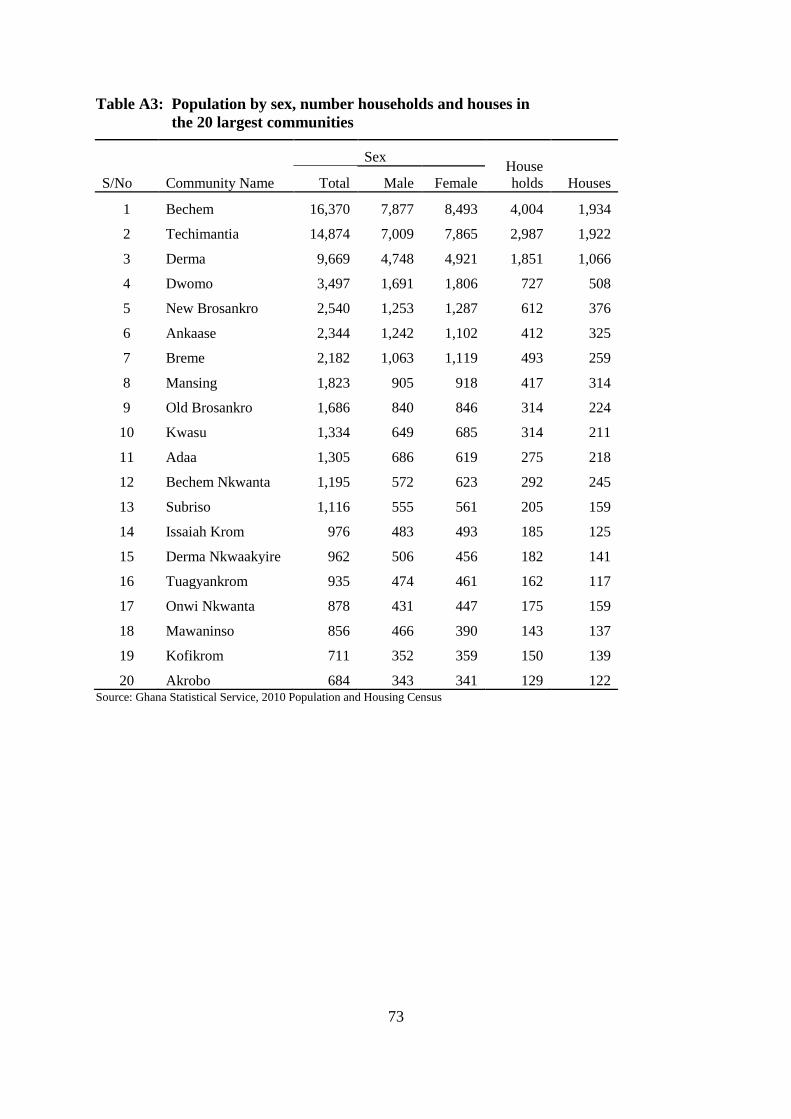
73
Table A3: Population by sex, number households and houses in
the 20 largest communities
S/No Community Name
Sex House
holds Houses Total Male Female
1 Bechem 16,370 7,877 8,493 4,004 1,934
2 Techimantia 14,874 7,009 7,865 2,987 1,922
3 Derma 9,669 4,748 4,921 1,851 1,066
4 Dwomo 3,497 1,691 1,806 727 508
5 New Brosankro 2,540 1,253 1,287 612 376
6 Ankaase 2,344 1,242 1,102 412 325
7 Breme 2,182 1,063 1,119 493 259
8 Mansing 1,823 905 918 417 314
9 Old Brosankro 1,686 840 846 314 224
10 Kwasu 1,334 649 685 314 211
11 Adaa 1,305 686 619 275 218
12 Bechem Nkwanta 1,195 572 623 292 245
13 Subriso 1,116 555 561 205 159
14 Issaiah Krom 976 483 493 185 125
15 Derma Nkwaakyire 962 506 456 182 141
16 Tuagyankrom 935 474 461 162 117
17 Onwi Nkwanta 878 431 447 175 159
18 Mawaninso 856 466 390 143 137
19 Kofikrom 711 352 359 150 139
20 Akrobo 684 343 341 129 122 Source: Ghana Statistical Service, 2010 Population and Housing Census

74
Table A4: Population by age group in the 20 largest communities
Age Group
S/No Community Name All ages 0-4 5-9 10 -14 15-19 20-24 25-29 30-34 35-39 40-44 45-49 50-54 55-59 60-64 65-69 70-74 75+
1 Bechem 16,370 2,201 2,078 2,019 1,925 1,591 1,355 1,098 887 712 578 511 390 249 177 202 397
2 Techimantia 14,874 2,065 1,909 1,881 1,627 1,245 1,062 842 838 668 537 542 388 324 205 280 461
3 Derma 9,669 1,702 1,435 1,214 943 853 809 597 528 440 285 262 128 136 70 102 165
4 Dwomo 3,497 490 497 426 419 238 195 173 191 149 178 136 88 66 51 81 119
5 New Brosankro 2,540 373 328 309 289 216 188 153 142 112 88 93 50 56 28 51 64
6 Ankaase 2,344 442 369 280 247 184 192 174 123 85 65 41 46 27 17 25 27
7 Breme 2,182 335 317 280 231 209 151 130 124 111 81 62 37 38 15 26 35
8 Mansing 1,823 244 260 218 195 119 123 129 100 95 85 76 45 38 20 36 40
9 Old Brosankro 1,686 268 286 231 182 110 98 86 93 66 87 54 25 38 14 25 23
10 Kwasu 1,334 237 200 161 117 103 90 104 82 42 35 42 33 31 15 27 15
11 Adaa 1,305 262 200 183 110 99 95 76 67 51 69 23 17 10 13 11 19
12 Bechem Nkwanta 1,195 161 162 142 150 103 100 72 77 53 60 44 25 11 8 11 16
13 Subriso 1,116 199 162 152 105 83 87 64 39 46 39 40 20 26 15 17 22
14 Issaiah Krom 976 174 135 132 88 80 82 57 65 59 23 20 9 23 5 14 10
15 Derma
Nkwaakyire 962 162 154 132 96 62 55 65 61 43 51 23 31 4 4 9 10
16 Tuagyankrom 935 158 175 146 85 55 62 66 45 42 18 17 14 11 7 14 20
17 Onwi Nkwanta 878 120 124 131 99 68 70 51 45 41 41 23 15 12 10 8 20
18 Mawaninso 856 140 132 120 71 55 68 51 62 35 30 24 24 12 8 13 11
19 Kofikrom 711 94 101 107 85 51 52 35 43 39 34 13 9 7 14 14 13
20 Akrobo 684 125 117 86 57 52 55 44 33 20 18 30 14 10 2 12 9
Source: Ghana Statistical Service, 2010 Population and Housing Census

75
LIST OF CONTRIBUTORS
Project Secretariat
Dr. Philomena Nyarko, Government Statistician
Mr. Baah Wadieh, Deputy Government Statistician
Mr. David Yenukwa Kombat, Acting Census Coordinator
Mr. Sylvester Gyamfi, DISDAP Project Coordinator
Mrs. Abena A. Osei-Akoto, Data Processing
Mr. Rochester Appiah Kubi Boateng, Data Processing
Mrs. Jacqueline Anum, Data Processing
Mrs. Samilia Mintah, Data Processing
Mr. Yaw Misefa, Data Processing
Mr. Ernest Enyan, Data Processing
Mr. Omar Seidu, Regional Statistician
Ms. Hanna Frempong Konadu, Formatting/Typesetting
Ms. Georgina Anagli, Formatting/Typesetting
Writers
Issahaka Fatimatu
Bernard Oduro
Consultant
Mr. Martin Kwasi Poku
Editor/ Reviewers
Prof. Samuel K. Gaisie
Mr. Johnson Owusu Kagya
Mr. Patrick Adzovor