tanzania - asclme project medas/meda... · tanzania is endowed with a scenic, diverse and resource...
TRANSCRIPT

T a n z a n i a
National Marine Ecosystem Diagnostic Analysis (MEDA)
Agulhas and Somali Current Large Marine Ecosystems (ASCLME) Project
ASCLME Agulhas and Somali Current
Large Marine Ecosystems Project

The GEF unites 182 countries in partnership with international institutions, non-governmental organizations (NGOs), and the private sector to address global environmental issues while supporting national sustainable development initiatives. Today the GEF is the largest public funder of projects to improve the global environment. An independently operating financial organization, the GEF provides grants for projects related to biodiversity, climate change, international waters, land degradation, the ozone layer, and persistent organic pollutants. Since 1991, GEF has achieved a strong track record with developing countries and countries with economies in transition, providing $9.2 billion in grants and leveraging $40 billion in co-financing for over 2,700 projects in over 168 countries. www.thegef.org
UNDP partners with people at all levels of society to help build nations that can withstand crisis, and drive and sustain the kind of growth that improves the quality of life for everyone. On the ground in 177 countries and territories, we offer global perspective and local insight to help empower lives and build resilient nations. www.undp.org
This document may be cited as: ASCLME 2012. National Marine Ecosystem Diagnostic Analysis. Tanzania. Contribution to the Agulhas and Somali Current Large Marine Ecosystems Project (supported by UNDP with GEF grant financing). Unpublished report.
The views expressed in this publication may not necessarily reflect those of the GEF, UNDP, or other UN agencies or project partner institutions/organisations. Neither does it imply any opinion whatsoever as to the legal status of any country, territory, city or area, of its authorities, or of the delineation of its territories or boundaries.

4
Table of Contents
Table of ContentsExecutive Summary . . . . . . . . . . . . . . . . . . . . . . . . . . . . . . . . . . . . . . . . . . . . . . . . . . . . . . . . . . . . . . . . . . .6
Acknowledgements . . . . . . . . . . . . . . . . . . . . . . . . . . . . . . . . . . . . . . . . . . . . . . . . . . . . . . . . . . . . . . . . . .7
Contributing Institutions . . . . . . . . . . . . . . . . . . . . . . . . . . . . . . . . . . . . . . . . . . . . . . . . . . . . . . . . . . . . . .8
List of Acronyms . . . . . . . . . . . . . . . . . . . . . . . . . . . . . . . . . . . . . . . . . . . . . . . . . . . . . . . . . . . . . . . . . . . . . .9
1 . COUNTRY OVERVIEW . . . . . . . . . . . . . . . . . . . . . . . . . . . . . . . . . . . . . . . . . . . . . . . . . . . . . . . . . . . . . 11
2 . BIOPHYSICAL ENVIRONMENT . . . . . . . . . . . . . . . . . . . . . . . . . . . . . . . . . . . . . . . . . . . . . . . . . . . . . 142.1 Description of the coast and distinctive features ......................................................................................................... 142.2 Climate ..................................................................................................................................................................... 172.3 Marine and coastal geology and geomorphology ........................................................................................................ 182.4 Fresh water resources and drainage ........................................................................................................................... 21Physical Oceanography ................................................................................................................................................... 25Currents ......................................................................................................................................................................... 25Tidal regime and waves .................................................................................................................................................. 26
Tidal ranges ........................................................................................................................................................................................................................... 26Wave patterns ....................................................................................................................................................................................................................... 26
Sea level change ............................................................................................................................................................. 27Ocean temperature......................................................................................................................................................... 27
Sea Surface Temperature (SST) .............................................................................................................................................................................................. 27
Salinity patterns ............................................................................................................................................................ 28Water masses of the Tanzanian coast .................................................................................................................................................................................... 28
Ocean-atmosphere interaction ........................................................................................................................................ 28Chemical and Biological Oceanography ............................................................................................................................ 29
Nutrients .............................................................................................................................................................................................................................. 29Persistent organic pollutants ................................................................................................................................................................................................ 30Primary production .............................................................................................................................................................................................................. 30Secondary production ........................................................................................................................................................................................................... 31
Coastal Zone and Continental Shelf.................................................................................................................................. 31Description and extent of coastal and marine habitats .......................................................................................................................................................... 31Coral reefs ............................................................................................................................................................................................................................. 31Mangroves ............................................................................................................................................................................................................................ 32Seagrass beds ........................................................................................................................................................................................................................ 32
Productivity of the Coastal zone ...................................................................................................................................... 33Coral reefs ............................................................................................................................................................................................................................. 33Mangroves ............................................................................................................................................................................................................................ 33Seagrass beds ........................................................................................................................................................................................................................ 34
Microfauna and meiofauna ............................................................................................................................................ 35Meiofauna status in Marine Ecosystems of Tanzania ............................................................................................................................................................. 35Microfauna status in the Marine Ecosystems of Tanzania....................................................................................................................................................... 35Macrofauna .......................................................................................................................................................................................................................... 36
Invertebrates ................................................................................................................................................................ 37Prawns/shrimps .................................................................................................................................................................................................................... 37Artisanal Fisheries Landings .................................................................................................................................................................................................. 38Stock Assessments ................................................................................................................................................................................................................ 38Lobsters ................................................................................................................................................................................................................................. 39Cephalopods ......................................................................................................................................................................................................................... 39Squid and Cuttlefish .............................................................................................................................................................................................................. 41Sea cucumbers ...................................................................................................................................................................................................................... 41Shells .................................................................................................................................................................................................................................... 43II) Gap ................................................................................................................................................................................................................................... 43Fish and fish resources ........................................................................................................................................................................................................... 43

5
Table of Contents
The Coelacanth ...................................................................................................................................................................................................................... 45Regional issues (shared by neighbouring countries) ............................................................................................................................................................. 45Mammals .............................................................................................................................................................................................................................. 46Reptiles ................................................................................................................................................................................................................................. 47Birds ...................................................................................................................................................................................................................................... 50Exotic and Invasive Species .................................................................................................................................................................................................... 50
Long term predicted atmospheric changes ....................................................................................................................... 51Air temperature and rainfall .................................................................................................................................................................................................. 51Wind patterns ....................................................................................................................................................................................................................... 51Extreme events ..................................................................................................................................................................................................................... 51
HUMAN ENVIRONMENT . . . . . . . . . . . . . . . . . . . . . . . . . . . . . . . . . . . . . . . . . . . . . . . . . . . . . . . . . . . . . 52Coastal and island populations ............................................................................................................................................................................................. 52Cultural diversity ................................................................................................................................................................................................................... 52Age and gender structure ..................................................................................................................................................................................................... 52Sites of religious or cultural significance ................................................................................................................................................................................ 53Health situation and health service delivery ......................................................................................................................................................................... 54Infrastructure ........................................................................................................................................................................................................................ 56Harbours ............................................................................................................................................................................................................................... 57Airports ................................................................................................................................................................................................................................. 57Energy ................................................................................................................................................................................................................................... 57i) Issues ................................................................................................................................................................................................................................. 57
4 . COASTAL LIVELIHOODS . . . . . . . . . . . . . . . . . . . . . . . . . . . . . . . . . . . . . . . . . . . . . . . . . . . . . . . . . . . 584.1 Small-Scale Fisheries ................................................................................................................................................. 584.2 Tourism. ................................................................................................................................................................... 584.3 Mariculture ............................................................................................................................................................... 594.4 Agriculture and Forestry ............................................................................................................................................ 594.5 Energy ...................................................................................................................................................................... 604.6 Ports and Coastal Transport ....................................................................................................................................... 604.7 Coastal Mining .......................................................................................................................................................... 61Conclusions .................................................................................................................................................................... 61
5 . POLICY AND GOVERNANCE . . . . . . . . . . . . . . . . . . . . . . . . . . . . . . . . . . . . . . . . . . . . . . . . . . . . . . . 63
6 . PLANNING AND MANAGEMENT . . . . . . . . . . . . . . . . . . . . . . . . . . . . . . . . . . . . . . . . . . . . . . . . . . . 64National Disaster Management Plans .............................................................................................................................. 64ii) Gaps .......................................................................................................................................................................... 64Environmental Sensitivity Mapping ................................................................................................................................. 65Coastal Management/Development Plans ........................................................................................................................ 65Areas under special management .................................................................................................................................... 66
Marine Protected Areas ......................................................................................................................................................................................................... 66Marine Managed Areas ......................................................................................................................................................................................................... 66Monitoring, Control and Surveillance .................................................................................................................................................................................... 67
Cost-Benefit Analysis . . . . . . . . . . . . . . . . . . . . . . . . . . . . . . . . . . . . . . . . . . . . . . . . . . . . . . . . . . . . . . . 69Coastal Agriculture and Forestry ...................................................................................................................................... 72
Coastal Agriculture ............................................................................................................................................................................................................... 72Coastal Forestry ..................................................................................................................................................................................................................... 72Value of critical ecosystems ................................................................................................................................................................................................... 73Tourism ................................................................................................................................................................................................................................. 73Ports and Harbours ................................................................................................................................................................................................................ 74Coastal Mining ...................................................................................................................................................................................................................... 74Coastal Resources and Poverty Alleviation ............................................................................................................................................................................ 75
REFERENCES . . . . . . . . . . . . . . . . . . . . . . . . . . . . . . . . . . . . . . . . . . . . . . . . . . . . . . . . . . . . . . . . . . . . . . . 76

6
Table of Contents
ANNEXES
I Extended bibliographyII. Metadata recordsIII. Capacity building and training review and work programmeIV. Areas of Concern (extracted from each of the MEDA chapters)V. Policy and Governance ReportVI. Requirements for data collection, analysis (processing/modeling/integration) or repatriation to inform the national MEDA.VII. National projects recently undertaken or currently underway which are relevant to the ASCLME MEDA, TDA or SAP. VIII. Official designation of territorial waters; other statutes relating to marine governance.IX. National Data and Information Management PlanX. DLIST summary reportXI. National Local Economic Development Plan (DLIST) XII. Coastal Livelihoods Assessment ReportXIII Inshore Oceanographic Monitoring PlanXIV. National Causal Chain Analysis Report

7
Executive Summary
Executive Summary
Tanzania is located on the East coast of Africa, bordering the Indian Ocean, and lies between Kenya to the north and Mozambique to the south. Its total area is 945,087 km2 and this includes the islands of Mafia, Pemba and Zanzibar. Water covers 59,050 km2 of this area and the coastline along the Indian Ocean is 1,424 km. The population of the country is 40 million with a growth rate of 2.6%. The economy is largely dependent on agriculture, which accounts for about 48% of the GDP.
Tanzania is endowed with a scenic, diverse and resource rich coastal area. This strip of land and water supports a diversity of important natural systems, including coral reefs, beaches, estuaries, sea grass beds and extensive mangrove stands. Tanzania’s coastal and marine ecosystems cover the mainland coast, three major islands (Pemba, Unguja, and Mafia) all of which are less than 100 km offshore, numerous small near-shore islands and islets and one oceanic island, Latham Island. The continental shelf covers an estimated 17,500 – 17,900 km2.
Demersal fish species dominates marine catches with a total catch of 22,290 tons compared to a pelagic catch of 14,014 tons. The main commercial marine species are sardine and anchovy, which together form 30 - 50 percent of total fish landings. The artisanal marine fishery sub-sector employs more than 29,754 full time fishers, using about 7,190 relatively small fishing canoes (Fisheries Division, 1992).
The majority of the coastal communities rely on coastal resources for their livelihood. The coast is of immense strategic importance to many social and economic sectors such as shipping, fishing, tourism, trade, agriculture, settlements and industrial developments. Recently, Tanzania has experienced a significant increase in coastal tourism, mariculture development and natural gas exploitation. Livelihood opportunities for people living along the Tanzanian coastline are changing; coastal areas are experiencing rapidly expanding population, putting increasing pressure on limited resources. As farming employment optiosn decline as a result of lack of financial assistance in the agricultural sector, more people are forced to depend on the easy and very common pool of coastal resources, such as forests, fisheries,coastal land areas, swamps, mangroves and coral reefs. The productivity of these resources is in decline as the environmental carrying capacity decreases due to increased coastal pollution, depletion of fish stocks and coastal resources, extinction of species overall decline in water quality.
The coast’s untapped potential must be harnessed, but it must be done with the appropriate safeguards that link growth to wise management. The pressures on these resources will grow and, like other countries faced with an expanding population, are at risk of collapse. People’s quality of life, which is inextricably tied to the resource base, will continue to decline unless development moves hand in hand with local goals and aspirations.
8
Acknowledgements
Acknowledgements
We would like to express our sincere gratitude to the Government of the United Republic of Tanzania and the Revolutionary Government of Zanzibar for supporting this initiative and efforts both in kind and materially throughout from the start to the end. The Government of the United Republic of Tanzania through its Ministry of Livestock Development and Fisheries; the University of Dar es Salaam through its Colleges of Natural and Applied Sciences (CoNAS) and Arts and Social Sciences (CASS), and the Institute of Marine Sciences (IMS); the Tanzania Fisheries Research Institute (TAFIRI); and the National Environment Management Council (NEMC) are thanked for providing and supporting the experts who prepared this document. The NEMC, the Focal Institution for the ASCLME project in Tanzania, is highly thanked for providing administrative guidance and support of the MEDA process in close collaboration with the IMS which was coordinating the process. The local stakeholders played a key role in guiding the coverage of contents of the document through the several national workshops that were organized. Several regional and international experts provided assistance in the preparation of the Tanzania Marine Ecosystem Diagnostic Analysis (MEDA). Finally, we would also like to thank all who assisted the experts who prepared this document in one way or another including providing them with the relevant data and or information. These include scientists, researchers, stakeholders, local communities, Non-Governmental Institutions (NGOs), Institutions and many others.The MEDA is a national contribution to the multinational Transboundary Diagnostic Analyses (TDA) - Strategic Action Programme (SAP) process, and was funded and supported by the Agulhas and Somali Current Large Marine Ecosystems Project (which is funded by the Global Environment Facility and implemented by the United Nations Development Programme).
The ASCLME Project Coordination Unit is thanked for ongoing support of the MEDA process. The Western Indian Ocean Marine Science Association (WIOMSA) and the Forum for Heads of Marine Related Institutions (FARI) are thanked for coordinating the peer review process,

9
Contributing Institutions
Contributing Institutions
s/n EXPERT NAME Institution
1 Dr Razack B LOKINA
University of Dar es Salaam
College of Arts and Social Sciences (CASS)
Department of Economics
P.O. Box 35045
Dar es Salaam
2 Dr Yohanna W SHAGHUDE
University of Dar es Salaam
Institute of Marine Sciences (IMS)
P.O. Box 668
Zanzibar
3 Mr Shigalla MAHONGO
Tanzania Fisheries Research Institute (TAFIRI)
P.O. Box 9750
Dar es Salaam
4 Dr Sadri A SAID
University of Dar es Salaam
Institute of Marine Sciences (IMS)
P.O. Box 668
Zanzibar
5 Dr Vedast M MAKOTA
National Environment Management Council (NEMC)
Regent Estate Plot No. 29/30
P.O. Box 63154
Dar es Salaam
6 Dr Daniel A SHILLA
University of Dar es Salaam
College of Natural and Applied Sciences (CoNAS)
Department of Aquatic Sciences and Fisheries
P.O. Box 35064
Dar es Salaam
7 Mr Winfried V HAULE
Ministry of Livestock Development and Fisheries
Fisheries Division
PO Box 9152
Dar es Salaam
The work was coordinated by:
Prof. Dr. Desiderius C.P MASALUNational Data and Information Coordinator (ASCLME)University of Dar es SalaamInstitute of Marine Sciences (IMS)P.O. Box 668Zanzibar

10
List of Acronyms
List of Acronyms
ACEP: African Coelacanth Ecosystem ProgrameASCLME: Agulhas and Somali Current Large Marine Ecosystems CBO: Community Based OrganisationCORDIO: Coastal Oceans Research and Development in the Indian Ocean DLIST: Distance Learning Information Sharing ToolDoF: Department of FisheriesEEZ: Exclusive Economic ZoneEIA: Environmental Impact AssessmentENSO: El Nino / La Nina Southern Oscillation FAO: Food and Agriculture OrganizationGDP: Gross Domestic ProductGIS: Geographic Information SystemGMDSS: Global Maritime Distress Signalling SystemGPA: Global Programme of Action for Protection of Marine EnvironmentGOOS: Global Ocean Observing SystemGTS: Global Telecommunications SystemHABs: Harmful Algal Blooms HEP: Hydro-Electric PowerIBAs: Important Bird AreasICZM: Integrated Coastal Zone ManagementISSG: Invasive Species Specialist GroupIOC-UNESCO: Inter-Governmental Oceanographic Commission of UNESCOIOD: Indian Ocean DipoleIOTWS: Indian Ocean Tsunami Warning System ITCZ: Inter-Tropical Convergence ZoneIUCN: The World Conservation UnionJMA: Japan Meteorological AgencyMACEMP: Marine and Coastal Area Environmental Management Project TAFIRI: Tanzania Fisheries Research InstituteTCMP: Tanzania Coastal Management PartnershipTIO: Tanzania Indian OceanTPA: Tanzania Ports AuthorityTMA: Tanzania Meteorological AgencyMPAs: Marine Protected AreasMCS: Monitoring, Control and Surveillance NEMC: National Environmental Management CouncilNGO: Non-Governmental OrganisationNPA: National Programme of ActionNORAD: Norwegian Agency for International Development PSU: Practical Salinity UnitsPTWC: Pacific Tsunami Warning CenterPOPs: Persistent Organic PollutantsSADC: Southern Africa Development CommunitySST: Sea Surface TemperatureSWIOFP: World Bank-GEF South-West Indian Ocean Fisheries ProjectSWOT: Analysis of Strengths, Weaknesses, Opportunities and ThreatsUNDP: United Nations Development ProgrammeUNEP: United Nations Environment ProgrammeUNESCO: United Nations Educational, Scientific and Cultural OrganisationURT: United Republic of TanzaniaUSAID: United States Agency for International DevelopmentUSD: United States DollarVTMS: Vessel Tracking Management System

11
List of Acronyms
WCS: World Conservation SocietyWHO: World Health OrganizationWIO-LaB: UNEP-GEF Project Addressing Land-Based Sources and Activities in the WIOWIO: Western Indian OceanWWF-EAME: World Wildlife Fund – Eastern Africa Marine Ecoregion
12
1. COUNTRY OVERVIEW
1 . COUNTRY OVERVIEW
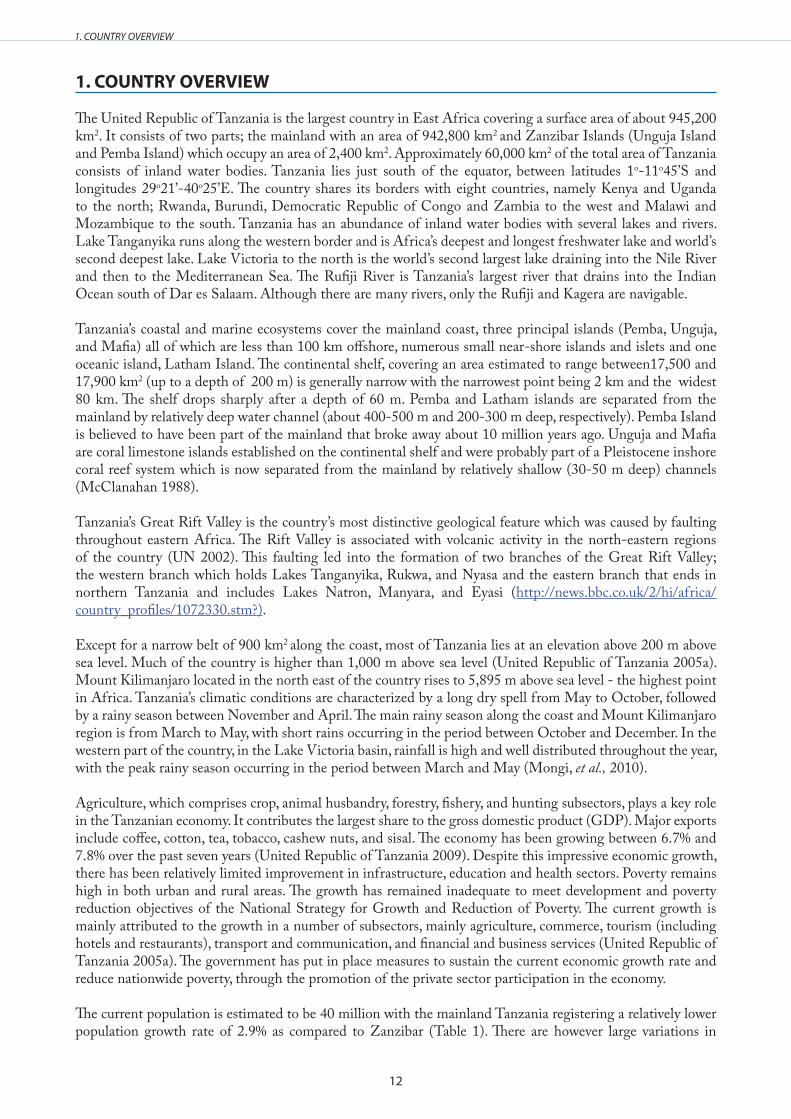
The United Republic of Tanzania is the largest country in East Africa covering a surface area of about 945,200 km2. It consists of two parts; the mainland with an area of 942,800 km2 and Zanzibar Islands (Unguja Island and Pemba Island) which occupy an area of 2,400 km2. Approximately 60,000 km2 of the total area of Tanzania consists of inland water bodies. Tanzania lies just south of the equator, between latitudes 1o-11o45’S and longitudes 29o21’-40o25’E. The country shares its borders with eight countries, namely Kenya and Uganda to the north; Rwanda, Burundi, Democratic Republic of Congo and Zambia to the west and Malawi and Mozambique to the south. Tanzania has an abundance of inland water bodies with several lakes and rivers. Lake Tanganyika runs along the western border and is Africa’s deepest and longest freshwater lake and world’s second deepest lake. Lake Victoria to the north is the world’s second largest lake draining into the Nile River and then to the Mediterranean Sea. The Rufiji River is Tanzania’s largest river that drains into the Indian Ocean south of Dar es Salaam. Although there are many rivers, only the Rufiji and Kagera are navigable.
Tanzania’s coastal and marine ecosystems cover the mainland coast, three principal islands (Pemba, Unguja, and Mafia) all of which are less than 100 km offshore, numerous small near-shore islands and islets and one oceanic island, Latham Island. The continental shelf, covering an area estimated to range between17,500 and 17,900 km2 (up to a depth of 200 m) is generally narrow with the narrowest point being 2 km and the widest 80 km. The shelf drops sharply after a depth of 60 m. Pemba and Latham islands are separated from the mainland by relatively deep water channel (about 400-500 m and 200-300 m deep, respectively). Pemba Island is believed to have been part of the mainland that broke away about 10 million years ago. Unguja and Mafia are coral limestone islands established on the continental shelf and were probably part of a Pleistocene inshore coral reef system which is now separated from the mainland by relatively shallow (30-50 m deep) channels (McClanahan 1988).
Tanzania’s Great Rift Valley is the country’s most distinctive geological feature which was caused by faulting throughout eastern Africa. The Rift Valley is associated with volcanic activity in the north-eastern regions of the country (UN 2002). This faulting led into the formation of two branches of the Great Rift Valley; the western branch which holds Lakes Tanganyika, Rukwa, and Nyasa and the eastern branch that ends in northern Tanzania and includes Lakes Natron, Manyara, and Eyasi (http://news.bbc.co.uk/2/hi/africa/country_profiles/1072330.stm?).
Except for a narrow belt of 900 km2 along the coast, most of Tanzania lies at an elevation above 200 m above sea level. Much of the country is higher than 1,000 m above sea level (United Republic of Tanzania 2005a). Mount Kilimanjaro located in the north east of the country rises to 5,895 m above sea level - the highest point in Africa. Tanzania’s climatic conditions are characterized by a long dry spell from May to October, followed by a rainy season between November and April. The main rainy season along the coast and Mount Kilimanjaro region is from March to May, with short rains occurring in the period between October and December. In the western part of the country, in the Lake Victoria basin, rainfall is high and well distributed throughout the year, with the peak rainy season occurring in the period between March and May (Mongi, et al., 2010).
Agriculture, which comprises crop, animal husbandry, forestry, fishery, and hunting subsectors, plays a key role in the Tanzanian economy. It contributes the largest share to the gross domestic product (GDP). Major exports include coffee, cotton, tea, tobacco, cashew nuts, and sisal. The economy has been growing between 6.7% and 7.8% over the past seven years (United Republic of Tanzania 2009). Despite this impressive economic growth, there has been relatively limited improvement in infrastructure, education and health sectors. Poverty remains high in both urban and rural areas. The growth has remained inadequate to meet development and poverty reduction objectives of the National Strategy for Growth and Reduction of Poverty. The current growth is mainly attributed to the growth in a number of subsectors, mainly agriculture, commerce, tourism (including hotels and restaurants), transport and communication, and financial and business services (United Republic of Tanzania 2005a). The government has put in place measures to sustain the current economic growth rate and reduce nationwide poverty, through the promotion of the private sector participation in the economy.
The current population is estimated to be 40 million with the mainland Tanzania registering a relatively lower population growth rate of 2.9% as compared to Zanzibar (Table 1). There are however large variations in
13
1. COUNTRY OVERVIEW
population growth rate from one region to another (United Republic of Tanzania 2006a). About 51% of the regions in Tanzania have their population growing at a rate above 2.5% per annum and about 71% of the regions have their population growing at a rate above 2% per annum (Figure 1).
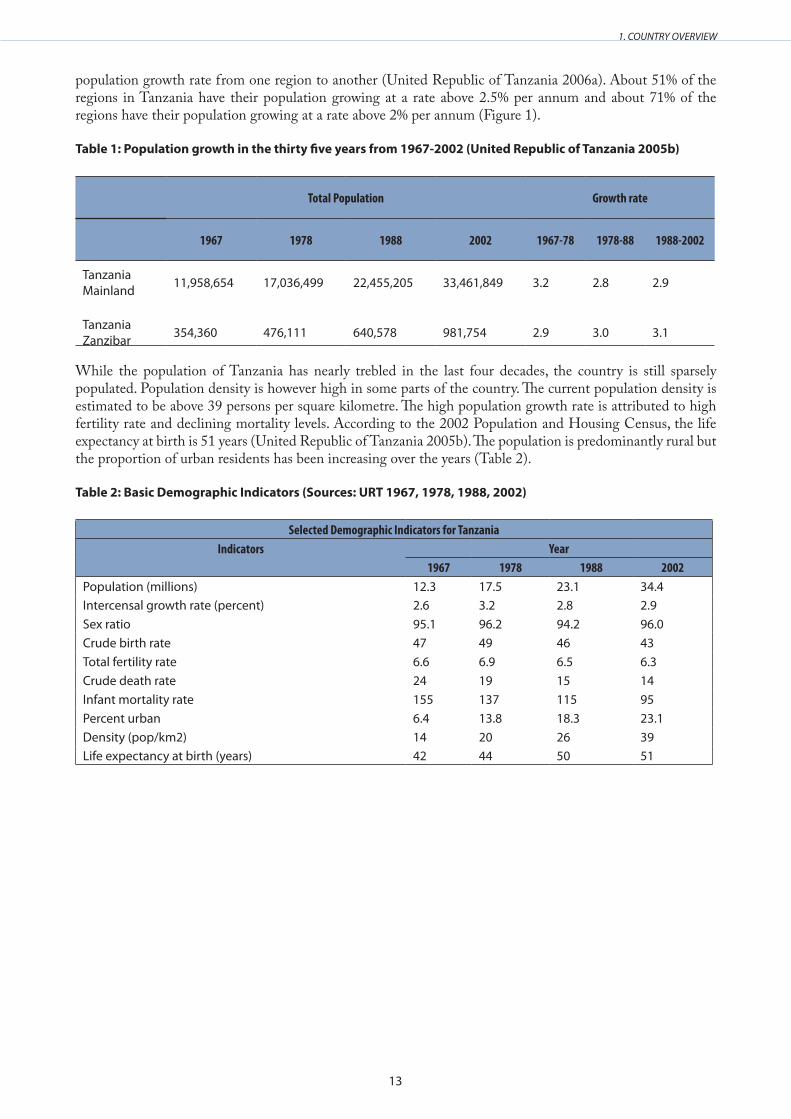
Table 1: Population growth in the thirty five years from 1967-2002 (United Republic of Tanzania 2005b)
Total Population Growth rate
1967 1978 1988 2002 1967-78 1978-88 1988-2002
Tanzania Mainland 11,958,654 17,036,499 22,455,205 33,461,849 3.2 2.8 2.9
Tanzania Zanzibar 354,360 476,111 640,578 981,754 2.9 3.0 3.1
While the population of Tanzania has nearly trebled in the last four decades, the country is still sparsely populated. Population density is however high in some parts of the country. The current population density is estimated to be above 39 persons per square kilometre. The high population growth rate is attributed to high fertility rate and declining mortality levels. According to the 2002 Population and Housing Census, the life expectancy at birth is 51 years (United Republic of Tanzania 2005b). The population is predominantly rural but the proportion of urban residents has been increasing over the years (Table 2).
Table 2: Basic Demographic Indicators (Sources: URT 1967, 1978, 1988, 2002)
Selected Demographic Indicators for TanzaniaIndicators Year
1967 1978 1988 2002Population (millions) 12.3 17.5 23.1 34.4Intercensal growth rate (percent) 2.6 3.2 2.8 2.9Sex ratio 95.1 96.2 94.2 96.0Crude birth rate 47 49 46 43Total fertility rate 6.6 6.9 6.5 6.3Crude death rate 24 19 15 14Infant mortality rate 155 137 115 95Percent urban 6.4 13.8 18.3 23.1Density (pop/km2) 14 20 26 39Life expectancy at birth (years) 42 44 50 51

14
1. COUNTRY OVERVIEW
Figure 1: The grouping of population growth rates in regions of Tanzania (URT 2006a)
15
2. BIOPHYSICAL ENVIRONMENT
2 . BIOPHYSICAL ENVIRONMENT
2 .1 Description of the coast and distinctive features
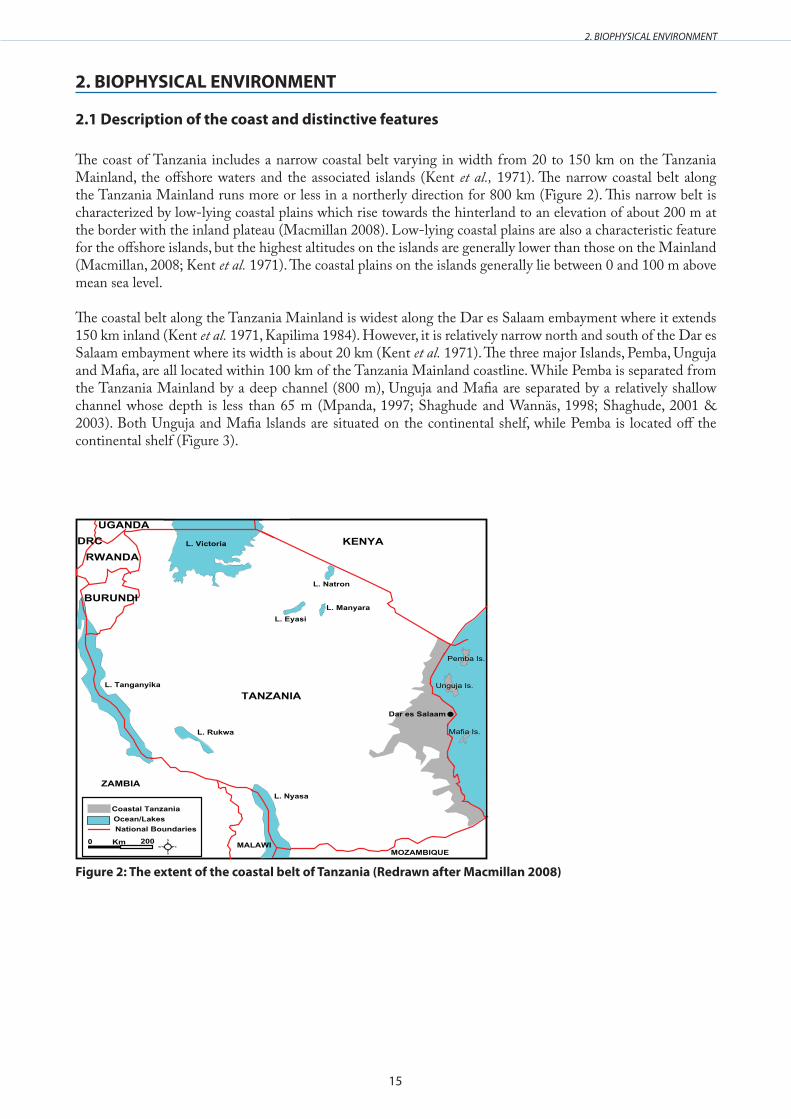
The coast of Tanzania includes a narrow coastal belt varying in width from 20 to 150 km on the Tanzania Mainland, the offshore waters and the associated islands (Kent et al., 1971). The narrow coastal belt along the Tanzania Mainland runs more or less in a northerly direction for 800 km (Figure 2). This narrow belt is characterized by low-lying coastal plains which rise towards the hinterland to an elevation of about 200 m at the border with the inland plateau (Macmillan 2008). Low-lying coastal plains are also a characteristic feature for the offshore islands, but the highest altitudes on the islands are generally lower than those on the Mainland (Macmillan, 2008; Kent et al. 1971). The coastal plains on the islands generally lie between 0 and 100 m above mean sea level.
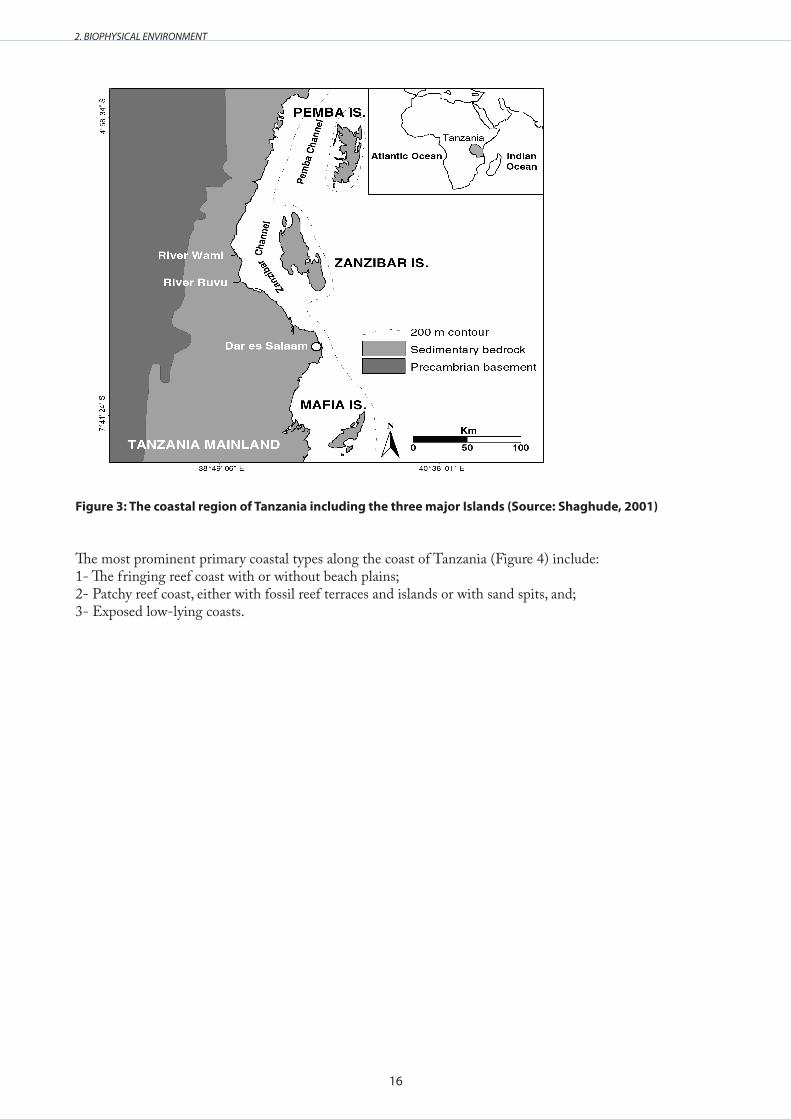
The coastal belt along the Tanzania Mainland is widest along the Dar es Salaam embayment where it extends 150 km inland (Kent et al. 1971, Kapilima 1984). However, it is relatively narrow north and south of the Dar es Salaam embayment where its width is about 20 km (Kent et al. 1971). The three major Islands, Pemba, Unguja and Mafia, are all located within 100 km of the Tanzania Mainland coastline. While Pemba is separated from the Tanzania Mainland by a deep channel (800 m), Unguja and Mafia are separated by a relatively shallow channel whose depth is less than 65 m (Mpanda, 1997; Shaghude and Wannäs, 1998; Shaghude, 2001 & 2003). Both Unguja and Mafia lslands are situated on the continental shelf, while Pemba is located off the continental shelf (Figure 3).
TANZANIA
KENYAUGANDA
RWANDA
BURUNDIL. Manyara
L. Eyasi
L. Natron
0 200Km
L. Rukwa
ZAMBIA
MALAWI
L. Tanganyika
Pemba Is.
Unguja Is.
Mafia Is.
L. VictoriaDRC
National BoundariesOcean/LakesCoastal Tanzania
L. Nyasa
MOZAMBIQUE
Dar es Salaam
Figure 2: The extent of the coastal belt of Tanzania (Redrawn after Macmillan 2008)
16
2. BIOPHYSICAL ENVIRONMENT
Figure 3: The coastal region of Tanzania including the three major Islands (Source: Shaghude, 2001)
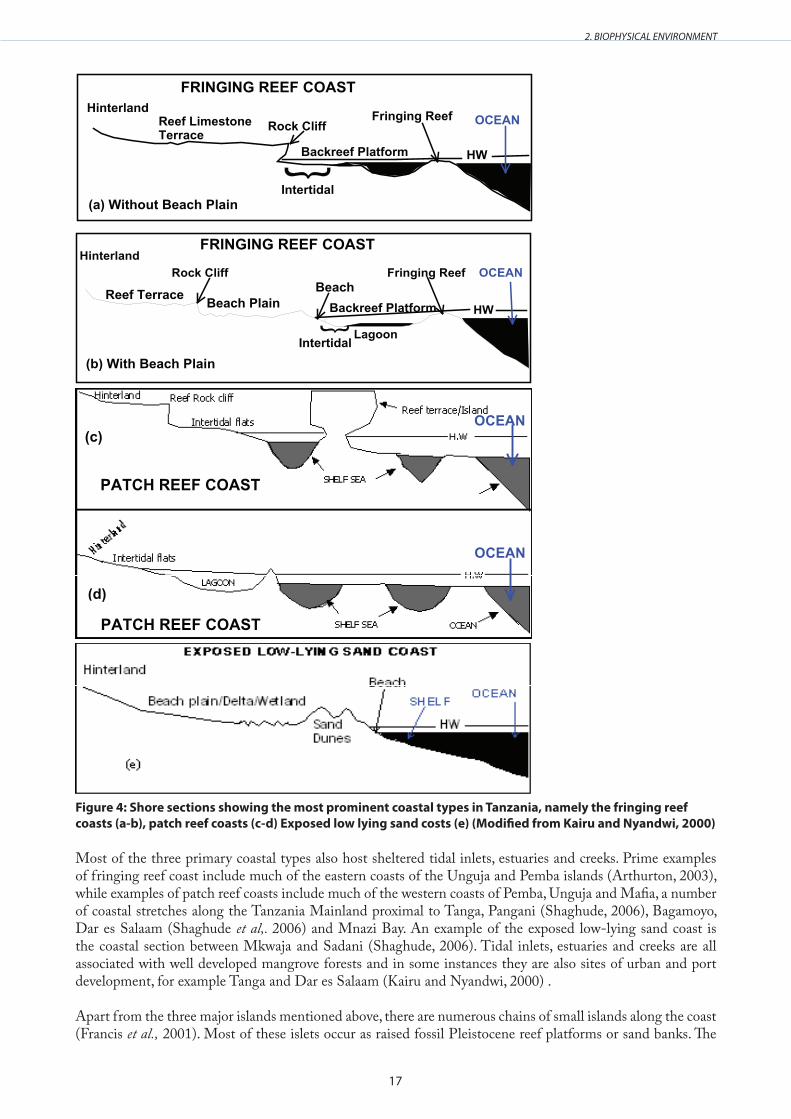
The most prominent primary coastal types along the coast of Tanzania (Figure 4) include:1- The fringing reef coast with or without beach plains; 2- Patchy reef coast, either with fossil reef terraces and islands or with sand spits, and; 3- Exposed low-lying coasts.
17
2. BIOPHYSICAL ENVIRONMENT
HW
OCEANFringing Reef
Backreef Platform
Intertidal
Rock CliffReef Limestone Terrace
HinterlandFRINGING REEF COAST
(a) Without Beach Plain
HWBeach PlainBeach
Lagoon
Fringing Reef OCEANRock Cliff
Reef Terrace
HinterlandFRINGING REEF COAST
(b) With Beach Plain
Backreef Platform
Intertidal
(c)
(d)
OCEAN
OCEAN
PATCH REEF COAST
PATCH REEF COAST
Figure 4: Shore sections showing the most prominent coastal types in Tanzania, namely the fringing reef coasts (a-b), patch reef coasts (c-d) Exposed low lying sand costs (e) (Modified from Kairu and Nyandwi, 2000)
Most of the three primary coastal types also host sheltered tidal inlets, estuaries and creeks. Prime examples of fringing reef coast include much of the eastern coasts of the Unguja and Pemba islands (Arthurton, 2003), while examples of patch reef coasts include much of the western coasts of Pemba, Unguja and Mafia, a number of coastal stretches along the Tanzania Mainland proximal to Tanga, Pangani (Shaghude, 2006), Bagamoyo, Dar es Salaam (Shaghude et al,. 2006) and Mnazi Bay. An example of the exposed low-lying sand coast is the coastal section between Mkwaja and Sadani (Shaghude, 2006). Tidal inlets, estuaries and creeks are all associated with well developed mangrove forests and in some instances they are also sites of urban and port development, for example Tanga and Dar es Salaam (Kairu and Nyandwi, 2000) .
Apart from the three major islands mentioned above, there are numerous chains of small islands along the coast (Francis et al., 2001). Most of these islets occur as raised fossil Pleistocene reef platforms or sand banks. The
18
2. BIOPHYSICAL ENVIRONMENT
typical examples include Tumbatu, Changuu, Bawe, Chapwani, Chumbe, Latham and Mnemba (off Unguja Island), Bongoyo, Mbudya, Pangavini, Fungu Yasin, and Makatumbe of the Dar es Salaam Marine Reserve (Wagner, 2007). Some of the islets such as Tumbatu are large enough to support human settlements but others are either too small or lack freshwater resources necessary for supporting human settlements (Francis et al,. 2001). However, most of these islets are of significant ecological and socio-economic importance, supporting terrestrial vegetation and fauna as well as providing recreational services for tourists and temporary homes for fishermen.
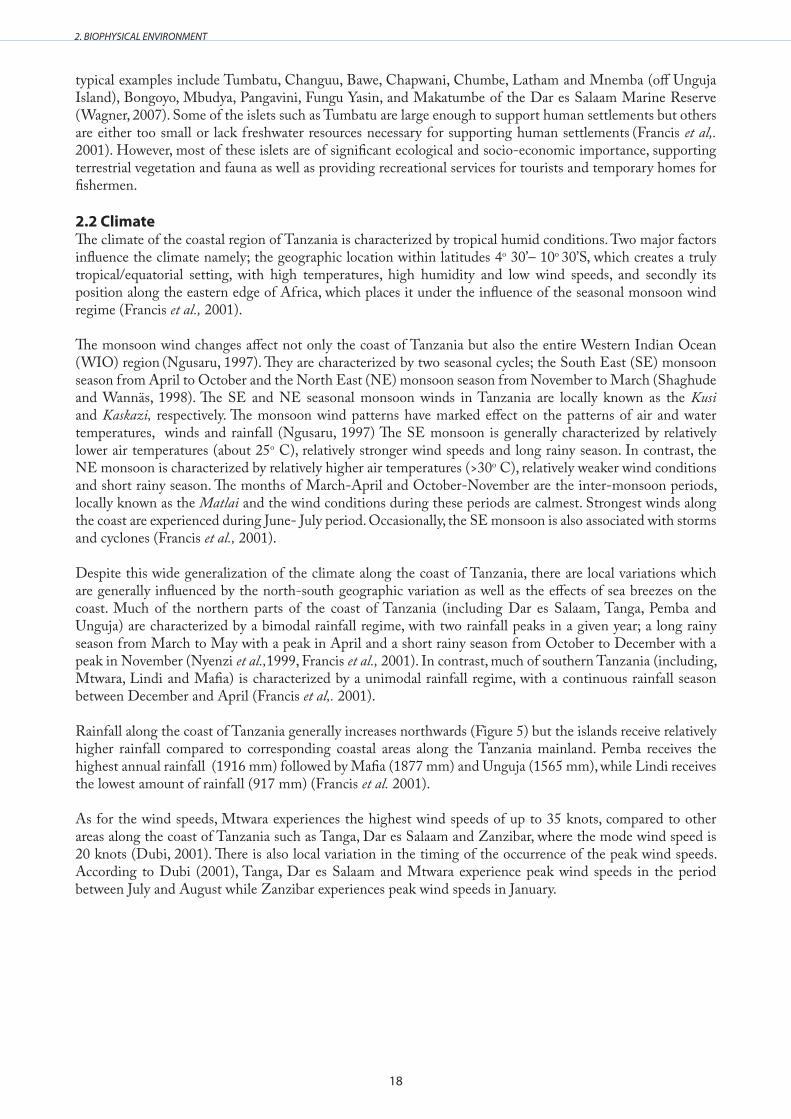
2 .2 ClimateThe climate of the coastal region of Tanzania is characterized by tropical humid conditions. Two major factors influence the climate namely; the geographic location within latitudes 4o 30’– 10o 30’S, which creates a truly tropical/equatorial setting, with high temperatures, high humidity and low wind speeds, and secondly its position along the eastern edge of Africa, which places it under the influence of the seasonal monsoon wind regime (Francis et al., 2001).
The monsoon wind changes affect not only the coast of Tanzania but also the entire Western Indian Ocean (WIO) region (Ngusaru, 1997). They are characterized by two seasonal cycles; the South East (SE) monsoon season from April to October and the North East (NE) monsoon season from November to March (Shaghude and Wannäs, 1998). The SE and NE seasonal monsoon winds in Tanzania are locally known as the Kusi and Kaskazi, respectively. The monsoon wind patterns have marked effect on the patterns of air and water temperatures, winds and rainfall (Ngusaru, 1997) The SE monsoon is generally characterized by relatively lower air temperatures (about 25o C), relatively stronger wind speeds and long rainy season. In contrast, the NE monsoon is characterized by relatively higher air temperatures (>30o C), relatively weaker wind conditions and short rainy season. The months of March-April and October-November are the inter-monsoon periods, locally known as the Matlai and the wind conditions during these periods are calmest. Strongest winds along the coast are experienced during June- July period. Occasionally, the SE monsoon is also associated with storms and cyclones (Francis et al., 2001).
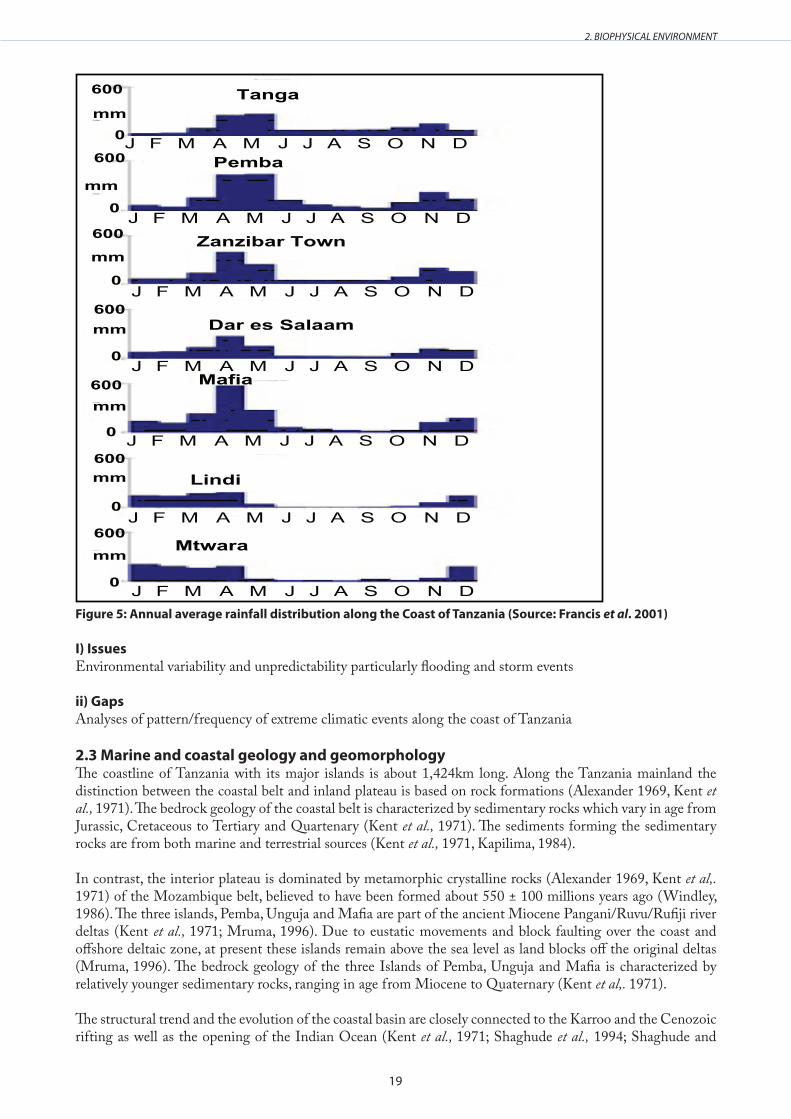
Despite this wide generalization of the climate along the coast of Tanzania, there are local variations which are generally influenced by the north-south geographic variation as well as the effects of sea breezes on the coast. Much of the northern parts of the coast of Tanzania (including Dar es Salaam, Tanga, Pemba and Unguja) are characterized by a bimodal rainfall regime, with two rainfall peaks in a given year; a long rainy season from March to May with a peak in April and a short rainy season from October to December with a peak in November (Nyenzi et al.,1999, Francis et al., 2001). In contrast, much of southern Tanzania (including, Mtwara, Lindi and Mafia) is characterized by a unimodal rainfall regime, with a continuous rainfall season between December and April (Francis et al,. 2001).
Rainfall along the coast of Tanzania generally increases northwards (Figure 5) but the islands receive relatively higher rainfall compared to corresponding coastal areas along the Tanzania mainland. Pemba receives the highest annual rainfall (1916 mm) followed by Mafia (1877 mm) and Unguja (1565 mm), while Lindi receives the lowest amount of rainfall (917 mm) (Francis et al. 2001).
As for the wind speeds, Mtwara experiences the highest wind speeds of up to 35 knots, compared to other areas along the coast of Tanzania such as Tanga, Dar es Salaam and Zanzibar, where the mode wind speed is 20 knots (Dubi, 2001). There is also local variation in the timing of the occurrence of the peak wind speeds. According to Dubi (2001), Tanga, Dar es Salaam and Mtwara experience peak wind speeds in the period between July and August while Zanzibar experiences peak wind speeds in January.
19
2. BIOPHYSICAL ENVIRONMENT
Tanga
Pemba
Zanzibar Town
Dar es Salaam
Mafia
Lindi
Mtwara
J F M A M J J A S O N D
J F M A M J J A S O N D
J F M A M J J A S O N D
J F M A M J J A S O N D
J F M A M J J A S O N D
J F M A M J J A S O N D
J F M A M J J A S O N D
0
600
600
600
600
600
600
600
0
0
0
0
0
0
mm
mm
mm
mm
mm
mm
mm
Figure 5: Annual average rainfall distribution along the Coast of Tanzania (Source: Francis et al . 2001)
I) IssuesEnvironmental variability and unpredictability particularly flooding and storm events
ii) Gaps Analyses of pattern/frequency of extreme climatic events along the coast of Tanzania
2 .3 Marine and coastal geology and geomorphologyThe coastline of Tanzania with its major islands is about 1,424km long. Along the Tanzania mainland the distinction between the coastal belt and inland plateau is based on rock formations (Alexander 1969, Kent et al., 1971). The bedrock geology of the coastal belt is characterized by sedimentary rocks which vary in age from Jurassic, Cretaceous to Tertiary and Quartenary (Kent et al., 1971). The sediments forming the sedimentary rocks are from both marine and terrestrial sources (Kent et al., 1971, Kapilima, 1984).
In contrast, the interior plateau is dominated by metamorphic crystalline rocks (Alexander 1969, Kent et al,. 1971) of the Mozambique belt, believed to have been formed about 550 ± 100 millions years ago (Windley, 1986). The three islands, Pemba, Unguja and Mafia are part of the ancient Miocene Pangani/Ruvu/Rufiji river deltas (Kent et al., 1971; Mruma, 1996). Due to eustatic movements and block faulting over the coast and offshore deltaic zone, at present these islands remain above the sea level as land blocks off the original deltas (Mruma, 1996). The bedrock geology of the three Islands of Pemba, Unguja and Mafia is characterized by relatively younger sedimentary rocks, ranging in age from Miocene to Quaternary (Kent et al,. 1971).
The structural trend and the evolution of the coastal basin are closely connected to the Karroo and the Cenozoic rifting as well as the opening of the Indian Ocean (Kent et al., 1971; Shaghude et al., 1994; Shaghude and
20
2. BIOPHYSICAL ENVIRONMENT
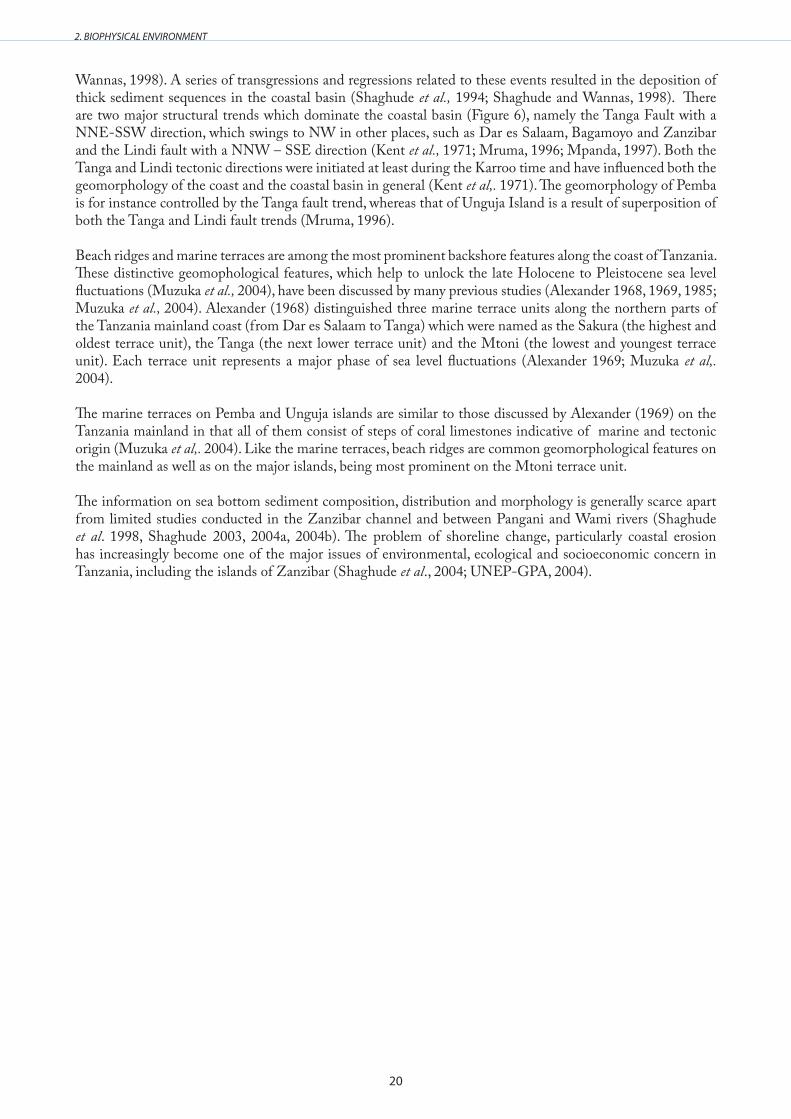
Wannas, 1998). A series of transgressions and regressions related to these events resulted in the deposition of thick sediment sequences in the coastal basin (Shaghude et al., 1994; Shaghude and Wannas, 1998). There are two major structural trends which dominate the coastal basin (Figure 6), namely the Tanga Fault with a NNE-SSW direction, which swings to NW in other places, such as Dar es Salaam, Bagamoyo and Zanzibar and the Lindi fault with a NNW – SSE direction (Kent et al., 1971; Mruma, 1996; Mpanda, 1997). Both the Tanga and Lindi tectonic directions were initiated at least during the Karroo time and have influenced both the geomorphology of the coast and the coastal basin in general (Kent et al,. 1971). The geomorphology of Pemba is for instance controlled by the Tanga fault trend, whereas that of Unguja Island is a result of superposition of both the Tanga and Lindi fault trends (Mruma, 1996).
Beach ridges and marine terraces are among the most prominent backshore features along the coast of Tanzania. These distinctive geomophological features, which help to unlock the late Holocene to Pleistocene sea level fluctuations (Muzuka et al., 2004), have been discussed by many previous studies (Alexander 1968, 1969, 1985; Muzuka et al., 2004). Alexander (1968) distinguished three marine terrace units along the northern parts of the Tanzania mainland coast (from Dar es Salaam to Tanga) which were named as the Sakura (the highest and oldest terrace unit), the Tanga (the next lower terrace unit) and the Mtoni (the lowest and youngest terrace unit). Each terrace unit represents a major phase of sea level fluctuations (Alexander 1969; Muzuka et al,. 2004).
The marine terraces on Pemba and Unguja islands are similar to those discussed by Alexander (1969) on the Tanzania mainland in that all of them consist of steps of coral limestones indicative of marine and tectonic origin (Muzuka et al,. 2004). Like the marine terraces, beach ridges are common geomorphological features on the mainland as well as on the major islands, being most prominent on the Mtoni terrace unit.
The information on sea bottom sediment composition, distribution and morphology is generally scarce apart from limited studies conducted in the Zanzibar channel and between Pangani and Wami rivers (Shaghude et al. 1998, Shaghude 2003, 2004a, 2004b). The problem of shoreline change, particularly coastal erosion has increasingly become one of the major issues of environmental, ecological and socioeconomic concern in Tanzania, including the islands of Zanzibar (Shaghude et al., 2004; UNEP-GPA, 2004).
21
2. BIOPHYSICAL ENVIRONMENT
Mtwara
Kiswere
KidodiNyakatitu
Pemba Is.
Zanzibar Is.
Mafia Is.
Dar es SalaamNgerengere
Tanga
INDIAN OCEANLINDI FAULT ZONE
TANG
A FA
ULT
ZONE
INDIAN OCEAN
5
6
7
8
9
10
11
38 39 40
0 100Km
Lindi
Pugu HillsRuvu
Lugoba
Fault systems
Figure 6: Map of coastal Tanzania showing the major fault trends . The orange, blue and black fault systems represent the three phases of faulting, namely, Karroo and later faulting, Jurassic and later faulting and Miocene and later faulting, respectively (Source: Mruma, 1996)
I) IssuesThe ecological and socio-economic impacts due to coastal erosion are increasingly becoming issues of major concern.Poor management of the shores due to lack of understanding of coastal erosion causative factors and sustainable mitigation/adaptation measures.
ii) GapsMost of the existing information on the marine and coastal geology and geomorphology are drawn from studies conducted on the northern parts of Tanzania (from Dar es Salaam to Tanga). There is limited information on the southern parts of the country (between Dar es Salaam and Mtwara).Information on the sea bottom morphology (bathymetry) is currently lacking for many coastal parts of Tanzania. This is important for running of hydrodynamic models.
22
2. BIOPHYSICAL ENVIRONMENT
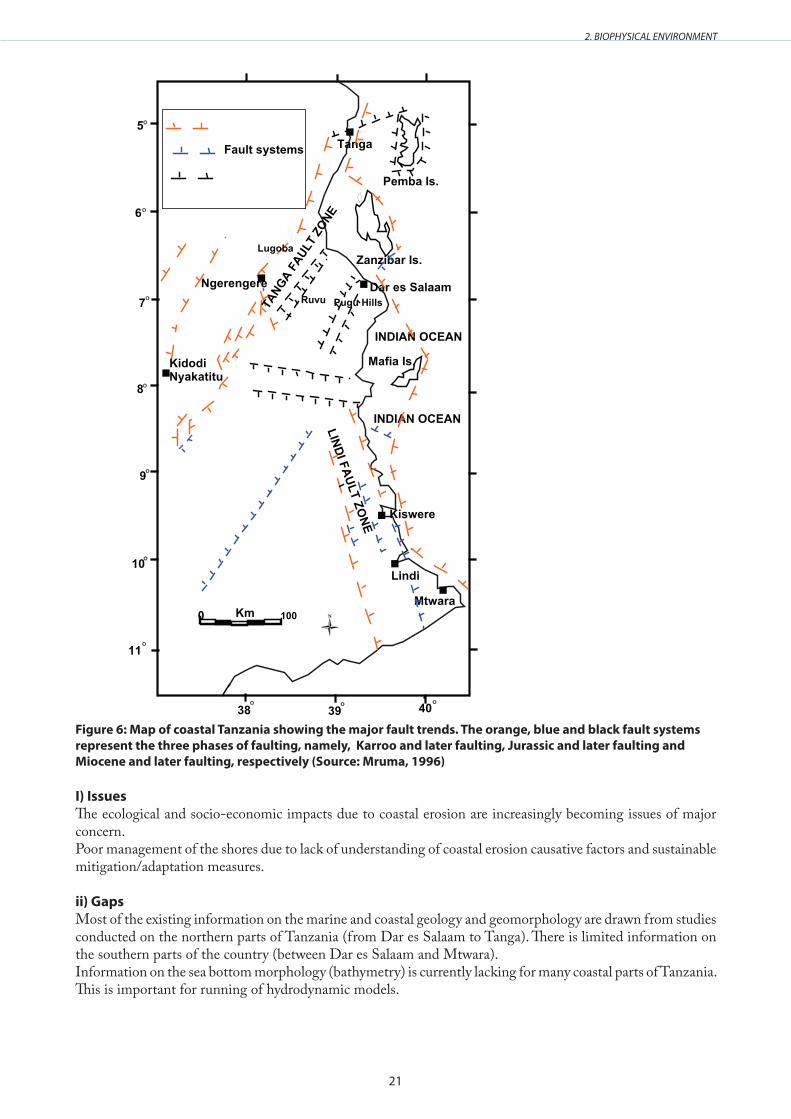
2 .4 Fresh water resources and drainageThe coastal region of Tanzania has several rivers that discharge into the Indian Ocean. The coastal drainage system covers about 20% of the country and contributes about 50% of the total surface runoff (Francis et al., 2001). The Rufiji is the largest river on the Tanzanian Indian Ocean (TIO) drainage system. Its mean annual discharge is estimated to range between 900 and 1,133 m3/s. The river contributes 50% of the total fresh water discharges to the sea (Welcomme, 1972; Hafslund 1980; Francis et al., 2001). Other important rivers include the Ruvuma with a mean annual discharge of 475 m3/s, the Wami with a mean annual discharge of 63 m3/s, the Ruvu with a mean annual discharge of 63 m3/s and the Pangani with a mean annual discharge of 27 m3/s (Welcomme, 1972; Francis et al., 2001; IUCN, 2003; Mikiyasu, 2007). The remaining rivers such as the Matandu, Mbwemkuru and Lukuledi are considered to be relatively less important in terms of freshwater discharges to the Indian Ocean (Figure 7 and Table 3).
Figure 7: River systems draining into the coast of Tanzania (Modified after Francis et al . 2001)
23
2. BIOPHYSICAL ENVIRONMENT
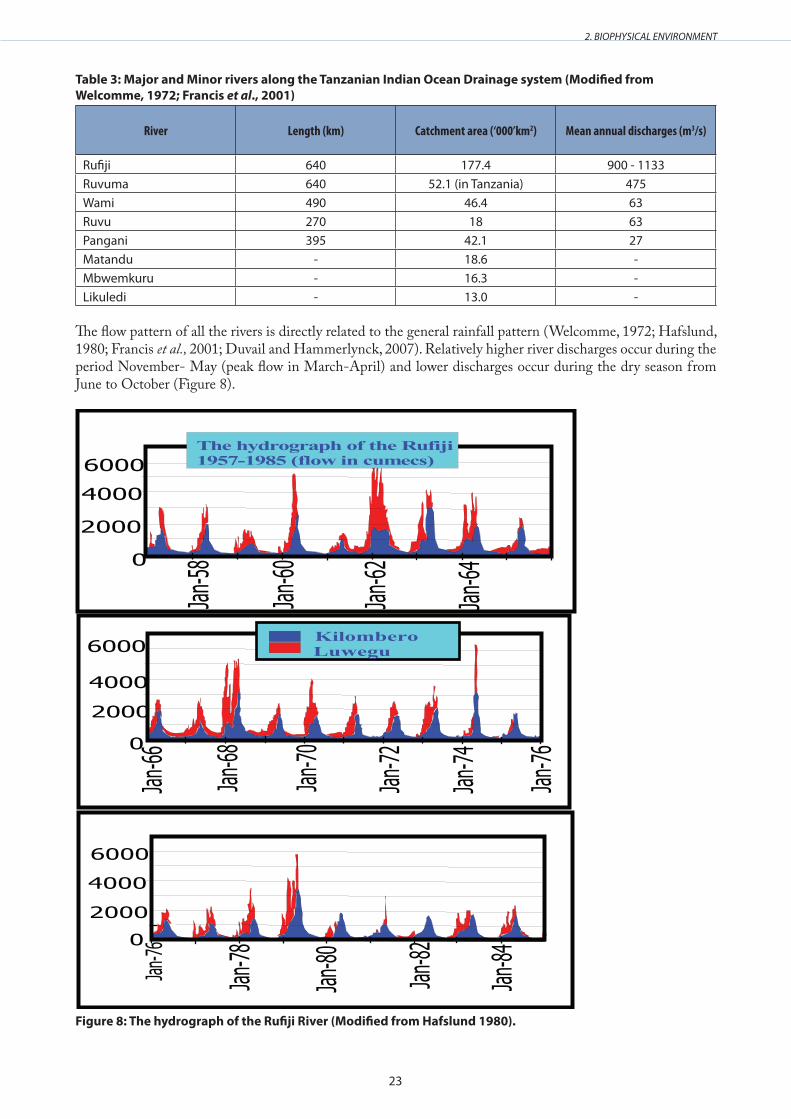
Table 3: Major and Minor rivers along the Tanzanian Indian Ocean Drainage system (Modified from Welcomme, 1972; Francis et al ., 2001)
River Length (km) Catchment area (‘000’km2) Mean annual discharges (m3/s)
Rufiji 640 177.4 900 - 1133Ruvuma 640 52.1 (in Tanzania) 475Wami 490 46.4 63Ruvu 270 18 63Pangani 395 42.1 27Matandu - 18.6 -Mbwemkuru - 16.3 -Likuledi - 13.0 -
The flow pattern of all the rivers is directly related to the general rainfall pattern (Welcomme, 1972; Hafslund, 1980; Francis et al., 2001; Duvail and Hammerlynck, 2007). Relatively higher river discharges occur during the period November- May (peak flow in March-April) and lower discharges occur during the dry season from June to October (Figure 8).
Jan-64
Jan-62
Jan-60
Jan-58
0
2000
4000
6000The hydrograph of the Rufiji1957-1985 (flow in cumecs)
Jan-66
Jan-68
Jan-70
Jan-72
Jan-74
Jan-76
6000
4000
2000
0
KilomberoLuwegu
Jan-78
Jan-80
Jan-82
Jan-84
6000
4000
2000
0
Jan-76
Figure 8: The hydrograph of the Rufiji River (Modified from Hafslund 1980) .
24
2. BIOPHYSICAL ENVIRONMENT
The mouths of most of these rivers are characterized by the presence of deltas, estuaries and mangrove forests. The Rufiji delta covering an area of about 1200 km2, with its associated 7 distributary channels and other interwoven smaller channels and creeks is home to the largest estuarine mangrove forest in East Africa, with an estimated surface area of 53,200 ha. The Rufiji delta mangrove forest constitutes about 46% of the total mangrove forest cover in Tanzania (Semesi, 1991; Kajia, 2000;. IUCN, 2003).
Anthropogenic activities related to demand for water for irrigation and hydropower developments (Figure 9) are considered to have significantly reduced the fresh water discharges of the rivers on the TIO drainage system at list since the last five decades (IUCN, 2003; Shaghude, 2006; Duvail and Hammerlynk, 2007). Anthropogenic activities associated with livestock developments and landuse changes on the upper catchments of the rivers on the TIO drainage system have also contributed to the degradation of the river basins with corresponding reduction in the fresh water discharges of the rivers (Sosovele, 2007). In some of the rivers such as the Pangani, Wami and Ruvu, the situation is considered to be critical with multipliable socio-economic conflicts and potential ecological and environmental impacts at the coast (IUCN, 2003; Shaghude, 2006)
In the Rufiji River Basin for instance (Fig. 9), the total annual discharge is estimated at 28, 382 Mm3 (million cubic metres), which are contributed by the three tributaries on the Upper Rufiji, namely the Kilombero (17, 597 Mm3), the Great Ruaha (4,257 Mm3), the Luwegu (5,109Mm3) and the flows from the Lower Rufiji (1,419 Mm3). Out this total flow, the irrigation developments on the Great Ruaha River consumes about 1,490 Mm3, while the planned development on the Lower Rufiji is anticipated to consume about 2022 Mm3 and the evaporative losses from the Mtera dam are estimated at 1,277 Mm3, making a total reduced flow of about 4,769 Mm3, equivalent to 153 m/s (Shaghude, 2008) which is also approximately 17% of the Rufiji Basin annual discharges The reduced flow may have profound effects on the dry season fresh water discharges to the sea by\the Rufiji, which is estimated at 300 m3/s (Shaghude, 2008).
In the Pangani River Basin, the fresh water contribution from mount Kilimanjaro and other sources had been estimated at 500 Mm3 and 400 Mm3, respectively (Fig. 9). As with the Rufiji River Basin the reduced flow due to irrigation developments and evaporative losses in dams had been estimated at 400 Mm3 and 400 Mm3, respectively. The reduced flow on the Pangani due to the existing irrigation project and the water impoundment in the Nyumba ya Mungu dam would therefore amount to at least 800 Mm3 per year, which is a very significant proportion (about 89%) of the total available water on the Pangani River Basin.
i) IssuesAnthropogenic activities have significantly affected fresh water discharges in the TIO drainage system at least during the last five decades (IUCN, 2003; Shaghude, 2006; Duvail and Hammerlynck, 2007). Landuse changes within the upper catchments of the rivers have contributed to the degradation of the river basins with corresponding reduction in the freshwater discharges (Shaghude, 2008). In some of the rivers such as the Pangani, Wami and Ruvu, the situation is considered to be critical with multiple socio-economic conflicts and potential ecological and environmental impacts at the coast (Mwandosya et al., 1998; IUCN, 2003; Shaghude, 2006; Yanda and Munishi, 2007).
The changes in rainfall pattern due to global climate change are also altering the river flow regime in most of the TIO drainage system and parallel impacts at the coast are envisaged (Yanda and Munishi 2007).
Coastal environmental impacts due to increasing water abstraction (for irrigation) and hydropower developments as well as the increasing degradation of the catchments due to landuse changes and livestock keeping.There is a general lack of information on the patterns of climate change and their impacts on the hydrology of the Tanzanian river systems draining into the coast.
ii) GapsThere is a need for updated data on current river discharges. In this regard, there is a need to further build the capacity for comprehensive monitoring of river discharges.There is also a need to identify appropriate climate change adaptation and mitigation measures in all major river basins of Tanzania.

25
2. BIOPHYSICAL ENVIRONMENT
Rufiji R
Usangu wetlands
Kibasila swamps
RUAHAKILOMBEROLUWEGU
28,382 Mm3
4,257 Mm3
LOWER RUFIJIIRRIGATED AGRICULTURAL LANDDAM
1,400 Mm3
1,277 Mm3
2022 Mm3
1,419 Mm3
17,597 Mm35,109 Mm3(a)
500
contribution From
Other Mts
contribution FromMt Kilimajaro
400 Mm3
3 400 Mm 3
400 Mm 3
Mm
DAMIRRIGATED AGRICULTURAL LAND
(b)
Fig . 9 . Figure 8 . Rufiji (a) and Pangani River Basins (b) water budgets . The bold arrows in the figures indicates the estimated annual input of fresh water to the systems, while the dotted arrows indicates the water losses due to irrigation and evaporation . Source: Shaghude (2008) .

26
2. BIOPHYSICAL ENVIRONMENT
Physical Oceanography
Water circulation within Tanzania’s coastal waters is controlled by a number of factors, including the Northeast and Southeast monsoons, the East African Coastal Current, the South Equatorial Current and the tidal regime.
CurrentsThe East African Coastal Current (EACC), which flows northwards throughout the year, is the dominant prevailing ocean current along the coast of Tanzania (Newell, 1959). The EACC principally originates from the Southern Equatorial Current (SEC) which flows from east to west throughout the year at around latitude 12oS (Swallow et al,. 1991). The EACC is strongest during the period April to October with current velocities ranging from 1.5 to 2 m/s when it is accelerated by the SE monsoon winds. During the period between November and March, the current is weaker with low velocities of the order 0.5 m/s as it is impeded by the northeast (NE) monsoon winds.
Tanzania coastal water is characterised by nutrient-poor water resulting in low productivity (El-Sayed, 1989). The coastal dynamics however, are to some extent influenced by the presence of islands (Zanzibar, Pemba, Mafia and numerous smaller islands), orientation of the coast and an almost continuous band of reefs that fringe the coast and islands. Studies carried out on current velocities in inshore water of Tanzania show that there are significant differences from one location to the other. For instance, in the inshore waters off Kunduchi in Dar es Salaam, the current speed recorded during the NE monsoon, averaged over one tidal cycle, is about 0.25 m/s with a maximum of 0.5 m/s. There is however, no remarkable change in both speed and direction during the SE monsoon. In the Kunduchi-Manyema Creek, velocities of up to 3.5 m/s have been recorded during ebb tide (Dubi, 2006).
Within the Zanzibar Channel when the EACC is strongest ( June-October), some flow of the EACC is diverted through the southern entrances of the Zanzibar and Pemba channels (Garcia-Reyes et al., 2009). During the NE monsoon, some of the EACC drives a southward flow through the northern entrance of the Zanzibar Channel.
The shores of the southern border of Tanzania and Mozambique at Mtwara are also of strategic importance because this is where the South Equatorial Current (SEC) meets the coastline of Africa and divides. The SEC waters carry eggs and larvae of numerous marine animals and plants. This area is therefore very important for the settlement and subsequent dispersal of marine organisms, both north and south along the coast of East Africa (Obura, 2004)
Studies have also shown that in the Rufiji delta freshwater is trapped in the nearshore zone due to the orientation of the delta, the prevailing wind regime (always onshore) and current conditions (Iversen et al., 1984; Francis, 1992). The EACC inhibits the flow of nearshore waters offshore, resulting in greater nearshore current flows (Gupta and Desa, 2001).
i) IssuesCyclonic eddies such as those which have been observed at the small island of Latham may be hazardous to fishers and navigators.
ii) GapsLack of sufficient knowledge of coastal currents and their seasonality. So far only short-term observations covering small areas of interest have been made. Lack of sufficient knowledge of the effect of the EACC on the coastal dynamics. Insufficient knowledge of areas with cyclonic eddies and upwellings. Current patterns in the strategic areas for egg and larval dispersal (such as those in Mtwara and south Mafia) are not clearly understood, there is speculation only.Lack of an inventory of historical surveys and expeditions
27
2. BIOPHYSICAL ENVIRONMENT
Tidal regime and waves
Tidal rangesTides along the Tanzanian coast and islands are predominantly semi-diurnal, with a Form Factor of 0.16 (Pugh 1984). The mean spring tidal ranges vary from 3.0 m at Kunduchi in Dar es Salaam (Lwiza and Bigendako, 1988) to a maximum of 3.6 m at Zanzibar harbour (Odido and Francis, 1999; Cederlöf et al., 1995; Mahongo and Francis, 2010). At Dar es Salaam harbour, the mean spring tidal range is about 3.2 m (Lwiza and Bigendako, 1988. The maximum tidal range in most places in Tanzania is about 4 m (Hartnol 1974). The times of high and low tides are also approximately the same all along the coast (Ngusaru 2002).
Throughout the coast of Tanzania, the mean neap tidal ranges vary from about 0.9 m at Chwaka bay in Zanzibar (Cederlöf et al. 1995) to about 1.2 at Zanzibar harbour (Odido and Francis 1999). The age of the semi-diurnal tide (time interval between the times of new and full moon and a measure of delay period of the spring tide) vary between one and two days. The age has a lag of about 26 hours at Zanzibar harbour (Odido and Francis, 1999), and about 32 hours at Dar es Salaam harbour (Lwiza and Bigendako, 1988).
Wave patternsThere are a few studies that document wave characteristics of coastal Tanzania, and these have mainly been undertaken on a short-time basis in a few areas of interest. Average wave heights of about 0.9 m have been observed during the North East monsoons, which increase to about 1.2 to 1.5 m during the South East monsoon (Lwiza, 1994; Nyandwi, 1999). During the North East monsoon, wind-generated waves approach the coast from the northerly sector. During the South East monsoon, waves approach the shore from the south-east direction with periods of 8-10 seconds (Nyandwi, 1999). Highest waves are experienced at the peak of the South East monsoon during the period between July and September. In August the significant wave heights are about 0.4 m and wave periods are about 6-10 seconds (Nyandwi, 1999).
Generally, fringing reefs protect the coastal areas and islands from most storm waves and swells (Brampton, 1996) and play an important role in refracting and diffusing the waves (Lwiza, 1994). Occasionally however, strong wind waves cross the barrier reefs to reach the shores, especially when spring tides coincide with storms and onshore winds. In addition to causing flooding in low lying areas, strong waves are also responsible for coastal erosion. Makota et al. (2004) for instance, observed considerable changes of the Kunduchi shoreline off Dar es Salaam between 1981 and 2002, whereby between 2.04 ha and 2.60 ha of the beach was eroded by wave action. Recently, Almström and Larsson (2008) concluded wave generated longshore transport is the governing process for moving sediments along the Kunduchi beach area. Lwiza (1994) also recognised the influence of waves on coastal erosion in Tanzania.
Tanzania is fortunate in not having experienced a major tsunami event. However, in December 2004, the Indian Ocean Tsunami caused by an undersea earthquake in Indonesia resulted in larger-than-normal waves reaching Zanzibar (Merrifield et al., 2005).
i) issuesCoastal erosion which is causing infrastructural damage, loss of valuable land and other impacts with major economic implications.Extreme waves and storm surges that accelerate coastal erosion processes.
ii) GapsThe coverage of sea level monitoring is low and tide gauges are yet to be installed in strategic locations along the coast of Tanzania.Lack of capacity for study of waves, sea level analysis and prediction.Lack of sufficient knowledge on the effects of local and regional factors on short-term changes of sea levelLack of capacity in satellite altimetry.Lack of a warning system for storm surges and tsunamis.

28
2. BIOPHYSICAL ENVIRONMENT
Sea level change
Along the coast of Tanzania, sea level variability is monitored using tide gauges installed in two stations in Zanzibar and Mtwara. The Zanzibar station is considered to be one of the most important Indian Ocean tide gauge stations for monitoring long term changes in sea level in the Western Indian Ocean (Church and White, 2006). The two stations transmit sea level data to the Indian Ocean Tsunami Warning System (IOTWS) on a real time basis through the Global Telecommunications System (GTS). Historical sea level data exist for stations located in Dar es Salaam, Mtwara and Tanga. However, data from these stations cover relatively short periods.
A recent study of trends in mean sea levels in Tanzania indicates falling sea level in Tanga (between 1962 and 1966), Dar es Salaam (between 1986 and 1990) and Zanzibar (between 1984 and 2004). However, sea level is rising in Mtwara (between 1959 and 1962) (Mahongo, 2009). Data from Zanzibar indicate that sea level has been declining at a rate of 3.6 mm/year for the period between 1985 and 2004. Mahongo and Francis (2010) have also given an in-depth analysis of the seasonal variations of sea level at the island of Zanzibar during the period 1985-2004, revealing three major cycles of sea level i.e. semi-annual, annual and four-year oscillations.
Few studies on the past sea levels along the coast of Tanzania have been undertaken. In Tanzania, Muzuka et al. (2003) made a preliminary investigation on the Pleistocene/Holocene sea level changes. In this study, it was found that the oldest Palaeo-shoreline is approximately 5 m above the present sea level. This extends landward to more than 1 km. On the islands of Zanzibar, specific localities where Pleistocene/Holocene sea level changes occurred have been preserved in the form of marine terraces and/or beach ridges. These are found in Chwaka, Uroa, Jambiani, Paje and Nungwi in Unguja Island and, Vumawimbi and Kiuyu in Pemba Island (Muzuka et al. 2000; Alexander, 1969 & 1985).
Projections of future mean sea level trends in Tanzania are currently not feasible due to insufficient data occasioned by limited duration of monitoring. The longest sea level record is only 25 years at Zanzibar. However, model simulation of long-term sea level trends (1955-2003) using a combination of tide gauge records and satellite altimetry, show a general rising trend in Tanzania ranging from 0.4 to 2.0 mm/yr (Bindoff et al., 2007). The global average within this period is about 0.4 to 3.6 mm/yr (Bindoff et al. 2007).
i) IssuesIncreased coastal erosion along the coast causing major economic losses due to loss of land and infrastructural damage.Inundation and displacement of wetlands and lowlands due to flooding.Saltwater intrusion into estuaries and groundwater aquifers.Changes in sedimentation patterns.Increased turbidity of coastal waters reducing productivity.
ii) GapsLack of sufficient knowledge of factors affecting long term change in mean sea levelLack of long term sea level records.Lack of capacity in the analysis of satellite altimetry data.
Ocean temperature
Sea Surface Temperature (SST)Typically, the average Sea Surface Temperature (SST) in Tanzanian offshore waters is around 27oC and the typical range is from 22 to 30°C (Newell, 1957; Iversen et al. 1984; Francis et al., 2001). The SSTs are generally higher during the North East monsoon as compared to the South East monsoon. The SSTs are also highest in early March and lowest in either August or September (Harvey, 1977). However, higher SSTs of up to 32.5oC occur in shallow coastal areas (Lugomela, 2006).
During the North East monsoon, there is a decrease in water temperature with depth while during the South East monsoon the waters are isothermal from the surface to the thermocline. According to Hartnoll (1974)
29
2. BIOPHYSICAL ENVIRONMENT
and Harvey (1977), the thermocline in the Tanzanian offshore waters lies at a depth of between 25 and 100 m. The temperature of the mixed layer varies quite appreciably from one place to another, mainly due to seasonal variations. There are also diurnal variations particularly in offshore waters which are controlled by variability in the heating of water by the solar radiation during the day and cooling during the night. In the near-shore waters, the seawater temperatures are mainly semidiurnal due to dominant effect of the semi-diurnal tides (Francis et al., 2001).
In Zanzibar, SSTs have been recorded using temperature loggers tied on coral branches at 3 m depth on Bawe and Chumbe coral reefs (Muhando 2001). Recording undertaken since 1997 showed a yearly seasonal pattern with lowest temperatures ranging 24.5–25.5˚C occurring in July–August, with an annual peaks (29.2˚C - 30.7˚C) occurring in the period between March and April. Generally, mean SSTs are always higher during the North East monsoon (about 28˚C) than during the South East monsoon (about 26˚C). Intrusion of a cold seawater mass in January–February period is attributed to the northward flow component of the EACC (Garcia-Reyes et al., 2009).
i) Issues Coral bleaching due to increased Sea Surface Temperatures (SSTs)Fish kills due to harmful algal blooms.Loss of colour and hence value of seaweeds.
ii) GapsLack of sufficient knowledge of seasonal and spatial variation of SSTs in most areas. Lack of vertical temperature profiles- only short-term measurements on SSTs which are site specific.
Salinity patternsThe surface water salinity of the Tanzanian coastal waters ranges between 34 and 36 PSU. In estuaries and coastal bays, salinities are usually relatively low due to the influence of freshwater discharge from the river systems. The salinities in offshore waters are highest in November during dry season, and are lowest in May during rainy season following the peak river freshwater outflow (Iversen et al. 1984). Bryceson (1982) observed that the salinity starts to decrease before the onset of the rains and attributed this to the advection of lower salinity water from the South.
The salinity of the surface water at Kunduchi in Dar es Salaam reaches a maximum of about 35.3 PSU in November and falls to a minimum of 34.6 PSU in May (Hartnoll, 1974). In the Mafia Channel, the salinity ranges between 34.7 and 34.95 PSU while in the Rufiji delta, salinity range 12-14 PSU inside the estuary and 20-25 PSU at the mouth of the delta (Talbot, 1964; Tafe, 1990). On the East coast of Zanzibar at Chwaka Bay, salinity ranges from 26.3-28.1 PSU on the inner zone of the bay and ranges from 29.5-35 PSU at the entrance (Lugendo et al., 2005, Wolanski, 1989). During the dry season, the salinity in the inner mangrove areas of Chwaka Bay can reach 38 PSU.
Water masses of the Tanzanian coastThere are four water masses in the Tanzanian offshore waters, characterized by typical salinity and oxygen levels. These occur at various depths. They include: (i) Tropical Surface Water characterised by high salinity and high oxygen, (ii) Arabian Sea Water at depth of about 1000m characterized by high salinity and low oxygen, (iii) Antarctic Intermediate Water characterized by low salinity and high oxygen, and (iv) North Indian Deep Water characterized by high salinity and low oxygen (Hartnoll, 1974). The Tropical Surface Water originates from the South Equatorial Current (SEC).
Ocean-atmosphere interaction
Few studies have been undertaken on ocean-atmosphere interactions in Tanzania. A study on heat fluxes at Chwaka bay on the eastern coast of Zanzibar in 1996 established that the major heat fluxes within the bay were due to incoming solar radiation and loss due to evaporation and long-wave back radiation (Mahongo 1998, 1999, 2000). The sensible heat and net long-wave radiation fluxes played minor roles in the heat budget of the bay. The observed and computed values of the fluxes of absorbed solar radiation, evaporation, net long-wave

30
2. BIOPHYSICAL ENVIRONMENT
radiation, sensible heat and reflection at the bay bottom were respectively +275, -156, -38, -18 and -2 W m-2. The heat budget was mainly balanced by heat advection from the bay to the open ocean, with a small portion being due to water-sediment heat conduction (Mahongo 1998, 1999, 2000).
The Indian Ocean Dipole and El-Nino Southern Oscillation (ENSO) phenomenon have some significant influences on the climate of coastal region of Tanzania. However, there are few local studies that have focussed on these two phenomenons. Kijazi and Reason (2005) has established that El Nino is associated with above average rainfall while La Nina is associated with below average rainfall over the northern region of the Tanzanian coast during the North-East Monsoon season, and to lesser extent during the South-East Monsoon season.
Chemical and Biological Oceanography
Nutrients Increased economic activities and expanding populations in coastal towns of Tanzania have resulted in production of large amount of waste including sewage and industrial effluent. Unfortunately, raw sewage and industrial effluents produced in all coastal towns are directly released into estuaries and other coastal habitats. This is particularly evident in Dar es Salaam, Zanzibar, Tanga, Kilwa and Mtwara. Away from coastal towns, pollution of coastal waters is caused by fertilizer residue contained in run-off from agricultural areas. There is evidence of nutrient enrichment. For instance, high nutrient loads have been detected in waters fronting major towns in Tanzania. Ammonium levels of up to 28.6 μg-at Nl-1, nitrate levels up to 7.8 μg-at Nl-1 and phosphate levels of 4.0 μg-at Nl occur-1 in Zanzibar (Anderson, 1994). Furthermore, high amounts of faecal coliform and total coliform bacteria of up to several thousands per ml of seawater, occur in the waters off Stone Town, Zanzibar (Mohammed, 2001). Likewise, high nutrient loadings have been recorded in water fronting Tanga Township. Effluents from a fertilizer factory, municipal sewage and sisal decortications plants have enriched coastal waters causing proliferation of macroalgae in Tanga coastal waters (Munisi, 1999; Shilungushella, 1993).
In Dar es Salaam, the inshore waters are characterized by the presence of high levels of nutrients (Lyimo (2009). Nitrate levels of up to 54 μmolL-1, phosphates of up to 45 μmolL-1 and nitrites of up to 20 μmolL-1 have been recorded. Several thousand counts of microbials ranging between 1,700 and 240,000 for total coliform, 200 to 92,000 for faecal coliform and 11 to 4,900 for enterococci have also been observed in Dar es Salaam inshore waters. The levels of faecal indicator bacteria and nutrients are usually higher during the rainy seasons due to surface runoff from Dar es Salaam city (Bryceson, 1983).
The coastal areas of Dar es Salaam experience heavy loads of pollutants through Msimbazi Creek which receives large quantities of domestic and industrial wastes from the city of Dar es Salaam. The river and creek receive pollutants such as dyes, paint wastes and strong alkalis, oil and tars, as well as organic wastes from breweries and meat plants (Bryceson, 1982).
In Dar es Salaam, raw sewage generated by 15% of the city residents who are connected to the sewer system is discharged directly into the sea, untreated. The situation became worse in the 1990s due to damage of the sewer pipe leading to the discharge of untreated sewage on sandy-mud flats near the harbour (Bryceson et al., 1990). About 79% of the population in Dar es Salaam use onsite sanitation facilities particularly pit latrines (Mashauri and Mayo 1989; Mgana and Mahongo, 1997; Dar es Salaam City Council, 2004). Leachate and overflow from pit-latrines have led to contamination of most surface and groundwater resources including inshore waters. Other sources of coastal pollution in Dar es Salaam are industrial wastes from Keko, Chang’ombe, Kurasini, Mtoni and Temeke which discharge heavy metals, pesticides, paint, nutrients, organic and other pollutants near the harbour (Bryceson, 1983; Machiwa, 2000; Mwevura et al., 2000). Other coastal areas of Tanzania outside the major cities and townships are free from domestic wastes but occasionally suffer from input of agricultural wastes, including pesticide and fertilizer residues. Most of the major rivers in the country drain rich agricultural lands where the application of fertilizers and pesticides to boost crop production is common.
31
2. BIOPHYSICAL ENVIRONMENT
Persistent organic pollutants High levels of PCBs and organochlorine pesticide residues have been detected in Dar es Salaam harbour (Machiwa, 1992; Mwevura et al. 2002). Chlorinated compounds due to pesticide pollution have been reported in Chwaka bay, Zanzibar (Mmochi, 2005). Heavy metals such as lead (Pb), zinc (Zn), cadmium (Cd), chromium (Cr), mercury (Hg) and copper (Cu) have been reported in waters within Dar es Salaam harbour and nearby coastal areas (Machiwa, 1992; Kondoro 1997; Muzuka, 1997). Concentrations of these metals exceeded maximum values recommended by the World Health Organization (WHO). Similarly, high concentrations of Cr, Pb, Cu, Hg and other heavy metals have been reported in Mzinga creek mangrove sediments in Dar es Salaam (Mtanga and Machiwa, 2007). These metals were found to have accumulated in tissues of Polychaete worms (Mtanga and Machiwa, 2007). Several studies have also been conducted on the impacts of heavy metal on flora and fauna dwelling in polluted habitats in Dar es Salaam coastal areas (Mwandya, 1996; Wekwe et al. 1989). The environmental impacts of Pb, Hg and Cd on calcification rates of the reef building calcareous algae Amphipora tribulis have been investigated in Dar es Salaam (Kangwe, 1999).
Primary production In Tanzania, high plankton biomass and productivity occur during the NE monsoon and is relatively lower during the SE monsoon period. The biomass is usually highest at the surface water column especially during calm weather periods (McClanahan, 1988; Lugomela et al., 2002). The water column primary productivity ranges from 204 to 4142 mg C m–2 day–1. Bacterial production varies from 10 to 72 mg C m–2 day–1, comprising 5% of the total bacterial standing stock (Lugomela et al, 2001). Biofilm carbon fixation rate is estimated to be 0.05, 0.3 and 0.5 kg C m−2 y−1 for thin (0.5 mm), medium (1 mm) and thick (2 mm) biofilms, respectively with an overall primary production rate of 0.14 kg C m−2 y−1 at depths of about 5 m (Lugomela et al. 2005).
The nitrogen fixation rate in intertidal sediments along the coast of Tanzania is estimated to be 38 mmolN m-2y-1. Higher rates of nitrogen fixation occur during the night time as compared to daytime suggesting sediments composed of non-heterocystous diazotrophic organisms (Lyimo and Lugomela 2006). The rates of nitrogen fixation by Trichodesmium species in the surface waters were estimated by to be 42.7 mmol N m-3y-1 (Lugomela et al., 2002)
In Zanzibar, studies on nitrogenase activity found that nitrogen fixation varies from 6.0 to 118.5 nmol C2H4 cm-
2h-1 on mangrove pneumatophores and from 1.3 to 16.8 nmol C2H4 cm-2h-1 in adjacent sediments (Lugomela and Bergman, 2002). In sandy and muddy areas within a mangrove ecosystem near Zanzibar town, the rates of nitrogen fixation are of the order of 1.64 and 1.34 nmol N m-2h-1, respectively, (Kyaruzi et al., 2003).
Studies on the impact of mangrove deforestation on nutrients, phytoplankton community structure and biomass in Tanzania have established that there are no significant differences in both water-column and sediment phytoplankton biomass between deforested and conserved sites (Kyewalyanga, 2005). Sediment chlorophyll-a was however significantly higher at the conserved site (average of 2.38 ± 1.36 mg m-3) than at the deforested one (1.28 ± 0.91 mg m-3), while water-column chlorophyll-a was higher at the deforested than at the conserved site, with averages of 1.52 ± 1.26 and 0.71 ± 0.62 mg m-3, respectively. Organic matter content was much higher at the deforested site (25.98 ± 1.51%) compared to the conserved mangrove site (19.52 ± 0.99%) (Kyewalyanga 2005).
Studies on the cyanobacteria diversity and nitrogenase activity in Paje lagoon, Zanzibar have revealed rich cyanobacterial genetic and morphological diversity and substantial nitrogenase activity especially during the night with the maximum activity reaching 120 nmol C2H4 cm-2 h-1) (Bauer et al., 2008).
Several potentially harmful microalgae have been found in Tanzanian coastal waters. They are distributed among three major microalgal groups, namely cyanobacteria, mostly dominated by Trichodesmium spp, the dinoflagellates, dominated by both Prorocentrum spp. and Gambierdiscus toxicus and the diatoms, mostly Pseudo-nitzschia spp. (Hansen et al., 2001; Lugomela, 2006 & 2007). Relative abundance and spatio-temporal variability of these organisms has not been well assessed. It is also not known if these organisms are associated with severe poisoning associated with the consumption of shellfish and meat from dead turtles that has happened at several places along the coastal line of Tanzania (The independent 1996, proMED-mail 1996).
32
2. BIOPHYSICAL ENVIRONMENT
Secondary productionIn the inshore waters of Dar es Salaam, the main taxa of zooplankton are Calanoida (49. 1%), Larvacea (11. 9%), Corycaeus spp. (6.4%), Cypridina sinuosa (5.6%), Oithona spp. (4.8%), caridean larvae (4.0%), Sagitta spp. (3.8%), Euterpina (2.1%), Lucifer (1.2%), Oncea (1.2%), Hydromedusae (1.0%), Euconchoecia chierchiae (1.0%), Creseis acicula (1.0%), Brachyuran zoeae (0.8%), Ctenophora (0.5%), Mysidacea (0.5%) and other minor species (Okera 1974). All major groups of the zooplankton have an annual cycle of abundance, with relatively high numbers being recorded in the period between February and August during the SE Monsoon. During the NE monsoon, the abundance is relatively low. Relatively richer, more diverse fauna exist at the river mouths and estuaries compared to the upper reaches as demonstrated in the Rufiji Delta (Tafe, 1990). The zooplankton in river mouths and estuaries are more abundant at certain times of the day. However, differences in faunal composition are found between different areas (Tafe, 1990). Estimates of total zooplankton in the Zanzibar coastal area was carried out by Wickstead in 1963. There is a need for updating of information on zooplankton in view of the fact that previous studies are now outdated and many changes have taken place.
A few studies on trophic relationships have also been conducted in Tanzania coastal-marine waters. Lugomela et al. (2001) has shown that 77% of the total primary production is channeled through the heterotrophic flagellates, ciliates and heterotrophic dinoflagellates to higher trophic levels. Thus, 28% of estimated carbon demand for mesozooplankton could potentially be met by ciliates and heterotrophic dinoflagellates (Lugomela et al. 2001). Another interesting investigation was done on the feeding behaviour of chaetognath species between the monsoons periods conducted in Zanzibar in 2000. The diet, feeding behaviour, feeding rates and estimates of predation impact on standing stock of copepods as well as the impact of cannibalism were presented in this study (Oresland 2000).
Coastal Zone and Continental Shelf
Description and extent of coastal and marine habitatsThe coastal zone of Tanzania stretches from latitude 4º49’S at the border with Kenya to the border with Mozambique at latitude 10º28’S. About two thirds of the coastline has fringing reefs, often close to the shoreline, broken by river outlets such as the Rufiji, Pangani, Ruvuma, Wami and Ruvu (Dubi 2001). Features of interest within the coastal zone include the coastline, continental shelf, corals, mangroves, and seagrass beds. The length of the coastline of Tanzania is 3,461 km (United States Mapping Agency, 2003). The width of the continental shelf is 5.8 km except in the Zanzibar and Mafia channels where it reaches a width of about 62km. The total area of the continental shelf is estimated to be 17,900 km2. The most important coastal ecosystems include coral reefs, mangroves and seagrass beds.
Coral reefsCoral reefs cover about two thirds of Tanzania’s continental shelf. Fringing reefs forming margins along the edge of the mainland or islands and patch reefs dominate the coastal waters of Tanzania (TCMP, 2001a). Due to the restricted drainage and un-indented coastline, well developed coral reefs have only evolved along major sections of the continental shelf. These cover a surface area of about 3,500 Km2 - the largest area covered by coral reefs in the entire Eastern Africa. Due to narrowness of the continental shelf, the coral reefs are generally situated near the shoreline within a distance of between 1 and 5 km.
The coral reefs in Tanzania are under different types of threats. In some Marine Protected Areas (MPAs) and managed areas (e.g. Muheza, Tanga and Pangani Districts), most of the destructive fishing practices has been stopped. However, dynamite fishing, coral bleaching, seine netting, over-fishing, shell collection, wave action, boat anchoring, coral mining, crown-of-thorns starfish (COTS) and pollution are still the main threats to the existence of the coral reefs (Francis et al., 2001; Horril et al., 2001; Ngusaru et al., 2001; Whitney et al., 2003).
The coral reefs in Tanzania have also been impacted by rising seawater temperatures. In the period between March and September 1998, a significant coral bleaching event occurred leading to 15 to 100% damage to hard corals. Bleaching was worse in shallow waters than in deeper waters (TCMP, 1999; Muhando, 2003).
The coral reefs of Zanzibar and those found in MPAs are generally in good condition since they have escaped
33
2. BIOPHYSICAL ENVIRONMENT
from serious mortality driven by bleaching events (Wells et al., 2004). This is also the case in well managed sites such as Chumbe where the diversity of fish populations is higher as compared to over-fished coral reefs found off Dar es Salaam and Tanga (McClanahan et al., 1999). Reefs around Pemba are extensive, luxuriant and diverse but only few studies have been carried out on them (Wells et al., 2004).
MangrovesA total of 8 species of mangrove, namely Avicennia marina, Bruguiera gymnorrhiza, Ceriops tagal, Heritiera littoralis, Lumnitzera racemosa, Rhizophora mucronata, Sonneratia alba and Xylocarpus granatum are found in mainland Tanzania. In addition, Xylocarpus mulluccensis occurs in Zanzibar (Ngusaru et al, 2001). The mangrove ecosystem in Tanzania is under threat due to high demand for mangrove products such as firewood, charcoal, building, boat making, in addition to commercial cutting and over harvesting, coral burning, lime production, salt making, clear-cutting for building sites, solar salt pans, commercial projects and clearance for agriculture (Shunula and Whittick, 1996; Francis et al., 2001; Wagner, 2003).
There has also been a decline in mangroves forests due to natural factors. For instance, in the Rufiji delta, the mangrove forests have declined slightly from 49,799 ha in 1990 to 49,032 ha in 2000 due to flooding of Rufiji River (Wang et al. 2003). The other main threats to the mangroves include coastal erosion and clear cutting for construction (Francis et al., 2001), clear felling for paddy farming and illegal harvesting (Sallema, 2003). The use of DDT and other pesticides on rice farms and the construction of dams and major irrigation schemes upriver are also possing a threat to the mangroves (Semesi and Mzava, 1991).
In Zanzibar, mangrove threats include rice cultivation and debarking of Rhizophora sp. for tannin production (Wells et al. 2004). This is particularly noticeable in Pemba (Wete District). Mangroves in Zanzibar are also threatened by cutting for fuel, the coral mining industry, firewood, building poles and boat making. Although Micheweni has most important stands with large mangrove trees in Zanzibar, it is threatened by selective cutting and high demand for lime production. In Unguja Island, most mangrove trees are small and few reach 10 m in height as the large ones have been cut for timber and firewood (Shunula and Whittick, 1996). There has been intensive cutting of mangroves in Chwaka Bay. Mangroves are also degraded near Maruhubi (2 km north of Zanzibar town) as a result of high demand for mangrove products by the local community (Kulindwa et al., 2001).
Seagrass bedsIn Tanzania seagrass beds are widespread and are found in all bays in most inshore areas and on the west side of most islands. The most extensive seagrass beds are found in Tanga coast, deltas of Ruvu, Wami and Rufiji rivers, Mafia and Songo songo archipelago and around Kilwa. There are 12 species of seagrass off the coast of Tanzania. The area covered by seagrass beds and the relative species densities in Tanzania are however not known (Whitney et al. 2003).
Seagrass beds in Tanzania are threatened by natural and human activities that include illegal fishing practices such as beach seining and shallow water trawling (Francis et al., 2001; Muir et al., 2003; Whitney et al., 2003), anchoring of fishing and tourist boats, excessive sedimentation increasing turbidity and reducing light penetration and shoreline dynamics involving sand deposition and removal (Whitney et al. 2003, Wells et al., 2004). Natural grazers such as sea urchins and dugongs have also in some places reduced the cover of seagrass beds (Francis et al. 2001, Whitney et al., 2003).
IssuesThe main issues in as far the critical ecosystems are concerned include increasing degradation of the ecosystems due to various anthropogenic activities including destructive fishing methods and over-exploitation. The rapid increase in coastal population is putting high pressure on finite coastal natural resources. Degradation of critical coastal ecosystems has the potential to reduce the ecosystem goods and services offered by these mangroves, coral reefs and seagrass beds. This has the potential to affect the socio-economic livelihoods of the local communities in Tanzania.
ii) GapsLack of information on the impacts of sedimentation of coral reefs, seagrass beds and mangrove forests.•
34
2. BIOPHYSICAL ENVIRONMENT
Lack of information on the key features of some coral reefs.•Lack of comprehensive descriptions and identification keys for Tanzanian coral species.•Lack of regular systematic monitoring for coral reefs.•Lack of detailed information on cover and species densities of seagrass beds and extent to which threats •pose a problem.Lack of maps showing distribution of seagrass beds and coral reefs .•Lack of current nationwide information on mangroves stock, condition and diversity. •Lack of current information on mangrove changes from year 2000 to date.•
Productivity of the Coastal zoneThe coastal and marine environments of Tanzania are characterized by high marine biodiversity and rich marine and coastal resources which amongst others, include major estuaries, mangrove forests, coral reefs, sandy beaches, cliffs, seagrass beds and muddy tidal flats (Francis and Bryceson, 2001). Rivers such as Pangani, Wami, Ruvu, Rufiji, Matandu, Mbemkuru, Lukuledi and Ruvuma all flow to the Indian Ocean and to a certain extent influence the coastal environment through creation of productive brackish water environments in estuaries, maintenance of deltas, tidal flats and shorelines and nourishment of mangroves and seagrass beds (Francis and Bryceson, 2001). These coastal ecosystems subsequently interact with each other and together sustain a tremendous diversity of marine life, which supports the livelihood of coastal communities. A wide range of important and valued species are found along the coast, including an estimated 150 species of corals in 13 families; 8,000 species of invertebrates; 1,000 species of fish; 5 species of marine turtles, and many seabirds (Francis and Bryceson, 2001).
Coral reefs Coral reefs support one of the most productive and diverse marine ecosystems in Tanzania waters and, with their associated habitats support a variety of marine species. Over 500 species of commercially important fish and other invertebrates are commonly found in coral reefs. It is estimated that 95% of artisanal fishing, which employs over 50,000 full time fishermen, is carried out on coral reefs. Coral reefs also support over 70% of the artisanal fish production in Tanzania (Saada, 2005). It is estimated that a sustainable yield of 15 tonnes of fish can be obtained per km2 in depth of less than 30 m in some coral reefs (Munro and Williams, 1985).
Generally, there is good coral reef growth and a high coral diversity in many areas in coastal Tanzania. Hamilton and Brakel (1984) recorded 140 coral species in Tanzania. Mafia Island has extensive reefs especially in the south, many in good condition. Medium diversity is found on the reefs of Mnazi Bay (Mtwara), Kunduchi (Dar es Salaam) and Tanga region. Overall reef health is probably good in most parts especially in less accessible and deeper areas i.e. the Mafia, Songo Songo and Kilwa (Saada 2005). The most degraded coral reefs are those found in shallow waters (1-10 m), especially near urban centres of Tanga, Dar es Salaam and Mtwara (Mohammed et al. 2002).
Over the past few decades, a number of factors have contributed to the degradation of coral reefs. The closeness of the reefs to land make them particularly prone to human impact, either from exploitation or from indirect terrestrial influence such as sedimentation and pollution. Many of the reefs were severely affected by the coral bleaching event of 1997-1998 that reduced the average live coral cover from 52% before bleaching to about 27% after the event (Wells et al., 2004). Follow-up assessments and monitoring indicated that although the impacts were not uniform, generally recovery has been very slow (Mohammed et al., 2002). Corals are also harvested by the local population, to exploit their rich biological and mineral value for jewellery, ornaments and building purposes.
MangrovesMangrove ecosystems include much more than just the trees and encompass terrestrial, fresh water, marine and estuarine systems. According to Francis et al., (2001), there are 8 common species of mangroves in Tanzania mainland either in pure stands or in mixtures (Figure 9). The relatively good condition and high species diversity in the mangrove communities provides important ecological and socio-economic services. Apart from shoreline protection, pollution filtration, and nutrient and sediment trapping, the most notable is their function as breeding and nursery grounds for valuable fish and shellfish species and feeding and protection of various mammals and bird species (Francis et al. 2001).
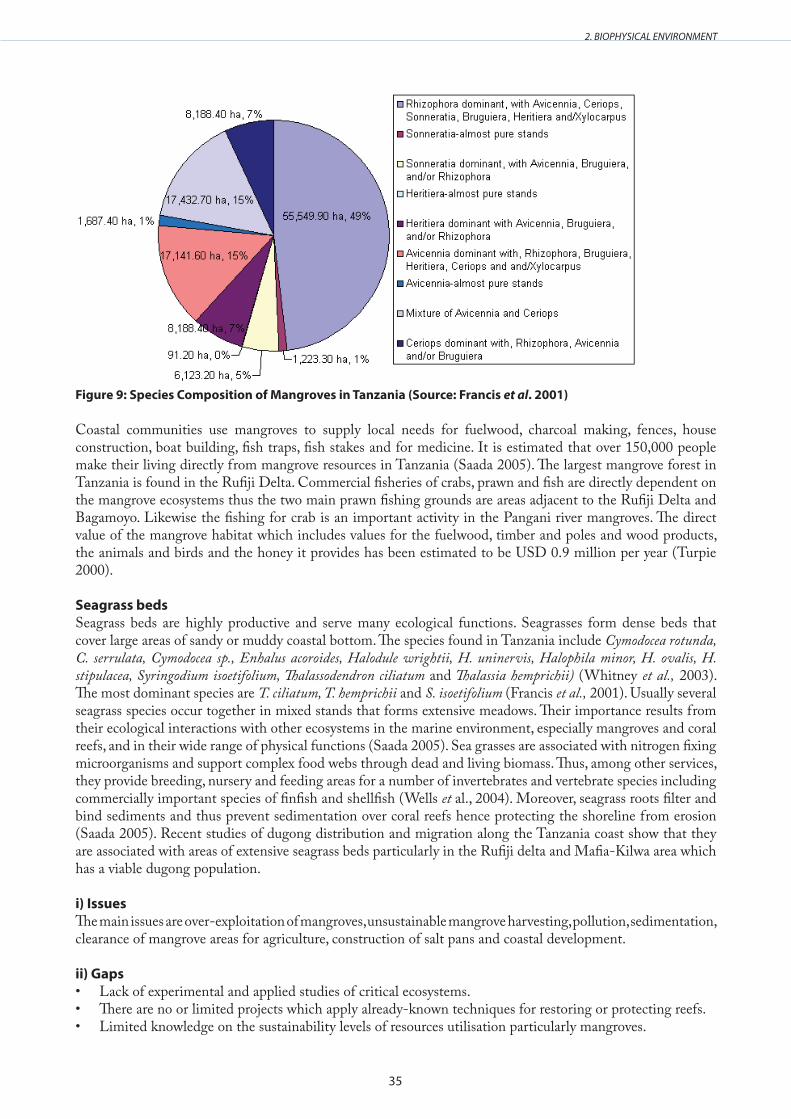
35
2. BIOPHYSICAL ENVIRONMENT
Figure 9: Species Composition of Mangroves in Tanzania (Source: Francis et al . 2001)
Coastal communities use mangroves to supply local needs for fuelwood, charcoal making, fences, house construction, boat building, fish traps, fish stakes and for medicine. It is estimated that over 150,000 people make their living directly from mangrove resources in Tanzania (Saada 2005). The largest mangrove forest in Tanzania is found in the Rufiji Delta. Commercial fisheries of crabs, prawn and fish are directly dependent on the mangrove ecosystems thus the two main prawn fishing grounds are areas adjacent to the Rufiji Delta and Bagamoyo. Likewise the fishing for crab is an important activity in the Pangani river mangroves. The direct value of the mangrove habitat which includes values for the fuelwood, timber and poles and wood products, the animals and birds and the honey it provides has been estimated to be USD 0.9 million per year (Turpie 2000).
Seagrass bedsSeagrass beds are highly productive and serve many ecological functions. Seagrasses form dense beds that cover large areas of sandy or muddy coastal bottom. The species found in Tanzania include Cymodocea rotunda, C. serrulata, Cymodocea sp., Enhalus acoroides, Halodule wrightii, H. uninervis, Halophila minor, H. ovalis, H. stipulacea, Syringodium isoetifolium, Thalassodendron ciliatum and Thalassia hemprichii) (Whitney et al., 2003). The most dominant species are T. ciliatum, T. hemprichii and S. isoetifolium (Francis et al., 2001). Usually several seagrass species occur together in mixed stands that forms extensive meadows. Their importance results from their ecological interactions with other ecosystems in the marine environment, especially mangroves and coral reefs, and in their wide range of physical functions (Saada 2005). Sea grasses are associated with nitrogen fixing microorganisms and support complex food webs through dead and living biomass. Thus, among other services, they provide breeding, nursery and feeding areas for a number of invertebrates and vertebrate species including commercially important species of finfish and shellfish (Wells et al., 2004). Moreover, seagrass roots filter and bind sediments and thus prevent sedimentation over coral reefs hence protecting the shoreline from erosion (Saada 2005). Recent studies of dugong distribution and migration along the Tanzania coast show that they are associated with areas of extensive seagrass beds particularly in the Rufiji delta and Mafia-Kilwa area which has a viable dugong population.
i) IssuesThe main issues are over-exploitation of mangroves, unsustainable mangrove harvesting, pollution, sedimentation, clearance of mangrove areas for agriculture, construction of salt pans and coastal development.
ii) GapsLack of experimental and applied studies of critical ecosystems.•There are no or limited projects which apply already-known techniques for restoring or protecting reefs.•Limited knowledge on the sustainability levels of resources utilisation particularly mangroves.•

36
2. BIOPHYSICAL ENVIRONMENT
Lack of information on coral recruitment patterns.•Lack of detailed understanding of the threats to seagrass beds.•There is no continuous monitoring of critical ecosystems using standardized approaches.•Limited financial capacity for coral reef research.•Limited knowledge on the taxonomy of corals.•There are no detailed maps showing the distribution of coral reef and sea grass beds.•Lack of knowledge on the distribution of seagrass beds.•
Microfauna and meiofauna
Meiofauna status in Marine Ecosystems of TanzaniaLittle research has been done on micro and meiofauna in Tanzania. Some of these studies include those of Ndaro et al. (1995); Ndaro and Ólafsson (1999); De Troch et al., (2001); Carlén and Ólafsson (2002); Vanhove et al., (2002); Ólafsson et al., (1995); Ólafsson (1995); and Raes et al., (2007). The dominance of epistrate feeders and the paucity of selective deposit feeders and other feeding guilds in coarse sands which are an indication that sediment granulometry influences fauna assemblage, have been carried out in the east coast of Zanzibar. The bottom meiofauna of shallow lagoons in Zanzibar have distinct nematode assemblages, principally determined by sediment chemistry in sea grass bed, fine sand and coarse sand habitats (Ndaro and Ólafsson, 1999). In Zanzibar, the variations in the structure of the microhabitat and differences in environmental conditions occur on very small spatial scales and these small-scale differences are the predominant factors determining the structure of nematode assemblages in coral degradation zones (Raes et al., 2007).
Studies have shown that seaweed Eucheuma spinosum does not affect the density of the major infauna taxa. Factors such as increased predation by benthic feeding fauna and the mechanical disturbance of the sediments better explain the variations of infauna abundance inside and outside seaweed farms. It was further revealed that low water areas have in general higher density than mid and high water areas (see also Hodda and Nicholas 1985, Alongi 1990a, Alongi 1990b, Nicholas et al 1992).
In a study investigating the effect of spring tide inundation on meiobenthos in a tropical mangrove ecosystem it was suggested that there was significant immigration of meiofauna from the lower shore into the hypersaline area during spring tide flooding. It was further observed that apart from chironomids, the meiofauna are not affected by salinity variations (89–160 ppt) and other environmental factors are therefore important in regulating the meiofauna numbers within this habitat. It was concluded that the meiobenthos were able to cope with very high salinities (Ólafsson et al 2000). Ndaro et al. (1995) has established that meiofauna varies substantially over small distances in mangroves, coastal lagoons and subtidal reefs. Recently, Gheerardyn et al. (2007) found that the composition and diversity of the harpacticoid fauna is different in different microhabitats, with a trend of changing copepod composition across these microhabitats. It appears that harpacticoid fauna associated with different microhabitats were controlled by the structural differences between coral, and gravel and sediment, and by changes in sediment grain size (Gheerardyn et al. 2007). Microhabitat type is important in structuring the harpacticoid assemblages. The coral fragments sport a specific assemblage composed of epibenthic or phytal taxa with an addition of sediment-dwelling species (Raes et al. 2007).
New species of Acari have being discovered in Tanzania. These are three halacarid mites of the genus Copidognathus (Acari: Halacaridae), a new species of the genus Arhodeoporus (Acari: Halacaridae) and Atelopsalis (Acari: Halacaridae) (Chatterjee et al. 2006, 2008, 2009). Also, a new species of Agauopsis ornata (Acari: Halacaridae) was found in Zanzibar.
Microfauna status in the Marine Ecosystems of TanzaniaIn general, studies of microfauna in Tanzania marine environments are very scarce. One study has been carried out on plankton composition and cycling of carbon in a tropical coastal ecosystem, Zanzibar, Tanzania (Lugomela et al. 2001). The second study was on diel feeding of the chaetognath Sagitta enflata in the Zanzibar Channel (Øresland 2000). There is therefore a need for further studies in this area.
i) IssuesWater level fluctuations which may determine the diversity and abundance of micro- and meiofauna.•
37
2. BIOPHYSICAL ENVIRONMENT
Global warming which may bring about the effect of temperature on the well being of micro- and •meiofauna.Dredging which will cause burial of resident fauna. The fate of buried fauna is important in terms of •possible recolonisation of a beneficial use of site.Habitat instability arising from for instance intense salinity fluctuations, infrequent tidal cover and water •stress.Physico-chemical parameters such as vertical pH changes, vertical decreases in oxygen, vertical decreases •in interstitial water content, vertical differences in organic matter.Heavy storm surges, tsunamis, flooding, extreme waves •Other issues are coastal erosion, siltation, habitat destruction and acidification.•
ii) GapsOnly a handful of studies on meiofauna assemblage structure in mangrove sediments of Zanzibar have been undertaken. Almost none have been conducted on the Tanzanian mainland. Further studies need to be done on micro and meiofauna, focussing on:
Ecophysiological studies of the micro- and meiofauna to determine the effects of temperature and •photoperiod on their growth, especially during juvenile stages.Effects of changes in physico-chemical parameters on the micro and meiofauna.•Use of micro- and meiofauna as bioindicators of marine ecosystem health.•Large scale patterns in meiobenthic diversity and community composition such as the effect of •environmental/geographical factors (e.g. region, depth, sediment type etc.) and what taxonomic level is needed to discriminate these patterns, what factor is most important in discriminating the assemblages.Feeding relationships in micro and meiofauna.•Species assembly rules to understand factors enabling high diverse communities to co-exist and to estimate •the relative importance of biological processes versus abiotic factors and stochastic processes in structuring communities.Patterns in harpacticoid copepod community composition and diversity with a focus on the relation •between diversity and density and diversity-related rarity.Effect of predation or avoidance by downward migration and/or competition for food resources on the •abundance of micro-and meiofauna.Fauna assemblage structure in different habitats.•
Macrofauna
On the Tanzania mainland, fisheries frame surveys have been conducted on annual basis from 1967 up to 1991. From 1992 the survey was scheduled on biannual basis. However, since then, the surveys were only carried out in 1998, 2001 and 2005 because of budgetary limitations. In Zanzibar, fisheries frame surveys were conducted in 1980, 1985, 1989, 1997 and 2002. The first ever Joint Marine Fisheries Frame Survey between Tanzania mainland and Zanzibar was carried out in 2007. The objective of the survey was to obtain information on the composition, magnitude and distribution of the fishing effort as well as facilities and services at landing sites in order to guide development and management of the fisheries resources. The 2007 survey recorded 36,297 fishers compared to 29,754 in 2005, from Tanzania mainland and 34,268 fishers compared to 18,618 in 2002 from Zanzibar (United Republic of Tanzania, 2008). The results of the survey are summarized in Table 4.
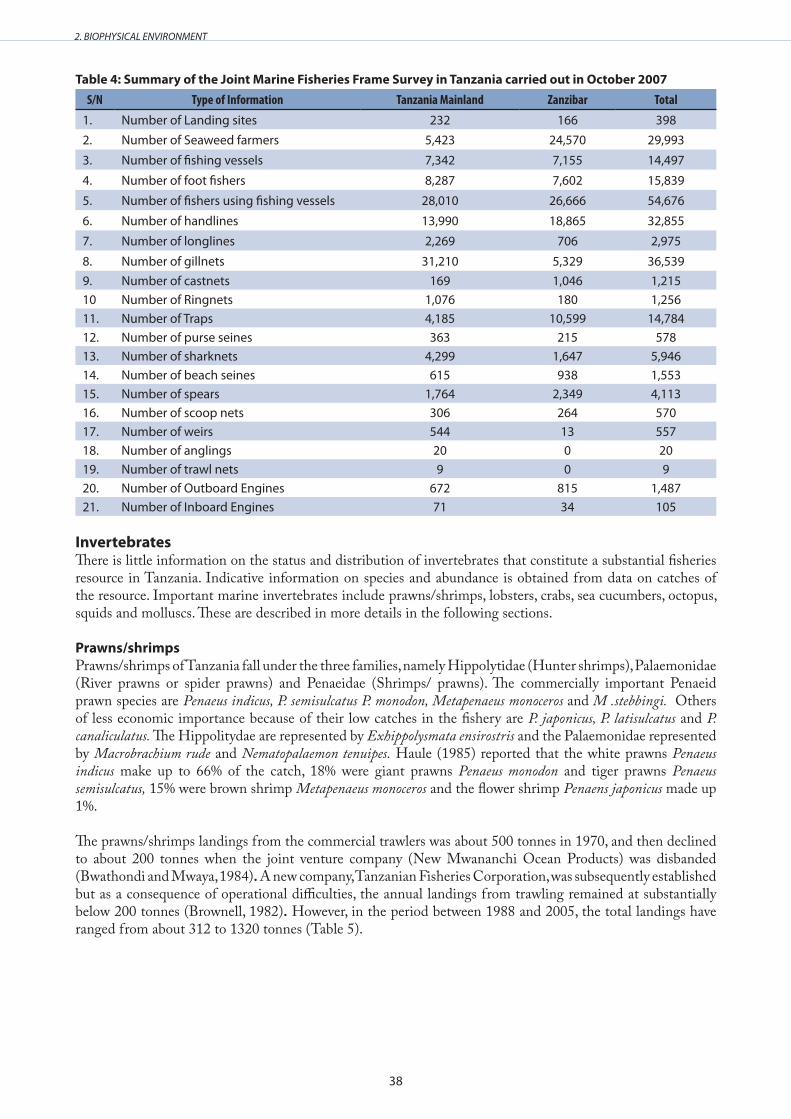
38
2. BIOPHYSICAL ENVIRONMENT
Table 4: Summary of the Joint Marine Fisheries Frame Survey in Tanzania carried out in October 2007 S/N Type of Information Tanzania Mainland Zanzibar Total
1. Number of Landing sites 232 166 3982. Number of Seaweed farmers 5,423 24,570 29,993
3. Number of fishing vessels 7,342 7,155 14,497
4. Number of foot fishers 8,287 7,602 15,839
5. Number of fishers using fishing vessels 28,010 26,666 54,676
6. Number of handlines 13,990 18,865 32,855
7. Number of longlines 2,269 706 2,975
8. Number of gillnets 31,210 5,329 36,5399. Number of castnets 169 1,046 1,21510 Number of Ringnets 1,076 180 1,25611. Number of Traps 4,185 10,599 14,78412. Number of purse seines 363 215 57813. Number of sharknets 4,299 1,647 5,94614. Number of beach seines 615 938 1,55315. Number of spears 1,764 2,349 4,11316. Number of scoop nets 306 264 57017. Number of weirs 544 13 55718. Number of anglings 20 0 2019. Number of trawl nets 9 0 920. Number of Outboard Engines 672 815 1,48721. Number of Inboard Engines 71 34 105
Invertebrates There is little information on the status and distribution of invertebrates that constitute a substantial fisheries resource in Tanzania. Indicative information on species and abundance is obtained from data on catches of the resource. Important marine invertebrates include prawns/shrimps, lobsters, crabs, sea cucumbers, octopus, squids and molluscs. These are described in more details in the following sections.
Prawns/shrimpsPrawns/shrimps of Tanzania fall under the three families, namely Hippolytidae (Hunter shrimps), Palaemonidae (River prawns or spider prawns) and Penaeidae (Shrimps/ prawns). The commercially important Penaeid prawn species are Penaeus indicus, P. semisulcatus P. monodon, Metapenaeus monoceros and M .stebbingi. Others of less economic importance because of their low catches in the fishery are P. japonicus, P. latisulcatus and P. canaliculatus. The Hippolitydae are represented by Exhippolysmata ensirostris and the Palaemonidae represented by Macrobrachium rude and Nematopalaemon tenuipes. Haule (1985) reported that the white prawns Penaeus indicus make up to 66% of the catch, 18% were giant prawns Penaeus monodon and tiger prawns Penaeus semisulcatus, 15% were brown shrimp Metapenaeus monoceros and the flower shrimp Penaens japonicus made up 1%.
The prawns/shrimps landings from the commercial trawlers was about 500 tonnes in 1970, and then declined to about 200 tonnes when the joint venture company (New Mwananchi Ocean Products) was disbanded (Bwathondi and Mwaya, 1984). A new company, Tanzanian Fisheries Corporation, was subsequently established but as a consequence of operational difficulties, the annual landings from trawling remained at substantially below 200 tonnes (Brownell, 1982). However, in the period between 1988 and 2005, the total landings have ranged from about 312 to 1320 tonnes (Table 5).
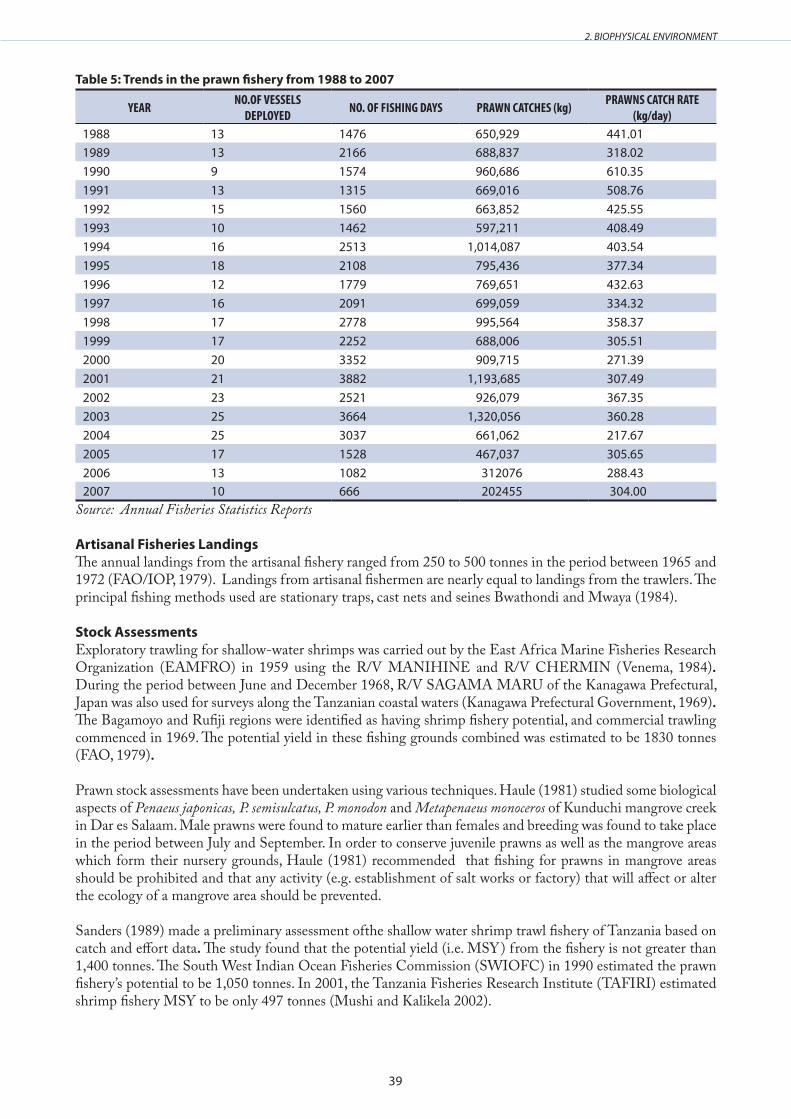
39
2. BIOPHYSICAL ENVIRONMENT
Table 5: Trends in the prawn fishery from 1988 to 2007
YEAR NO.OF VESSELS DEPLOYED NO. OF FISHING DAYS PRAWN CATCHES (kg) PRAWNS CATCH RATE
(kg/day)1988 13 1476 650,929 441.01 1989 13 2166 688,837 318.02 1990 9 1574 960,686 610.35 1991 13 1315 669,016 508.76 1992 15 1560 663,852 425.55 1993 10 1462 597,211 408.49 1994 16 2513 1,014,087 403.54 1995 18 2108 795,436 377.34 1996 12 1779 769,651 432.63 1997 16 2091 699,059 334.32 1998 17 2778 995,564 358.37 1999 17 2252 688,006 305.51 2000 20 3352 909,715 271.39 2001 21 3882 1,193,685 307.49 2002 23 2521 926,079 367.35 2003 25 3664 1,320,056 360.28 2004 25 3037 661,062 217.67 2005 17 1528 467,037 305.65 2006 13 1082 312076 288.432007 10 666 202455 304.00
Source: Annual Fisheries Statistics Reports
Artisanal Fisheries LandingsThe annual landings from the artisanal fishery ranged from 250 to 500 tonnes in the period between 1965 and 1972 (FAO/IOP, 1979). Landings from artisanal fishermen are nearly equal to landings from the trawlers. The principal fishing methods used are stationary traps, cast nets and seines Bwathondi and Mwaya (1984).
Stock AssessmentsExploratory trawling for shallow-water shrimps was carried out by the East Africa Marine Fisheries Research Organization (EAMFRO) in 1959 using the R/V MANIHINE and R/V CHERMIN (Venema, 1984). During the period between June and December 1968, R/V SAGAMA MARU of the Kanagawa Prefectural, Japan was also used for surveys along the Tanzanian coastal waters (Kanagawa Prefectural Government, 1969). The Bagamoyo and Rufiji regions were identified as having shrimp fishery potential, and commercial trawling commenced in 1969. The potential yield in these fishing grounds combined was estimated to be 1830 tonnes (FAO, 1979).
Prawn stock assessments have been undertaken using various techniques. Haule (1981) studied some biological aspects of Penaeus japonicas, P. semisulcatus, P. monodon and Metapenaeus monoceros of Kunduchi mangrove creek in Dar es Salaam. Male prawns were found to mature earlier than females and breeding was found to take place in the period between July and September. In order to conserve juvenile prawns as well as the mangrove areas which form their nursery grounds, Haule (1981) recommended that fishing for prawns in mangrove areas should be prohibited and that any activity (e.g. establishment of salt works or factory) that will affect or alter the ecology of a mangrove area should be prevented.
Sanders (1989) made a preliminary assessment ofthe shallow water shrimp trawl fishery of Tanzania based on catch and effort data. The study found that the potential yield (i.e. MSY) from the fishery is not greater than 1,400 tonnes. The South West Indian Ocean Fisheries Commission (SWIOFC) in 1990 estimated the prawn fishery’s potential to be 1,050 tonnes. In 2001, the Tanzania Fisheries Research Institute (TAFIRI) estimated shrimp fishery MSY to be only 497 tonnes (Mushi and Kalikela 2002).
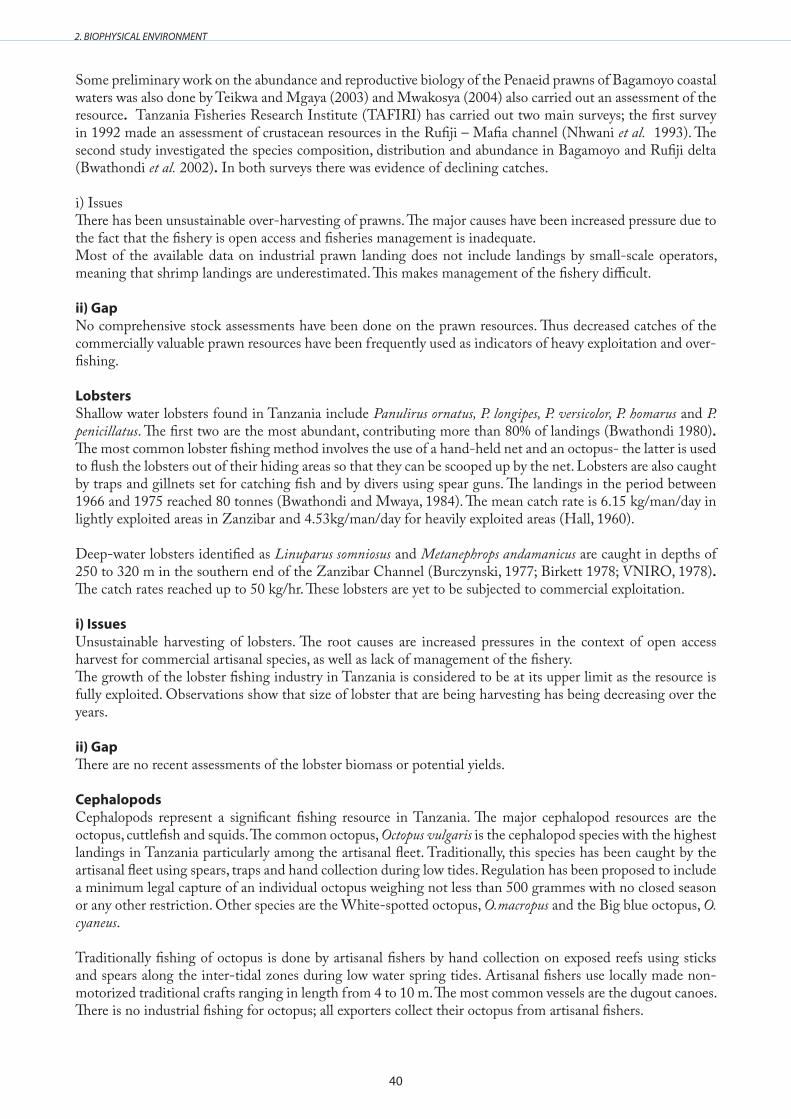
40
2. BIOPHYSICAL ENVIRONMENT
Some preliminary work on the abundance and reproductive biology of the Penaeid prawns of Bagamoyo coastal waters was also done by Teikwa and Mgaya (2003) and Mwakosya (2004) also carried out an assessment of the resource. Tanzania Fisheries Research Institute (TAFIRI) has carried out two main surveys; the first survey in 1992 made an assessment of crustacean resources in the Rufiji – Mafia channel (Nhwani et al. 1993). The second study investigated the species composition, distribution and abundance in Bagamoyo and Rufiji delta (Bwathondi et al. 2002). In both surveys there was evidence of declining catches.
i) IssuesThere has been unsustainable over-harvesting of prawns. The major causes have been increased pressure due to the fact that the fishery is open access and fisheries management is inadequate. Most of the available data on industrial prawn landing does not include landings by small-scale operators, meaning that shrimp landings are underestimated. This makes management of the fishery difficult.
ii) GapNo comprehensive stock assessments have been done on the prawn resources. Thus decreased catches of the commercially valuable prawn resources have been frequently used as indicators of heavy exploitation and over-fishing.
LobstersShallow water lobsters found in Tanzania include Panulirus ornatus, P. longipes, P. versicolor, P. homarus and P. penicillatus. The first two are the most abundant, contributing more than 80% of landings (Bwathondi 1980). The most common lobster fishing method involves the use of a hand-held net and an octopus- the latter is used to flush the lobsters out of their hiding areas so that they can be scooped up by the net. Lobsters are also caught by traps and gillnets set for catching fish and by divers using spear guns. The landings in the period between 1966 and 1975 reached 80 tonnes (Bwathondi and Mwaya, 1984). The mean catch rate is 6.15 kg/man/day in lightly exploited areas in Zanzibar and 4.53kg/man/day for heavily exploited areas (Hall, 1960).
Deep-water lobsters identified as Linuparus somniosus and Metanephrops andamanicus are caught in depths of 250 to 320 m in the southern end of the Zanzibar Channel (Burczynski, 1977; Birkett 1978; VNIRO, 1978). The catch rates reached up to 50 kg/hr. These lobsters are yet to be subjected to commercial exploitation.
i) IssuesUnsustainable harvesting of lobsters. The root causes are increased pressures in the context of open access harvest for commercial artisanal species, as well as lack of management of the fishery.The growth of the lobster fishing industry in Tanzania is considered to be at its upper limit as the resource is fully exploited. Observations show that size of lobster that are being harvesting has being decreasing over the years.
ii) GapThere are no recent assessments of the lobster biomass or potential yields.
CephalopodsCephalopods represent a significant fishing resource in Tanzania. The major cephalopod resources are the octopus, cuttlefish and squids. The common octopus, Octopus vulgaris is the cephalopod species with the highest landings in Tanzania particularly among the artisanal fleet. Traditionally, this species has been caught by the artisanal fleet using spears, traps and hand collection during low tides. Regulation has been proposed to include a minimum legal capture of an individual octopus weighing not less than 500 grammes with no closed season or any other restriction. Other species are the White-spotted octopus, O.macropus and the Big blue octopus, O. cyaneus.
Traditionally fishing of octopus is done by artisanal fishers by hand collection on exposed reefs using sticks and spears along the inter-tidal zones during low water spring tides. Artisanal fishers use locally made non-motorized traditional crafts ranging in length from 4 to 10 m. The most common vessels are the dugout canoes. There is no industrial fishing for octopus; all exporters collect their octopus from artisanal fishers.
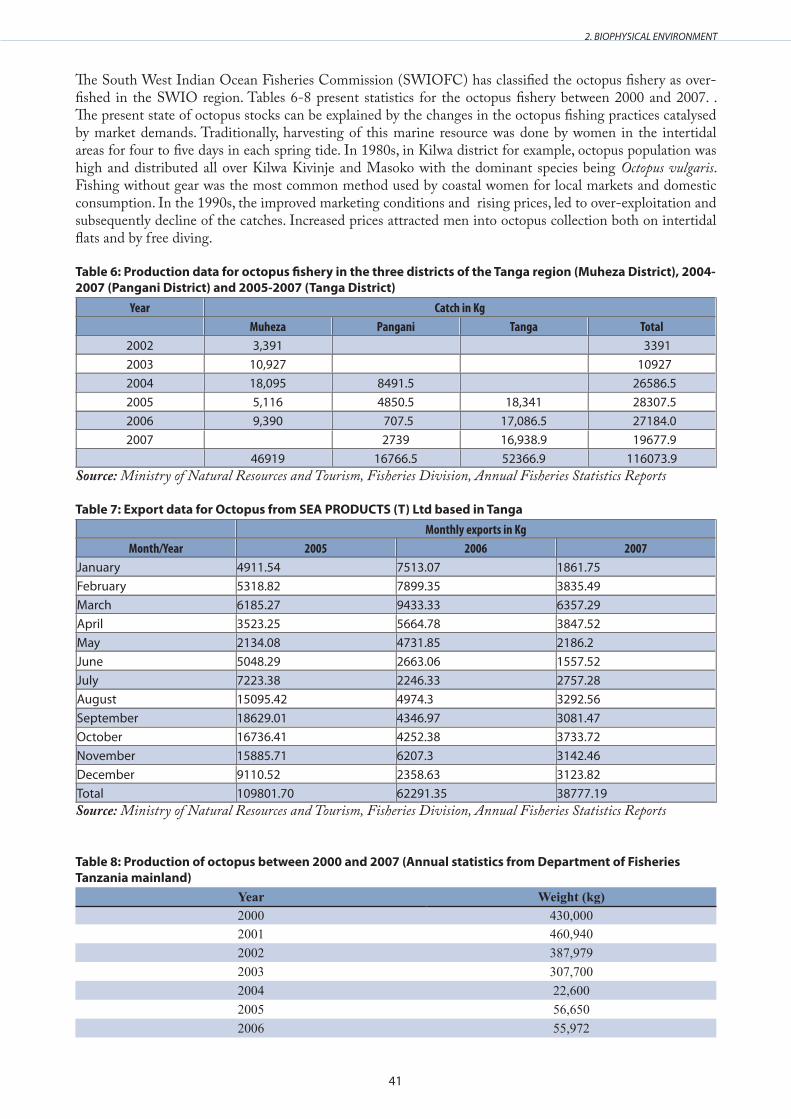
41
2. BIOPHYSICAL ENVIRONMENT
The South West Indian Ocean Fisheries Commission (SWIOFC) has classified the octopus fishery as over-fished in the SWIO region. Tables 6-8 present statistics for the octopus fishery between 2000 and 2007. . The present state of octopus stocks can be explained by the changes in the octopus fishing practices catalysed by market demands. Traditionally, harvesting of this marine resource was done by women in the intertidal areas for four to five days in each spring tide. In 1980s, in Kilwa district for example, octopus population was high and distributed all over Kilwa Kivinje and Masoko with the dominant species being Octopus vulgaris. Fishing without gear was the most common method used by coastal women for local markets and domestic consumption. In the 1990s, the improved marketing conditions and rising prices, led to over-exploitation and subsequently decline of the catches. Increased prices attracted men into octopus collection both on intertidal flats and by free diving.
Table 6: Production data for octopus fishery in the three districts of the Tanga region (Muheza District), 2004-2007 (Pangani District) and 2005-2007 (Tanga District)
Year Catch in KgMuheza Pangani Tanga Total
2002 3,391 33912003 10,927 109272004 18,095 8491.5 26586.52005 5,116 4850.5 18,341 28307.52006 9,390 707.5 17,086.5 27184.02007 2739 16,938.9 19677.9
46919 16766.5 52366.9 116073.9Source: Ministry of Natural Resources and Tourism, Fisheries Division, Annual Fisheries Statistics Reports
Table 7: Export data for Octopus from SEA PRODUCTS (T) Ltd based in Tanga Monthly exports in Kg
Month/Year 2005 2006 2007January 4911.54 7513.07 1861.75February 5318.82 7899.35 3835.49March 6185.27 9433.33 6357.29April 3523.25 5664.78 3847.52May 2134.08 4731.85 2186.2June 5048.29 2663.06 1557.52July 7223.38 2246.33 2757.28August 15095.42 4974.3 3292.56September 18629.01 4346.97 3081.47October 16736.41 4252.38 3733.72November 15885.71 6207.3 3142.46December 9110.52 2358.63 3123.82Total 109801.70 62291.35 38777.19Source: Ministry of Natural Resources and Tourism, Fisheries Division, Annual Fisheries Statistics Reports
Table 8: Production of octopus between 2000 and 2007 (Annual statistics from Department of Fisheries Tanzania mainland)
Year Weight (kg)2000 430,0002001 460,9402002 387,9792003 307,7002004 22,6002005 56,6502006 55,972
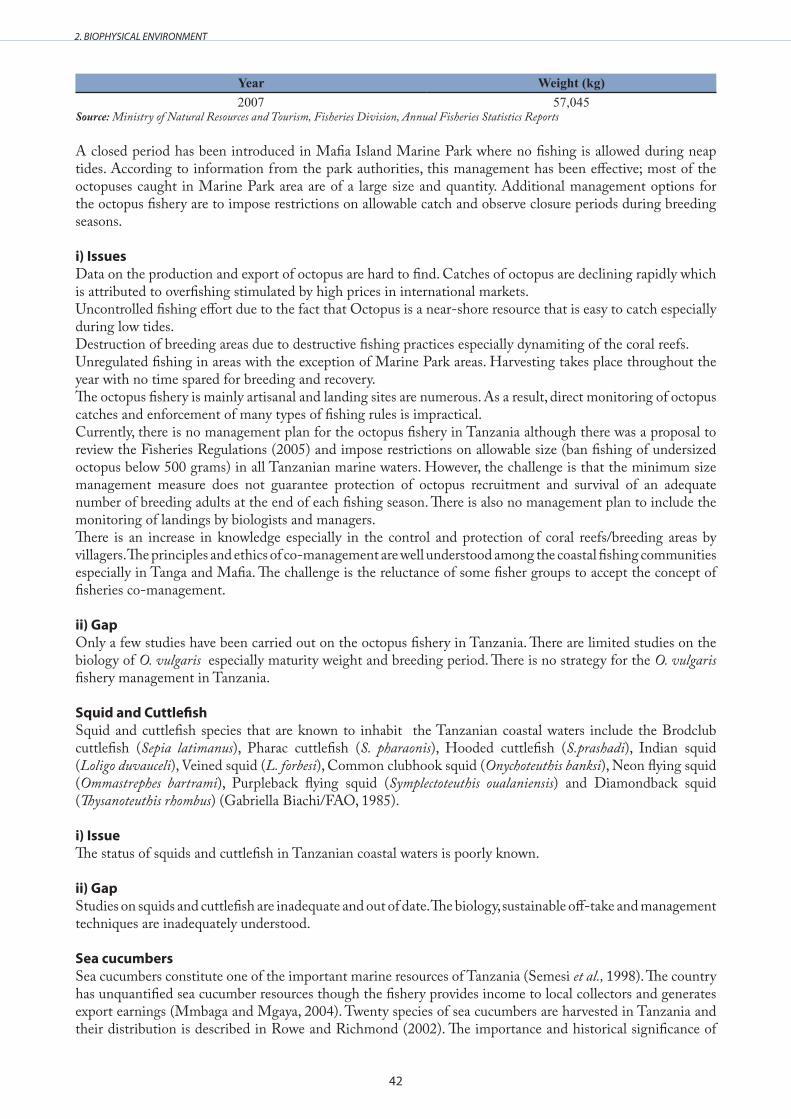
42
2. BIOPHYSICAL ENVIRONMENT
Year Weight (kg)2007 57,045
Source: Ministry of Natural Resources and Tourism, Fisheries Division, Annual Fisheries Statistics Reports
A closed period has been introduced in Mafia Island Marine Park where no fishing is allowed during neap tides. According to information from the park authorities, this management has been effective; most of the octopuses caught in Marine Park area are of a large size and quantity. Additional management options for the octopus fishery are to impose restrictions on allowable catch and observe closure periods during breeding seasons.
i) IssuesData on the production and export of octopus are hard to find. Catches of octopus are declining rapidly which is attributed to overfishing stimulated by high prices in international markets.Uncontrolled fishing effort due to the fact that Octopus is a near-shore resource that is easy to catch especially during low tides. Destruction of breeding areas due to destructive fishing practices especially dynamiting of the coral reefs. Unregulated fishing in areas with the exception of Marine Park areas. Harvesting takes place throughout the year with no time spared for breeding and recovery. The octopus fishery is mainly artisanal and landing sites are numerous. As a result, direct monitoring of octopus catches and enforcement of many types of fishing rules is impractical.Currently, there is no management plan for the octopus fishery in Tanzania although there was a proposal to review the Fisheries Regulations (2005) and impose restrictions on allowable size (ban fishing of undersized octopus below 500 grams) in all Tanzanian marine waters. However, the challenge is that the minimum size management measure does not guarantee protection of octopus recruitment and survival of an adequate number of breeding adults at the end of each fishing season. There is also no management plan to include the monitoring of landings by biologists and managers.There is an increase in knowledge especially in the control and protection of coral reefs/breeding areas by villagers. The principles and ethics of co-management are well understood among the coastal fishing communities especially in Tanga and Mafia. The challenge is the reluctance of some fisher groups to accept the concept of fisheries co-management.
ii) GapOnly a few studies have been carried out on the octopus fishery in Tanzania. There are limited studies on the biology of O. vulgaris especially maturity weight and breeding period. There is no strategy for the O. vulgaris fishery management in Tanzania.
Squid and CuttlefishSquid and cuttlefish species that are known to inhabit the Tanzanian coastal waters include the Brodclub cuttlefish (Sepia latimanus), Pharac cuttlefish (S. pharaonis), Hooded cuttlefish (S.prashadi), Indian squid (Loligo duvauceli), Veined squid (L. forbesi), Common clubhook squid (Onychoteuthis banksi), Neon flying squid (Ommastrephes bartrami), Purpleback flying squid (Symplectoteuthis oualaniensis) and Diamondback squid (Thysanoteuthis rhombus) (Gabriella Biachi/FAO, 1985).
i) IssueThe status of squids and cuttlefish in Tanzanian coastal waters is poorly known.
ii) GapStudies on squids and cuttlefish are inadequate and out of date. The biology, sustainable off-take and management techniques are inadequately understood.
Sea cucumbersSea cucumbers constitute one of the important marine resources of Tanzania (Semesi et al., 1998). The country has unquantified sea cucumber resources though the fishery provides income to local collectors and generates export earnings (Mmbaga and Mgaya, 2004). Twenty species of sea cucumbers are harvested in Tanzania and their distribution is described in Rowe and Richmond (2002). The importance and historical significance of

43
2. BIOPHYSICAL ENVIRONMENT
this fishery to the local coastal communities is indicated by the presence of at least 50 different Swahili names for different species (Marshall et al., 2001).
A study conducted on Mafia Island revealed that Actinopyga miliaris, Bohadschia argus, B. marmorata and Stichopus variegatus occurred are most preferred in trade. The most valuable species including Holothuria scabra, H. nobilis, H. spinifera and Holothuria sp. form a very small percentage of the total cucumber catches. There has been a shift from more highly valuable commercial species such as H. scabra and H. nobilis that previously dominated the catch (Marshall et al. 2001).
Mmbaga (2002) and Kithakeni and Ndaro (2002) conducted studies on some aspects of the biology of Holothuria scabra along the coast of Dar es Salaam at Kunduchi, the most exploited shore, and Buyuni, a shore with no history of exploitation. The total catch of H. scabra at Buyuni was significantly higher compared to that from Kunduchi. The stomach contents revealed sand, small gastropods, detritus, debris of red algae and fresh pieces of polychaetes and unidentified animal parts mixed with sediments (Mmbaga, 2002). Studies of the gonads indicated that although reproduction was continuous throughout the year, gonad indices showed two peak periods - June to August and December to January. Using a length distribution for 240 specimens of H. scabra measured between January and December 1999, Kithakeni and Ndaro (2002) showed that the frequency distribution was unimodal, with most individuals ranging in length from 8.5 and 26.5 cm. The most frequent length category was 17.5 cm. The total catch consisted of individuals measuring between 7 and 27 cm. Kithakeni and Ndaro (2002) reported size at first maturity of H. scabra at Dar es Salaam coast to be 16.8 cm.
The sea cucumber fishery is largely artisanal with a small commercial operation monopolized by a few exporters. The level of exploitation differs from shore to shore depending on fisher folk’s experience, the number and category of fishers, fishing techniques and season. A study by Mgaya et al. (1999) on sea cucumbers in Bagamoyo reported that local exploitation occurred year-round on reef flats close to the shore or sheltered from the prevailing winds and that the main collection seasons were October to December and April to May. This is the period when the winds were usually light, and trips could be made to the off-shore reefs. Collection methods in Bagamoyo area included hand-picking either from the intertidal reef flats or by snorkel diving over sand and seagrass areas, collection by free divers, using both manufactured and home-made goggles and collection using SCUBA. The latter technique is becoming increasingly popular as shallow water areas are depleted and fishers are moving to deeper waters. The use of SCUBA diving to collect deepwater cucumbers makes the species vulnerable to over-harvesting and can deplete breeding stocks causing recruitment overfishing.
Depletion of sea cucumber resources in Tanzania was first reported at Songo Songo by Darwall (1996a, 1996b). Other studies that reported depletion included that of Jiddawi (1997) in Zanzibar, Guard (1998) in Mtwara, Horsfall (1998) and Mgaya et al. (1999) in Bagamoyo and Kithakeni and Ndaro (2002) at Kunduchi, Dar es Salaam. Interviews conducted by Mgaya et al. (1999) with sea cucumber collectors in Bagamoyo indicated that the stocks were declining and the average size of individuals was decreasing. Removal of large individuals may affect reproduction and lead to recruitment overfishing. Although the collectors recognize that part of the problem is harvesting of juveniles due to lack of effective policing, they continue to collect juveniles as “others will do so if they don’t” - a typical tragedy of the commons scenario (Hardin, 1968).
Open access to unmanaged sea cucumber resources has definitely led to depletion of the stock. Importation statistics for sea cucumbers reported in Hong Kong during January–March 1996 showed that Tanzania ranked high in the Western Indian Ocean region for the level of exports. Tanzania produced up to 1,644 tonnes by the end of 1996 (Conand, 2004a & 2004b). Although it is difficult to accurately estimate historical and current production of sea cucumbers in Tanzania, the available data indicates a very serious decline in production in the last decade, from >1500 tonnes in 1994 to 10 tonnes in 2004. The number of exporters has also decreased over time from 23 to 8 on mainland Tanzania and from 6 to 2 in Zanzibar between 1993 and 1997. This is an indication of the reduction in the profitability of the sea cucumber fishery (Marshall et al. 2001).
i) IssuesFisheries regulations vary between Mainland Tanzania and Zanzibar. For example, a ban prohibiting sea cucumber fishing was implemented in September 2006 on Mainland Tanzania but not on Zanzibar. The impacts of such regulations on the fisheries are difficult to assess due to the lack of adequate monitoring of the

44
2. BIOPHYSICAL ENVIRONMENT
catch during the period the ban is in force.
Cross border transfers of sea cucumber from Tanga to Vanga in Kenya and from Mozambique to Mtwara in Tanzania complicate the export statistics. The need for generating up-to-date information on the status of the resources cannot be overemphasized.
ii) GapThe sea cucumber fishery developed without baseline data on the biology and reproductio and without any monitoring. Very few studies have been carried out on the general biology of sea cucumbers in Tanzania. No studies on the growth, larval ecology, recruitment, or mortality of any sea cucumber species has been conducted in Tanzania. These gaps need to be filled as soon as possible.
ShellsIn Tanzania, shells particularly those of queen snails (Turbo marmoratus), helmet snails (Cypraecassis rufa), tiger cowrie (Cypraea tigris), money cowrie (C. moneta) and the most valuable cowrie (C.mauritiana) are collected and exported for curio trade. Most of the curio shells are rare and threatened species. Shells for ornamental purposes are also collected all along the coast. They are gathered along the beaches and in reef areas during low tide. Although intended for the tourist market, a large proportion was exported by the Tanzania Fisheries Corporation and Zanzibar State Trading Corporation. A great deal of damage to the intertidal and near shore areas has been caused by shell collectors through trampling. This activity was very intensive along the shore of Zanzibar in the late 1970s (Halsted and Halsted 1986).
i) IssuesOver-harvesting of shells: most of the curio shells are rare and threatened speciesHabitat destruction in the process of harvesting shells.
II) GapNo recent scientific studies have been carried out on shell collection. The damage caused on the coral reefs by shell collectors and open water seining may in certain areas be of the same magnitude or even greater than that of dynamite fishing. There is a need for regulatory measures to be imposed on shell collection.
Fish and fish resourcesFish resource assessment surveys conducted in the mid 1980s in Tanzania marine waters, gave estimates on the standing stocks for coastal waters ranging from 94,000 tonnes to 174,000 tonnes (Iversen et al,. 1984). Annual fish yield was estimated to be about 38,000 tonnes per year for demersal species and about 23,000 tonnes for pelagic species, such as sardines and small tuna. This gave an overall yield of 60,000 tonnes per year for commercial marine fish resources for the Tanzanian mainland.
For Zanzibar the potential fish yields has been estimated to be 20,000 tonnes per year for pelagic species (FAO, 1988). An optimistic estimate of a potential annual yield in Tanzania’s territorial waters is 100,000 tonnes (Linden and Lundin, 1996). Currently, landed fish catch is estimated to be 50,000 tonnes per year. Marine fish production and value for Tanzania Mainland and Zanzibar in the period 1988 – 1992 are presented in Table 9.
Table 9: Marine fish production and values for Tanzania 1988- 1992 (a) Mainland
Year Number of fishers
Number of vessels
Artisanal catches (tons)
Industrial catches (tons) Total Value (Tsh) (1000Tsh)
1988 13,855 4,390 47,193 2,190 49,383 2,568,859?1990 16,178 4,354 54,527 2,015 56,542 4,663,069?1991 16,361 4,402 52,380 1,510 53,891 6,159,297?1992 15,027 3,514 42,183 1,119 43,302 6,014,473?
Source: Fisheries Division, Ministry of Tourism Natural Resources and Environment, Dar es Salaam
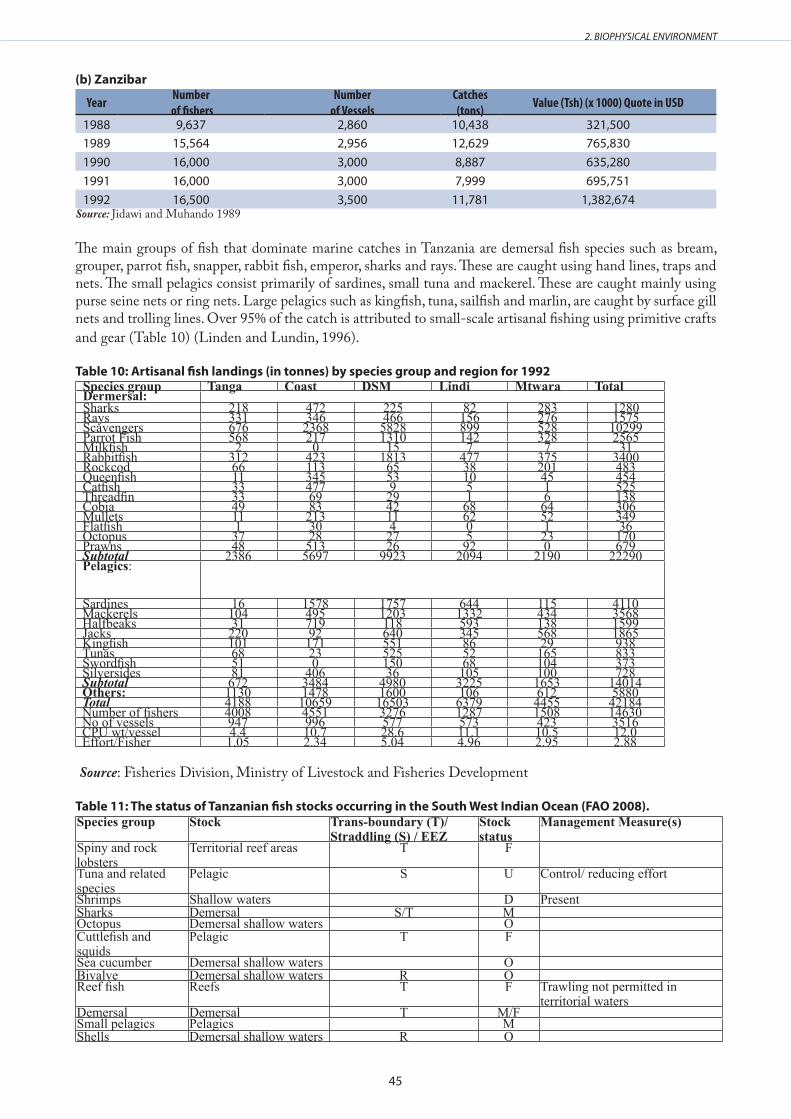
45
2. BIOPHYSICAL ENVIRONMENT
(b) Zanzibar
Year Number of fishers
Numberof Vessels
Catches (tons) Value (Tsh) (x 1000) Quote in USD
1988 9,637 2,860 10,438 321,5001989 15,564 2,956 12,629 765,8301990 16,000 3,000 8,887 635,2801991 16,000 3,000 7,999 695,7511992 16,500 3,500 11,781 1,382,674
Source: Jidawi and Muhando 1989
The main groups of fish that dominate marine catches in Tanzania are demersal fish species such as bream, grouper, parrot fish, snapper, rabbit fish, emperor, sharks and rays. These are caught using hand lines, traps and nets. The small pelagics consist primarily of sardines, small tuna and mackerel. These are caught mainly using purse seine nets or ring nets. Large pelagics such as kingfish, tuna, sailfish and marlin, are caught by surface gill nets and trolling lines. Over 95% of the catch is attributed to small-scale artisanal fishing using primitive crafts and gear (Table 10) (Linden and Lundin, 1996).
Table 10: Artisanal fish landings (in tonnes) by species group and region for 1992 Species group Tanga Coast DSM Lindi Mtwara TotalDermersal:Sharks 218 472 225 82 283 1280Rays 331 346 466 156 276 1575Scavengers 676 2368 5828 899 528 10299Parrot Fish 568 217 1310 142 328 2565Milkfish 2 0 15 7 7 31Rabbitfish 312 423 1813 477 375 3400Rockcod 66 113 65 38 201 483Queenfish 11 345 53 10 45 454Catfish 33 477 9 5 1 525Threadfin 33 69 29 1 6 138Cobia 49 83 42 68 64 306Mullets 11 213 11 62 52 349Flatfish 1 30 4 0 1 36Octopus 37 28 27 5 23 170Prawns 48 513 26 92 0 679Subtotal 2386 5697 9923 2094 2190 22290Pelagics:
Sardines 16 1578 1757 644 115 4110Mackerels 104 495 1203 1332 434 3568Halfbeaks 31 719 118 593 138 1599Jacks 220 92 640 345 568 1865Kingfish 101 171 551 86 29 938Tunas 68 23 525 52 165 833Swordfish 51 0 150 68 104 373Silversides 81 406 36 105 100 728Subtotal 672 3484 4980 3225 1653 14014Others: 1130 1478 1600 106 612 5880Total 4188 10659 16503 6379 4455 42184Number of fishers 4008 4551 3276 1287 1508 14630No of vessels 947 996 577 573 423 3516CPU wt/vessel 4.4 10.7 28.6 11.1 10.5 12.0Effort/Fisher 1.05 2.34 5.04 4.96 2.95 2.88
Source: Fisheries Division, Ministry of Livestock and Fisheries Development
Table 11: The status of Tanzanian fish stocks occurring in the South West Indian Ocean (FAO 2008) . Species group Stock Trans-boundary (T)/
Straddling (S) / EEZStock status
Management Measure(s)
Spiny and rock lobsters
Territorial reef areas T F
Tuna and related species
Pelagic S U Control/ reducing effort
Shrimps Shallow waters D PresentSharks Demersal S/T M Octopus Demersal shallow waters O Cuttlefish and squids
Pelagic T F
Sea cucumber Demersal shallow waters O Bivalve Demersal shallow waters R O Reef fish Reefs T F Trawling not permitted in
territorial watersDemersal Demersal T M/F Small pelagics Pelagics M Shells Demersal shallow waters R O
46
2. BIOPHYSICAL ENVIRONMENT
Coelacanth EEZ ?
The CoelacanthThe sighting of Coelacanth in Tanzania started in September 2003, when a single fish was caught off the coast of Songa Mnara near Kilwa by deep-set gillnets. Since then, more than 35 captures of Coelacanths have been reported by rural fishers in the fishing villages of Kigombe, Mwarongo and Mwambani, South of Tanga, Mtwara, Lindi and Dar es Salaam (Marine Parks and Reserves Unit, 2005). The unprecedented catches of coelacanths in Tanzania especially in Kigombe in Tanga called for urgent measures to stop catches of this highly endangered species (Marine Parks and Reserves Unit, 2005). The National Committee for the African Coelacanth Ecosystem Programe (ACEP) organized a Stakeholder workshop to initiate the process for creation of a marine protected area to conserve the coelacanths and other marine resources in Tanga region in 2009. Subsequently, the Tanga Coelacanth Marine Park was established to conserve coelacanths and their habitats.
Issues OverharvestingAt present, coastal fisheries in Tanzania are dominated by artisanal fisheries which contribute more than 96% of the total marine fish catches. The artisanal fishery is concentrated in shallow inshore waters because of limited range of fishing vessels and crafts. Most of the fishermen use simple gear and vessels of limited operational range. Fishing vessels include dugout canoes, outrigger canoes, sailboats and dhow. These vessels are normally driven by sails but can be fitted with outboard engines. The operational range of a vessel is determined by its size and whether it is sail or motor driven. Vessels driven by sails rarely go further than 4km from the shore. Their fishing gear includes traps, hooks and lines, nets and harpoons. The most productive fishing grounds are coral reefs, sea-grass beds and reef flats. These areas are experiencing very heavy fishing pressure and are showing signs of over-exploitation (Tarbit, 1984). Nylon gill nets introduced in the late 1960s, are non-degradable and if lost continue fishing indefinitely. Monofilament gill nets have been banned, although there are still being used by fishermen in certain areas.
Destructive fishing methods The most destructive fishing practice in Tanzanian coastal waters is dynamite fishing. This type of fishing has been used in the inshore waters since the early 1960s. It is mainly used in coastal areas near urban centres such as Dar es Salaam, Tanga and Lindi. It causes major destruction of the coral reefs and fish of different sizes and species are killed indiscriminately. Part of the decline in the productivity and catches of artisanal fishery can be attributed to dynamite fishing. Dynamite fishing has degraded the coral reefs to such an extent that only two (Latham and Mafia) of the eight coral reef sites recommended for marine parks in 1968 had intact coral reefs in 1983 (Salm, 1983). The rest of the reefs have been reduced to rubble. Surveillance of dynamite fishing is done by the Fisheries Department in collaboration with the police. However, this is usually ineffective. The number of fishermen caught while dynamite fishing has however increased since it was banned in 1972 (Ngoile, 1982).
Habitat destructionIn Tanzania, seine nets are operated either on the beaches or in open waters around patch reefs. In the latter case the fishermen survey the reefs and select the one which has a high concentration of fish. The selected reef is encircled with nets and the fish are then scared by breaking the coral heads. As the fish try to escape, they are caught in the seine. This is a destructive form of fishing, as it not only damages reefs, but it is indiscriminate catching also immature fish. Unfortunately, it is a common method in Zanzibar and Pemba islands. There were 2608 seine nets in the islands in 1982 (Ngoile, 1982).
Regional issues (shared by neighbouring countries)To date, industrial fishing in Tanzania has been limited to prawn trawling. The EEZ has not been exploited significantly, although there is a potential to increase landings of tuna and similar fish species. In order to benefit from the potential fish catches in the EEZ, vessel licensing has to be combined with effective monitoring, surveillance and control system in collaboration with neighbouring coastal and island states. This is a very difficult task that requires significant capacity building.

47
2. BIOPHYSICAL ENVIRONMENT
GAPInadequate knowledge on the resource base
MammalsWhales, dolphins, dugongs and porpoises are some of the marine animals which frequently occur in the marine coastal waters of Tanzania. Eight species of dolphins have been observed in various places including the Rufiji delta, Mtwara, Tanga, Saadan, Latham Island, Menai bay, Nungwi and Matemwe. Humpback Whales have also been observed near the coast of Tanga and Mnazi Bay. Ray (1968) identified Rufiji and Kilwa as the last remaining refuges for dugongs along the Tanzania coast.
Until recently, dugongs were thought to have disappeared from northern Tanzania -their former stronghold. Their presence in the south was unknown (Marshall et al. 2001). The first documented records of dugongs were of 3 animals netted by local fishermen in afia Island in 1930 (Dollman, 1933).
The Pemba-Zanzibar channel in northern Tanzania is also recognized as an important dugong habitat (Bryceson, 1981; Korrubel and Cockcroft, 1997; Howell, 1998; UNEP, 2001), although it is believed dugongs in this area are already locally extinct since the last one was reported in 1990 (Chande et al. 1994; Cockcroft and Krohn, 1994; Marshall et al. 2001). Populations have declined significantly in recent decades possibly to the point where they cannot recover. Dugong numbers are estimated to be no more than 100 individuals (Ngusaru et al., 2001).
Prior to the mid-1970s, dugongs were both abundant and widely distributed along the Tanzania coast. During this period, they were actively hunted in some areas using “dugong nets” and occasionally dynamites. Over the past 25-30 years, dugong numbers have declined dramatically and sightings are now rare. Small resident populations exists in just two remaining areas: the Rufiji-Kilwa-Mafia area and at Moa in Tanga region, near the Kenyan border.
Nylon filament gillnets introduced in Tanzania in the late 1960s (Amir et al, 2002), posses the greatest threat to dugongs. InMuheza District dugongs were actively hunted using dynamite until the 1970s (Amir et al., 2002).
Rapid population growth, rapid urban expansion and industrial development are resulting in the reduction in the quality of coastal waters due to pollution of important dugong feeding grounds (Pratap, 1988). Estuarine and coastal habitats are being degraded and this is threatening future survival of dugongs (Cockcroft and Krohn, 1994). Gas and oil exploration in the Songo Songo archipelago, off the southern Rufiji delta is also a potential threat particularly due to general disturbance (e.g. pipe laying) and oil/gas leaks. Population declines are also attributed to low reproduction rates of dugongs.
i) IssuesThere have been reported incidences of unexpected Dolphin deaths in Zanzibar. The causes of the deaths are yet to be established.Dugong is one of the most endangered species on the African continent and is on the IUCN Red list (IUCN, 2000). It is almost extinct in Tanzania, threatened by degradation of its main habitat; sea grass beds. It is also slaughtered for its meat and oil. The other main threats to dugongs in Tanzania are accidental capture in gillnets, seagrass damage from trawlers and seine nets, disturbance from boat traffic, dynamite fishing and offshore gas and oil extraction activities, and coastal development
ii) GapInformation on dugong distribution and abundance in Tanzania is mostly from anecdotal reports and incidental sightings. There is a need for comprehensive research to determine the current distribution and population dynamics.

48
2. BIOPHYSICAL ENVIRONMENT
Reptiles
Marine Turtles Five species of marine turtles occur in Tanzania’s coastal waters. These are the green (Chelonia mydas), hawksbill (Eretmochelys imbricata), loggerhead (Caretta caretta), olive ridley (Lepidochelys olivacea) and leatherback (Dermochelys coriacea) turtles. The first studies on the status, distribution, uses of and threats to turtles in Tanzania were conducted by Frazier (1976, 1980). However, it was not until the early 1990s that more widespread efforts to conserve turtles were made, and it was only recently that more comprehensive surveys were conducted in Mafia, Pemba, Unguja, Saadani, Temeke and Mtwara.
Green turtleThe green turtle is the most common nesting species in Tanzania. Population size estimates from the mid 1970s put the total number in the whole of Tanzania at approximately 300. The majority of these were thought to nest on a single island, Maziwe, south of Tanga, which was considered the most important breeding ground for turtles in Tanzania and East Africa as a whole. The other sites include the small islands near Mafia (Frazier, 1976). In the 1980s, Maziwe Island submerged as a result of erosion and now exists as a shifting tidal sand bank on top of Maziwe reef (Howell and Mbindo, 1996). It is no longer a suitable nesting site (Howell, 1993), although local informants report that green turtles continue to nest on the sand bar even though the nests are inundated during both spring and neap tides (Muir, 2005).
The concentrated nesting activity occurs on Misali Island (Pemba), Mnemba and Matemwe Island (Unguja), Mafia Island ( Juani Island and Kungwi), Saadani (Madete) and Mtwara (Msimbati and Litokoto and Kingumi Islands) (Khatib, 1998a, 1998b; Pharaoh et al,. 2003; Muir 2005).
Anecdotal reports also highlight a number of other important nesting sites in Zanzibar and along the mainland coast. While low density nesting has been reported along the mainland coast from Tanga in the north to Mtwara in the south, the most concentrated numbers of nests appear to be on the offshore islands of Zanzibar, Mafia and Songo Songo archipelago. The main nesting season is between February and July. Evidence from tag returns indicate that some green turtles are probably resident while others are highly migratory, moving to other nesting and feeding grounds in Kenya, Seychelles, Comoros, Mayotte, Europa Island and South Africa. It is estimated that the annual nesting population of green turtles in Tanzania is about 150 (Muir, 2005).
Hawksbill turtleHawksbills are also widely distributed but are less abundant. There are few records of hawksbill in small remote offshore islands such as Misali and Mnemba Islands in Zanzibar, the small islands off Dar es Salaam, Shungi-mbili Island and Juani Islands in Mafia and the Songo Songo archipelago. No nests have been recorded on the mainland coast (Muir, 2005). The most important nesting sites in Tanzania are Misali Island, off Pemba, and Mafia Island. On Misali Island, 42 hawksbill nests were recorded between 1998 and 2002, peaking during the month of March. In Mafia Island, 30 hawksbill nests were recorded between 2001 and 2008, of which 16 were laid on Shungi-Mbili Island in the North West and 14 on the east coast at Juani and Kungwi. The main nesting season is during the North East monsoon between December and April. Hawksbill is a migratory species and Tanzania coast harbours both residents and migrants (Muir, 2005).
Olive Ridley turtleThis species was observed nesting on Maziwe Island south of Tanga in the mid-1970s but the island has subsequently submerged and no further nesting records for this species have been made (Muir, 2005). Local fishermen note that they are occasionally accidentally caught in gillnets along the Tanzania coast. Net captures have been confirmed in Mtwara, near the border with Mozambique, particularly within Mnazi Bay Ruvuma Estuary Marine Park.
Loggerhead turtleLoggerhead turtles are relatively rare in Tanzania. However, evidence from tag returns indicate that southern Tanzania and the Mafia area are important foraging grounds for this species. Three tagged animals were caught in southern Tanzania in 1976. One animal swam a distance of at least 2,640 km in 66 days between its release in Natal and its capture at Kilwa Masoko (Frazier, 1976). Since 2001, tags had been recovered by Sea Sense from
49
2. BIOPHYSICAL ENVIRONMENT
5 loggerhead turtles caught in gillnets: 3 at Jibondo Island off southeast Mafia, and 2 off Songo Songo Island (Muir, 2005). All were tagged while nesting in Tongaland and Natal in South Africa (Muir, 2003).
Leatherback turtleThe leatherback turtle nested in Zanzibar in the 1970s (Frazier, 1976). In 1997-1998, five leatherback turtles, mostly dead individuals, were found in Unguja Island (Khatib, 1998a &1998b). Two leatherback turtles were also caught in offshore waters on Pemba Island in 1997 (Slade et al., 1997) and three washed up on Mafia beaches in 2002 and 2003 (Muir, 2005). This suggests that they may be feeding in the area or they were migrating to nesting sites in Natal, South Africa.
Turtles foraging and developmental groundsTanzania has extensive seagrass beds and coral reefs which can support considerable numbers of turtles (Howell and Mbindo, 1996). The extensive seagrass beds off the southern Rufiji Delta (Kichinja Mbuzi and Toshi) including Mohoro Bay (Fungu ya Kasa) are important feeding grounds for green turtles. On Mafia Island, immature and adult green and hawksbill turtles are found in Chole Bay and along the east coast of Juani Island where seagrass and corals occur. Off Ras Kisimani on the west coast of Mafia, green turtles have been observed digging pits in the sand at a depth of 10-15 meters where they appear to nest (Muir, 2005).
In Mtwara, important turtle foraging habitats exist in Mnazi Bay and off Msimbati (Guard, 1998; Muir, 2003). In Zanzibar, green and hawksbill turtles are found in Nungwi and the coral reefs around Mnemba Island. The main turtle developmental habitat, where small and immature green and hawksbill turtles concentrate, is Uroa in the Central District of Unguja. The area comprises of seagrasses, corals and algae and, as late as 1996, was unprotected. The reefs off Zanzibar are also important feeding grounds for loggerhead and leatherback turtles (Khatib et al,. 1996).
Legislation to protect marine turtlesIn mainland Tanzania, turtles protection is the responsibility of the Fisheries Development Division (Ministry of Livestock and Fisheries Development), through the Fisheries Act of 2003. In addition to Fisheries legislation, the Marine Parks and Reserves Act No. 29 of 1994 provides for the establishment of marine protected areas and the protection and conservation of coastal and marine life including turtles.
In Zanzibar, where marine turtles are protected through the Fisheries Act of 1988. Marine turtles are also protected by the 1993 Fisheries Regulation which prohibits fishing of turtles as well as possession of hawksbill or any other species of “fish” that are considered endangered or threatened under international conventions or agreements.
i) Issues
Reduction of egg harvestingTraditionally, turtle egg collection has been ubiquitous along the Tanzanian coast, and unlike the killing of turtles themselves, it is not generally perceived to be contravening the law. There is evidence of egg collection along the coast at Saadani, Temeke, Mapanya Island (Mkuranga), Rufiji, Kilwa and Mtwara. However, at sites where effective monitoring and conservation education are underway, the threat of egg harvesting has been significantly reduced. On Mafia Island, for example, 49% of nests recorded during the first year of monitoring by Sea Sense were poached by local fishers (Muir 2005). However, in 2002, following the implementation of beach patrols, the introduction of a nest protection incentive scheme and a public awareness campaign, the incidence of poaching fell to 8% and has declined further to less than 1% in 2003 and 2004 (Muir, 2004a, 2004b, 2004c). A similar change in behaviour has been recorded in MBREMP where the number of nests poached fell from 100% in 2003 to 0% in 2004 following initiation of a turtle conservation programme (Mahenge 2004). In Temeke district, since monitoring began in July 2004, only 1 out of 16 nests recorded has been poached (Muir, 2005).
Monitoring programmeIn January 2001, a community-based marine conservation initiative was established by Sea Sense in Mafia district (Mafia Island) to promote the long-term survival of endangered marine species and their habitats,

50
2. BIOPHYSICAL ENVIRONMENT
in collaboration with Mafia District Council, Mafia Island Marine Park and local communities. Direct conservation, monitoring, tagging, public awareness, training and research were undertaken by a team of 8 village-elected “Conservation Officers”. A nest protection incentive scheme was initiated in 2002. Under this scheme, individuals who reported a nest received a financial reward (Muir 2005)
On Zanzibar and Mafia, involvement of local communities in nest protection, monitoring, data collection and awareness-raising played a key role in reducing threats to turtles. The provision of financial incentives was a conservation option, and was practiced in some areas in the region. There were of course dangers associated with incentive-driven conservation, the most important of which was financial sustainability. However, in areas where mortality (through turtle and egg poaching) had reached critical levels, financial rewards were considered to be the only realistic short-term solution. It was envisaged that in the longer term it could be possible to generate revenue to fund turtle conservation through turtle tourism and park entry fees (Muir, 2005). On Zanzibar, cash incentives were found to be counter-productive to obtaining committed public participation (Khatib et al. 1996). However, in Mafia and Mtwara provision of modest incentives proved to be highly effective in involving local communities and in protecting nests (Muir, 2005).
Eco-tourism programmesSea Sense has initiated eco-tourism activities in Temeke, Mafia and Pangani Districts. Tourists are encouraged to watch turtle hatchling events and adopt nests (Muir, 2005).
Economic uses and cultural values of marine turtles in TanzaniaCurrent information on turtle uses and myths in Tanzania is based on questionnaire surveys conducted in Pemba and Unguja between 1995 and 1998 (Clark and Khatib, 1993; Slade et al., 1997; Khatib, 1998a & 1998b) and a national questionnaire survey (450 respondents) conducted between April and June 2003 by the TTDCP and direct observations. Many Tanzanians enjoy eating turtle meat and the sale has traditionally provided a valuable source of local income (Muir, 2005). The meat and eggs are eaten by many Muslims, not only on Zanzibar, where they comprise 95% of the population, but also in other predominately Islamic locations (e.g., Mafia) (Khatib et al. 1996). The local trade in turtle meat in Mtwara district is an important and lucrative business.
There has been a long history of exploitation of hawksbill turtles. Zanzibar was one of the world’s major clearing houses for tortoise shells, exporting mainly to Japan and Hong Kong (Slade, 2000). In 1979, when exports to Japan reached their highest levels, annual exports averaged 3,600 kg (Fraiser, 1980). However, with the closure of the centre for international trade in hawksbill shell, banning of international trade through CITES, the closure of the Tanzania markets and the ceremonial burning of turtle shells in Zanzibar in 1995, trade in tortoiseshell and other turtle products has ceased (Thiagarajan, 1991). The sale of turtle shells has however been recorded in Mtwara market (Darwall and Choiseul, 1996) and Rufiji district (Muir, 2005).
In Zanzibar, Clark and Khatib (1993) report that many residents believe turtle products (meat, oil, eggs, shell, skin and internal organs) have medicinal properties and use them to treat a wide range of diseases. During the 2003 survey, 14% (63) of respondents mentioned uses for turtle oil, most commonly as a cooking fat (33%). In Tanga, oil is used mainly as a cure for earache and in Mtwara turtle oil is applied to the skin to heal burns and rashes. In other parts of Tanzania, oil is used to treat asthma, hernias and muscle ache and is occasionally used to waterproof traditional wooden dhows (Clark and Khatib, 1993).
Shrimp TrawlingOne of the major threats to turtles in Tanzania is shrimp trawls. 16 Turtles (green, hawksbill and loggerhead) were caught during a by-catch survey conducted in 2007 in the industrial prawn trawl fishery (Muir, 2007b).
GillnettingGillnets also pose a major threat to all species of turtles (adult and subadult) in Tanzania. Most captures are incidental (Muir, 2005). However, at some key known foraging grounds, nets are set deliberately to catch turtles. Such sites include Ras Fikirini (west Mafia), Matanango and Nanano reefs off Msimbati in MBREMP and Kimbiji (Temeke district). More recent estimates for the whole Mafia area suggest annual capture rates of between 1,000 and 2,000 turtles. In Songo Songo, 30 turtles (green, hawksbill and loggerhead) were caught
51
2. BIOPHYSICAL ENVIRONMENT
on 76 fishing trips recorded during a catch monitoring survey by Frontier in 1996 (Darwall, 1996a, 1996b). A survey of turtle by-catch in gillnets in Mtwara in 1996 indicated that turtles are caught in a third of all fishing trips (Darwall and Choiseul, 1996) and in 2003, fishers from Mtwara reported that the average number of turtles caught accidentally in nets ranged from 2-3 per month in Mnazi Bay to as many as 2-3 per day at Litikoto (Muir, 2003). Many turtles were also said to be caught during fishing forays to northern Mozambique for sale in Mtwara town.
Habitat destructionHabitat destruction caused by erosion, in some cases as a result of coastal developments, live coral mining, destructive prawn trawling practices and clearing of mangroves are also threatening sea turtles (Khatib, 1998a, 1998b, Muir 2007b). The threat of erosion is illustrated by the case of Maziwe Island which submerged in the 1980s. The turtle nesting sites are being eroded in Zanzibar, the most threatened being Nungwi, Bwejuu, Jambiani and Mnemba Island (Khatib, 1998a, 1998b).
ii) GapsLittle is known about the status of olive ridley turtles in Tanzania although they are no longer reported to nest.Very little information is available on leatherback turtles in Tanzania because they are so rarely sighted and because indigenous knowledge is limited.Potentially important nesting and feeding sites in Tanga, Muheza, Pangani and Lindi districts have not been surveyed because of funding and resource limitations.Very little is known about the main turtle foraging and nursery grounds in Tanzania.
BirdsThe avifauna of Tanzania includes a total of 1,108 species of which 23 are endemic, 4 have been introduced by humans, and 43 are rare or accidental. There are 36 species which are globally threatened. (http://en.wikipedia.org/wiki/List_of_birds_of_Tanzania). A wide variety of coastal birds and seabirds are found particularly in mangrove forests, intertidal flats and on rocky cliffs. Waders and shorebirds visit Tanzania in large numbers each year between August and May to feed on intertidal flats during low tides. 10 Important Bird Areas (IBAs) have been designated by Birdlife International along the coast of Tanzania
i) IssuesLoss of bird habitats due to unsustainable human activities threatens existence of the Tanzanian avifauna.The Indian crow is known to be feed ferociously on eggs of other bird species thus threatening indigenous populations of birds and their continued existence in Tanzania. ii) Gaps Birds are not covered in the implementation of the Fisheries policy. There is a need for collaboration with the Wildlife sector responsible for bird life, in order to ensure the continued existence of the coastal avifauna of Tanzania. Very little research has also being carried out on marine birds in Tanzania. This gap need to be addressed as soon as possible.
Exotic and Invasive SpeciesThe Invasive Species Specialist Group (ISSG 2005) of the IUCN Species Survival Commission has identified the following invasive species: Musculista senhousia (mollusc), Salmo trutta (fish), Tilapia zillii (fish), Vibrio cholerae (micro-organism), Acanthophora spicifera (algae), Gracilaria salicornia (algae), Tubastraea coccinea (coral) and Lutjanus kasmira (fish). However, very few studies have been carried out on invasive species in marine waters of Tanzania.
i) IssueThe National Fisheries Policy and Coastal Area Management Strategy do not explicitly address marine invasive species. ii) Gap Very few studies have been carried out on invasive species in marine waters of Tanzania. Studies on invasive species in Tanzanian waters need to be carried out.
52
2. BIOPHYSICAL ENVIRONMENT
Long term predicted atmospheric changes
Air temperature and rainfallThe projections of long term atmospheric changes in Tanzania have basically focused on air temperature and rainfall. Agrawala et al. (2003) made projections on the changes in area averaged temperature and rainfall over Tanzania using outputs from General Circulation Models (GCMs). These simulations anticipate an increase in annual mean temperature of 0.9oC, 1.3oC and 2.2oC by 2030, 2050 and 2100, respectively. The corresponding changes in rainfall are 4.1%, 5.9% and 10.2%, respectively. Rainfall is expected to reduce in the months of June-August, and to increase in the remaining months of the year.
By the year 2100, the increase in air temperature is expected to be relatively higher (2.6 °C) over the months of June to August, and lower (1.9 °C) during December through February (Agrawala et al., 2003). Obviously, this increase in air temperature will have implications for the coastal and marine environment such as the increase in the thermal expansion of the ocean leading to increase in the level of the sea.
Predictions using GCMs shows that temperature will increase by 2.5 -2.9 oC during the warmest months of December-February, and by 3.0-3.5 oC during the coolest months of June to August. The corresponding change in rainfall will be -5 to 10%, with an increase in the northern and southern parts of the coast, and a decrease at the central portion (Mwandosya et al., 1998).
Other attempts to assess the possible consequences of global change on climate on the coastal ecosystems of Tanzania have been made by several authors (Wemba-Rashid, 1991; Fay, 1992; Mgaya, 1997; Paavola, 2003; Mwandosya et al., 1998; Kaser et al., 2004).
Wind patternsThe monthly means of the NE and SE monsoon winds speeds between the period 1985 and 2004 measured from the island of Zanzibar, have shown an increasing trend (Mahongo and Francis, 2010). The wind data records for the period 1972 - 1996 in some coastal locations indicates that maximum wind speeds have increased since 1972 (Dubi 2002). However, in Tanga, Dar es Salaam and Zanzibar, the wind speeds shows a declining trend. Mtwara is also experiencing strongest winds, which results in increased wave activity, stronger currents and wind set-up. Lwambuka (1992) found extreme gust speeds to be 30 ms-1 for Tanga, 29 ms-1 for Zanzibar, 27 ms-1 for Dar es Salaam and 38 ms-1 for Mtwara.
Extreme eventsThe ongoing change in global climate is leading to increased frequency and intensity of tropical cyclones, changes in wind patterns, floods, wave action and storm surges. However, no comprehensive study has been carried out in Tanzania to forecast these events. Although Tanzania is largely not within the Indian Ocean cyclone zone, historical records show that the coast has in the past been hit by several cyclones. The affected places included Zanzibar and Bagamoyo on 4th April 1872, Lindi, Mikindani and Mtwara on 15th April 1972, Dar es Salaam in 1989 and Zanzibar in August 1994 (Francis et al., 2001). A review of adaptation technologies and legal instruments to address climate change impacts to coastal and marine resources in Tanzania is given by Sallema and Mtui (2008).
i) Issues AND GAPSFew studies have been carried out on ocean –atmosphere interactions in Tanzania. There is therefore lack of knowledge in this areaUncertainties in the results of global circulation models.Available data have not been analyzed
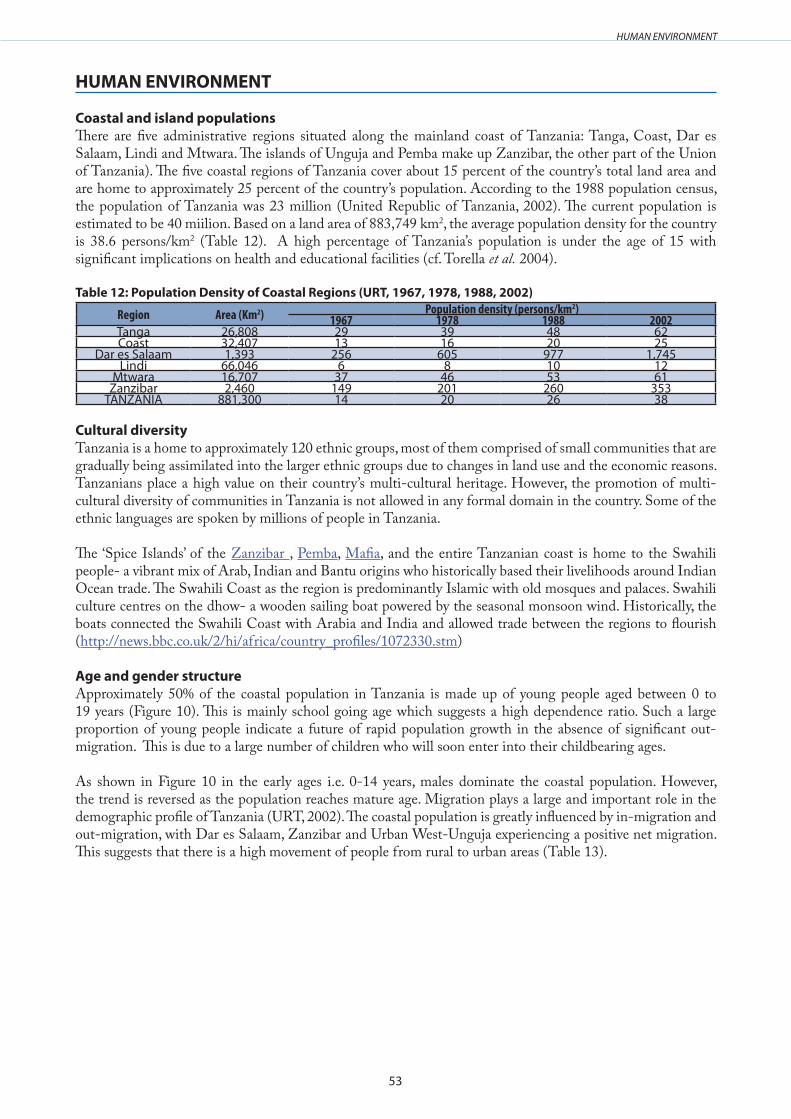
53
HUMAN ENVIRONMENT
HUMAN ENVIRONMENT Coastal and island populations There are five administrative regions situated along the mainland coast of Tanzania: Tanga, Coast, Dar es Salaam, Lindi and Mtwara. The islands of Unguja and Pemba make up Zanzibar, the other part of the Union of Tanzania). The five coastal regions of Tanzania cover about 15 percent of the country’s total land area and are home to approximately 25 percent of the country’s population. According to the 1988 population census, the population of Tanzania was 23 million (United Republic of Tanzania, 2002). The current population is estimated to be 40 miilion. Based on a land area of 883,749 km2, the average population density for the country is 38.6 persons/km2 (Table 12). A high percentage of Tanzania’s population is under the age of 15 with significant implications on health and educational facilities (cf. Torella et al. 2004).
Table 12: Population Density of Coastal Regions (URT, 1967, 1978, 1988, 2002)
Region Area (Km2) Population density (persons/km2)1967 1978 1988 2002
Tanga 26,808 29 39 48 62Coast 32,407 13 16 20 25
Dar es Salaam 1,393 256 605 977 1,745Lindi 66,046 6 8 10 12
Mtwara 16,707 37 46 53 61Zanzibar 2,460 149 201 260 353
TANZANIA 881,300 14 20 26 38
Cultural diversityTanzania is a home to approximately 120 ethnic groups, most of them comprised of small communities that are gradually being assimilated into the larger ethnic groups due to changes in land use and the economic reasons. Tanzanians place a high value on their country’s multi-cultural heritage. However, the promotion of multi-cultural diversity of communities in Tanzania is not allowed in any formal domain in the country. Some of the ethnic languages are spoken by millions of people in Tanzania.
The ‘Spice Islands’ of the Zanzibar , Pemba, Mafia, and the entire Tanzanian coast is home to the Swahili people- a vibrant mix of Arab, Indian and Bantu origins who historically based their livelihoods around Indian Ocean trade. The Swahili Coast as the region is predominantly Islamic with old mosques and palaces. Swahili culture centres on the dhow- a wooden sailing boat powered by the seasonal monsoon wind. Historically, the boats connected the Swahili Coast with Arabia and India and allowed trade between the regions to flourish (http://news.bbc.co.uk/2/hi/africa/country_profiles/1072330.stm)
Age and gender structure Approximately 50% of the coastal population in Tanzania is made up of young people aged between 0 to 19 years (Figure 10). This is mainly school going age which suggests a high dependence ratio. Such a large proportion of young people indicate a future of rapid population growth in the absence of significant out-migration. This is due to a large number of children who will soon enter into their childbearing ages.
As shown in Figure 10 in the early ages i.e. 0-14 years, males dominate the coastal population. However, the trend is reversed as the population reaches mature age. Migration plays a large and important role in the demographic profile of Tanzania (URT, 2002). The coastal population is greatly influenced by in-migration and out-migration, with Dar es Salaam, Zanzibar and Urban West-Unguja experiencing a positive net migration. This suggests that there is a high movement of people from rural to urban areas (Table 13).

54
HUMAN ENVIRONMENT
Figure 10: Coastal regions Population structure by sex . Source: URT, 1967, 1978, 1988, 2002)
Table 13: In-migration and Out-migration of the Coastal Population (URT, 2006b)Region In-migration Out-migration Net-migration
Tanzania 4,671,642 4,671,642 -
Mainland 4,442,528 4,449,580 (7,052)
Tanga 96,343 289,227 (192,884)
Pwani 159,276 222,254 (62,978)
Dar-es-Salaam 1,319,361 187,904 1,131,457
Lindi 79,484 158,617 (79,133)
Mtwara 43,554 177,214 (133,660)
Zanzibar 229,114 222,062 7,052
N & S Unguja 43,136 82,614 (39,478)
Urban-West 166,947 47,465 119,482
Pemba 19,031 91,983 (72,952)
i) IssuesPollutionAccessibility (hospitals, markets) - lack of infrastructure (see infrastructure section)Population pressureResource degradationIncreased unplanned settlementCrime
ii) GapsNo sufficient disaggregated data by gender.More research needs to be done in the area of population and population structure of the coastal regions
Sites of religious or cultural significanceThe cultural heritage sites found along the coastal region of Tanzania include monuments and old buildings that represent important events or eras in local history and traditional lifestyles, such as the performing arts and handicrafts. Some of the world-class cultural sites include the ruins of Kilwa Kisiwani and Songo Mnara, designated as UNESCO world heritage sites. Others include Bagamoyo town, Kaole ruins, Amboni caves, Tongoni ruins, Kunduchi ruins, Mkindani and Kilwa Kivinje. The National museum, village museum and Bagamoyo Catholic Museum are also important cultural heritage sites. Furthermore, Ras Mkumbuu-, a demonstration site for the ASCLME project for Distance Learning Information Sharing Tool (DLIST), is an
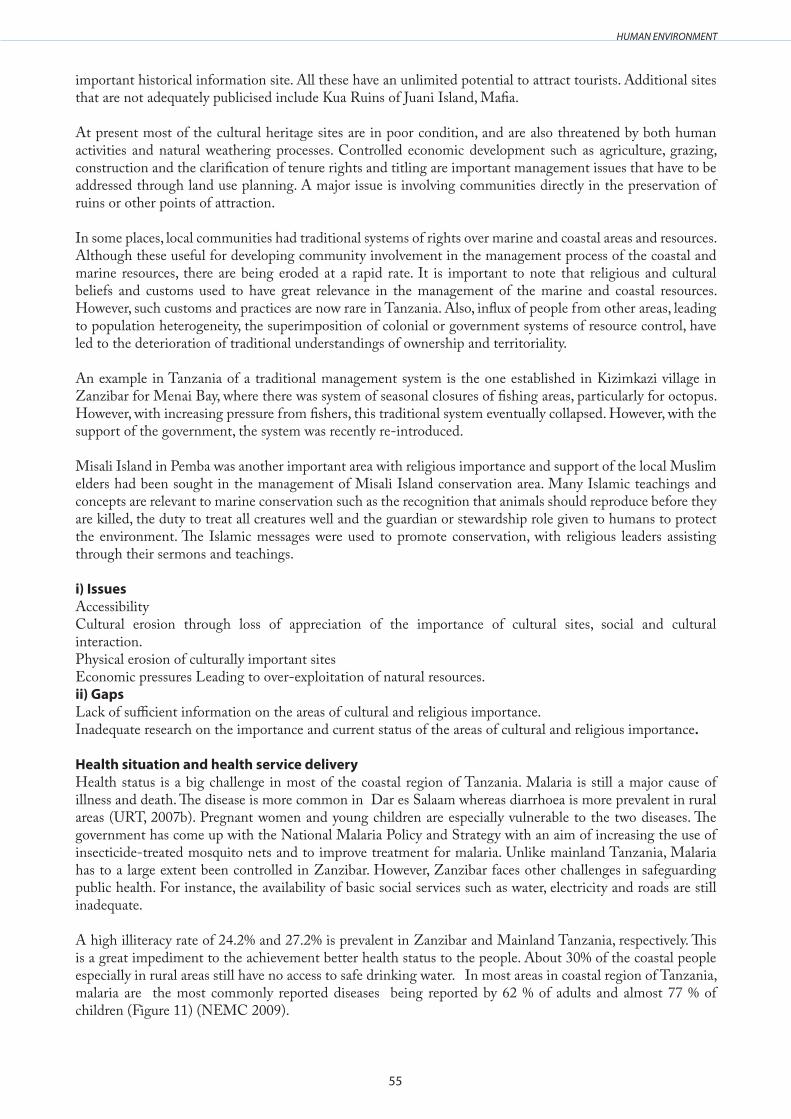
55
HUMAN ENVIRONMENT
important historical information site. All these have an unlimited potential to attract tourists. Additional sites that are not adequately publicised include Kua Ruins of Juani Island, Mafia.
At present most of the cultural heritage sites are in poor condition, and are also threatened by both human activities and natural weathering processes. Controlled economic development such as agriculture, grazing, construction and the clarification of tenure rights and titling are important management issues that have to be addressed through land use planning. A major issue is involving communities directly in the preservation of ruins or other points of attraction.
In some places, local communities had traditional systems of rights over marine and coastal areas and resources. Although these useful for developing community involvement in the management process of the coastal and marine resources, there are being eroded at a rapid rate. It is important to note that religious and cultural beliefs and customs used to have great relevance in the management of the marine and coastal resources. However, such customs and practices are now rare in Tanzania. Also, influx of people from other areas, leading to population heterogeneity, the superimposition of colonial or government systems of resource control, have led to the deterioration of traditional understandings of ownership and territoriality.
An example in Tanzania of a traditional management system is the one established in Kizimkazi village in Zanzibar for Menai Bay, where there was system of seasonal closures of fishing areas, particularly for octopus. However, with increasing pressure from fishers, this traditional system eventually collapsed. However, with the support of the government, the system was recently re-introduced.
Misali Island in Pemba was another important area with religious importance and support of the local Muslim elders had been sought in the management of Misali Island conservation area. Many Islamic teachings and concepts are relevant to marine conservation such as the recognition that animals should reproduce before they are killed, the duty to treat all creatures well and the guardian or stewardship role given to humans to protect the environment. The Islamic messages were used to promote conservation, with religious leaders assisting through their sermons and teachings.
i) IssuesAccessibilityCultural erosion through loss of appreciation of the importance of cultural sites, social and cultural interaction.Physical erosion of culturally important sitesEconomic pressures Leading to over-exploitation of natural resources.ii) GapsLack of sufficient information on the areas of cultural and religious importance.Inadequate research on the importance and current status of the areas of cultural and religious importance.
Health situation and health service delivery Health status is a big challenge in most of the coastal region of Tanzania. Malaria is still a major cause of illness and death. The disease is more common in Dar es Salaam whereas diarrhoea is more prevalent in rural areas (URT, 2007b). Pregnant women and young children are especially vulnerable to the two diseases. The government has come up with the National Malaria Policy and Strategy with an aim of increasing the use of insecticide-treated mosquito nets and to improve treatment for malaria. Unlike mainland Tanzania, Malaria has to a large extent been controlled in Zanzibar. However, Zanzibar faces other challenges in safeguarding public health. For instance, the availability of basic social services such as water, electricity and roads are still inadequate.
A high illiteracy rate of 24.2% and 27.2% is prevalent in Zanzibar and Mainland Tanzania, respectively. This is a great impediment to the achievement better health status to the people. About 30% of the coastal people especially in rural areas still have no access to safe drinking water. In most areas in coastal region of Tanzania, malaria are the most commonly reported diseases being reported by 62 % of adults and almost 77 % of children (Figure 11) (NEMC 2009).
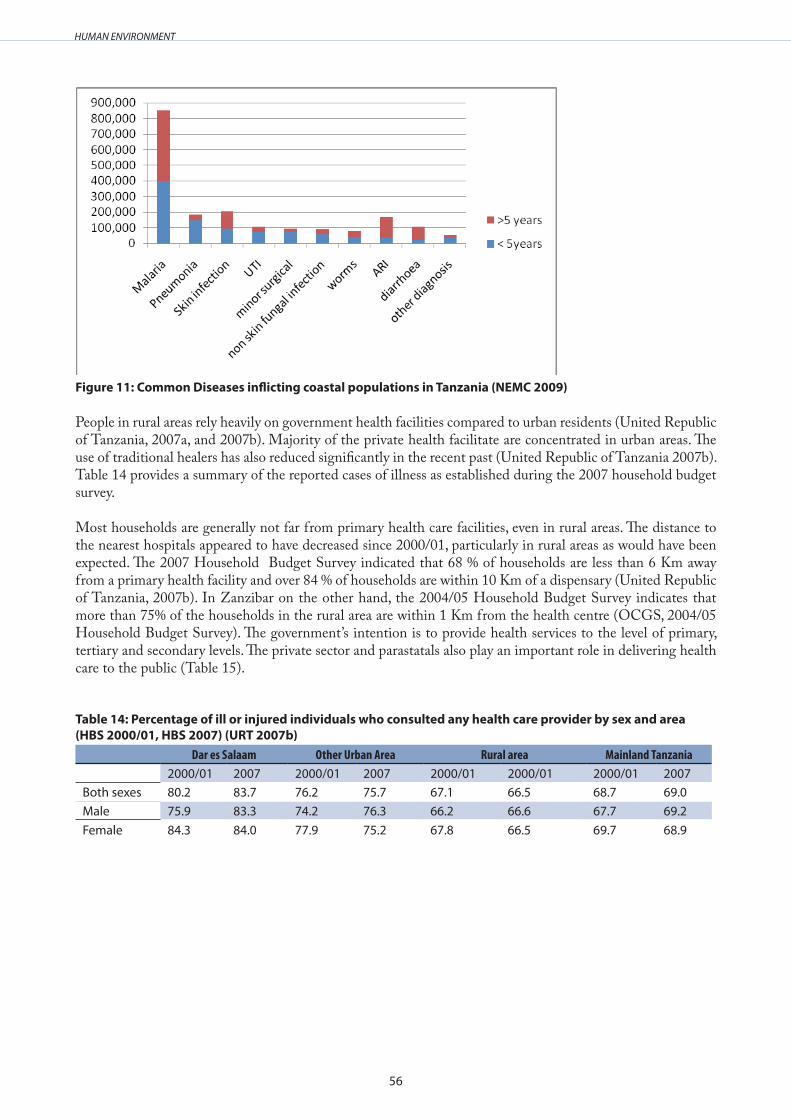
56
HUMAN ENVIRONMENT
Figure 11: Common Diseases inflicting coastal populations in Tanzania (NEMC 2009)
People in rural areas rely heavily on government health facilities compared to urban residents (United Republic of Tanzania, 2007a, and 2007b). Majority of the private health facilitate are concentrated in urban areas. The use of traditional healers has also reduced significantly in the recent past (United Republic of Tanzania 2007b). Table 14 provides a summary of the reported cases of illness as established during the 2007 household budget survey.
Most households are generally not far from primary health care facilities, even in rural areas. The distance to the nearest hospitals appeared to have decreased since 2000/01, particularly in rural areas as would have been expected. The 2007 Household Budget Survey indicated that 68 % of households are less than 6 Km away from a primary health facility and over 84 % of households are within 10 Km of a dispensary (United Republic of Tanzania, 2007b). In Zanzibar on the other hand, the 2004/05 Household Budget Survey indicates that more than 75% of the households in the rural area are within 1 Km from the health centre (OCGS, 2004/05 Household Budget Survey). The government’s intention is to provide health services to the level of primary, tertiary and secondary levels. The private sector and parastatals also play an important role in delivering health care to the public (Table 15).
Table 14: Percentage of ill or injured individuals who consulted any health care provider by sex and area (HBS 2000/01, HBS 2007) (URT 2007b)
Dar es Salaam Other Urban Area Rural area Mainland Tanzania 2000/01 2007 2000/01 2007 2000/01 2000/01 2000/01 2007
Both sexes 80.2 83.7 76.2 75.7 67.1 66.5 68.7 69.0Male 75.9 83.3 74.2 76.3 66.2 66.6 67.7 69.2Female 84.3 84.0 77.9 75.2 67.8 66.5 69.7 68.9
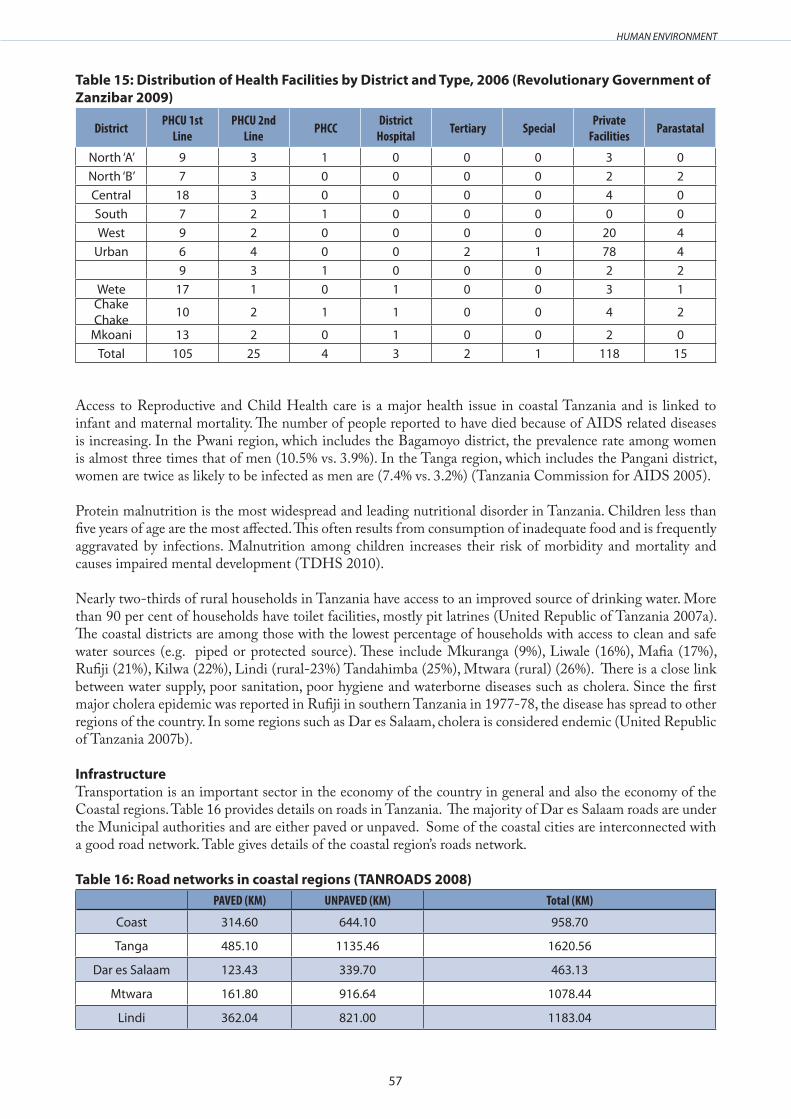
57
HUMAN ENVIRONMENT
Table 15: Distribution of Health Facilities by District and Type, 2006 (Revolutionary Government of Zanzibar 2009)
District PHCU 1st Line
PHCU 2nd Line PHCC District
Hospital Tertiary Special Private Facilities Parastatal
North ‘A’ 9 3 1 0 0 0 3 0North ‘B’ 7 3 0 0 0 0 2 2Central 18 3 0 0 0 0 4 0South 7 2 1 0 0 0 0 0West 9 2 0 0 0 0 20 4
Urban 6 4 0 0 2 1 78 49 3 1 0 0 0 2 2
Wete 17 1 0 1 0 0 3 1Chake Chake 10 2 1 1 0 0 4 2
Mkoani 13 2 0 1 0 0 2 0Total 105 25 4 3 2 1 118 15
Access to Reproductive and Child Health care is a major health issue in coastal Tanzania and is linked to infant and maternal mortality. The number of people reported to have died because of AIDS related diseases is increasing. In the Pwani region, which includes the Bagamoyo district, the prevalence rate among women is almost three times that of men (10.5% vs. 3.9%). In the Tanga region, which includes the Pangani district, women are twice as likely to be infected as men are (7.4% vs. 3.2%) (Tanzania Commission for AIDS 2005).
Protein malnutrition is the most widespread and leading nutritional disorder in Tanzania. Children less than five years of age are the most affected. This often results from consumption of inadequate food and is frequently aggravated by infections. Malnutrition among children increases their risk of morbidity and mortality and causes impaired mental development (TDHS 2010).
Nearly two-thirds of rural households in Tanzania have access to an improved source of drink ing water. More than 90 per cent of households have toilet facilities, mostly pit latrines (United Republic of Tanzania 2007a). The coastal districts are among those with the lowest percentage of households with access to clean and safe water sources (e.g. piped or protected source). These include Mkuranga (9%), Liwale (16%), Mafia (17%), Rufiji (21%), Kilwa (22%), Lindi (rural-23%) Tandahimba (25%), Mtwara (rural) (26%). There is a close link between water supply, poor sanitation, poor hygiene and waterborne diseases such as cholera. Since the first major cholera epidemic was reported in Rufiji in southern Tanzania in 1977-78, the disease has spread to other regions of the country. In some regions such as Dar es Salaam, cholera is considered endemic (United Republic of Tanzania 2007b).
InfrastructureTransportation is an important sector in the economy of the country in general and also the economy of the Coastal regions. Table 16 provides details on roads in Tanzania. The majority of Dar es Salaam roads are under the Municipal authorities and are either paved or unpaved. Some of the coastal cities are interconnected with a good road network. Table gives details of the coastal region’s roads network.
Table 16: Road networks in coastal regions (TANROADS 2008)PAVED (KM) UNPAVED (KM) Total (KM)
Coast 314.60 644.10 958.70
Tanga 485.10 1135.46 1620.56
Dar es Salaam 123.43 339.70 463.13
Mtwara 161.80 916.64 1078.44
Lindi 362.04 821.00 1183.04

58
HUMAN ENVIRONMENT
HarboursDar es Salaam is the largest seaport in Tanzania followed by Tanga and Zanzibar. The port handles cargo destined for land locked countries such as Burundi, Rwanda, Uganda, Malawi and Zambia. Tanga is the second largest seaport with a handling capacity of 500,000 tons of cargo a year. The port handles mostly cargo -copper concentrates from the Kahama mines, bulk wheat, cement, fish fillets/octopus and hide and skins. Sisal and coffee are also exported to European and Asian markets. There are container handling and cold storage facilities as well.
Other coastal regions with ports include Lindi, Mtwara and Coast (Mafia). The new initiative of the Mtwara corridor is likely to make Mtwara more active in handling cargo destined for Southern African countries. Fishing harbours are however missing in all the coastal regions.
AirportsApart from Julius Nyerere International airport which is in Dar es Salaam, Zanzibar airport is the second largest international airport in the coastal zone, handling both local and international flights. Tanga city also has airport facilities capable of handling small passenger planes.
Other coastal regions also have airports to cater for domestic transport. These include the Mafia Airport in Pwani Region, Lindi and Mtwara Airports which are popular for the domestic flights. In addition there are small airstrips which cater for private needs such as the air strip in the Selous game reserve for those visiting the area, Utete air strip, and Mnazi Bay air strip. All these are important infrastructure which provides a good reflection of the growth of the economy and investment into the region.
EnergyAll coastal regions depend on different sources of energy, such as electricity, kerosene, charcoal, firewood and solar. The main source of power for lighting, business and industry is electricity which is generated, transmitted and supplied by a sole utility agent - Tanzania Electric Supply Company Limited (TANESCO). All coastal regions and districts are connected to the national grid. The availability of electricity in most parts of coastal region of Tanzania is still a challenge. Lack of alternative enegy for cooking, especially in rural areas has imposed severe demands on forest resources due to unsustainable harvesting of wood for cooking. Fuelwood and charcoal are the main sources of energy for most people in the coastal region of Tanzania.i) IssuesLack of investment / poor maintenanceLevel of educationDeforestation Pollution
ii) Gaps Lack of good quality data on the coastal infrastructureInadequate research on the coastal regions infrastructure status.
59
4. COASTAL LIVELIHOODS
4 . COASTAL LIVELIHOODS
A comprehensive coastal livelihoods assessment has been carried out. Chapter summaries are presented below, and the full Coastal Livelihoods Assessment may be found in Annex XII for further information.
4 .1 Small-Scale FisheriesThe small-scale fishery in Tanzania accounts for 98% of total fish production, 1.3% of GDP and contributes up to 9.9% of fish exports worth an estimated 12.4 million USD. While the contribution of small-scale fisheries to the GDP may appear marginal, the sector is a vital source of food, employment and income for coastal communities. This helps in sustaining the economy of the five coastal regions. The small-scale fisheries sector is however constrained by inadequate infrastructure, including lack of capacity for processing, storage and transportation facilities. The post-harvest fish losses due to lack of storage and processing facilities is estimated to be 20%.
Deleterious fishing techniques such as dynamite are a large threat to small-scale fisheries sector in view of degradation of habitats. Weak institutional infrastructure required to monitor and regulate such activities has also weakened the ability of authorities to prevent such bad fishing practices. Despite these obstacles, some degree of oversight and planning has been decentralized to the community level through Beach Management Units (BMUs) and Collaborative Fisheries Management Areas (CFMAs), which empower local fishers to monitor and become responsible for the resources and habitats they depend on. Likewise, as micro-finance continues to be made available by international organizations to the sector, sustainable practices should be strengthened.
Relatively high taxes on fish exports and financial services tend to constrain development of the commercial sector, and credit remains scarce in the coastal zone. However increasing global demand for tropical fish products could be an incentive to the investors in the sector. This could subsequently allow the sector to gradually move away from its over-dependence on external finance.
In general, the high potential for the growth of mariculture, availability of a wide range of fish species, presence of supporting development institutions and good legislation are strengths in the sector. Improved implementation of existing policies, legislation and guidelines, and strengthening of the role of BMUs in co-management initiatives are key areas for improvement, while the role of Marine Protected Areas as a viable management option need to be promoted.
4 .2 Tourism .Tourism is important for the Tanzanian economy as it accounts for 17.2% of GDP. This makes up 25% of foreign exchange earnings and employs 288,700 people. The sector also continues to grow with foreign exchange receipts from tourism increasing from US$259.44 million in 1995 to $1,269.68 million in 2008. The total arrivals increased from 295,312 to 770,376 over the same period. While much of this activity is concentrated around wildlife-based tourism in the hinterland, coastal tourism is witnessing some growth. For instance, in Mafia Island, arrivals increased from 484 in 2000 to 3,107 in 2007. Coastal tourism is not however, growing as rapidly as inland tourism, which has been partly attributed to lack of a national strategy on diversification of the sector into the country’s coastal regions.
Numerous constraints have been documented in the tourism sector, despite the aforementioned growth rates. For example, it is estimated that between 75% and 90% of funds paid for vacations in Tanzania are actually collected by outbound operators, source country airlines and other imports from the visitor’s country of origin, which also corresponds to the leakages in the sector experienced by other least developed countries in Africa. Similarly, lack of appropriate facilities for international clients, low-levels of entrepreneurship and lack of confidence in the private-sector all highlight the weaknesses that continue to constrain the sector. Numerous environmental threats have also been identified, with large-scale erosion, strip development, over-fishing and deterioration of coastal ecosystems due to climate change and pollution all being highlighted, which is problematic considering the sector’s dependence on the country’s natural landscape and wildlife.
There are however strengths and opportunities prevalent in the sector which could be utilized to mitigate
60
4. COASTAL LIVELIHOODS
some of the aforementioned constraints. For example, improvements in electricity infrastructure in the coastal towns around Lindi and Mtwara will encourage private-investors, while upgrades in the port and airport at Mtwara will increase accessibility. The country’s long coastline and attractive offshore islands, world renowned attractions and traditional cultures could also be utilized as pillars for further growth in the sector, while the presence of regulations around marine parks, eco-tourism development, as well as conservation support from international donors such as the World Bank and WWF, should be helpful in reducing environmental degradation of the coast. Nevertheless, despite the presence of a Tourism Master Plan, tourism growth in the coastal zone continues to lag behind activity in the hinterland, which is expected to continue without a proper strategy to grow the sector around coastal communities.
4 .3 MaricultureMariculture is an important sector in the Tanzanian economy, with finfish, seaweed and mudcrab being farmed in all coastal regions, and pearls and prawns also being farmed in Mafia and Tanga. Regulation and infrastructure development has lagged behind in this sector. However, high quality seawater, large numbers of candidate species and existing research and support capacity highlight the untapped potential in the sector. The government has also committed to developing the sector, as evident in the Seaweed Development Strategic Plan and the Aquaculture Development Strategy proposed in 2005 and 2008, respectively. Despite constraints in governance, several experimental farms are currently operational and the strategies have been applauded for their credibility. The private-sector has also been established in the seaweed and prawn industries, while NGO’s and international organizations with expertise in mariculture continue to provide support. Many mariculture projects are, however, largely dependent on the knowledge and finance provided by international donor organizations, which has magnified the need for greater private-sector involvement and local capacity building in the sector.
Despite the potential for over-exploitation of certain species due to the requirement of wild-caught seed, and high levels of theft and vandalism, the opportunities for diversification into new markets are immense. With greater NGO participation, expansion into undeveloped intertidal lagoon and mud flats, as well as improved production of aquafeeds, mariculture has the potential to become a mainstay in the Tanzanian economy.
4 .4 Agriculture and ForestryAgriculture is the country’s leading sector, employing 82% of the population. The sector contributes 45% of GDP and 60% of total export earnings. The sector also employs three million people. The forest sector accounts for 4% of GDP, making up 10% of foreign exchange earnings equal to 14 million USD annually. Subsistence farming is, however, the most dominant form of income generation in the coastal zone. Thus, any increases in unemployment are expected to place further strain on the region’s natural resources. Fuel wood also accounts for more than 92% of the country’s energy use, also placing extensive strain on the country’s coastal forests.
Forest depletion, a lack of information on sustainable agriculture and limited export opportunities have all been highlighted as major obstacles in the sector, this is apart from the threat posed by demand of extensive land for export oriented production, including bio-fuels, which in the lack of careful management will be detrimental rather than being beneficial to coastal livelihoods. However, current projects and planning being implemented by coastal residents, the government and the international community are very promising. The promotion of participatory forest management by the government, as well as the sustainable development projects being promoted by the World Bank and WWF, have all focused on the empowerment of local communities to manage their own resources. Likewise, alternative sources of income generation, such as beekeeping, honey production, and tree nursery management have highlighted potential substitutes present in the sector. The government has also recognized coastal forests, particularly mangrove areas, as a key resource under threat, which is a significant step from a conservation perspective.
Despite the high pressures on coastal land from population increases, as well as the conflicts between coastal residents and commercial companies, the government has begun to recognize that the fishery is not the only sector of importance in the coastal region. The Poverty Reduction Strategy Paper aims at facilitating partnerships between the public sector, private sector and civil society in order to reduce poverty and subsequently reduce the strain on the country’s natural resources. However, almost half of the country’s forests are severely threatened, hence, more aggressive action will be required to sustain the sector.

61
4. COASTAL LIVELIHOODS
4 .5 EnergyActivities in oil, gas and biofuels in Tanzania are highly promising, with current natural gas production at Songo Songo reaching 70mcf in 2008, and production at Mnazi Bay reaching 1mcf in 2008. The country also has strong hydrocarbon potential and numerous companies are currently exploring potential oil reserves, with 13 offshore blocks expected to be conceded in the near future. Only about a quarter of potential arable land is currently cultivated, providing opportunities for bio fuel production. It is estimated that between 20 and 24 companies have requested land for commercial bio fuel production.
Although the refinery in Dar es Salaam was closed in 1999, the region still remains a center for downstream activity, as it handles imports of liquid petroleum gas (LPG), stores oil products, receives gas from the 230 km pipeline connected to Songo Songo, supplies Burundi, Uganda, Rwanda and Eastern Conco and transports crude oil through a pipeline to the Indeni oil refinery in Zambia. Despite all this activity, it is estimated that only 0.1% of the population is employed in the electricity and gas sectors.
Numerous constraints have been identified in the energy sector. For example, weak petroleum regulations, as well as an inconsistent environmental impact assessment (EIA) framework, have both been highlighted as weaknesses. Similarly, a lack of financial, operational and human resources capacity has constrained management and law enforcement in the sector, particularly prevalent at lower-levels of government. Many large-scale biofuels projects have also been implemented without a clear and consistent framework, which could lead to unsound development in agro-fuels and threaten food security, small-scale food crop producers and local livelihoods. It is also likely that any increases in oil operations, both upstream and downstream, will intensify the risk of spills and accidents, which could negatively impact local livelihoods.
A number of strengths and opportunities have however, been identified, which could be utilized to alleviate some of the aforementioned constraints. For example, there is interest from foreign investors, particularly in biofuels, which could mitigate some of the financial strains in the public sector, while the availability of land is highly supportive of biofuels development. The government is also committed to developing domestic energy resources, which is very positive considering the current domestic and regional demand for energy. Oil and gas development also has the potential to benefit livelihoods through employment, while companies in the sector, such as Songas, are likely to further engage in the community and support local development. There are also plans to construct a new oil refinery in Dar es Salaam, as well as upgrading of oil storage capacity in Dar es Salaam and increasing of capacity at the Songo Songo gas field, all of which should be conducive to growth in the sector. Numerous international organizations, such as the World Bank and USAID, are also involved in coastal zone management projects, which could again be beneficial in terms of community development in the coastal regions. Thus, while it is not likely that the current upstream activities will provide significant employment to coastal communities, the prospects inherent throughout the sector highlights the great potential in the Tanzanian energy sector.
4 .6 Ports and Coastal Transport Tanzania has well established ports and coastal transport sector, with ports in Mtwara, Lindi, Kilwa, Dar Es Salaam and Tanga, as well as an extensive rail and road network. While the ports are managed by the Tanzania Ports Authority (TPA), the rail network is jointly managed by the Zambian government and the Tanzania Railway Corporation (TAZARA). Some concessions have been proposed, however, the transport sector is largely funded and managed by the public sector, which does constrain capacity and service delivery in the sector.
There are numerous opportunities in the transport sector despite the presence of corruption and lack of training and skills in ports and coastal transport. The introduction of new navigational aids in Mtwara could make the port operational twenty-four hours a day. In Dar Es Salaam, modernization of the road and rail corridor could greatly expand business opportunities on the coast. Likewise, there are also opportunities to expand Tanga port into a deepwater port. The discovery of an offshore gas field near Songo Songo Island could also provide power for industrial development near Kilwa.
Inadequate infrastructure and a poor manufacturing sector have constrained growth in the sector, however, physical location of the ports, as well as the proposed development of Mtwara and Central Development
62
4. COASTAL LIVELIHOODS
Corridors, which will effectively link Tanzanian coast to the interior of the continent, highlight the prospects for further growth in the sector. If further concessions can be negotiated with the private-sector, as seen in the container sub-sector, capacity and service delivery both have the potential to dramatically improve.
4 .7 Coastal MiningBeing Africa’s third largest gold producer, the world’s sole producer of the gemstone tanzanite, and a producer of cement, diamonds, sapphire and garnet, Tanzania has an extensive and diverse mining sector. The sector contributes nearly 4% to GDP and it formally employs 8,000 people. An estimated 500,000 artisanal miners are also active throughout the sector. The sector also contributes 42.9% of total foreign exchange earnings.
The majority of precious metal mining takes place inland. However, the coastal zone does have mining operations focused on cement, coral and lime, with both lime and cement being produced for export throughout East Africa. Companies controlling these operations, such as Tanga cement, have also invested in community development, a testament to the social benefits provided by coastal mining activities. The Twiga and Tanga cement projects have also produced over 200 billion TZS in tax revenue, which could potentially be reinvested into the coastal communities with the construction of housing, schools and clinics. Likewise, recent investments in the Twiga and Tanga mines are expected to generate more employment and training for employees in the coastal region. While financial resources are limited and environmental management remains uncoordinated, strong mining regulations, NGO involvement in coastal zone management and the development of new cement projects on the coast all highlight the potential for further sustainable growth in the sector. Despite some of the environmental issues surrounding the mining sector on the coast, the incentive to invest in the region also remains high. Poverty and unemployment does, however, remain a constraint across coastal communities, which could facilitate the over-exploitation of resources in the future.
ConclusionsEach livelihood sector has had, and will continue to have a distinct impact on the socio-economic and environmental status of the coastal communities concerned. There are many constraints that remain constant across sectors, such as political stability, over-exploitation of natural resources and limited infrastructure, all of which have had a widespread impact on all of the sectors. There are also many strengths and opportunities apparent, such as potential alternative income generating activities, the provision of microfinance and opportunities for business and investment. In this respect, while each of the seven sectors have their own distinct institutions and processes that are unique to the sector in question, they are nevertheless extensively linked economically, socially and environmentally.
One clear link between the sectors is the constraint of governance and capacity. In the small-scale fisheries, the lack of institutional infrastructure to monitor the sector has led to destructive fishing practices going unchecked. In mariculture, the responsible government agencies lack resources and funding to meet their proposed objectives. In agriculture and forestry, community capacity is too weak to sustainably manage their resources, while government ownership in ports and shipping sector continues to weaken capacity and service delivery. Likewise, in the energy sector, capacity to manage and enforce laws has been highlighted as a weakness, particularly at the lower-levels of government. Despite these constrictions, progress is being seen. For example, decentralization and microfinance has the potential to further empower local communities in the small-scale fisheries, while NGO’s continue to provide technical support in the development of the mariculture sector. Likewise, concessions to the private sector in the ports and shipping sector, as well as strong regulation in the mining sector, highlight the development of governance capacity in the coastal zone.
Across many sectors, environmental degradation also remains a threat. The destruction of marine habitats, forest depletion, pollution and the potential for over-exploitation all highlight the environmental challenges confronting coastal communities in Tanzania. While the government has promoted sustainable development practices across most sectors, lack of capacity has made it difficult moving forward. Despite this, positives can be seen. For example, substitutes in the agriculture and forestry sector, such as beekeeping, honey production and tree nursery management, have the potential to reduce the strain on forests and land. Likewise, various NGO projects continue to promote sustainable practices in the small-scale fishery and coastal zone management in the mining sector.
63
4. COASTAL LIVELIHOODS
Business and investment opportunities are also evident across the sectors. In coastal mining, the cement and lime industries continue to attract investment, while upgrades in road and railway corridors linking the coast to inland areas could present new opportunities in the ports and shipping sector. Similarly, the private sector has been promoted with the Poverty Reduction Strategy Paper, while the demand for fishery products should highlight the commercial opportunities existing in the small-scale fishery. In the energy sector, there is also great interest from foreign investors, particularly in biofuels, which could be very promising for both government and coastal communities. Despite this potential, private-sector involvement does remain weak in the mariculture sector, while high taxes continue to limit the competitiveness of the country’s fishery products. Likewise, conflicts between coastal communities and commercial companies have become a threat in the agriculture and forestry sector, while biofuels investors have shown an inclination to target rich land that is occupied by small-scale food crop producers in the energy sector.
Overall, weak infrastructure, a lack of capacity and the over-exploitation of natural resources present many challenges to the Tanzanian coastal zone. However, a commitment to sustainable social and economic development by government, NGO’s and communities is apparent. Opportunities for private-sector investment are also evident, particularly in the mining and ports and coastal transport sectors, which demonstrates the potential for growth and development moving forward. Investment in these sectors also makes evident the significance of spillovers, whereby, the private-sector could stimulate the coastal economy and potentially reduce the affects of rapid rural-urban migration. These opportunities also magnify the utility and importance of creating employment and alternative streams of income to reduce poverty and, in turn, reduce the strain being placed on coastal resources. By promoting private-sector investment, international support and community management in new sectors, the government has the opportunity to facilitate the growth of a sustainable economy in the coastal zone while simultaneously empowering the coastal population.
64
5. POLICY AND GOVERNANCE
5 . POLICY AND GOVERNANCE
A comprehensive report was prepared on Policy and Governance, which is Annex V to this MEDA. A summary is presented below.
Tanzania is negotiating with Mozambique, Comoro and Seychelles on the delineation of the EEZ boundaries.
Tanzania has quite a number of laws which provide for legal and institutional frameworks that adequately address coastal and marine resources and environment management. Although financial and human resources have constrained them from operating in their full capacity, yet they complement each other. In the long run they will be allocated sufficient funds to enable them to improve their enforcement operations. Tanzania is still in the process of implementing reforms in its legal sector. Old and outdated laws are repealed and replaced by new ones. The current trend in the enactment of new laws indicates a great likelihood that there will be very strong enforcement machinery.
The major recommendations for the effective application of the ecosystem based approach are:There is need for the Tanzanian Government to establish coordination and monitoring institutions in •order to enhance its effective governance of its coastal and marine areas. There is a need to build the capacity of coastal districts to align well with the central government especially •on coastal and marine issues. This could be done through training (Strategic Planning) and awareness raising to district policy makers on the importance of such alignment.
Marine fisheries and Environmental issues are not union issues - each side of the Union is dealing with these issues separately in spite of them occurring in the same geographical setting. Both Mainland and Zanzibar Governments have different policies, laws, regulations and plans that are not harmonized. This situation creates some difficulties and confusion to resource users and management. There is a need to harmonize those policies and laws for effective governance and at the same time reduce unnecessary conflicts that are common every day. Environment,
Marine resource theft at sea, IUU, Dynamite fishing, Piracy, drowning of mariners and oil spill are some of the threats and challenges to Tanzania coastal and marine areas. Most of the responsible institution lack capacity to deal with these challenges. Either, they don’t have the right and appropriate equipment, trained personnel or plan to deal with those existing challenges. It is recommended to build institutional and individual capacity of responsible institutions and personnel in order to halt the existing alarming situation.
Incomes obtained from licensing legal businesses related to Mangroves, prawn fishery, deep sea fishery, natural gas, marine transport, etc., to a large extent are all and always directed to the central government with less or non to the local government or community directly. This licensing system makes the local Government become weak in doing its business at local level because it lacks the financial capacity to deal with management issues of those coastal and marine resources. It is important if the distribution of these incomes can be adjusted to enable the local governments to cope with rising management challenges at local level.
There is a need to constantly raise the knowledge and awareness on the importance of coastal and marine system to all stakeholders using different means. Use of several and different media like radio, TV, theatre arts, posters, electronic media etc., are among the recommended means to enhance knowledge and awareness to many stakeholders. As such there is a need to revive the semi-annual retreats and coastal and marine forums to enable the practitioners to share knowledge and experience on coastal and marine issues.
65
6. PLANNING AND MANAGEMENT
6 . PLANNING AND MANAGEMENT
National Disaster Management Plans
Tanzania has experienced both natural and man-made disasters. Drought, floods and earthquakes are just a few examples. Lack of awareness and information among the disaster risk management stakeholders and the general public has been one of the leading factors which contribute to peoples’ vulnerability to disasters and destruction of infrastructure. Disasters also affect livelihoods and cause poverty, food insecurity and health problems. Evidence indicates that disasters will occur with greater frequency and intensity in years to come (URT 2009).
One of the leading factors reported to be contributing to peoples’ vulnerability to disasters is lack of awareness and information among the disaster risk management stakeholders and the general public (URT, 2002, 2003). Tanzania has an upper organ known as the ‘Tanzania Disaster Relief Committee (TANDREC)’ that constitutes Permanent Secretaries of Sector Ministries, which convenes whenever necessary and makes decisions to utilize relief funds in responding and giving relief to victims (URT, 2002, 2003). Other policies that address disaster risk management include the National Land Policy (1995), the National Human Settlements Development Policy (2000), and the National Environmental Management Policy (1997). Furthermore, there is a standing legislation referred to as “The Disaster Relief Act No. 9 of 1990”. which was enacted in 1990 to oversee and help in the coordination of relief operations at national level. The government also has selected organizations and institutions which are responsible for the early warning system, namely the Tanzania Meteorological Agency, Seismology unit under the Ministry of Energy and Minerals, Emergency Preparedness and Response Unit (EPRU), Plant Protection, Food Security Department and Famine Early Warning System Network (FEWS NET) under Ministry of Agriculture.
Moreover, according to the UN (2009), persistent and emerging disaster risks have highlighted the need to strengthen national structures in Tanzania to minimize these risks, prepare for potential disasters and support the building of sustainable capacities to manage responses in case a disaster strikes. In the spirit of UN reform and the UN Development Assistance Framework, the vision of the UN in Tanzania is closer cooperation of UN agencies in supporting the Government in disaster management. The overall goal of this joint programme, which is part of the One UN Programme, is to enhance national capacity to reduce vulnerability and mitigate disasters. Tanzania has also endorsed Hyogo Framework of Action, and the African Union Regional Disaster Reduction Strategy, which clearly commit countries to address disaster risks in a proactive and participatory way. According to an Interim national progress report on the implementation of the Hyogo Framework for Action (URT, 2002; 2003), the National Operational Guidelines for Disasters (2003) and National Disaster Management policy of 2004 outlines National goals and objectives for hazard risks and emergency management. Furthermore, Mango (2007) explained that the National Land Use Planning Commission has land use plans and squatter upgrading programme which incorporate risk management measures.
i) IssuesNeed for effective coordination between agencies responsible for disaster management. Awareness and communication of government disaster mitigation plans or strategies.Weak implementation of the disaster mitigation plansPoor land use planning leading to development in disaster prone areas.Disaster monitoring networks and early warning system.
ii) GapsLack of flood inundation maps for low lying regions.Lack of awareness and information among the disaster risk management stakeholders.Lack of financial support in integrating disaster risk reduction in the land use planning process and other development programmes.Lack of a monitoring and evaluation system in the implementation of land use plans to get feedback on the impact of land use plans on disaster reduction.Lack of financial support to research better ways to prepare land use plans that respond to disaster risk reduction and preparedness.

66
6. PLANNING AND MANAGEMENT
Lack of mainstreaming of the land use planning and disaster management projects by the International Financial Institutions such as World Bank and European Union.Lack of frequent public awareness programmes on disaster preparedness and response at District and Community levels.Inadequate capacity in timely response to disasters, lack of early warning system on disasters and contingency plans for DRR.Lack of good water circulation models for example to show oil spill movement, tsunami/other seismic incidences run-up, storm surges, among others.Lack of featuring media in all stages of disaster management cycle.
Environmental Sensitivity Mapping
Tanzania`s coast faces threats from the maritime transportation of oil including other chemical substances, and offshore drilling of oil. Tanzania’s territorial waters are among the busiest shipping lanes in Africa, but the country has never experienced a serious oil spill incident (Guardian 2008). According to SUMATRA, it is estimated that there are 50 ships in the major shipping lanes off Tanzania’s coast at any given time. An average of nine oil tankers with capacities ranging from 50,000 to 250,000 tonnes, sail through the shipping lanes daily (The Citizen 2009).
Tanzania’s National Marine Oil Spill Contingency Plan (NMOCP) is currently under review. The Contingency Plan includes oil spill control and cleaning modes, methods of reporting oil spill incidents, establishment of a response headquarters and formation of national and response teams. Moreover, the country is in the process of preparing the National Oil Spill Response Contingency Plan (NOSRCP). In August 2008, stakeholders from the National Environment Management Council (NEMC), Navy (TPDF), Tanzanian Petroleum Development Corporation (TPDC), Energy and Water Utilities Regulatory Authority (EWURA), National Land Use Planning Commission (NLUPC) and representatives of several ministries sat together to discuss this initiative. The co-ordination of this exercise is done by the Surface and Marine Transport Regulatory Authority (SUMATRA).
A Danish consultancy company- Geological Survey of Denmark and Greenland (GEUS), is undertaking a preparatory study for an Environmental Sensitivity Atlas for Tanzanian Coast. The preparatory study, funded under the Study and Consultancy Fund of the bilateral co-operation between the government of Belgium and the government of Tanzania, is the first and most important step towards drawing up the Environmental Atlas. It is expected that this Environmental Atlas will be completed by June 2012. WWF (Tanzania) has also prepared an environmental sensitivity map for the Tanzanian coast (Guardian 2008).
i) IssuesThere is need to have sensitivity maps for the entire coastline of Tanzania.Raising awareness on oil spill and associated impacts on the marine and coastal ecosystems.Need for improved collaborations between different institutions and organizations involved in disaster management.
ii) GapsPrepare the sensitivity atlas through building on WWF sensitivity maps.Sensitizing the public on issues related to oil spills.Poor collaborations between different institutions and organizations involved in disaster management.
Coastal Management/Development Plans
A National Integrated Coastal Management (ICM) Strategy was officially launched in April 2003. It is a framework for linking and harmonising different sectors role in the management of coastal resources including decentralisation and harmonisation with existing initiatives and participatory approaches (Rweyemamu 2003). Currently there are no marine fisheries projects in implementation based on the Fisheries Master Plan.
67
6. PLANNING AND MANAGEMENT
i) IssuesCoordination between agencies involved in coastal planning and development.Rapid coastal population growth putting additional stress to coastal and marine environment.Weak capacity for integrated planning and management.Emerging socio-economic problems due to poor planning of coastal development.
ii) GapsLack of current data on the extent of urban sprawling. Lack of alternative energy sources to reduce dependency on the exploitation of mangroves. Lack of or limited access to beaches as a result of coastal development particularly hotels in areas such as Bagamoyo.Inadequate tourism information centres.
Areas under special management
Marine Protected AreasTanzania started its marine conservation initiatives in 1975 by declaring the first Marine Reserves under the Fisheries Act of 1970. Over the years, the country has established several marine protected areas, mostly for biodiversity protection. The exception is Dar es Salaam marine reserves which were created largely for tourism and recreation. The more recent MPAs have been established to conserve marine resources for sustainable use by local communities within and outside the protected areas. Most of the MPAs are focussed on the coral reefs while mangroves and other wetlands are under represented (Saada 2005).
The estimated total coverage of the Marine Protected Areas (MPAs) in Tanzania is currently 1,380 km2. The Marine Parks and Reserves Act No. 29 of 1994 is the main legal instrument for the establishment of marine protected areas in Tanzania mainland. In Zanzibar, the overall mandate for protected areas lies with the Ministry of Agriculture, Natural Resources, Environment and Co-operatives (MANREC). Two main approaches are used in protected area management: co-management arrangements between local communities and the government (e.g. in Misali Island, Menai Bay and Kiwengwa), and agreements with tourist companies that manage lodges within the MPAs (e.g in Chumbe and Mnemba Islands) (Wells et al. 2004).
Marine Managed Areas
Mangrove Forest ReservesAll mangrove forests in Tanzania are gazetted as Forest Reserves under the forestry legislation. Also mangrove areas are classified into four categories according to their quality and use; those designated as “core zones (Zone 1) might technically qualify as protected areas. In other zones, controlled harvesting of poles (selective cutting) is permitted where mangroves are ecologically stable and have sufficient regeneration potential (Saada 2005). In Zanzibar, Forest Resources Management Act of 1996 provides for the gazettement of Forest Reserves (The Revolutionary Government of Zanzibar 2009).
Collaborative Fisheries Management AreasCollaborative fisheries management areas have been established in Tanga, Muheza, Kilindi, Pangani and Bagamoyo Districts through Tanga Coastal Zone Conservation and Development Programme (TCZCDP) and Tanzania Coastal Management Partnership (TCMP), respectively (Saada, 2005). CFMAs are implemented jointly by local villages and the Districts. The boundaries of these areas are determined by ascertaining the use of the area by a group of villages- they are therefore based on resource use rather than biodiversity characteristics or administrative arrangements. Selected reefs within the six fisheries management areas have been closed by the villages to fishing e.g Maziwe Island marine reserve. The plans for each area are approved at national level by the Fisheries Department and legal backing is provided by village and District by-laws. In Zanzibar, the Environment Act allows for national ICM planning and village level ICM plans co-ordinated by the Department of Environment (cf. Wells et al. 2004).
Saadani National ParkThere are 14 National Parks that are managed by Tanzania National Parks (TANAPA). However, Saadani
68
6. PLANNING AND MANAGEMENT
National Park (SANAPA) is the first National Park to include both terrestrial and marine habitats in its area. The terrestrial part of this park was a Game Reserve, and its gazettement has involved the inclusion of an area of marine habitat, extending protection into the sea (Saada 2005).
Rufiji- Mafia - Kilwa Marine RAMSAR SiteThe site is located in the three districts of Rufiji, Mafia and Kilwa, within the Coast and Lindi regions of southeast Tanzania. It was designated on 29th October 2004 and it has an area of 596,908 ha (URT 2009). According to the Directory of Wetlands of International Importance, this site is a good representative wetland of East Africa as it contains a large diversity of wetland types, which are ecologically interlinked. This includes the threatened estuarine, coastal and marine wetland habitats (Directory of Wetlands of International Importance 2004).
i) IssuesPoaching activitiesCoastal developmentConflict between usersInsufficient education and awareness of the value of managed areas.
ii) GapsLack of CFMA in other areas. Review of the existing Management Plans and Zoning Schemes, Mangroves and Marine Parks.Review of the responsibilities of the different government institutions and departments responsible for forests, fisheries, wildlife, agriculture, ports, surveying of land and issuing of titles, and mineral mining in order to avoid conflicts arising between those branches of government regarding management of mangrove areas.
Monitoring, Control and SurveillanceTanzania’s 12 nautical miles of territorial sea and 200 nautical mile EEZ covers 223,000 km². The fishing is carried out mainly within the continental shelf which covers a surface area of 30,000 km². Tanzania has formed Deep Sea Authority (DSA) - a corporate body with powers to regulate and control fishing activities in the country’s Exclusive Economic Zone (EEZ). For the high-seas fishing, mainland Tanzania and Zanzibar are both issuing licenses to foreign fishing vessels. The royalties received from licensed foreign vessels provide foreign currency. However, there is complete lack of control over the operations of these vessels while in offshore waters (Saada 2005).
Monitoring, control and surveillance system is weak and most of the EEZ is uncontrolled and probably regularly fished by mostly unlicensed tuna vessels. The area at present is not fully explored and therefore the stock abundance is not fully known. Tanzania lose billions of US dollars through fish smuggling by foreign fishing vessels in the EEZ due to absence of local observers to monitor fishing activities of the vessels. In Tanzania the reporting of fishing effort is done voluntarily and most data reports underestimates actual catch since some vessels breach license conditions by fishing in restricted areas, such as marine protected areas. Statistics from the Fisheries Department show that although over 171 vessels were registered in 2004. However, none docked in Tanzanian ports.
The Division of Fisheries has the largest share of authority compared to other government institutions over many issues related to coastal marine resources in mainland Tanzania including fisheries and mariculture development and marine park formulation and management. However, according the Fisheries Regulations (Ministry of Natural Resources and Tourism 2005) No. 104 (3) states that “Every person engaging in fisheries activities including fish processors, traders, gear repairers, and boat builders with the Beach Management Unit (BMU) shall be registered as members of such Beach Management Unit”. It continues in part 4 that the functions of the BMU shall include, but not limited to “engaging in monitoring, control and surveillance in such a way to reduce the incidence of illegal gears, fishing and fish trading practices within the BMU area”.
Patrols carried out in 2009 under the auspices of SADC that involved South Africa, Mozambique, Tanzania and Kenya managed to seize a commercial trawler, TAWARIQ 1, which was illegally fishing in Tanzania’s Exclusive Economic Zone (EEZ) with a haul of 296 tonnes of fish (This Day 2009). In 2004/2005, about 20
69
6. PLANNING AND MANAGEMENT
illegal fishing vessels were captured in Tanzania’s waters in the Indian Ocean (Daily News 2008).
Illegal, unreported and unregulated fishing activities by industrial-sized foreign vessels have traditionally been denying the country significant revenue. Tanzania harvest only 5,000 tonnes of fish annually, which is small compared to the established potential (Tanzania Standards Newspapers 2006).
Government of Tanzania has embarked on a special countrywide operation against use of illegal fishing gears and illegal export of fish products. This includes establishing more patrol and management centres in various districts. Patrols are carried out in collaboration with Marine Police, Navy and judiciary with mobile courts. According to the Minister for Livestock Development and Fisheries (2008), the Tanzania People’s Defence Forces (TPDF) is stepping up patrols in the country’s Exclusive Economic Zone (EEZ) to curb theft of marine resources (Daily News 2008).
i) IssuesInadequate capacity to enforce regulations in the EEZ,High cost of monitoring, control and surveillance.Capacity for effective MCS.Low budgetary allocation for MCS for the coastal and marine resources.Permits are issued for quotas and there is no monitoring of catches by foreign vessels.
ii) Gaps
Insufficient research on issues related to fishing in general including research on the level of awareness among fishermen on hazards of using illegal fishing gears. Assessment of the achievement of the BMUs based on the functions stipulated in fisheries regulations.Inadequate information on issues related to community-based monitoring of coastal and marine resources.Lack of information on the optimum level of effort that produces maximum yield that can be sustainable without affecting the long-term production.Based on the fishing challenges in the EEZ as explained above, there is insufficient Vessel Monitoring Systems (VMS).Lack of regular patrols -Lack of enough patrol boats and planes.Lack of necessary inputs to fisheries experts to enable them to collect data, process, store and above all be able to timely disseminate the information to consumers.Lack of accessible fisheries resource data bases.
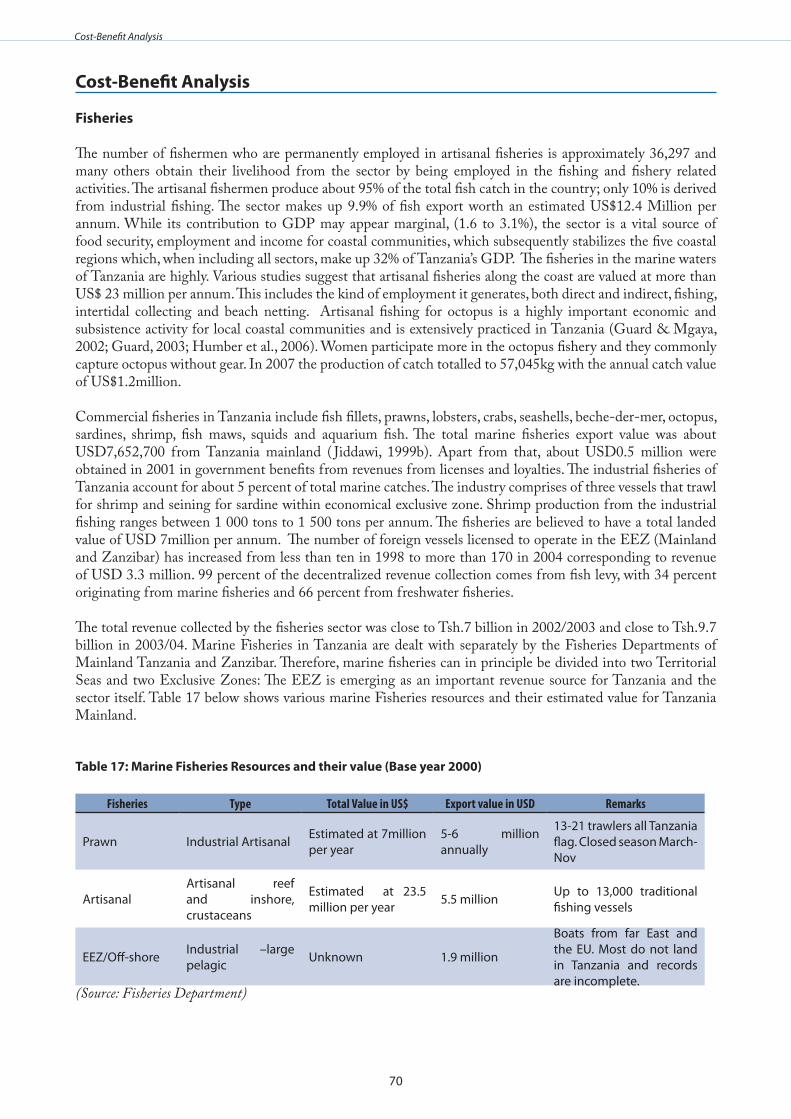
70
Cost-Benefit Analysis
Cost-Benefit Analysis Fisheries
The number of fishermen who are permanently employed in artisanal fisheries is approximately 36,297 and many others obtain their livelihood from the sector by being employed in the fishing and fishery related activities. The artisanal fishermen produce about 95% of the total fish catch in the country; only 10% is derived from industrial fishing. The sector makes up 9.9% of fish export worth an estimated US$12.4 Million per annum. While its contribution to GDP may appear marginal, (1.6 to 3.1%), the sector is a vital source of food security, employment and income for coastal communities, which subsequently stabilizes the five coastal regions which, when including all sectors, make up 32% of Tanzania’s GDP. The fisheries in the marine waters of Tanzania are highly. Various studies suggest that artisanal fisheries along the coast are valued at more than US$ 23 million per annum. This includes the kind of employment it generates, both direct and indirect, fishing, intertidal collecting and beach netting. Artisanal fishing for octopus is a highly important economic and subsistence activity for local coastal communities and is extensively practiced in Tanzania (Guard & Mgaya, 2002; Guard, 2003; Humber et al., 2006). Women participate more in the octopus fishery and they commonly capture octopus without gear. In 2007 the production of catch totalled to 57,045kg with the annual catch value of US$1.2million.
Commercial fisheries in Tanzania include fish fillets, prawns, lobsters, crabs, seashells, beche-der-mer, octopus, sardines, shrimp, fish maws, squids and aquarium fish. The total marine fisheries export value was about USD7,652,700 from Tanzania mainland ( Jiddawi, 1999b). Apart from that, about USD0.5 million were obtained in 2001 in government benefits from revenues from licenses and loyalties. The industrial fisheries of Tanzania account for about 5 percent of total marine catches. The industry comprises of three vessels that trawl for shrimp and seining for sardine within economical exclusive zone. Shrimp production from the industrial fishing ranges between 1 000 tons to 1 500 tons per annum. The fisheries are believed to have a total landed value of USD 7million per annum. The number of foreign vessels licensed to operate in the EEZ (Mainland and Zanzibar) has increased from less than ten in 1998 to more than 170 in 2004 corresponding to revenue of USD 3.3 million. 99 percent of the decentralized revenue collection comes from fish levy, with 34 percent originating from marine fisheries and 66 percent from freshwater fisheries.
The total revenue collected by the fisheries sector was close to Tsh.7 billion in 2002/2003 and close to Tsh.9.7 billion in 2003/04. Marine Fisheries in Tanzania are dealt with separately by the Fisheries Departments of Mainland Tanzania and Zanzibar. Therefore, marine fisheries can in principle be divided into two Territorial Seas and two Exclusive Zones: The EEZ is emerging as an important revenue source for Tanzania and the sector itself. Table 17 below shows various marine Fisheries resources and their estimated value for Tanzania Mainland.
Table 17: Marine Fisheries Resources and their value (Base year 2000)
Fisheries Type Total Value in US$ Export value in USD Remarks
Prawn Industrial Artisanal Estimated at 7million per year
5-6 million annually
13-21 trawlers all Tanzania flag. Closed season March-Nov
Artisanal Artisanal reef and inshore, crustaceans
Estimated at 23.5 million per year 5.5 million Up to 13,000 traditional
fishing vessels
EEZ/Off-shore Industrial –large pelagic Unknown 1.9 million
Boats from far East and the EU. Most do not land in Tanzania and records are incomplete.
(Source: Fisheries Department)
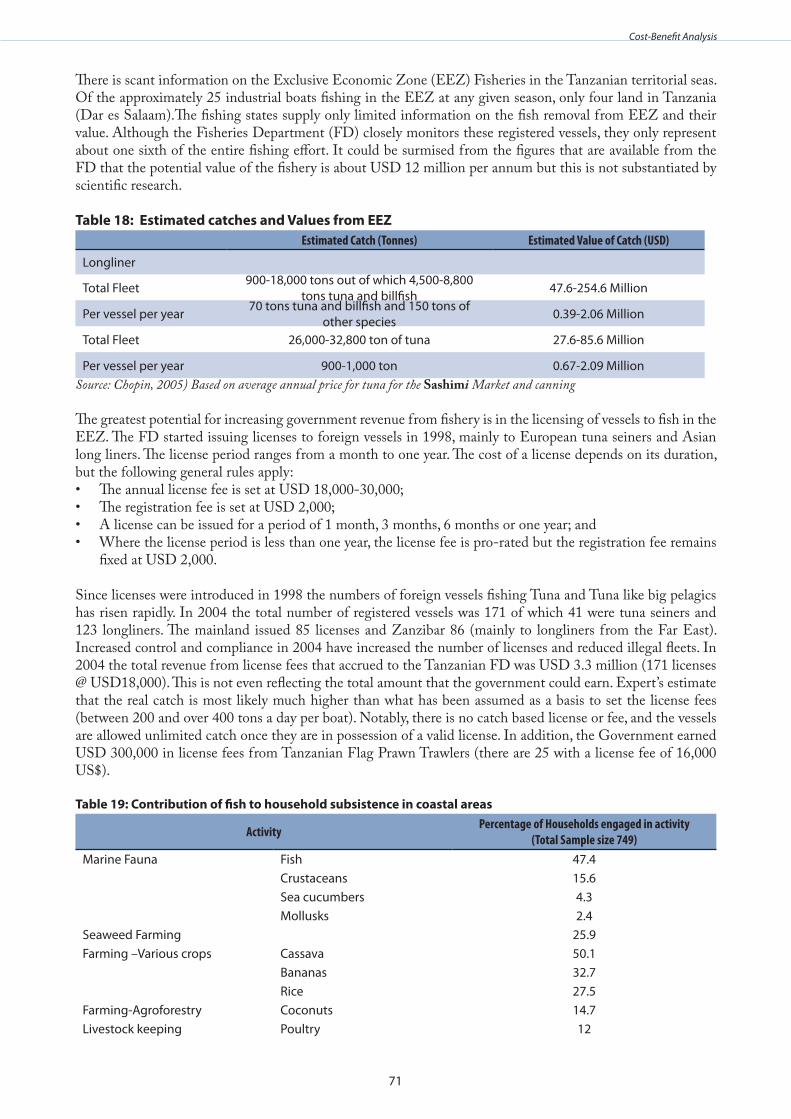
71
Cost-Benefit Analysis
There is scant information on the Exclusive Economic Zone (EEZ) Fisheries in the Tanzanian territorial seas. Of the approximately 25 industrial boats fishing in the EEZ at any given season, only four land in Tanzania (Dar es Salaam).The fishing states supply only limited information on the fish removal from EEZ and their value. Although the Fisheries Department (FD) closely monitors these registered vessels, they only represent about one sixth of the entire fishing effort. It could be surmised from the figures that are available from the FD that the potential value of the fishery is about USD 12 million per annum but this is not substantiated by scientific research.
Table 18: Estimated catches and Values from EEZEstimated Catch (Tonnes) Estimated Value of Catch (USD)
Longliner
Total Fleet 900-18,000 tons out of which 4,500-8,800 tons tuna and billfish 47.6-254.6 Million
Per vessel per year 70 tons tuna and billfish and 150 tons of other species 0.39-2.06 Million
Total Fleet 26,000-32,800 ton of tuna 27.6-85.6 Million
Per vessel per year 900-1,000 ton 0.67-2.09 Million Source: Chopin, 2005) Based on average annual price for tuna for the Sashimi Market and canning
The greatest potential for increasing government revenue from fishery is in the licensing of vessels to fish in the EEZ. The FD started issuing licenses to foreign vessels in 1998, mainly to European tuna seiners and Asian long liners. The license period ranges from a month to one year. The cost of a license depends on its duration, but the following general rules apply:
The annual license fee is set at USD 18,000-30,000;•The registration fee is set at USD 2,000;•A license can be issued for a period of 1 month, 3 months, 6 months or one year; and•Where the license period is less than one year, the license fee is pro-rated but the registration fee remains •fixed at USD 2,000.
Since licenses were introduced in 1998 the numbers of foreign vessels fishing Tuna and Tuna like big pelagics has risen rapidly. In 2004 the total number of registered vessels was 171 of which 41 were tuna seiners and 123 longliners. The mainland issued 85 licenses and Zanzibar 86 (mainly to longliners from the Far East). Increased control and compliance in 2004 have increased the number of licenses and reduced illegal fleets. In 2004 the total revenue from license fees that accrued to the Tanzanian FD was USD 3.3 million (171 licenses @ USD18,000). This is not even reflecting the total amount that the government could earn. Expert’s estimate that the real catch is most likely much higher than what has been assumed as a basis to set the license fees (between 200 and over 400 tons a day per boat). Notably, there is no catch based license or fee, and the vessels are allowed unlimited catch once they are in possession of a valid license. In addition, the Government earned USD 300,000 in license fees from Tanzanian Flag Prawn Trawlers (there are 25 with a license fee of 16,000 US$). Table 19: Contribution of fish to household subsistence in coastal areas
Activity Percentage of Households engaged in activity (Total Sample size 749)
Marine Fauna Fish 47.4Crustaceans 15.6Sea cucumbers 4.3Mollusks 2.4
Seaweed Farming 25.9Farming –Various crops Cassava 50.1
Bananas 32.7Rice 27.5
Farming-Agroforestry Coconuts 14.7Livestock keeping Poultry 12
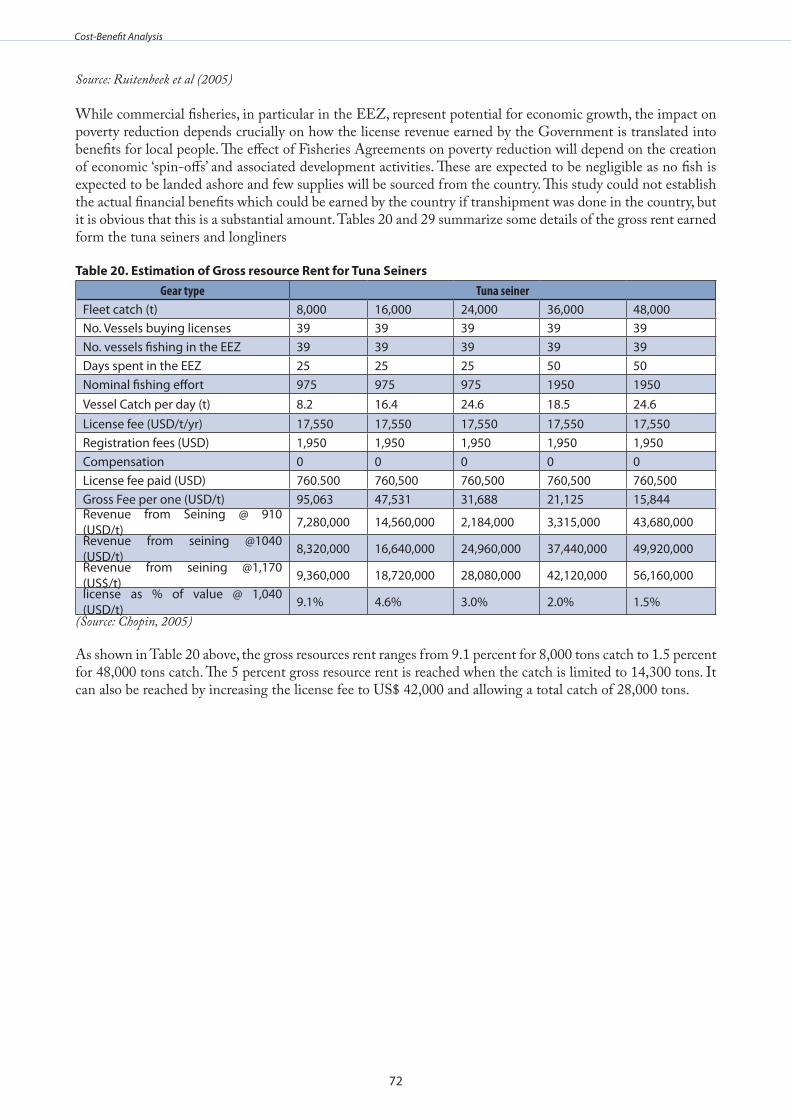
72
Cost-Benefit Analysis
Source: Ruitenbeek et al (2005)
While commercial fisheries, in particular in the EEZ, represent potential for economic growth, the impact on poverty reduction depends crucially on how the license revenue earned by the Government is translated into benefits for local people. The effect of Fisheries Agreements on poverty reduction will depend on the creation of economic ‘spin-offs’ and associated development activities. These are expected to be negligible as no fish is expected to be landed ashore and few supplies will be sourced from the country. This study could not establish the actual financial benefits which could be earned by the country if transhipment was done in the country, but it is obvious that this is a substantial amount. Tables 20 and 29 summarize some details of the gross rent earned form the tuna seiners and longliners
Table 20 . Estimation of Gross resource Rent for Tuna SeinersGear type Tuna seiner
Fleet catch (t) 8,000 16,000 24,000 36,000 48,000No. Vessels buying licenses 39 39 39 39 39No. vessels fishing in the EEZ 39 39 39 39 39Days spent in the EEZ 25 25 25 50 50Nominal fishing effort 975 975 975 1950 1950Vessel Catch per day (t) 8.2 16.4 24.6 18.5 24.6License fee (USD/t/yr) 17,550 17,550 17,550 17,550 17,550Registration fees (USD) 1,950 1,950 1,950 1,950 1,950Compensation 0 0 0 0 0License fee paid (USD) 760.500 760,500 760,500 760,500 760,500Gross Fee per one (USD/t) 95,063 47,531 31,688 21,125 15,844Revenue from Seining @ 910 (USD/t) 7,280,000 14,560,000 2,184,000 3,315,000 43,680,000Revenue from seining @1040 (USD/t) 8,320,000 16,640,000 24,960,000 37,440,000 49,920,000Revenue from seining @1,170 (US$/t) 9,360,000 18,720,000 28,080,000 42,120,000 56,160,000license as % of value @ 1,040 (USD/t) 9.1% 4.6% 3.0% 2.0% 1.5%
(Source: Chopin, 2005)
As shown in Table 20 above, the gross resources rent ranges from 9.1 percent for 8,000 tons catch to 1.5 percent for 48,000 tons catch. The 5 percent gross resource rent is reached when the catch is limited to 14,300 tons. It can also be reached by increasing the license fee to US$ 42,000 and allowing a total catch of 28,000 tons.
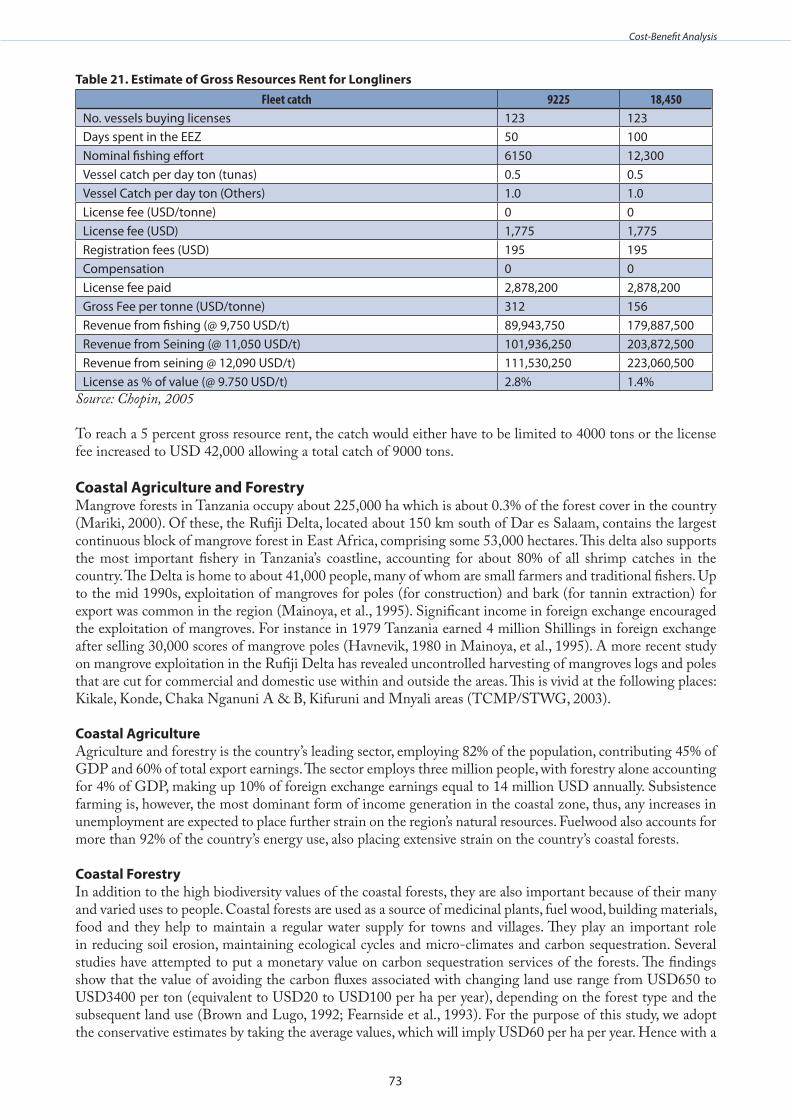
73
Cost-Benefit Analysis
Table 21 . Estimate of Gross Resources Rent for Longliners Fleet catch 9225 18,450
No. vessels buying licenses 123 123Days spent in the EEZ 50 100Nominal fishing effort 6150 12,300Vessel catch per day ton (tunas) 0.5 0.5Vessel Catch per day ton (Others) 1.0 1.0License fee (USD/tonne) 0 0License fee (USD) 1,775 1,775Registration fees (USD) 195 195Compensation 0 0License fee paid 2,878,200 2,878,200Gross Fee per tonne (USD/tonne) 312 156Revenue from fishing (@ 9,750 USD/t) 89,943,750 179,887,500Revenue from Seining (@ 11,050 USD/t) 101,936,250 203,872,500Revenue from seining @ 12,090 USD/t) 111,530,250 223,060,500License as % of value (@ 9.750 USD/t) 2.8% 1.4%
Source: Chopin, 2005
To reach a 5 percent gross resource rent, the catch would either have to be limited to 4000 tons or the license fee increased to USD 42,000 allowing a total catch of 9000 tons. Coastal Agriculture and ForestryMangrove forests in Tanzania occupy about 225,000 ha which is about 0.3% of the forest cover in the country (Mariki, 2000). Of these, the Rufiji Delta, located about 150 km south of Dar es Salaam, contains the largest continuous block of mangrove forest in East Africa, comprising some 53,000 hectares. This delta also supports the most important fishery in Tanzania’s coastline, accounting for about 80% of all shrimp catches in the country. The Delta is home to about 41,000 people, many of whom are small farmers and traditional fishers. Up to the mid 1990s, exploitation of mangroves for poles (for construction) and bark (for tannin extraction) for export was common in the region (Mainoya, et al., 1995). Significant income in foreign exchange encouraged the exploitation of mangroves. For instance in 1979 Tanzania earned 4 million Shillings in foreign exchange after selling 30,000 scores of mangrove poles (Havnevik, 1980 in Mainoya, et al., 1995). A more recent study on mangrove exploitation in the Rufiji Delta has revealed uncontrolled harvesting of mangroves logs and poles that are cut for commercial and domestic use within and outside the areas. This is vivid at the following places: Kikale, Konde, Chaka Nganuni A & B, Kifuruni and Mnyali areas (TCMP/STWG, 2003). Coastal Agriculture Agriculture and forestry is the country’s leading sector, employing 82% of the population, contributing 45% of GDP and 60% of total export earnings. The sector employs three million people, with forestry alone accounting for 4% of GDP, making up 10% of foreign exchange earnings equal to 14 million USD annually. Subsistence farming is, however, the most dominant form of income generation in the coastal zone, thus, any increases in unemployment are expected to place further strain on the region’s natural resources. Fuelwood also accounts for more than 92% of the country’s energy use, also placing extensive strain on the country’s coastal forests.
Coastal ForestryIn addition to the high biodiversity values of the coastal forests, they are also important because of their many and varied uses to people. Coastal forests are used as a source of medicinal plants, fuel wood, building materials, food and they help to maintain a regular water supply for towns and villages. They play an important role in reducing soil erosion, maintaining ecological cycles and micro-climates and carbon sequestration. Several studies have attempted to put a monetary value on carbon sequestration services of the forests. The findings show that the value of avoiding the carbon fluxes associated with changing land use range from USD650 to USD3400 per ton (equivalent to USD20 to USD100 per ha per year), depending on the forest type and the subsequent land use (Brown and Lugo, 1992; Fearnside et al., 1993). For the purpose of this study, we adopt the conservative estimates by taking the average values, which will imply USD60 per ha per year. Hence with a

74
Cost-Benefit Analysis
total area of 617,562 ha of coastal forest, this will translate into USD 37,053,714 per annum as the economic and social value of the coastal ecosystem in terms of avoiding carbon fluxes associated with changes in land use. This figure is arrived by taking into account commercial products such as timber, beeswax, honey, fuelwood, poles, charcoal, wattle-bark, wild fruits etc.
Existence value derives from the knowledge of a resource’s continued existence, independent of any use. There are several plausible underlying motivations for existence value which have been widely covered in social science literature (e.g. Randall and Stoll, 1983). From the methodological standpoint, measurement of existence value is perhaps the least tractable and most contentious aspect of natural resource valuation. The available developed country evidence (summarized in Pearce, 1993), suggests that non users have typically indicated values in the range US$1.2 - 64 per annum per person for wild species, while per annum WTP for scenic and wilderness areas range between USD9 and USD107. To estimate this value for forests in our study area, we used data from a synthesis of global economic values of forest ecosystems. This synthesis indicates considerable variability in estimates of existence value for various forest regions, which is associated with differences in both methodology and attributes of the forests that were valued. We chose to be conservative and therefore selected a value of USD5/ha per annum for household WTP for the existence of forests in the area, a value based on debt-for-nature swaps for all tropical forests. We assume that the forests in our region are representative of tropical forests in general, and that they would qualify for additionality based on rapid conversion rates outside protected areas. On the basis of this evidence, indicative per hectare values would appear to be in the range (0.03 - 10.4 USD ha-1). Multiplying the upper bound of that range over the extent Coastal forests (approximately 617,562 hectares) provides a conservative estimate of USD 6,422,643. Value of critical ecosystemsCoastal mangrove forests cover a total area of about 115,500 ha. It is estimated that over 150,000 people in Tanzania earn their living directly from mangrove resources. Mangrove exploitation for poles for construction and bark (for tannin extraction), both for export, was common in Tanzania up to the mid-1990s (UNEP/Nairobi Convention 2008).
Coastal communities use mangroves to supply local needs for fuelwood, charcoal making, fences, house construction, boat building, fish traps, fish stakes and for medicines. Overall, it is estimated that over 150,000 people make their living directly from mangrove resources in Tanzania (Saada 2005). Commercial fisheries of crabs, prawn and fish are directly dependent on the mangrove ecosystems thus the two main prawn fishing grounds are areas adjacent to the Rufiji Delta and Bagamoyo. Likewise the fishing for crab is an important activity in the Pangani river mangroves. The potential catch of the large mangrove crab (Scylla serrata) was estimated to be 5 – 10 tonnes wet wt/month in Pangani and in 1989 the price of the crab was TShs. 75/Kg (Semesi and Mzava 1991). Today the price of the crab is ranges from TShs 2500-6000/kg. The direct value of the mangrove habitat which includes values for the fuelwood, timber and poles and wood products, the animals and birds and the honey it provides was estimated to be US$ 0.9 million per year (Turpie 2000).
Coral reefs support one of the most productive and diverse marine ecosystems in Tanzania waters and, with their associated habitats support a variety of marine species. It is estimated that 95% of artisanal fishing, which employs over 50,000 full time fishermen, is carried out on coral reefs and that they support over 70% of the artisanal fish production in Tanzania (Saada 2005). It is estimated that a sustainable yield harvest of 15 tons of fish can be obtained per km2 of coralline areas in depth of less than 30 m (Munro and Williams 1985). Thus with 3,580 km2 it would suggest that about 340 tons are harvested annual from the coral reefs. With approximately USD 1000 per tons this will translate into USD 340,000 per annum.
TourismTourism in Tanzania plays a vital role in the country’s economic development. It is one of the major sources of foreign exchange. The sector accounts for 17.2% of the GDP and nearly 25% of total export earnings. It directly supports an estimated 288,700 jobs (TTB, 2008). Foreign exchange receipts from tourism grew from USD259.44 million in 1995 to USD,269.68 million in 2008. Tourist arrivals have shown a steady increase from 295,312 in 1995 to 770,376 in 2008 (MNRT, 2008). USA, UK, Italy, Canada, Australia, Netherlands, Sweden, France, South Africa, India and China, remain the major tourist source markets for Tanzania.
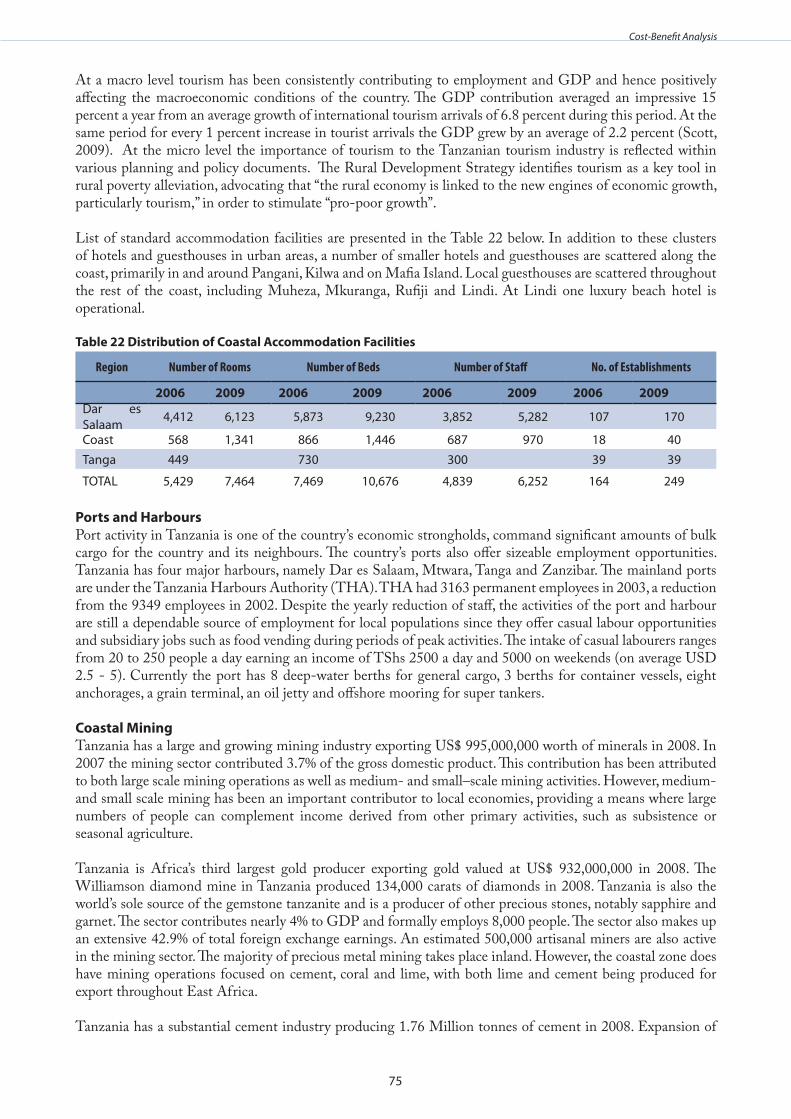
75
Cost-Benefit Analysis
At a macro level tourism has been consistently contributing to employment and GDP and hence positively affecting the macroeconomic conditions of the country. The GDP contribution averaged an impressive 15 percent a year from an average growth of international tourism arrivals of 6.8 percent during this period. At the same period for every 1 percent increase in tourist arrivals the GDP grew by an average of 2.2 percent (Scott, 2009). At the micro level the importance of tourism to the Tanzanian tourism industry is reflected within various planning and policy documents. The Rural Development Strategy identifies tourism as a key tool in rural poverty alleviation, advocating that “the rural economy is linked to the new engines of economic growth, particularly tourism,” in order to stimulate “pro-poor growth”.
List of standard accommodation facilities are presented in the Table 22 below. In addition to these clusters of hotels and guesthouses in urban areas, a number of smaller hotels and guesthouses are scattered along the coast, primarily in and around Pangani, Kilwa and on Mafia Island. Local guesthouses are scattered throughout the rest of the coast, including Muheza, Mkuranga, Rufiji and Lindi. At Lindi one luxury beach hotel is operational.
Table 22 Distribution of Coastal Accommodation Facilities
Region Number of Rooms Number of Beds Number of Staff No. of Establishments
2006 2009 2006 2009 2006 2009 2006 2009Dar es Salaam 4,412 6,123 5,873 9,230 3,852 5,282 107 170
Coast 568 1,341 866 1,446 687 970 18 40Tanga 449 730 300 39 39
TOTAL 5,429 7,464 7,469 10,676 4,839 6,252 164 249
Ports and HarboursPort activity in Tanzania is one of the country’s economic strongholds, command significant amounts of bulk cargo for the country and its neighbours. The country’s ports also offer sizeable employment opportunities. Tanzania has four major harbours, namely Dar es Salaam, Mtwara, Tanga and Zanzibar. The mainland ports are under the Tanzania Harbours Authority (THA). THA had 3163 permanent employees in 2003, a reduction from the 9349 employees in 2002. Despite the yearly reduction of staff, the activities of the port and harbour are still a dependable source of employment for local populations since they offer casual labour opportunities and subsidiary jobs such as food vending during periods of peak activities. The intake of casual labourers ranges from 20 to 250 people a day earning an income of TShs 2500 a day and 5000 on weekends (on average USD 2.5 - 5). Currently the port has 8 deep-water berths for general cargo, 3 berths for container vessels, eight anchorages, a grain terminal, an oil jetty and offshore mooring for super tankers.
Coastal MiningTanzania has a large and growing mining industry exporting US$ 995,000,000 worth of minerals in 2008. In 2007 the mining sector contributed 3.7% of the gross domestic product. This contribution has been attributed to both large scale mining operations as well as medium- and small–scale mining activities. However, medium- and small scale mining has been an important contributor to local economies, providing a means where large numbers of people can complement income derived from other primary activities, such as subsistence or seasonal agriculture.
Tanzania is Africa’s third largest gold producer exporting gold valued at US$ 932,000,000 in 2008. The Williamson diamond mine in Tanzania produced 134,000 carats of diamonds in 2008. Tanzania is also the world’s sole source of the gemstone tanzanite and is a producer of other precious stones, notably sapphire and garnet. The sector contributes nearly 4% to GDP and formally employs 8,000 people. The sector also makes up an extensive 42.9% of total foreign exchange earnings. An estimated 500,000 artisanal miners are also active in the mining sector. The majority of precious metal mining takes place inland. However, the coastal zone does have mining operations focused on cement, coral and lime, with both lime and cement being produced for export throughout East Africa.
Tanzania has a substantial cement industry producing 1.76 Million tonnes of cement in 2008. Expansion of

76
Cost-Benefit Analysis
the cement industry since 2008 has Tanzania producing over 3Mta in 2010 with new plants coming on line in 2011.
Coastal Resources and Poverty Alleviation Fisheries dependent communities have been mentioned to be economically better off than purely agricultural dependent livelihood earners as earlier discussed (DFID undated). Yet determination of profit margins for fishers and related activities requires complex analysis involving many variables and assumptions. This is complicated by the different gear types used, the use or non-use of boats, whether or not boats used are motorised. Whereas men go out to fish in boats, women mostly glean the intertidal areas for gastropods, bivalves and sea cucumbers ( Jiddawi 2000). There is no periodic survey programme for fisheries households and therefore no official information on fishers’ income other than data collected in the preparation of the Fisheries Master Plan Project. Survey outcome showed that the income of fishers is approximately US $ 1 per day, which exceeds the national average, with incomes of Tshs 120,000/= per month for a boat owner with a circle net in the marine waters. This is categorised as one of the highest income generating groups engaged in fishing activities (Tables 23 & 24). There is a distinct difference in income between boats with and without engines, though both practice the same fishing methods. Obviously fishers without boats earn little, basically for home or subsistence consumption.
Table 23: Macro Economic Index for Fisheries Sector1996 1997 1998 1999 2000
Fisheries GDP (USD 1,000) - 165,232 189,787 211,704Fisheries GDP/Total GDP (%) - 3.0 2.9 2.9Employment (full-time fishers 75,621 - - 78,682Fisheries Exports (Million USD 61.8 70.1 72.5 61.8 75.6Fish Export/Total Exports (%) 12.3 11.4 11.4
Source: Tanzania Fisheries Master Plan 2002
Table 24: Comparison in monthly Incomes and Profits per sales among different fishing methods for Marine Fishers
Fishing method Night purse seine with engine Circle net with engine Gill net without engine
Income for crew (Tshs) 46,940 21,250 28,250Income for a boat owner (Tshs) 120,483 191,389 39,750Profit per sale (%) 5.2 18.2 18.9
Source: MNRT/JICA 2002
77
REFERENCES
REFERENCES
Agrawala S., Moehner A., Hemp A., van Aalst M., Hitz S., Smith J., Meena H., Mwakifwamba SM., Hyera T, Mwaipopo OU (2003) Development and Climate Change in Tanzania: Focus on Mount Kilimanjaro, OECD, 72p
Alexader CS (1968) The Marine terraces of the northeastern coast of Tanganyika. Zeitschrift fur Geomorphologie, Supplementband 7: 133-154
Alexander CS (1969) Beach ridges in northeastern Tanzania. Geographical Review 49: 104-123Alexander CS (1985) Tanzania. In Bird ECF and Shwartz ML (Eds) The world’s coastlines. Van Nostrand
Reinhold Company Inc., pp.691-695AllAfrica.com (2009) East Africa: United States extends friendly hand to region. [Issued 20 March 2009]Almström B., Larsson L (2008) Shoreline Change Analysis for the Kunduchi Beach Area, Tanzania. MSc
Thesis, Lund Institute of Technology, Lund University. Lund UniversityAlongi DM (1990) The ecology of tropical soft-bottom benthic ecosystems. Oceanography and Marine Biology
Annual Reviews 28: 381-496Alongi DM (1990) Community Dynamics of Free-Living Nematodes in Some Tropical Mangrove and Sand-
flat Habitats. Bulletin of Marine Science 46: 358-373Amir O, Berggren P, Jiddawi N (2002) Incidental catch of dolphins in gillnet fisheries in Zanzibar, Tanzania.
Western Indian Ocean Journal of Marine Science 1(2): 155–162Anderson B (1994) An environmental monitoring approach to sewage pollution issues along the west coast of
Zanzibar. SIT Marine Ecology Tanzania. 31pArthurton RS (2003) The fringing reef coasts of eastern Africa – present processes in their long-term context.
Western Indian Ocean Journal of Marine Science 2: 1-13Boote DRD and Matchette-Downes CJ Extinct and near extinct petroleum systems of the East African
Coastal Basins. Available at: http://www.blackmarlinenergy.com/pdfs/Extinct_and_near.pdf [Accessed 15 January 2010]
Bauer K., Dıez B., Lugomela C., Seppala S., Borg AJ., Bergman B (2008) Variability in benthic diazotrophy and cyanobacterial diversity in a tropical intertidal lagoon. FEMS Microbiol Ecology 63: 205–221
Bindoff NL., Willebrand J., Artale V., Cazenave A., Gregory J., Gulev S., Hanawa K., Le Quéré C., Levitus S., Nojiri Y., Shum CK., Talley LD., Unnikrishnan A (2007) Observations: Oceanic climate change and sea level. In: Solomon S, Qin D, Manning M, Chen Z, Marquis M, Averyt KB, Tignor M, Miller HL (eds) Climate Change 2007: The Physical Science Basis. Contribution of Working Group I to the IPCC AR4 Cambridge University Press
Birkett L (1978) Western Indian Ocean Fishery Resources Survey. Report on the cruises of R/V PROFESSOR MESYATSEV, December 1975-June 1976/July 1977, Technical Reports of the Indian Ocean Programme 21:97 p
Brakel WH (1982) Tidal patterns on the East African coast and their implications for the littoral biota. Proceedings, Symposium on the Red Sea Gulf Aden. Environ. Prog. Jeddah, Saudi Arabia 2: 403-418
Brampton A (1996) Processes of beach change. In: Mohammed SK and Betlem J (eds) Proceedings of the national workshop on coastal erosion, Zanzibar, 12 April, 1996. Zanzibar Environmental Study Series No. 20
Brownell WN (1982) Tanzania baseline study. Regional Project for the Development and Management of Fisheries in the Southwest Indian Ocean, RAF/79/065/WP/03/82:33 p
Bruckner AW (ed) (2006) The proceedings of the technical workshop on the conservation of sea cucumbers in the families Holothuridae and Stichopodidae. NOAA Technical Memorandum 44, 239 pp
Bryceson I (1981) A review of some problems of tropical marine conservation with particular reference to the Tanzania coast. Biological Conservation 20: 163-171
Bryceson I (1982) Seasonality of oceanographic conditions and phytoplankton in Dar es Salaam waters. University Science Journal 8: 66-76
Bryceson I (1982) Pollution of Dar es Salaam coastal environments by industrial and domestic effluents. In:
78
REFERENCES
Proceedings of the Workshop on the Current State and Development of Marine Sciences in Tanzania. Institute of Marine Sciences, Zanzibar. 2-8 April, pp. 32-41
Bryceson I (1983) Pollution of Dar es Salaam Coastal environments by industrial and domestic effluents. In: Status and Problems of Marine Resources Development in Tanzania. Recommendations and selected papers from the workshop on “The Current State and Development of Marine Sciences in Tanzania.” Zanzibar, 2-8 April, p. 32-41
Bryceson I, De Souza TF, Jehangeer I, Ngoile MAK, Wynter P (1990) State of the marine environment in the Eastern African region. UNEP Regional Seas Reports and Studies No. 113
Bryceson, Ian et al (2006) Coastal Fisheries of Tanzania. Burczynski J (1977) Echo survey along the East African coast from Mombasa to Laurco. Marques by R.N
Professor Mesyatsev in January/February 1976. FAO Fisheries Travel Report and aide memoire, (1162) Suppl. 1:28 p
Bwathondi POJ (1973) The biology and fishery potential of palinurid lobsters in Tanzania. M.Sc. thesis, University of Dar-es-Salaam
Bwathondi POJ (1980) The spiny lobster fishery in Tanzania. Proceedings of the Symposium on the Coastal and Marine Environment of the Red Sea, Gulf of Aden and Tropical Western Indian Ocean. Khartoum 9-14 Jan. 1980. Vol. II:281-292 p.
Bwathondi POJ and Mwaya G (1984) The fishery of crustacea and molluscs in Tanzania. The proceedings of the Norad-Tanzania Seminar to review the marine fish stocks and fisheries in Tanzania (Mbegani, Tanzania, 6-8 March 1984). Tanzania Fisheries Research Institute, Dar-es-Salaam, Norwegian Agency for International Development Bergen:19-28
Bwathondi POJ, Chande AI, Mhitu HA, Kulekana JJ, Mwakosya CA, Shayo SD and Bayona JDR (2002) Investigation on the abundance and distribution of prawns at Bagamoyo and Rufiji delta. A report submitted to the Ministry of Natural Resources and Tourism 56pp
Carlén A, Ólafsson E (2002) The effects of the gastropod Terebralia palustris on infaunal communities in a tropical tidal mud-flat in East Africa. Wetland Ecology and Management 10: 303–311
Cederlöf U., Rydberg L., Mgendi M, and Mwaipopo O (1995) Tidal exchange in a warm tropical lagoon: Chwaka bay, Zanzibar. Ambio 24: 458-464
Chande AI., Mtoka GF and Mhitu HA (1994) Marine mammals and fisheries interactions in Tanzania. UNEP.Chatterjee T, De Troch M et al. (2006) Three halacarid mites of the genus Copidognathus (Acari: Halacaridae)
from Zanzibar, Tanzania. Cahiers de Biologie Marine 47(2): 177-187Chatterjee T, Pesic V et al. (2008) A new species of the genus Arhodeoporus (Acari: Halacaridae) from Zanzibar,
Tanzania. Cahiers de Biologie Marine 49(2): 185-190Chatterjee T, Pesic V et al. (2009) A new species of the genus Atelopsalis (Acari: Halacaridae) from Zanzibar,
Tanzania. Cahiers de Biologie Marine 50(2): 193-197Church JA, White NJ (2006) A 20th century acceleration in global sea-level rise. Geophysical Research Letters 33:
L01602, doi: 10.1029/2005GL024826Clark F and Khatib AA (1993) Sea turtles in Zanzibar: Status, distribution, management options and local
perspectives. Zanzibar Environmental Study Series No. 15b: 1-84Climate and Oceanography In Richmonds MD (ed) A guide to the sea shore of eastern Africa and Western Indian
Ocean Islands, Sida, Department of Research Corporation, SAREC, pp. 8-11Cockcroft VG and Krohn R (1994) Passive gear fisheries of the southwestern Indian and southeastern Atlantic
Oceans: an assessment of their possible impact on cetaceans. Report of the International Whaling Commission. Issue 15: 317 – 328
Conand C (1990) The fishery resources of Pacific island countries. Part 2: Holothurians. FAO Fisheries Technical Paper, Rome, No. 272 (2): 143 pp
Conand C (2004a) Present status of world sea cucumber resources and utilisation: an international overview. In: Lovatelli A, Conand C, Purcell S, Uthicke S, Hamel JF, Mercier A (eds) FAO Fisheries Technical Paper 463: 13-23
Conand C (2004b) Present status of world sea cucumber resources and utilization: an international overview. In: Lovatelli A, Conand C, Purcell S, Uthicke S, Hamel JF, Mercier A (eds) Advances in sea cucumber
79
REFERENCES
aquaculture and management. FAO Fisheries Technical Paper No. 463:13-23Daily News (2006) 25 boats impounded in Tanzania for illegal fishing. Available at http://illegal-fishing.info/
item_single.php?item=news&item_id=409&approach_id=12. [accessed 19 October 2009]Daily News (2008) Dar gets tough on illegal fishing. [Issued 07 July 2008]Daily News (2008) Military vessels to be used to check illegal fishing. Available at http://dailynews.habarileo.co.tz/
sports/index.php?id=6529. [accessed 19 October 2009]Dar es Salaam City Council (2004). City Profile for Dar es Salaam, United Republic of Tanzania (unpublished
report)Darwall WRT (1996a) Marine biological and marine resource use surveys in the Songo Songo Archipelago,
Tanzania. No. 3: Simaya IslandDarwall WRT (1996b) Marine biological and marine resource use surveys in Songo Songo Archipelago,
Tanzania. Report no. 7: Current status and management recommendations. Frontier-Tanzania marine research programme. The Society for Environmental Exploration, London and the University of Dar es Salaam
Darwall WRT and Choiseul VM (1996) Marine biological and marine resource use surveys in the Songo Songo Archipelago, Tanzania. No. 4: Okuza Island
De Troch M., Gurdebeke S., Fiers F and Vincx M (2001) Zonation and structuring factors of meiofauna communities in a tropical seagrass bed (Gazi Bay Kenya). Journal of Sea Research 45: 45–61
De Troch M., Fiers F and Vincx M (2003) Niche segregation and habitat specialisation of harpacticoid copepods in a tropical seagrass bed. Marine Biology 142: 345–355
Directory of Wetlands of International Importance (2004) Rufiji, Mafia Kilwa Marine Ramsar site. Available at http://www.wetlands.org/RSIS/_COP9Directory/Directory/1TZ004.html [accessed 17 October 2010]
Dollman G (1933) Dugongs from Mafia Island and a manatee from Nigeria. Natural History Magazine No. 28, vol IV: 117-125
Douglas BC(1992) Global sea level acceleration. Journal of Geophysical Research, 97: 12699-12706.Dubi AM (2001) Frequency and long-term distribution of coastal winds of Tanzania. In Richmond MD and
Francis J (Eds) Marine science development in Tanzania and Eastern Africa, Proceedings of the 20th Anniversary Conference on Advances in marine Sciences, 28-30 June 1999, Zanzibar, Tanzania, IMS/WIOMSA. p. 131-144
Dubi AM (2002) Evaluation of water levels in relation to the design of coastal structures in Tanzania. Uhandisi Journal 25 (1): 24-36
Dubi AM (2006) Tidal power potential in the submerged channels of Dar es Salaam coastal waters. Western Indian Ocean Journal of Marine Science 5 (1): 95-104.
Duvail S and Hammerlynck O (2007) Rufiji river flood: Plague or blessing? International Journal of Biometeorology 52:32-42
El-Shehawy R., Lugomela C., Ernst A and Bergman B (2007) Diurnal expression of hetR and diazocyte development in the filamentous non-heterocystous cyanobacterium Trichodesmium erythraeum. Microbiology 149: 1139–1146
El-Sayed MKH (1989) Physical characteristics of the Eastern African Region, Geomorphology, Continental Shelf and Oceanography. Task Team Report (Eastern African Region)
FAO/IOP (1979) Report of the workshop on the fishery resources of the Western Indian Ocean South of the Equator. Mahe, Seychelles, 23 October 4 November 1978. Dev. Rep. Indian Ocean Programme, (45):102 p
FAO (1988) A Plan for the Fisheries Sector of Zanzibar. Report prepared for the Project Mission to Fisheries in Planning, Management (Legislation) and Development (FI:TCP/URT/5755(F)
Fay MB (1992) Maziwi Island off Pangani (Tanzania): History of its destruction and possible causes. UNEP Regional Seas Reports and Studies No. 139
Fenchel T (1978) The ecology of micro and meiobenthos. Annual Review of Ecology and Systematics 9: 99-121Fisheries Division (1992) Artisanal fish landings (in tonnes) by species group and region for 1992, Ministry of
Livestock Development and Fisheries.
80
REFERENCES
Francis J (1992) Physical processes in the Rufiji delta and their possible implications on the mangrove ecosystem, Hydrobiologia 247: 173-179
Francis J, Mahongo S and Semesi A (2001) Part 1: The coastal environment In: UNEP, 2001, Eastern Africa Atlas of Coastal Resources, Tanzania. UNEP: 9-47
Francis J, Mahongo S and Semesi A (2001) Eastern African Atlas of Coastal Resources, Tanzania. UNEP, 117pp.
Francis J., Mahongo S., Semesi A., Muhando C., Mgaya Y., Daffa J and Ngoile M (eds) (2001) Eastern Africa Atlas of Coastal Resources: Tanzania. UNEP, Nairobi, 111p
Francis J., Wagner GM., Mvungi A., Ngwale J and Sallema R (2001) Tanzania National Report, Phase I: Integrated Problem Analysis. GEF MSP Sub-Saharan Africa Project on “Development and Protection of the Coastal and Marine Environment in Sub-Saharan Africa. 60 pp
Francis J and Bryceson I (2001) Tanzanian coastal and marine resources: some examples illustrating questions of sustainable use. In: Ahmed J et al. (eds) Lessons learned - CaseStudies in Sustainable Use, IUCN, Gland, Switzerland. pp. 76-102
Frazier JG (1976) Sea turtles in Tanzania. Tanzania Notes and Records 77/78: 11-20Frazier J (1980) Exploitation of marine turtles in the Indian Ocean. Human Ecology 8: 329-369Garcia-Reyes M., Mayorga-Adame G., Moulton MR and Nadeau PC (2009) Modelling of the Zanzibar
Channel. Zanzibar Project Progress Report, 13pGheerardyn H., De Troch M., Ndaro SGM., Raes M, Vincx M and Vanreusel A (2008) Community structure
and microhabitat preferences of harpacticoid copepods in a tropical reef lagoon (Zanzibar Island, Tanzania). Journal of the Marine Biological Association of the United Kingdom 88(4): 747–758
Guard M (1998) Marine biological and marine resource use surveys in the Mtwara district, Tanzania. Report no. 4: Local resource use within and adjacent to Mnazi Bay. Frontier-Tanzania marine research programme. The Society for Environmental Exploration, London and the University of Dar es Salaam. 30pp
Guardian Newspaper (2008). Sensitivity Atlas for Tanzanian coast in the making as part of a national oil spill contingency plan. Available at http://kurayangu.com/ipp/guardian/2008/08/28/121445.html [accessed 16 October 2010]
Gupta RS and Desa E (2001) The Indian Ocean - A Perspective, Vol. 1Giere O (1993) Meiobenthology. The Microscopic Fauna in Aquatic Sediments. Springer-Verlag Berlin
Hafslund AS (1980) Stiegler’s Gorge Power and Flood Control Development, Project planning Report, Volume 1, Oslo, Report to RUBADA
Halsted JP and Halsted DC (1986) The cowries of Zanzibar. Tanzaia Notes and Records 88/89Hall DNF (1960) A note on the Zanzibar rock-lobster fishery. Annual Report, EAMFRO: 32-38Hamilton HGH, Brakel WH (1984) Structure and coral fauna of East African reefs. Bulletin of Marine Science
34Hamisi MI (2005) Nitrogen fixation in seagrass ecosystem along Dar es Salaam coastal waters, Tanzania.
M.Sc. Thesis, University of Dar es Salaam, 101ppHansen GJ., Turquet JP., Quod LT., Lugomela C., Kyewalyanga MS., Hurrbungs P., Wawiye P., Ogongo S.,
Tunje S and Rakotoarinjanahary H (2001) Potentially harmful microalgae of Western Indian Ocean: A Guide based on a preliminary survey. IOC-UNESCO Manuals and Guides No. 41, pp104
Hardin G (1968) The tragedy of the commons. Science 162:1243-1248Hartnoll RG (1974) The Kunduchi Marine Biology Station. Tanzania Notes and Records, 74: 39-47Harvey J (1977) Some aspects of the hydrography of the water off the coast of Tanzania: A contribution of
CINCWIO. University Science Journal 3 (1 & 2): 53-92Haule WV (1981) Some biological aspects of penaeid prawns of Kunduchi mangrove creek. M.Sc. thesis,
University of Dar-es-SalaamHaule WV (1985) Current Status of Important Crustacean Fishery in Tanzanian Coastal Waters. In: Report of
the Workshop on Crustacean Fisheries and Management, Albion, Mauritius Raf/79/065/wp/23/86
81
REFERENCES
Haule WV (1994) Fisheries and Environmental Issues. A contribution to the National Environmental Policy Workshop 21st - 25th November, Dar es Salaam, Tanzania.
Hodda M, Nicholas WL (1985) Meiofauna associated with mangroves in the Hunter River estuary and Fullerton Cove, Southeastern Australia. Australian Journal of Marine and Freshwater Research 36: 41-50
Horrill JC, Darwall WRT and Ngoile M (1996) Development of a marine protected area: Mafia Island, Tanzania. Ambio 25 (1): 50-57
Horrill JC, Kalombo H and Makoloweka S (2001) Collaborative Reef and Reef Fisheries Management in Tanga, Tanzania. Tanga Coastal Zone Conservation and Development Programme, IUCN Eastern Africa Programme, Nairobi, Kenya
Horsfall IM (1998) Sea cucumbers in Tanzania, the salad days are over. Miombo 18:4-5Howell KM (1993) A review of the conservation status of sea turtles in TanzaniaHowell KM and Mbindo C (1996) The status of sea turtle conservation in Tanzania. In: Humphrey S, Salm RV
(eds) Status of sea turtle conservation in the Western Indian Ocean. IUCN/UNEP, Nairobi, Kenya. 73-80 p
Howell KM (1998) The conservation of marine mammals and turtles in Tanzania. In: Mainoya JR (ed) Proceedings of the Workshop on Ecology and Bioproductivity of the Marine Coastal Waters of Eastern Africa. 18-20 January, 1998, Dar es Salaam, Tanzania
Humphrey SL and Salm RV (eds) (1996) Status of sea turtle conservation in the Western Indian Ocean. Regional Seas Reports and Studies. IUCN/UNEP
ISSG Invasive Species of Tanzania. Available at http://www.issg.org/database/species/ecology.as? [accessed 5 December 2009]
IUCN (The World Conservation Union) (2000) The 2000 Red List of Threatened Species. IUCN, Gland, Switzerland
IUCN (2003) Eastern African Programme 2003. The Pangani River Basin: A Situation analysis, xvi + 104 ppIversen SA, Myklevoll S, Lwiza K and Yonazi J (1984) Tanzanian Marine fish Resources as investigated by Dr.
Fridtjof Nansen Research Vessel. In: The Proceedings of the NORAD-Tanzania Seminar, 6-8 March 1984, Tanzania
Jiddawi NS, Mhando C (1989) Summary of marine resources in Zanzibar. (IMS). ESS-1. COLE, Zanzibar.Jiddawi N (1997) Reef dependent fisheries in Zanzibar. In: Johnston RW, Francis J, Muhando C (eds) Proceedings
of the national conference on coral reefs. Coral reefs: values, threats and solutions. Zanzibar Tanzania, December 1997. SIDA/SAREC, UNEP and University of Dar es Salaam, pp 12-24
Jury MR and Huang B (2004) The Rossby wave as a key mechanism of Indian Ocean climate variability. Deep Sea Research 51 (12): 2123-2136
Kairu K and Nyandwi N (2000) Guidelines for the study of shoreline change in the Western Indian Ocean Region, 55p. IOC-UNESCO.
Kajia YS (2000) Assessment of the effects of rice farming in the mangrove forests of the Rufiji delta, mainland Tanzania. MSc. Thesis in ecological marine management, Faculty of Science, Free University of Brussels
Kanagawa Prefectural Government (1969) The report of survey on the prawn fishing grounds along the coast of Tanzania, Japan:120 p
Kangwe JW (1999) The effect of land based pollution on reef building calcareous algae in the reefs near Zanzibar Town. MSc Thesis, University of Dar es Salaam. 97p
Kapilima S (1984) Stratigraphic, palaeontologic and palaeogeographic analysis of the Jurassic-Cretaceous rocks of the coastal rocks in the hinterland of Dar es Salaam and Bagamoyo. PhD Thesis, Technical University of Berlin, Berlin, 77 p.
Kaser G, Hardy DR, Mölg T, Raymond S, Bradley RSand Hyera TM (2004) Modern glacier retreat on Kilimanjaro as evidence of climate change: observations and facts, International Journal of Climatology 24: 329–339
Kent, PE, Hunt, JA and Johnstone, DW (1971) The Geology and geophysics of coastal Tanzania, Geophysical 6: 101 p., HMS Stationary Office, Inst. Geol. Sc. London.
82
REFERENCES
Khatib AA, Khiari SK and Mbindo C (1996) The status of sea turtle conservation in Zanzibar. In: Humphrey SL, Salm RV (eds) Status of sea turtle conservation in the Western Indian Ocean. Regional Seas Reports and Studies. IUCN/UNEP
Khatib AA (1998a) Sea turtles nest recording program: Unguja Island. Ambio 27: 763-764Khatib AA (1998b) The turtle nesting programme: Unguja Island report 1997-1998. 1-21 pKijazi AL, Reason CJC (2005) Relationships between intraseasonal rainfall variability of coastal Tanzania and
ENSO. Theoretical and Applied Climatology 82:153-176Kithakeni T and Ndaro SGM (2002) Some aspects of sea cucumber, Holothuria scabra ( Jaeger, 1935) along
the coast of Dar es Salaam. Western Indian Ocean Journal of Marine Science 1(2): 163-168Kondoro JWA (1997) Dispersion of heavy metals along Msimbazi River basin in Dar es Salaam, Tanzania.
Tanzania Journal of Science 23: 1-10Korrubel J and Cockcroft V (1997) Dire days for dugongs. Africa – Environment & Wildlife. Vol 5. No 1: 28-
33Kulindwa K, Mgaya YD and Sosovele H (2001) Social-Economic dimensions of biodiversity loss in Tanzania.
Causes of biodiversity loss in Southern coast of Tanzania. pg78Kyaruzi JJ, Kyewalyanga MS and Muruke MHS (2003) Cyanobacteria composition and impact of seasonality on
their in situ nitrogen fixation rate in a mangrove ecosystem adjacent to Zanzibar Town Western Indian Ocean Journal of Marine Science 2: 35-44
Kyewalyanga MS (2005) Impact of mangrove deforestation on nutrients, phytoplankton community structure and biomass. WIOMSA/MARG-I/2005-05. 21pp
Lovatelli A, Conand C, Purcell S, Uthicke S, Hamel JF and Mercier A (eds) (2004) Advances in sea cucumber aquaculture and management. FAO, Rome. Fisheries Technical Paper No. 463, 425 pp
Lugendo BR, Pronker A, Cornelissen I, de Groene A, Nagelkerken I, Dorenbosch M, van der Velde G and Mgaya YD (2005) Habitat utilisation by juveniles of commercially important fish species in a marine embayment in Zanzibar, Tanzania. Aquatic Living Resource 18: 149–158
Lugomela C, Wallberg P and Nielsen TG (2001) Plankton composition and cycling of carbon during the rainy season in a tropical coastal ecosystem, Zanzibar, Tanzania. Journal of Plankton Research 23: 1121-1136
Lugomela C and Bergman B (2002) Biological N2-fixation on mangrove pneumatophores: preliminary observations and perspectives. Ambio 31: 612-613
Lugomela C, Lyimo TJ, Bryceson I, Semesi AK and Bergman B (2002) Trichodesmium in coastal waters of Tanzania: diversity, seasonality, nitrogen and carbon fixation. Hydrobiologia 477: 1-13
Lugomela C, Söderbäck E, Björk M (2005) Photosynthesis rates in cyanobacteria-dominated sub-tidal biofilms near Zanzibar, Tanzania Estuarine. Coastal and Shelf Science 63: 439-446
Lugomela CV (2006) Autecology of the toxic dinoflagellate gambierdiscus toxicus Adachi et Fukuyo (Dinophceae) in central coastal areas of Tanzania. Western Indian Ocean Journal of Marine Sciences 5 (2): 213-221
Lugomela C (2007) Noctiluca Scintillans (Dinophyceae) in Central Coastal Waters of Tanzania: A New Phytoplankton Record for the Area. Western Indian Ocean Journal of Marine Science 6: 117 – 124
Lundgren P, Bauer K, Lugomela C, Söderbäck E, Bergman B (2003) Re-evaluation of the nitrogen fixation behavior in the marine non-heterocystous cyanobacterium lyngbya majuscule. Journal of Phycology 39: 310–314
Lwambuka L (1992) Evaluation of wind data records to predict extreme wind speeds in Tanzania. Uhandisi Journal 16 (1)
Lwiza KMM, Bigendako PR (1988) Kunduchi Tides. Tanzania Journal of Science 14: 65-76Lwiza KMM (1994) Beach erosion north of Dar es Salaam. Proceedings of the IOCUNEP-WMO-SAREC
Workshop on an integrated approach to coastal erosion, SeaLevel changes and their impacts. Intergovernmental Oceanographic Commission. Workshop report 96(1): 107-111
Lyimo TL and Lugomela C (2006) Nitrogenase activity in Intertidal Sediment Along the Tanzanan Coast, Western Indian ocean. Western Indian Ocean Journal of Marine Science 6: 133-140
Lyimo TJ (2009) Microbial and nutrient pollution in the coastal bathing waters of Dar es Salaam Aquatic

83
REFERENCES
Conservation 19 S27 – S37.Machiwa JF (1992) Anthropogenic pollution in the Dar es Salaam Harbour area, Tanzania. Marine Pollution
Bulletin 24 (11): 562-567Machiwa JF (1992a) Heavy metal content in coastal sediments off Dar es Salaam, Tanzania. Environment
International. 18: 409-415Macmillan A (2008) Secondary Atlas for Tanzania, 128 p. Macmillan Aidan.McClanahan TR (1988) Seasonality in East Africa’s coastal waters. Marine Ecology Progress Series 44: 191-
199McClanahan TR, Muthiga NA, Kamukuru AT, Machano H and Kiambo RW (1999) The effects of marine
parks and fishing on the coral reefs of northern Tanzanian. Biological Conservation 89: 161-182Mahenge J (2004) Quarterly activity report. Mnazi Bay-Ruvuma Estuary Marine ParkMahika GC (1992) By-catch reduction by rigid separator grids in penaeid shrimp trawl fisheries: The case of
Tanzania. M. Phil. Thesis, Department of Fisheries and Marine Biology, University of Bergen, Norway. 53pp
Mahongo SB (1998) Bottom reflection in a shallow tidal bay. Tanzania Journal of Science 26: 37-48Mahongo SB (1999) Turbulent Heat Energy Exchange in a Tropical Bay. Tanzania Journal of Science 28: 1-12Mahongo SB (2000) Radiative heat exchange in a tropical Chwaka bay, east coast of Zanzibar. Indian Journal
of Marine Sciences 29: 12-18Mahongo SB (2009) The changing global climate and its implication on sea level trends in Tanzania and the
western Indian Ocean. Western Indian Ocean Journal of Marine Sciences, 8(2): ): 147-159Mahongo SB, Francis J (2010) Variations of sea level at the Island of Zanzibar. Western Indian Ocean Journal of
Marine Science, 9 (1): 1-16.Makota V, Sallema R and Mahika C (2004) Monitoring shoreline change using remote sensing and GIS: A
Case Study of Kunduchi Area, Tanzania. Western Indian Ocean Journal of Marine Sciences 3(1): 1-10Mango GK (2007) The role of environmental management on disaster risk reduction in Tanzania. National Land
Use Planning Commission. Available at http://www.preventionweb.net/globalplatform/2007/first-session/docs/Workshops/4_2_3_Ecosystems_Environment/Mango.pdf [accessed 17 October 2009]
Mare MF (1942) A study of a marine benthic community with special reference to the micro-organisms. Journal of the Marine Biological Association UK 25: 517-554
Margesson R (2005) Indian Ocean Earthquake and Tsunami: Humanitarian Assistance and Relief Operations. CRS Report for Congress, Order Code RL32715, 56pp.
Marshall NT, Milledge AH, Afonso PS (2001) Trade Review: Stormy seas for marine invertebrates: trade in Sea cucumbers, seashells and lobsters in Kenya, Tanzania and Mozambique. WWF IUCN. 70pp
Masalu DCP (2002) Coastal Erosion and Its Social and Environmental Aspects in Tanzania: A Case Study in Illegal Sand Mining. Coastal Management 30: 347-359
Mashauri DA and Mayo A (1989) The Environment impact of industrial and domestic waster water in Dar es Salaam. A research paper presented at the symposium on environmental pollution and its Management in Eastern Africa, Faculty of Science, University of Dar es Salaam, Tanzania
Mburu JW, Shaghude YW, Nyandwi N, Magori C, Sanga I, Gachuiri SM, Dubi AM and Arthurton RS (2010) The role of monsoonal forcing in shoreline change: the case of Bamburi, Kenya and Kunduchi, Tanzania.
Merrifield MA, Firing YL, Aarup T, Agricole W, Brundrit G, Chang-Seng D, Farre R, Kilonsky B, Knight W, Kong L, Magori C, Manurung P, McCreery C, Mitchell W, Pillay S, Schindele F, Shillington F, Testut L, Wijeratne EMS, Caldwell P, Jardin J, Nakahara S, Porter F-Y and Turetsky N (2005) Tide gauge observations of the Indian Ocean tsunami, December 26, 2004. Geophysical Research Letters 32: L09603,doi:10.1029/2005GL022610
Mgana S and Mahongo S (1997) Land-based sources and activities affecting the quality and uses of the marine, coastal and associated freshwater environment: Tanzania Mainland. Report presented at the UNEP Regional Workshop, Institute of Marine Sciences, Zanzibar. 6-9 October, 1997. 50p
Mgaya YD (1997) Global warming: A threat to human societies and natural ecosystems. Tanzania Journal of Science 22: 65-74

84
REFERENCES
Mgaya YD, Muruke MHS and Semesi AK (1999) The sea cucumber and molluscs fishery in Bagamoyo. In: Howell KM, Semesi AK (eds) Coastal resources of Bagamoyo District, Tanzania. University of Dar es Salaam, Tanzania, 65-72pp
Mikiyasu N (2003) International Waters in Southern Africa, United Nations University Press. Available at: http://books.google.co.uk. [Accessed 15 December 2009]
Ministry of Natural Resources and Tourism (2005) Fisheries Regulations. Government Notes No. 314Mmbaga TK (2002) Some aspects of fishery, ecology and reproductive biology of Holothuria scabra ( Jaeger,
1935) along the coast of Dar es Salaam. M.Sc thesis, University of Dar es Salaam, Dar es Salaam, Tanzania. 118 pp
Mmbaga T and Mgaya Y (2004) Studies on sea cucumber in Tanzania and the gaps towards resource inventory and management. In: Lovatelli A, Conand C, Purcell S, Uthicke S, Hamel JF, Mercier A (eds) Advances in sea cucumber aquaculture and management. FAO Fisheries Technical Paper No. 463:193-203
Mmochi AJ (2005) Chemodynamics of pesticide residues and metabolites in Zanzibar Coastal Marine Environment. Submitted to the Head Chemistry Department, University of Dar es Salaam, 238 pp
Mohammed S, Ngusaru A and Mwaipopo O (1993) Determination of the effects of pollution on coral reefs around Zanzibar Town. Technical report to NEMC, Dar es Salaam
Mohammed SM (1997) Assessment of land based sources of pollution in Zanzibar. Institute of Marine Sciences, Zanzibar. 12p
Mohammed SM (2001) Water quality assessment in the coastal waters fronting the Stone Town, Zanzibar. Dorsch Consult, Zanzibar (Part 1-3)
Mohammed SM (2002) The Assessment of Water Quality and Pollution in Tanzania. Ambio Volume XXXI (7-9): 617-620.
Mohammed SM, Muhando CA and Machano H (2002) Coral reef degradation in Tanzania: Results of Monitoring 1999-2002. In: Linden O, Souter D, Wilhelmsson D, Obura D (eds.) Coral Reef Degradation in the Indian Ocean, Status Report 2002. CORDIO, Kalmar, Sweden, p 21-30
Mongi, H., Majule, A.E and, Lyimo, J.G. (2010): Vulnerability and adaptation of rain fed agriculture to climate change and variability in semi-arid Tanzania African Journal of Environmental Science and Technology Vol. 4(6), pp. 371-381
Mpanda S (1997) Geological development of the East African coastal belt of Tanzania, Stockholms contributions in Geology, 121 p. Almqvist & Wiksell International, Stockholm, Sweden.
Mruma AH (1996) Geology and tectonics of the coastal zone and major islands of Tanzania. In Betlem and Shufaa (edis) Proceedings of the National workshop on coastal erosion, 11-12 April, 1996, Zanzibar”. Zanzibar environmental study series, vol. 21: Session 1.04
Mtanga A and Machiwa J (2007) Assessment of heavy metal pollution in sediment and polychaete worms from the Mzinga Creek and Ras Dege Mangrove Ecosystems, Dar es Salaam, Tanzania. Western Indian Ocean Journal Marine Science 6: 125–135
Muhando CA (2001) Seawater temperature on shallow reefs off Zanzibar Town, Tanzania. A report to CORDIO, 7p
Muhando CA, (2003) Trends in reef benthos after the 1998 coral-bleaching event in Mafia island marine park Tanzania. IMS-UDSM report series, Zanzibar
Muir CE (2003) An Assessment of the status of turtles, dugongs and cetaceans in Mnazi Bay – Ruvuma Estuary Marine Park & recommendations for a conservation strategy. Report to IUCN/MBREMP Project
Muir CE, Sallema A, Abdallah O, De Luca D and Davenport TRB (2003) The dugong (Dugong dogon) in Tanzania: a national assessment of status, distribution and threat. WCS/WWF. 24 pp
Muir CE (2004a) Community-based marine turtle conservation in Tanzania. 5-6 pMuir CE (2004b) Mafia turtle and dugong conservation programme: Tanzania. Results FY04 (01 July 2003 -
30 June 2004). 1 ppMuir CE (2004c) Tanzania Turtle and Dugong Conservation and Research Programme – quarterly progress
85
REFERENCES
report. Submitted to Commission for Science and Technology, Dar es SalaamMuir CE (2005) The status of marine turtles in the United Republic of Tanzania, East Africa. Sea Sense
Report (Tanzania Turtle and Dugong Conservation Programme)Muir CE (2007a) Sea Sense Technical Report, June 2007, 1-9 pMuir CE (2007b) Community-based endangered marine species conservation: TanzaniaMunisi JJ (1999) A comparative study of polluted and unpolluted intertidal floral communities near Tanga
Town. A report submitted for the fulfilment of the forth term programme at the University of Dar es Salaam. Department of Zoology and Marine Biology. 17pp
Munro JL, Williams DMcB (1985) Assessment and management of coral reef fisheries: biological, environmental and socio-economic aspects. Proceedings of the Fifth International Coral Reef Congress (Tahiti) 4:545-578
Mushi V and Kalikela G (2002) The Status of the Prawn Industry in Tanzania. Paper presented at the 1st workshop of the Capacity Building in Planning and Co-Management of the Tanzania Prawn Fishery Project. FAO TCP/URT/0168 (A)
Muzuka ANN, Nyandwi N and Shaghude YW (2003) Preliminary investigation on the Pleistocene/Holocene sea-level changes along the coastline of Tanzania, with reference to Unguja and Pemba Islands. UDSM/Sida-SAREC Bilateral Programme report
Muzuka ANN, Nyandwi N and Shaghude YW (2004) Preliminary investigation on the Pleistocene/Holocene sea level changes along the coastline of Tanzania, with reference to Unguja and Pemba islands. Bulletin of the Directorate of Geology, Mozambique (Boletim Direcção Nacional de Geologico, Moćambique) 43: 8-13.
Muzuka ANN (2007) Distribution of Heavy Metals in the Coastal Marine Surficial Sediments in the Msasani Bay-Dar es Salaam Harbour Area Western Indian Ocean. Journal of Marine Science 6: 73–83
Mwakosya CG (2004) Assessment of Tanzanian prawn fishery resources. M. Phil. Thesis, Department of Biology, University of Bergen, Norway. 83pp
Mwandosya MJ, Nyenzi BS and Luhanga ML (1998) The Assessment of Vulnerability and Adaptation to Climate Change Impacts. Centre for Energy, Environment, Science and Technology. Dar es Salaam, 235 p
Mwandya AW (1996) Variability and morphometric relationships of lead and cadmium in Saccostrea cuccullata and Pinctada marginitifera along the Dar es Salaam coast. Third Year Student Project. Department of Zoology and Marine Biology, University of Dar es Salaam. 31p
Mwevura H, Othman OC and Mhehe GL (2002) Organochlorine pesticide residues in sediments and biota from the coastal area of Dar es Salaam city, Tanzania. Marine pollution bulletin 45: 262-7.
Nakicenovic N, Swart R (eds.) IPCC (2000) Emissions Scenarios. Special Report of the Intergovernmental Panel on Climate Change, Cambridge University Press
Ndaro SGM, Sjöling S and Ólafsson E (1995) Small-scale variation in major meiofaunal taxa and sediment chemistry in Tropical sediments. Ambio 24(7/8): 470-474
Ndaro S, Ólafsson E (1999) Soft-bottom fauna with emphasis on nematode assemblage structure in a tropical lagoon in Zanzibar eastern Africa: I. spatial variability. Hydrobiologia 405: 133–148
NEMC (2009) State of the Coast Report: People and The Environment. National Environmental Management council
NEMC (2010) ICM Action Plan Monitoring Report. Unpublished.Newell BS (1957) A preliminary survey of the hydrography of the British East African Coastal Waters. Fishery
Publications Colonial Office, No. 9, 21 ppNewell BS (1959) The hydrography of British East African coastal waters. Fishery Publications Colonial
Office, No.12, 18ppNgusaru A, Tobey J and Luhikula G (2001) Tanzania State of the Coast 2001: People and the Environment.
Tanzania Coastal Management Partnership, Dar es Salaam, pp. 53Ngusaru A (2002) Climate and Oceanography. In: Richmond MD (ed) A field guide to the seashores of East
Africa and the western Indian Ocean Islands, SIDA/SAREC – UDSM, pp. 12-21Nhwani LB, Mwaiko SP, Chande AI, Mwamsojo GU and Mhitu, HA (1993) Crustacean Resource Assessment

86
REFERENCES
in Rufiji and by-catch studies from prawn trawlers. A report submitted to National Environment Council (NEMC), Dar es Salaam. 34pp
Nicholas WL, Elek JA, Stewart AC and Marples TG (1991) The nematode fauna of a temperate Australian mangrove mudflat; its population density, diversity and distribution. Hydrobiologia 209: 13-27
Ngoile MAK (1982) A survey of fishing units in Zanzibar and Pemba. Tanzania Notes and RecordsNkondokaya SRK (1992) By-catch in Tanzanian shallow-water shrimp fisheries with special emphasis on fin
fish. M. Phil. Thesis. Department of Fisheries and Marine Biology, University of Bergen, Norway. 43ppNyandwi N, Shaghude YW, Arthurton RS, Mburu JW, Sanga I, Mwaipopo R, Dubi AM and Magori C (2010)
Disruption of longshore beach sand drift by tidal currents: the case of Manyema Creek, Tanzania.Nyandwi (1999) Reassessment of the nature of beach erosion north of Dar es Salaam, Tanzania. In: Richmond
MD and Francis J (eds) Marine Science Development in Tanzania and Eastern Africa. Proceedings of the 20th Anniversary Conference and Advances in Marine Science in Tanzania. 28 June – 1 July, 1999
Nyenzi BS, Kavishe MM, Nassib IR and Tilya FF (1999) Analysis of the meteorological draughts in Tanzania. Proceedings of the Interdisciplinary International conference on integrated draught management, 20-22 September 1999, Pretoria, South Africa.
Obura D (2004) Biodiversity surveys of the coral reefs of the Mnazi Bay Ruvuma Estuary Marine Park, Tanzania: IUCN, Nairobi.
Odido M and Francis J (1999) Sea Level Measurement and Analysis in the Western Indian Ocean. Regional Report prepared for the Intergovernmental Oceanographic Commission of UNESCO. 59pp
Ólafsson E (1995) Meiobenthos in mangrove areas in eastern Africa with emphasis on assemblage structure of free-living marine nematodes. Hydrobiologia 312: 47-57
Ólafsson E, Johnstone RW andNdaro SGM (1995) Effects of intensive seaweed farming on the meiobenthos in a tropical lagoon. Journal of Experimental Marine Biology and Ecology 191: 101–117
Ólafsson E, Carlström S and Ndaro SGM (2000) Meiobenthos of hypersaline tropical mangrove sediment in relation to spring tide inundation. Hydrobiologia 426: 57–64
Okera W (1974) The zooplankton of the inshore waters of Dar es Salaam (Tanzania, S. E. Africa) with observations on reactions to artificial light. Marine Biology 26: 13-25. DOI (10.1007/BF00389082)
OPPT (2011) Ocean Primary Productivity Team’s homepage, Available at: http://marine.rutgers.edu/opp/swf/Production/results/all2_swf.html, Accessed through IMCS on March 22, 2011.
Oresland V (2000) Die1 feeding of the chaetognath Sagitta enflata in the Zanzibar Channel, Western Indian Ocean. Marine Ecology Progress Series 193: 117-123
Paavola J (2003) Vulnerability to Climate Change in Tanzania: Sources, Substance and Solutions. Paper presented at the inaugural workshop of Southern Africa Vulnerability Initiative (SAVI) in Maputo, Mozambique
Pharaoh AM, Fanning E and Said A (2003) Observations of sea turtles nesting on Misali Island, Pemba. Journal of East African Natural History 92: 127-134
Pond S and Pickard GL (1983) Introductory Dynamical Oceanography, Pergamon Press. Second edition, 329pp.
Porth JS (2009) United States extends friendly hand to East Africa, Available at: http://www.africom.mil/getArticle.asp?art=2837&lang=0, Accessed 20th March 2011.
Pratap HB (1988) Impact of heavy metal pollution on the bioproductivity of marine coastal waters. In: Mainoya JR (ed) Proceedings of the Workshop on Ecology and Bioprodctivity of the Marine Coastal Waters of Eastern Africa, 18-20 January 1988. Dar es Salaam. Tanzania.
ProMED-mail, the Program for Monitoring Emerging Diseases (1996). Accessed through http://www.promedmail.org/pls/otn/f/f?p=2400:1001:3335506298735390::::F2400_P1001_BACK_PAGE,F2400_P1001_ARCHIVE_NUMBER,F2400_P1001_USE_ARCHIVE:1001,19960331.0595,Y, March 22, 2011.
Pugh, DT (2004) Changing Sea Levels: Effects of Tides, Weather, and Climate. Cambridge University Press., 265pp.
Raes M, De Troch M, Ndaro SGM, Muthumbi A, Guilini K and Vanreusel A (2007) The structuring role
87
REFERENCES
of microhabitat type in coral degradation zones: a case study with marine nematodes from Kenya and Zanzibar. Coral Reefs 26: 113–126
Ray C (1968) Marine Parks for Tanzania, results of a survey of the coast of Tanzania. The Conservation Foundation, New York Zoological Society
Revolution Government of Zanzibar (2009) The Status of Zanzibar Coastal Resources: Towards the Development of Integrated Coastal Management Strategies and Action Plan. Prepared by the Department of Environment through support from Marine and Coastal Environmental Project (MACEMP)
Robertson AL, Rundle SD and Schmid-Araya JM (2000) An introduction to a special issue on lotic meiofauna. Freshwater Ecology, 44: 1-3.
Rowe FEW and Richmond MD (2002) Echinodermata. In: Richmond MD (ed) A guide to the seashores of Eastern Africa and the Western Indian Ocean Islands. Second edition, SIDA/SAREC. Sweden, 300-331pp
Rweyemamu M (2003) New Strategy Targets Tanzania’s Coastal Problems. Available at http://www.ens-newswire.com/ens/apr2003/2003-04-25-02.asp. [accessed 17 October 2010]
Saada K. J (2005) Environmental and Social Situational Analysis In support of the Environmental and Social Impact Assessment of the MACEMP. Tanzania Marine and Coastal Environment Management Project
Saji NH., Goswami BN, Vinayachandran PN and Yamagata T (1999) A dipole in the tropical Indian Ocean. Nature 401: 360-363
Sallema N (2003) Survey of marine turtles and dugongs in Tanzania. Report to TCMP, 21 ppSallema RE and Mtui GYS (2008) Adaptation technologies and legal instruments to address climate change
impacts to coastal and marine resources in Tanzania. African Journal of Environmental Science and Technology 2(9): 239-248
Salm R (1983) Coral reefs of the western Indian Ocean: a threatened heritage. Ambio 12(6) Sanders MJ (1989) Preliminary assessment for the shallow water shrimp trawl fishery of Tanzania based on
catch and effort data for 1988. RAF/87/008/WP/46/89/E. 23ppSchiller EJ, Bryceson I (1978) Beach erosion in the Dar es Salaam area. University Science Journal 4(1&2):
101-120Sekilasa, I. (2009). Tanzania unveils plan to tackle oil spills. The Citizen Newspaper.Semesi AK and Mzava EM (1991) Management plans for mangrove ecosystem of mainland Tanzania. Vol
1-10. Ministry of Tourism Natural Resources and Environment, Forestry and beekeeping Division, Mangrove Management Project, Dar es Salaam, Tanzania
Semesi AK (1991) Management plan for the mangrove Eco-system of mainland, Vol. 11: Mangrove Management Plan of all Coastal Districts, Ministry of Tourism, Natural Resources and Environment, Forest and Bee-keeping Division, Dar es Salaam
Semesi AK, Mgaya Y, Muruke MHS, Francis J, Mtolera M and Msumi G (1998) Coastal resources utilisation issues in Bagamoyo, Tanzania. Ambio 27: 635-644
Shaghude YW, Mutakyahwa MKD and Mohamed SK (1994) National Report on the Status of Coastal Erosion, Sea Level Changes and their Impacts, Tanzanian case. IOC-UNEP-WMO-SAREC Planning Workshop on an Integrated Approach to Coastal Erosion, Sea Level Changes and Their Impacts, Zanzibar, IOC Workshop Report No. 96, Supplement 1 pp. 85-106
Shaghude YW and Wannas KO (1998) The morphology and sediment Distribution of the Zanzibar channel. Ambio 27: 729-733
Shaghude YW (2001) Shallow water carbonate basin of the Zanzibar Channel, Tanzania. PhD Thesis, Department of Geology and Geochemistry, Stockholm University, Sweden. Sandlund & Co Grafisca, Stockholm.
Shaghude YW (2003) Sediment distribution and composition on the shallow water carbonate basin of the Zanzibar channel. Tanzania Journal of Science 29: 37-44
Shaghude YW (2003) Sediment distribution and composition on the shallow water carbonate basin of the Zanzibar channel. Tanzania Journal of Science 29: 37-44
Shaghude YW (2004a) Shore morphology and sediment characteristics, south of Pangani river, coastal Tanzania.
88
REFERENCES
Western Indian Ocean Journal of Marine Sciences 3: 93-104Shaghude YW 2004b The study of sediment characteristics and nearshore sediment dynamics in coastal Tanzania, 38p.
MARG-I Final Research Report (IMS Research Report No: IMS/2004/04). Available at: http://iodeweb1.vliz.be/odin/bitstream/1834/177/1/Final+report_MARG_dec.pdf [Accessed 15 January 2010]
Shaghude YW (2006) Review of water resource exploitation and landuse pressure in the Pangani river basin. Western Indian Ocean, Journal of Marine Science 5: 195-207
Shaghude YW, Nyandwi N, Muzuka ANN, Dubi AM and Mwaipopo OU (2006) Sediment characteristics and hydrodynamic settings of the reef platform sediments of Kunduchi, north of Dar es Salaam harbour. Tanzania Journal of Science 32: 36-52
Shaghude YW (2010) Anthropogenic constraints on water resource availability and management: The case of Rufiji and Pangani River Basins. Submitted (November 2008) for publications as the conference Proceedings of the Presented papers during the International Year of Planet Earth, Ngurdoto, Arusha
Shaghude YW, Mburu JW, Nyandwi N, Magori C, Ochiewo J, Sanga I and Arthurton R (2010) The`role of sand supply on shoreline changes: the case of Bamburi, Kenya and Kunduchi, Tanzania. Submitted to the Western Indian Ocean Journal of Marine Sciences.
Shilungushela JMS (1993) Inventory of destructive activities to the freshwater bodies and the marine environment along the Tanga region coastal area. Report commissioned by National Environment Management Council (NEMC), Dar es Salaam, 57p
Shunula JP and Whittick A (1996) The Mangroves of Zanzibar. Institute of Marine Sciences, University of Dar es Salaam.pp i-iv, 1-65
Slade L (2000) Sea turtle recovery action plan for Zanzibar. 1-91 pSlade L, Khatib AA, Yussuf MH (1997) Sea turtles in Zanzibar: Pemba sea turtle conservation education and
community nest recording programme - November 1995 - March 1997. Department of Environment, Zanzibar
Swallow JC, Schott F and Fieux M (1991) Structure and transport of the East African Coastal Current. Journal of Geophyscial Research 96: 22254–22267
Tafe DJ (1990) Zooplankton and salinity in the Rufiji River delta, Tanzania. Hydrobiologia 208: 123-130. (DOI10.1007/BF00008451)
Talbot FH (1964) A description of the coral structure of Tutia Reef (Tanganyika Territory) and its fish fauna. Proceedings of the Zoological Society London, 145: 431-470
TANROADS (2008) Tanzania Road Agency Annual ReportTanzania Commission for AIDS (2005) Tanzania HIV/AIDS Indicator Survey 2003–04, Dar es SalaamTanzania Standards Newspapers (2006) 25 boats impounded for illegal fishing. Available at http://www.illegal-
fishing.info/item_single.php?item=news&item_id=399&approach_id=17. [accessed 19 October 2009]Tarbit J (1984) Inshore fisheries of the Tanzania Coast. Proceedings of the NORAD-Tanzania seminar to Review
the Marine Fish stocks in Tanzania, Mbegani 6-8 March: 29-44TCMP (1999) Tanzania ICM country profileTCMP (2001) Tanzania state of the coast, people and the Environment. TCMP Science & Technical Working
Group, Dar es Salaam, TanzaniaTCMP (2001b). Tanzania Mariculture Guidelines Source Book. Working Document No. 5048, TCMP, Dar
es salaam, Tanzania.TDHS (2005) Tanzania Demographic and Health Survey DataTeikwa ED and Mgaya YD (2003) Abundance and Reproductive Biology of the Penaeid Prawns of Bagamoyo
Coastal Waters, Tanzania. Western Indian Ocean Journal of Marine Science 2(2): 117-126Temeke Municipal (2009) Taarifa ya Hali ya Jamii na KiuchumiThe Citizen (2009) Country unveils plan to tackle oil spills. Available at http://allafrica.com/stories/200909250682.
html. [accessed 16 October 2010]The independent (1996), Poisoned turtle kills 21 in Zanzibar, The Independent (London, England) March 21,
1996.The Revolutionary Government of Zanzibar (2009) The Status of Zanzibar Coastal Resources
89
REFERENCES
Thiagarajan T (1991) Status of sea turtles in Zanzibar. 1-12 pThis Day (2009) Government declares war on pirate trawlers. [Issued 04 July 2009]This Day (2009) Tanzania, SADC join forces against illegal fishing. [Issued 18 March 2009]Torella E, Tobeya J, Thaxton M, Crawford B, Kalanghe B, Madulu N, Issa A, Makota V and Sallema R (2004)
Examining the linkages between AIDS and biodiversity conservation in coastal TanzaniaTPDC (2004) Hydrocarbon exploration activities in Tanzania. TPDC website. Available at http://www.tpdc-
tz.com. [Accessed 15 January 2010]Turpie J (2000) The Use and Value of Natural Resources of the Rufiji Floodplain and Delta, Rufiji District.
Tanzania REMP Technical Report No. 17UNEP (2001) Eastern Africa Atlas of Coastal Resources: Tanzania. Nairobi, Kenya. Wamukoya GM, Ottichilo
WK, Salm RV (1997) Aerial Survey of dugongs (dugong dugon) in Ungwana Bay and the Lamu Archipelago, Kenya. Kenya Wildlife Service. 13pp.
UNEP-GPA (2004) Overview of Shoreline Changes in the Western Indian Ocean Region. Regional Report, Global Programme of Action, UNEP. Available at: http://www.gpa.unep.org/documents/shoreline_change_in_the_english.pdf [Accessed 15 January 2010]
United Nations (2002); Johannesburg Summit 2002: United Republic of Tanzania Country profile. Available at http://news.bbc.co.uk/2/hi/africa/country_profiles/1072330.stm [Accessed April 25, 2011]
United Nations (2009) One UN Joint Programme Available at http://www.tz.undp.org/un_proj_un_disaster.html, [accessed 17 October 2009].
United States Mapping Agency (2003) Earth Trends. Available at http://earthtrends.wri.org/pdf_library/country_profiles/coa_cou_834.pdf [accessed 17 October 2009]
United Republic of Tanzania (1967) Bureau of Statistics, Population and Demographic Survey. United Republic of Tanzania (1978), Bureau of Statistics Population and Demographic Survey.United Republic of Tanzania (1988) Bureau of Statistics, Population and Demographic Survey.United Republic of Tanzania (2002) Population and housing census, General report, central Census office
national Bureau of statistics president office planning and privatization, Dar es Salaam.United Republic of Tanzania (2005a), President’s Office, Planning and Privatization, Economic Survey.United Republic of Tanzania (2005b): National Bureau of Statistics, Reports from respective population
Censuses.United Republic of Tanzania (2006a), National Bureau of Statistics Census Reports.United Republic of Tanzania (2006b) National Bureau of Statistics, Tanzania Main Statistical TablesUnited Republic of Tanzania (2007a) Poverty and Human Development ReportUnited Republic of Tanzania (2007b) National Bureau of statistics, National Household Budget Survey
ReportURT (2002). Vulnerability Assessment Report. Prime Minister’s Office, Dar es salaam, Tanzania.URT (2003). Vulnerability Assessment Report. Prime Minister’s Office, Dar es salaam, Tanzania.URT (2006) Tanzania Country Profile. Available at http://www.sfp-acp.eu/EN/Pays/Africa/Tanzania/
TanzaniaCountryProfile.pdf. [accessed 15 October 2010]URT (2009), Interim national progress report on the implementation of the Hyogo Framework for Action,
Prime Minister’s Office, Dar es salaam, Tanzania.URT (2005) Poverty and Human Developmen Report (PHDR) United Republic of Tanzania (2009) Poverty and Human Development Report (WHO IS THE
AUTHOR??).Uronu WEM (1995) Sewerage Issues in the Dar es Salaam area. In: Proceedings of the National Workshop
on Integrated Coastal Zone Management in Tanzania. May 8-12. The World Bank Land, Water, and Natural Habitats Division Environmental Department.
Vanhove S, Vincx M, Van Gansbeke D, Gijselinck W and Schram D (1992) The meiobenthos of five mangrove vegetation types in Gazi Bay Kenya. Hydrobiologia 247: 99–108
Venema SC (1984) Resource surveys other than those by Dr. Fridtjof Nansen. The proceedings of the Norad-
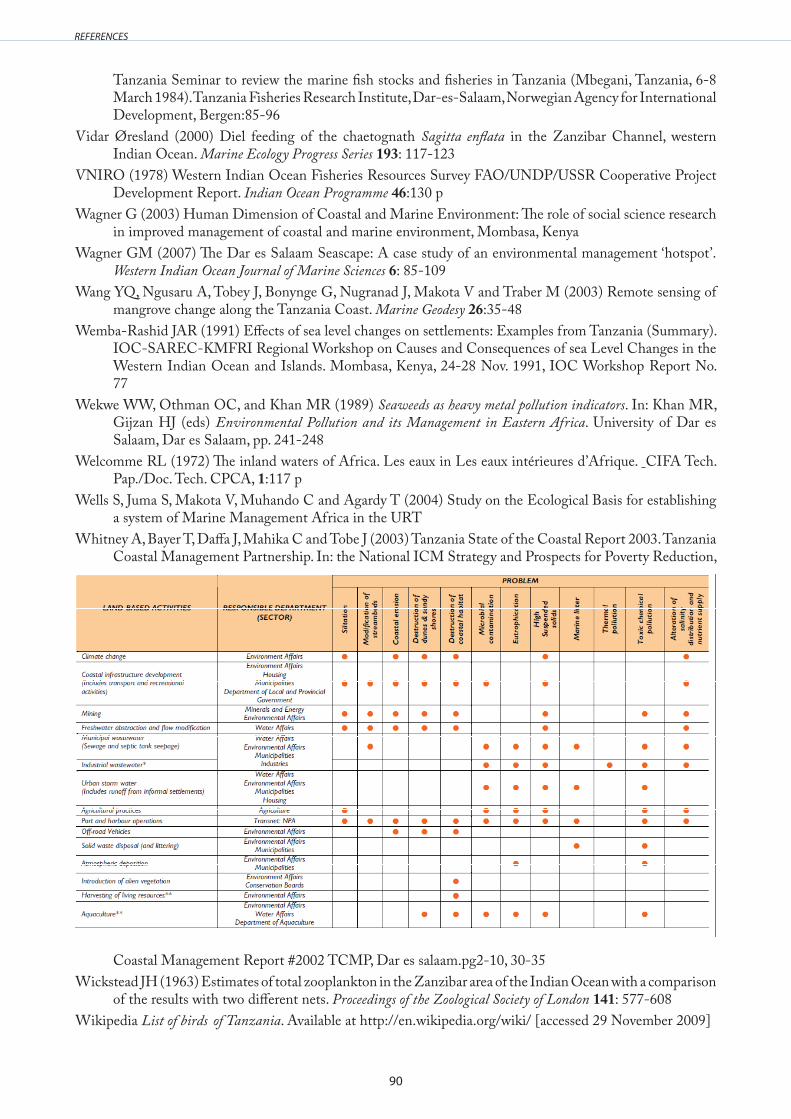
90
REFERENCES
Tanzania Seminar to review the marine fish stocks and fisheries in Tanzania (Mbegani, Tanzania, 6-8 March 1984). Tanzania Fisheries Research Institute, Dar-es-Salaam, Norwegian Agency for International Development, Bergen:85-96
Vidar Øresland (2000) Diel feeding of the chaetognath Sagitta enflata in the Zanzibar Channel, western Indian Ocean. Marine Ecology Progress Series 193: 117-123
VNIRO (1978) Western Indian Ocean Fisheries Resources Survey FAO/UNDP/USSR Cooperative Project Development Report. Indian Ocean Programme 46:130 p
Wagner G (2003) Human Dimension of Coastal and Marine Environment: The role of social science research in improved management of coastal and marine environment, Mombasa, Kenya
Wagner GM (2007) The Dar es Salaam Seascape: A case study of an environmental management ‘hotspot’.Western Indian Ocean Journal of Marine Sciences 6: 85-109
Wang YQ, Ngusaru A, Tobey J, Bonynge G, Nugranad J, Makota V and Traber M (2003) Remote sensing of mangrove change along the Tanzania Coast. Marine Geodesy 26:35-48
Wemba-Rashid JAR (1991) Effects of sea level changes on settlements: Examples from Tanzania (Summary). IOC-SAREC-KMFRI Regional Workshop on Causes and Consequences of sea Level Changes in the Western Indian Ocean and Islands. Mombasa, Kenya, 24-28 Nov. 1991, IOC Workshop Report No. 77
Wekwe WW, Othman OC, and Khan MR (1989) Seaweeds as heavy metal pollution indicators. In: Khan MR, Gijzan HJ (eds) Environmental Pollution and its Management in Eastern Africa. University of Dar es Salaam, Dar es Salaam, pp. 241-248
Welcomme RL (1972) The inland waters of Africa. Les eaux in Les eaux intérieures d’Afrique. CIFA Tech. Pap./Doc. Tech. CPCA, 1:117 p
Wells S, Juma S, Makota V, Muhando C and Agardy T (2004) Study on the Ecological Basis for establishing a system of Marine Management Africa in the URT
Whitney A, Bayer T, Daffa J, Mahika C and Tobe J (2003) Tanzania State of the Coastal Report 2003. Tanzania Coastal Management Partnership. In: the National ICM Strategy and Prospects for Poverty Reduction,
Coastal Management Report #2002 TCMP, Dar es salaam.pg2-10, 30-35Wickstead JH (1963) Estimates of total zooplankton in the Zanzibar area of the Indian Ocean with a comparison
of the results with two different nets. Proceedings of the Zoological Society of London 141: 577-608Wikipedia List of birds of Tanzania. Available at http://en.wikipedia.org/wiki/ [accessed 29 November 2009]

91
REFERENCES
Windley BF (1986) The evolving continents, Bath Press, Avon, Britain pp. 133-146Wisegeek (2011) Wisegeek home page, Available at : http://www.wisegeek.com/what-are-microfauna.htm, Accessed March 2011.
Wolanski E (1989) Measurement and modelling of the water circulation in mangrove swamps. COMARAF Regional Project for Research and Training on Coastal Marine Systems in Africa – RAF/87/038. UNESCO, Series No. 3, 43p
Wytirki K (1971) Oceanographic Atlas of the International Indian Ocean Expedition, National Science Foundation, Washington D.C., 531p
Yanda PZ and Munishi PKT (2007) Hydrologic and land use/cover changes analysis for Ruvu River (Uluguru) and Sigi (East Usambara) watersheds. For WWF/CARE Dar es Salaam, Tanzania

92
Table of Contents

93
Table of Contents

94
Table of Contents

95
Table of Contents

96
Table of Contents

97
Table of Contents

98
Table of Contents

99
Table of Contents

100
Table of Contents

101
Table of Contents

102
Table of Contents

103
Table of Contents

104
Table of Contents

105
Table of Contents

106
Table of Contents

107
Table of Contents

108
Table of Contents

109
Table of Contents

110
Table of Contents

111
Table of Contents

112
Table of Contents

113
Table of Contents

114
Table of Contents

115
Table of Contents

116
Table of Contents

117
Table of Contents

118
Table of Contents

119
Table of Contents

120
Table of Contents

121
Table of Contents