target : inr 232 key data tilaknagar industries...
TRANSCRIPT
Tilaknagar Industries Ltd.
Shareholding % 2Q 3Q 4Q
Promoters 74.0 74.0 61.0
MF/Banks/Indian FIs 6.0 7.0 2.0
FII/ NRIs/ OCBs 0.0 0.0 8.0
Indian Public 20.0 19.0 29.0
KEY DATA
Market Cap (INR bn) 5.2
Market Cap (USD mn) 115.8
52 WK High / Low 177/24
Avg Daily Volume (BSE) 128008
Face Value (INR) 10
BSE Sensex 17639
Nifty 5274
BSE Code 507205
NSE Code NA
Reuters Code TILK.BO
Bloomberg Code TLNGR IN
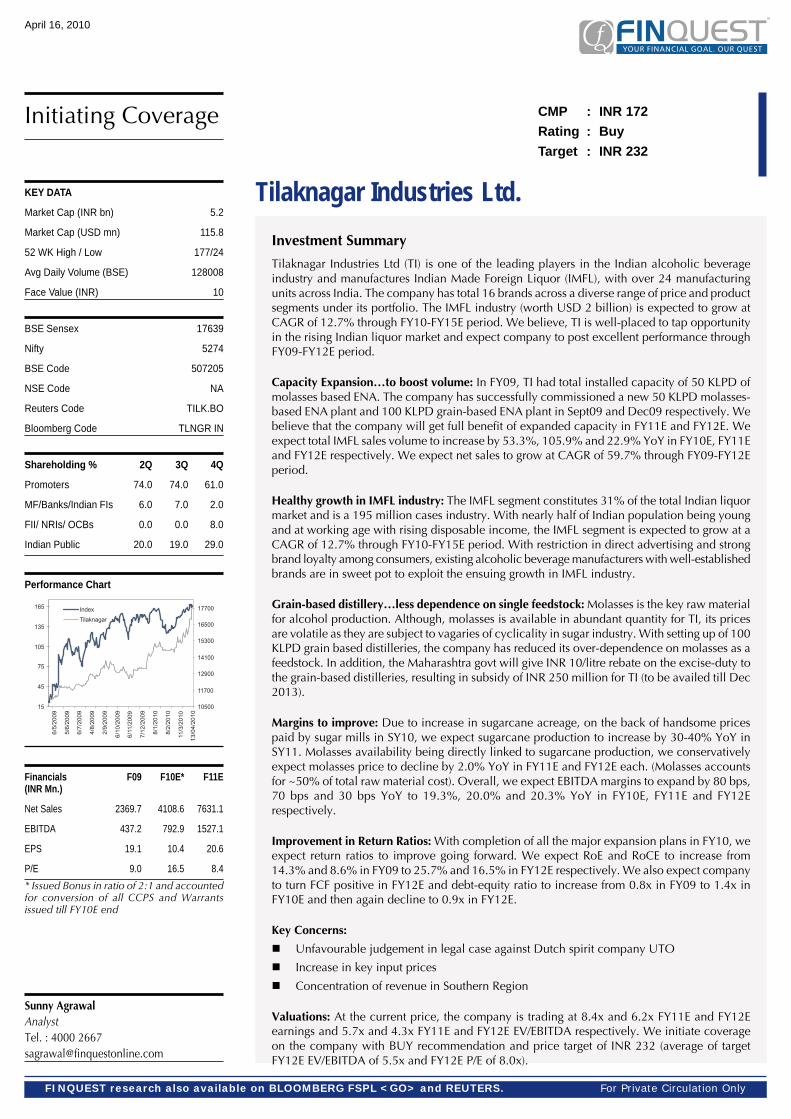
Performance Chart
CMP : INR 172Rating : BuyTarget : INR 232
Initiating Coverage
Investment Summary
Tilaknagar Industries Ltd (TI) is one of the leading players in the Indian alcoholic beverageindustry and manufactures Indian Made Foreign Liquor (IMFL), with over 24 manufacturingunits across India. The company has total 16 brands across a diverse range of price and productsegments under its portfolio. The IMFL industry (worth USD 2 billion) is expected to grow atCAGR of 12.7% through FY10-FY15E period. We believe, TI is well-placed to tap opportunityin the rising Indian liquor market and expect company to post excellent performance throughFY09-FY12E period.
Capacity Expansion…to boost volume: In FY09, TI had total installed capacity of 50 KLPD ofmolasses based ENA. The company has successfully commissioned a new 50 KLPD molasses-based ENA plant and 100 KLPD grain-based ENA plant in Sept09 and Dec09 respectively. Webelieve that the company will get full benefit of expanded capacity in FY11E and FY12E. Weexpect total IMFL sales volume to increase by 53.3%, 105.9% and 22.9% YoY in FY10E, FY11Eand FY12E respectively. We expect net sales to grow at CAGR of 59.7% through FY09-FY12Eperiod.
Healthy growth in IMFL industry: The IMFL segment constitutes 31% of the total Indian liquormarket and is a 195 million cases industry. With nearly half of Indian population being youngand at working age with rising disposable income, the IMFL segment is expected to grow at aCAGR of 12.7% through FY10-FY15E period. With restriction in direct advertising and strongbrand loyalty among consumers, existing alcoholic beverage manufacturers with well-establishedbrands are in sweet pot to exploit the ensuing growth in IMFL industry.
Grain-based distillery…less dependence on single feedstock: Molasses is the key raw materialfor alcohol production. Although, molasses is available in abundant quantity for TI, its pricesare volatile as they are subject to vagaries of cyclicality in sugar industry. With setting up of 100KLPD grain based distilleries, the company has reduced its over-dependence on molasses as afeedstock. In addition, the Maharashtra govt will give INR 10/litre rebate on the excise-duty tothe grain-based distilleries, resulting in subsidy of INR 250 million for TI (to be availed till Dec2013).
Margins to improve: Due to increase in sugarcane acreage, on the back of handsome pricespaid by sugar mills in SY10, we expect sugarcane production to increase by 30-40% YoY inSY11. Molasses availability being directly linked to sugarcane production, we conservativelyexpect molasses price to decline by 2.0% YoY in FY11E and FY12E each. (Molasses accountsfor ~50% of total raw material cost). Overall, we expect EBITDA margins to expand by 80 bps,70 bps and 30 bps YoY to 19.3%, 20.0% and 20.3% YoY in FY10E, FY11E and FY12Erespectively.
Improvement in Return Ratios: With completion of all the major expansion plans in FY10, weexpect return ratios to improve going forward. We expect RoE and RoCE to increase from14.3% and 8.6% in FY09 to 25.7% and 16.5% in FY12E respectively. We also expect companyto turn FCF positive in FY12E and debt-equity ratio to increase from 0.8x in FY09 to 1.4x inFY10E and then again decline to 0.9x in FY12E.
Key Concerns:
Unfavourable judgement in legal case against Dutch spirit company UTO
Increase in key input prices
Concentration of revenue in Southern Region
Valuations: At the current price, the company is trading at 8.4x and 6.2x FY11E and FY12Eearnings and 5.7x and 4.3x FY11E and FY12E EV/EBITDA respectively. We initiate coverageon the company with BUY recommendation and price target of INR 232 (average of targetFY12E EV/EBITDA of 5.5x and FY12E P/E of 8.0x).
Sunny AgrawalAnalystTel. : 4000 [email protected]
April 16, 2010
For Private Circulation OnlyFINQUEST research also available on BLOOMBERG FSPL <GO> and REUTERS.
Financials F09 F10E* F11E(INR Mn.)
Net Sales 2369.7 4108.6 7631.1
EBITDA 437.2 792.9 1527.1
EPS 19.1 10.4 20.6
P/E 9.0 16.5 8.4* Issued Bonus in ratio of 2:1 and accountedfor conversion of all CCPS and Warrantsissued till FY10E end

For Private Circulation OnlyApril 16, 2010 2
Particulars ( INR million ) F09 F10E* F11E F12E
Valuation RatiosP/E 9.0 16.5 8.4 6.2EV/EBITDA 5.0 10.3 5.7 4.3P/BV 1.3 2.6 2.1 1.6Dividend Yield (%) 1.5 1.5 1.5 1.5
Per Share Data (INR)EPS 19.1 10.4 20.6 27.7Cash EPS 21.7 12.9 26.9 35.1BVPS 133.7 65.4 83.1 107.9DPS 2.5 2.5 2.5 2.5
P&L (INR mn)Net Sales 2369.7 4108.6 7631.1 9658.3Operating Expenses 1932.4 3315.7 6104.1 7697.8EBITDA 437.2 792.9 1527.1 1960.5PBIT 434.7 738.9 1354.3 1745.4Interest Expense 105.6 217.6 325.0 357.5PBT 329.0 521.3 1029.3 1387.9Tax 116.5 184.5 364.4 491.3PAT 212.5 336.8 664.9 896.6Extra Ordinary items 0.0 0.0 0.0 0.0Adjusted PAT 212.5 336.8 664.9 896.6
Growth rates (%)Net Sales 62.9 73.4 85.7 26.6EBITDA 41.2 81.3 92.6 28.4EBIT 44.4 70.0 83.3 28.9EPS-Diluted 20.7 -45.5 97.4 34.8
Balance Sheet (INR mn)Net worth 1483.8 2114.1 2684.6 3486.7Total Debt 1251.3 3000.0 3500.0 3000.0Creditors 482.5 833.0 1547.1 1958.1Total Liabilities 2792.5 5171.5 6242.0 6544.1Net Fixed Assets 1652.3 3572.8 4167.8 4528.9Cash & Cash Equivalents 43.1 363.3 384.4 83.8Debtors 606.0 1046.8 1944.4 2460.9Total assets 2792.5 5171.5 6242.0 6544.1
Cash Flow (INR mn)PAT 212.5 336.8 664.9 896.6Depreciation 28.9 79.5 205.1 238.8Operating Cash Flow -194.6 277.9 415.7 893.8Capital Expenses 491.2 2000.0 800.0 600.0Chg in Investments 31.4 0.0 0.0 0.0Investing Cash Flow -522.6 -2000.0 -800.0 -600.0Debt raised/(repaid) 674.5 1748.7 500.0 -500.0Dividend Paid 739.9 2042.2 405.5 -594.5Financing Cash Flow 739.9 2042.2 405.5 -594.5
Profitability/Solvency Ratios (%)EBITDA Margin 18.5 19.3 20.0 20.3ROCE 8.6 7.8 12.6 16.5ROE 14.3 15.9 24.8 25.7Debt to Equity 84.3 141.9 130.4 86.0Interest Coverage Ratio 411.4 339.6 416.7 488.2* Issued Bonus in ratio of 2:1 and accounted for conversion of all CCPS and Warrants issued till FY10E end
Company Description
TI is one of the leading players in the Indian
alcoholic beverage industry and manufactures
Indian Made Foreign Liquor (IMFL), with over
16 brands across a diverse range of price and
product segments. TI's primary manufacturing
facility is located in at Shrirampur, Maharashtra.
Currently, the company has 100 KLPD molasses
based and 100 KLPD grain based distillery. The
company commands 4% of domestic IMFL
market.
www.tilind.com
Sector
Alcoholic Beverage
Key Management Personnel
Mr. Amit Dahanukar
MD & Chairman
Mrs. Shivani A Dahanukar
Executive Director
Mr. Lalit Sethi
CFO
PRICE PERFORMANCE (%)
3 M 6 M 12 M
Absolute 1.8 3.4 62.5
Relative (55.9) (129.7) (378.0)
Valuation Thesis
At CMP, the company is trading at 8.4x and 6.2x
FY11E and FY12E earnings and 5.7x and 4.3x
FY11E and FY12E EV/EBITDA respectively. We
recommend BUY rating with price target of INR
232 (average of target FY12E EV/EBITDA of 5.5x
and FY12E P/E of 8.0x).
Financial Summary
For Private Circulation OnlyApril 16, 2010 3
Investment Rationale
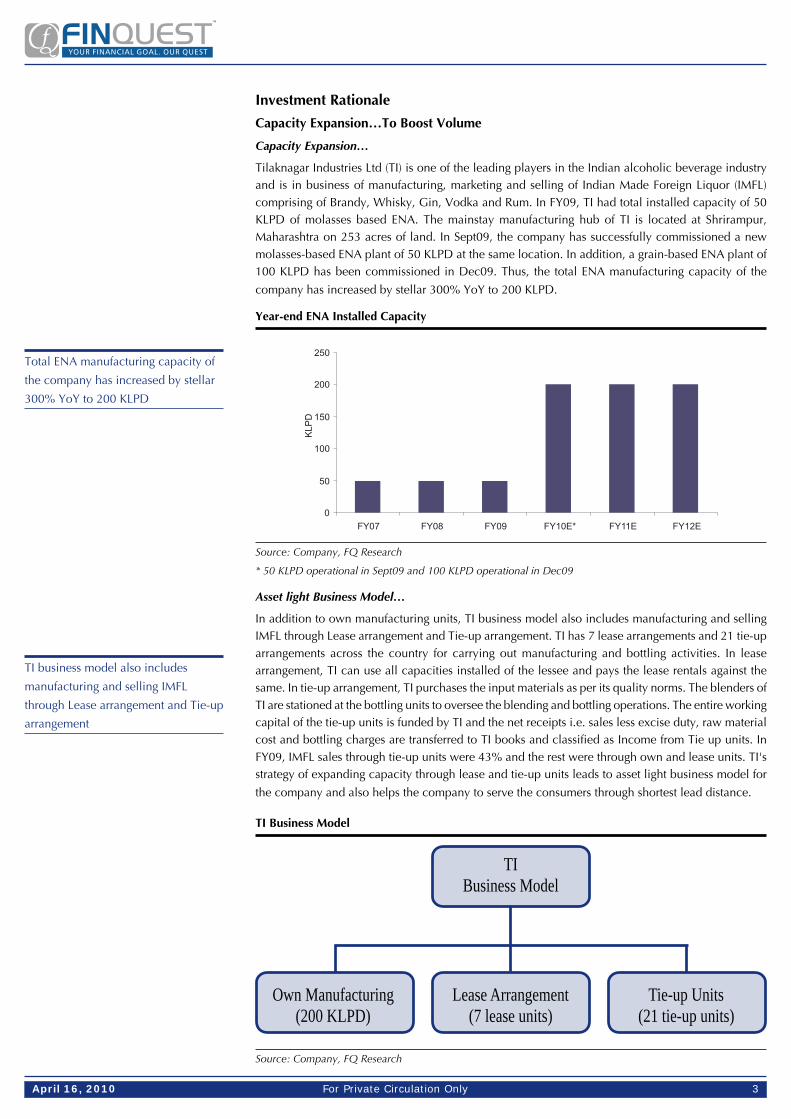
Capacity Expansion…To Boost Volume
Capacity Expansion…
Tilaknagar Industries Ltd (TI) is one of the leading players in the Indian alcoholic beverage industryand is in business of manufacturing, marketing and selling of Indian Made Foreign Liquor (IMFL)comprising of Brandy, Whisky, Gin, Vodka and Rum. In FY09, TI had total installed capacity of 50KLPD of molasses based ENA. The mainstay manufacturing hub of TI is located at Shrirampur,Maharashtra on 253 acres of land. In Sept09, the company has successfully commissioned a newmolasses-based ENA plant of 50 KLPD at the same location. In addition, a grain-based ENA plant of100 KLPD has been commissioned in Dec09. Thus, the total ENA manufacturing capacity of the
company has increased by stellar 300% YoY to 200 KLPD.
Year-end ENA Installed Capacity
Source: Company, FQ Research
* 50 KLPD operational in Sept09 and 100 KLPD operational in Dec09
Asset light Business Model…
In addition to own manufacturing units, TI business model also includes manufacturing and sellingIMFL through Lease arrangement and Tie-up arrangement. TI has 7 lease arrangements and 21 tie-uparrangements across the country for carrying out manufacturing and bottling activities. In leasearrangement, TI can use all capacities installed of the lessee and pays the lease rentals against thesame. In tie-up arrangement, TI purchases the input materials as per its quality norms. The blenders ofTI are stationed at the bottling units to oversee the blending and bottling operations. The entire workingcapital of the tie-up units is funded by TI and the net receipts i.e. sales less excise duty, raw materialcost and bottling charges are transferred to TI books and classified as Income from Tie up units. InFY09, IMFL sales through tie-up units were 43% and the rest were through own and lease units. TI'sstrategy of expanding capacity through lease and tie-up units leads to asset light business model for
the company and also helps the company to serve the consumers through shortest lead distance.
TI Business Model
Source: Company, FQ Research
TIBusiness Model
Own Manufacturing Lease Arrangement Tie-up Units(200 KLPD) (7 lease units) (21 tie-up units)
Total ENA manufacturing capacity of
the company has increased by stellar
300% YoY to 200 KLPD
TI business model also includes
manufacturing and selling IMFL
through Lease arrangement and Tie-up
arrangement

For Private Circulation OnlyApril 16, 2010 4
Well-established brands…Stellar Volume Growth
The company sells its IMFL products under its well-established brand. The Brandy is sold under brand
name of Mansion House, Courrier Napoleon, Master's Doctor and Senate whereas Whisky is sold
under brand name of Senate Royale, Mansion House, Shot, Classic, Royal Choice, Hottt Silk and
Castle Club. In fact, Mansion House won the "Brandy of the Year" award for 2009 at INDSPIRIT 2009.
Including other well-established brands for Rum, Vodka and Gin, the company has over 16 brands
across the diverse range of price and product segments and caters to economy, semi-premium and
premium category of the market.
TI's and Competitors Brand
Products TI's Brand Competitors Brand
Brandy Mansion, Courrier Napoleon, McDowell's, Honey Bee, Old English,
Master's Doctor, Senate Napolean, Bio
Whisky Senate Royale, Mansion House, Shot, Imperial Blue, Red Knight, DSP Black,
Classic, Royal Choice, Hottt Silk, AC Premium, Raffles
Castle Club
Rum Savoy Club, Royal Choice, Madira, Old Monk, Celebration, Hercules, 8 PM,
Castle Club, Senate, Shot Rock Carta Blanka
Gin Savoy Club Dry Gin, Royal Choice, Blue Ribbon, White Lace, Premium Blue,
Duet Gin, Mansion House Royal Choice, SRK Superior
Vodka Classic Vodka, Castle Club Vodka Karmazov Rare, White Mischief, Romanov,
MGM Apple, Magic Moments
Source: Company, FQ Research
As of FY09, the company has garnered 50.7% and 41.4% sales volume in whisky and brandy
respectively. The remaining 7.9% sales comprises of Rum, Gin and Vodka. As of FY09, the company
commands total market share of 7.1%, 3.0% and 3.1% in brandy, whisky and total IMFL market
respectively. Going forward, rum sales volume should increase at rapid pace due to empanelment
of TI's rum in CSD market. However, whisky and brandy will continue to command dominant
proportion in overall sales quantity.
FY09 Productwise Quantitative Sales Breakup (%)
Source: Company, FQ Research
Mansion House won the "Brandy of
the Year" award for 2009 at
INDSPIRIT 2009
In FY09, among IMFL, the company
has garnered 50.7% and 41.4%
quantitative volume through sales of
whisky and brandy respectively
For Private Circulation OnlyApril 16, 2010 5
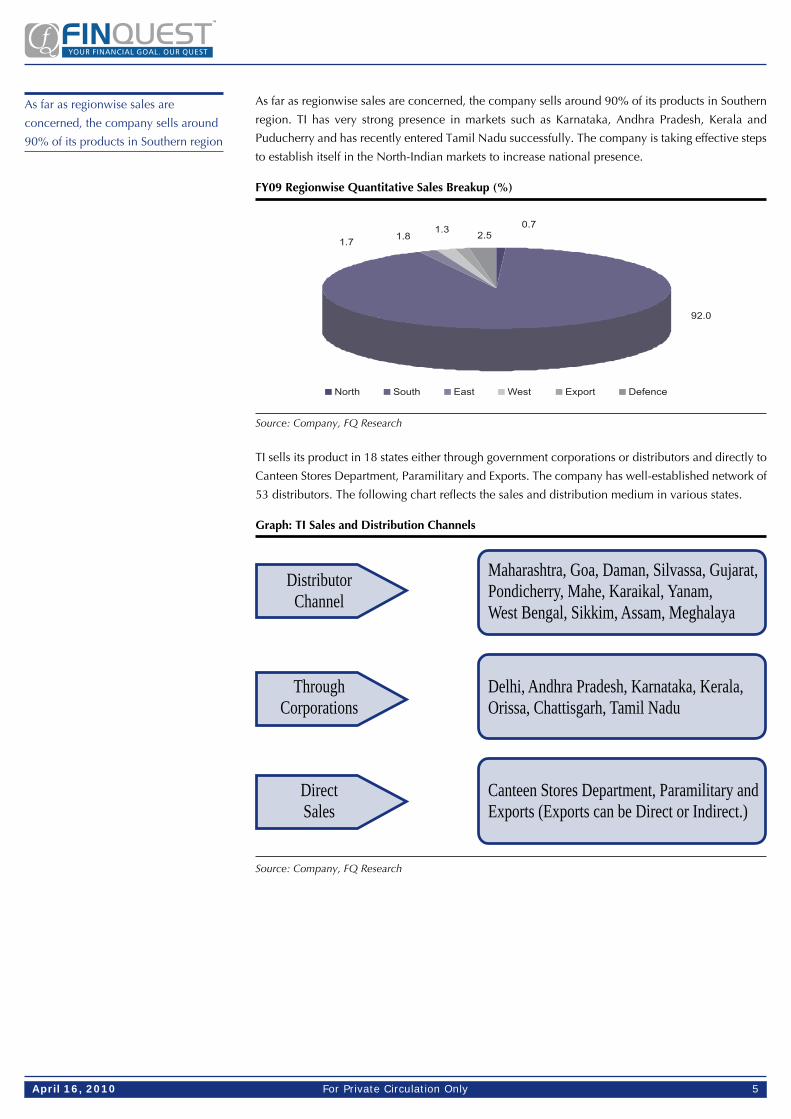
As far as regionwise sales are concerned, the company sells around 90% of its products in Southern
region. TI has very strong presence in markets such as Karnataka, Andhra Pradesh, Kerala and
Puducherry and has recently entered Tamil Nadu successfully. The company is taking effective steps
to establish itself in the North-Indian markets to increase national presence.
FY09 Regionwise Quantitative Sales Breakup (%)
Source: Company, FQ Research
TI sells its product in 18 states either through government corporations or distributors and directly to
Canteen Stores Department, Paramilitary and Exports. The company has well-established network of
53 distributors. The following chart reflects the sales and distribution medium in various states.
Graph: TI Sales and Distribution Channels
Source: Company, FQ Research
ThroughCorporations
Delhi, Andhra Pradesh, Karnataka, Kerala,Orissa, Chattisgarh, Tamil Nadu
DirectSales
Canteen Stores Department, Paramilitary andExports (Exports can be Direct or Indirect.)
DistributorChannel
Maharashtra, Goa, Daman, Silvassa, Gujarat,Pondicherry, Mahe, Karaikal, Yanam,West Bengal, Sikkim, Assam, Meghalaya
As far as regionwise sales are
concerned, the company sells around
90% of its products in Southern region
For Private Circulation OnlyApril 16, 2010 6
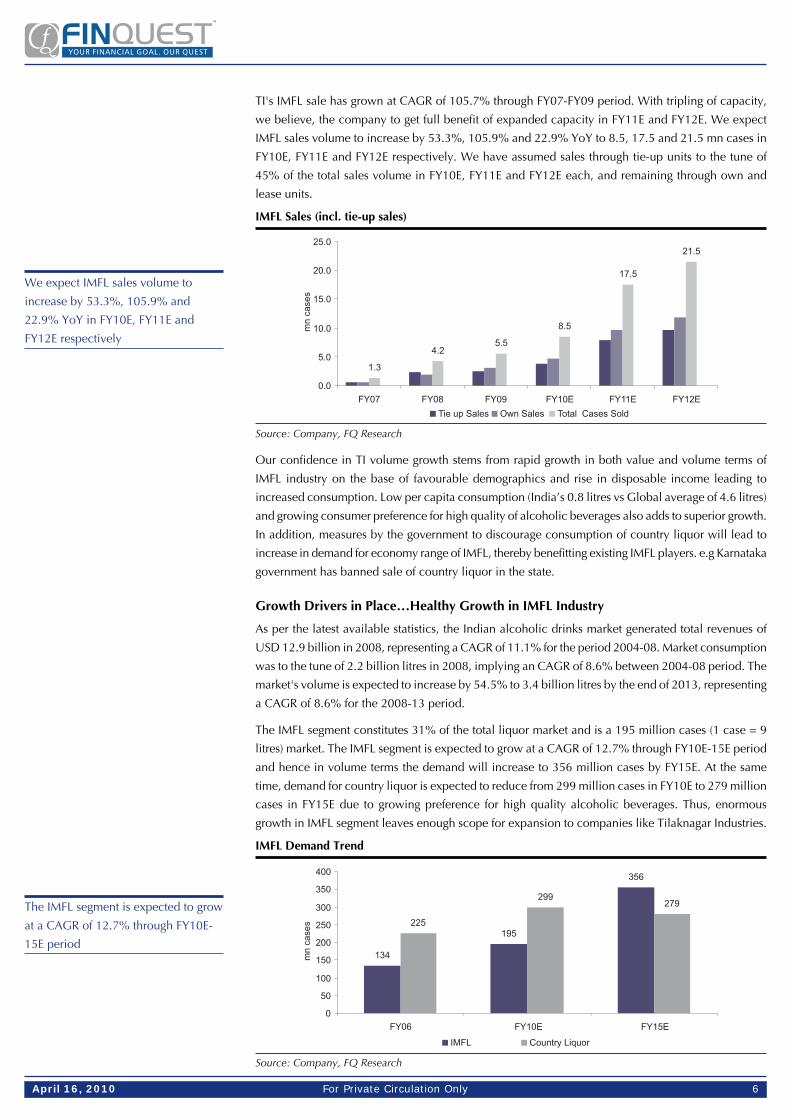
TI's IMFL sale has grown at CAGR of 105.7% through FY07-FY09 period. With tripling of capacity,
we believe, the company to get full benefit of expanded capacity in FY11E and FY12E. We expect
IMFL sales volume to increase by 53.3%, 105.9% and 22.9% YoY to 8.5, 17.5 and 21.5 mn cases in
FY10E, FY11E and FY12E respectively. We have assumed sales through tie-up units to the tune of
45% of the total sales volume in FY10E, FY11E and FY12E each, and remaining through own and
lease units.
IMFL Sales (incl. tie-up sales)
Source: Company, FQ Research
Our confidence in TI volume growth stems from rapid growth in both value and volume terms of
IMFL industry on the base of favourable demographics and rise in disposable income leading to
increased consumption. Low per capita consumption (India’s 0.8 litres vs Global average of 4.6 litres)
and growing consumer preference for high quality of alcoholic beverages also adds to superior growth.
In addition, measures by the government to discourage consumption of country liquor will lead to
increase in demand for economy range of IMFL, thereby benefitting existing IMFL players. e.g Karnataka
government has banned sale of country liquor in the state.
Growth Drivers in Place…Healthy Growth in IMFL Industry
As per the latest available statistics, the Indian alcoholic drinks market generated total revenues of
USD 12.9 billion in 2008, representing a CAGR of 11.1% for the period 2004-08. Market consumption
was to the tune of 2.2 billion litres in 2008, implying an CAGR of 8.6% between 2004-08 period. The
market's volume is expected to increase by 54.5% to 3.4 billion litres by the end of 2013, representing
a CAGR of 8.6% for the 2008-13 period.
The IMFL segment constitutes 31% of the total liquor market and is a 195 million cases (1 case = 9
litres) market. The IMFL segment is expected to grow at a CAGR of 12.7% through FY10E-15E period
and hence in volume terms the demand will increase to 356 million cases by FY15E. At the same
time, demand for country liquor is expected to reduce from 299 million cases in FY10E to 279 million
cases in FY15E due to growing preference for high quality alcoholic beverages. Thus, enormous
growth in IMFL segment leaves enough scope for expansion to companies like Tilaknagar Industries.
IMFL Demand Trend
Source: Company, FQ Research
We expect IMFL sales volume to
increase by 53.3%, 105.9% and
22.9% YoY in FY10E, FY11E and
FY12E respectively
The IMFL segment is expected to grow
at a CAGR of 12.7% through FY10E-
15E period

For Private Circulation OnlyApril 16, 2010 7
Within pan India IMFL segment, whisky corners the largest share at 52-55%, followed by rum at
22-23%. The brown spirit (Whisky, Brandy and Rum) accounts for around 93% of the market
share. Although Vodka accounts for only 4-5% of total sales, its consumption is growing at healthy
rate of 40% due to increase preference among urban and young population. The breakup of IMFL
demand is as follows:
(Cases in million) FY04 FY05 FY06 FY07 FY08 FY09 FY10
Whisky 62.1 66.9 74.2 79.9 86.2 93 100.5
YoY % 7.7 10.9 7.7 7.9 7.9 8.1
Brandy 15.5 19.4 21.2 24.4 28 32.2 37.1
YoY % 25.2 9.3 15.1 14.8 15.0 15.2
Rum 30.3 32.1 32.6 35.2 38 41 44.3
YoY % 5.9 1.6 8.0 8.0 7.9 8.0
Vodka 1 1.4 2.3 3.2 4.5 6.3 8.8
YoY % 40.0 64.3 39.1 40.6 40.0 39.7
Gin 3.3 3.3 3.1 3.3 3.4 3.6 3.8
YoY % 0.0 -6.1 6.5 3.0 5.9 5.6
Total Market 112.5 123.5 133.7 146.4 160.6 176.8 195.4
YoY % 9.8 8.3 9.5 9.7 10.1 10.5
Source: Company, FQ Research
In India, different regions have varied preferences among Whisky, Brandy, Rum, Gin and Vodka.
Whisky is mostly preferred in North, while Brandy volumes are concentrated in South and West.
Rum is mostly preferred in Defense. The breakup of sales (and hence preferences) for various
alcoholic drink region wise is as follow:
Regionwise Preferences for IMFL
Source: Company, FQ Research
For Private Circulation OnlyApril 16, 2010 8
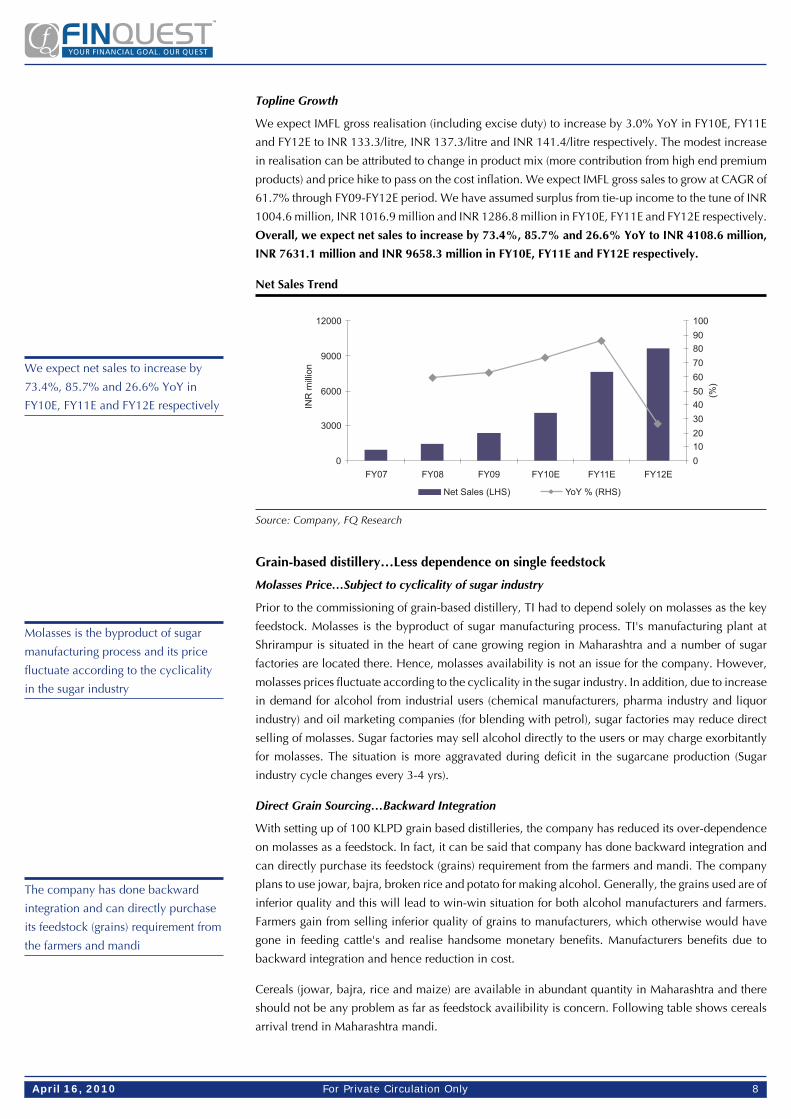
Topline Growth
We expect IMFL gross realisation (including excise duty) to increase by 3.0% YoY in FY10E, FY11E
and FY12E to INR 133.3/litre, INR 137.3/litre and INR 141.4/litre respectively. The modest increase
in realisation can be attributed to change in product mix (more contribution from high end premium
products) and price hike to pass on the cost inflation. We expect IMFL gross sales to grow at CAGR of
61.7% through FY09-FY12E period. We have assumed surplus from tie-up income to the tune of INR
1004.6 million, INR 1016.9 million and INR 1286.8 million in FY10E, FY11E and FY12E respectively.
Overall, we expect net sales to increase by 73.4%, 85.7% and 26.6% YoY to INR 4108.6 million,
INR 7631.1 million and INR 9658.3 million in FY10E, FY11E and FY12E respectively.
Net Sales Trend
Source: Company, FQ Research
Grain-based distillery…Less dependence on single feedstock
Molasses Price…Subject to cyclicality of sugar industry
Prior to the commissioning of grain-based distillery, TI had to depend solely on molasses as the key
feedstock. Molasses is the byproduct of sugar manufacturing process. TI's manufacturing plant at
Shrirampur is situated in the heart of cane growing region in Maharashtra and a number of sugar
factories are located there. Hence, molasses availability is not an issue for the company. However,
molasses prices fluctuate according to the cyclicality in the sugar industry. In addition, due to increase
in demand for alcohol from industrial users (chemical manufacturers, pharma industry and liquor
industry) and oil marketing companies (for blending with petrol), sugar factories may reduce direct
selling of molasses. Sugar factories may sell alcohol directly to the users or may charge exorbitantly
for molasses. The situation is more aggravated during deficit in the sugarcane production (Sugar
industry cycle changes every 3-4 yrs).
Direct Grain Sourcing…Backward Integration
With setting up of 100 KLPD grain based distilleries, the company has reduced its over-dependence
on molasses as a feedstock. In fact, it can be said that company has done backward integration and
can directly purchase its feedstock (grains) requirement from the farmers and mandi. The company
plans to use jowar, bajra, broken rice and potato for making alcohol. Generally, the grains used are of
inferior quality and this will lead to win-win situation for both alcohol manufacturers and farmers.
Farmers gain from selling inferior quality of grains to manufacturers, which otherwise would have
gone in feeding cattle's and realise handsome monetary benefits. Manufacturers benefits due to
backward integration and hence reduction in cost.
Cereals (jowar, bajra, rice and maize) are available in abundant quantity in Maharashtra and there
should not be any problem as far as feedstock availibility is concern. Following table shows cereals
arrival trend in Maharashtra mandi.
We expect net sales to increase by
73.4%, 85.7% and 26.6% YoY in
FY10E, FY11E and FY12E respectively
Molasses is the byproduct of sugar
manufacturing process and its price
fluctuate according to the cyclicality
in the sugar industry
The company has done backward
integration and can directly purchase
its feedstock (grains) requirement from
the farmers and mandi

For Private Circulation OnlyApril 16, 2010 9
Cereals Arrivals in Maharashtra (in tonnes)
Year (Jan-Dec) Jowar Bajra Rice Maize Total
2010* 100498 17401 210187 100943 429029
2009 312570 71885 622362 304555 1311372
2008 170088 65304 243755 217314 696460
2007 245985 104415 288710 316733 955843
2006 305870 248701 286894 217507 1058972
Source: Agmarknet (as per data provided by APMC), FQ Research
* From Jan10-Mar10
Costing
Generally, cost of making grain based alcohol is more than that of molasses based alcohol. Grain is
first milled into flour and then it is fermented into liquor. At the same time, grain based alcohol
commands premium due to better quality. Thus, company plans to cater to high-end premium IMFL
market through grain based alcohol and will cater to low-end market through molasses based alcohol.
Following table shows the ballpark cost of making alcohol from molasses and grains.
Economics of molasses and grain based alcohol
Feedstock Used
Particulars Molasses-based Grain-based
Quantity Used 1 tonne 1 tonne
(A) Productivity per tonne 250-270 litres 380 litres for jowar
400 litres for broken rice and bajra
430 litres for maize
(B) Feedstock Cost INR 6500/tonne INR 10000/tonne
(C) Per litre cost (B)/(A) INR 26-24 INR 26 (for jowar) to INR 23 (for maize)
(D) Per litre conversion cost INR 5 INR 7
Total Manufacturing cost (C) + (D) INR 30-29/litre INR 33-30/litre
Source: Media, FQ Research
Subsidy on grain based alcohol
As per the Maharashtra government policy, TI is eligible for the subsidy of INR 250 million for making
alcohol from grains. The government of Maharashtra will give INR 10/litre rebate on the excise-duty
to the grain-based distilleries. This concession has to be utilized by TI till Dec 2013. In our calculation,
we have not taken into account this subsidy and if INR 250 million is divided equally in FY11E and
FY12E, then it will lead to incremental EPS of INR 3.8/share in FY11E and FY12E each.
Cost of making grain based alcohol is
more than that of molasses based
alcohol
As per the Maharashtra government
policy, TI is eligible for the subsidy of
INR 250 million for making alcohol
from grains

For Private Circulation OnlyApril 16, 2010 10
Margins to improve…
Sugar Cycle….in reverse gear
During SY09 (Oct08-Sept09), India's sugar production declined to 14.5 million tonnes against the
demand of 22.5 million tonnes. In SY10 (Oct09-Sept10), the sugar production is expected to be
higher at 16-17 million tonnes. However, it will be way below the expected demand of 23.0 million
tonnes. In the wake of cane sourcing competition between sugar mills and gur/khandsari players in
SY10, sugar mills have paid exorbitant cane price of INR 240-280/quintal against fair and remunerative
price of 129/quintal fixed by central government. The exorbitant prices paid by sugar mills in SY10
has incentivize farmers to plant more cane and we expect sugarcane output and hence sugar production
to increase by 30-35% YoY in SY11 (Oct10-Sept11). Molasses availability (being directly linked to
sugarcane output) is also expected to increase proportionately.
Due to expected increase in sugar production in SY11, the sugar prices have corrected from the peak
of INR 42/Kg in Jan to INR 31/Kg in April.
Sugar Price Trend (Spot Sugar M - Muzaffarnagar)
Source: NCDEX, FQ Research
Decline in molasses price… Margins to expand
For SY11, Indian sugar mills will start sugarcane crushing from Oct10 onwards and we expect molasses
prices to start cooling off from the current level of INR 6500-7000/tonne. Thus, we expect the benefit
of decline in molasses price to accrue for TI from 2HFY11E onwards. Overall, we conservatively
expect molasses price to decline by 2.0% YoY each in FY11E and FY12E to INR 6860/tonne and INR
6723/tonne respectively.
Molasses Price Trend
Source: Company, FQ Research
We expect sugarcane output to
increase by 30-35% YoY in SY11
(Oct10-Sept11)
For SY11, sugarcane crushing will
start from Oct10 onwards and we
expect molasses prices to start cooling
off from the current level
For Private Circulation OnlyApril 16, 2010 11
As far as manufacturing alcohol from grains is concerned, the company doesn't have any operational
history. In our calculation, we have assumed that the company will be using mainly jowar along with
other grains as a feedstock. We have conservatively taken productivity of 380 litres of alcohol for
every tonne of grains processed in FY11E and FY12E each.
Taking into account Minimum Support Price (MSP) fixed by government for wheat, paddy and coarse
grains (jowar/bajra/maize/ragi/barley) for 2009-10, we have assumed average grain cost of INR 12,000/
tonne and INR 13000/tonne in FY11E and FY12E respectively.
MSP for Foodgrains
Source: Department of Agriculture & Cooperation, FQ Research
It is to be noted that raw material cost accounts for 50-60% of total expenditure and molasses (key
feedstock) accounts for 50-60% of total raw material cost. From FY11E onwards, the full impact of
cost of grains will be added to raw material cost. We expect, feedstock (molasses and grains) contribution
to total raw material cost to remain at 50-60% in FY11E and FY12E also. Overall, we expect raw
material cost to increase by 99.8%, 45.6% and 25.9% YoY in FY10E, FY11E and FY12E respectively.
Taking into account other expenditure, we expect EBITDA to grow at CAGR of 64.9% through
FY09-FY12E period. Due to decline in raw material cost coupled with increase in average realisation
(on the back of change in product mix towards premium category), we expect EBITDA margins to
expand by 80 bps, 70 bps and 30 bps YoY to 19.3%, 20.0% and 20.3% YoY in FY10E, FY11E and
FY12E respectively.
EBITDA Trend
Source: Company, FQ Research
We have assumed average grain cost
of INR 12,000/tonne and INR 13000/
tonne in FY11E and FY12E
respectively
We expect EBITDA margins to expand
by 80 bps, 70 bps and 30 bps YoY to
19.3%, 20.0% and 20.3% YoY in
FY10E, FY11E and FY12E respectively

For Private Circulation OnlyApril 16, 2010 12
The company commands operating margin inline with the IMFL industry leader United Spirits. This
reflects that the company has strong business model. Following graph shows margin of key players in
the alcoholic beverage industry:
Peer Margin (excl. other income) comparisons
Source: Capitaline, FQ Research
Depreciation and Interest expense to increase
In one of the largest expansion ever in TI's history, the company has spend INR 2000 million as a
capex in FY10E, mainly on expansion of the molasses-based distillery and a new grain based distillery.
The breakup of capex spends is as follow:
Project Cost
Particulars (INR million) Project I Project II Total
Molasses Based Distillery Grain Based Distillery
Land - - -
Building 35 10 45
Plant & Machinery 660 1083 1743
Pre-operative Expenses 52 52
Contingencies 5 55 60
Margin Money for working capital 50 100 150
Total 750 1300 2050
Sources of funds
Sources (INR million) Project I Project II Total
Molasses Based Distillery Grain Based Distillery
Equity / Internal Accruals 300 400 650
Debt 450 900 1,350
Total 750 1,300 2,000
The company has planned to spend INR 800 million in FY11E for setting up a new bottling plant. We
have assumed that the company will spend INR 600 million in FY12E as a part of its capex program.
Hence, we expect gross block to increase by 162.7%, 18.9% and 14.4% YoY to INR 3745.7 million,
INR 4457.0 million and INR 5097.0 million in FY10E, FY11E and FY12E respectively. Due to increase
in capitalization of assets, we expect depreciation expense to increase by 175.2%, 157.9% and
16.5% to INR 79.5 million, INR 205.1 million and INR 238.8 million in FY10E, FY11E and FY12E
respectively.
The company commands operating
margin inline with the IMFL industry
leader United Spirits

For Private Circulation OnlyApril 16, 2010 13
Depreciation Expense Trend
Source: Company, FQ Research
As of Dec09, the company has gross debt of INR 3000 million as compared to INR 1251.3 million in
Mar09. We expect interest expense to increase by 106.0%, 49.4%, and 10.0% YoY to INR 217.6
million, INR 325.0 million and INR 357.5 million in FY10E, FY11E and FY12E respectively. Overall,
we expect net profit to grow to CAGR of 61.6% through FY09-FY12E period. We expect net profit
margin to increase marginally by 50 bps and 60 bps YoY to 8.7% and 9.3% in FY11E and FY12E
respectively.
Improvement in Return Ratios
Post completion of one of the most ambitious project of TI, majority of capex has completed in FY10E
and we expect return ratios to improve from here onwards. We expect RoE to increase from 14.3% in
FY09 to 15.9%, 24.8% and 25.7% in FY10E, FY11E and FY12E respectively. We expect RoCE to
increase from 8.6% in FY09 to 7.8%, 12.6% and 16.5% in FY10E, FY11E and FY12E respectively.
RoE and RoCE trend
Source: Company, FQ Research
We expect net profit to grow to CAGR
of 61.6% through FY09-FY12E period
We expect depreciation expense to
increase by 175.2%, 157.9% and
16.5% in FY10E, FY11E and FY12E
respectively
RoE & RoCE will increase from 14.3%
and 8.6% in FY09 to 25.7% & 16.5%
in FY12E respectively

For Private Circulation OnlyApril 16, 2010 14
We expect the company's debt-equity ratio to increase from 0.8x in FY09 to 1.4x in FY10E and then
decline to 1.3x and 0.9x in FY11E and FY12E respectively. At the same time, we expect interest
coverage ratio to increase from 4.1x in FY09 to 4.9x in FY12E. Overall, we believe the company's
balance sheet to remain healthy through FY09-FY12E period. Also, we expect company to turn FCF
positive by FY12E end.
Debt-Equity and Interest Coverage Ratio
Source: Company, FQ Research
Valuations
At CMP, the company is trading at 8.4x and 6.2x FY11E and FY12E earnings and 5.7x and 4.3x FY11E
and FY12E EV/EBITDA respectively. Historically, the company has mostly traded in the 1-yr forward
PE band of 2.2x-13.3x and 1-yr forward EV/EBITDA band of 3.8x-8.4x. We believe the company is
well-placed to benefit from healthy growth in IMFL industry along with India's consumption story.
Looking at magnificent earning growth ahead, we believe that such a low valuations for TI as compared
to its peers is unjustified and the stock will be re-rated soon. We initiate coverage on the company
with BUY recommendation and price target of INR 232 (average of target FY12E EV/EBITDA of
5.5x and FY12E P/E of 8.0x).
We believe the company's balance
sheet to remain healthy through FY09-
FY12E period
Peer Comparison
P/E EV/EBITDA Dividend Yield (%) RoE (%)
Company Yr-End Country Currency FY10E FY11E FY10E FY11E FY10E FY11E FY10E FY11E
United Spirit March India INR 39.2 26.2 18.9 15.8 0.2 0.3 10.7 12.3
Diageo June UK GBP 15.3 13.8 - - 3.2 3.5 16.2 17.1
Brown-Forman Corporation April US USD 19.1 17.9 12.0 11.5 2.0 2.1 24.7 23.8
Constellation Brands Feb US USD 10.3 9.4 8.7 8.4 0.0 0.0 13.6 13.0
Tilaknagar Industries March India INR 16.5 8.4 10.3 5.7 1.5 1.5 15.9 24.8
Source: Bloomberg, FQ Research
Peer Comparision - TTM Valuation Ratio
Mcap TTM-End P/E EV/EBITDA P/BV
(INR mn) TTM TTM TTM
Tilaknagar Industries 5202 Dec-09 12.2 7.0 3.0
United Spirit 160504 Dec-09 45.7 20.1 3.4
Radico Khaitan 17674 Dec-09 82.9 14.1 2.7
Jagatjit Industries 3039 Dec-09 216.7 9.7 1.4
Empee Distilleries 2469 Dec-09 14.1 7.4 1.1
Pioneer Distilleries 594 Dec-09 13.1 9.9 1.6
Source: Capitaline, FQ Research

For Private Circulation OnlyApril 16, 2010 15
Valuation Graphs
1-yr forward EV/EBITDA Band
Source: Bloomberg, FQ Research
2-yr forward EV/EBITDA Band
Source: Bloomberg, FQ Research
1-yr forward PE Band
Source: Bloomberg, FQ Research

For Private Circulation OnlyApril 16, 2010 16
2-yr forward PE Band
Source: Bloomberg, FQ Research
Other Industry Details
Industry Structure and Market
Liquor manufactured in India is categorised as Beer, Country liquor and Indian Made Foreign Liquor
(IMFL). IMFL production includes whisky, brandy, rum, vodka and gin. Indian Made Foreign Liquor
(IMFL) accounts for a third of the total liquor consumption in India.
Manufacturing Process in Brief
Basic Feedstock Sourcing: Basic raw material for manufacture of alcohol is molasses and/or
grain. Molasses is a byproduct of the sugar industry. Molasses is transported through road tankers
and is stored in huge tanks in the company premises. For manufacturing alcohol, the molasses is
diluted with water into a solution containing 15-16% of sugar.
Fermentation: This solution is then inoculated with yeast strain and is allowed to ferment at
room temperature.
Distillation: The fermented wash is distilled in a series of distillation columns to obtain alcohol
of adequate/ requisite strength and quality/ specification. This alcohol is used for various purposes,
both potable and industrial.
Blending/Bottling: For manufacture of alcoholic beverages, the alcohol is, if required, matured
and blended with malt alcohol (for manufacture of whisky) and diluted to requisite strength to
obtain the desired type of liquor/ Indian Made Foreign Liquor (IMFL). This is then bottled in
bottles of various sizes for the convenience of consumers.
Liquor manufactured in India is
categorised as Beer, Country liquor
and Indian Made Foreign Liquor

For Private Circulation OnlyApril 16, 2010 17
Government Policies and Regulations…Entry Barriers for new entrants
Restriction on direct advertising: Direct advertising of alcoholic beverages is banned in India, curtailing
the attempts of global majors to make a strong entry. Promotions, sponsorships, surrogate advertising
done to build brands. E.g. TI sells packaged drinking water under brand name of Senate Royale
packaged drinking water, UB group sponsorship to majority of the teams in IPL and surrogate advertising
through Kingfisher mineral water etc. At the lower end of the market, brand promotion has been
mainly through retailer discounts.
Licensing: Licenses are required to set up a new manufacturing unit. While one can readily expand
existing units, getting a fresh license is cumbersome.
High taxes: Taxes and duties constitute nearly 45-50% of the final Consumer price. In addition to
excise duties imposed by various states, there are also high taxes on inter-state movement of liquor.
Each state levies taxation and duties on alcohol at its own decided rates. The duty structure of each
State is so different that for a company operating at the national level, it is like dealing with 25
countries.
High import duties: Imported liquor is subject to 100% import duty and 150% CV duty. The total
incidence of taxes on imported liquor increases significantly due to presence of numerous state level
taxes.
Existing strong brands: Strong consumer affinity with brands results in very high degree of repeat
purchase. E.g. Kingfisher, Signature Whisky, Mcdowell, Mansion House etc.
Difficulties in distribution: Each state regulates distribution channels of alcohol in its own way.
Distribution controls take various forms: Auctions, free-market system, government- controlled markets
(corporations) and canteen stores departments.
Under the auction system, the Government fixes a floor price for the shops and the bidders have to
quote prices. The license would go to the highest bidder and the bid price would have to be paid in
equated monthly installments. This system operates in Punjab, Rajasthan, Bihar, Orissa, Uttar Pradesh
and Madhya Pradesh. Since there are limited licences, unfair practices are rampant. Some distributors
bid for as many as ten shops at a time for greater control over the market. For instance, in Rajasthan,
12 groups control the wholesale and retail networks. In Uttar Pradesh, three major lobbies are said to
control 70 per cent of the trade in the State.
In the government-controlled system (corporation), the distribution of liquor is through state agencies
such as the TASMAC in Tamil Nadu, BEVCO in Kerala, the Andhra Pradesh Beverage Corporation in
AP, and the DSIDC in Delhi and so on. Since these agencies are sole wholesalers, they also have the
ultimate say in deciding on the entry of a brand into the State.
In a free-market system, there is no government intervention in the pricing and distribution of liquor.
The manufacturers sell liquor to the wholesaler/distributor who in turn sells it to the retail outlets.
Market forces determine pricing. The government issues wholesale/retail licenses for a fee.
Regionwise Overview
North
Constitutes around 25% of the total Alcohol drinks volume
Standard and economy brands continued to dominate less developed region of Uttaranchal and
Uttar Pradesh
Prospects:
Expected volume growth of 6.6% CAGR in total alcohol from the year 2010 - 2013
Deregulation of distribution and retail policies
Direct advertising of alcoholic
beverages is banned in India,
curtailing the attempts of global
majors to make a strong entry
Taxes and duties constitute nearly 45-
50% of the final Consumer price
Imported liquor is subject to 100%
import duty and 150% CV duty
Each state regulates distribution
channels of alcohol in its own way

For Private Circulation OnlyApril 16, 2010 18
South
Region with the highest consumption ~38% of India's total drinks volume
Leads National consumption of Whiskey, Rum, Brandy and beer
Accounts for 67% of India's brandy consumption
Prospects:
Expected volume growth of 7.4% CAGR in total alcohol from the year 2010 - 2013
Government ban on country liquor in Karnataka opens huge market for economy brands of
IMFL
The youth are prone to experimentation and see white spirits as a trendy trend as opposed to
whisky.
West
Constitute 27% of total sales
Second behind south in spirits, leads in beer and Ready to Drink alcohol
Prospects
Alcoholic drinks to grow in volume terms at CAGR of 6.9% from the year 2010 - 2013
Liberal stance towards alcohol and flourishing of premium brands in Maharashtra
Experimentation will lead to white spirits and other alcohols such as tequila and liqueurs to
grow faster in this region
East and North-East
Low contribution - 10% of total alcohol sales in volume terms
Prospects
Expected volume growth of 6% CAGR in total alcohol from the year 2010 - 2013
State governments depend heavily on excise in this region and hence number of off-trade
outlets is likely to increase
50% under proof alcohol (28% ABV) brands are providing a low cost upgrade from country
liquor to IMFL
West Bengal - Tax changes have made smaller packs of economy spirits cheaper, increasing
demand
Source: Company, Capitaline, FQ Research
Key Players
In IMFL segment, United Spirits is the market leader with ~53% market share and 19 brands with
sales of over 1 million cases in each brand. Other key players are Radico Khaitan, Jagatjit Industries,
Balaji Distilleries, Khoday India, Pioneer Distilleries and Empee Distilleries.
Key Concerns
Unfavourable judgement in legal case against Dutch spirit company UTO
TI and UTO, Dutch-based spirit company is engage in a legal battle over the brand Mansion
House and Savoy Club, details of which is given below:
Dutch spirit company UTO has moved the Bombay High Court to reclaim what its says are its
brand, Mansion House and Savoy Club from TI. UTO claims that it has licensed these brands to
TI in 1983. According to the TI, "Mansion House and Savoy Club are registered by TI in the
trademark registry under the provisions of the trademark law. Mansion House labels are also
registered under the Copyright Act. The said registrations are valid and subsisting and TI, therefore
has an exclusive right to use them". In fact, in 1987, UTO ceded its right to the said trademarks
in favour of TI. Therefore, UTO did not demand the TI to give back the said trademarks, nor did
TI give up its right in the said trademarks. The fact that UTO never staked its claim in the 1990s,
when TI was struggling to promote the said brand and create a market for it, reinforces the feeling
that it is not going to give in easily.
Southern region account for highest
consumption at ~38% of India's total
drinks volume
Western region constitute 27% of total
sales, second behind southern region
For Private Circulation OnlyApril 16, 2010 19
Also, while UTO markets only whisky under the Mansion House brand internationally, TI stopped
importing this concentrate from the former in 1991, and instead, developed its own blend of
whisky (as well as brand) under this brand. On its part, it is this IPR that TI will be depending.
Any unfavourable result for TI can have negative impact for the company as a whole.
Increase in key input prices
Currently, the key input for TI is molasses and going forward, grains will also be the key feedstock.
Any spurt in prices of key feedstock above our expectation, due to any reason, will have direct
impact on bottom line of the company.
Concentration of revenue in Southern Region
As more than 90% of revenue for the company comes from southern region, any decline in sales
in Southern region, due to any unavoidable circumstances, can hit the topline of the company
directly.
About Company
TI is one of the leading players in the Indian alcoholic beverage industry and manufactures Indian
Made Foreign Liquor (IMFL), with over 16 brands across a diverse range of price and product segments.
TI's primary manufacturing facility is located in at Shrirampur, Maharashtra. Currently, the company
has 100 KLPD molasses based and 100 KLPD grain based distillery. The company sells its products in
18 states through well knit sales and distribution network. Southern region is the main market which
contributes around 90% of the total sales. TI's Mansion House has held the unassailable position in
the premium brandy segment for many years. The company commands around 4% of the IMFL
market nationally.
History
Established in 1933 as Maharashtra Sugar Mills Ltd. (MSM), TI was named after the revered freedom
fighter Bal Gangadhar Tilak and was one of Maharashtra's first private sugar factories, which served
the nation for over five decades. Later on, TI moved to an the alcoholic beverage business.
Tilaknagar Distilleries & Industries Ltd. was promoted as a 100% subsidiary of The Maharashtra Sugar
Mills Ltd. The year 1973 saw TI diversify into the businesses of Industrial Alcohol, Indian Made
Foreign Liquor (IMFL) and Sugar Cubes, the company transitioned to the alcoholic the company
transitioned to the alcoholic beverage business in 1987. Both Maharashtra Sugar Mills Ltd. and
Tilaknagar Distilleries & Industries Ltd were merged to form Tilaknagar Industries Ltd. (TI) with effect
from August 6, 1993.
Key Management Personnel
Mr. Amit Dahanukar, MD & Chairman
Mrs. Shivani A Dahanukar, Executive Director
Mr. Lalit Sethi, CFO
For Private Circulation OnlyApril 16, 2010 20
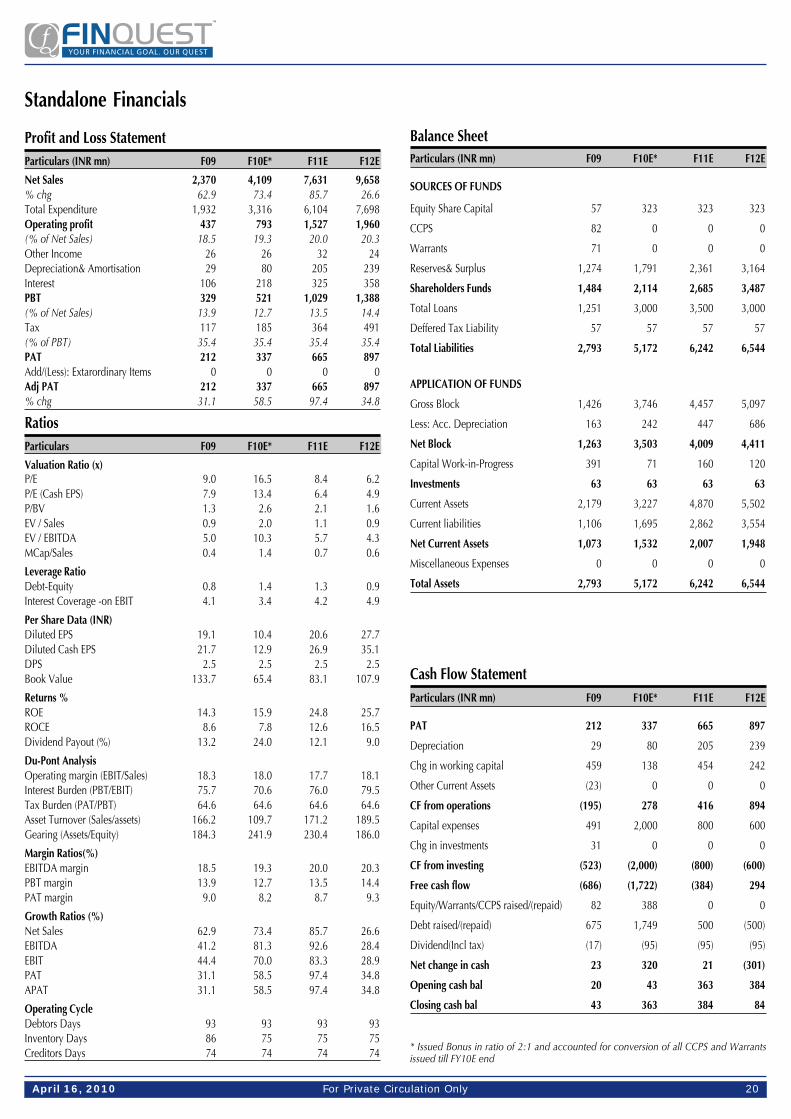
Profit and Loss StatementParticulars (INR mn) F09 F10E* F11E F12E
Net Sales 2,370 4,109 7,631 9,658% chg 62.9 73.4 85.7 26.6Total Expenditure 1,932 3,316 6,104 7,698Operating profit 437 793 1,527 1,960(% of Net Sales) 18.5 19.3 20.0 20.3Other Income 26 26 32 24Depreciation& Amortisation 29 80 205 239Interest 106 218 325 358PBT 329 521 1,029 1,388(% of Net Sales) 13.9 12.7 13.5 14.4Tax 117 185 364 491(% of PBT) 35.4 35.4 35.4 35.4PAT 212 337 665 897Add/(Less): Extarordinary Items 0 0 0 0Adj PAT 212 337 665 897% chg 31.1 58.5 97.4 34.8
RatiosParticulars F09 F10E* F11E F12E
Valuation Ratio (x)P/E 9.0 16.5 8.4 6.2P/E (Cash EPS) 7.9 13.4 6.4 4.9P/BV 1.3 2.6 2.1 1.6EV / Sales 0.9 2.0 1.1 0.9EV / EBITDA 5.0 10.3 5.7 4.3MCap/Sales 0.4 1.4 0.7 0.6
Leverage RatioDebt-Equity 0.8 1.4 1.3 0.9Interest Coverage -on EBIT 4.1 3.4 4.2 4.9
Per Share Data (INR)Diluted EPS 19.1 10.4 20.6 27.7Diluted Cash EPS 21.7 12.9 26.9 35.1DPS 2.5 2.5 2.5 2.5Book Value 133.7 65.4 83.1 107.9
Returns %ROE 14.3 15.9 24.8 25.7ROCE 8.6 7.8 12.6 16.5Dividend Payout (%) 13.2 24.0 12.1 9.0
Du-Pont AnalysisOperating margin (EBIT/Sales) 18.3 18.0 17.7 18.1Interest Burden (PBT/EBIT) 75.7 70.6 76.0 79.5Tax Burden (PAT/PBT) 64.6 64.6 64.6 64.6Asset Turnover (Sales/assets) 166.2 109.7 171.2 189.5Gearing (Assets/Equity) 184.3 241.9 230.4 186.0
Margin Ratios(%)EBITDA margin 18.5 19.3 20.0 20.3PBT margin 13.9 12.7 13.5 14.4PAT margin 9.0 8.2 8.7 9.3
Growth Ratios (%)Net Sales 62.9 73.4 85.7 26.6EBITDA 41.2 81.3 92.6 28.4EBIT 44.4 70.0 83.3 28.9PAT 31.1 58.5 97.4 34.8APAT 31.1 58.5 97.4 34.8
Operating CycleDebtors Days 93 93 93 93Inventory Days 86 75 75 75Creditors Days 74 74 74 74
Balance SheetParticulars (INR mn) F09 F10E* F11E F12E
SOURCES OF FUNDS
Equity Share Capital 57 323 323 323
CCPS 82 0 0 0
Warrants 71 0 0 0
Reserves& Surplus 1,274 1,791 2,361 3,164
Shareholders Funds 1,484 2,114 2,685 3,487
Total Loans 1,251 3,000 3,500 3,000
Deffered Tax Liability 57 57 57 57
Total Liabilities 2,793 5,172 6,242 6,544
APPLICATION OF FUNDS
Gross Block 1,426 3,746 4,457 5,097
Less: Acc. Depreciation 163 242 447 686
Net Block 1,263 3,503 4,009 4,411
Capital Work-in-Progress 391 71 160 120
Investments 63 63 63 63
Current Assets 2,179 3,227 4,870 5,502
Current liabilities 1,106 1,695 2,862 3,554
Net Current Assets 1,073 1,532 2,007 1,948
Miscellaneous Expenses 0 0 0 0
Total Assets 2,793 5,172 6,242 6,544
Cash Flow StatementParticulars (INR mn) F09 F10E* F11E F12E
PAT 212 337 665 897
Depreciation 29 80 205 239
Chg in working capital 459 138 454 242
Other Current Assets (23) 0 0 0
CF from operations (195) 278 416 894
Capital expenses 491 2,000 800 600
Chg in investments 31 0 0 0
CF from investing (523) (2,000) (800) (600)
Free cash flow (686) (1,722) (384) 294
Equity/Warrants/CCPS raised/(repaid) 82 388 0 0
Debt raised/(repaid) 675 1,749 500 (500)
Dividend(Incl tax) (17) (95) (95) (95)
Net change in cash 23 320 21 (301)
Opening cash bal 20 43 363 384
Closing cash bal 43 363 384 84
* Issued Bonus in ratio of 2:1 and accounted for conversion of all CCPS and Warrantsissued till FY10E end
Standalone Financials
For Private Circulation OnlyApril 16, 2010 21
DISCLAIMER: This document is not for public distribution and has been furnished to you solely for your information and must not be reproduced or redistributed to any other person. Persons into whose possession thisdocument may come are required to observe these restrictions. Opinion expressed is our current opinion as of the date appearing on this material only. While we endeavor to update on a reasonable basis the informationdiscussed in this material, there may be regulatory, compliance, or other reasons that prevent us from doing so. Prospective investors and others are cautioned that any forward-looking statements are not predictions and maybe subject to change without notice. Our proprietary trading and investment businesses may make investment decisions that are inconsistent with the recommendations expressed herein. The information in this documenthas been printed on the basis of publicly available information, internal data and other reliable sources believed to be true and are for general guidance only. While every effort is made to ensure the accuracy andcompleteness of information contained, the company takes no guarantee and assumes no liability for any errors or omissions of the information. No one can use the information as the basis for any claim, demand or causeof action. Recipients of this material should rely on their own investigations and take their own professional advice. Each recipient of this document should make such investigations as it deems necessary to arrive at anindependent evaluation of an investment in the securities of companies referred to in this document (including the merits and risks involved), and should consult their own advisors to determine the merits and risks of suchan investment. Price and value of the investments referred to in this material may go up or down. Past performance is not a guide for future performance. Certain transactions - futures, options and other derivatives as wellas non-investment grade securities - involve substantial risks and are not suitable for all investors. Reports based on technical analysis centers on studying charts of a stock’s price movement and trading volume, as opposedto focusing on a company’s fundamentals and as such, may not match with a report on a company’s fundamentals. We do not undertake to advise you as to any change of our views expressed in this document. While wewould endeavor to update the information herein on a reasonable basis, FINQUEST, its subsidiaries and associated companies, their directors and employees are under no obligation to update or keep the information current.Also there may be regulatory, compliance, or other reasons that may prevent FINQUEST and affiliates from doing so. Prospective investors and others are cautioned that any forward-looking statements are not predictionsand may be subject to change without notice. FINQUEST and affiliates, including the analyst who has issued this report, may, on the date of this report, and from time to time, have long or short positions in, and buy or sellthe securities of the companies mentioned herein or engage in any other transaction involving such securities and earn brokerage or compensation or act as advisor or have other potential conflict of interest with respect tocompany/ies mentioned herein or inconsistent with any recommendation and related information and opinions. FINQUEST and affiliates may seek to provide or have engaged in providing corporate finance, investmentbanking or other advisory services in a merger or specific transaction to the companies referred to in this report, as on the date of this report or in the past.
Outperformer Marketperformer Underperformer
More than 10% to Index Within 0-10% to Index Less than 0-10% to Index
RESEARCH
Chintan MewarVice President - Research4000 [email protected]
Sunny AgrawalAnalyst4000 [email protected]
Dinesh ShuklaAnalyst4000 [email protected]
Rajesh GhodkeProduction4000 [email protected]
ANALYST DISCLAIMER: Each analyst of FINQUEST Securities (P) Ltd. whose name appears on page 1 of the research reports accessible on this website hereby certifies that (i) the recommendations and opinionsexpressed in the research report accurately reflect the research analyst's personal views about any and all of the securities or issuers discussed herein that are within the analyst’s coverage universe and (ii) no part of theresearch analyst's compensation was, is, or will be, directly or indirectly, related to the provision of specific recommendations or views expressed by the research analyst in the research report.
FINQUEST Securities (P) Ltd.602 Boston House, Next to Cinemax, Suren Road, Andheri (East) Mumbai 400 093.Tel.: 91-22-4000 2600 Fax: 91-22-4000 2605 Email: [email protected]
Website: www.finquestonline.com
SALES
Uday KamatSenior Vice President - Institutional Sales4000 [email protected]
Jyoti NangraniTechnical Analyst4000 [email protected]
DEALING
Jackie GandhiInstitutional Dealer4000 [email protected]
Paras ShahInstitutional Dealer4000 [email protected]
Vikas MandhaniaInstitutional Dealer4000 [email protected]