tarrah declemente f&n 453 individual project thursday afternoon lab · · 2006-05-10f&n...
TRANSCRIPT

1
Tarrah DeClemente F&N 453 Individual Project Thursday Afternoon Lab Title: The Effect of Different Amounts of Gum Acacia (SuperWhite T) on Viscosity and
Mouthfeel of Diet Flavored Water
Abstract
The problem with many diet beverages is the lack of body and mouthfeel, and the bitter aftertaste
some have due to the sugar-replacer. By adding gum to these beverages the sensory appeal of
the product increases all the way from how the beverage looks to the taste of the beverage. By
making several solutions with varying amounts of gum and through objective and subjective
testing, the overall best product is determined; thus finding the correct amount of gum to add to a
solution to increase sensory appeal. Each solution undergoes a timed test through a burette and
is subjected to a sensory appeal card ranking each product on the Hedonic scale, ratings of
mouthfeel, thickness, and overall preference. The time it takes to run through the burette
increases with the increasing amount of gum. The sample with the most gum added is the least
liked throughout the experiment. Overall participants pick the control as the product preferred to
the solutions containing gum. The gum solution most preferred is that with the least amount of
gum added.
Introduction
The problem with many diet beverages is the lack of mouthfeel and the bitter aftertaste. By
adding a gum the beverage will become more viscous and the overall mouthfeel will be
improved. The gum used for this experiment was a new product called SuperWhite T, a type of
gum acacia that completely dissolves without tainting the flavor of the product. This gum was
2
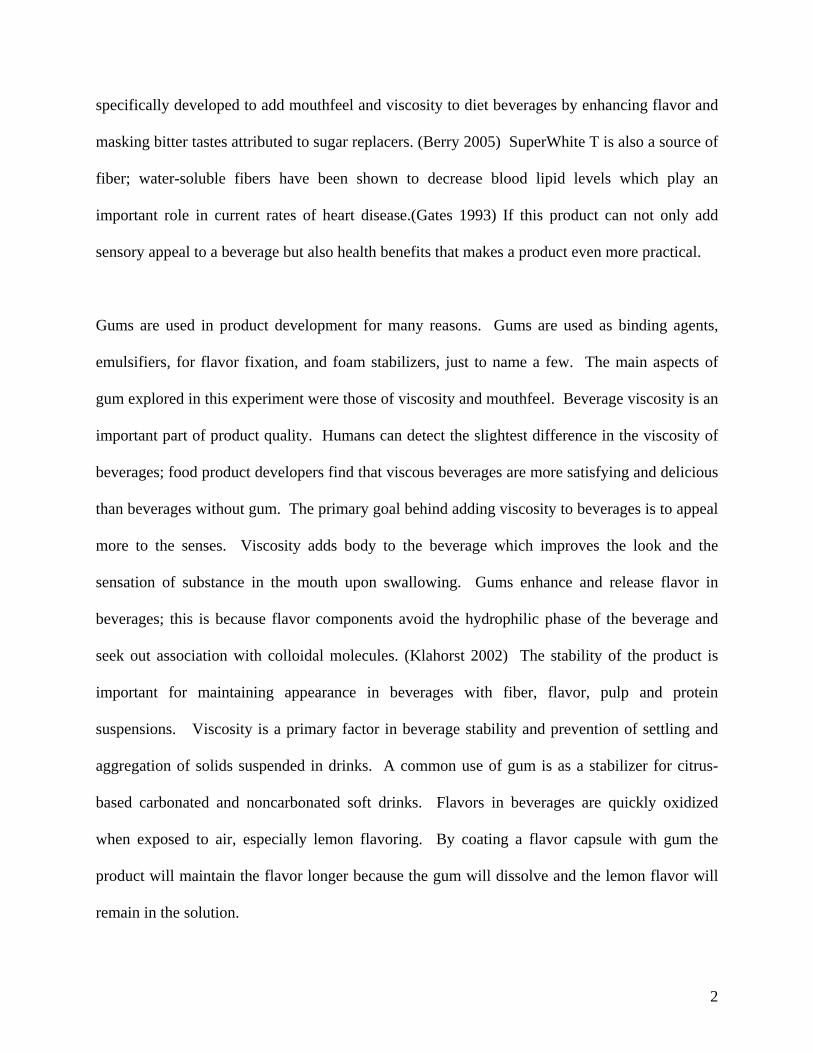
specifically developed to add mouthfeel and viscosity to diet beverages by enhancing flavor and
masking bitter tastes attributed to sugar replacers. (Berry 2005) SuperWhite T is also a source of
fiber; water-soluble fibers have been shown to decrease blood lipid levels which play an
important role in current rates of heart disease.(Gates 1993) If this product can not only add
sensory appeal to a beverage but also health benefits that makes a product even more practical.
Gums are used in product development for many reasons. Gums are used as binding agents,
emulsifiers, for flavor fixation, and foam stabilizers, just to name a few. The main aspects of
gum explored in this experiment were those of viscosity and mouthfeel. Beverage viscosity is an
important part of product quality. Humans can detect the slightest difference in the viscosity of
beverages; food product developers find that viscous beverages are more satisfying and delicious
than beverages without gum. The primary goal behind adding viscosity to beverages is to appeal
more to the senses. Viscosity adds body to the beverage which improves the look and the
sensation of substance in the mouth upon swallowing. Gums enhance and release flavor in
beverages; this is because flavor components avoid the hydrophilic phase of the beverage and
seek out association with colloidal molecules. (Klahorst 2002) The stability of the product is
important for maintaining appearance in beverages with fiber, flavor, pulp and protein
suspensions. Viscosity is a primary factor in beverage stability and prevention of settling and
aggregation of solids suspended in drinks. A common use of gum is as a stabilizer for citrus-
based carbonated and noncarbonated soft drinks. Flavors in beverages are quickly oxidized
when exposed to air, especially lemon flavoring. By coating a flavor capsule with gum the
product will maintain the flavor longer because the gum will dissolve and the lemon flavor will
remain in the solution.

3
To find the effects of gum on diet beverages SuperWhite T will be added to flavored water
solutions and be tested both objectively and subjectively. (Berry 2005) Each beverage will
contain the same amount of water, Splenda®, and lemon juice, the only varying part of the recipe
will be the amount of gum added. 50 mL of each solution will be run through a burette and
timed to gauge the viscosity of each beverage. Each beverage will also be subjectively tested
through the Hedonic scale and comparison testing of mouthfeel, thickness, and preference of
each beverage.
The independent variable is the amount of gum added; the dependent variables are mouthfeel and
viscosity. The objective of this experiment is to find the percent gum solution which provides
the most sensory quality product. The solutions containing gum acacia will provide a better
mouthfeel in comparison to the reference sample Nestle lemon water.
Methods
The overall design of the experiment includes making three lemon water solutions and varying
only the amount of gum in each. Each solution contains 500mL of filtered water, 4 grams of
Splenda®, and 11.8 grams of lemon juice. The amount of gum added will be 4.05 g in sample
one, 8.10 g in sample two, and 12.15 g in sample three. The solutions will be mixed and then
objectively tested using a burette. 50 mL of each solution will be run through the burette and
timed to see how long it takes for the entire solution to run through. The burette test is a “simple
and inexpensive technique for measurement of kinematic viscosity of liquids, based on the
discharge time of liquid through a standard glass burette.” (Igathinathane 2005) A sensory

4
scorecard will subjectively test each sample based on: Hedonic scale rating, mouthfeel,
thickness, and overall likeability.
Procedure
1. Obtain the reference sample (Nestle lemon water).
2. Using a Brita filter, filter 1500mL of tap water.
3. Using fresh lemons, cut the lemon into wedges and then squeeze the juice into a metal screen
sifter. This will prevent pulp from getting into the beverage. Filter as many times as necessary.
4. Prepare three sample solutions with the following recipe:
500 mL of filtered water
4 g Splenda® sweetener
11.8 g lemon wedges juice
5. Mix the water, Splenda®, and lemon juice together until all Splenda® is dissolved.
6. Once the basic solutions are made add the following amounts of SuperWhite T acacia gum
accordingly:
Sample 1: 4.05g
Sample 2: 8.10 g
Sample 3: 12.15 g
7. Mix samples first by hand, use a handheld mixer if all the gum will not dissolve. Sometimes
just letting the solutions sit for a few minutes allows the gum to absorb and dissolve on its own.
8. Once completely mixed, label samples with 3 digit sample code:

5
Sample Description
Amount of
Gum (g)
888 Control 0.00
642 1/2 Tbsp 4.05
712 1 Tbsp 8.10
596 1.5 Tbsp 12.15
9. Take a 50 mL sample of each solution and using a burette time how long it takes for each
solution to run through. Record this information.
10. Pour samples of each solution into small plastic soufflé cups.
11. Using a sensory score card conduct sensory tests to find the product with the most taste
appeal.

6
Sensory scorecard used for subjective testing:
Please mark the line next to the statement you agree with.
Which of the following samples do you like better? 888 or 596 642 or 712 Which sample has the best mouthfeel? ___ 642 ___ 888 ___ 712 ___ 596 Which sample tastes thicker? ___ 888 ___ 642 Which sample tastes thicker? ___ 642 ___ 596 Overall (considering taste and mouthfeel) which sample do you prefer? ___ 642 ___ 888 ___ 712 ___ 596
642 888 712 596 __Like extremely __Like very much __Like moderately __Like slightly __Neither like nor dislike __Dislike slightly __Dislike moderately __Dislike very much __Dislike extremely
__Like extremely __Like very much __Like moderately __Like slightly __Neither like nor dislike __Dislike slightly __Dislike moderately __Dislike very much __Dislike extremely
__Like extremely __Like very much __Like moderately __Like slightly __Neither like nor dislike __Dislike slightly __Dislike moderately __Dislike very much __Dislike extremely
__Like extremely __Like very much __Like moderately __Like slightly __Neither like nor dislike__Dislike slightly __Dislike moderately __Dislike very much __Dislike extremely
7
This experiment should be conducted three times using the exact same methods. When
conducting the subjective methods the samples should be lined up randomly and the control
should not be put either first or last. The order should be as follows: 642, 888, 712, and 596.
Sensory evaluators should take a sip of each solution and keep the sample in their mouth long
enough to evaluate the texture of the beverage. Evaluators may drink as much or as little of the
beverage sample as they would like.
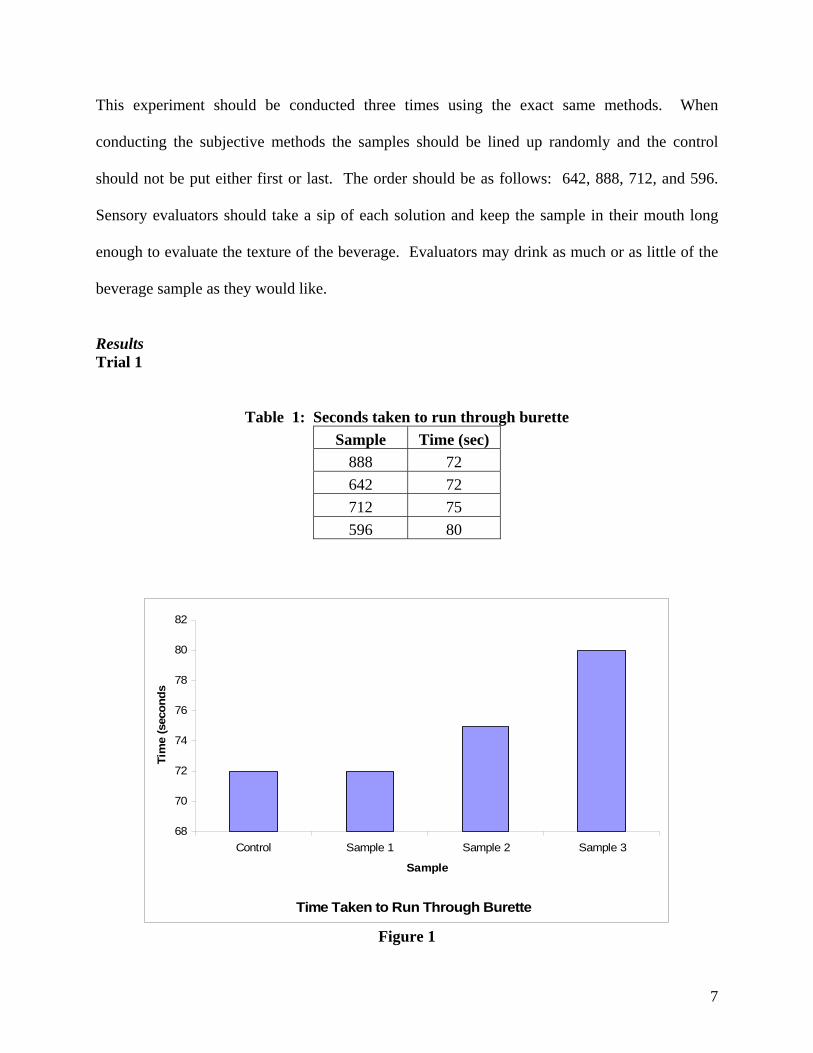
Results Trial 1
Table 1: Seconds taken to run through burette Sample Time (sec)
888 72 642 72 712 75 596 80
Time Taken to Run Through Burette
68
70
72
74
76
78
80
82
Control Sample 1 Sample 2 Sample 3
Sample
Tim
e (s
econ
ds
Figure 1

8
Table 2: Hedonic Scale Rating Responses
Hedonic Rating 642 888 712 596 Like extremely Like very much 2 4 2 1 Like moderately 4 4 2 1
Like slightly 2 1 3 2 Neither like nor
dislike 1 Dislike slightly 1 1 3 3
Dislike moderately 1 1 1 2 Dislike very much 2 Dislike extremely
Table 3: Sample Preferred in Comparison Tests Sample Preferred
642 4 888 9 712 1 596 1
Sample Preferred in Comparison Tests
0
1
2
3
4
5
6
7
8
9
10
Control Sample 1 Sample 2 Sample 3
Sample
Num
ber
of p
eopl
e th
at c
hose
sam
ple
Figure 2

9
Table 4: Number of Ratings for Best Mouthfeel Sample Best Mouthfeel
642 4 888 4 712 3 596
Amount of Ratings for Best Mouthfeel
0
0.5
1
1.5
2
2.5
3
3.5
4
4.5
Control Sample 1 Sample 2 Sample 3
Sample
Num
ber
of p
eopl
e th
at c
hose
sam
ple
Figure 3
Table 5: Number of ratings for Thicker Sample in Comparison Test
Sample Rated thicker
888 8
642 3

10
Amount of Ratings for Thickest (Comparison Test)
0
1
2
3
4
5
6
7
8
9
Control Sample 1
Sample
Num
ber o
f peo
ple
that
cho
se s
ampl
e
Figure 4
Table 6: Number of ratings for Thicker Sample in Comparison Test
Sample Rated thicker 642 3 596 8
Amount of Ratings for Thickest (Comparison Test)
0
1
2
3
4
5
6
7
8
9
Sample 1 Sample 3
Sample
Num
ber o
f peo
ple
that
cho
se s
ampl
e
Figure 5

11
Table 7: Number of Ratings for Overall Preference
Sample Overall
preference 642 2 888 5 712 3 596 1
Overall Preference of Samples
0
1
2
3
4
5
6
Control Sample 1 Sample 2 Sample 3
Sample
Num
ber o
f peo
ple
that
cho
se s
ampl
e
Figure 6
Trial 2
Table 8: Seconds taken to run through burette Sample Time (sec)
888 71 642 75 712 78 596 80

12
Time Taken to Run Through Burette
66
68
70
72
74
76
78
80
82
Control Sample 1 Sample 2 Sample 3
Sample
Tim
e (s
econ
ds
Figure 7
Table 9: Hedonic Scale Rating Responses
Hedonic Rating 642 888 712 596 Like extremely 1 Like very much 1 2 1 Like moderately 4 2 3
Like slightly 4 1 Neither like nor
dislike 1 1 2 3 Dislike slightly 3 3 2
Dislike moderately 3 Dislike very much 1 1 Dislike extremely 1
Table 10: Sample Preferred in Comparison Tests Sample Preferred
642 5 888 8 712 5 596 2

13
Sample Preferred in Comparison Test
0
1
2
3
4
5
6
7
8
9
Control Sample 1 Sample 2 Sample 3
Sample
Num
ber o
f peo
ple
that
cho
se s
ampl
e
Figure 8
Table 11: Number of Ratings for Best Mouthfeel Sample Best Mouthfeel
642 2 888 5 712 2 596 1

14
Amount of Ratings for Best Mouthfeel
0
1
2
3
4
5
6
Control Sample 1 Sample 2 Sample 3
Sample
Num
ber o
f peo
ple
that
cho
se s
ampl
e
Figure 9
Table 12: Number of ratings for Thicker Sample in Comparison Test
Sample Rated thickest
888 7
642 3
Amount of Ratings for Thickest (Comparison Test)
0
1
2
3
4
5
6
7
8
Control Sample 1
Sample
Num
ber o
f peo
ple
that
cho
se s
ampl
e
Figure 10
15
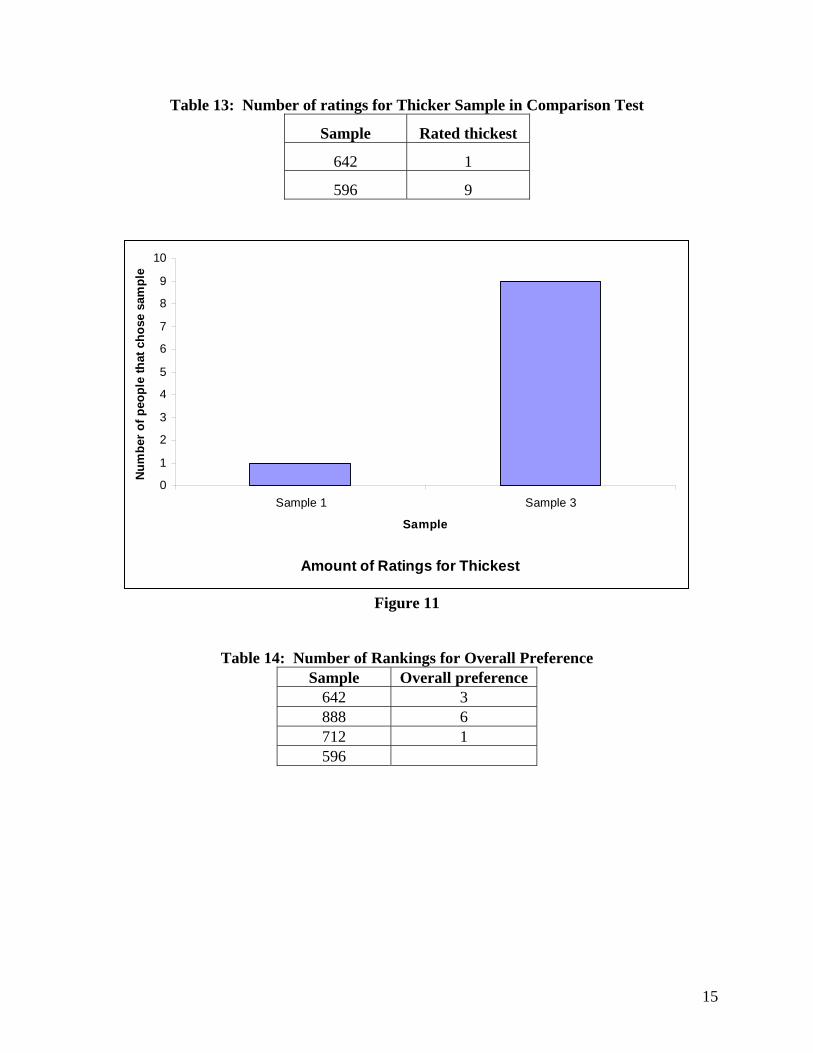
Table 13: Number of ratings for Thicker Sample in Comparison Test
Sample Rated thickest
642 1
596 9
Amount of Ratings for Thickest
0
1
2
3
4
5
6
7
8
9
10
Sample 1 Sample 3
Sample
Num
ber
of p
eopl
e th
at c
hose
sam
ple
Figure 11
Table 14: Number of Rankings for Overall Preference Sample Overall preference
642 3 888 6 712 1 596

16
Overall Preference of Samples
0
1
2
3
4
5
6
7
Control Sample 1 Sample 2 Sample 3
Sample
Num
ber
of p
eopl
e th
at c
hose
sam
ple
Figure 12
Discussion This experiment evaluated the sensory effects of gum acacia. Only two trials were conducted
because the original amounts of gum in the recipe were far too high and the solutions tasted
terrible. So the first trial was spent figuring out which variable amounts of gum to use. Trials 2
and 3 will be referred to as trials 1 and 2, were replicated and used objective and subjective
methods to obtain the results of this experiment.
The objective method used was the burette timing test. 50mL of each solution were ran through
the burette and timed. The results for the burette test from trial 1 can be found in table 1. As
seen in table 1 samples 888 and 642 took 72 seconds to empty out of the burette. Sample 712
took 75 seconds and sample 596 took 80 seconds. For trial 2 the results can be found in table 8.
Sample 888 took 71 seconds, sample 642 took 75 seconds, sample 712 took 78 seconds, and
sample 596 took 80 seconds to run through the burette. Figures 1 and 7 compare the results

17
graphically, again showing how long each sample took to run through the burette. The control
sample (888) took the least amount of time to run through, the solution made with the least
amount of gum took the same amount of time as the control in trial one, but four seconds longer
in trial 2. The solution with the second highest amount of gum took longer than both solutions
with less gum added, and the sample with the most amount of gum (596) took the longest to run
through the burette in both trials. These results comply with the idea that the more gum added
the more viscous the solution will become. A thicker solution will take a longer time to run
through the burette. This "time-dependent thickening flow behavior" was demonstrated in a
study done on the structure of acacia gums and the effect on fluid activity. (Lefebvre 2002)
The subjective tests were a little more involved and asked participants to rank the beverage
solutions on the Hedonic scale, choose which solution they preferred in a comparison test,
compare thicknesses of beverages, and choose an overall preferred solution. The first sensory
evaluation was the hedonic scale which had participants rank solutions on a likeability scale.
Trial 1 results can be seen in table 2. For sample 642 the results were: two participants liked the
solution very much, four liked the solution moderately, two liked the solution slightly, one
neither liked nor disliked the solution, one disliked the solution slightly, and one disliked the
solution moderately. For sample 888 the results were: four participants liked the solution very
much, four liked the solution moderately, one liked the solution slightly, one disliked the
solution slightly, and one disliked the solution moderately. For sample 712 the results were: two
participants liked the solution very much, two liked the solution moderately, three liked the
solution slightly, three disliked the solution slightly, and one disliked the solution moderately.
For sample 596 the results were: one participant liked the solution very much, one liked the

18
solution moderately, two liked the solution slightly, three disliked the solution slightly, two
disliked the solution moderately, and two disliked the solution very much.
Trial 2 results can be found in table 9. For sample 642 the results were: one participant liked the
solution very much, four liked the solution moderately, four liked the solution slightly, and one
neither liked nor disliked the solution. For sample 888 the results were: one participant liked the
solution extremely, two liked the solution very much, two liked the solution moderately, one
neither liked nor disliked the solution, three disliked the solution slightly, and one disliked the
solution extremely. For sample 712 the results were: three liked the solution moderately, one
liked the solution slightly, two neither liked nor disliked the solution, three disliked the solution
slightly, and one disliked the solution very much. For sample 596 the results were: one liked the
solution very much, three neither liked nor disliked the solution, two disliked the solution
moderately, three disliked the solution slightly, and one disliked the very much.
Overall these results show that participants favored the control (888) and the solution with the
least amount of gum (642). The solution that was the most highly disliked was solution 596,
which contained the highest amount of gum. Participants stated that the solution had a strange
taste similar to a chalky, dusty taste. Sample 712 was equally ranked on both the like and dislike
portion of the scale with two participants in the middle, having no preference. Many of the
participants stated that they liked 888 the best because it tasted like Propel lemon water, a
Gatorade product; whereas some participants stated they disliked the control due to the funny
aftertaste, which can be attributed to the sugar replacer.

19
The next subjective tests were comparison tests for likeability. Samples 888 and 596 were put
together, and samples 642 and 712 were put together. This was designed to see which sample
participants preferred between the two middle solutions. Table 4 shows the results from trial 1:
sample 642 was picked four times over 712 which was chosen once. Nine participants chose
sample 888 over 596 which was chosen once. Some participants were confused by the way the
question was setup on the survey. All four samples were listed beneath the question asking
participants to choose which sample they liked better; some participants only circled one of the
four. For trial 2 the results can be seen in table 10. The results between 888 and 596 showed
again an overwhelming preference to the control with eight participants choosing 888 and two
choosing 596. The results were split between 642 and 712 with five participants choosing each
respectively. Figures 2 and 8 show the results of these trials graphically and it is easy to judge
which solutions were preferred.
The next question asked which sample provided the best mouthfeel. Texture and mouthfeel are
fundamental sensory properties of foods and beverages. (Guinard 1996) All solutions were
evaluated at once. The trial 1 results can be seen in table 4 and figure 3. Sample 642 was chosen
as having the best mouthfeel by four participants, sample 888 was also chosen by four
participants, and sample 712 was chosen by three participants. Sample 642 had the least amount
of gum added and therefore the closest in composition to the control, so it is not surprising that
this sample was the picked the most. For this test it is possible that participants still were swayed
by the taste of each sample. Table 11 and figure 9 show the results from trial 2. Sample 642 was
picked by two participants, sample 888 was chosen by five participants, table 712 was chosen by
two participants, and one participant chose sample 596. Again the control was the most popular

20
choice but in actuality, had the least mouthfeel because there was no gum in this product. This
may also be an indication that participants are choosing based on the taste of the product.
Next participants were asked to choose which sample tasted thicker in two comparison tests,
testing samples 888 and 642, and then 642 and 596. Trial one results are in tables 5 and 6 and
figures 4 and 5. For the first comparison eight participants chose sample 888 as being thicker
than 642, which was chosen by three participants. The second comparison results were that eight
participants chose 596 as being thicker than 642 which was chosen by three participants. These
results go along with what is true, 596 has the most amount of added gum and is the thicker
solution over 642. The control (888) and sample 642 are very similar in content, but 642 is
thicker. Trial 2 results can be found in table 12 and 13 and figures 10 and 11. Seven participants
chose sample 888 as being thicker than 642 which was chosen by three participants. The second
comparison test results were nine participants choosing 596 as thicker than 642 which was
chosen by one participant. Again this goes with what is true, 596 contains the most gum and is
the thickest of all the solutions.
Participants were finally asked to choose which sample they preferred overall. Trial 1 results can
be found in table 7 and figure 9. Overall the most participants preferred the control with five
participants, 712 was ranked next with three participants, 642 next with two, and 596 last with
one participant preferring it most to the other samples. Trial 2 results can be found in table 14
and figure 12. Overall six participants chose the control sample (888), next was 642 with three
participants, and next was 712 with one participant. So based on both trials the control sample
was preferred to any of the samples containing gum. The solution with the least amount of gum

21
was liked best overall with five participants ranking it for the overall preference, 712 had four
participants’ preferences, and 596 was liked the least with only one participant liking it the most.
The hypothesis for this experiment was that the products containing gum would provide a better
mouthfeel in comparison to the reference sample Nestle lemon water. Participants chose the
control substance as having the best mouthfeel, and as the overall preferred sample, so this
hypothesis was not proven to be correct.
If this experiment could be done again, the control sample would be made the same way as the
other samples with no gum added. By having a control sample that is a product on the market it
was difficult to compare homemade samples to the overall quality of the machine made product.
Many participants commented positively on the taste of the control (888) because it reminded
them of a product they had already consumed. Another factor that adds to the results varying or
not being quite right is the fact that the sensory evaluators were not consistent between both trials
and were untrained students. As stated in a Food Product Design article talking about the
importance of sensory panels and how to properly compose a panel: “To make the results of
sensory testing most useful, they have to be consistent. To achieve consistency, the sensory panel
must be carefully selected or the information may be skewed.” (Hegenbart 1992) The flavor of
water is mainly determined by its mouthfeel and this should be the main concern when
comparing water. (Mischa 2005) From all of the tests performed evaluating sensory appeal it is
clear that the participants in this experiment did not take to the solutions containing gum.
Perhaps if doing this experiment over by adding food coloring participants would not think of the
solution as water, and would not then have that comparison in their mind. If the solutions were

22
colored participants would think more of juices or other noncarbonated beverages and in this
sense may become more aware of mouthfeel instead of thinking of the mouthfeel of water. Also
the question that participants were confused by on the survey should be broken up into two
questions, so that one of each comparison is chosen.
References Berry, Donna. 2005. Through Thick and Thin. Food Product Design. Vol. 15 Issue 2, 35-55. Chambrun, J. and Millery, J. 2001. Liquid compositions, especially beverages, comprising at least two distinct phases forming a motif, and their manufacture. Patent application. Dunnewind, B., Janssen, A., Vliet, T., Weenen, H. 2004. Relative importance of cohesion and adhesion for sensory stickiness of semisolid foods. Journal of Texture Studies. Vol. 35, Issue 6, 603-620. Gates, J.E., A.F. Miller, C.D. Jensen, and J.H. Whittam. 1993. The effect of acacia gum and water-soluble dietary fiber mixture on blood lipids in humans. Journal of the American College of Nutrition. Vol. 12, Issue 2, 147-54.
Guinard, J. and Mazzucchelli, R. 1996. The sensory perception of texture and mouthfeel. Trends in Food Science and Technology. Volume 7 Issue 7, 213-219.
Hegenbart, S. 1992. An Inventory of the Toolbox. Food Product Design. http://www.foodproductdesign.com/archive/1992/0592CS.html
Igathinathane, C., Malleswar, V., Rao, A., Pordesimo, L., Womac, A. 2005. Viscosity Measurement Technique Using Standard Glass Burette for Newtonian Liquids. Instrumentation Science & Technology. Volume 33, 101-125.
Klahorst, S. 2002. Beverage Viscosity, Any Way You Like It! Food Product Design. http://www.foodproductdesign.com/archive/2002/0102AP.html. Lefebvre, Jaques, Denis Renard, Paul Robert, Christian Sanchez, Christophe Schmitt. 2002. Structure and rheological properties of acacia gum dispersions. Food Hydrocolloids. Vol. 16 Issue 3, 257-67. Mascha, M. 2005. Mouthfeel – a Strange but Important Word for Water Connoisseurs. Fine Waters.