tata asset management limited - wirc-icai.org secured borrowing / lending overnight 14 days ......
TRANSCRIPT

TATA ASSET MANAGEMENT LIMITEDDEBT FUNDS – AN INTRODUCTION
TATA ASSET MANAGEMENT LIMITEDDEBT FUNDS – AN INTRODUCTION

Disclaimer: The views expressed in this article are in no way trying to predictthe markets or to time them. The views expressed are for information purposeonly and do not construe to be any investment, legal or taxation advice. Anyaction taken by you on the basis of the information contained herein is yourresponsibility alone and Tata Asset Management will not be liable in anymanner for the consequences of such action taken by you. Please consult yourFinancial/Investment Adviser before investing. The views expressed in thisarticle may not reflect in the scheme portfolios of Tata Mutual Fund.
Risk Factor: Mutual Fund investments are subject to market risks, read allscheme related documents carefully

TYPE OF FUNDS
Equity funds
Money market funds
Debt (Income) funds
Gilt funds
Hybrid funds
Commodity funds
Real estate funds
Equity funds
Money market funds
Debt (Income) funds
Gilt funds
Hybrid funds
Commodity funds
Real estate funds

DEBT INSTRUMENTS
Debt instruments are essentially an IOU, with an undertaking as regards interest payment andrepayment of principal amount borrowed after a specified period.
Debt instruments are usually considered “safer” than equities because of lower volatility..They generally have lower return on investment than equities.
4

WHY INVEST IN DEBT INSTRUMENTS?
Periodic interest over the life of asset
Risks are lower
Loss of Principal unlikely (Sovereign Bonds)
Receipt of principal on Maturity
Appeals risk averse investors
5
Periodic interest over the life of asset
Risks are lower
Loss of Principal unlikely (Sovereign Bonds)
Receipt of principal on Maturity
Appeals risk averse investors

SHORT TERM DEBT MARKET&
INSTRUMENTS
6
SHORT TERM DEBT MARKET&
INSTRUMENTS

Creates Equilibrium by evening out surplus/deficits
Focal point for RBI (liquidity) intervention
Access to short term money at reasonable price
Enabling matching of assets & liabilities
Avenue for short term funds deployment
Indicates state of the economy Based on liquidity RBI conducts Government Borrowing through auctions - private placement
MONEY MARKET INSTRUMENTS
7
Creates Equilibrium by evening out surplus/deficits
Focal point for RBI (liquidity) intervention
Access to short term money at reasonable price
Enabling matching of assets & liabilities
Avenue for short term funds deployment
Indicates state of the economy Based on liquidity RBI conducts Government Borrowing through auctions - private placement

INVESTMENT OPTIONS
Money Market Securities Treasury Bills Repo & Reverse Repo CBLO Commercial Paper Certificate of Deposit
Other Securities Fixed rate bond Floating rate bond Securitized Paper (PTC)
Without Securities Call Money, Notice, Term Money
8
Money Market Securities Treasury Bills Repo & Reverse Repo CBLO Commercial Paper Certificate of Deposit
Other Securities Fixed rate bond Floating rate bond Securitized Paper (PTC)
Without Securities Call Money, Notice, Term Money
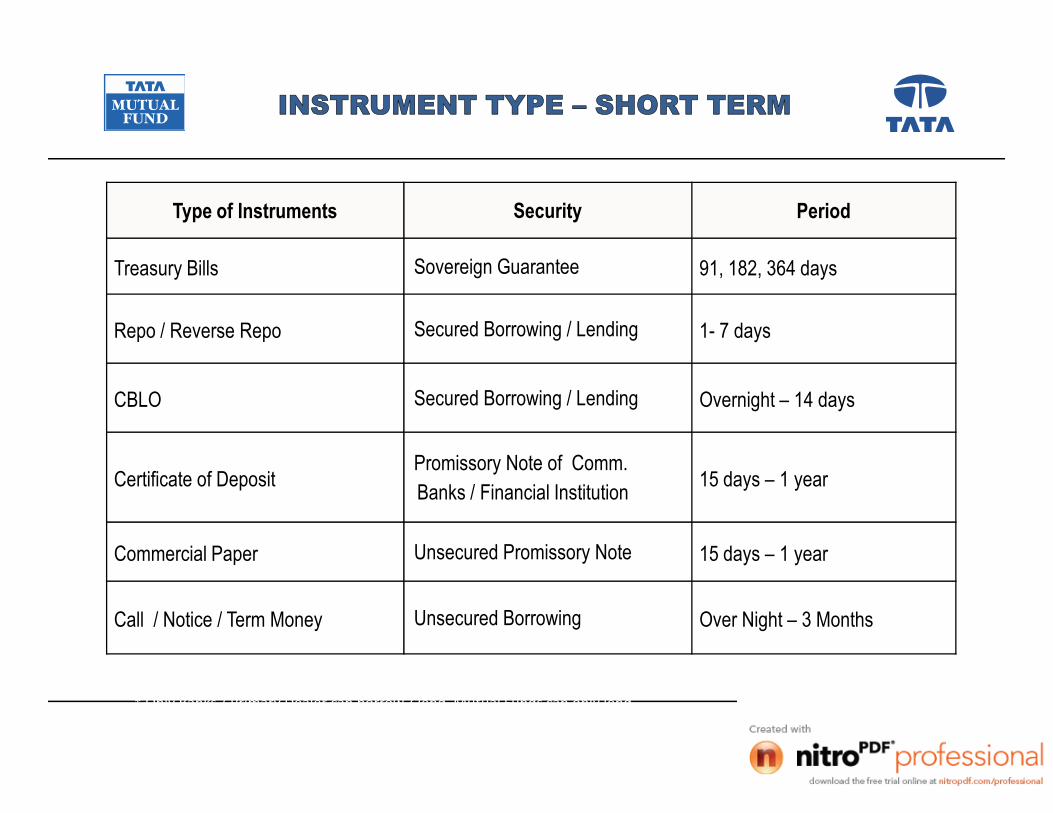
INSTRUMENT TYPE – SHORT TERM
Type of Instruments Security Period
Treasury Bills Sovereign Guarantee 91, 182, 364 days
Repo / Reverse Repo Secured Borrowing / Lending 1- 7 days
CBLO Secured Borrowing / Lending Overnight – 14 daysCBLO Secured Borrowing / Lending Overnight – 14 days
Certificate of DepositPromissory Note of Comm.Banks / Financial Institution 15 days – 1 year
Commercial Paper Unsecured Promissory Note 15 days – 1 year
Call / Notice / Term Money Unsecured Borrowing Over Night – 3 Months
* Only Banks / Primary Dealer can borrow / lend. Mutual Funds can only lend.# CDs can be issued by Financial Institutions for minimum of 1 year & maximum of 3 years.
LONG TERM DEBT MARKET&
INSTRUMENTS
10
LONG TERM DEBT MARKET&
INSTRUMENTS

INSTRUMENT TYPE – LONG TERM
Type of Instruments Security Period
Govt. Securities Sovereign Guarantee 1-30 years
Bonds from PSUs Secured Above 1 year
11
Bonds from Financial Institutions Secured Above 1 year
Secured Debenture Mortgage of Assets Above 1 year
Securitized Debt (Pass ThroughCertificates)
As per the underlying Asset Above 1 year
* Ratings of the bonds are of primary importance before investing
UNDERSTANDING RISKS
12
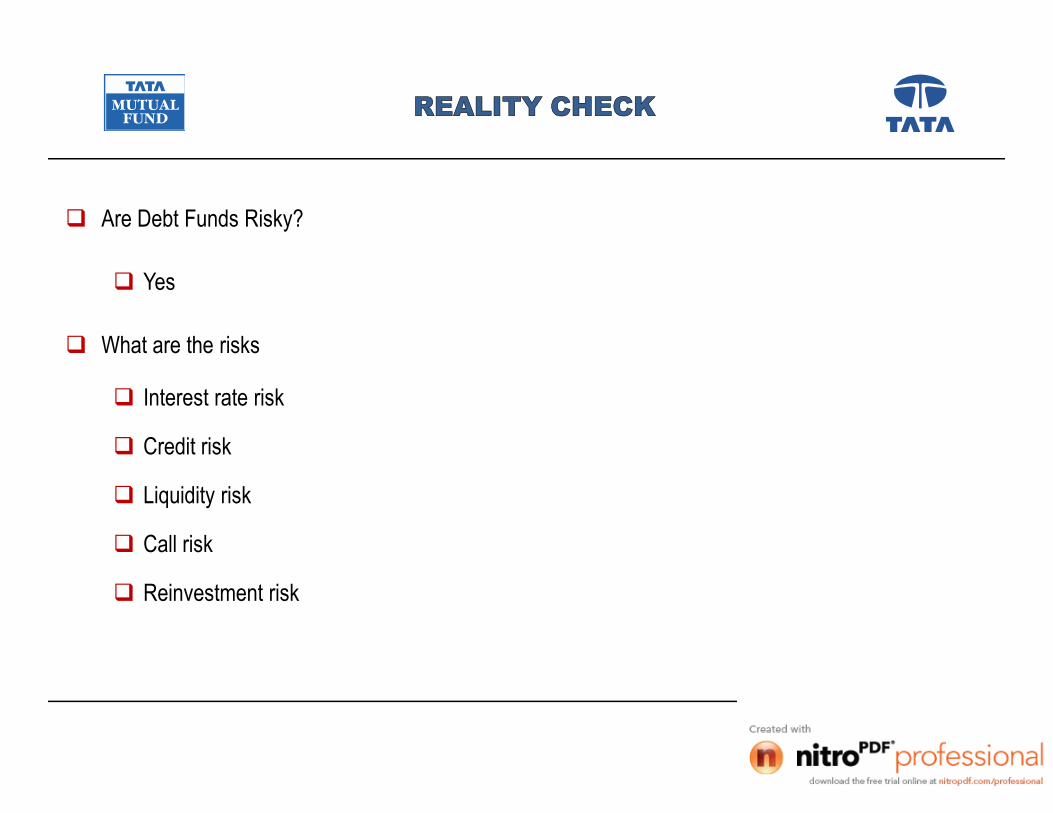
Are Debt Funds Risky?
Yes
What are the risks
Interest rate risk
Credit risk
Liquidity risk
Call risk
Reinvestment risk
REALITY CHECK
13
Are Debt Funds Risky?
Yes
What are the risks
Interest rate risk
Credit risk
Liquidity risk
Call risk
Reinvestment risk

INTEREST RATE RISK
Change in price caused due to change in interest rate
InterestRateFallsby
2.0%
InterestRateRises
by1.5%
D a te 1 -Ja n -0 5C o u p o n 8 %S e c u rit ie s C G 2 0 1 0M k t V a lu e 1 0 0Y ie ld 8 .0 0 %
InterestRateFallsby
2.0%
InterestRateRises
by1.5%
D a te 1 -J a n -0 6C o u p o n 8 %S e c u rit ie s C G 2 0 1 0M k t V a lu e 9 8 .1 4Y ie ld 9 .5 0 %
D a te 1 -J a n -0 6C o u p o n 8 %S e c u rit ie s C G 2 0 1 0M k t V a lu e 1 1 2 .5 3Y ie ld 6 .0 0 %
D a te 1 -Ja n -0 5C o u p o n 8 %S e c u rit ie s C G 2 0 1 0M k t V a lu e 1 0 0Y ie ld 8 .0 0 %

CREDIT RISK
Default
Credit Spread
Issuer Fails to meet Debt Obligation in a timely manner
Risk Premium required for particular corporate bond increases, leading toprice reduction in existing bonds
Down-grade
Risk Premium required for particular corporate bond increases, leading toprice reduction in existing bonds
Rating agency could lower the rating, increasing the credit spread, causingthe yield to go up & price to come down

CREDIT RISKS
In India issuance and trading are skewed towards high credit quality bonds
Over 90% of secondary market activity is in AAA or AA+ category
Drop in credit quality leads to significant drop in liquidity
Debt funds do not hold low credit quality bonds, even if the yields are attractive
16
In India issuance and trading are skewed towards high credit quality bonds
Over 90% of secondary market activity is in AAA or AA+ category
Drop in credit quality leads to significant drop in liquidity
Debt funds do not hold low credit quality bonds, even if the yields are attractive

TYPES OF RISK
Liquidity Risk
100 101 102 103 104 105 106 107 108
Bid: Price at which aperson is willing to
BUY
Ask: Price at whicha person is willing to
SELL
17
Bid: Price at which aperson is willing to
BUY
Ask: Price at whicha person is willing to
SELL
The wider the spread the lower are the chances of a realizing Fair Value of the Bond
It is an important consideration for investor looking to capitalize from market movement
Liquidity Risk is a function of Following factors
Expectation Ofinterest rate change
Number of MarketMaker
Comfort level withIssuer

LIQUIDITY RISK
The risk that arises due to difficulty in selling security in the secondary market.
The risk arises due to:-
Secondary debt market is non vibrant
Expectation of interest rate change
Comfort level with the issuer
Inadequate floating stock
Banks classification into HTM category
18
The risk that arises due to difficulty in selling security in the secondary market.
The risk arises due to:-
Secondary debt market is non vibrant
Expectation of interest rate change
Comfort level with the issuer
Inadequate floating stock
Banks classification into HTM category

LIQUIDITY RISK – ILLIQUID BONDS
Bond portfolio’s may have bonds that are illiquid
Fund Manager may have bought the same for yield enhancement
Valuation risk on these bonds are very high
Every day the value is arrived at using the CRISIL/ICRA valuer
Spread takes into account the liquidity premium
When one tries to sell the bond realized price may be lower than value used till then
This will create a drop in NAV and affecting existing investors
19
Bond portfolio’s may have bonds that are illiquid
Fund Manager may have bought the same for yield enhancement
Valuation risk on these bonds are very high
Every day the value is arrived at using the CRISIL/ICRA valuer
Spread takes into account the liquidity premium
When one tries to sell the bond realized price may be lower than value used till then
This will create a drop in NAV and affecting existing investors

CALL RISK
Call risk pertain to Callable Bonds designated by the issuer as being subject to payment of theprincipal earlier than the date of maturity.
The call option to redeem a bond is exercised by the issuer, if interest rates decline, so that thebonds can be reissued at a lower rate of interest.
20

TYPES OF RISK
Call Risk
Yr 1 Yr2 Yr3 Yr4 Yr5 Yr6 Yr7 Yr8 Yr9
8% < 8%
Call Protection Period
Bonds with call option embedded often pay a higher coupon to compensate for call risk
Issuers exercise call option to take advantage of falling interest rates by re-financing
EmbeddedCall Option

REINVESTMENT RISK
The risk that future proceeds will have to be reinvested at a lower interest rate.
It is evident during periods of falling interest rates where the coupon payments receivedare reinvested at rate of interest less than the one invested at the time of purchase ofsecurity.
22

TYPES OF RISK
Reinvestment Risk
9% 9% 9%
8% 7% 6%
6% 6% 6%
23
9% 9% 9%
Current Income & Reinvestment fromCURRENT BOND
Interest Income fromNEW BOND
6% 6% 6%
Rollover

TYPES OF DEBT FUNDS
24

RISK PROFILE – LIQUID & DEBT SCHEMES
Liquid Funds Ultra ShortTerm Funds
Short TermFunds
Income Funds MediumTerm Funds
DynamicBond Funds
Long termGilt Funds
Typical Interest Risk Profile Debt Funds
25Note: The above Risk profiling is for illustration purpose only.
Strictly for Private Circulation
Liquid Funds Ultra ShortTerm Funds
Short TermFunds
Income Funds MediumTerm Funds
DynamicBond Funds
Long termGilt Funds
Typical Interest Risk Profile Debt Funds

DEBT FUNDS
Invests in debt instruments, Lower end of risk, Target at income flow
TypesIncome Funds
Invests in all available types of debts, Less risky
Focused debt funds Invests in specific pre-defined sector or type, e.g.. Investing only in Corporate debenture
and bonds or Tax free infrastructure or Municipal bonds, Riskier than diversified fund
High yield debt funds Invests in ‘below investment grade’ instruments seeking higher return. Highly risky
DEBT FUNDS
Debt funds comes across 2 types of risks.
Credit riskCredit risk refers to financial stability of a corporate which usually rated by reputed credit ratingagencies
Interest rate riskIt is managed dynamically by a fund Manager forecasting the interest rate movements and also ofthe yield to maturity periods of the portfolio
DEBT PORTFOLIO
May be secured or unsecured
Money Market Sec - Maturities up to 1 year
Debt sec - Maturities more than 1 year
Types Certificate of Deposit, Commercial Paper, Corporate Debenture, Floating Rate Bonds,
Govt. Securities, Treasury Bills, Banks/FI Bonds, PSU Bonds
May be secured or unsecured
Money Market Sec - Maturities up to 1 year
Debt sec - Maturities more than 1 year
Types Certificate of Deposit, Commercial Paper, Corporate Debenture, Floating Rate Bonds,
Govt. Securities, Treasury Bills, Banks/FI Bonds, PSU Bonds

LIQUID/MONEY MARKET FUND
Invests in securities of short-term nature (less than 90days residual maturities) like TB, CD, CP andInter-bank call money
Highly liquid, Safety of principal
Lowest rung in the order of risk level
Typical Portfolio average maturity ranges within 90 days
Invests in securities of short-term nature (less than 90days residual maturities) like TB, CD, CP andInter-bank call money
Highly liquid, Safety of principal
Lowest rung in the order of risk level
Typical Portfolio average maturity ranges within 90 days

ULTRA SHORT TERM FUNDS
Invests in securities of short-term nature (less than 1 yr) like NCDs,TB, CD, CP and Inter-bank call money
High to moderately liquid, Low risk of principal loss in the short term
Lower in the order of risk level
Typical Portfolio average maturity ranges between 3mths to 1yr
Invests in securities of short-term nature (less than 1 yr) like NCDs,TB, CD, CP and Inter-bank call money
High to moderately liquid, Low risk of principal loss in the short term
Lower in the order of risk level
Typical Portfolio average maturity ranges between 3mths to 1yr

SHORT TERM BOND FUNDS
Invests in securities of short-term nature (between 1 to 5yrs) like NCDs, CD, CP and G-secs
Moderately liquid, Low risk of principal loss over the medium term
Moderate in the order of risk level
Typical Portfolio average maturity ranges between 1yr to 3yrs
Invests in securities of short-term nature (between 1 to 5yrs) like NCDs, CD, CP and G-secs
Moderately liquid, Low risk of principal loss over the medium term
Moderate in the order of risk level
Typical Portfolio average maturity ranges between 1yr to 3yrs

SHORT TERM BOND FUNDS
Return is made of two component-
Accrued Interest Income
Capital Gain (Loss) due to changes in yield
Valuation is done every business day based on market yields
Price and yields are inversely related
Instruments with shorter tenor have lower MTM risk
32
Return is made of two component-
Accrued Interest Income
Capital Gain (Loss) due to changes in yield
Valuation is done every business day based on market yields
Price and yields are inversely related
Instruments with shorter tenor have lower MTM risk

INCOME FUNDS
Invests in securities of medium to long term nature (between 4 to 15yrs) like NCDs, CD, CP and G-secs with an objective to earn capital appreciation
Moderate to low liquidity, Moderate to high risk of principal loss over the short term
Moderate to high in the order of risk level
Typical Portfolio average maturity ranges between 4yrs to 12yrs

MEDIUM TO LONG TERMFUNDS
Return is made of three component-
Accrued Interest Income
Capital Gain (Loss) due to changes in yield
Spreads between credit spread
Valuation is done every business day based on market yields
Price and yields are inversely related
Instruments with longer tenor have higher MTM risk
Debt funds are made of a bundle of cash flows that are managed and rearranged according tothe fund manager’s strategies.
34
Return is made of three component-
Accrued Interest Income
Capital Gain (Loss) due to changes in yield
Spreads between credit spread
Valuation is done every business day based on market yields
Price and yields are inversely related
Instruments with longer tenor have higher MTM risk
Debt funds are made of a bundle of cash flows that are managed and rearranged according tothe fund manager’s strategies.

MEDIUM TERM FUNDS
Invests in securities of medium to long term nature (between 4 to 15yrs) like NCDs, CD, CP and G-secs with an objective to earn predominantly accrual income
Moderate to low liquidity, Moderate to high risk of principal loss over the short term
Moderate to high in the order of risk level
Typical Portfolio average maturity ranges between 4yrs to 13yrs

CREDIT FUNDS
Invests in corporate securities of short to medium term nature (between 1 to 3yrs) like NCDs, CPswith an objective to earn predominantly accrual income
Low liquidity, High risk of principal loss over short to medium term
High in the order of risk level
Typical Portfolio average maturity ranges between 1yrs to 3yrs

GILT FUNDS
Government securities with medium to long-term maturities
Issuer being Govt. - low default risk
Sensitive to interest rate levels
Prices fall when interest rate increases and vice versa
Government securities with medium to long-term maturities
Issuer being Govt. - low default risk
Sensitive to interest rate levels
Prices fall when interest rate increases and vice versa
LONG TERM FUNDS – RISKS
Bond fund performance depends on
Quality of the portfolio Yield of the portfolio Average Maturity and duration of the portfolio Ability of the fund manager to dynamically manager and take advantage of interest
rate changes
During the times of interest rates hardening long term bond funds under perform otherdebt instruments / funds and vice-versa
38
Bond fund performance depends on
Quality of the portfolio Yield of the portfolio Average Maturity and duration of the portfolio Ability of the fund manager to dynamically manager and take advantage of interest
rate changes
During the times of interest rates hardening long term bond funds under perform otherdebt instruments / funds and vice-versa

INVESTMENT MATRIX
CATEGORY RISING INTERESTRATE
STABLE INTERESTRATE
FALLING INTERESTRATE
Liquid Funds Yes Yes Yes
39
Income / Gilt Funds No Yes Yes
FMPs No Yes Yes

PERFORMANCE EVALUATION OF DEBT FUNDS
40

RISK IN STATISTICAL TERMS
Investments are based on expected returns Expected return are subjective and ever changing as per market conditions etc Expected Return = ∑ (Probability of Return) X ( Possible Return) For example: = (0.30)(10%) + (0.10)(-10%) + (0.60)(25%) = 19% Generally however, Mean returns are generally taken as proxy for forming expectations But would the investor be assured that he will get the mean returns as expected He may or May not: thus the uncertainty This uncertainty is the risk in statistics
Investments are based on expected returns Expected return are subjective and ever changing as per market conditions etc Expected Return = ∑ (Probability of Return) X ( Possible Return) For example: = (0.30)(10%) + (0.10)(-10%) + (0.60)(25%) = 19% Generally however, Mean returns are generally taken as proxy for forming expectations But would the investor be assured that he will get the mean returns as expected He may or May not: thus the uncertainty This uncertainty is the risk in statistics

Variance is a measure of deviation from mean Variance is calculated as sum of squared deviations from mean divided by n-1 Standard deviation is the variability/deviation of return from the ‘mean’ value and is
calculated as Square root of Variance Denotes Spread or Degree of variation and is the primary definition of risk in statistics Higher the standard deviation: Higher the risk is the simple rule Buy Why Consider Positive Deviation as Risk ?
VARIANCE AND STANDARD DEVIATION
Variance is a measure of deviation from mean Variance is calculated as sum of squared deviations from mean divided by n-1 Standard deviation is the variability/deviation of return from the ‘mean’ value and is
calculated as Square root of Variance Denotes Spread or Degree of variation and is the primary definition of risk in statistics Higher the standard deviation: Higher the risk is the simple rule Buy Why Consider Positive Deviation as Risk ?

SEMI STANDARD DEVIATION
Only the negative variances from the mean considered as risk
May not be suitable for analysis for a period when markets were overwhelmingly positive
Requires a longer set of data for meaningful result

Systematic RiskRisk which the entire market is
subject to
If invested in marketsNo escaping above risk
Measured by beta
Unsystematic Risk
Specific to a stock or instrument
Can be reduced by diversification
COMPONENTS OF RISK
Systematic RiskRisk which the entire market is
subject to
If invested in marketsNo escaping above risk
Measured by beta

HOW TO EVALUATE RISK AND RETURN?
One can look at the risk and return separately (Risk Return Matrix)
OR
Use some statistical ratios which combine both the features of risk and returnand give a composite figure which give ‘’risk adjusted returns’ per unit of risk’
One can look at the risk and return separately (Risk Return Matrix)
OR
Use some statistical ratios which combine both the features of risk and returnand give a composite figure which give ‘’risk adjusted returns’ per unit of risk’

RISK ADJUSTED RETURNS
Jensen’s Alpha: Mean Return of Y – Beta * Mean return of market
• Variation of Sortino - Replacement of Risk Free Rate with Minimum AcceptedReturn and Std Div with downside deviation to Minimum Accepted Return
what about alpha?

RISK ADJUSTED RETURNS
Square of correlation coefficient
Percentage/proportion of change in one variable that is related to/predictable from change in theother variable – Predictive power of a model
R-squared is a statistical measure that represents the percentage of a fund or security'smovements that can be explained by movements in a benchmark index

Period of Analysis (Min 1 year recommended)
Frequency of NAV picking ( daily, weekly, monthly etc.)
Appropriateness of benchmark used
Risk free rate of return
‘Comparison with ‘relevant peers’
RESULTS FROM STATISTICAL ANALYSISDEPEND UPON
Period of Analysis (Min 1 year recommended)
Frequency of NAV picking ( daily, weekly, monthly etc.)
Appropriateness of benchmark used
Risk free rate of return
‘Comparison with ‘relevant peers’

INFORMATION RATIO (IR)
Information Ratio (IR) calculates risk adjusted out-performance i.e. relative return per unit of risk Return per unit of risk undertaken for the alpha component
Formula is = Active Annualised Returns/Annualised standard deviation of monthly active returns(Tracking Error)
Where active returns = Fund returns – benchmark returns
Interpretation – Higher the better - If IR = 0 then no real value addition by active fundmanagement. An information ratio of 0.5 is considered good

DEBT FUND SELECTION
Fund Size
Fund Age
Relative yields,
Loads
Average Maturity
Peer group comparison
Tax implication
50
Fund Size
Fund Age
Relative yields,
Loads
Average Maturity
Peer group comparison
Tax implication

INVESTMENT PROCESS AND APPROACH
51
FUND OBJECTIVES & PHILOSOPHY
Objectives
Accrual / regular earnings
Capital Gains
Accruals and capital gains
Philosophy
Safety
Liquidity
Returns
52
Objectives
Accrual / regular earnings
Capital Gains
Accruals and capital gains
Philosophy
Safety
Liquidity
Returns
INVESTMENT PROCESS
Focus on Fundamentals
Macro & Micro
Exposure
Quantitative and Qualitative filters
Liquidity
Market depth & Positioning on liquidity – yield curve
Tenure
Different Strategies, Tactical plays, holding horizon
53
Focus on Fundamentals
Macro & Micro
Exposure
Quantitative and Qualitative filters
Liquidity
Market depth & Positioning on liquidity – yield curve
Tenure
Different Strategies, Tactical plays, holding horizon

INVESTMENT STRATEGY
Economic & Fundamental Factors
Top Down / Bottom up approach
Relative valuation (Rich / Cheap)
Technical Factors
Credit research inputs
Investment Universe
54
Economic & Fundamental Factors
Top Down / Bottom up approach
Relative valuation (Rich / Cheap)
Technical Factors
Credit research inputs
Investment Universe

REVIEW AND MONITORING
Objective and Strategy for individual fund
Regulatory limits
Internal Risk Management Guidelines
Soft compartments
Rebalancing
Adherence to limits and continuous surveillance
55
Objective and Strategy for individual fund
Regulatory limits
Internal Risk Management Guidelines
Soft compartments
Rebalancing
Adherence to limits and continuous surveillance

KEY CHALLENGES – LARGELY AROUNDLIQUIDITY
Liquidity – Open ended structure of the debt funds rely on a liquid market Debt portfolio largely skewed towards G-sec as they are more liquid Preference of large players such as Banks to hold securities in HTM category limits
the liquidity in G-sec Liquidity in corporate bond market very limited, only to AAA PSU bonds,
diversification of portfolio a major challenge Absence of an active CDS market limits credit risk appetite Lack of retail participation , Investor base dominated by Institutional Investors,
with short investment horizon Absence of an active CDS market limits credit riskappetite
56

THANK YOUTHANK YOU