tax ans structuring analysis report
TRANSCRIPT

TAX AND STRUCTURING ANALYSIS REPORT
Sample Business Somewhere, USA
813 8th Street, Suite # 550 Wichita Falls, Texas 76301-3318
www.waa-online.com (940) 322-5086

Sample Business
Report Prepared For:
Mr. and Mrs. Entrepreneur
Report Prepared By:
Monty W. Walker, CPA, CBI, BCB
Telephone: (940) 322-5086 Fax: (940) 322-5088
E-mail: [email protected]
WALKER ADVISORY ASSOCIATES
Mailing Address: Physical Address: P. O. Box 8066 813 8th Street, Suite # 550 Wichita Falls, TX 76307-8066 Wichita Falls, TX 76301-3318
www.waa-online.com

Table of Contents
TABLE OF CONTENTS .......................................................................... Page No.
PURPOSE ................................................................................................................... i
DISCLAIMER ............................................................................................................. ii
ABOUT WALKER ADVISORY ASSOCIATES ...........................................................iii
HOW TO REVIEW THIS REPORT ........................................................................... iv
BUSINESS INFORMATION.........................................................................................................1
SCENARIO NARRATIVES...........................................................................................................2 Scenario # 1..............................................................................................................................3 Scenario # 1..............................................................................................................................4 Scenario # 2..............................................................................................................................6 Scenario # 3..............................................................................................................................8 Scenario Recap .....................................................................................................................10
GENERAL INFORMATION APPLICABLE TO TRANSACTIONS.......................................11
CURRENT ASSETS .....................................................................................................................11 Cash and Cash Equivalents................................................................................................11 Accounts Receivable ............................................................................................................11 Inventory ..................................................................................................................................12 Work In Progress ...................................................................................................................13
TANGIBLE ASSETS.....................................................................................................................14 Personal Property..................................................................................................................14 Real Property..........................................................................................................................15
INTANGIBLE ASSETS ................................................................................................................17 Goodwill ...................................................................................................................................17 Going Concern Value ...........................................................................................................17 Workforce In Place ................................................................................................................17 Information Base....................................................................................................................18 Know-How ...............................................................................................................................18 Customer-Based Intangibles...............................................................................................18 Supplier-Based Intangibles .................................................................................................19 Licenses, Permits, and Other Rights Granted By Governmental Units ....................19 Covenants Not To Compete................................................................................................19

Franchises, Trademarks, and Trade Names...................................................................20 Contracts For Use Of, and Term Interests In, Other Code Section 197 Intangibles21
OTHER ITEMS AND TERMS ....................................................................................................23 Depreciation Recapture .......................................................................................................23 Earn-Out ..................................................................................................................................23 Installment Sale......................................................................................................................24 Like-Kind Exchange ..............................................................................................................24
SCENARIO SUPPORT SCHEDULES.......................................................................................25 Schedule Explanations.........................................................................................................25 Support Schedules - Scenario # 1 .............................................................................................27 Support Schedules - Scenario # 2 .............................................................................................36 Support Schedules - Scenario # 3 .............................................................................................45

Purpose
The purpose of this Tax and Structuring Analysis Report is to present three (3) or more structuring scenarios and related tax results associated with the presented scenario(s). This report is associated with the pending and or future divestiture opportunity of Sample Business “Business”.
The management of Tax and Structuring Matters is a proactive process but many business owners approach this is as a reactive process by putting these issues off until a potential Buyer is located or until a business closing is underway. This report will help the business’s owner(s) take a proactive approach to managing the Tax and Structuring Matters associated with the pending or future divestiture of the Business.
Understanding the level of net funds which will remain after applicable debt payments, transaction expenses and tax is critical and an essential knowledge component necessary to effectively negotiate a transaction.
In a transaction, the Seller and Buyer really have similar tax objectives. The Seller desires to maximize after-sale tax proceeds while the Buyer desires to maximize operational cash flow. Tax deductions impact both these areas which are influenced by the tax components of the structure used in the transaction.
Too often the Seller, Buyer and their respective advisors strive to WIN the tax game by trying to completely maximize all the tax benefits on one side of transaction. When negotiating a transaction the Seller and Buyer should not attempt to WIN the tax game but instead should work toward achieving some level of tax parity. Structuring design is what will help the Seller and Buyer achieve tax parity.
Seller and Buyer often overly focus on price when the true fact is the net results of a business transaction experienced by both Seller and Buyer is not driven by price alone but is driven by the transaction’s overall structuring design.
This report will present the benefit the Business’s Owner(s) will experience by integrating Tax and Structure related planning into a business divestiture.
Page i

Disclaimer
The scenarios presented in this report are not exhaustive and do not necessarily indicate the final structuring which may be most appropriate for a transaction associated with the Business. In fact, the final structuring for the Business will likely be some derivative of the options presented in this report supplemented with information uncovered during the course of Business’s transaction.
The appropriate structure for the Business Transaction will be the structure which most effectively and efficiently achieves both Business’s and Business Owner's goals.
A final analysis and associated tax calculation, based on the actual results of the Business’s divestiture transaction, will need to occur to determine the true final net tax implication.
Tax rates used in the calculations contained in this report are based on current published information and ASSUMED rates for future periods. Any change in a future assumed rate or in a tax bracket will cause the calculations associated therewith to change.
The results presented in the various scenarios within this report represent what potentially can occur if all the data and variables used end up being the actual data and variables which occur over time. Because some of the assumed data and variables and the application thereof will change, this report should not be looked upon as an absolute nor as a solution for the replacement to using the services of a competent tax advisor but instead should be used solely as a planning tool and guide.
Page ii

About Walker Advisory Associates
Walker Advisory Associates “WAA” is a small business advisory firm focused on providing Business Exit Planning and Transaction Support services to Small Business Entrepreneurs.
WAA supports Small Business Entrepreneurs throughout the country. Whether an Entrepreneur is a Current Business Owner or is in the process of Starting, Buying or Selling a business, he / she can benefit from the advisory services of an organization experienced in serving the unique needs of Business Entrepreneurs.
WAA’s flag ship and most sought after service is its Business Transaction Advisory Services. WAA works with Business Sellers, Business Buyers and their various advisors, such as Business Intermediaries, Accountants and Attorneys, to deal with the unique financial, tax, planning and procedural matters associated with Buying and Selling a business.
Buying or Selling a business is a very complex process. This is often one of the most significant financial events ever experienced for both the Buyer and Seller. Buyers often approach the process with a hope and desire of creating something better for their future while exposing themselves to a large investment and debt. Sellers want to capitalize on their years of hard work by receiving as much net after-tax cash as possible and also often see this as a way of securing their future.
As the size and/or complexity of a transaction increases, the need for creative and innovative structuring alternatives also increases. Structuring often requires balancing the buyer’s interest with those of co-investors, sellers, managers and lenders. There are a multitude of formats available for structuring business transactions. In fact, the net results of a business transaction experienced by both Seller and Buyer is not driven by price but is driven by the transaction’s overall structuring design.
WAA helps Entrepreneurs address these important matters and much more.
Page iii

Page iv
How To Review This Report
Consider the report to be broken into three (3) sections. Section 1 covers the title page through the end of the Structuring Scenario Narratives. Section 2 covers the General Information Applicable to Transactions. Section 3 covers Scenario Support Schedules. Section 1 contains a narrative for each respective scenario. The structuring scenario narratives provide a written explanation of the results associated with each respective scenario. Each scenario narrative begins with a general explanation of the structuring contained in the scenario. The narrative then progresses forward to describe the scenario components to include transaction type, transaction price, funding, taxes and net to owner. Section 2 provides information about Assets and other components associated with a transaction. This information will help you understand the taxation and impact these items will have on an Accrual and Cash Basis Seller. Section 3 contains the support schedules for each scenario and provides the financial details associated with each scenario. The initial schedule for each scenario is the Transaction Activity Schedule. This schedule provides an overall recap of each respective scenario to include the presentation by year of revenue recognition, payment collections and tax liability. The other support schedules provide information such as, transaction gains, taxable proceeds, tax calculations, allocations, etc… A list and explanation of the various schedules is provided at the beginning of Section 3. Just before the start of the scenario narratives in Section 1, there is a Net Proceed Analysis Comparison Schedule which provides on a single report the result totals from the separate net proceed analysis schedules provided for each in Section 3. This comparison will allow you to quickly gain an understanding of the estimated results associated with each scenario. Although there are many ways to review the information contained in this report, here is a Suggested Report Review Sequence:
1) First, review the Support Schedule Explanations just before the scenario support schedules on Section 3. This will give you an understanding of what type of information is provided in the various support schedules.
2) Second, review the Net Proceed Analysis Comparison Schedule in Section 1 which is
located just prior to the start of the Scenario Narratives. This will enable you to understand the estimated results anticipated to occur for each respective scenario.
3) Third, review the Net Proceed Analysis and Transaction Activity Schedule for each
scenario in Section 3. By reviewing these individual schedules for each scenario you will gain an understanding of the detail by year which is summed up and totaled on the Comparison Schedule located in Section 1.
4) Fourth, read the narratives for each scenario.
5) Fifth, review the other support schedules for each scenario. With the Net Proceed Analysis
and Transaction Activity Schedules having been reviewed and the narratives having been read, you will have a better base of information to understand the details contained in the other support schedules.

Business Information
Entity Type
The business is an S-Corporation. State of Organization
The business is organized in a State in the USA. Date of Organization
The business was organized on January 1, 1998. Business Purpose
The business is a provider of 3D Laser Scanning, Digitizing and Reproduction Services.
Business Owner(s)
The business’s owner(s) are Mr. and Mrs. Entrepreneur. Information Used to Prepare Report
• Year 2007 Form 1120S Federal Income Tax Return
• Current Year Income Statement Sheet as of November 30, 2008
• Current Year Balance Sheet as of November 30, 2008
• Recast information from Business Intermediary
• Conversation with Business Intermediary
Page 1

Scenario Narratives
Scenario Support Schedules are contained in the back of this report and provide an in-depth view into the numerical results of each Scenario. Purchase Price Allocation, Transaction Gains, Income Categories, Tax Rate Assumptions, Tax Calculations, and overall Transaction Funds Flow are presented in the Scenario Support Schedules. The support schedule entitled, Transaction Activity, is a consolidated recap which details the overall transaction and shows the anticipated funds flow by year. By comparing this schedule for each Scenario, the anticipated results of each Scenario can be easily analyzed. The intent of the Scenario Narratives is to provide additional explanatory language to assist in understanding each respective Scenario. Note: A Scenario’s narrative and support schedules should be reviewed together
to gain an overall understanding of the Scenario.
Page 2
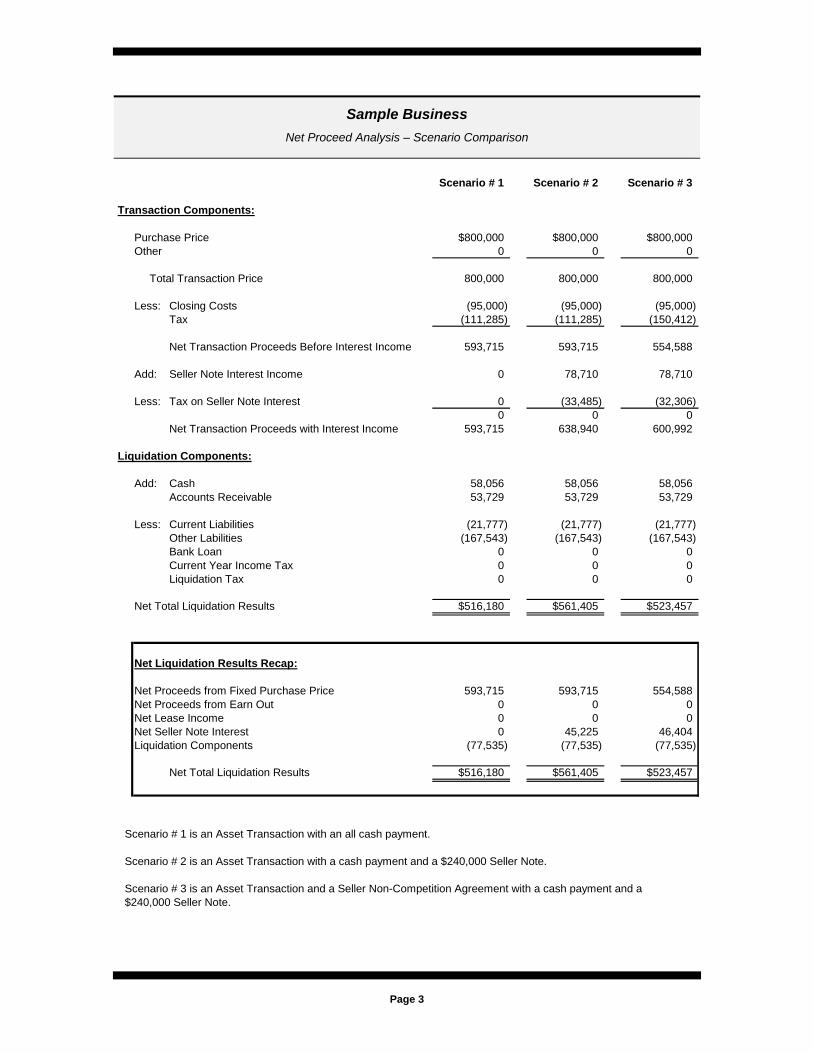
Sample Business Net Proceed Analysis – Scenario Comparison
Scenario # 1 Scenario # 2 Scenario # 3
Transaction Components:
Purchase Price $800,000 $800,000 $800,000Other 0 0 0
Total Transaction Price 800,000 800,000 800,000
Less: Closing Costs (95,000) (95,000) (95,000)Tax (111,285) (111,285) (150,412)
Net Transaction Proceeds Before Interest Income 593,715 593,715 554,588
Add: Seller Note Interest Income 0 78,710 78,710
Less: Tax on Seller Note Interest 0 (33,485) (32,306)0 0 0
Net Transaction Proceeds with Interest Income 593,715 638,940 600,992
Liquidation Components:
Add: Cash 58,056 58,056 58,056Accounts Receivable 53,729 53,729 53,729
Less: Current Liabilities (21,777) (21,777) (21,777)Other Labilities (167,543) (167,543) (167,543)Bank Loan 0 0 0Current Year Income Tax 0 0 0Liquidation Tax 0 0 0
Net Total Liquidation Results $516,180 $561,405 $523,457
Net Liquidation Results Recap:
Net Proceeds from Fixed Purchase Price 593,715 593,715 554,588Net Proceeds from Earn Out 0 0 0Net Lease Income 0 0 0Net Seller Note Interest 0 45,225 46,404Liquidation Components (77,535) (77,535) (77,535)
Net Total Liquidation Results $516,180 $561,405 $523,457
Scenario # 1 is an Asset Transaction with an all cash payment.
Scenario # 2 is an Asset Transaction with a cash payment and a $240,000 Seller Note.
Scenario # 3 is an Asset Transaction and a Seller Non-Competition Agreement with a cash payment and a $240,000 Seller Note.
Page 3

Scenario # 1
Sell Side Results
This Scenario # 1 assumes the business transfer will be structured as an Asset Transaction with an $800,000 transaction price allocated as follows.
Entity Level: Office Furniture 5,955 Office Equipment 6,211 Tools 2,352 Machinery 208,330 Scanners 120,000 Topometric Sensor 18,744 Computer Equipment 15,481 Computer Software 5,000 Rolling Stock (Vehicles, Trucks, etc…) 10,437 Platforms 7,490 Goodwill 400,000 Owner Level: Non–Competition Agreement 0 -------------- Total $800,000 ========
The Buyer will pay $800,000 down with $0 being carried by the Seller.
After considering available tax basis, taxable gains will be $411,853. A calculation of this gain is detailed in the Transaction Gain Analysis Schedule provided in the Scenario # 1 support schedule section located in the back of this report.
This gain will result in an estimated tax of $111,285. Schedules detailing the estimated tax can be found in the Scenario # 1 support schedule section located in the back of this report.
After considering applicable closing costs and taxes, the estimated net to owner is $516,180. The calculation of the net to owner can be found by reviewing the Transaction Activity Schedule located in the Scenario # 1 support schedule section located in the back of this report.
A detail of the key financial components of this Scenario # 1 are as follows:
Transaction Type: Asset
Transaction Price: $800,000
Funding:
Page 4

Cash at Close: $800,000
Seller Note: $0
Estimated Tax: $111,285
Net to Owner: $516,180
The Net to Owner includes excess cash or other assets existing in the business less the payoff of all liabilities.
Buy Side Results
The result to the Buyer occurring from this Scenario # 1 is as follows:
The $400,000 allocated to FFE and Rolling Stock can be depreciated over 5 to 7 years or possibly be expensed immediately with a Section 179 Election.
The $400,000 allocated to Corporate Goodwill can be amortized over 15 years.
Page 5

Scenario # 2
Sell Side Results
This Scenario # 2 assumes the business transfer will be structured as an Asset Transaction with an $800,000 transaction price allocated as follows.
Entity Level: Office Furniture 5,955 Office Equipment 6,211 Tools 2,352 Machinery 208,330 Scanners 120,000 Topometric Sensor 18,744 Computer Equipment 15,481 Computer Software 5,000 Rolling Stock (Vehicles, Trucks, etc…) 10,437 Platforms 7,490 Goodwill 400,000 Owner Level: Non–Competition Agreement 0 -------------- Total $800,000 ========
The Buyer will pay $560,000 down with $240,000 being carried by the Seller for a period of 7 years. The note will create an additional $78,710 of interest income to the Seller over the term of the note. This projected interest is incorporated into the activity associated with this Scenario # 2.
After considering available tax basis, taxable gains will be $411,853. A calculation of this gain is detailed in the Transaction Gain Analysis Schedule provided in the Scenario # 2 support schedule section located in the back of this report.
This gain along with the additional projected $78,710 of interest income will result in an estimated tax of $144,770. Schedules detailing the estimated tax can be found in the Scenario # 2 support schedule section located in the back of this report.
After considering applicable closing costs and taxes, the estimated net to owner is $561,405. The calculation of the net to owner can be found by reviewing the Transaction Activity Schedule located in the Scenario # 2 support schedule section located in the back of this report.
A detail of the key financial components of this Scenario # 2 are as follows:
Transaction Type: Asset
Page 6

Transaction Price: $800,000
Funding:
Cash at Close: $560,000
Seller Note: $240,000
Interest Rate: 7% per annum
Payment Period: 7 years
Payments per year: 12
Note Payments will include Interest only for the first 24 payments with principal and interest over the next 60 payments. The first twenty-four payments are Interest Only because Lenders often either allow a Seller Note to initially receive interest only or in some cases will put the note on complete standby for a period of time. When a note is on complete standby no principal or interest can be paid until the end of the standby period or until a standby release is issued.
Estimated Tax: $144,770
Net to Owner: $561,405
The Net to Owner includes excess cash or other assets existing in the business less the payoff of all liabilities.
Buy Side Results
The result to the Buyer occurring from this Scenario # 2 is as follows:
The $400,000 allocated to FFE and Rolling Stock can be depreciated over 5 to 7 years or possibly be expensed immediately with a Section 179 Election.
The $400,000 allocated to Corporate Goodwill can be amortized over 15 years.
Page 7

Scenario # 3
Sell Side Results
This Scenario # 3 assumes the business transfer will be structured as an Asset Transaction with an $800,000 transaction price allocated as follows.
Entity Level: Office Furniture 5,955 Office Equipment 6,211 Tools 2,352 Machinery 208,330 Scanners 120,000 Topometric Sensor 18,744 Computer Equipment 15,481 Computer Software 5,000 Rolling Stock (Vehicles, Trucks, etc…) 10,437 Platforms 7,490 Goodwill 160,000 Owner Level: Non–Competition Agreement 240,000 -------------- Total $800,000 ========
The Buyer will pay $560,000 down with $240,000 being carried by the Seller for a period of 7 years. The note will create an additional $78,710 of interest income to the Seller over the term of the note. This projected interest is incorporated into the activity associated with this Scenario # 3.
After considering available tax basis, taxable gains will be $411,853. A calculation of this gain is detailed in the Transaction Gain Analysis Schedule provided in the Scenario # 3 support schedule section located in the back of this report.
This gain along with the additional projected $78,710 of interest income will result in an estimated tax of $182,718. Schedules detailing the estimated tax can be found in the Scenario # 3 support schedule section located in the back of this report.
After considering applicable closing costs and taxes, the estimated net to owner is $523,457. The calculation of the net to owner can be found by reviewing the Transaction Activity Schedule located in the Scenario # 3 support schedule section located in the back of this report.
A detail of the key financial components of this Scenario # 3 are as follows:
Transaction Type: Asset
Page 8

Transaction Price: $800,000
Funding:
Cash at Close: $560,000
Seller Note: $240,000
Interest Rate: 7% per annum
Payment Period: 7 years
Payments per year: 12
Note Payments will include Interest only for the first 24 payments with principal and interest over the next 60 payments. The first twenty-four payments are Interest Only because Lenders often either allow a Seller Note to initially receive interest only or in some cases will put the note on complete standby for a period of time. When a note is on complete standby no principal or interest can be paid until the end of the standby period or until a standby release is issued.
Estimated Tax: $182,718
Net to Owner: $523,457
The Net to Owner includes excess cash or other assets existing in the business less the payoff of all liabilities.
Buy Side Results
The result to the Buyer occurring from this Scenario # 3 is as follows:
The $400,000 allocated to FFE and Rolling Stock can be depreciated over 5 to 7 years or possibly be expensed immediately with a Section 179 Election.
The $160,000 allocated to Corporate Goodwill can be amortized over 15 years.
The $240,000 allocated to Personal Shareholder Covenant Not-To-Compete can be amortized over 15 years.
Page 9

Scenario Recap Scenario # 1 is an Asset Transaction with an ALL cash payment. An ALL cash payment happens very rarely. This Scenario # 1 is presented to show the pure result of the transaction without any other variable, such as a Seller Note. The majority of the transaction is subject to preferential capital gain rates. One way to lower tax by approximately another $20,000 is to further reduce the allocation to Furniture, Fixtures and Equipment “FFE” by $100,000. This Scenario # 1 currently allocates $400,000 to FFE so a $100,000 reduction would bring the FFE allocation to $300,000. Although this would reduce tax it could certainly have a negative impact on the Buyer’s borrowing capacity. The realty is FFE should receive an allocation based on what it is really worth whether it is as presented or higher or lower.
Scenario # 2 is an Asset Transaction with a $560,000 cash payment due at closing along with a $240,000 Seller Note. A review of the Transaction Activity Schedule in the Scenario # 2 support schedule section located in the back of this report details net cash inflows initially and over the term of the Seller Note collection. This Scenario #2, in some form, is the most likely structuring solution for this transaction.
Scenario # 3 is an Asset Transaction and a Seller Non-Competition Agreement with a $560,000 cash payment due a closing along with a $240,000 Seller Note. It is common for Buyers to try and allocate a component of the Transaction Price to a Seller Non-Competition Agreement. The Non-Competition language built into the Buy/Sell Agreement is sufficient without an actual allocation.
For an S-Corporation, the amount allocated to a Non-Competition Agreement causes the Seller to incur ordinary income tax on these funds as opposed to a preferential capital gain rate. The Buyer receives the exact same tax benefit whether or not an allocation is made to Non-Competition because when an allocation occurs to Non-Competition it is generally being moved from Goodwill. Both Goodwill and Non-Competition are a 15 write off for the Buyer. This Scenario # 3 shows the negative tax impact which will occur if $240,000 is allocated to a Non-Competition Agreement. This allocation caused an additional tax burden of approximately $39,000 when compared to the tax paid in Scenario # 2. Thus, stay away from allowing an allocation to be placed on a Non-Competition Agreement.
In each Scenario the Net to Owner includes excess cash or other assets existing in the business less the payoff of all liabilities.
Note: The Transaction Activity Schedule for each Scenario at the end of this report provides an analysis and recap of each Scenario by period. This schedule and the other supporting schedules provide helpful and informative information regarding the results of each Scenario.
Page 10

General Information Applicable to Transactions
Current Assets
Cash and Cash Equivalents
The term cash means actual cash on deposit with Banks, Savings & Loans, Investment Groups, etc… Cash Equivalents are assets that are readily convertible into cash, such as funds in a certificate of deposit, money market holdings, short-term government bonds or Treasury bills, marketable securities and commercial paper. Cash equivalents are distinguished from other investments through their short-term existence; they mature within 3 months whereas short-term investments are 12 months or less, and long-term investments are any investments that mature in excess of 12 months.
When sold and transferred in a business transaction cash and cash equivalents do not cause a taxable event because this asset type is sold dollar for dollar. This means that the tax basis in these assets equals the value allocated to them as a part of the transaction.
Accounts Receivable
Upon the delivery of a service and or the sale of a product a customer can either pay the resulting billed invoice immediately or be allowed a short period of time in which to get the invoice paid. During this period of time the invoice, in the accounting records of the business supplying the service and or product, is known as an Accounts Receivable. An Accounts Receivable is a short term extension of time allotted to a customer enabling the customer to pay an invoice at a future point.
In a business transaction, if Accounts Receivable is part of the assets being sold, the tax treatment for an Accrual Basis Taxpayer versus a Cash Basis Taxpayer is different.
Page 11

A business using the Accrual Basis of Accounting establishes tax basis at the time a service and or product is delivered to a customer because the resulting billed invoice immediately becomes recognized as income which in turn causes income tax to be due even though the business has not yet received payment for the invoice.
A business using the Cash Basis of Accounting has no tax basis in a billed invoice because income for a Cash Basis Taxpayer is not recognized until payment is received for the invoice.
Thus, when Accounts Receivable is included as a part of the assets sold in a business transaction, an Accrual Basis Taxpayer will incur no income tax on the portion of the transaction allocated to the Accounts Receivable because tax was paid when the invoice was originally issued. On the other hand, a Cash Basis Taxpayer will owe ordinary income tax because the funds received in the business transaction are considered to be the collection of the Accounts Receivable and for a Cash Basis Taxpayer this is an ordinary income event.
Inventory
These are assets which ultimately get sold to customers. These include raw materials, work-in-process goods, completed finished goods and products purchased for direct resale.
Whether a business is an Accrual Basis Taxpayer or a Cash Basis Taxpayer, inventory, for tax purposes, is required to be maintained as an asset on the Balance Sheet until the inventory is sold.
In a business transaction, the tax basis carrying amount of the inventory, which is generally the amount carried on the Balance Sheet, will be deducted from the portion of the transaction price allocated to the inventory. If the allocated amount equals the tax basis carrying amount, then no tax will be due. If the allocated amount is less than the tax basis carrying amount, an ordinary operating tax loss will occur. If the allocated amount is greater than the tax basis carrying amount, an ordinary operating tax profit will occur.
Page 12

Work In Progress
Unlike work in process associated with inventory, which are unfinished goods still in the manufacturing process, Work In Progress is generally the unbilled portion associated with an active job or contract. This is actually sometimes referred to as Unbilled Receivables.
Contracts are accounted for on the Completed Contract Method or on the Percentage of Completion Method. In either case, as work is occurring on the contract a percentage of the contract is in fact being completed. This completed portion is the amount considered as the Work In Progress portion. If the Percentage of Completion Method is being used to account for the contract then the Work In Progress can be placed in two categories being billed and unbilled. If the Completed Contract Method is used to account of the contract then the percentage of the contract which has been finished is in fact categorized as unbilled. Thus, this unbilled categorization is what often leads to Work In Progress being referred to as Unbilled Receivables.
Under the Completed Contract Method an Accrual Basis Taxpayer will have no tax basis to deduct from any amount allocated to the Work In Progress because no invoices have been issued to cause the previous recognition of any income. So, an allocation to Work In Progress will cause the entire allocated amount to become taxable as ordinary income.
Under the Percentage of Completion Method an Accrual Basis Taxpayer will have tax basis for amounts in the billed category and will have no tax basis for amounts in the unbilled category. So, an allocation to Work in progress will cause no tax to be due on the amounts held in the billed category with ordinary income occurring for amount any amount in the unbilled category.
A Cash Basis Taxpayer will recognize ordinary income for any amount allocated to Work In Progress under either the Percentage of Completion or Completed Contract Methods.
Page 13

Tangible Assets
Personal Property
These assets are known as Section 1245 Property. These include assets such as Furniture, Fixtures, Equipment, Rolling Stock, etc… These assets are depreciated over time which is generally from 5 to 12 years depending on asset type.
The depreciation allowed on these assets is taken as a tax deduction against operating income which means that it is an ordinary tax deduction. When a Personal Property asset is later sold, any gain on the sale of the asset is considered a capital gain. The gain is then broken down into two categories. The first category is the portion subject to depreciation recapture and the second category is the portion not subject to depreciation recapture.
Depreciation Recapture is simple to identify. The gain on the sale of a Personal Property asset is first compared to any depreciation previously applied to the asset. Category One receives an allocation up to the amount of the previous depreciation. Category Two receives any amount still remaining.
The tax implications will generally be the same for a Taxpayer under the Accrual Method and Cash Method of accounting.
C-Corporations pay ordinary income tax on any gain from the Sale of Personal Property regardless of the amount in Category One or Category Two because C-Corporations do not benefit from a preferential capital gain rate.
People, also known in tax as Natural Persons, and Pass-Thru Entities (i.e. S-Corporation, LLC, Partnership, etc…) which pass through activity to Natural Persons receive an ordinary tax rate for Category One and a preferential capital gain rate for Category Two.
Page 14

Real Property
These assets are known as Section 1250 Property. These include assets such as Buildings and Land. Since 1986, non-residential Buildings placed in service are depreciated on the straight line basis over a period of 40 years. Non-residential Buildings placed in service prior to 1986 had the option of having the depreciation accelerated for a period shorter than 40 years. Land cannot be depreciated.
The depreciation allowed on these assets is taken as a tax deduction against operating income which means that it is an ordinary tax deduction. When a Real Property asset is later sold, any gain on the sale of the asset is considered a capital gain. Likewise any loss is considered a capital loss.
If the property is a Non-residential Building placed in service since 1986 then its gain will be broken down into two categories. The first category is the portion associated with any previous straight line depreciation which is known as an “Unrecaptured 1250 Gain” and the second category is the portion in excess of the previous straight line depreciation.
Since Non-residential Buildings placed in service since 1986 are only depreciated on the straight line basis there is no depreciation recapture. This is because depreciation recapture is only related to accelerated deprecation. Category One receives an allocation up to the amount of the previous straight line depreciation. Category Two receives any amount still remaining.
When Land is sold at a profit it generates a capital gain but no portion is subject to Depreciation Recapture or Unrecaptured 1250 Gain because Land cannot receive any form of depreciation. Thus, its gain can be considered to fall entirely in Category Two.
The tax implications will generally be the same for a Taxpayer under the Accrual Method and Cash Method of accounting.
C-Corporations pay ordinary income tax on any gain from the Sale of Real Property regardless of the amount in Category One or Category Two because C-Corporations do not benefit from a preferential capital gain rate.
People, also known in tax as Natural Persons, and Pass-Thru Entities (i.e. S-Corporation, LLC, Partnership, etc…) which pass through activity to Natural
Page 15

Persons receive a special 25% capital gain tax rate for Category One and a preferential capital gain rate for Category Two.
Page 16

Intangible Assets
Goodwill
Goodwill is the value of a trade or business attributable to the expectancy of continued customer patronage. This expectancy may be due to the name or reputation of a trade or business or any other factor.
Going Concern Value
Going concern value is the additional element of value that attaches to property by reason of its existence as an integral part of an ongoing business activity. Going concern value includes the value attributable to the ability of a trade or business (or part of a trade or business) to continue functioning or generating income without interruption notwithstanding a change in ownership, but does not include any of the other items included in the definition of Code Section 197 intangibles. Going concern value also includes the value attributable to the immediate use or availability of an acquired trade or business, such as, for example, the use of the revenues or net earnings that otherwise would not be received during any period if the acquired trade or business were not available or operational.
Workforce In Place
Workforce in place (sometimes referred to as an agency force or assembled workforce) includes the composition of a workforce (e.g., the experience, education or training of a workforce), the terms and conditions of employment whether contractual or otherwise, and any other value placed on employees or any of their attributes. Thus, the amount paid or incurred for workforce in place includes, for example, any portion of the purchase price of an acquired trade or business attributable to the existence of a highly-skilled workforce, an existing employment contract (or contracts), or a relationship with employees or consultants (including, but not limited to, any key employee contract or relationship). Workforce in place does not include any covenant not to compete or other similar arrangement.
Page 17

Information Base
Information base includes items such as business books and records, operating systems, and any other information base, regardless of the method of recording the information. It also includes any customer-related information base, including lists or other information with respect to current or prospective customers. Finally, it also includes any other intangible property that is similar in all material respects to an information base, including a customer-related information base.
The amount paid or incurred for information bases includes, for example, any portion of the purchase price of an acquired trade or business attributable to the intangible value of technical manuals, training manuals or programs, data files, and accounting or inventory control systems, as well as the cost of acquiring customer lists, subscription lists, insurance expirations, patient or client files, or lists of newspaper, magazine, radio, or television advertisers.
Know-How
Know how includes any patent or copyright, formula, process, design, pattern, know-how, format, package design, computer software, or interest in a film, sound recording, video tape, book or other similar property, unless specifically exempted from the definition as discussed in, and any other intangible property that is similar in all material respects to this type of property. However, these items generally are Code Section 197 intangibles only if they are acquired as part of a trade or business.
Customer-Based Intangibles
A customer-based intangible is any composition of market, market share, or other value resulting from the future provision of goods or services pursuant to relationships (contractual or otherwise) in the ordinary course of business with customers.
The amount paid or incurred for customer-based intangibles includes, for example, any portion of the purchase price of an acquired trade or business attributable to the existence of customer base, a circulation base, an undeveloped market or market growth, insurance in force, mortgage servicing contracts, investment management contracts, or other relationships with customers that involve the future provision of goods or services. On the other hand, any portion of the
Page 18

purchase price of an acquired trade or business attributable to accounts receivable or other similar rights to income for those goods or services provided to customers before the acquisition of a trade or business is not an amount paid or incurred for a customer-based intangible.
Supplier-Based Intangibles
A supplier-based intangible is the value resulting from the future acquisition of goods or services pursuant to relationships (contractual or otherwise) in the ordinary course of business with suppliers of goods or services to be used or sold by the taxpayer.
The amount paid or incurred for supplier-based intangibles includes, for example, any portion of the purchase price of an acquired trade or business attributable to the existence of a favorable relationship with persons providing distribution services (e.g., favorable shelf or display space at a retail outlet), the existence of a favorable credit rating, or the existence of favorable supply contracts. The amount paid or incurred for supplier-based intangibles does not include any amount required to be paid for the goods or services themselves pursuant to the terms of the agreement or other relationship, or the right to receive property or services from another person.
Licenses, Permits, and Other Rights Granted By Governmental Units
These include any license, permit or other right granted by a governmental unit, including an agency or instrumentality thereof, even if the right is granted for an indefinite period or the right is reasonably expected to be renewed for an indefinite period. These rights include, for example, a liquor license, a taxi-cab medallion (or license), an airport landing or take-off right (sometimes referred to as a slot), a regulated airline route, or a television or radio broadcasting license.
Covenants Not To Compete
This includes any covenant not to compete or other arrangement to the extent that the arrangement has substantially the same effect as a covenant not to compete entered into in connection with the direct or indirect acquisition of an interest in a trade or business (or a substantial portion thereof). For this purpose, an acquisition may be made in the form of an asset acquisition (including a qualified stock
Page 19
purchase that is treated as a purchase of assets under Code Section 338), a stock acquisition or redemption, and the acquisition or redemption of a partnership interest.
An agreement requiring the performance of services, or the provision of property or the use of property (other than property of the acquired trade or business) does not have substantially the same effect as a covenant not to compete to the extent that the amount paid under the agreement represents reasonable compensation for the services actually rendered or for the property, or use of the property actually provided. As under pre-Code Section 197 law, to the extent that the amount paid or incurred under a covenant not to compete represents additional consideration for the acquisition of stock in a corporation, such amount is not to be taken into account under Code Section 197, but instead, is to be included as part of the acquirer's basis in the stock. H.R. Rep. 213, 103d Cong., 1st Sess. 216 (1993).
Any amount paid or incurred under a covenant not to compete (or similar arrangement) entered into in connection with the direct or indirect acquisition of an interest in a trade or business (or substantial portion thereof) is chargeable to capital account and is to be amortized ratably over the 15-year period specified in. In addition, any amount paid or incurred under a covenant not to compete (or similar arrangement) after the taxable year in which the covenant was entered into is amortized ratably over the remaining months in the 15-year amortization period as of the beginning of the month that the amount is paid or incurred.
Franchises, Trademarks, and Trade Names
A franchise for this purpose is defined as it is for purposes of the rules on transfers of franchises. Thus, it includes an agreement that gives one of the parties to the agreement the right to distribute, sell, or provide goods, services, or facilities, within a specified area. A license, permit, or other right granted by a governmental unit is a franchise if it otherwise meets the definition.
A trademark for this purpose includes any word, name, symbol, or device, or any combination thereof, adopted and used by a manufacturer or merchant to identify goods or services and distinguish them from those provided by others. It includes any trademark arising under statute or applicable common law, and any similar right granted by contract.
Page 20

A trade name for this purpose includes any name used by a manufacturer or merchant to identify or designate a particular trade or business or the name or title used by a person or organization engaged in a trade or business. It includes any trade name arising under statute or applicable common law, and any similar right granted by contract.
The renewal of a franchise, trademark, or trade name is to be treated as an acquisition of the franchise, trademark, or trade name. The costs paid or incurred for the renewal of a franchise, trademark, or trade name are amortized over the 15-year period that begins with the month of renewal, and any costs paid or incurred for the issuance, or earlier renewal, continue to be taken into account over the remaining portion of the amortization period that began at the time of the issuance, or earlier renewal. Any amount paid or incurred for the protection, expansion or defense of a trademark or trade name that is capitalized is treated as an amount paid for a renewal.
Contracts For Use Of, and Term Interests In, Other Code Section 197 Intangibles
Code Section 197 intangibles include any right under a license, contract, or other arrangement providing for the use of property that would be a Code Section 197 intangible, as well as any term interest, whether outright or in trust, in such property. However, Code Section 197 intangibles do not include any interest, including an interest as a licensee, in a patent, patent application or copyright that is not acquired as part of a purchase of a trade or business. In addition, royalty payments under a contract for the use of Code Section 197 intangibles unconnected with the purchase of a trade or business are not required to be capitalized unless the transaction is a sale or exchange. However, licensing transactions will be closely scrutinized to see whether it is in fact a sale or exchange.
The tax implications associated with Intangibles will generally be the same for a Taxpayer under the Accrual Method and Cash Method of accounting.
C-Corporations pay ordinary income tax on the any gain from the Sale or Licensing of Intangibles because C-Corporations do not benefit from a preferential capital gain rate.
Page 21

People, also known in tax as Natural Persons, and Pass-Thru Entities (i.e. S-Corporation, LLC, Partnership, etc…) which pass through activity to Natural Persons, receive a preferential capital gain rate on the Sale of Intangibles with the exception of a Covenant Not to Compete which is treated as ordinary income. The licensing of any Intangible will also result in ordinary income.
Page 22

Other Items and Terms
Depreciation Recapture
Depreciation Recapture is the process by which prior depreciation is included as ordinary income on the tax return when a depreciated property is sold at a gain. Each year that a depreciable business asset is owned, depreciation is claimed that theoretically corresponds with the using up of the property through normal wear, obsolescence, etc. Thus, the property should be worth approximately its adjusted basis. If the property is sold for more than its adjusted basis, section 1245 of the tax Code requires that the gain on personal property and certain nonresidential real property (to the extent of depreciation claimed) be recaptured. The purpose of this procedure is to prevent capital gain treatment of gain resulting from claiming depreciation. The procedure does not apply when the property is disposed of at a loss.
Earn-Out
An Earn Out is the portion of the purchase price of a business which is contingent upon the occurrence of some future event. For Example, if a Buyer and Seller cannot come to terms on the validity of existing data to support the Seller's asking price, a lower price may be accepted with a contingency that if the business performs at a level to support the asking price, then the difference between the asking price and agreed upon price will paid to the Seller. The actual events to trigger an earn-out obligation vary but most will include or be based on some target matrix to include items such as sales, earnings, cash flow, etc…
An Earn Out can be an excellent way to provide upside opportunity to the Seller while mitigating risk exposure to the Buyer. If the business performs, the Seller benefits from the additional earnings and if the business does not perform, the Buyer is not exposed to additional purchase price requirement.
Page 23

Installment Sale
An Installment Sale is a sale in which at least one payment occurs in a year after the year of sale. This is also referred to as the Installment Method. This method enables a taxpayer to spread the recognition of gain on the sale of property over the payment period. Under this procedure, the seller computes the gross profit percent from the sale (that is, the gain divided by the contract price) and applies it to each payment received to arrive at the amount of the gain to be recognized.
Like-Kind Exchange
A Like-Kind Exchange is an exchange of property held for productive use in a trade or business or for investment (except inventory and stocks and bonds) for property of the same type. Unless different property is received (called boot), the exchange is nontaxable in the current year. Any gain or loss is not recognized until the property received in the exchange is sold or disposed.
Page 24

Scenario Support Schedules
Schedule Explanations Transaction Activity
This schedule splits the transaction activity between where it is being received either at the Business Entity Level or at the Personal Level. This schedule is essentially a recap schedule incorporating information which has been calculated and compiled in the other provided support schedules. It recaps the estimated and projected Net “After-Tax” cash flow expected to occur by year. By reviewing this schedule the reader can gain an understanding of what is expected to occur in the year of close and in future periods.
Transaction Gain Analysis The gain or (loss) associated with a business transaction is derived from the respective assets sold and other income sources associated with the transaction. This gain or (loss) is generally a summation from various income categories. These categories, depending on entity type, can carry different tax rates. This schedule splits the transaction proceeds between where it is being received either at the Business Entity Level or at the Personal Level. This schedule then calculates the gain or (loss) associated with each asset or income source and then categorizes the gain or (loss). Thus, this schedule will help the reader understand the gain or loss associated with the transaction and how this gain or loss is categorized for income tax calculation purposes.
Income Subject To Taxation Total Gross Proceeds are not taxable. It is necessary to consider information such as existing tax basis, income timing, income sources, etc… in the calculation of income tax associated with a business transaction. This schedule uses information from the Transaction Gain Analysis Schedule, Promissory Note Schedule and certain items from the Transaction Activity Schedule in the determination of what constitutes taxable income. The income is split between where it is being received either at the Business Entity Level or at the Personal Level. It is then broken down by five sections being Cash, Earn Out, Note, Time Period Income and Dividend Income. Cash is the portion the portion of the transaction associated with the funds submitted as a part of the
Page 25

closing. Earn Out is the portion of the transaction tied to future amounts to be earned under an earn out agreement if applicable. Note is the portion of the transaction being received under a Seller Promissory Note if applicable. Time Period Income are other income items not applicable to the other sections which include consulting agreements, employment agreements, etc… Dividend Income is any taxable dividends, if applicable, being issued from an entity to the entities’ owners.
Tax Rate Assumptions
This schedule details the various tax rates used in the tax calculations.
Calculated Tax Amounts This schedule uses the information presented in the Income Subject to Taxation Schedule and calculates Federal and State Level Tax. The resulting tax is then carried to the tax section in the Transaction Activity Schedule. Thus, the information detailed in this schedule is actual estimated tax amounts.
Asset Allocation This schedule splits the transaction asset allocation in to two columns being Business Entity Level and Personal Level. This schedule categorizes by class the Asset Components of the transaction as per the requirements for the completion of IRS Form 8594 – Asset Acquisition Statement.
Promissory Notes This schedule details the annual Seller Promissory Note receipts if applicable.
Page 26

Support Schedules - Scenario # 1
The schedules which follow this page are for Scenario # 1.
Page 27

Sample Business Net Proceed Analysis – Scenario # 1
Entity Owner Total
Transaction Components:
Purchase Price $800,000 $0 $800,000Other 0 0 0
Total Transaction Price 800,000 0 800,000
Less: Closing Costs (95,000) 0 (95,000)Tax (111,285) 0 (111,285)
Net Transaction Proceeds Before Interest Income 593,715 0 593,715
Add: Seller Note Interest Income 0 0 0
Less: Tax on Seller Note Interest 0 0 0
Net Transaction Proceeds with Interest Income 593,715 0 593,715
Liquidation Components:
Add: Cash 58,056 0 58,056Accounts Receivable 53,729 0 53,729
Less: Current Liabilities (21,777) 0 (21,777)Other Labilities (167,543) 0 (167,543)Bank Loan 0 0 0Current Year Income Tax 0 0 0Liquidation Tax 0 0 0
Net Total Liquidation Results $516,180 $0 $516,180
Net Liquidation Results Recap:
Net Proceeds from Fixed Purchase Price 593,715 0 593,715Net Proceeds from Earn Out 0 0 0Net Lease Income 0 0 0Net Seller Note Interest 0 0 0Liquidation Components (77,535) 0 (77,535)
Net Total Liquidation Results $516,180 $0 $516,180
Net Transaction Proceeds are the amounts projected to be received from the transaction after payment of closing costs and taxes.
Net Seller Note Interest is the projected interest income to be received by the Seller as a result of extending financing to the Buyer.
The Liquidation Components are Asset and Liability amounts remaining after the transaction which were not transferred to the Buyer.
The Net Liquidation Recap details by source the projected amounts to be received by the Seller "After" tax and closing costs.
Page 28

Page 29
Year 1 Year 2 Year 3 Year 4 Year 5 Year 6 Year 7 Year 8 Year 9 Year 10 Year 11 Total
Entity LevelBusiness Assets $800,000 $0 $0 $0 $0 $0 $0 $0 $0 $0 $0 $800,000Earn Out 0 0 0 0 0 0 0 0 0 0 0 0Non-Competition 0 0 0 0 0 0 0 0 0 0 0 0Consulting 0 0 0 0 0 0 0 0 0 0 0 0Lease and Rental 0 0 0 0 0 0 0 0 0 0 0 0License and Royalty Fees 0 0 0 0 0 0 0 0 0 0 0 0Interest Income - Seller Note 0 0 0 0 0 0 0 0 0 0 0 0Stock 0 0 0 0 0 0 0 0 0 0 0 0Other 0 0 0 0 0 0 0 0 0 0 0 0Other 0 0 0 0 0 0 0 0 0 0 0 0
Less:Salary 0 0 0 0 0 0 0 0 0 0 0 0Health Insurance Premiums 0 0 0 0 0 0 0 0 0 0 0 0Retirement Plan 0 0 0 0 0 0 0 0 0 0 0 0Closing Costs (95,000) 0 0 0 0 0 0 0 0 0 0 (95,000)Other 0 0 0 0 0 0 0 0 0 0 0 0Other 0 0 0 0 0 0 0 0 0 0 0 0
Sub-Total Entity Level 705,000 0 0 0 0 0 0 0 0 0 0 705,000
Personal LevelSalary from Business 0 0 0 0 0 0 0 0 0 0 0 0Employment Agreement 0 0 0 0 0 0 0 0 0 0 0 0Consulting Agreement 0 0 0 0 0 0 0 0 0 0 0 0Retirement Plan Distributions 0 0 0 0 0 0 0 0 0 0 0 0Business Assets 0 0 0 0 0 0 0 0 0 0 0 0Stock 0 0 0 0 0 0 0 0 0 0 0 0Non-Competition 0 0 0 0 0 0 0 0 0 0 0 0Lease and Rental 0 0 0 0 0 0 0 0 0 0 0 0License and Royalty Fees 0 0 0 0 0 0 0 0 0 0 0 0Interest Income - Seller Note 0 0 0 0 0 0 0 0 0 0 0 0Closing Costs 0 0 0 0 0 0 0 0 0 0 0 0Other 0 0 0 0 0 0 0 0 0 0 0 0Other 0 0 0 0 0 0 0 0 0 0 0 0
Sub-Total Personal Level 0 0 0 0 0 0 0 0 0 0 0 0
Total Transaction 705,000 0 0 0 0 0 0 0 0 0 0 705,000
Less:Entity Level Tax (105,107) 0 0 0 0 0 0 0 0 0 0 (105,107)Franchise Tax (6,178) 0 0 0 0 0 0 0 0 0 0 (6,178)Personal Tax 0 0 0 0 0 0 0 0 0 0 0 0
85)
Liquidation Additions 111,785 0 0 0 0 0 0 0 0 0 0 111,785
Liquidation Subtractions (189,320) 0 0 0 0 0 0 0 0 0 0 (189,320)
Sub-Total Tax (111,285) 0 0 0 0 0 0 0 0 0 0 (111,2
Net to Owner $516,180 $0 $0 $0 $0 $0 $0 $0 $0 $0 $0 $516,180
Sample Business Transaction Activity – Scenario # 1

Sample Business Transaction Gain Analysis – Scenario # 1
Tax Closing Ordinary Depreciation Unrecaptured Built In CapitalAllocation Basis Costs Gain Income Recapture 1250 Gain Gain Gain Total
Entity Level:
Business Assets:
Cash $0 $0 $0 $0 $0 $0 $0 $0 $0 $0Accounts Receivable 0 0 0 0 0 0 0 0 0 0Work In Progress - Contracts 0 0 0 0 0 0 0 0 0 0Inventory 0 0 0 0 0 0 0 0 0 0Office Furniture 5,955 (440) (707) 4,808 0 4,808 0 0 0 4,808Office Equipment 6,211 (6,211) (738) (738) 0 0 0 0 (738) (738)Tools 2,352 (3,563) (279) (1,490) 0 0 0 0 (1,490) (1,490)Machinery 208,330 (208,330) (24,739) (24,739) 0 0 0 0 (24,739) (24,739)Scanners 120,000 (22,078) (14,250) 83,672 0 83,672 0 0 0 83,672Topometric Sensor 18,744 (18,744) (2,226) (2,226) 0 0 0 0 (2,226) (2,226)Computer Equipment 15,481 (15,481) (1,838) (1,838) 0 0 0 0 (1,838) (1,838)Computer Software 5,000 (2,919) (594) 1,487 0 1,487 0 0 0 1,487Vehicles 10,437 (7,000) (1,239) 2,198 0 2,198 0 0 0 2,198Platforms 7,490 (7,490) (889) (889) 0 0 0 0 (889) (889)Leasehold Improvements 0 (891) 0 (891) 0 0 0 0 (891) (891)Goodwill 400,000 0 (47,501) 352,499 0 0 0 0 352,499 352,499
Sub-Total Business Assets 800,000 (293,147) (95,000) 411,853 0 92,165 0 0 319,688 411,853
Other:
Consulting Agreement 0 0 0 0 0 0 0 0 0 0Non-Competition Agreement 0 0 0 0 0 0 0 0 0 0Lease and Rental 0 0 0 0 0 0 0 0 0 0License and Royalty Fees 0 0 0 0 0 0 0 0 0 0
Sub-Total Other 0 0 0 0 0 0 0 0 0 0
Total Entity Level 800,000 (293,147) (95,000) 411,853 0 92,165 0 0 319,688 411,853
Personal Level:
Shareholder(s):
Consulting Agreement 0 0 0 0 0 0 0 0 0 0Employment Agreement 0 0 0 0 0 0 0 0 0 0Non-Competition Agreement 0 0 0 0 0 0 0 0 0 0Goodwill 0 0 0 0 0 0 0 0 0 0Stock / Ownership Interest 0 0 0 0 0 0 0 0 0 0Real Estate - Land 0 0 0 0 0 0 0 0 0 0Real Estate - Buildings 0 0 0 0 0 0 0 0 0 0
Total Personal Level 0 0 0 0 0 0 0 0 0 0
Grand Total - Transaction $800,000 ($293,147) ($95,000) $411,853 $0 $92,165 $0 $0 $319,688 $411,853
Transaction Gain Calculation Transaction Gain Categories
Page 30

Page 31
Year 1 Year 2 Year 3 Year 4 Year 5 Year 6 Year 7 Year 8 Year 9 Year 10 Year 11 Total
Entity Level:Ordinary Income:
Business Assets 0 0 0 0 0 0 0 0 0 0 0 0Non-Competition 0 0 0 0 0 0 0 0 0 0 0 0Consulting 0 0 0 0 0 0 0 0 0 0 0 0Lease and Rental 0 0 0 0 0 0 0 0 0 0 0 0License and Royalty Fees 0 0 0 0 0 0 0 0 0 0 0 0Stock / Ownership Interest 0 0 0 0 0 0 0 0 0 0 0 0Interest Income - Seller Note 0 0 0 0 0 0 0 0 0 0 0 0Deduction - Salary 0 0 0 0 0 0 0 0 0 0 0 0Other 0 0 0 0 0 0 0 0 0 0 0 0
Sub-Total Ordinary Income 0 0 0 0 0 0 0 0 0 0 0 0
Depreciation Recapture: 92,165 0 0 0 0 0 0 0 0 0 0 92,165
Unrecaptured 1250 Gain: 0 0 0 0 0 0 0 0 0 0 0 0
Built In Gain: 0 0 0 0 0 0 0 0 0 0 0 0
Capital Gain:Business Assets 319,688 0 0 0 0 0 0 0 0 0 0 319,688Earn Out 0 0 0 0 0 0 0 0 0 0 0 0Stock / Ownership Interest 0 0 0 0 0 0 0 0 0 0 0 0Other 0 0 0 0 0 0 0 0 0 0 0 0
Sub-Total Capital Gain 319,688 0 0 0 0 0 0 0 0 0 0 319,688
Total - Entity Level 411,853 0 0 0 0 0 0 0 0 0 0 411,853
Personal LevelOrdinary Income:
Salary from Business 0 0 0 0 0 0 0 0 0 0 0 0Employment Agreement 0 0 0 0 0 0 0 0 0 0 0 0Consulting 0 0 0 0 0 0 0 0 0 0 0 0Retirement Plan Distributions 0 0 0 0 0 0 0 0 0 0 0 0Business Assets 0 0 0 0 0 0 0 0 0 0 0 0Stock / Ownership Interest 0 0 0 0 0 0 0 0 0 0 0 0Non-Competition 0 0 0 0 0 0 0 0 0 0 0 0Lease and Rental 0 0 0 0 0 0 0 0 0 0 0 0License and Royalty Fees 0 0 0 0 0 0 0 0 0 0 0 0Interest Income - Seller Note 0 0 0 0 0 0 0 0 0 0 0 0Other 0 0 0 0 0 0 0 0 0 0 0 0
Sub-Total Ordinary Income 0 0 0 0 0 0 0 0 0 0 0 0
Depreciation Recapture: 0 0 0 0 0 0 0 0 0 0 0 0
Unrecaptured 1250 Gain: 0 0 0 0 0 0 0 0 0 0 0 0
Built In Gain: 0 0 0 0 0 0 0 0 0 0 0 0
Capital Gain:Business Assets 0 0 0 0 0 0 0 0 0 0 0 0Earn Out 0 0 0 0 0 0 0 0 0 0 0 0Stock / Ownership Interest 0 0 0 0 0 0 0 0 0 0 0 0Other 0 0 0 0 0 0 0 0 0 0 0 0
Sub-Total Capital Gain 0 0 0 0 0 0 0 0 0 0 0 0
Total - Personal Level 0 0 0 0 0 0 0 0 0 0 0 0
Sample Business Income Subject to Taxation – Scenario # 1

Sample Business Tax Rate Assumptions – Scenario # 1
Year 1 Year 2 Year 3 Year 4 Year 5 Year 6 Year 7 Year 8 Year 9 Year 10 Year 11
Entity Tax Rates - FederalIncome Tax 35.00% 35.00% 35.00% 35.00% 35.00% 35.00% 35.00% 35.00% 35.00% 35.00% 35.00%Capital Gain 15.00% 15.00% 15.00% 15.00% 15.00% 15.00% 15.00% 15.00% 15.00% 15.00% 15.00%Unrecaptured 1250 Gain 25.00% 25.00% 25.00% 25.00% 25.00% 25.00% 25.00% 25.00% 25.00% 25.00% 25.00%Built In Gain 35.00% 35.00% 35.00% 35.00% 35.00% 35.00% 35.00% 35.00% 35.00% 35.00% 35.00%Social Security Tax 6.20% 6.20% 6.20% 6.20% 6.20% 6.20% 6.20% 6.20% 6.20% 6.20% 6.20%Medicare Tax 1.45% 1.45% 1.45% 1.45% 1.45% 1.45% 1.45% 1.45% 1.45% 1.45% 1.45%
Entity Tax Rates - StateIncome Tax 9.30% 9.30% 9.30% 9.30% 9.30% 9.30% 9.30% 9.30% 9.30% 9.30% 9.30%Capital Gain 9.30% 9.30% 9.30% 9.30% 9.30% 9.30% 9.30% 9.30% 9.30% 9.30% 9.30%
Dividend Tax Rate - Federal 0.00% 15.00% 15.00% 15.00% 15.00% 15.00% 15.00% 15.00% 15.00% 15.00% 15.00%
Dividend Tax Rate - State 0.00% 5.00% 5.00% 5.00% 5.00% 5.00% 5.00% 5.00% 5.00% 5.00% 5.00%
Personal Tax Rates - FederalIncome Tax 35.00% 35.00% 35.00% 35.00% 35.00% 35.00% 35.00% 35.00% 35.00% 35.00% 35.00%Capital Gain 15.00% 15.00% 15.00% 15.00% 15.00% 15.00% 15.00% 15.00% 15.00% 15.00% 15.00%Unrecaptured 1250 Gain 25.00% 25.00% 25.00% 25.00% 25.00% 25.00% 25.00% 25.00% 25.00% 25.00% 25.00%Social Security Tax 6.20% 6.20% 6.20% 6.20% 6.20% 6.20% 6.20% 6.20% 6.20% 6.20% 6.20%Medicare Tax 1.45% 1.45% 1.45% 1.45% 1.45% 1.45% 1.45% 1.45% 1.45% 1.45% 1.45%Self Employment Tax 15.30% 15.30% 15.30% 15.30% 15.30% 15.30% 15.30% 15.30% 15.30% 15.30% 15.30%Self Employment - Medicare Only 2.90% 2.90% 2.90% 2.90% 2.90% 2.90% 2.90% 2.90% 2.90% 2.90% 2.90%
Personal Tax Rates - StateIncome Tax 9.30% 9.30% 9.30% 9.30% 9.30% 9.30% 9.30% 9.30% 9.30% 9.30% 9.30%Capital Gain 9.30% 9.30% 9.30% 9.30% 9.30% 9.30% 9.30% 9.30% 9.30% 9.30% 9.30%
Page 32

Page 33
Year 1 Year 2 Year 3 Year 4 Year 5 Year 6 Year 7 Year 8 Year 9 Year 10 Year 11 Total
Entity Level:State Tax:
Ordinary Income: 0 0 0 0 0 0 0 0 0 0 0 0Depreciation Recapture: 8,571 0 0 0 0 0 0 0 0 0 0 8,571Unrecaptured 1250 Gain: 0 0 0 0 0 0 0 0 0 0 0 0Built In Gain: 0 0 0 0 0 0 0 0 0 0 0 0Capital Gain: 29,731 0 0 0 0 0 0 0 0 0 0 29,731
Sub-Total State 38,302 0 0 0 0 0 0 0 0 0 0 38,302
Federal Tax:Ordinary Income: (13,406) 0 0 0 0 0 0 0 0 0 0 (13,406)Depreciation Recapture: 32,258 0 0 0 0 0 0 0 0 0 0 32,258Unrecaptured 1250 Gain: 0 0 0 0 0 0 0 0 0 0 0 0Built In Gain: 0 0 0 0 0 0 0 0 0 0 0 0Capital Gain: 47,953 0 0 0 0 0 0 0 0 0 0 47,953Payroll: 0 0 0 0 0 0 0 0 0 0 0 0
Sub-Total Federal 66,805 0 0 0 0 0 0 0 0 0 0 66,805
Total Entity Level Tax 105,107 0 0 0 0 0 0 0 0 0 0 105,107
Franchise:California 6,178 0 0 0 0 0 0 0 0 0 0 6,178Other 0 0 0 0 0 0 0 0 0 0 0 0
Total Franchise Tax 6,178 0 0 0 0 0 0 0 0 0 0 6,178
Personal Level:State Tax:
Ordinary Income: 0 0 0 0 0 0 0 0 0 0 0 0Depreciation Recapture: 0 0 0 0 0 0 0 0 0 0 0 0Unrecaptured 1250 Gain: 0 0 0 0 0 0 0 0 0 0 0 0Built In Gain: 0 0 0 0 0 0 0 0 0 0 0 0Capital Gain: 0 0 0 0 0 0 0 0 0 0 0 0
Sub-Total State 0 0 0 0 0 0 0 0 0 0 0 0
Federal Tax:Ordinary Income: 0 0 0 0 0 0 0 0 0 0 0 0Depreciation Recapture: 0 0 0 0 0 0 0 0 0 0 0 0Unrecaptured 1250 Gain: 0 0 0 0 0 0 0 0 0 0 0 0Built In Gain: 0 0 0 0 0 0 0 0 0 0 0 0Capital Gain: 0 0 0 0 0 0 0 0 0 0 0 0Payroll: 0 0 0 0 0 0 0 0 0 0 0 0Self-Employment: 0 0 0 0 0 0 0 0 0 0 0 0
Sub-Total Federal 0 0 0 0 0 0 0 0 0 0 0 0
Total Personal Level Tax 0 0 0 0 0 0 0 0 0 0 0 0
Total Tax 111,285 0 0 0 0 0 0 0 0 0 0 111,285
Sample Business Calculated Tax Amounts – Scenario # 1

Page 34
Entity PersonalLevel Level Total
Class I Cash 0 0 0
Class II Certificate of Deposit 0 0 0Life Insurance Policies 0 0 0Market Securites 0 0 0
Class III Accounts Receivable 0 0 0Work In Progress - Contracts 0 0 0
Class IV Inventory 0 0 0
Class V Office Furniture 5,955 0 5,955Office Equipment 6,211 0 6,211Tools 2,352 0 2,352Machinery 208,330 0 208,330Scanners 120,000 0 120,000Topometric Sensor 18,744 0 18,744Computer Equipment 15,481 0 15,481Computer Software 5,000 0 5,000Vehicles 10,437 0 10,437Platforms 7,490 0 7,490Rolling Stock (Vehicles, Trucks, etc..) 0 0 0Buildings 0 0 0Land 0 0 0Long-Term Construction Contracts 0 0 0
Class VI Customer Based Intangibles 0 0 0Supplier Based Intangibles 0 0 0Workforce In Place 0 0 0Information Database 0 0 0Know How 0 0 0Trademarks 0 0 0Patents 0 0 0Copyrights 0 0 0Licenses 0 0 0Franchise 0 0 0Covenant Not To Compete 0 0 0
Class VII Goodwill 400,000 0 400,000
Total 800,000 0 800,000
Sample Business Asset Allocation – Scenario # 1

Year 1 Year 2 Year 3 Year 4 Year 5 Year 6 Year 7 Year 8 Year 9 Year 10 Year 11 Total
Note Amortization-Corporate
Ordinary Gain % 0% 0 0 0 0 0 0 0 0 0 0 0 0Unrecap 1250 Gain % 0% 0 0 0 0 0 0 0 0 0 0 0 0Capital Gain % 0% 0 0 0 0 0 0 0 0 0 0 0 0
Total 0 0 0 0 0 0 0 0 0 0 0 0
Principal 0 0 0 0 0 0 0 0 0 0 0 0Interest 0 0 0 0 0 0 0 0 0 0 0 0
Total 0 0 0 0 0 0 0 0 0 0 0 0
Note Amortization-Personal
Ordinary Gain % 0% 0 0 0 0 0 0 0 0 0 0 0 0Unrecap 1250 Gain % 0% 0 0 0 0 0 0 0 0 0 0 0 0Capital Gain % 0% 0 0 0 0 0 0 0 0 0 0 0 0
Total 0 0 0 0 0 0 0 0 0 0 0 0
Principal 0 0 0 0 0 0 0 0 0 0 0 0Interest 0 0 0 0 0 0 0 0 0 0 0 0
Total 0 0 0 0 0 0 0 0 0 0 0 0
Sample Business Promissory Notes – Scenario # 1
Page 35

Support Schedules - Scenario # 2
The schedules which follow this page are for Scenario # 2.
Page 36

Sample Business Net Proceed Analysis – Scenario # 2
Entity Owner Total
Transaction Components:
Purchase Price $800,000 $0 $800,000Other 0 0 0
Total Transaction Price 800,000 0 800,000
Less: Closing Costs (95,000) 0 (95,000)Tax (111,285) 0 (111,285)
Net Transaction Proceeds Before Interest Income 593,715 0 593,715
Add: Seller Note Interest Income 78,710 0 78,710
Less: Tax on Seller Note Interest (33,485) 0 (33,485)
Net Transaction Proceeds with Interest Income 638,940 0 638,940
Liquidation Components:
Add: Cash 58,056 0 58,056Accounts Receivable 53,729 0 53,729
Less: Current Liabilities (21,777) 0 (21,777)Other Labilities (167,543) 0 (167,543)Bank Loan 0 0 0Current Year Income Tax 0 0 0Liquidation Tax 0 0 0
Net Total Liquidation Results $561,405 $0 $561,405
Net Liquidation Results Recap:
Net Proceeds from Fixed Purchase Price 593,715 0 593,715Net Proceeds from Earn Out 0 0 0Net Lease Income 0 0 0Net Seller Note Interest 45,225 0 45,225Liquidation Components (77,535) 0 (77,535)
Net Total Liquidation Results $561,405 $0 $561,405
Net Transaction Proceeds are the amounts projected to be received from the transaction after payment of closing costs and taxes.
Net Seller Note Interest is the projected interest income to be received by the Seller as a result of extending financing to the Buyer.
The Liquidation Components are Asset and Liability amounts remaining after the transaction which were not transferred to the Buyer.
The Net Liquidation Recap details by source the projected amounts to be received by the Seller "After" tax and closing costs.
Page 37

Page 38
Year 1 Year 2 Year 3 Year 4 Year 5 Year 6 Year 7 Year 8 Year 9 Year 10 Year 11 Total
Entity LevelBusiness Assets $560,000 $0 $41,544 $44,547 $47,767 $51,220 $54,922 $0 $0 $0 $0 $800,000Earn Out 0 0 0 0 0 0 0 0 0 0 0 0Non-Competition 0 0 0 0 0 0 0 0 0 0 0 0Consulting 0 0 0 0 0 0 0 0 0 0 0 0Lease and Rental 0 0 0 0 0 0 0 0 0 0 0 0License and Royalty Fees 0 0 0 0 0 0 0 0 0 0 0 0Interest Income - Seller Note 16,800 16,800 15,484 12,481 9,260 5,807 2,078 0 0 0 0 78,710Stock 0 0 0 0 0 0 0 0 0 0 0 0Other 0 0 0 0 0 0 0 0 0 0 0 0Other 0 0 0 0 0 0 0 0 0 0 0 0
Less:Salary 0 0 0 0 0 0 0 0 0 0 0 0Health Insurance Premiums 0 0 0 0 0 0 0 0 0 0 0 0Retirement Plan 0 0 0 0 0 0 0 0 0 0 0 0Closing Costs (95,000) 0 0 0 0 0 0 0 0 0 0 (95,000)Other 0 0 0 0 0 0 0 0 0 0 0 0Other 0 0 0 0 0 0 0 0 0 0 0 0
Sub-Total Entity Level 481,800 16,800 57,028 57,028 57,027 57,027 57,000 0 0 0 0 783,710
Personal LevelSalary from Business 0 0 0 0 0 0 0 0 0 0 0 0Employment Agreement 0 0 0 0 0 0 0 0 0 0 0 0Consulting Agreement 0 0 0 0 0 0 0 0 0 0 0 0Retirement Plan Distributions 0 0 0 0 0 0 0 0 0 0 0 0Business Assets 0 0 0 0 0 0 0 0 0 0 0 0Stock 0 0 0 0 0 0 0 0 0 0 0 0Non-Competition 0 0 0 0 0 0 0 0 0 0 0 0Lease and Rental 0 0 0 0 0 0 0 0 0 0 0 0License and Royalty Fees 0 0 0 0 0 0 0 0 0 0 0 0Interest Income - Seller Note 0 0 0 0 0 0 0 0 0 0 0 0Closing Costs 0 0 0 0 0 0 0 0 0 0 0 0Other 0 0 0 0 0 0 0 0 0 0 0 0Other 0 0 0 0 0 0 0 0 0 0 0 0
Sub-Total Personal Level 0 0 0 0 0 0 0 0 0 0 0 0
Total Transaction 481,800 16,800 57,028 57,028 57,027 57,027 57,000 0 0 0 0 783,710
Less:Entity Level Tax (67,495) (6,895) (14,060) (13,384) (12,659) (11,882) (11,038) 0 0 0 0 (137,413)Franchise Tax (3,257) (252) (781) (776) (770) (764) (757) 0 0 0 0 (7,357)Personal Tax 0 0 0 0 0 0 0 0 0 0 0 0
Liquidation Additions 111,785 0 0 0 0 0 0 0 0 0 0 111,785
Liquidation Subtractions (189,320) 0 0 0 0 0 0 0 0 0 0 (189,320)
Sub-Total Tax (70,752) (7,147) (14,841) (14,160) (13,429) (12,646) (11,795) 0 0 0 0 (144,770)
Net to Owner $333,513 $9,653 $42,187 $42,868 $43,598 $44,381 $45,205 $0 $0 $0 $0 $561,405
Sample Business Transaction Activity – Scenario # 2

Sample Business Transaction Gain Analysis – Scenario # 2
Tax Closing Ordinary Depreciation Unrecaptured Built In CapitalAllocation Basis Costs Gain Income Recapture 1250 Gain Gain Gain Total
Entity Level:
Business Assets:
Cash $0 $0 $0 $0 $0 $0 $0 $0 $0 $0Accounts Receivable 0 0 0 0 0 0 0 0 0 0Work In Progress - Contracts 0 0 0 0 0 0 0 0 0 0Inventory 0 0 0 0 0 0 0 0 0 0Office Furniture 5,955 (440) (707) 4,808 0 4,808 0 0 0 4,808Office Equipment 6,211 (6,211) (738) (738) 0 0 0 0 (738) (738)Tools 2,352 (3,563) (279) (1,490) 0 0 0 0 (1,490) (1,490)Machinery 208,330 (208,330) (24,739) (24,739) 0 0 0 0 (24,739) (24,739)Scanners 120,000 (22,078) (14,250) 83,672 0 83,672 0 0 0 83,672Topometric Sensor 18,744 (18,744) (2,226) (2,226) 0 0 0 0 (2,226) (2,226)Computer Equipment 15,481 (15,481) (1,838) (1,838) 0 0 0 0 (1,838) (1,838)Computer Software 5,000 (2,919) (594) 1,487 0 1,487 0 0 0 1,487Vehicles 10,437 (7,000) (1,239) 2,198 0 2,198 0 0 0 2,198Platforms 7,490 (7,490) (889) (889) 0 0 0 0 (889) (889)Leasehold Improvements 0 (891) 0 (891) 0 0 0 0 (891) (891)Goodwill 400,000 0 (47,501) 352,499 0 0 0 0 352,499 352,499
Sub-Total Business Assets 800,000 (293,147) (95,000) 411,853 0 92,165 0 0 319,688 411,853
Other:
Consulting Agreement 0 0 0 0 0 0 0 0 0 0Non-Competition Agreement 0 0 0 0 0 0 0 0 0 0Lease and Rental 0 0 0 0 0 0 0 0 0 0License and Royalty Fees 0 0 0 0 0 0 0 0 0 0
Sub-Total Other 0 0 0 0 0 0 0 0 0 0
Total Entity Level 800,000 (293,147) (95,000) 411,853 0 92,165 0 0 319,688 411,853
Personal Level:
Shareholder(s):
Consulting Agreement 0 0 0 0 0 0 0 0 0 0Employment Agreement 0 0 0 0 0 0 0 0 0 0Non-Competition Agreement 0 0 0 0 0 0 0 0 0 0Goodwill 0 0 0 0 0 0 0 0 0 0Stock / Ownership Interest 0 0 0 0 0 0 0 0 0 0Real Estate - Land 0 0 0 0 0 0 0 0 0 0Real Estate - Buildings 0 0 0 0 0 0 0 0 0 0
Total Personal Level 0 0 0 0 0 0 0 0 0 0
Grand Total - Transaction $800,000 ($293,147) ($95,000) $411,853 $0 $92,165 $0 $0 $319,688 $411,853
Transaction Gain Calculation Transaction Gain Categories
Page 39

Page 40
Year 1 Year 2 Year 3 Year 4 Year 5 Year 6 Year 7 Year 8 Year 9 Year 10 Year 11 Total
Entity Level:Ordinary Income:
Business Assets 0 0 0 0 0 0 0 0 0 0 0 0Non-Competition 0 0 0 0 0 0 0 0 0 0 0 0Consulting 0 0 0 0 0 0 0 0 0 0 0 0Lease and Rental 0 0 0 0 0 0 0 0 0 0 0 0License and Royalty Fees 0 0 0 0 0 0 0 0 0 0 0 0Stock / Ownership Interest 0 0 0 0 0 0 0 0 0 0 0 0Interest Income - Seller Note 16,800 16,800 15,484 12,481 9,260 5,807 2,078 0 0 0 0 78,710Deduction - Salary 0 0 0 0 0 0 0 0 0 0 0 0Other 0 0 0 0 0 0 0 0 0 0 0 0
Sub-Total Ordinary Income 16,800 16,800 15,484 12,481 9,260 5,807 2,078 0 0 0 0 78,710
Depreciation Recapture: 92,165 0 0 0 0 0 0 0 0 0 0 92,165
Unrecaptured 1250 Gain: 0 0 0 0 0 0 0 0 0 0 0 0
Built In Gain: 0 0 0 0 0 0 0 0 0 0 0 0
Capital Gain:Business Assets 108,200 0 36,609 39,255 42,092 45,135 48,397 0 0 0 0 319,688Earn Out 0 0 0 0 0 0 0 0 0 0 0 0Stock / Ownership Interest 0 0 0 0 0 0 0 0 0 0 0 0Other 0 0 0 0 0 0 0 0 0 0 0 0
Sub-Total Capital Gain 108,200 0 36,609 39,255 42,092 45,135 48,397 0 0 0 0 319,688
Total - Entity Level 217,165 16,800 52,093 51,736 51,352 50,942 50,475 0 0 0 0 490,563
Personal LevelOrdinary Income:
Salary from Business 0 0 0 0 0 0 0 0 0 0 0 0Employment Agreement 0 0 0 0 0 0 0 0 0 0 0 0Consulting 0 0 0 0 0 0 0 0 0 0 0 0Retirement Plan Distributions 0 0 0 0 0 0 0 0 0 0 0 0Business Assets 0 0 0 0 0 0 0 0 0 0 0 0Stock / Ownership Interest 0 0 0 0 0 0 0 0 0 0 0 0Non-Competition 0 0 0 0 0 0 0 0 0 0 0 0Lease and Rental 0 0 0 0 0 0 0 0 0 0 0 0License and Royalty Fees 0 0 0 0 0 0 0 0 0 0 0 0Interest Income - Seller Note 0 0 0 0 0 0 0 0 0 0 0 0Other 0 0 0 0 0 0 0 0 0 0 0 0
Sub-Total Ordinary Income 0 0 0 0 0 0 0 0 0 0 0 0
Depreciation Recapture: 0 0 0 0 0 0 0 0 0 0 0 0
Unrecaptured 1250 Gain: 0 0 0 0 0 0 0 0 0 0 0 0
Built In Gain: 0 0 0 0 0 0 0 0 0 0 0 0
Capital Gain:Business Assets 0 0 0 0 0 0 0 0 0 0 0 0Earn Out 0 0 0 0 0 0 0 0 0 0 0 0Stock / Ownership Interest 0 0 0 0 0 0 0 0 0 0 0 0Other 0 0 0 0 0 0 0 0 0 0 0 0
Sub-Total Capital Gain 0 0 0 0 0 0 0 0 0 0 0 0
Total - Personal Level 0 0 0 0 0 0 0 0 0 0 0 0
Sample Business Income Subject to Taxation – Scenario # 2

Sample Business Tax Rate Assumptions – Scenario # 2
Year 1 Year 2 Year 3 Year 4 Year 5 Year 6 Year 7 Year 8 Year 9 Year 10 Year 11
Entity Tax Rates - FederalIncome Tax 35.00% 35.00% 35.00% 35.00% 35.00% 35.00% 35.00% 35.00% 35.00% 35.00% 35.00%Capital Gain 15.00% 15.00% 15.00% 15.00% 15.00% 15.00% 15.00% 15.00% 15.00% 15.00% 15.00%Unrecaptured 1250 Gain 25.00% 25.00% 25.00% 25.00% 25.00% 25.00% 25.00% 25.00% 25.00% 25.00% 25.00%Built In Gain 35.00% 35.00% 35.00% 35.00% 35.00% 35.00% 35.00% 35.00% 35.00% 35.00% 35.00%Social Security Tax 6.20% 6.20% 6.20% 6.20% 6.20% 6.20% 6.20% 6.20% 6.20% 6.20% 6.20%Medicare Tax 1.45% 1.45% 1.45% 1.45% 1.45% 1.45% 1.45% 1.45% 1.45% 1.45% 1.45%
Entity Tax Rates - StateIncome Tax 9.30% 9.30% 9.30% 9.30% 9.30% 9.30% 9.30% 9.30% 9.30% 9.30% 9.30%Capital Gain 9.30% 9.30% 9.30% 9.30% 9.30% 9.30% 9.30% 9.30% 9.30% 9.30% 9.30%
Dividend Tax Rate - Federal 0.00% 0.00% 0.00% 0.00% 0.00% 0.00% 0.00% 0.00% 0.00% 0.00% 0.00%
Dividend Tax Rate - State 0.00% 0.00% 0.00% 0.00% 0.00% 0.00% 0.00% 0.00% 0.00% 0.00% 0.00%
Personal Tax Rates - FederalIncome Tax 35.00% 35.00% 35.00% 35.00% 35.00% 35.00% 35.00% 35.00% 35.00% 35.00% 35.00%Capital Gain 15.00% 15.00% 15.00% 15.00% 15.00% 15.00% 15.00% 15.00% 15.00% 15.00% 15.00%Unrecaptured 1250 Gain 25.00% 25.00% 25.00% 25.00% 25.00% 25.00% 25.00% 25.00% 25.00% 25.00% 25.00%Social Security Tax 6.20% 6.20% 6.20% 6.20% 6.20% 6.20% 6.20% 6.20% 6.20% 6.20% 6.20%Medicare Tax 1.45% 1.45% 1.45% 1.45% 1.45% 1.45% 1.45% 1.45% 1.45% 1.45% 1.45%Self Employment Tax 15.30% 15.30% 15.30% 15.30% 15.30% 15.30% 15.30% 15.30% 15.30% 15.30% 15.30%Self Employment - Medicare Only 2.90% 2.90% 2.90% 2.90% 2.90% 2.90% 2.90% 2.90% 2.90% 2.90% 2.90%
Personal Tax Rates - StateIncome Tax 9.30% 9.30% 9.30% 9.30% 9.30% 9.30% 9.30% 9.30% 9.30% 9.30% 9.30%Capital Gain 9.30% 9.30% 9.30% 9.30% 9.30% 9.30% 9.30% 9.30% 9.30% 9.30% 9.30%
Page 41

Page 42
Year 1 Year 2 Year 3 Year 4 Year 5 Year 6 Year 7 Year 8 Year 9 Year 10 Year 11 Total
Entity Level:State Tax:
Ordinary Income: 1,562 1,562 1,440 1,161 861 540 193 0 0 0 0 7,319Depreciation Recapture: 8,571 0 0 0 0 0 0 0 0 0 0 8,571Unrecaptured 1250 Gain: 0 0 0 0 0 0 0 0 0 0 0 0Built In Gain: 0 0 0 0 0 0 0 0 0 0 0 0Capital Gain: 10,063 0 3,405 3,651 3,915 4,198 4,501 0 0 0 0 29,733
Sub-Total State 20,196 1,562 4,845 4,812 4,776 4,738 4,694 0 0 0 0 45,623
Federal Tax:Ordinary Income: (1,189) 5,333 3,724 2,684 1,569 374 (916) 0 0 0 0 11,579Depreciation Recapture: 32,258 0 0 0 0 0 0 0 0 0 0 32,258Unrecaptured 1250 Gain: 0 0 0 0 0 0 0 0 0 0 0 0Built In Gain: 0 0 0 0 0 0 0 0 0 0 0 0Capital Gain: 16,230 0 5,491 5,888 6,314 6,770 7,260 0 0 0 0 47,953Payroll: 0 0 0 0 0 0 0 0 0 0 0 0
Sub-Total Federal 47,299 5,333 9,215 8,572 7,883 7,144 6,344 0 0 0 0 91,790
Total Entity Level Tax 67,495 6,895 14,060 13,384 12,659 11,882 11,038 0 0 0 0 137,413
Franchise:California 3,257 252 781 776 770 764 757 0 0 0 0 7,357Other 0 0 0 0 0 0 0 0 0 0 0 0
Total Franchise Tax 3,257 252 781 776 770 764 757 0 0 0 0 7,357
Personal Level:State Tax:
Ordinary Income: 0 0 0 0 0 0 0 0 0 0 0 0Depreciation Recapture: 0 0 0 0 0 0 0 0 0 0 0 0Unrecaptured 1250 Gain: 0 0 0 0 0 0 0 0 0 0 0 0Built In Gain: 0 0 0 0 0 0 0 0 0 0 0 0Capital Gain: 0 0 0 0 0 0 0 0 0 0 0 0
Sub-Total State 0 0 0 0 0 0 0 0 0 0 0 0
Federal Tax:Ordinary Income: 0 0 0 0 0 0 0 0 0 0 0 0Depreciation Recapture: 0 0 0 0 0 0 0 0 0 0 0 0Unrecaptured 1250 Gain: 0 0 0 0 0 0 0 0 0 0 0 0Built In Gain: 0 0 0 0 0 0 0 0 0 0 0 0Capital Gain: 0 0 0 0 0 0 0 0 0 0 0 0Payroll: 0 0 0 0 0 0 0 0 0 0 0 0Self-Employment: 0 0 0 0 0 0 0 0 0 0 0 0
Sub-Total Federal 0 0 0 0 0 0 0 0 0 0 0 0
Total Personal Level Tax 0 0 0 0 0 0 0 0 0 0 0 0
Total Tax 70,752 7,147 14,841 14,160 13,429 12,646 11,795 0 0 0 0 144,770
Sample Business Calculated Tax Amounts – Scenario # 2

Page 43
Entity PersonalLevel Level Total
Class I Cash 0 0 0
Class II Certificate of Deposit 0 0 0Life Insurance Policies 0 0 0Market Securites 0 0 0
Class III Accounts Receivable 0 0 0Work In Progress - Contracts 0 0 0
Class IV Inventory 0 0 0
Class V Office Furniture 5,955 0 5,955Office Equipment 6,211 0 6,211Tools 2,352 0 2,352Machinery 208,330 0 208,330Scanners 120,000 0 120,000Topometric Sensor 18,744 0 18,744Computer Equipment 15,481 0 15,481Computer Software 5,000 0 5,000Vehicles 10,437 0 10,437Platforms 7,490 0 7,490Rolling Stock (Vehicles, Trucks, etc..) 0 0 0Buildings 0 0 0Land 0 0 0Long-Term Construction Contracts 0 0 0
Class VI Customer Based Intangibles 0 0 0Supplier Based Intangibles 0 0 0Workforce In Place 0 0 0Information Database 0 0 0Know How 0 0 0Trademarks 0 0 0Patents 0 0 0Copyrights 0 0 0Licenses 0 0 0Franchise 0 0 0Covenant Not To Compete 0 0 0
Class VII Goodwill 400,000 0 400,000
Total 800,000 0 800,000
Sample Business Asset Allocation – Scenario # 2

Year 1 Year 2 Year 3 Year 4 Year 5 Year 6 Year 7 Year 8 Year 9 Year 10 Year 11 Total
Note Amortization-Corporate
Ordinary Gain % 0% 0 0 0 0 0 0 0 0 0 0 0 0Unrecap 1250 Gain % 0% 0 0 0 0 0 0 0 0 0 0 0 0Capital Gain % 88% 0 0 36,609 39,255 42,092 45,135 48,397 0 0 0 0 211,488
Total 0 0 36,609 39,255 42,092 45,135 48,397 0 0 0 0 211,488
Principal 0 0 41,544 44,547 47,767 51,220 54,922 0 0 0 0 240,000Interest 16,800 16,800 15,484 12,481 9,260 5,807 2,078 0 0 0 0 78,710
Total 16,800 16,800 57,028 57,028 57,027 57,027 57,000 0 0 0 0 318,710
Note Amortization-Personal
Ordinary Gain % 0% 0 0 0 0 0 0 0 0 0 0 0 0Unrecap 1250 Gain % 0% 0 0 0 0 0 0 0 0 0 0 0 0Capital Gain % 0% 0 0 0 0 0 0 0 0 0 0 0 0
Total 0 0 0 0 0 0 0 0 0 0 0 0
Principal 0 0 0 0 0 0 0 0 0 0 0 0Interest 0 0 0 0 0 0 0 0 0 0 0 0
Total 0 0 0 0 0 0 0 0 0 0 0 0
Sample Business Promissory Notes – Scenario # 2
Page 44

Support Schedules - Scenario # 3
The schedules which follow this page are for Scenario # 3
Page 45

Sample Business Net Proceed Analysis – Scenario # 3
Entity Owner Total
Transaction Components:
Purchase Price $560,000 $240,000 $800,000Other 0 0 0
Total Transaction Price 560,000 240,000 800,000
Less: Closing Costs (66,500) (28,500) (95,000)Tax (63,602) (86,810) (150,412)
Net Transaction Proceeds Before Interest Income 429,898 124,690 554,588
Add: Seller Note Interest Income 0 78,710 78,710
Less: Tax on Seller Note Interest 0 (32,306) (32,306)
Net Transaction Proceeds with Interest Income 429,898 171,094 600,992
Liquidation Components:
Add: Cash 58,056 0 58,056Accounts Receivable 53,729 0 53,729
Less: Current Liabilities (21,777) 0 (21,777)Other Labilities (167,543) 0 (167,543)Bank Loan 0 0 0Current Year Income Tax 0 0 0Liquidation Tax 0 0 0
Net Total Liquidation Results $352,363 $171,094 $523,457
Net Liquidation Results Recap:
Net Proceeds from Fixed Purchase Price 429,898 124,690 554,588Net Proceeds from Earn Out 0 0 0Net Lease Income 0 0 0Net Seller Note Interest 0 46,404 46,404Liquidation Components (77,535) 0 (77,535)
Net Total Liquidation Results $352,363 $171,094 $523,457
Net Transaction Proceeds are the amounts projected to be received from the transaction after payment of closing costs and taxes.
Net Seller Note Interest is the projected interest income to be received by the Seller as a result of extending financing to the Buyer.
The Liquidation Components are Asset and Liability amounts remaining after the transaction which were not transferred to the Buyer.
The Net Liquidation Recap details by source the projected amounts to be received by the Seller "After" tax and closing costs.
Page 46

Page 47
Year 1 Year 2 Year 3 Year 4 Year 5 Year 6 Year 7 Year 8 Year 9 Year 10 Year 11 Total
Entity LevelBusiness Assets $560,000 $0 $0 $0 $0 $0 $0 $0 $0 $0 $0 $560,000Earn Out 0 0 0 0 0 0 0 0 0 0 0 0Non-Competition 0 0 0 0 0 0 0 0 0 0 0 0Consulting 0 0 0 0 0 0 0 0 0 0 0 0Lease and Rental 0 0 0 0 0 0 0 0 0 0 0 0License and Royalty Fees 0 0 0 0 0 0 0 0 0 0 0 0Interest Income - Seller Note 0 0 0 0 0 0 0 0 0 0 0 0Stock 0 0 0 0 0 0 0 0 0 0 0 0Other 0 0 0 0 0 0 0 0 0 0 0 0Other 0 0 0 0 0 0 0 0 0 0 0 0
Less:Salary 0 0 0 0 0 0 0 0 0 0 0 0Health Insurance Premiums 0 0 0 0 0 0 0 0 0 0 0 0Retirement Plan 0 0 0 0 0 0 0 0 0 0 0 0Closing Costs (66,500) 0 0 0 0 0 0 0 0 0 0 (66,500)Other 0 0 0 0 0 0 0 0 0 0 0 0Other 0 0 0 0 0 0 0 0 0 0 0 0
Sub-Total Entity Level 493,500 0 0 0 0 0 0 0 0 0 0 493,500
Personal LevelSalary from Business 0 0 0 0 0 0 0 0 0 0 0 0Employment Agreement 0 0 0 0 0 0 0 0 0 0 0 0Consulting Agreement 0 0 0 0 0 0 0 0 0 0 0 0Retirement Plan Distributions 0 0 0 0 0 0 0 0 0 0 0 0Business Assets 0 0 0 0 0 0 0 0 0 0 0 0Stock 0 0 0 0 0 0 0 0 0 0 0 0Non-Competition 0 0 41,544 44,547 47,767 51,220 54,922 0 0 0 0 240,000Lease and Rental 0 0 0 0 0 0 0 0 0 0 0 0License and Royalty Fees 0 0 0 0 0 0 0 0 0 0 0 0Interest Income - Seller Note 16,800 16,800 15,484 12,481 9,260 5,807 2,078 0 0 0 0 78,710Closing Costs (28,500) 0 0 0 0 0 0 0 0 0 0 (28,500)Other 0 0 0 0 0 0 0 0 0 0 0 0Other 0 0 0 0 0 0 0 0 0 0 0 0
Sub-Total Personal Level (11,700) 16,800 57,028 57,028 57,027 57,027 57,000 0 0 0 0 290,210
Total Transaction 481,800 16,800 57,028 57,028 57,027 57,027 57,000 0 0 0 0 783,710
Less:Entity Level Tax (60,597) 0 0 0 0 0 0 0 0 0 0 (60,597)Franchise Tax (3,005) 0 0 0 0 0 0 0 0 0 0 (3,005)Personal Tax (6,895) (6,895) (21,382) (21,235) (21,078) (20,909) (20,722) 0 0 0 0 (119,116)
Liquidation Additions 111,785 0 0 0 0 0 0 0 0 0 0 111,785
Liquidation Subtractions (189,320) 0 0 0 0 0 0 0 0 0 0 (189,320)
Sub-Total Tax (70,497) (6,895) (21,382) (21,235) (21,078) (20,909) (20,722) 0 0 0 0 (182,718)
Net to Owner $333,768 $9,905 $35,646 $35,793 $35,949 $36,118 $36,278 $0 $0 $0 $0 $523,457
Sample Business Transaction Activity – Scenario # 3

Sample Business Transaction Gain Analysis – Scenario # 3
Tax Closing Ordinary Depreciation Unrecaptured Built In CapitalAllocation Basis Costs Gain Income Recapture 1250 Gain Gain Gain Total
Entity Level:
Business Assets:
Cash $0 $0 $0 $0 $0 $0 $0 $0 $0 $0Accounts Receivable 0 0 0 0 0 0 0 0 0 0Work In Progress - Contracts 0 0 0 0 0 0 0 0 0 0Inventory 0 0 0 0 0 0 0 0 0 0Office Furniture 5,955 (440) (707) 4,808 0 4,808 0 0 0 4,808Office Equipment 6,211 (6,211) (738) (738) 0 0 0 0 (738) (738)Tools 2,352 (3,563) (279) (1,490) 0 0 0 0 (1,490) (1,490)Machinery 208,330 (208,330) (24,739) (24,739) 0 0 0 0 (24,739) (24,739)Scanners 120,000 (22,078) (14,250) 83,672 0 83,672 0 0 0 83,672Topometric Sensor 18,744 (18,744) (2,226) (2,226) 0 0 0 0 (2,226) (2,226)Computer Equipment 15,481 (15,481) (1,838) (1,838) 0 0 0 0 (1,838) (1,838)Computer Software 5,000 (2,919) (594) 1,487 0 1,487 0 0 0 1,487Vehicles 10,437 (7,000) (1,239) 2,198 0 2,198 0 0 0 2,198Platforms 7,490 (7,490) (889) (889) 0 0 0 0 (889) (889)Leasehold Improvements 0 (891) 0 (891) 0 0 0 0 (891) (891)Goodwill 160,000 0 (19,001) 140,999 0 0 0 0 140,999 140,999
Sub-Total Business Assets 560,000 (293,147) (66,500) 200,353 0 92,165 0 0 108,188 200,353
Other:
Consulting Agreement 0 0 0 0 0 0 0 0 0 0Non-Competition Agreement 0 0 0 0 0 0 0 0 0 0Lease and Rental 0 0 0 0 0 0 0 0 0 0License and Royalty Fees 0 0 0 0 0 0 0 0 0 0
Sub-Total Other 0 0 0 0 0 0 0 0 0 0
Total Entity Level 560,000 (293,147) (66,500) 200,353 0 92,165 0 0 108,188 200,353
Personal Level:
Shareholder(s):
Consulting Agreement 0 0 0 0 0 0 0 0 0 0Employment Agreement 0 0 0 0 0 0 0 0 0 0Non-Competition Agreement 240,000 0 (28,500) 211,500 211,500 0 0 0 0 211,500Goodwill 0 0 0 0 0 0 0 0 0 0Stock / Ownership Interest 0 0 0 0 0 0 0 0 0 0Real Estate - Land 0 0 0 0 0 0 0 0 0 0Real Estate - Buildings 0 0 0 0 0 0 0 0 0 0
Total Personal Level 240,000 0 (28,500) 211,500 211,500 0 0 0 0 211,500
Grand Total - Transaction $800,000 ($293,147) ($95,000) $411,853 $211,500 $92,165 $0 $0 $108,188 $411,853
Transaction Gain Calculation Transaction Gain Categories
Page 48

Page 49
Year 1 Year 2 Year 3 Year 4 Year 5 Year 6 Year 7 Year 8 Year 9 Year 10 Year 11 Total
Entity Level:Ordinary Income:
Business Assets 0 0 0 0 0 0 0 0 0 0 0 0Non-Competition 0 0 0 0 0 0 0 0 0 0 0 0Consulting 0 0 0 0 0 0 0 0 0 0 0 0Lease and Rental 0 0 0 0 0 0 0 0 0 0 0 0License and Royalty Fees 0 0 0 0 0 0 0 0 0 0 0 0Stock / Ownership Interest 0 0 0 0 0 0 0 0 0 0 0 0Interest Income - Seller Note 0 0 0 0 0 0 0 0 0 0 0 0Deduction - Salary 0 0 0 0 0 0 0 0 0 0 0 0Other 0 0 0 0 0 0 0 0 0 0 0 0
Sub-Total Ordinary Income 0 0 0 0 0 0 0 0 0 0 0 0
Depreciation Recapture: 92,165 0 0 0 0 0 0 0 0 0 0 92,165
Unrecaptured 1250 Gain: 0 0 0 0 0 0 0 0 0 0 0 0
Built In Gain: 0 0 0 0 0 0 0 0 0 0 0 0
Capital Gain:Business Assets 108,188 0 0 0 0 0 0 0 0 0 0 108,188Earn Out 0 0 0 0 0 0 0 0 0 0 0 0Stock / Ownership Interest 0 0 0 0 0 0 0 0 0 0 0 0Other 0 0 0 0 0 0 0 0 0 0 0 0
Sub-Total Capital Gain 108,188 0 0 0 0 0 0 0 0 0 0 108,188
Total - Entity Level 200,353 0 0 0 0 0 0 0 0 0 0 200,353
Personal LevelOrdinary Income:
Salary from Business 0 0 0 0 0 0 0 0 0 0 0 0Employment Agreement 0 0 0 0 0 0 0 0 0 0 0 0Consulting 0 0 0 0 0 0 0 0 0 0 0 0Retirement Plan Distributions 0 0 0 0 0 0 0 0 0 0 0 0Business Assets 0 0 0 0 0 0 0 0 0 0 0 0Stock / Ownership Interest 0 0 0 0 0 0 0 0 0 0 0 0Non-Competition 0 0 36,609 39,255 42,092 45,135 48,409 0 0 0 0 211,500Lease and Rental 0 0 0 0 0 0 0 0 0 0 0 0License and Royalty Fees 0 0 0 0 0 0 0 0 0 0 0 0Interest Income - Seller Note 16,800 16,800 15,484 12,481 9,260 5,807 2,078 0 0 0 0 78,710Other 0 0 0 0 0 0 0 0 0 0 0 0
Sub-Total Ordinary Income 16,800 16,800 52,093 51,736 51,352 50,942 50,487 0 0 0 0 290,210
Depreciation Recapture: 0 0 0 0 0 0 0 0 0 0 0 0
Unrecaptured 1250 Gain: 0 0 0 0 0 0 0 0 0 0 0 0
Built In Gain: 0 0 0 0 0 0 0 0 0 0 0 0
Capital Gain:Business Assets 0 0 0 0 0 0 0 0 0 0 0 0Earn Out 0 0 0 0 0 0 0 0 0 0 0 0Stock / Ownership Interest 0 0 0 0 0 0 0 0 0 0 0 0Other 0 0 0 0 0 0 0 0 0 0 0 0
Sub-Total Capital Gain 0 0 0 0 0 0 0 0 0 0 0 0
Total - Personal Level 16,800 16,800 52,093 51,736 51,352 50,942 50,487 0 0 0 0 290,210
Sample Business Income Subject to Taxation – Scenario # 3

Sample Business Tax Rate Assumptions – Scenario # 3
Year 1 Year 2 Year 3 Year 4 Year 5 Year 6 Year 7 Year 8 Year 9 Year 10 Year 11
Entity Tax Rates - FederalIncome Tax 35.00% 35.00% 35.00% 35.00% 35.00% 35.00% 35.00% 35.00% 35.00% 35.00% 35.00%Capital Gain 15.00% 15.00% 15.00% 15.00% 15.00% 15.00% 15.00% 15.00% 15.00% 15.00% 15.00%Unrecaptured 1250 Gain 25.00% 25.00% 25.00% 25.00% 25.00% 25.00% 25.00% 25.00% 25.00% 25.00% 25.00%Built In Gain 35.00% 35.00% 35.00% 35.00% 35.00% 35.00% 35.00% 35.00% 35.00% 35.00% 35.00%Social Security Tax 6.20% 6.20% 6.20% 6.20% 6.20% 6.20% 6.20% 6.20% 6.20% 6.20% 6.20%Medicare Tax 1.45% 1.45% 1.45% 1.45% 1.45% 1.45% 1.45% 1.45% 1.45% 1.45% 1.45%
Entity Tax Rates - StateIncome Tax 9.30% 9.30% 9.30% 9.30% 9.30% 9.30% 9.30% 9.30% 9.30% 9.30% 9.30%Capital Gain 9.30% 9.30% 9.30% 9.30% 9.30% 9.30% 9.30% 9.30% 9.30% 9.30% 9.30%
Dividend Tax Rate - Federal 0.00% 0.00% 0.00% 0.00% 0.00% 0.00% 0.00% 0.00% 0.00% 0.00% 0.00%
Dividend Tax Rate - State 0.00% 0.00% 0.00% 0.00% 0.00% 0.00% 0.00% 0.00% 0.00% 0.00% 0.00%
Personal Tax Rates - FederalIncome Tax 35.00% 35.00% 35.00% 35.00% 35.00% 35.00% 35.00% 35.00% 35.00% 35.00% 35.00%Capital Gain 15.00% 15.00% 15.00% 15.00% 15.00% 15.00% 15.00% 15.00% 15.00% 15.00% 15.00%Unrecaptured 1250 Gain 25.00% 25.00% 25.00% 25.00% 25.00% 25.00% 25.00% 25.00% 25.00% 25.00% 25.00%Social Security Tax 6.20% 6.20% 6.20% 6.20% 6.20% 6.20% 6.20% 6.20% 6.20% 6.20% 6.20%Medicare Tax 1.45% 1.45% 1.45% 1.45% 1.45% 1.45% 1.45% 1.45% 1.45% 1.45% 1.45%Self Employment Tax 15.30% 15.30% 15.30% 15.30% 15.30% 15.30% 15.30% 15.30% 15.30% 15.30% 15.30%Self Employment - Medicare Only 2.90% 2.90% 2.90% 2.90% 2.90% 2.90% 2.90% 2.90% 2.90% 2.90% 2.90%
Personal Tax Rates - StateIncome Tax 9.30% 9.30% 9.30% 9.30% 9.30% 9.30% 9.30% 9.30% 9.30% 9.30% 9.30%Capital Gain 9.30% 9.30% 9.30% 9.30% 9.30% 9.30% 9.30% 9.30% 9.30% 9.30% 9.30%
Page 50

Page 51
Year 1 Year 2 Year 3 Year 4 Year 5 Year 6 Year 7 Year 8 Year 9 Year 10 Year 11 Total
Entity Level:State Tax:
Ordinary Income: 0 0 0 0 0 0 0 0 0 0 0 0Depreciation Recapture: 8,571 0 0 0 0 0 0 0 0 0 0 8,571Unrecaptured 1250 Gain: 0 0 0 0 0 0 0 0 0 0 0 0Built In Gain: 0 0 0 0 0 0 0 0 0 0 0 0Capital Gain: 10,061 0 0 0 0 0 0 0 0 0 0 10,061
Sub-Total State 18,632 0 0 0 0 0 0 0 0 0 0 18,632
Federal Tax:Ordinary Income: (6,521) 0 0 0 0 0 0 0 0 0 0 (6,521)Depreciation Recapture: 32,258 0 0 0 0 0 0 0 0 0 0 32,258Unrecaptured 1250 Gain: 0 0 0 0 0 0 0 0 0 0 0 0Built In Gain: 0 0 0 0 0 0 0 0 0 0 0 0Capital Gain: 16,228 0 0 0 0 0 0 0 0 0 0 16,228Payroll: 0 0 0 0 0 0 0 0 0 0 0 0
Sub-Total Federal 41,965 0 0 0 0 0 0 0 0 0 0 41,965
Total Entity Level Tax 60,597 0 0 0 0 0 0 0 0 0 0 60,597
Franchise:California 3,005 0 0 0 0 0 0 0 0 0 0 3,005Other 0 0 0 0 0 0 0 0 0 0 0 0
Total Franchise Tax 3,005 0 0 0 0 0 0 0 0 0 0 3,005
Personal Level:State Tax:
Ordinary Income: 1,562 1,562 4,845 4,811 4,776 4,738 4,695 0 0 0 0 26,989Depreciation Recapture: 0 0 0 0 0 0 0 0 0 0 0 0Unrecaptured 1250 Gain: 0 0 0 0 0 0 0 0 0 0 0 0Built In Gain: 0 0 0 0 0 0 0 0 0 0 0 0Capital Gain: 0 0 0 0 0 0 0 0 0 0 0 0
Sub-Total State 1,562 1,562 4,845 4,811 4,776 4,738 4,695 0 0 0 0 26,989
Federal Tax:Ordinary Income: 5,333 5,333 16,537 16,424 16,302 16,171 16,027 0 0 0 0 92,127Depreciation Recapture: 0 0 0 0 0 0 0 0 0 0 0 0Unrecaptured 1250 Gain: 0 0 0 0 0 0 0 0 0 0 0 0Built In Gain: 0 0 0 0 0 0 0 0 0 0 0 0Capital Gain: 0 0 0 0 0 0 0 0 0 0 0 0Payroll: 0 0 0 0 0 0 0 0 0 0 0 0Self-Employment: 0 0 0 0 0 0 0 0 0 0 0 0
Sub-Total Federal 5,333 5,333 16,537 16,424 16,302 16,171 16,027 0 0 0 0 92,127
Total Personal Level Tax 6,895 6,895 21,382 21,235 21,078 20,909 20,722 0 0 0 0 119,116
Total Tax 70,497 6,895 21,382 21,235 21,078 20,909 20,722 0 0 0 0 182,718
Sample Business Calculated Tax Amounts – Scenario # 3

Page 52
Entity PersonalLevel Level Total
Class I Cash 0 0 0
Class II Certificate of Deposit 0 0 0Life Insurance Policies 0 0 0Market Securites 0 0 0
Class III Accounts Receivable 0 0 0Work In Progress - Contracts 0 0 0
Class IV Inventory 0 0 0
Class V Office Furniture 5,955 0 5,955Office Equipment 6,211 0 6,211Tools 2,352 0 2,352Machinery 208,330 0 208,330Scanners 120,000 0 120,000Topometric Sensor 18,744 0 18,744Computer Equipment 15,481 0 15,481Computer Software 5,000 0 5,000Vehicles 10,437 0 10,437Platforms 7,490 0 7,490Rolling Stock (Vehicles, Trucks, etc..) 0 0 0Buildings 0 0 0Land 0 0 0Long-Term Construction Contracts 0 0 0
Class VI Customer Based Intangibles 0 0 0Supplier Based Intangibles 0 0 0Workforce In Place 0 0 0Information Database 0 0 0Know How 0 0 0Trademarks 0 0 0Patents 0 0 0Copyrights 0 0 0Licenses 0 0 0Franchise 0 0 0Covenant Not To Compete 160,000 240,000 400,000
Class VII Goodwill 0 0 0
Total 560,000 240,000 800,000
Sample Business Asset Allocation – Scenario # 3

Year 1 Year 2 Year 3 Year 4 Year 5 Year 6 Year 7 Year 8 Year 9 Year 10 Year 11 Total
Note Amortization-Corporate
Ordinary Gain % 0% 0 0 0 0 0 0 0 0 0 0 0 0Unrecap 1250 Gain % 0% 0 0 0 0 0 0 0 0 0 0 0 0Capital Gain % 0% 0 0 0 0 0 0 0 0 0 0 0 0
Total 0 0 0 0 0 0 0 0 0 0 0 0
Principal 0 0 0 0 0 0 0 0 0 0 0 0Interest 0 0 0 0 0 0 0 0 0 0 0 0
Total 0 0 0 0 0 0 0 0 0 0 0 0
Note Amortization-Personal
Ordinary Gain % 0% 0 0 0 0 0 0 0 0 0 0 0 0Unrecap 1250 Gain % 0% 0 0 0 0 0 0 0 0 0 0 0 0Capital Gain % 88% 0 0 36,609 39,255 42,092 45,135 48,409 0 0 0 0 211,500
Total 0 0 36,609 39,255 42,092 45,135 48,409 0 0 0 0 211,500
Principal 0 0 41,544 44,547 47,767 51,220 54,922 0 0 0 0 240,000Interest 16,800 16,800 15,484 12,481 9,260 5,807 2,078 0 0 0 0 78,710
Total 16,800 16,800 57,028 57,028 57,027 57,027 57,000 0 0 0 0 318,710
Sample Business Promissory Notes – Scenario # 3
Page 53

Page 54