tax effects on the cost of capital - the national bureau ... · 5 tax effects on the cost of...
TRANSCRIPT

This PDF is a selection from an out-of-print volume from the National Bureauof Economic Research
Volume Title: Canada-U.S. Tax Comparisons
Volume Author/Editor: John B. Shoven and John Whalley, editors
Volume Publisher: University of Chicago Press
Volume ISBN: 0-226-75483-9
Volume URL: http://www.nber.org/books/shov92-1
Conference Date: July 26-27, 1990
Publication Date: January 1992
Chapter Title: Tax Effects on the Cost of Capital
Chapter Author: Kenneth McKenzie, Jack Mintz
Chapter URL: http://www.nber.org/chapters/c7482
Chapter pages in book: (p. 189 - 216)

5 Tax Effects on the Cost of Capital Kenneth J. McKenzie and Jack M. Mintz
5.1 Introduction
Given the important economic linkages and the mobility of capital between the United States and Canada, it is important to understand and compare how the tax systems may distort the investment decisions of firms in the two coun- tries. Although considerable work on the distortions caused by taxes has been undertaken separately in each country, less has been done in the way of a systematic comparison of the United States and Canada, especially on a his- torical basis. ’
A tax comparison of this sort is particularly important for two reasons. The first concerns the impact of the recent free-trade agreement on capital flows between the two countries. Differences in capital taxes that affect the relative cost of production may lead to an outflow of capital from one country to the other once tariffs are removed. The second concerns the recent tax reforms in both countries. The claim has been made in the popular press in Canada that the tax reform measures had to reduce differences in the taxation of income from capital so that a flight of capital to the United States would not take place. In other words, the corporate tax systems needed to be made more “harmonious .”
Given the scope and complexity of the tax regimes in the two countries, the
Kenneth J. McKenzie is assistant professor of economics at the University of Toronto and the University of Calgary. Jack M. Mintz is the Arthur Andersen Professor of Taxation in the Faculty of Management at the University of Toronto.
The authors are indebted to Alan Auerbach, Vijay Jog, and James Poterba, and to the Depart- ment of Finance, Canada, which provided data for this project.
1. In the United States, cost-of-capital and effective-tax-rate studies have been undertaken by Auerbach (1983), King and Fullerton (1984), and Gordon (1985). Similar Canadian studies in- clude Boadway, Bruce, and Mintz (1984), Daly and Jung (1987), and Jog and Mintz (1989). For a survey on effective tax rates and an explanation of the differences in methodologies, see Boad- way (1987).
189

190 Kenneth J. McKenzie and Jack M. Mintz
existence of distorting effects of taxation on the decision to invest in capital is not self-evident.2 A framework that lends itself to comparative analysis is thus required. Toward this end, we focus on the impact of taxation on the user cost of capital (Jorgenson 1963), which is the economic cost of acquiring and holding the last, or marginal, unit of capital. We use the user cost of capital to compute a summary measure of the distorting effects of taxation on capital accumulation, conventionally referred to as the marginal effective tax rate (hereafter referred to simply as the effective tax rate [ETR], as in Auerbach 1983, King and Fullerton 1984, and Boadway, Bruce, and Mintz 1984). The ETR assesses the effect that taxation has on the incentive to hold capital, by determining the amount of taxes paid as a proportion of the operating income generated by the last, or marginal, unit of capital of a particular type held by the firm. The last unit of capital just “breaks even,” earning only enough in- come to cover the economic cost of holding it. A positive ETR on a certain type of capital means that the tax system increases the cost of a marginal unit of that capital relative to the income it generates, which means that it must earn more income in order to break even; this discourages investment. A negative ETR means that the tax system actually subsidizes investment, low- ering the user cost and providing an incentive for firms to hold that type of capital.
The tax system distorts the allocation of investment in the economy by af- fecting the investment decisions of firms, both among different types of capi- tal and among industries. These distortions impose real costs on the economy, as capital is inefficiently allocated. When capital is internationally mobile, there is an additional concern that tax systems may provide incentives for firms to invest in one country rather than another. ETR differentials between industries and capital types in two countries imply scope for the tax-induced movement of resources from highly taxed capital in one country to tax- favored capital in the other. Whether this movement actually takes place de- pends upon a number of factors, such as the mobility and substitutibility of capital between countries, sectors, and uses; differences in economic condi- tions; the institutional and regulatory environment; and labor, material, and transportation costs. Differences in ETRs between Canada and the United States may not, therefore, actually precipitate a flight of capital. We do not explicitly examine this issue, nor do we attempt to estimate how differences in the tax systems in the United States and Canada may have contributed to actual capital movements between the two countries. These require an exten- sive empirical investigation, which is beyond the scope of this paper. Rather, we seek merely to identify the distortions in the cost of capital caused by the tax systems in the two countries, and by comparing them arrive at some con-
2. We survey these differences for the current corporate tax regimes in an earlier version of this paper, McKenzie and Mintz ( 199 1 ) .
191 Tax Effects on the Cost of Capital
clusions regarding the degree of “harmony” in the corporate tax regimes and the potential for tax-motivated capital mo~ements.~
We calculate ETRs for various types of capital in different industry groups in both countries for large and medium-sized businesses, for the years 1975, 1980, 1985, and 1990. Small companies taxed at lower statutory rates are ignored, since cross-country mobility of capital does not seem to be as impor- tant an issue for them. Due to the lack of available data, we do not include property taxes, sales taxes on capital inputs, Canadian provincial capital taxes, the Canadian tax on large businesses, or the corporate minimum tax in the United States. We thus compute ETRs only for capital income taxes, which are important contributors to differences in the costs of capital across the two countries.
We arrive at some rather interesting, and we think important, conclusions. Although we compute ETRs under a number of alternative assumptions (which will be discussed at length in subsequent sections), we conclude gen- erally that in 1975 and 1980, ETRs were significantly higher in Canada than in the United States, for fully taxpaying companies. Although the extent of the distortions vary significantly by industry and by type of capital, overall ETRs in these years tended to be significantly higher in Canada. This means that the Canadian capital income tax system tended to discourage capital ac- cumulation to a greater extent over this period than the U.S. regime did. To the extent that firms were able to choose freely between Canada and the United States when making their investment decisions, the capital income tax system in the United States may have attracted investments that otherwise would have been made in Canada.
In 1985, just prior to major tax reforms in both countries, the difference in the overall ETR moderated somewhat. However, ETRs in 1985 were highly variable in both countries between industry groups and types of capital. Cap- ital in some industries faced very high ETRs, while capital in other industries faced very low (even negative) ETRs. The tax systems served to distort in- vestment decisions between the two countries, but also wirhin each country, between industry groups and different types of capital.
The recent tax reforms in the United States (1986) and Canada (1986-87) changed matters somewhat. Overall ETRs for Canada in 1990 are still higher than for the United States, but to a lesser extent than was the case in the prereform period. Differences in ETRs between the United States and Canada
3. Whether a comparison of ETRs is the appropriate way to assess the “harmony” of the two tax regimes may be open to question; it clearly depends upon the issues one is addressing. In our case, when we are comparing the pressure that the tax systems may place upon the type and location of capital firms choose to employ, assessing differences and/or similarities in ETRs be- tween the two countries appears to be an appropriate way of measuring the extent to which the tax regimes are “harmonized.” Other measures or definitions of “harmonization” may be more appro- priate in other circumstances.

192 Kenneth J. McKenzie and Jack M. Mintz
for specific industries or types of capital have also been reduced. Thus, insofar as ETRs on capital in the two countries have converged somewhat, the tax systems appear to have become more harmonious, at least for fully taxpaying companies. An important reason for the higher overall postreform ETR in Canada is the treatment of inventories, which are taxed at a much lower rate in the United States. Our estimates indicate that the ETRs on buildings, ma- chinery and equipment, and land are quite close between the two countries in 1990. This narrowing of ETRs between the two countries appears particularly important in light of the free-trade agreement, as the removal of trade distor- tions may make any tax distortions that continue to exist all the more impor- tant. On the basis of our estimates, we conclude that the overall ETR differ- entials currently existing between Canada and the United States for fully taxpaying firms do not appear to give rise to a significant incentive for capital to flow one way or the other, at least relative to the past. Nevertheless, some significant differences across sectors remain: ETRs are much higher in Canada than in the United States in the Construction, Transportation and Storage, and Wholesale Trade sectors, while U.S. rates are much higher in Communica- tions. There may be scope for some tax-motivated capital movements in these industries.
All of the above results apply to fully taxpaying companies. As is well documented (Mintz 1988; Altshuler and Auerbach 1990), Canada has a much higher proportion of companies not paying taxes in a given year. For a com- pany that has accumulated tax losses over time, the effective rate of taxation may be significantly different from that faced by a fully taxpaying firm. We examine this issue for 1990 and find that Canadian tax-loss companies face a far lower ETR than their U.S. counterparts. Important reasons for this are the discretion allowed Canadian companies in claiming tax depreciation deduc- tions, which may be postponed until the company becomes taxpaying, and the longer period of nontaxability we estimate for Canadian tax-loss firms. In addition, there is a much greater proportion of capital assets held by nontax- paying companies in Canada compared to the United States. When this is taken into account, we find that the overall ETR on capital in Canada, aggre- gating over taxpaying and tax-loss firms, is almost identical to that of the United States. However, two factors suggest that the aggregate ETR estimates for Canada may be understated. First, the recent tax reform measures should reduce the number of companies in a loss position over time, so that the ag- gregate ETR will increase. Second, in theory the existence of tax losses could raise, rather than reduce, the ETR on capital for start-up and risky companies, compared to fully taxpaying companies. If we were to include these types of companies in our calculations, aggregate Canadian ETRs would likely be somewhat higher (but then so would U.S. ETRs). Nevertheless, on the basis of our estimates for tax-loss companies, we conclude that the ETR differen- tials between the two countries are somewhat lower than suggested by the
193 Tax Effects on the Cost of Capital
fully taxpaying case, and therefore that the scope for tax-induced capital flows is lower.
Competitiveness of tax systems is particularly important for cross-border flows of direct investment by multinational corporations. This issue is impor- tant, since multinational companies are taxed on their foreign-source income earned by branches and subsidiaries operating abroad. We compare the ETRs on taxpaying U.S. multinationals with subsidiaries operating in Canada and on taxpaying Canadian multinationals with subsidiaries operating in the United States, with their counterparts operating at home. We find that there exists a tax disincentive for U.S. multinationals to operate in Canada rather than at home, and a tax incentive for Canadian multinationals to operate in the United States.
The divergent results for fully taxpaying firms, tax-loss companies, and multinational corporations emphasize an important message of this study- that there is no single ETR measure that easily captures the rich institutional features of the economies and tax systems of the two countries. ETR estimates must thus be interpreted with caution and with an eye to the assumptions which underlie the estimates.
5.2 Methodology
In this section we discuss the method used to determine the effects of taxes on the user cost of capital. The theory has been presented extensively else- where (e.g., Boadway 1987), so the discussion will focus on the areas impor- tant for an understanding of the ETR estimates that follow in subsequent sec- tions.
The manner in which the tax system impinges upon the investment deci- sions of firms may be seen by considering the following simple idea. Firms invest in all projects that yield a rate of return in excess of some “hurdle” rate required by the market. This hurdle rate is the real (inflation-adjusted) market cost of the funds invested in the project, net of depreciation, and is equal to the weighted average of the real interest rate on debt and the real rate of return required by equity holders prior to the payment of personal taxes.4 For ex- ample, if the nominal interest rate on debt is denoted i, the required return to equity is p, the expected rate of inflation is T , and the proportion of the in- vestment financed by debt is 6, the hurdle rate of return is R = pi + (1 - p) p - T. If we assume for analytical purposes that investment prospects are continuously divisible, firms accumulate capital until the last increment earns just enough operating income, net of taxes paid by the corporation, so that its
4. A risk premium may be included as well. In the discussion that immediately follows we ignore risk. Risk considerations will be dealt with in more depth later in this section. See also Shoven and Topper (ch. 6 in this volume).

194 Kenneth J. McKenzie and Jack M. Mintz
rate of return is just equal to the hurdle rate.J This last increment of capital, therefore, just “breaks even” in an economic sense, and is referred to as the marginal unit of capital. To evaluate the impact of taxation on the capital accumulation decision, we determine how taxes affect the difference between the rate of return to capital, gross of taxes, and the hurdle rate of return.
To develop the methodology, we first consider a closed economy, where all funds are supplied by domestic savers. Capital investment in a closed econ- omy is affected by both corporate taxes and personal taxes levied on the inter- est, dividends, and capital gains income received by the corporation’s owners. Owners of capital are concerned with the rate of return on their investments net of the payment of both corporate and personal income taxes. We initially show how the hurdle rate of return may be adjusted to reflect the payment of personal income taxes.
If the expected rate of inflation is IT, the personal tax rate on nominal inter- est income is m, and the tax rate on equity (perhaps a weighted average of the effective capital-gains and dividend tax rate) is c, then the net-of-tax real hurdle rate of return is R” = pi (1 - m) + (1 - p) p (1 - c) - T. To be viable, all investments must earn at least this net-of-tax rate of return, and the marginal project will earn it exactly. If household arbitrage holds, equilibrium in the capital market requires that the real after-tax rate of return on debt equals the real after-tax rate of return on equity, or i (1 - m) - IT = p (1 - c) - IT.^ Since we can observe i directly, but not p, we may use this equilibrium condition to determine that p = i (1 - m)/( 1 - c), in which case R“ = i (1 - m) - IT is the net-of-personal tax rate of return required on a marginal investment. Note that i = p only if m = c.
The imposition of corporate taxes on business income affects the cost of capital in the following way. As indicated above, the firms will accumulate capital until the rate of return earned by the last unit just equals the rate of return required by the market. To yield R” after personal taxes, a marginal investment must earn R = pi + (1 - p) p - IT after corporate taxes. Let Rg denote the gross-of-corporate-tax, net-of-depreciation, rate of return on a unit of capital required to yield R after corporate taxes. This gross-of-corporate- tax rate of return will reflect various tax provisions, such as debt interest de- ductibility, investment tax credits, and depreciation allowances. It appears in- tuitively that corporate income taxes affect the cost of capital in the following way. The deductibility of nominal interest expenses from corporate income means that the nominal cost of debt finance to the firm is i (1 - u ) , where u is the statutory corporate tax rate. A company that is given an investment tax credit (ITC) at the rate + and annual depreciation allowances that yield tax savings of uA in present value terms on the original cost of the asset faces an
5 . Operating income is equal to revenues net of salaries. expenditures on materials, depreciation
6 . This is an assumption discussed in more detail below. of capital, interest, and inventory costs.

195 Tax Effects on the Cost of Capital
effective purchase price of capital that is lowered by the amount uA (1 - k ) + + per dollar, where the base for computing depreciation allowances is re- duced by the ITC at rate k ( k = + means that the tax depreciation base is fully reduced by the ITC; k = 0 means that the ITC does not lower the base). Corporate income taxes levied at the rate u on income also reduce the rate of return, gross of depreciation, 6, by (1 - u). It is then possible to show that in equilibrium the before-corporate-tax-rate of return on a marginal unit of capi- tal, R g , must equal:
(Rf + 6) (1 - u)
Rg = ~ (1 - + - uA(1 - k ) ) - 6
where,
(2) Rf = i(l - u)P + p(1 - p) - T.'
Rf is the real weighted average net-of-corporate-tax cost of funds to the firm, where p is the debvasset ratio of the company, which we assume to be deter- mined independently of the capital-stock decision.8 The present value of de- preciation allowances on one dollar of capital, A , is calculated by discounting the annual tax saving of depreciation costs by Rf + IT, which reflects the fact that depreciation allowances are not indexed for inf la t i~n.~ The parameter k is equal to + in Canada, and 0 (prior to 1981) or +/2 (after 1981) in the United States. This is because the depreciation base is fully reduced by the ITC in Canada and, after 198 1, only by one-half in the United States. The economic rate of depreciation, 6, includes changes in the real price of capital goods and physical depreciation. The right-hand side of equation (1) plus 8 is the con- ventional user cost of capital expression in the presence of taxes. The firm accumulates capital until the gross return to capital, the left-hand side of equa- tion (l) , is just equal to the user cost.
The ETR is the hypothetical rate of tax T, which if applied to the gross-of- tax rate of return on the marginal unit of capital Rg, would just yield the net- of-personal-tax rate of return R". Thus the ETR solves (1 - T ) R ~ = R"; there- fore:
(3) R g - R"
Rg q-=-
An ETR may be computed using the expressions for Rg and R" given above for various types of capital in different industries in each country. The above expressions were developed for depreciable capital. They may be easily mod-
7. See Boadway (1987). 8. For models in which this is appropriate, see Bartholdy, Fisher, and Mintz (1987). 9. For example, under a declining balance approach, annual tax savings given at the end of
each period is ua( 1 - a)', where a is the declining-balance tax depreciation rate and r is the time since the asset was purchased. If this annual amount is divided by the factor ( 1 + Rf + n)' + I , the present value of the infinite stream of tax depreciation allowances is A = a/(a + R/ + T) .

196 Kenneth J. McKenzie and Jack M. Mintz
ified to determine an ETR for nondepreciable capital, such as land, by setting 6 = 0 and A = 0. A similar expression may also be developed for inventory capital, although it is not reported here (see Boadway, Bruce, and Mintz 1982).
An important consideration in the computation of ETRs is what has come to be known as the arbitrage assumption. The issue arises because the corpo- rate and personal tax systems treat various sources of finance differently, which means that some agents may face different rates of return on assets financed in different ways. The arbitrage assumption specifies who bears the tax differential on these assets (firms, savers, or both). For example, in the above determination of the ETR for a closed economy, we assumed that rates of return are such that savers receive the same after-corporate-and-personal- tax rate of return on a marginal unit of capital, regardless of the form of the investment-debt or equity. The arbitrage assumption in this case is known as “closed economy household arbitrage,” because the after-tax return to domes- tic households is assumed to be the appropriate arbitrage margin. But if households earn the same after-tax return on debt and equity, then the firm must face different after-tax costs for debt and equity. This can be easily seen be noting that the firm pays i( 1 - u ) for a unit of debt finance, and p = i( 1 - m)/( 1 - c) for equity. Under household arbitrage the firm bears the entire tax differential unless it just so happens that u + c (1 - u ) = m, in which case the firm is indifferent between its sources of finance. Miller (1977) has sug- gested that this condition will in fact hold in equilibrium, if there are different classes of investors facing different personal tax rates. Miller’s model is not entirely applicable for our analysis, because it assumes that there is a single corporate tax rate in the economy. But statutory corporate tax rates in fact differ both between and within Canada and the United States. Miller’s model would suggest that companies facing low statutory tax rates would be entirely equity-financed, while high-tax-rate companies would be entirely debt- financed (see Bartholdy, Fisher, and Mintz 1987). This is clearly not the case in practice.
Various arbitrage assumptions are possible, and ETR estimates are sensitive to the assumption used. In the calculations presented in the following sec- tions, we compare two alternative assumptions. The first is the closed econ- omy household arbitrage case discussed above. Although this assumption has been used to undertake international ETR comparisons in the past, it does not appear to be entirely appropriate when it is presumed that capital is interna- tionally mobile.” In this case, a more appropriate assumption is one of “open economy arbitrage”, which was initially formulated by Boadway, Bruce, and
10. Of course, this is strictly true only if there are no agency, bankruptcy, or other costs asso-
11. The closed economy assumption was used by King and Fullerton (1984) in their compari- ciated with debt or equity.
son of effective tax rates across countries.

197 Tax Effects on the Cost of Capital
Mintz (1984).12 Under the assumption of open economy arbitrage, the firm must earn a net-of-corporate-tax rate of return on capital at least as great as that required by international financial markets. For example, suppose that an investor can earn i on each dollar invested in Canadian bond assets or i* on each dollar invested U.S. bond assets. Let m’ be the tax rate on interest in- come and x’ the tax rate on foreign currency gains ( g ) earned by the marginal investor holding Canadian dollar assets. In equilibrium the investor is indiffer- ent between the two assets only if
(4) i(1 - m’) + g(l - x’) = i*(l - m’).
If foreign currency gains reflect purchasing power parity, then g = T* - P ,
which is the difference between anticipated rates of inflation in the two coun- tries. The relationship between Canadian and U.S. interest rates under inter- national arbitrage is then i = i* + (P - ~ * ) ( 1 - x ’ ) / ( l - m‘). This implies that real rates of interest, net of personal taxes, are equal, but real rates of return gross of personal taxes are not, unless m’ = x’. An equation similar to (4) must also hold for equity assets yielding net-of-tax nominal returns of p (1 - c’) and p*( 1 - c‘) in each country.
Interest rates are determined by international arbitrage, where the marginal investor holding a country’s corporate securities may be some foreign investor rather than a domestic investor. Thus, personal taxes on domestic investors are irrelevant in the calculation of R”, as they determine only the supply of domestic savings and therefore whether the country is a net capital importer or exporter. Instead, we must determine the net-of-tax rate of return required by the international marginal investor for both bond and equity assets. This is not possible without making an assumption about where the marginal investor resides. Since the marginal investor’s tax rate is assumed to be the same for both Canada and the United States, there is no serious difficulty in measuring the cost of capital as long as gross-of-personal-tax rates of interest are observ- able, allowing us to ignore personal tax rates. However, to determine the re- lationship between p and i in each country, we must know c’, x ’ , and m‘. To abstract from this problem, we assume for our calculations that m’ = x‘ = c’, implying that i - P = p - P = i* - P* = p* - T* andR” = R in the above equations.’) An alternative case in which m‘, x’, and c’ are not equal
12. Gordon (1986) models an international equilibrium using a model similar to that of Miller (1977) and derives a capital market equilibrium similar to that discussed in Boadway, Bruce, and Mintz (1984). In Gordon’s model, the identity of the investor who is indifferent between holding an asset of a particular country or that of another depends on each country’s inflation rate and the difference between taxes on interest income and capital gains. Investors facing high personal t a x rates on interest tend to hold unindexed bond assets originating in countries with high inflation rates.
13. One case in which this obviously holds is when there are no taxes levied on interest or equity income earned by the marginal investor. This is the case if the marginal investor is a tax- exempt institution or an individual residing in a country with no capital income taxes (which may well be a reasonable assumption).

198 Kenneth J. McKenzie and Jack M. Mintz
was also considered. In this case, real net-of-tax interest rates are not the same across countries, and therefore hurdle rates of return differ across countries. Calculations for this case are not reported, as they do not substantially change our conclusions.
As we assume that the marginal investor is the same for both countries, the ETR estimates for the open economy arbitrage case reflect only differences in corporate tax provisions, rather than differences in personal tax rates. With equal rates of personal tax on equity and debt, the open economy arbitrage assumption restricts real interest rates to be the same in the two countries, although nominal interest rates and rates of inflation may differ. It is our belief that the case of open economy arbitrage, with m‘ = x’ = c’ , provides the most meaningful basis for comparison between the United States and Canada; we thus treat this as our “base case” against which the alternative assumption of closed economy household arbitrage is measured.
Aside from the arbitrage assumption, a number of other assumptions must be made in the computation of ETRs. Two particularly important ones involve the treatment of risk and loss offsetting. We deal with each in turn.
Following Gordon (1983, Bulow and Summers (1984), Gordon and Wil- son (1989), and McKenzie (1989), a distinction is made between two types of risk that are important in the calculation of ETRs. Zncome risk refers to uncer- tainty regarding future net revenues, arising from the stochastic movement of output prices or demand faced by the firm. Capital risk refers to uncertainty regarding the economic rate of depreciation, due either to an unknown future supply price of capital or a stochastic physical rate of depreciation.
If the tax system grants full loss offsets, so that companies receive a full refund for taxable losses when they are incurred, as was assumed in the pre- ceding discussion, then an income risk premium, h‘, may be added to both R“ and Rg in the above equations. However, if we then express the rate of return on capital net of risk, and subtract the income risk premium from the net and gross rates of return, it is evident that the ETR expression for income-risky investments is identical to the expression for equivalent riskless investments. The reason for this is intuitive. With full loss offsetting, the tax liability of the firm fluctuates perfectly with its income. The government therefore shares equally in both the profits and losses of the company. In other words, the government shares in 1OOu% of the profits and absorbs 100~4% of the risk. The cost of bearing income risk (h? is thus implicitly fully deducted in a full loss offset tax system, and no additional distortions are introduced for income- risky investments vis-a-vis comparable riskless investments.
The matter is somewhat different for capital-risky investments. In both the United States and Canada, tax depreciation allowances are based on the orig- inal cost of the asset, and there is no accrual valuation of capital gains and losses on the assets. This means that tax depreciation allowances and accrued capital gains income do not fluctuate with unanticipated changes in the re-

199 Tax Effects on the Cost of Capital
placement value of the capital. The implication is that the tax system does not deduct the full cost of bearing capital risk. The imputed cost of bearing capital risk can be thought of as an upward adjustment in the economic rate of depre- ciation that is not compensated for by an equivalent increase in the tax depre- ciation rate. With the capital risk premium denoted by hc, the ETR for capital- risky investments may be determined by replacing 6 with S + hc in the expression for Rg in equation (1).
One of the problems in measuring ETRs on risky capital is that it is difficult to measure the risk premium associated with capital risk. We follow Bulow and Summers (1984), who argue that the market value of a firm is equal to its asset value, so that fluctuations in market values reflect changes in the value of the firm’s underlying assets. This implies that capital-asset-pricing-model (CAPM) estimates would be appropriate to use for the capital risk premium. However, as Gordon and Wilson (1989) point out, it is the correlation between the economic cost of depreciation and consumption that is really relevant, and this correlation could well be negative. If that were the case, we would err considerably in our use of CAPM estimates for risk premiums.14
The analysis to this point has assumed that the tax system allows for the full refundability of tax losses, or equivalently, that all companies are fully taxpay- ing. Although the resulting ETR estimates are informative, only about 50% of investment in Canada and 80% in the United States is conducted by firms that are fully taxpaying at a particular point of time. For firms that are experi- encing tax losses, the assumption of full loss offsetting is not appropriate. A firm may be in a nontaxable position, for example, due to large banks of past tax losses. In this case, the income (write-offs) generated by the marginal investment may not be taxed (deducted) until some later time. Alternatively, a young firm may be making its initial investment, which will earn income only at some later, uncertain time. In that case, tax credits and deductions cannot be written off against income generated from past investments and must be postponed.
Loss offsetting is imperfect in Canada and the United States. In both coun- tries, tax losses may be carried back for three years. In the United States, operating losses may be carried forward for fifteen years, but without interest. In Canada the carry-forward period (also without interest) is only seven years;
14. See the paper by Shoven and Topper (ch. 6 in this volume), for a more in-depth discussion of the effects of risk. Although our approach is similar, it differs in some important respects. First, Shoven and Topper consider the cost of capital under a continuum of risk premiums, while our calculations are based upon specific risk-premium estimates taken from Jog and Mintz (1988). which differ by industry. Second, Shoven and Topper use price-earnings ratios to determine the market-risk premium, while we again use an estimate based on the CAPM from Jog and Mintz (1988). Third, our ETRs are disaggregated by industry and asset type; Shoven and Topper con- sider illustrative investments in a manufacturing plant and automobiles. Finally, our treatment of income risk differs slightly; see Boadway, McKenzie, and Mintz (1989) for a formal derivation of the type of cost-of-capital expression for risky assets we use in this paper.

200 Kenneth J. McKenzie and Jack M. Mintz
however, depreciation and other important capital cost deductions may effec- tively be carried forward indefinitely, due to their discretionary nature.I5 Moreover, consolidated tax accounting is allowed in the United States, but not in Canada. This means that the losses of U.S. firms can be offset against the profits of associated companies. Given the different treatment of operating losses, it is important to determine how the ETRs for loss corporations may differ between the two countries. To compute ETRs for loss corporations, we assume that the firm is risk-neutral and in an initial tax-loss position, expect- ing to become taxable T years from the current period t . Given the paucity of data, we only undertake calculations for 1990, when there was no investment tax credit. We estimate a “tax loss refundability parameter,” 5 = (1 + p + T) -(T-f), which is the present value of the proportion of the last dollar of tax losses used by the corporation.I6 As shown in Mintz (1990), the marginal rate of return, gross of taxes, for a company in a tax-loss position depends on its history and whether capital is depreciated during the loss period. The mar- ginal rate of return is equal to the following:
where A, = 1 - ( 1 - cx)T-r + A(l - a)=-[, if capital is depreciated for tax purposes during the loss period (as in the United States), and A, = A , if capital is not depreciated during the loss period (as in Canada). The term v is the effective statutory tax rate for the loss company, equal to su. As before, Rf is the real cost of finance, pi(1 - v) + ( 1 - p) p - m. Note that A is the present value of tax depreciation allowances that would be normally calcu- lated for a taxpaying firm, and A,- I is the value of tax depreciation allowances calculated in the previous period. To compute ETRs for tax loss companies we use the Rg given in equation (5).
The final modification that we make to the base case analysis is the deter- mination of ETRs for multinational corporations. One of the important ques- tions raised in debates regarding capital mobility is whether companies of a given country may find it advantageous to locate production facilities in an- other country. For multinational companies resident in a capital-exporting country, an additional level of taxation must be considered. This is the tax on foreign-source earnings that may be imposed by the home country. In Canada an exemption approach is used, and multinationals are allowed to repatriate
15. Capital deductions are mandatory in the U.S. and discretionary in Canada. Thus, although the carry-forward period in longer in the U.S. , firms must continue to write off assets during the loss period. In Canada, deductions can be postponed until the firm becomes taxable. See Mc- Kenzie and Mintz (1991) for a more in-depth discussion of the carryover provisions in the two countries.
16. This is the procedure for “currently nontaxpaying” firms used in Mintz (1988). We use the Mintz figures for .$ in Canada. For the U.S., we use calculations provided in Altshuler and Auer- bach (1990) for companies in a loss position for two consecutive years.

201 Tax Effects on the Cost of Capital
dividends tax-free from foreign affiliates operating in the United States (a for- eign affiliate’s equity must be owned at least 10% by the parent). In the United States, a deferral approach is used, where the remitted foreign-source earn- ings received by the parent from its subsidiary are taxed, but a foreign-tax credit for the corporate and withholding taxes attributed to those earnings is granted. If there are excess credits associated with a particular source of earn- ings, such as dividends (i.e., foreign-tax credits are more than U.S. tax liabil- ities on dividends received from Canada), the company may use the credits against U.S. tax liabilities on other foreign sources of income that are in the same “basket.” If not all credits are fully used, the company is in an excess foreign-tax-credit position. If the credits are fully used, the company is in an overall deficient foreign-tax-credit-position.
Under the deferral method, the cost of capital for the multinational depends on the functional currency used by the home country to convert subsidiary income into home country tax liabilities. In the case of U.S. companies oper- ating in Canada, two functional currencies may be used, depending on the ownership of the subsidiary and the type of business. A qualifying U.S. mul- tinational company may use the U.S . dollar as the functional currency. In this case, foreign-source income is measured by converting Canadian dollars into U.S. dollars as the income is earned. The alternative is to use the Canadian dollar as the functional currency. In that case, foreign-source income is mea- sured in U.S. dollars only when the income is remitted. The difference be- tween these two approaches leads to two different costs of capital. If the first approach is used, the tax depreciation allowances granted by the United States for foreign investments are calculated by converting the cost of the asset into U.S. dollars and then depreciating that amount. If the second approach is used, there is no conversion of asset values into U.S. dollars; instead, the U.S. determination of tax-depreciation allowances is based on the Canadian dollar, and depreciation claims are converted into U.S. dollars when the income is remitted.
Leechor and Mintz (1990, 1991) provide the costs of capital for U.S. mul- tinational companies operating in Canada and for Canadian multinationals op- erating in the United States.” In the case of deferral taxation, the cost of capital depends upon the “tax-adjusted‘’ dividend-payout ratio of the multina- tional, the “repatriation tax” rate of U.S. tax on remitted dividends (which could be positive or negative), and the capital-cost provisions of the home and host countries. We use the before-tax rate of return on equity and the steady- state conditions for the capital stock to derive the repatriation tax rate on re- mitted dividends. The accounting dividend-payout ratio is used as a proxy for the tax-adjusted payout ratio, based on the U.S. definition of subsidiary in- come earned in Canada.
17. Leechor and Mintz (1990, 1991) ignore rules regarding the attribution of interest that have recently been adopted in the United States.
202 Kenneth J. McKenzie and Jack M. Mintz
5.3 Comparative Analysis: The Base Case
In this section we compare the ETR estimates for Canada and the United States for our “base case,” which employs the following assumptions: (i) the tax systems grant full loss offsets, or all firms are fully taxpaying; (ii) the investments are riskless; (iii) there is open economy arbitrage with debt and equity income taxed at the same personal tax rate; and (iv) none of the invest- ments involve cross-border direct investment by multinationals. Some of these assumptions will be modified in subsequent sections.
ETRs were estimated for four years-1975, 1980, 1985, and 1990. These “snapshots” represent important periods in each country, when economic con- ditions and the tax regimes varied substantially. For example, 1975 and 1980 were both periods of relatively high inflation with moderate real interest rates in both countries, while in 1985 and 1990, inflation rates were lower but real interest rates were higher. As we shall see, the interaction between the tax system and inflation and interest rates has important effects on ETR estimates. Moreover, the tax systems in both countries underwent important changes over the period considered. Two major regime changes occurred in the United States: the Economic Recovery Tax Act of 1981 increased write-off rates and enhanced the ITC, while the Tax Reform Act of 1986 lowered depreciation rates, eliminated the ITC, and reduced the statutory tax rate. In Canada, in late 1977 the ITC (originally introduced in 1975) was enhanced, and a 3 per- cent inventory allowance was introduced to offset the taxation of inflationary gains on inventories due to the use of FIFO accounting. In 1986 the first stage of tax reform eliminated the inventory allowance, lowered ITC rates, and re- duced the statutory corporate tax rate slightly. In 1987 the process was contin- ued, as the ITC was virtually eliminated (except for a few regional credits), depreciation rates were lowered, and the tax rate was further reduced.
We begin with a discussion of the changes in ETRs over time for each country and follow with a comparative discussion. The ETRs are listed in table5.1.
5.3.1 Canada In 1975, the weighted average ETR for the four types of capital across the
nine industries was a very high 40.3% in Canada. The implication is that on average, in 1975 the Canadian tax system acted as a significant deterrent to investment. When we examine individual assets and industries, we see that this figure does not tell the whole story. Investments in inventory capital were highly taxed in most sectors, with the exception of Agriculture, where inven- tories are expensed under cash accounting. The high rate of tax on inventory investment was due to the relatively high inflation rate in 1975, coupled with the use of FIFO (first in, first out) accounting, which results in the taxation of inflationary gains on inventories. Provisions to offset this (the inventory al-

203 Tax Effects on the Cost of Capital
Table 5.1 Effective Tax Rates; Base Case
1975 1980 1985 I990
Industry or United United United United Asset' Canada States Canada States Canada States Canada States
AFF MAN CON T&S COM PUT WST RET SER
BLD EQP INV LND
Total
30.2 43.2 63.1 25.0 7.2
11.8 53.8 47.4 28.3
17.6 28.7 67.7
(26.3)
40.3
21.6 33.0 40.0
(40.3) 36.6 (5.9) 24.3 13.5
(16.1)
14.9 6.0
35.1 (23.4)
14.7
22.1 16.5 31.9 31.7 27.6 26.2 28.0 30.7 21.3 28.8 31.1 27.0 62.3 35.8 45.7 34.4 43.4 24.0 10.7 (67.8) 25.5 (12.0) 21.7 8.3 (5.4) 34.5 26.2 23.7 17.5 25.2 1.0 (25.3) 22.8 2.7 19.8 12.5
41.9 20.0 31.5 31.4 34.9 24.8 35.0 5.3 28.4 26.0 30.5 21.3 19.0 (34.7) 26.2 13.8 22.9 16.1
5.4 (0.2) 24.7 12.8 21.1 17.6 14.2 10.0 16.2 1.6 25.6 18.9 59.0 31.9 37.1 38.4 43.2 28.0
(36.0) (49.9) 29.3 27.7 20.2 19.0 27.7 7.5 26.0 18.9 28.9 20.4
Nore: Brackets indicate negative numbers. 'AFF = Agriculture, Forestry, Fishing; MAN = Manufacturing; CON = Construction; T&S = Trans- portation and Storage; COM = Communications; PUT = Public Utilities; WST = Wholesale Trade; RET = Retail Trade; SER = Services. BLD = buildings and structures; EQP = machinery and equipment; INV = inventories; LND = land.
lowance) were not put in place until 1977. As a result, industries that devote a large proportion of their investments to inventories, such as Construction, Wholesale Trade, and Retail Trade, tended to be highly taxed on average. By way of contrast, the high inflation rates and low real interest rates combined to provide a tax subsidy to investments in land, as evidenced by the negative ETR. This was due to the deductibility of nominal rather than real debt inter- est payments. As such, the tax subsidy was particularly large in highly lever- aged sectors such as Transportation and Storage and Services.
In 1980, ETRs declined rather significantly in Canada, averaging 27.7% overall. The decline was due to a number of factors. First, there was a modest reduction in the corporate tax rate from 1975 (1 percentage point). Second, the higher inflation rate in 1980 tended to reduce the ETR on some assets while increasing it for others. With nominal debt interest deductibility and low real interest rates, for example, there was a substantial increase in the tax subsidy for investments in land ( - 36% in 1980 versus - 26% in 1975). If it had not been for the introduction of the inventory allowance in 1977, the high inflation rate would have also increased the ETR on inventories relative to 1975. As it turned out, the inventory allowance actually resulted in a decline in the ETR on inventories, from about 68% in 1975 to 59% in 1980. Finally,
204 Kenneth J. McKenzie and Jack M. Mintz
investment tax credits were somewhat richer in 1980, with a basic rate of 7% versus 5% in 1975. This was particularly important for equipment, where the effective ITC rate was higher and asset lives shorter. Thus, the ETR on equip- ment declined from 28.5% in 1975 to 14.2% in 1980. The Manufacturing sector was a particular beneficiary of the enhanced ITC. The ETR on build- ings also declined significantly, to only 5.4%, due to relatively low real inter- est rates and a high rate of inflation.
In 1985, while the overall average ETR did not change very much (26% versus 28% in 1980), the configuration of EYRs changed considerably. This was the result almost entirely of changes in inflation and real interest rates, as the tax system was largely unchanged from 1980. In particular, a large reduc- tion in the rate of inflation from 1980 to 1985 eliminated the tax subsidy on land, which now faced a positive ETR of 29% on average. The ETR on inven- tories declined substantially, from 59% in 1980 to 37% in 1985, also due to the reduction in inflation. The increase in real interest rates and reduction in inflation also caused the ETR on buildings to increase quite significantly, to 24.7%.’*
In 1986 and 1987, a tax reform was instituted in Canada. From the 1990 ETR estimates, we see that the net result of this reform was actually a slight increase in the aggregate ETR, from 26% to almost 29%. However, inflation rates were somewhat higher and real interest rates were somewhat lower in 1990 than in 1985. While these changes exacerbated the impact of the elimi- nation of the inventory allowance, they were offset somewhat by the reduction in the statutory tax rate. The net result was only a slight increase in the ETR on inventories, from 37% to 43%. The decline in the ETR on land was due largely to the reduction in the corporate tax rate. The ETR on buildings also declined slightly in 1990 from 1985. The elimination of the ITC did not have much of an impact on buildings, and the reduction in write-off rates was rela- tively minor for structures; the tax rate reduction thus offset these effects and lowered the ETR on buildings. The ETR on equipment was substantially higher in 1989, particularly in the Manufacturing sector, because of the elim- ination of the ITC and the reduction in write-off rates, including the elimina- tion of the accelerated write-off for manufacturing and processing assets. As a result, Manufacturing moved from a position with a lower-than-average ETR in 1985 (21%) to a higher-than-average ETR in 1989 (31%). Overall, the tax reforms tended to smooth ETRs across sectors and between assets. Investments in buildings, equipment, and land all bear an ETR of around 22%, while inventories are more highly taxed at 43%, due to the use of FIFO accounting.
18. These results generally correspond to the “prereform” estimates made by Jog and Mintz (1989). Their effective tax rates on large companies were lower primarily due to the use of a lower discount rate for equity finance, where they assumed rn > c, so that p is lower than i. We take the case that rn = c, so p =‘ i.

205 Tax Effects on the Cost of Capital
5.3.2 The United States In the United States, the overall ETR for the nine industries and four assets
was 14.73% in 1975.19 Investment in land was largely subsidized due to the relatively high rate of inflation and the deductibility of nominal borrowing costs, which proved beneficial for highly leveraged industries such as Trans- portation and Storage. The high inflation rate also led to a relatively high ETR on inventories. Although firms in the United States have the option of using LIFO (last in, first out) accounting, which eliminates the taxation of inflation- ary gains on inventories, about one-quarter of businesses opt to use FIFO in any event, and the ETR estimates reflect this. The low ETR on equipment was due largely to a relatively rich ITC, which actually created a tax subsidy for investments in equipment in many industries.
In 1980, the aggregate ETR was about half the 1975 rate, at 7.5%. This change occurred for a number of reasons, including a slight reduction in the corporate tax rate from 1975 (about 1 percentage point); enhanced ITCs (par- ticularly for some structures, such as those used in the Transportation and Storage and the Public Utilities industries); and a higher inflation rate coupled with a lower real rate of interest, which increased the tax subsidy on invest- ments in land, again due to the use of nominal debt interest deductions.
The Economic Recovery Tax Act of 1981 sought to increase corporate in- vestment in the United States by increasing write-off rates and enriching the ITC. Despite these measures, our estimates show that the average ETR actu- ally increased from 1980 to 1985, to almost 19%. The reason for this was the substantial increase in real interest rates, which led to an elimination of the tax subsidy on land. Land had a positive ETR of almost 28% on average. The increase in real interest rates also led to an increase in the ETR on inven- tories and buildings. Despite the increase in real interest rates, the enhanced write-offs and ITCs led to a significant decline in the ETR on machinery and equipment, which benefited the most from the tax changes. In 1985, invest- ments in equipment were virtually distortion-free, with an average ETR of approximately 2%. The Communications, Manufacturing, and Construction industries all had lower ETRs in 1985 relative to 1980, despite the higher real interest rates.
The Tax Reform Act of 1986 sought to eliminate many of the tax breaks introduced in 198 1 and earlier. The result was an increase in the average ETR to over 20%. The elimination of the ITC and the reduction in tax depreciation rates were particularly important for investments in equipment. On average,
19. Results reported here and below roughly correspond to those reported by Auerbach (1983). who provided us with U.S. data on depreciation and asset classes. The main difference in our results and his is that we use a weighted average discount rate based on estimates of the debvasset ratios by industry and the observed interest rates for the U.S. , while Auerbach used a constant 4% real discount rate.

206 Kenneth J. McKenzie and Jack M. Mintz
investments in equipment moved from a position of virtual neutrality in 1985 to a positive average ETR of almost 19% in 1990. The ETR on buildings also increased slightly, due to longer write-off periods. The elimination of the ITC and lengthening of write-off periods for depreciable assets were offset by a tax rate reduction of over 10 percentage points. As a result of this rate reduction, the ETRs on investments in both land and inventories decreased significantly from their 1985 levels. Overall, the tax reforms in 1986 served to smooth out the ETRs among assets and across sectors. In fact, buildings, equipment, and land all had an ETR of around 18.5%, while inventories were taxed at a higher rate of 28% (because of the elective use of FIFO accounting by some busi- nesses). Moreover, the large tax subsidies that had existed for some indus- tries, particularly Transportation and Storage and Public Utilities, were elim- inated. All sectors had a positive ETR in 1990.
5.3 .3 Comparing Effective Tax Rates We now turn to a more direct comparison of ETRs between the two coun-
tries. There are a number of similarities, particularly in the pattern of changes in ETRs over time. In both countries, the 1970s and early 1980s were typified by a wide divergence of ETRs across assets and industries, with investments in some assets and industries highly subsidized while others were highly taxed. In 1990, following the tax reforms in both countries, ETRs were “smoothed” substantially across assets and among industries. In both coun- tries, overall ETRs declined rather significantly from 1975 to 1980, then in- creased slightly in 1985 and again in 1990. This pattern in large part resulted from similar movements in inflation and interest rates in the two countries. However, parallel tax-regime changes also contributed. For example, in the late 1970s and early 1980s both countries modestly reduced corporate tax rates and enhanced ITCs, and in the mid-1980s both implemented tax reforms of a similar nature, eliminating ITCs, lowering depreciation rates, and reduc- ing statutory tax rates.
Although there are similarities, the differences in ETRs between the two countries are perhaps more striking. Most obvious is the fact that overall ETRs in Canada have tended to be higher than those in the United States, particularly in 1975 and 1980. This difference was due to number of factors, three of which appear to be particularly important. The first was the invest- ment tax credit. Prior to the elimination of the credit in both countries, the ITC in the United States was richer than in Canada. The basic ITC rate was higher,20 the credit was available for a broader range of assets (structures in particular), and, depreciation deductions were not reduced by ITC claims in the United States (unlike Canada) until after 1980, and then only partially.
20. This is not strictly true, as historically ITC rates vary by region in Canada, with very high rates available in regions considered economically depressed. However, investment in these high- ITC regions has typically been low relative to the rest of the country; their presence has very little impact on the weighted-average ITC calculations.

207 Tax Effects on the Cost of Capital
The more generous ITC in the United States was particularly advantageous for investments in equipment. A second reason for the higher ETRs in Canada was the optional use of LIFO accounting for inventories in the United States and the mandatory use of FIFO in Canada. As discussed above, the use of FIFO leads to the taxation of inflationary gains in the cost of inventories, which significantly increases the ETR on inventories during high inflation pe- riods, such as 1975 and 1980. Although some firms in the United States use FIFO in any event, and the inventory allowance moderated the impact of infla- tion in Canada somewhat in 1980 and 1985, the ETR on inventories in the United States has tended to be lower than in Canada. For example, in 1990 the overall ETR on investments in inventories was 15.2% higher in Canada. The third factor contributing to higher ETRs in Canada was the slightly higher rates of inflation. The open economy arbitrage model used for the base case restricts real interest rates to be the same in both countries. However, inflation rates, and therefore nominal interest rates, have been higher in Canada than in the United States over the period examined. This has been an important factor in the higher ETRs in Canada for assets like inventories, structures, and cer- tain forms of equipment.
Despite the historical differences, ETRs in the two countries have moved closer together recently. Similar tax changes no doubt contributed to this. Tax reforms contributed to the decline in the overall aggregate ETR differential between the two countries, from 25.6% in 1975 to only 8.5% in 1990. By examining each industry and asset class individually, we see that differences between Canadian and U.S. ETRs declined virtually across the board from 1975 to 1990. Insofar as ETRs in the two countries have moved closer to- gether, the corporate tax regimes seem to have become more “harmonious.” Indeed, ETRs on buildings, equipment, and land were quite similar in 1990 (the fourth asset, inventories, is highly taxed in Canada). The overall ETRs in key sectors such as Manufacturing, which accounts for more than 30% of nonresource investment in both the United States and Canada, were also very close. Yet even though it appears that overall the Canadian and U.S. tax sys- tems have become more harmonious over time, considerable differences re- main in specific’ sectors. For example, in 1990 Canadian ETRs exceeded United States ETRs by 19.5% in Construction, 13.4% in Transportation and Storage, and 10.1% in Wholesale Trade.
Given the apparent convergence in overall ETRs over time, it might be argued that the governments deliberately attempted to harmonize the corpo- rate tax systems. At times, specific provisions such as the DISC program in the United States and accelerated depreciation for manufacturing in Canada were implemented in response to international trends. But there is little direct evidence of an intent by Canada and the United States to harmonize their corporate tax systems in the late 1980s. Canada’s corporate income tax re- form, which actually began prior to U.S. reform, was mainly concerned with problems arising from the instability of the corporate tax base due to the sub-
208 Kenneth J. McKenzie and Jack M. Mintz
stantial amount of tax-loss carry-forwards and with a desire to make the tax system less distortive. U.S. tax reform was largely motivated by a desire to improve upon the efficiency of the tax system and upon the mix between cor- porate and personal tax revenues (with a shift toward collecting more revenue from the corporate sector). Although the countries ended up adopting similar reforms (as have other countries around the world), we would argue that this result may have occurred more by accident than by design.21
Another important point to note is that the absence of indexing for inflation in both tax systems may well lead to a greater divergence in ETRs in the future, even if no other tax changes are made. As indicated above, ETRs in both Canada and the United States are highly sensitive to interest and inflation rates. If the inflation rate in either country changes significantly relative to the other, ETRs will diverge.
5.4 Changes in the Underlying Assumptions
A number of assumptions underlie the base case estimates discussed above. In our view, there is no single or unique method to measure ETRs that captures all of the institutional details of the tax systems and economies of the two countries, in part because there is no consensus regarding the appropriate as- sumptions that should underlie the model. In this section, we examine the implications of modifying some of the assumptions. In particular, we exam- ine: a different treatment of risk; an alternative view of financial arbitrage; the presence of nontaxpaying companies; and multinational companies.
5.4.1 Capital Risk In the base case, it was assumed that investments were riskless. As dis-
cussed in section 5.2, ETRs on riskless and income-risky investments are identical if the tax system grants full loss offsets. This is not the case for capital risk. Since tax depreciation allowances are determined ex ante, based upon the original or historic cost of the asset, these allowances do not fluctuate with unforeseen changes in the replacement values of assets. As such, the economic cost of bearing capital risk is not fully deducted, even with full loss offsetting. Unless an upward adjustment is made in the tax-depreciation rate to account for capital risk (something done by neither country explicitly), we would expect the distortions caused by the tax systems to be higher for capital-risky investments in both the United States and Canada.
This expectation is confirmed in table 5.2, where we see that the presence of capital risk leads to a significant increase in ETRs. In 1990, the aggregate Canadian ETR on capital-risky assets was almost 48%, versus 29% for com- parable riskless or income-risky investments; for the United States, the figures
21. John Whalley discusses this issue in more detail in the introduction to this volume.

209 Tax Effects on the Cost of Capital
Table 5.2 Effective Tax Rates, 1990 ~
Base Case Capital Risk Closed Economy Industry or Asseta Canada United States Canada United States Canada United States
AFF MAN CON T&S COM PUT WST RET SER
BLD EQP INV LND
Total
27.6 31.1 43.4 21.7 17.5 19.8 34.9 30.5 22.9
21.1 25.6 43.2 20.2
28.9
26.2 27.0 29.0
8.3 25.2 12.5 24.8 21.3 16.1
17.6 18.9 28.0 19.0
20.4
55.6 47.9 60.0 45.0 28.1 39.0 51.1 47.6 46.5
42.3 43.7 56.7 49.0
41.6
52.5 43.9 47.9 24.0 29.5 25.9 43.6 40.4 38.7
33.8 26.5 49.0 46.4
37.6
44.6 49.3 58.6 43.9 39.9 40.7 52.8 49.6 44.1
41.5 45.7 59.5 38.1
48.0
42.4 44.3 45.1 33.3 41.4 34.4 43.5 41.1 37.6
37.9 39.7 45.3 37.7
40.0
“As defined in table 5.1
were 38% and 20%, respectively. Both systems thus act to significantly deter investments characterized by capital risk, to a much greater extent than com- parable riskless or income-risky investments.
The presence of capital risk does not alter our general conclusion that the current tax system in the United States is less distortive than the Canadian system. Indeed, if anything the ETR in favor of the United States appears to be even greater than it was with riskless investments. For example, the aggre- gate ETR for riskless investments was 8.5% higher in Canada than in the United States; for capital-risky investments the Canadian aggregate ETR ex- ceeded the American by 10%. One reason for this is the higher statutory tax rate in Canada, which penalizes capital risk. For Manufacturing, where the statutory tax rates of the two countries are much closer, the ETRs were almost the same.
5.4.2 Closed Economy Arbitrage As discussed in section 5.2 , there are other financial arbitrage assumptions
that may be used to assess the impact of taxes on capital-investment decisions. One possibility is closed economy household arbitrage, in which both per- sonal and corporate taxes in the home country affect the user cost of capital faced by domestic firms. In table 5.2 we report ETRs under the closed econ- omy assumption, in which households in each country must earn the same net-of-personal-tax rate of return on equity and bond assets. Allowing per- sonal taxes on interest and equity income to differ according to estimates of effective personal tax rates in Canada and the United States (in both cases

210 Kenneth J. McKenzie and Jack M. Mintz
rn > c) , we compute the combined corporate and personal tax rate on capital.22 These numbers are not strictly comparable to those in the base case, since the base case provides only an effective corporate tax rate (domestic personal taxes do not affect the level of investment under our open economy arbitrage assumption).
Given that the closed economy case includes domestic personal taxes on capital income, it is not surprising to find that ETRs are about 20 percentage points higher than the base case. What might be surprising is that the differ- ences in ETRs between the two countries are similar to those in the open economy base case. The reason is that our calculations of the effective per- sonal tax rate on nominal interest income for the United States and Canada are very close, at about 25%; similarly, the ETR on nominal equity income is about 8% in both countries (assuming that the capital-gains tax rate, rather than dividend tax rate, is the most important factor influencing the cost of equity finance). On the basis of these calculations, we conclude that the effec- tive personal tax rates are more harmonized in Canada and the United States than the corporate tax rates! This might be considered anomalous, as one might expect countries to be more concerned about the harmonization of cor- porate income tax systems than personal tax systems; the latter depend on the residence of households, which are far less mobile.
5.4.3 Tax-Loss Firms and Imperfect Loss Offsetting Another important consideration for a United States-Canada comparison is
the presence of nontaxpaying companies. As also discussed in section 5.2, we consider only one particular case of tax losses, in which a firm is assumed to be in a tax-loss position currently and expects to remain so for some specified amount of time. As a result, our estimates of ETRs are lower for loss firms than for fully taxpaying companies. However, our calculations may tend to understate the ETR on companies with tax losses since, under alternative ap- proaches, tax losses could increase rather than reduce ETRs. For example, Mintz (1988) and Jog and Mintz (1989) show that in some cases, loss firms may face very high ETRs relative to fully taxpaying firms.
We compute the cost of capital for tax-loss companies in the United States and Canada, taking into account the flexibility allowed in Canada in claiming tax-depreciation allowances; see equation (5) above. Aside from full loss off- setting, we use the base case assumptions and assume risk neutrality. Using calculations from Altshuler and Auerbach (1990), we estimate that in the United States only 20% of investment was undertaken by tax-loss companies in 1990, which expect, on average, to be nontaxpaying for about eight years.23
22. Canadian calculations are based on Glenday (1989) and Boadway, Bruce, and Mintz (1987). U.S. numbers are based on data given to us by James Poterba and Alan Auerbach.
23. Altshuler and Auerbach (1990) calculate that another large portion of companies were constrained in claiming investment tax credits in 198 1. We assume that all these companies would be taxpaying in 1990.

211 Tax Effects on the Cost of Capital
Using 1977-85 data from the Department of Finance, compiled by Glenday and Mintz 1991, we estimate that approximately 50% of investment was undertaken by tax-loss companies in Canada, and that Canadian tax-loss com- panies take an average of eleven years to become taxpaying. We suspect that one of the reasons for the shorter tax-loss period in the United States is the use for tax purposes of consolidated accounting, which allows associated compa- nies to aggregate profits and losses. Consolidation is not allowed in Canada.
Table 5.3 provides ETR estimates for taxpaying and illustrative tax-loss firms in Canada and the United States. It is immediately apparent that the ETR on loss companies was far lower in Canada. The lower ETR on loss compa- nies in Canada arises for two reasons: the longer estimated time for Canadian companies to become taxpaying, and the ability of Canadian companies to postpone depreciation deductions until they become taxpaying.
It is interesting to consider the ETRs aggregated over taxpaying and non- taxpaying companies. As shown in the last column of table 5.3, the overall aggregate Canadian ETR was virtually identical to the U.S. ETR (18.7%, compared to 19.2%). In fact, Canadian ETRs were lower for the Agriculture, Forestry, and Fishing, Manufacturing, and Communications industries. There was also a reversal of ETRs on buildings, machinery, and land, with Canadian ETRs now lower than U.S. ETRs.
These calculations emphasize that conclusions regarding the impact of taxes on capital can be reversed if certain institutional details, such as tax losses, are taken into account. Although, as emphasized above, the ETRs re-
Table 5.3 Effective Tax Rates, 1990
Industry or Asseta
AFF MAN CON T&S COM PUT WST RET SER
Taxpaying Firmsb Loss Firms Aggregate
Canada United States
27.6 26.2 31.1 27.0 43.4 29.0 21.7 8.3 17.5 25.2 19.8 12.5 34.9 24.8 30.5 21.3 22.9 16. I
Canada United States
8.6 17.0 1.9 11.0 6.3 15.7 6.6 18.0 6.9 23.1 6.6 17.6 2.6 8.8 2.9 8.7 4.0 9.3
Canada United States
17.8 24.3 20.5 24.6 31.4 27.0 14.8 10.4 12.5 24.8 13.6 13.5 24.8 22.7 21.4 19.5 14.9 14.9
BLD 21.1 17.6 4.2 14.8 13.8 17.1 EQP 25.6 18.9 5.7 20. I 17.2 19.1 INV 43.2 28.0 1 . 1 6.4 28.6 24.8 LND 20.2 19.0 1.8 4.5 12.3 16.6
Total 28.9 20.4 3.8 13.7 18.7 19.2
'As defined in table 5.1 bBase case.
212 Kenneth J. McKenzie and Jack M. Mintz
ported for loss companies may be understated, they suggest that we may not know as much as we would like to about how taxes influence the cost of capi- tal in either Canada or the United States.
5.4.4 Multinationals A comparison of the ETRs on direct investments undertaken by multina-
tional corporations may well be the most relevant of all, as cross-border direct investment flows are likely to be quite sensitive to differences in tax regimes. As discussed in section 5.2, when evaluating the ETRs imposed on resident multinationals, one must take account of the tax treatment of foreign-source income.
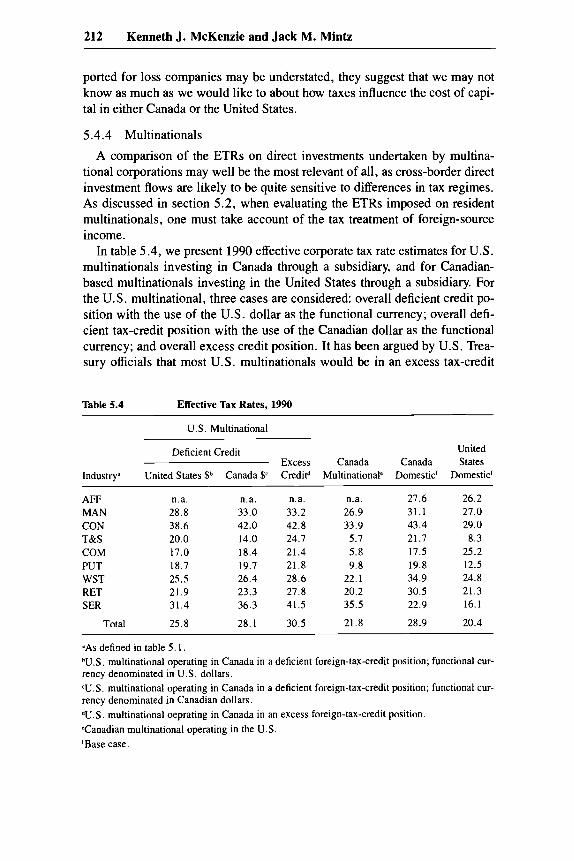
In table 5.4, we present 1990 effective corporate tax rate estimates for U.S. multinationals investing in Canada through a subsidiary, and for Canadian- based multinationals investing in the United States through a subsidiary. For the U.S. multinational, three cases are considered: overall deficient credit po- sition with the use of the U.S. dollar as the functional currency; overall defi- cient tax-credit position with the use of the Canadian dollar as the functional currency; and overall excess credit position. It has been argued by U.S. Trea- sury officials that most U.S. multinationals would be in an excess tax-credit
Table 5.4 Effective Tax Rates, 1990
U.S. Multinational
Deficient Credit United Excess Canada Canada States
Industrya United States $b Canada f? Creditd Multinationalc Domestic' Domestic'
AFF MAN CON T&S COM PUT WST RET SER
Total
n.a. 28.8 38.6 20.0 17.0 18.7 25.5 21.9 31.4
25.8
n.a. n.a. n.a. 33.0 33.2 26.9 42.0 42.8 33.9 14.0 24.7 5.1 18.4 21.4 5.8 19.7 21.8 9.8 26.4 28.6 22.1 23.3 27.8 20.2 36.3 41.5 35.5
28.1 30.5 21.8
27.6 26.2 31.1 27.0 43.4 29.0 21.7 8.3 17.5 25.2 19.8 12.5 34.9 24.8 30.5 21.3 22.9 16.1
28.9 20.4
'As defined in table 5.1. bU.S. multinational operating in Canada in a deficient foreign-tax-credit position; functional cur- rency denominated in U.S. dollars. <U.S. multinational operating in Canada in a deficient foreign-tax-credit position; functional cur- rency denominated in Canadian dollars. dU.S. multinational oeprating in Canada in an excess foreign-tax-credit position. Canadian multinational operating in the U.S. 'Base case.
213 Tax Effects on the Cost of Capital
position after the 1987 tax reform. However, many U.S. companies are chang- ing the ownership and financial structure of their subsidiaries so as to fully utilize excess credits. This means that the deficient credit case may be the most relevant in the future. Moreover, as will be confirmed below by our esti- mates, there can be an incentive for companies to be in deficient credit posi- tion. As Leechor and Mintz (1991) discuss, one important strategy is for the subsidiary to increase its leverage so that excess credits can be fully used.
For a Canadian multinational investing in the United States, remitted divi- dends from foreign affiliates operating in the United States are essentially ex- empt from the Canadian corporate tax. This case is similar to that of a U.S. multinational being in an excess credit position.
We first deal with U.S. multinationals operating in Canada and determine whether a U.S. multinational would prefer investing in a Canadian subsidiary rather than at home. The ETRs for U.S. multinationals operating in Canada are reported in the first three columns of table 5.4, while the last column contains estimates for U.S. domestic investments. A comparison of these fig- ures shows that overall the ETR for U.S. companies operating domestically is slightly lower than for all three cases of U.S. subsidiaries operating in Can- ada. The aggregate ETR, for example, is 20.4% for domestic investment and ranges from 25.8% to 30.5% for investments in Canada. The implication is that the tax systems tend to discourage U.S.-based firms from investing in Canadian subsidiaries. An important reason for this is that U.S.-based firms must use a less generous tax depreciation schedule for capital employed in other countries; straight-line depreciation based upon ADR (asset deprecia- tion range) midpoint lives must be used for foreign investments, while MACRS (modified accelerated cost recovery system) may be used for invest- ments at home.
For Canadian companies operating in the United States, the opposite situa- tion arises, as the ETR on investments by Canadian firms in the United States is slightly less than the ETR on domestic investments. Canadian-based multi- nationals thus have a small incentive to invest in U.S. subsidiaries rather than at home. This is not surprising, given the exemption approach followed in Canada, and it reflects the same factors that lower ETRs on U.S. domestic investments relative to Canadian domestic investments.
The ETRs on investments made by Canadian companies in the United States tend to be slightly higher than for U.S .-owned domestic investments. This is due to our assumption that Canadian companies issue some debt in Canada to finance investments by subsidiaries in the United States. Whether it is cheaper to issue debt in the United States rather than in Canada depends upon differences in statutory tax and inflation rates. Debt is more likely to be issued in the country with the higher corporate tax rate and higher inflation rate. If we had assumed that the debt was raised in the United States, the ETRs would have been identical for Canadian multinational and U.S. domestic in-
214 Kenneth J. McKenzie and Jack M. Mintz
vestments. The same applies for U.S. companies in the excess credit position and Canadian domestic investments, where it is assumed that U.S. companies issue some debt in the United States. The fact that the ETRs are not signifi- cantly different suggests that there is not a large incentive for companies to issue more debt in Canada or the United States. This absence of incentive is the result of the similarity in statutory corporate tax rates and the rates of inflation.
5.5 Summary and Conclusions
We conclude that for fully taxpaying companies investing domestically, ETRs in Canada are somewhat higher than those in the United States. This is due in large part to the significantly higher ETR on inventories in Canada. Similarly, Canadian multinationals face lower ETRs on direct investments in the United States than on domestic investments, while for U.S. multinationals the ETR on domestic investments is lower. ETRs for nontaxpaying companies in Canada are significantly lower than for their U.S. counterparts, due partly to the flexibility granted to Canadian loss companies when claiming deprecia- tion deductions. Aggregated over fully taxpaying and tax-loss firms, overall ETRs are very similar in the two countries.
As there appears to have been a convergence in aggregate ETRs across the two countries in recent years, we find that the corporate tax systems in the United States and Canada have become more “harmonious.” Although we be- lieve that this convergence may have occurred more by accident than design, tax reform in both countries has no doubt contributed to it. Nevertheless, sig- nificant differences in ETRs remain and may become greater in the future, if large differences in inflation and interest rates between the two countries emerge.
Throughout our discussion, we have argued that there is no single ETR estimate that easily captures the institutional features of the economies and tax systems of the two countries. We have tried to address some of the issues involved by computing ETRs under a number of alternative assumptions re- garding the treatment of risk, financial arbitrage, tax losses, and multinational investments. We do not believe, however, that we have addressed all of the interesting problems that arise in the measurement of ETRs on capital. Re- maining problems include the treatment of minimum taxes, financial and in- flation risk, resource firms, real estate, regulated and finance companies, ad- justment costs, and international tax planning. Moreover, the paucity of data has not allowed us to incorporate other taxes that may be relevant to capital decision making, such as property taxes, sales taxes on capital inputs, the corporate minimum tax, and provincial capital taxes. Despite these limita- tions, we suspect that our general conclusions regarding the level of corporate taxation in Canada relative to the United States are at least qualitatively accu- rate.

215 Tax Effects on the Cost of Capital
References Altshuler, Rosanne, and Alan J. Auerbach. 1990. The Significance of Tax Law Asym-
metries: An Empirical Investigation. Quarterly Journal of Economics 105:61-86. Auerbach, Alan J. 1983. Corporate Taxation in the United States. Brookings Papers on
Economic Activity 2:451-505. Washington, D.C. Bartholdy, Jan, Gordon Fisher, and Jack M. Mintz. 1987. Taxation and the Financial
Policy of Firms: Theory and Empirical Applications to Canada. Economic Council of Canada Discussion Paper no. 324.
Boadway, Robin W. 1987. The Theory and Measurement of Effective Tax Rates. In The Impact of Taxation on Business Activity, ed. Jack M. Mintz and Douglas D. Purvis. Kingston, Ont: John Deutsch Institute.
Boadway, Robin W., Neil Bruce, and Jack M. Mintz. 1982. Corporate Taxation and the Cost of Holding Inventories. Canadian Journal of Economics 15:278-93.
. 1984. Taxation, Inflation and the Effective Marginal Tax Rate on Capital in Canada. Canadian Journal of Economics 17:62-79.
. 1987. Taxes on Capital Income in Canada: Analysis and Policy. Toronto: Canadian Tax Foundation.
Boadway, Robin W., Ken J. McKenzie, and Jack M. Mintz. 1989. Federal and Provin- cial Taxation of the Canadian Mining Industry: Impact and Implications for Reform. Kingston, Ont.: Centre for Resource Studies.
Bulow, J., and L. H. Summers. 1984. The Taxation of Risky Assets. Journal of Polit- ical Economy 92:20-39.
Daly, Michael, and Jack Jung. 1987. The Taxation of Corporate Investment Income in Canada: An Analysis of Marginal Effective Tax Rates. Canadian Journal of Eco- nomics 20:555-87.
Glenday, Graham. 1989. Personal Savings and Portfolio Composition: Changing Tax Incentives. In Economic Impacts of Tax Reform, ed. Jack M. Mintz and John Whal- ley. Toronto: Canadian Tax Foundation.
Glenday, Graham, and Jack M. Mintz. 1991. The Nature and Magnitude of Tax Losses of Canadian Corporations. In Policy Options for the Treatment of Tax Losses in Canada. Toronto: Clarkson Gordon Foundation.
Gordon, Roger H. 1985. Taxation of Corporate Capital Income: Tax Revenues versus Tax Distortions. Quarterly Journal of Economics 100: 1-28.
, 1986. Taxation of Investment and Savings in a World Economy. American Economic Review 76: 1086-1 102.
Gordon, Roger H., and John D. Wilson. 1989. Measuring the Efficiency Cost of Tax- ing Risky Capital Income. American Economic Review 79:427-39.
Jog, Vijay M., and Jack M. Mintz. 1989. Corporate Tax Reform and its Economic Impact: An Evaluation of the Phase I Proposals. In Economic Impacts of Tax Re- form, ed. Jack M. Mintz and John Whalley, 83-124. Toronto: Canadian Tax Foun- dation.
Jorgenson, Dale. 1963. Capital Theory and Investment Behavior. American Economic Review 53:247-59.
King, M. A., and D. Fullerton. 1984. The Taxation of Income.from Capital: A Com- parative Study of the United States, United Kingdom, Sweden and West Germany. Chicago: University of Chicago Press.
Leechor, Chad, and Jack M. Mintz. 1990. On the Taxation of Multinational Corporate Investment when the Deferral Method is Used by the Capital Exporting Country. University of Toronto Working Paper no. 9013. Toronto.
. 1991. Taxation of International Income by a Capital-Importing Country: The Perspective of Thailand. In Tax Policy in Developing Countries, ed. Javad Khalizadeh-Shirazi and Anwar Shah. Washington, D.C.: World Bank.

216 Kenneth J. McKenzie and Jack M. Mintz
McKenzie, Kenneth J. 1989. The Neutrality of Business Taxation in the Presence of Adjustment Costs and Risk. Queen’s University Discussion Paper no. 759. Kings- ton, Ont.
McKenzie, Kenneth J., and Jack M. Mintz. 1991. Tax Effects on the Costs of Capital: A Canada-United States Comparison. University of Toronto. Manuscript.
Miller, M. 1977. Debt and Taxes. Journal of Finance 32:261-76. Mintz, Jack M. 1988. An Empirical Estimate of Corporate Tax Refundability and Ef-
. 1990. Corporate Tax Holidays and Investment. World Bank Economic Review fective Tax Rates. Quarterly Journal of Economics 103:225-31.
4( 1): 8 1-1 02.