tcpcubic versus bbron thehighway -...
TRANSCRIPT
TCP CUBIC versus BBR on the Highway
Feng Li1, Jae Won Chung1, Xiaoxiao Jiang1, and Mark Claypool2
1 Verizon Labs, 60 Sylvan Rd, Waltham, MA, 02451, USA2 Worcester Polytechnic Institute, 100 Institute Rd, Worcester, MA, 01609, USA
Abstract. 4G Long Term Evolution (LTE) networks present new fea-tures of high capacities together with end-user mobility. These challengeshave led to a gap in the understanding of the effectiveness of TCP con-gestion control algorithms in LTE networks with mobile users. To fur-ther understanding, we conduct a detailed measurement study comparingTCP CUBIC with Bottleneck Bandwidth and Round-trip propagationtime (BBR) – a new congestion control alternative developed by Google– in a high-speed driving scenario over a tier-1 U.S. wireless carrier. Ourresults show CUBIC and BBR generally have similar throughputs, butBBR has significantly lower self-inflicted delays than CUBIC.
1 Introduction
Access between urban towers is one of the most important features of 4G LTEnetworks, providing mobility for end users, particularly when driving. Whilestudies have helped to better understand LTE performance [2, 5, 7, 10, 13], un-fortunately, there has been little systematic research on “in the wild” TCP per-formance for driving at high speeds (e.g., on the U.S. Interstate). This lackof knowledge makes modeling and simulating TCP over LTE networks difficultand slows development of TCP improvements for mobile networks. Moreover, thenew Bottleneck Bandwidth and Round-trip propagation time (BBR) congestioncontrol algorithm [4, 3] has yet to be evaluated over 4G LTE.
To better understand TCP performance in highway driving conditions andprovide valuable mobility performance data on U.S. LTE networks, we collectreal-world network traces from a tier-1 wireless carrier while driving on a U.S.interstate highway between Worcester, MA, and Morristown, NJ, driving about8 hours and 400 miles (675 km) round-trip. Our traces include physical andmedium access control layer measurements (e.g., signal strength and tower han-dover), correlated with higher-layer TCP performance (e.g., throughput andround-trip time).
Our results show that: 1) there is a fairly uniform distribution (0 to 30 dB) ofsignal to interference-plus-noise ratios (SINRs) along the route; 2) the round-triptimes from the mobile device to servers in the wireless AS are modest, mostlyranging from 40-80 milliseconds; 3) most downloads (20 MBytes) do not expe-rience a tower handover despite the highway speeds; 4) for 20 MB downloads,BBR and CUBIC have similar throughputs, but BBR has significantly lowerround-trip times; 5) for 1 MB downloads, BBR has higher throughputs but also

higher round-trip times; and 6) for 20 MB downloads, BBR experiences far fewerduplicate ACKs than does CUBIC (median less than 1% versus about 5-10%).
The rest of paper is organized as follows: Section 2 summarizes related re-search; Section 3 describes our methodology for measuring TCP over 4G LTEwhile highway driving; Section 4 presents the physical and medium access con-trol layer measurement results; Section 5 compares the performance of TCPunder the experiment conditions; and Section 6 concludes our work and presentspossible future work.
2 Related Work
Huang et al. [5] studied the performance of TCP over LTE through packet tracescollected from a carrier’s network. Although their results confirm shorter round-trip times over LTE compared to 3G, they do not provide physical nor mediumaccess control layer analysis. Xiao et al. [12] measured TCP throughput andround-trip times over stationary, driving and railway scenarios in LTE. Whiletheir results show TCP throughput degrades in high-speed conditions, their mea-sured throughputs are lower than what is typically available with LTE. Merz etal. [7] conducted a measurement study focusing on the performance of LTE inhigh-speed conditions, but their measurements do not include upper layer per-formance (e.g., the Transport layer).
Most closely related to our study, Eneko et al. [2] and Remi et al. [10] in-vestigated performance with wireless mobility for five different TCP congestioncontrol algorithms (CCAs): CUBIC, New Reno, Westwood+, Illinois, and CAIADelay Gradient (CDG). Although they used Linux kernel code [11] for the CCAs,their network was simulated via ns-3,3 making it difficult to determine how welltheir results match real highway driving conditions.
Our work differs from the above by providing comparative TCP performancein a highway driving scenario, with insights into radio conditions, and a first lookat the performance of the Bottleneck Bandwidth and Round-trip propagationtime (BBR) algorithm [4] over 4G as it compares to CUBIC. Plus, we havean opportunity to confirm some of the simulated results by Robert et al. [10]with experimental measurements, and compare some measured results by Xiaoet al. [12], Huang et al. [5] and Cardwell et al. [4] to our measurements.
3 Methodology
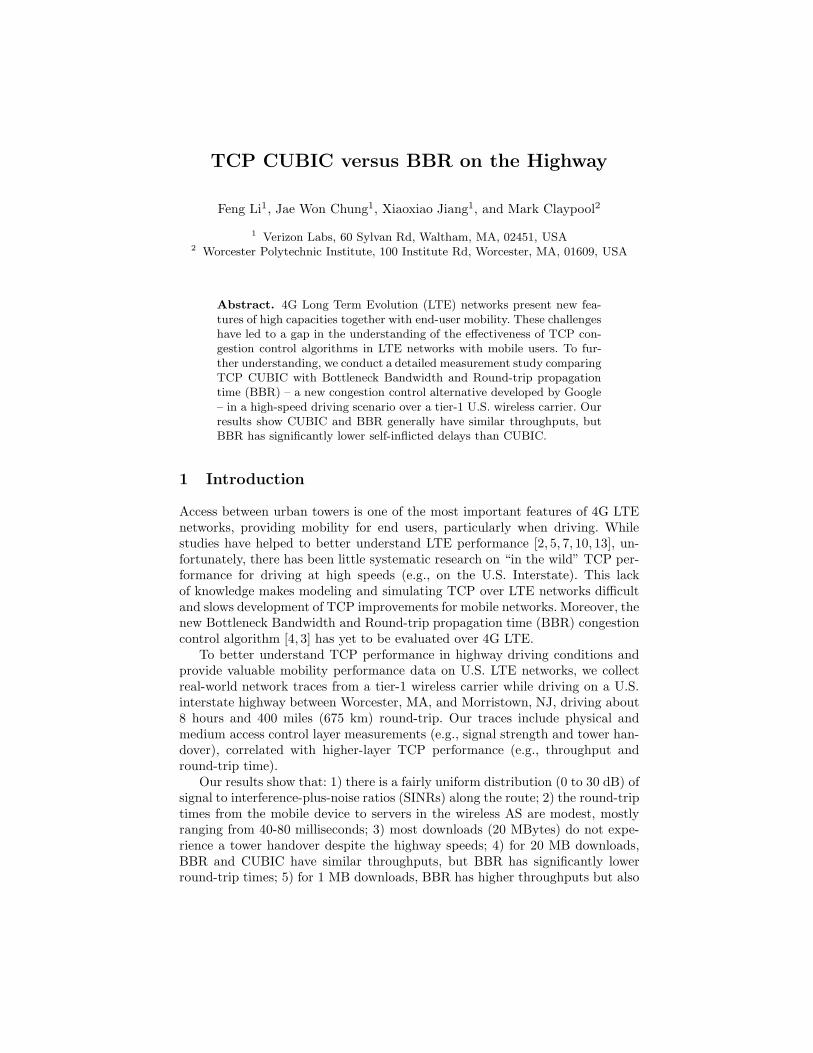
Figure 1 depicts details of our measurement methodology. Shown are the con-gestion control algorithms (CCAs) studied (Section 3.1), the experiment setup(Section 3.2) and the driving scenario (Section 3.3).
3 https://www.nsnam.org
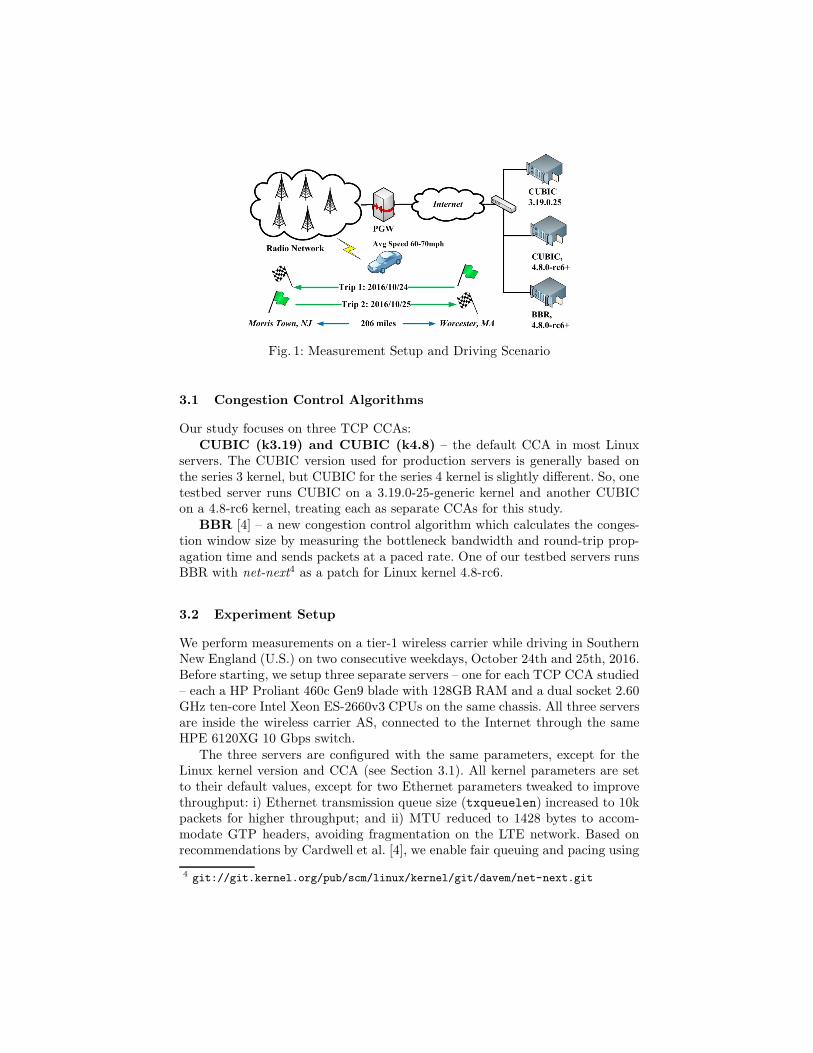
Fig. 1: Measurement Setup and Driving Scenario
3.1 Congestion Control Algorithms
Our study focuses on three TCP CCAs:CUBIC (k3.19) and CUBIC (k4.8) – the default CCA in most Linux
servers. The CUBIC version used for production servers is generally based onthe series 3 kernel, but CUBIC for the series 4 kernel is slightly different. So, onetestbed server runs CUBIC on a 3.19.0-25-generic kernel and another CUBICon a 4.8-rc6 kernel, treating each as separate CCAs for this study.
BBR [4] – a new congestion control algorithm which calculates the conges-tion window size by measuring the bottleneck bandwidth and round-trip prop-agation time and sends packets at a paced rate. One of our testbed servers runsBBR with net-next
4 as a patch for Linux kernel 4.8-rc6.
3.2 Experiment Setup
We perform measurements on a tier-1 wireless carrier while driving in SouthernNew England (U.S.) on two consecutive weekdays, October 24th and 25th, 2016.Before starting, we setup three separate servers – one for each TCP CCA studied– each a HP Proliant 460c Gen9 blade with 128GB RAM and a dual socket 2.60GHz ten-core Intel Xeon ES-2660v3 CPUs on the same chassis. All three serversare inside the wireless carrier AS, connected to the Internet through the sameHPE 6120XG 10 Gbps switch.
The three servers are configured with the same parameters, except for theLinux kernel version and CCA (see Section 3.1). All kernel parameters are setto their default values, except for two Ethernet parameters tweaked to improvethroughput: i) Ethernet transmission queue size (txqueuelen) increased to 10kpackets for higher throughput; and ii) MTU reduced to 1428 bytes to accom-modate GTP headers, avoiding fragmentation on the LTE network. Based onrecommendations by Cardwell et al. [4], we enable fair queuing and pacing using
4 git://git.kernel.org/pub/scm/linux/kernel/git/davem/net-next.git
Linux Traffic Control (tc) utilities on the BBR server only (such settings arenot known to impact CUBIC performance and generally are not enabled).
All three servers run Apache 2.4.7 with PHP 5.5. A custom PHP scriptdynamically generates 20 MB files with random content (to avoid any possiblecaching) for the smart phone to download. Tcpdump captures packet traces, setupto record 300 bytes per packet to provide complete TCP headers (the serverssend only TCP traffic to the smart phone). Tests show the PHP script andtcpdump have less than a 1% CPU load on each server. Note, the three serversare dedicated to our performance study, reachable only from a small number ofsmart phones from our test device pool.
The client smart phone is an LG G2 VS980 with 2GB RAM and a 32-bitQualcomm Snapdragon S4 Prime Quad Core CPU, running Android 4.3.2 andcontinually at full charge via a power brick. The phone runs Qualipoc, measuringradio characteristics each second, baseline round-trip times via ping (ICMP), andthroughput via HTTP download.
The cellular network provides LTE services over two radio spectra: BandXIII and Advanced Wireless Service (AWS). AWS normally provides more linkcapacity in urban areas while Band XIII provides a larger coverage over ruralareas. Since no U.S. carrier provides continuous AWS coverage along highways,the smart phone is locked to Band XIII for this study.
Our measurement test suite contains 40 test iterations. Each iteration pingsthe server (three 56-byte ICMP packets, separated by one second), pauses 3seconds, and then serially downloads a 20 MB file from each of the three servers.The suite pauses about 10 seconds between iterations. In total, one test suiterun takes about 1 hour, providing an opportunity for a driver break betweensuite runs.
Fig. 2: Driving Route
3.3 Driving Scenario
As shown in Figure 2, our highway driving measurements are between Worces-ter, MA and Morristown, NJ on two consecutive days: departing Worcester on
October 24, 2016 at 3:37pm to Morristown and returning from Morristown on6:00pm on October 25th to Worcester. The average driving speed is 65-70 mph(about 30 m/sec). The total driving distance is about 400 miles (675 km) andtakes 8 hours, including traffic, breaks, and refueling. On each trip, the full testsuite is run three times, with the driver stopping only in-between test suites.
4 Radio Network Characteristics
This section analyzes select radio network characteristics as one aspect of LTEperformance.
0
0.25
0.5
0.75
1
-5 0 5 10 15 20 25 30
Cu
mu
lative
Dis
trib
utio
n
Avg SINR (dB)
BBRCUBIC(k3.19)CUBIC(k4.8)
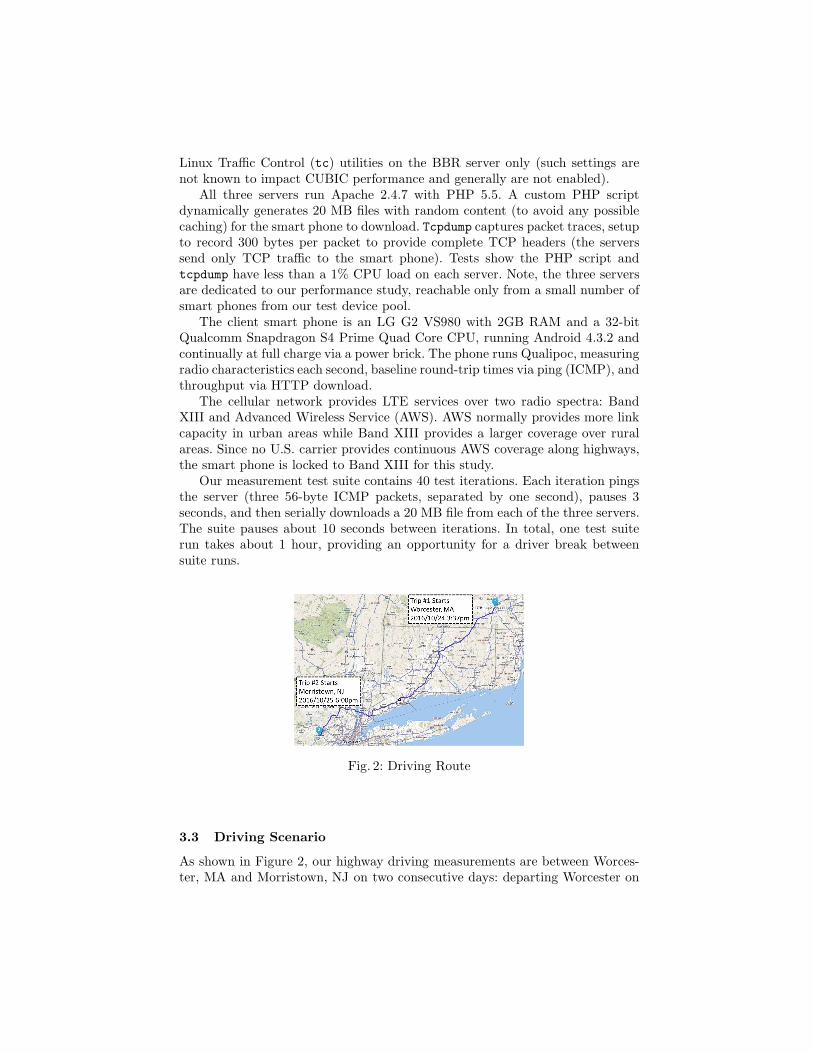
Fig. 3: SINR Distribution
0
10
20
30
40
50
60
70
80
90
100
[-5,0) [0,5) [5,10) [10,15) [15,20) [20,25) [25,30)
Modula
tion (
%)
SINR (dB)
QPSKQAM16QAM64
Fig. 4: Downlink modulation vs. SINR
Figure 3 shows the distribution of Signal to Interference-plus-Noise Ratios(SINRs) for the different TCP congestion control algorithms (CCAs). The x-axis is the SINR, averaged over a trial (file download), with a trendline shownfor each CCA. From the figure, the trendlines overlap, suggesting that eachCCA experiences similar radio conditions on aggregate, allowing for an equitablecomparison of overall performance. Based on this lack of differentiation, we donot present breakdown by CCA for further physical and medium access controllayer analysis. For comparison, our observed SINRs match those Merz et al. [7]measured on inter-city trains in Europe, suggesting similarity in radio coverage.
The modulation (or encoding scheme) selection in LTE depends on the SINRmeasured by both user equipment (UE) and radio tower computers (eNodeBs).Figure 4 shows a histogram of the downlink modulations used for different SINRs.The x-axis is the recorded SINR (in dB) clustered into 5dB bins, and the y-axisis the percentage of transmission blocks (TBs) sent at that modulation. For thebest radio conditions (SINRs greater than 20dB), more than 90% of TBs aretransmitted in 64 QAM (6 bits per symbol). For the worst (SINRs less than5dB), most of TBs are transmitted in QPSK (4 bits per symbol). In between(SINRs between 5dB and 15dB), the eNodeBs adapt transmissions among allthree modulations.

0
200
400
600
800
1000
1200
0 1 2 3 4 5
Byte
s in
Flig
ht
(KB
)
Time (secs)
CUBIC 4.8BBR
(a) Bytes in Flight
0
50
100
150
200
0 1 2 3 4 5
RT
T (
ms)
Time (secs)
CUBIC 4.8BBR
(b) RTT
Fig. 5: Single Trial Downlink for BBR and CUBIC (k4.8)
5 CCA Performance
5.1 Single Trial
For illustration, this section compares a single trial of BBR and CUBIC (k4.8)5
over time. Both trials had an SINR greater than 20dB with no tower handoverand neither flow experienced TCP retransmissions nor packet drops. In Figure 5,the left figure compares the bytes in flight (the as-yet unacknowledged transmit-ted bytes), while the right figure shows the round-trip times (RTTs) measuredvia TCP ACKs. The BBR flow averaged 45 Mbps and the CUBIC flow aver-aged 36 Mbps. For comparison, the CUBIC throughputs are about the same asthe maximum simulated throughputs for stationary UEs by Robert et al. [10],confirming their simulations with our measurements.
From the figures, BBR transmits aggressively during its initial probing phaseshowing a packet and RTT burst, reducing the congestion window to around 500KB after about 1 second, which also reduces the RTT. After the probing phase,BBR maintains an RTT under 80 ms and a congestion window around 500 KB.CUBIC, on the other hand, exits from slow start early in the download (around0.5 seconds) with a small congestion window. Although CUBIC’s congestionwindow is able to grow up to 1 MB by the end of the download, it is unlikely tofully utilize the radio link resources for the duration.
5.2 Throughput
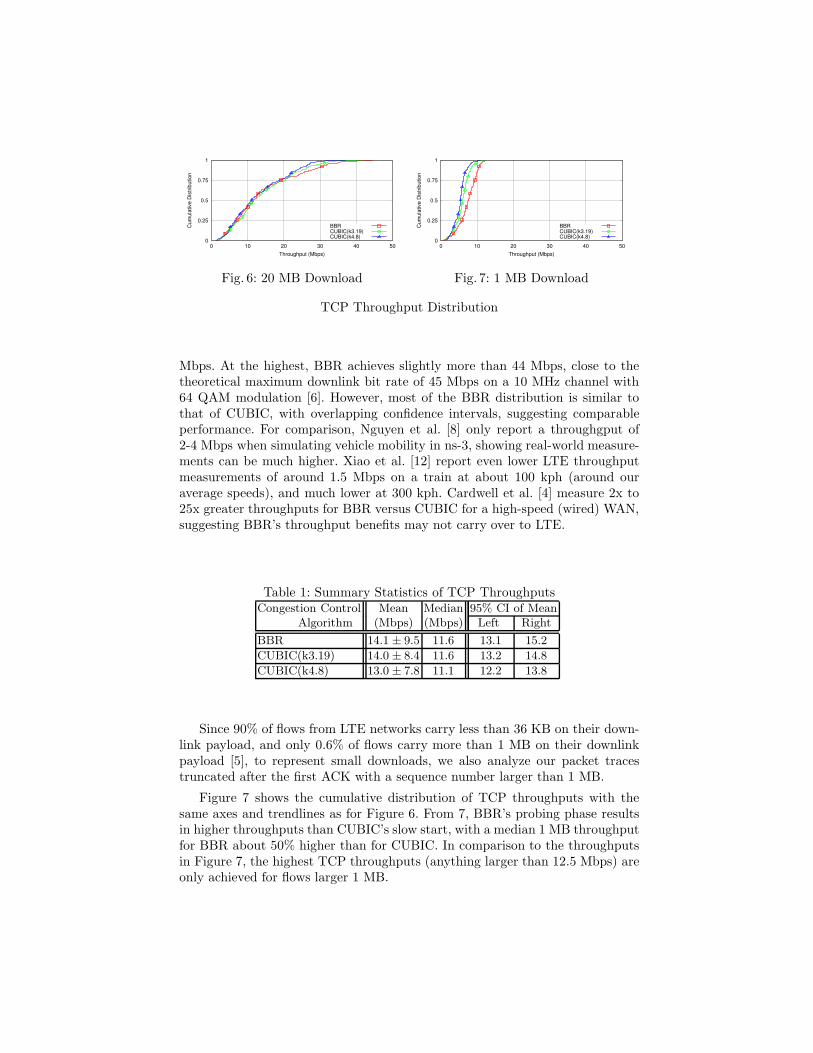
For a core measure of performance, Figure 6 shows the cumulative distributionof TCP throughputs over all trials, with the x-axis the throughput measured foreach trial. Each CCA is shown with a different trendline. Table 1 summarizesthe means, standard deviations, medians and 95% confidence intervals (CI) ofthe means.
From Figure 6 and Table 1, the throughput ranges considerably for all threeCCAs with Q1 (the first quartile) at about 7 Mbps and Q3 (the third quar-tile) at about 20 Mbps. All three CCAs can occasionally achieve more than 30
5 CUBIC (k3.19) behaves similarly to CUBIC (k4.8).
0
0.25
0.5
0.75
1
0 10 20 30 40 50
Cum
ula
tive D
istr
ibution
Throughput (Mbps)
BBRCUBIC(k3.19)CUBIC(k4.8)
Fig. 6: 20 MB Download
0
0.25
0.5
0.75
1
0 10 20 30 40 50
Cum
ula
tive D
istr
ibution
Throughput (Mbps)
BBRCUBIC(k3.19)CUBIC(k4.8)
Fig. 7: 1 MB Download
TCP Throughput Distribution
Mbps. At the highest, BBR achieves slightly more than 44 Mbps, close to thetheoretical maximum downlink bit rate of 45 Mbps on a 10 MHz channel with64 QAM modulation [6]. However, most of the BBR distribution is similar tothat of CUBIC, with overlapping confidence intervals, suggesting comparableperformance. For comparison, Nguyen et al. [8] only report a throughgput of2-4 Mbps when simulating vehicle mobility in ns-3, showing real-world measure-ments can be much higher. Xiao et al. [12] report even lower LTE throughputmeasurements of around 1.5 Mbps on a train at about 100 kph (around ouraverage speeds), and much lower at 300 kph. Cardwell et al. [4] measure 2x to25x greater throughputs for BBR versus CUBIC for a high-speed (wired) WAN,suggesting BBR’s throughput benefits may not carry over to LTE.
Table 1: Summary Statistics of TCP ThroughputsCongestion Control Mean Median 95% CI of Mean
Algorithm (Mbps) (Mbps) Left Right
BBR 14.1 ± 9.5 11.6 13.1 15.2
CUBIC(k3.19) 14.0 ± 8.4 11.6 13.2 14.8
CUBIC(k4.8) 13.0 ± 7.8 11.1 12.2 13.8
Since 90% of flows from LTE networks carry less than 36 KB on their down-link payload, and only 0.6% of flows carry more than 1 MB on their downlinkpayload [5], to represent small downloads, we also analyze our packet tracestruncated after the first ACK with a sequence number larger than 1 MB.
Figure 7 shows the cumulative distribution of TCP throughputs with thesame axes and trendlines as for Figure 6. From 7, BBR’s probing phase resultsin higher throughputs than CUBIC’s slow start, with a median 1 MB throughputfor BBR about 50% higher than for CUBIC. In comparison to the throughputsin Figure 7, the highest TCP throughputs (anything larger than 12.5 Mbps) areonly achieved for flows larger 1 MB.
5.3 Round-Trip Time
Two methods to measure the round-trip time between the smart phone and ourservers are used: i) the average of 3 ICMP pings before each trial, and ii) theTCP connection setup time measured through the three-way handshake.
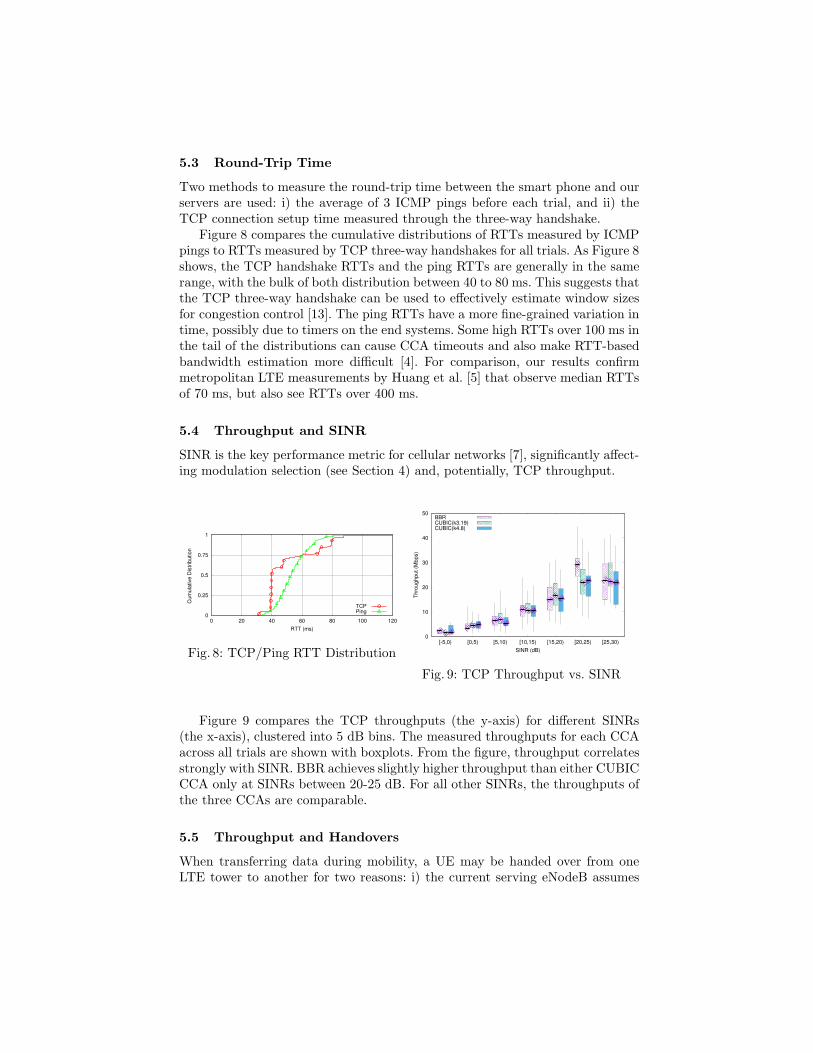
Figure 8 compares the cumulative distributions of RTTs measured by ICMPpings to RTTs measured by TCP three-way handshakes for all trials. As Figure 8shows, the TCP handshake RTTs and the ping RTTs are generally in the samerange, with the bulk of both distribution between 40 to 80 ms. This suggests thatthe TCP three-way handshake can be used to effectively estimate window sizesfor congestion control [13]. The ping RTTs have a more fine-grained variation intime, possibly due to timers on the end systems. Some high RTTs over 100 ms inthe tail of the distributions can cause CCA timeouts and also make RTT-basedbandwidth estimation more difficult [4]. For comparison, our results confirmmetropolitan LTE measurements by Huang et al. [5] that observe median RTTsof 70 ms, but also see RTTs over 400 ms.
5.4 Throughput and SINR
SINR is the key performance metric for cellular networks [7], significantly affect-ing modulation selection (see Section 4) and, potentially, TCP throughput.
0
0.25
0.5
0.75
1
0 20 40 60 80 100 120
Cum
ula
tive D
istr
ibution
RTT (ms)
TCPPing
Fig. 8: TCP/Ping RTT Distribution
0
10
20
30
40
50
[-5,0) [0,5) [5,10) [10,15) [15,20) [20,25) [25,30)
Th
rou
gh
pu
t (M
bp
s)
SINR (dB)
BBRCUBIC(k3.19)CUBIC(k4.8)
Fig. 9: TCP Throughput vs. SINR
Figure 9 compares the TCP throughputs (the y-axis) for different SINRs(the x-axis), clustered into 5 dB bins. The measured throughputs for each CCAacross all trials are shown with boxplots. From the figure, throughput correlatesstrongly with SINR. BBR achieves slightly higher throughput than either CUBICCCA only at SINRs between 20-25 dB. For all other SINRs, the throughputs ofthe three CCAs are comparable.
5.5 Throughput and Handovers
When transferring data during mobility, a UE may be handed over from oneLTE tower to another for two reasons: i) the current serving eNodeB assumes
the UE is leaving its serving zone, or ii) the UE discovers another eNodeB withbetter radio conditions (i.e., stronger SINR).
While 3GPP standards [1] state packets can be forwarded to the next servingeNodeB during tower handover to avoid possible service interruptions, packetsmay still be lost, especially important during rapid movement (e.g., highwaydriving), and confusing bottleneck link capacity estimation algorithms (e.g., usedin BBR [4]).
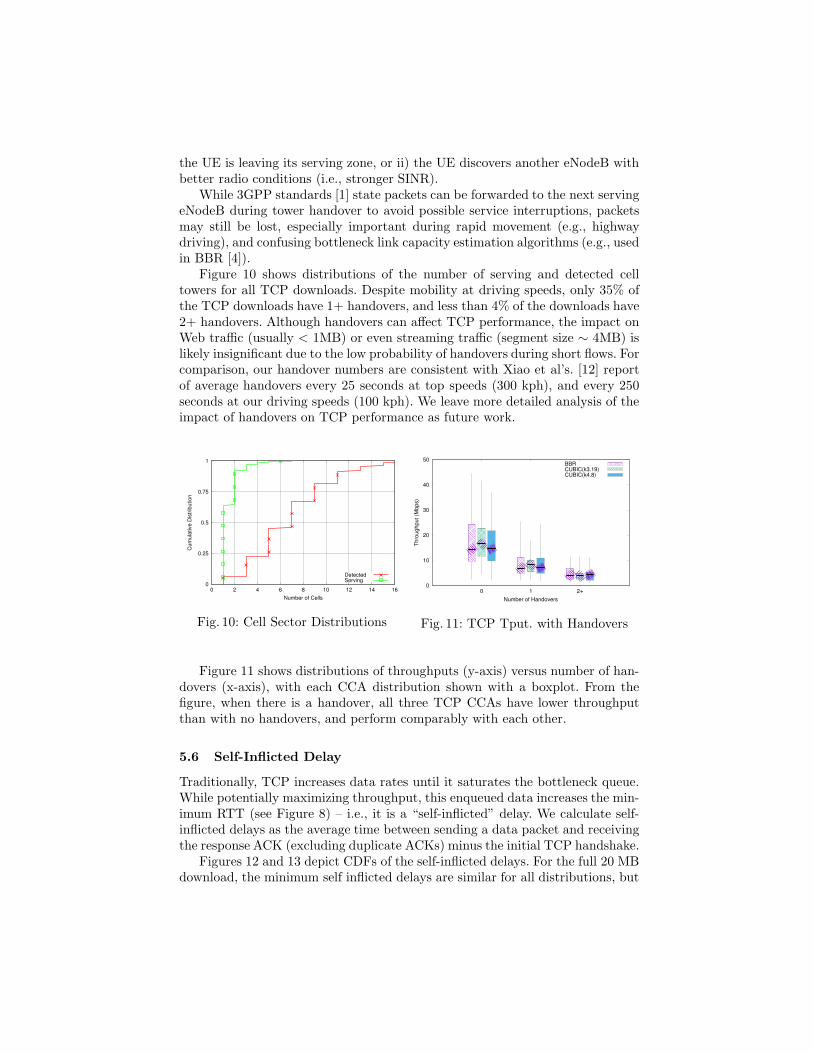
Figure 10 shows distributions of the number of serving and detected celltowers for all TCP downloads. Despite mobility at driving speeds, only 35% ofthe TCP downloads have 1+ handovers, and less than 4% of the downloads have2+ handovers. Although handovers can affect TCP performance, the impact onWeb traffic (usually < 1MB) or even streaming traffic (segment size ∼ 4MB) islikely insignificant due to the low probability of handovers during short flows. Forcomparison, our handover numbers are consistent with Xiao et al’s. [12] reportof average handovers every 25 seconds at top speeds (300 kph), and every 250seconds at our driving speeds (100 kph). We leave more detailed analysis of theimpact of handovers on TCP performance as future work.
0
0.25
0.5
0.75
1
0 2 4 6 8 10 12 14 16
Cu
mu
lative
Dis
trib
utio
n
Number of Cells
DetectedServing
Fig. 10: Cell Sector Distributions
0
10
20
30
40
50
0 1 2+
Th
rou
gh
pu
t (M
bp
s)
Number of Handovers
BBRCUBIC(k3.19)CUBIC(k4.8)
Fig. 11: TCP Tput. with Handovers
Figure 11 shows distributions of throughputs (y-axis) versus number of han-dovers (x-axis), with each CCA distribution shown with a boxplot. From thefigure, when there is a handover, all three TCP CCAs have lower throughputthan with no handovers, and perform comparably with each other.
5.6 Self-Inflicted Delay
Traditionally, TCP increases data rates until it saturates the bottleneck queue.While potentially maximizing throughput, this enqueued data increases the min-imum RTT (see Figure 8) – i.e., it is a “self-inflicted” delay. We calculate self-inflicted delays as the average time between sending a data packet and receivingthe response ACK (excluding duplicate ACKs) minus the initial TCP handshake.
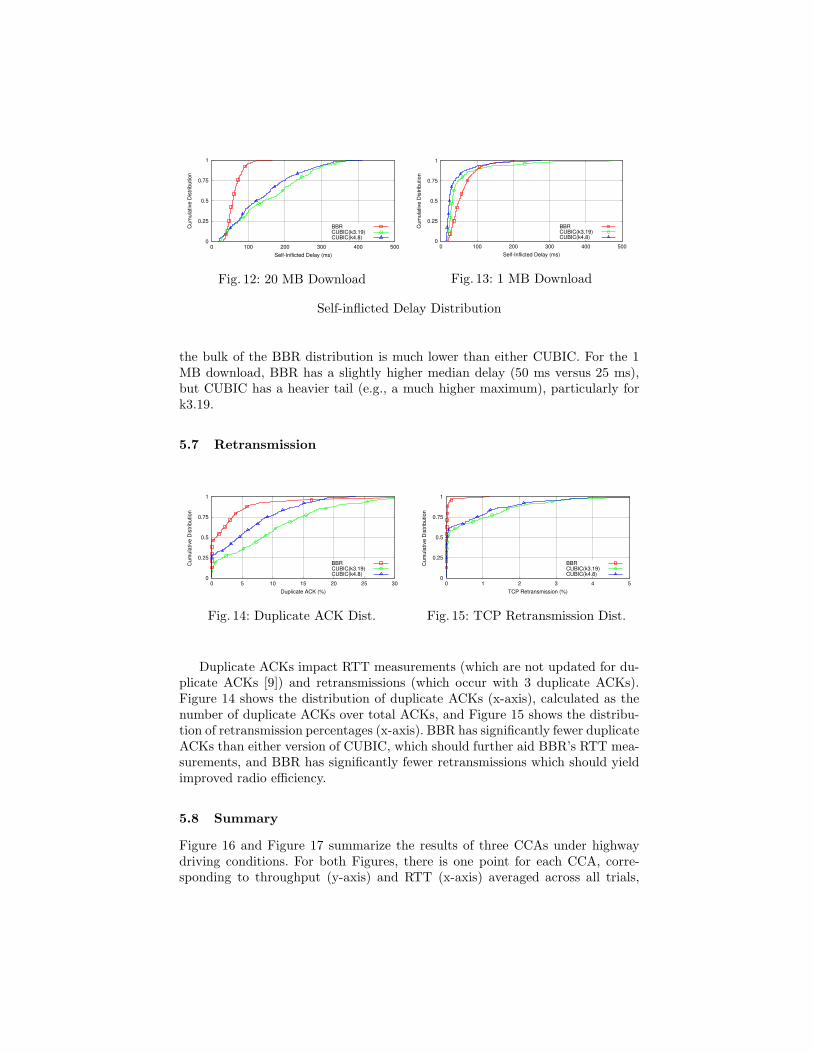
Figures 12 and 13 depict CDFs of the self-inflicted delays. For the full 20 MBdownload, the minimum self inflicted delays are similar for all distributions, but
0
0.25
0.5
0.75
1
0 100 200 300 400 500
Cu
mu
lative
Dis
trib
utio
n
Self-Inflicted Delay (ms)
BBRCUBIC(k3.19)CUBIC(k4.8)
Fig. 12: 20 MB Download
0
0.25
0.5
0.75
1
0 100 200 300 400 500
Cum
ula
tive D
istr
ibution
Self-Inflicted Delay (ms)
BBRCUBIC(k3.19)CUBIC(k4.8)
Fig. 13: 1 MB Download
Self-inflicted Delay Distribution
the bulk of the BBR distribution is much lower than either CUBIC. For the 1MB download, BBR has a slightly higher median delay (50 ms versus 25 ms),but CUBIC has a heavier tail (e.g., a much higher maximum), particularly fork3.19.
5.7 Retransmission
0
0.25
0.5
0.75
1
0 5 10 15 20 25 30
Cu
mu
lative
Dis
trib
utio
n
Duplicate ACK (%)
BBRCUBIC(k3.19)CUBIC(k4.8)
Fig. 14: Duplicate ACK Dist.
0
0.25
0.5
0.75
1
0 1 2 3 4 5
Cu
mu
lative
Dis
trib
utio
n
TCP Retransmission (%)
BBRCUBIC(k3.19)CUBIC(k4.8)
Fig. 15: TCP Retransmission Dist.
Duplicate ACKs impact RTT measurements (which are not updated for du-plicate ACKs [9]) and retransmissions (which occur with 3 duplicate ACKs).Figure 14 shows the distribution of duplicate ACKs (x-axis), calculated as thenumber of duplicate ACKs over total ACKs, and Figure 15 shows the distribu-tion of retransmission percentages (x-axis). BBR has significantly fewer duplicateACKs than either version of CUBIC, which should further aid BBR’s RTT mea-surements, and BBR has significantly fewer retransmissions which should yieldimproved radio efficiency.
5.8 Summary
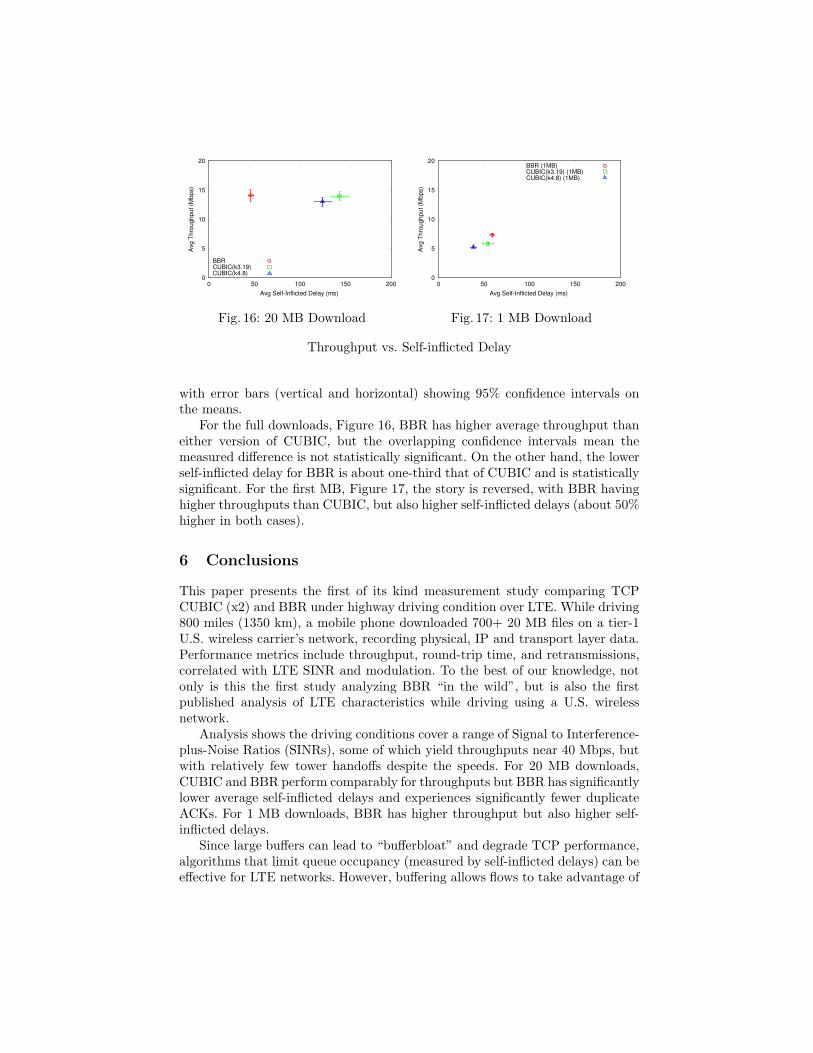
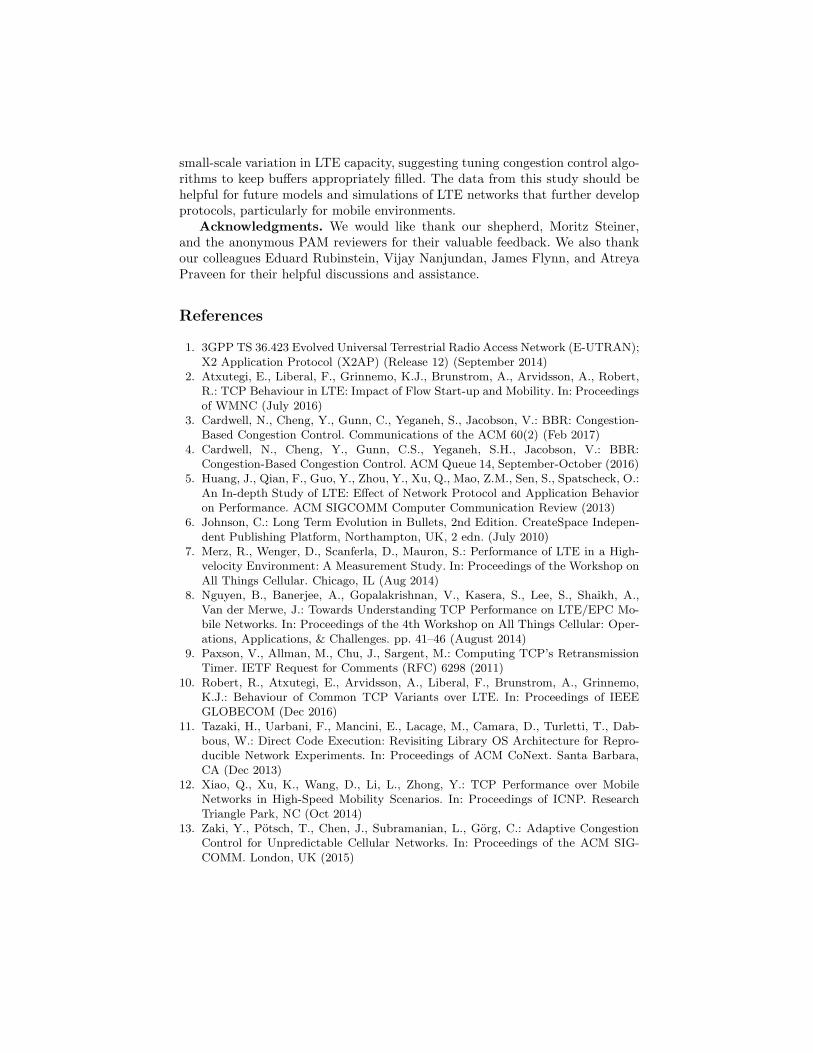
Figure 16 and Figure 17 summarize the results of three CCAs under highwaydriving conditions. For both Figures, there is one point for each CCA, corre-sponding to throughput (y-axis) and RTT (x-axis) averaged across all trials,
0
5
10
15
20
0 50 100 150 200
Avg
Th
rou
gh
pu
t (M
bp
s)
Avg Self-Inflicted Delay (ms)
BBRCUBIC(k3.19)CUBIC(k4.8)
Fig. 16: 20 MB Download
0
5
10
15
20
0 50 100 150 200
Avg
Th
rou
gh
pu
t (M
bp
s)
Avg Self-Inflicted Delay (ms)
BBR (1MB)CUBIC(k3.19) (1MB)CUBIC(k4.8) (1MB)
Fig. 17: 1 MB Download
Throughput vs. Self-inflicted Delay
with error bars (vertical and horizontal) showing 95% confidence intervals onthe means.
For the full downloads, Figure 16, BBR has higher average throughput thaneither version of CUBIC, but the overlapping confidence intervals mean themeasured difference is not statistically significant. On the other hand, the lowerself-inflicted delay for BBR is about one-third that of CUBIC and is statisticallysignificant. For the first MB, Figure 17, the story is reversed, with BBR havinghigher throughputs than CUBIC, but also higher self-inflicted delays (about 50%higher in both cases).
6 Conclusions
This paper presents the first of its kind measurement study comparing TCPCUBIC (x2) and BBR under highway driving condition over LTE. While driving800 miles (1350 km), a mobile phone downloaded 700+ 20 MB files on a tier-1U.S. wireless carrier’s network, recording physical, IP and transport layer data.Performance metrics include throughput, round-trip time, and retransmissions,correlated with LTE SINR and modulation. To the best of our knowledge, notonly is this the first study analyzing BBR “in the wild”, but is also the firstpublished analysis of LTE characteristics while driving using a U.S. wirelessnetwork.
Analysis shows the driving conditions cover a range of Signal to Interference-plus-Noise Ratios (SINRs), some of which yield throughputs near 40 Mbps, butwith relatively few tower handoffs despite the speeds. For 20 MB downloads,CUBIC and BBR perform comparably for throughputs but BBR has significantlylower average self-inflicted delays and experiences significantly fewer duplicateACKs. For 1 MB downloads, BBR has higher throughput but also higher self-inflicted delays.
Since large buffers can lead to “bufferbloat” and degrade TCP performance,algorithms that limit queue occupancy (measured by self-inflicted delays) can beeffective for LTE networks. However, buffering allows flows to take advantage of
small-scale variation in LTE capacity, suggesting tuning congestion control algo-rithms to keep buffers appropriately filled. The data from this study should behelpful for future models and simulations of LTE networks that further developprotocols, particularly for mobile environments.
Acknowledgments. We would like thank our shepherd, Moritz Steiner,and the anonymous PAM reviewers for their valuable feedback. We also thankour colleagues Eduard Rubinstein, Vijay Nanjundan, James Flynn, and AtreyaPraveen for their helpful discussions and assistance.
References
1. 3GPP TS 36.423 Evolved Universal Terrestrial Radio Access Network (E-UTRAN);X2 Application Protocol (X2AP) (Release 12) (September 2014)
2. Atxutegi, E., Liberal, F., Grinnemo, K.J., Brunstrom, A., Arvidsson, A., Robert,R.: TCP Behaviour in LTE: Impact of Flow Start-up and Mobility. In: Proceedingsof WMNC (July 2016)
3. Cardwell, N., Cheng, Y., Gunn, C., Yeganeh, S., Jacobson, V.: BBR: Congestion-Based Congestion Control. Communications of the ACM 60(2) (Feb 2017)
4. Cardwell, N., Cheng, Y., Gunn, C.S., Yeganeh, S.H., Jacobson, V.: BBR:Congestion-Based Congestion Control. ACM Queue 14, September-October (2016)
5. Huang, J., Qian, F., Guo, Y., Zhou, Y., Xu, Q., Mao, Z.M., Sen, S., Spatscheck, O.:An In-depth Study of LTE: Effect of Network Protocol and Application Behavioron Performance. ACM SIGCOMM Computer Communication Review (2013)
6. Johnson, C.: Long Term Evolution in Bullets, 2nd Edition. CreateSpace Indepen-dent Publishing Platform, Northampton, UK, 2 edn. (July 2010)
7. Merz, R., Wenger, D., Scanferla, D., Mauron, S.: Performance of LTE in a High-velocity Environment: A Measurement Study. In: Proceedings of the Workshop onAll Things Cellular. Chicago, IL (Aug 2014)
8. Nguyen, B., Banerjee, A., Gopalakrishnan, V., Kasera, S., Lee, S., Shaikh, A.,Van der Merwe, J.: Towards Understanding TCP Performance on LTE/EPC Mo-bile Networks. In: Proceedings of the 4th Workshop on All Things Cellular: Oper-ations, Applications, & Challenges. pp. 41–46 (August 2014)
9. Paxson, V., Allman, M., Chu, J., Sargent, M.: Computing TCP’s RetransmissionTimer. IETF Request for Comments (RFC) 6298 (2011)
10. Robert, R., Atxutegi, E., Arvidsson, A., Liberal, F., Brunstrom, A., Grinnemo,K.J.: Behaviour of Common TCP Variants over LTE. In: Proceedings of IEEEGLOBECOM (Dec 2016)
11. Tazaki, H., Uarbani, F., Mancini, E., Lacage, M., Camara, D., Turletti, T., Dab-bous, W.: Direct Code Execution: Revisiting Library OS Architecture for Repro-ducible Network Experiments. In: Proceedings of ACM CoNext. Santa Barbara,CA (Dec 2013)
12. Xiao, Q., Xu, K., Wang, D., Li, L., Zhong, Y.: TCP Performance over MobileNetworks in High-Speed Mobility Scenarios. In: Proceedings of ICNP. ResearchTriangle Park, NC (Oct 2014)
13. Zaki, Y., Potsch, T., Chen, J., Subramanian, L., Gorg, C.: Adaptive CongestionControl for Unpredictable Cellular Networks. In: Proceedings of the ACM SIG-COMM. London, UK (2015)