tcrp report 128 effects of tod on housing, parking, … report 128 effects of tod on housing,...
TRANSCRIPT
TCRP Report 128 Effects of TOD on Housing, Parking, and Travel
1

TCRP Report 128 Effects of TOD on Housing, Parking, and Travel
TCRP Report 128 Effects of TOD on Housing, Parking, and Travel
GB Arrington Robert Cervero PhD
Co-Principal Investigators
GB Arrington Todd Borkowitz
Kimi Iboshi-Sloop Emily Hull
Jennifer Rosales PB PlaceMaking
Portland, Oregon
Robert Cervero PhD University of California at Berkeley
Berkeley, California
Shelley Poticha Jeff Wood
Center for Transit Oriented Development Oakland, California
Robert Dunphy
Carl Koelbel Urban Land Institute
Washington, DC

TCRP Report 128 Effects of TOD on Housing, Parking, and Travel
i
TCRP Staff Ms. Gwen Chisholm-Smith
Project Panel
Chair Mr. Richard G. Bickel, Jr. - Delaware Valley Regional Planning Commission
Members
Dr. Edward A. Beimborn, University of Wisconsin - Milwaukee
Mr. Todd Hemingson, Capital Metro
Mr. William Jones, Capital One
Mr. Jack Kanarek, New Jersey Transit
Mr. Jack Limber, San Diego
Dr. Anastasia Loukaitous-Sideris, University of California - Los Angeles
Mr. Jeff Ordway, San Francisco Bay Area Rapid Transit District
Mr. Jeffrey L. Spencer, Caltrans
Mr. Paul Marx, FTA Liaison
Ms. Effie Stallsmith, FTA Liaison
Mr. Richard Weaver¸ APTA Liaison
Dr. Peter Shaw, TRB Liaison
ACKNOWLEDGMENT OF SPONSORSHIP This work was sponsored by the Federal Transit Administration (FTA) and was conducted in the Transit Cooperative Research Program, which is administered by the Transportation Research
Board of the National Research Council
DISCLAIMER This copy is an uncorrected draft as submitted by the research agency. A decision concerning acceptance by the Transportation Research Board, and publication in the regular TCRP series
will not be made until a complete technical review has been made and discussed with the researchers. The opinions and conclusions expressed or implied in the report are those of the research agency. They are not necessarily those of the Transportation Research Board, the
National Research Council, the Federal Transit Administration (FTA), or the Transit Development Corporation.

TCRP Report 128 Effects of TOD on Housing, Parking, and Travel
ii
TABLE OF CONTENTS
1. Executive Summary ................................................................... 4
2. Literature Review ...................................................................10
3. Does TOD Housing Reduce Automobile Trips?...................................58
1. Study Projects .....................................................................59
2. Study Methods .....................................................................67
3. Data Compilation .................................................................68
4. Comparison of Vehicle Trip Generation Rates ...............................69
4. How Do Rates Vary? ..............................................................84
5. Multiple Regression Predictions of TOD-Housing Trip Generation Rates.97
6. Applying the Research: Four TOD Housing Case Studies.................. 103
7. Implications of Applying New Standards for TOD-Housing ............... 114
8. Conclusions and Recommendations .......................................... 116
Literature Review References ................................................. 121
TCRP Report 128 Effects of TOD on Housing, Parking, and Travel
iii
Project Objectives
The objectives of this research are to (1) determine the behavior and motivation of TOD residents, employees, and employers in their mode choice; (2) identify best practices to promote TOD-related transit ridership; and (3) recommend contextual use of best practices. The results of this research may be used by project, land-use, and transportation planners; elected officials; transit agencies; federal, state, and local funding agencies; public and private financial institutions; and developers. The panel also posed nine questions to the research team:
• What are the demographic profiles of TOD residents and employers? • What motivates residents or employers to locate in TODs? Examples
of motivators may include the quality of schools, access to jobs, housing affordability, presence of transit services, neighborhood services and amenities, and community perception.
• What are the travel characteristics (e.g., frequency of travel by different modes) of people who live or work in a TOD?
• What was the travel pattern of the TOD resident prior to moving to the TOD?
• What levels of transit connectivity to desired origins and destinations are required to promote transit ridership at TODs?
• What motivates or impedes transit ridership in a TOD? • Which strategies have been effective in increasing transit ridership
at TODs? • What steps should transit agencies take in supporting TODs to
maximize transit ridership? • What TOD land-use and design features (e.g., mixed land-use, traffic
calming, bus bulbs, short blocks, street furniture) have had an effect on travel patterns, transit ridership, or the decision to locate in a TOD?

TCRP Report 128 Effects of TOD on Housing, Parking, and Travel
4
Effects of TOD on Housing, Parking, and Travel
Literature Review and Case Studies
1. Executive Summary This research helps confirm what had been intuitively obvious: in the four metropolitan areas studied, TOD-housing produced considerably less traffic than is generated by conventional development. Yet most TODs are parked on the assumption that there is little difference between TOD and conventional development with respect to the traffic they generate and the parking spaces they are built with. One likely result of this fallacious assumption is that fewer TOD projects get built. Those TOD developments that do get built are certainly less affordable and less sustainable than they might be, because they are subject to incorrect assumptions about the traffic impact they generate. Therefore many of the hoped for benefits (i.e., less time stuck in traffic and lower housing costs to name two), from the nearly $75 billion in public dollars invested in rail transit over the past 11 years, are not being realized. The policy value of transit-oriented development (TOD) projects (e.g. less automobile travel) is well understood. Those potential benefits are muted since most U.S. TODs are parked oblivious to the fact that a rail stop is nearby. This study looks at the most recent literature on the subject and the actual transportation performance of 17 built TOD projects. The report is divided into two sections:
Section 1 – Literature Review Section 2 – Research Findings

TCRP Report 128 Effects of TOD on Housing, Parking, and Travel
5
Literature Review We now know a lot more about the travel performance of TODs. Whereas the first generations of TOD focused primarily on advocacy and assisting early adopters, there is now increased measurement and understanding of TOD travel outcomes. Some key findings in this literature review include:
Between 1970 and 2000, transit ridership for work trips increased in TOD zones, whereas ridership declined markedly in the metro areas surrounding TODs.
TOD households are twice as likely to not own a car, and own roughly half as many cars as comparable households not living in TODs.
Among the factors that attract households to TOD, households consistently place high value on neighborhood design, home prices and perceived value, and transit proximity.
Access to high quality transit is becoming increasingly important to firms trying to attract “creative class” workers in the knowledge economy.
The literature review focused on nine questions related to TOD travel characteristics, transit system and land use influences, TOD ridership strategies and TOD resident/tenant characteristics. The most current knowledge on TOD was analyzed. The following is a summary of the key conclusions for each question.
TOD Travel Characteristics
i) What are the travel characteristics (e.g., frequency of travel by different modes) of people who live or work in a TOD?
ii) What was the travel pattern of the TOD resident prior to moving to the TOD?
TOD commuters typically use transit 2 to 5 times more than other commuters in the region. TOD transit mode share can vary from 5% to near 50%. The findings are similar findings for non-work trips: transit share is 2 to 5 times higher, although mode shares are typically lower than commute trips (2% to 20%) The primary reason for range is that transit use is heavily influenced by relative travel times with automobile and extensiveness of transit service, which can vary markedly across regions. As the transit network links to more job centers, educational opportunities and cultural facilities, transit use increases. From this perspective, TOD type (e.g., suburban neighborhood versus suburban center) is less important than specific location within the region and the quality of connecting transit service. Although one could reasonably infer the approximate transit mode share of a hypothetical new TOD by comparing it to similar TODs in the same, existing system, there is no rule of
TCRP Report 128 Effects of TOD on Housing, Parking, and Travel
6
thumb or single mode share number that can be easily applied to a hypothetical new TOD along a new rail or bus system. This is due to widely varying local travel conditions and employment distributions.
A primary reason for higher TOD transit use is self selection. Current transit users and those precluded to use transit seek out TOD. The travel pattern of TOD residents prior to moving to the TOD depended on their previous access to transit. When work location was unchanged, often a significant percent (e.g., 50%) were transit users. Among commuters with no previous transit access, transit use increased (up to 50%).
Transit System and Land Use Influences
i) What levels of transit connectivity to desired origins and destinations are required to promote transit ridership at TODs?
ii) What TOD land-use and design features (e.g., mixed land-use, traffic calming, bus bulbs, short blocks, street furniture) have had an effect on travel patterns, transit ridership, or the decision to locate in a TOD?
Research shows that system extensiveness is positively correlated with transit ridership. Extensive transit networks are also most often found in cities with worse traffic congestion (i.e., slow auto trip times) and higher parking costs, and these 3 factors work together to increase TOD transit ridership. The general consensus is that transit service headways of 10 minutes is ideal to support a transit lifestyle. There is no single, definitive threshold for connectivity, and measures such as “track miles” and “number of transit stations” are not the best predictors of ridership on their own. What matters is transit travel times relative to auto travel times. For example, an extensive but very slow transit system will likely attract few riders if highway congestion is not severe. Conversely, a single fast rail corridor adjacent to a highly congested auto corridor will likely attract high ridership.
The location of jobs accessible by transit influences transit ridership. Systems that generate the highest commute ridership have a high percentage of regional jobs accessible by fast transit. For work trips, proximity to rail stations is a stronger influence on transit use than land use mix or quality of walking environment. Thus, the most effective strategy to increase TOD ridership is to increase development densities in close proximity to transit. Employment densities at trip ends have more influence on ridership than population densities at trip origins. It is critical to locate jobs near transit in order to attract households to TODs. However, Relative travel time (transit v. auto) is still more important than any land use factor (density, diversity of uses, design) in ridership.

TCRP Report 128 Effects of TOD on Housing, Parking, and Travel
7
Mixed uses in TODs allow the transit service to be used for a variety of trip purposes throughout the day and week, but as a travel benefit, this is not a primary consideration for prospective TOD residents. Employment access is a primary consideration. Mixed uses (e.g., local restaurants) and urban design treatments (e.g., pedestrian pathways) are important for their amenity and design value in attracting residents and visitors/customers. TOD residents highly value “good” neighborhood design in addition to transit access to work. Urban design and the local land use mix may influence which TOD prospective residents choose to live in. Good design may also make a TOD a more desirable location to travel to.
TOD Ridership Strategies
i) What motivates or impedes transit ridership in a TOD? ii) What strategies have been effective in increasing transit ridership at
TODs? iii) What steps should transit agencies take in supporting TODs to
maximize transit ridership?
Factors that most influence transit ridership are station proximity, transit quality and parking policies. Fast, frequent, and comfortable transit service will increase ridership, as will high parking charges and/or constrained parking supply. The availability of free or low-cost parking is a major deterrent to transit ridership.
Successful ridership strategies include: TOD transit pass programs, parking reductions, and car-sharing programs TOD transit programs will be similar to other transit programs. That said, because TOD residents and households are by definition the nearest to transit, TODs should be among the first locations that transit agencies implement specialized programs.
TOD (e.g., mixed uses, high densities, reduced parking) is still “illegal” around station areas in many cities and transit districts, creating a barrier for development. Steps that transit agencies are taking to promote TOD include: reconsidering replacement parking requirements at park and rides, advocating for zoning changes with TOD entitlements, land assembly, joint development, and educational efforts (e.g., producing TOD guidebooks).
TOD Resident/Tenant Characteristics
i) What are the demographic profiles of TOD residents and employers? ii) What motivates residents or employers to locate in TODs? Examples
of motivators may include the quality of schools, access to jobs, housing affordability, presence of transit services, neighborhood services and amenities, and community perception.
TCRP Report 128 Effects of TOD on Housing, Parking, and Travel
8
The majority of TOD residents along new transit systems are childless singles or couples. The age spectrum is wide: often younger working professionals, or older “empty-nesters”. TOD residents may have low, medium or high incomes; this is driven by the design and price of the specific TOD housing, and TOD developers will target/be able to predict their market. More higher incomes are being served as the US continues to go through a robust construction phase of denser urban residential product.
TOD households typically own fewer cars because they have smaller households, and because they may forgo “extra” cars due to transit’s proximity. TOD households are almost twice as likely to not own any car, and own almost half the number of cars of other households.
The top 3 reasons households give for selecting a TOD are housing/ neighborhood design, housing cost, and proximity to transit.
TOD Housing Transportation Performance The actual transportation performance of 17 built TOD projects was assessed by counting the passage of motorized vehicles using pneumatic tubes stretched across the driveways of 17 transit-oriented housing projects of varying sizes in four urbanized areas of the country: Philadelphia/N.E. New Jersey; Portland, Oregon; metropolitan Washington D.C.; and the East Bay of the San Francisco Bay Area. To help understand the physical implications of the research, 8 residential TOD site plan case studies were developed to test some of the physical implications of reducing residential parking ratios at a range of potential densities on a theoretical 8 acre TOD. One motivation for this research was to provide original and reliable data to help seed an update of the Institute of Transportation Engineers (ITE) trip generation and parking generation rates from which local traffic and parking impacts are typically derived, and impact fees are set. Some analysts are of the opinion that there is a serious "suburban bias" in the current ITE rates. Typically the empirical data used to set generation rates are drawn from suburban areas with free and plentiful parking and low-density single land uses. Moreover, since ITE's auto trip reduction factors, to reflect internal trip capture, are based on only a few mixed-use projects in Florida; there has been little or no observation of actual TODs. The end result is that auto trip generation is likely to be overstated for TODs. This can mean that TOD developers end up paying higher impact fees, proffers, and exactions than they should since such charges are usually tied to ITE rates. The results of this research clearly show TOD-housing results in fewer trips in the four urbanized areas that were studied. The research confirms the ITE trip

TCRP Report 128 Effects of TOD on Housing, Parking, and Travel
9
generation and parking generation rates underestimate automobile trip reduction for TOD housing. The ITE manual presents “weighted averages” of trip generation. The weighted average vehicle trip rates for this study were computed for all 17 projects combined for weekday, AM peak, and PM peak. Over a typical weekday period, the 17 surveyed TOD-housing projects averaged 44% fewer vehicle trips than that estimated by the ITE manual (3.754 versus 6.715). The weighted average differentials were even larger during peak periods – 49% lower rates during the A.M. peak and 48% lower rates during the P.M. peak. To the degree that impact fees are based on peak travel conditions, one can infer that traffic impacts studies might end up overstating the potential congestion-inducing effects of TOD-housing in large rail-served metropolitan areas, such as Washington D.C., by up to 50%. One implication of the research is that parking ratios for residential TODs are also likely to be overstated by the same order of magnitude since they are also based on ITE data. Some of the cumulative impacts of over-parking TODs are illustrated in the site plan case studies. The TOD site plan case studies help to demonstrate that under the right conditions lowering residential parking ratios by 50% for TODs in station areas with quality transit service can result in:
An increase in the potential density of a residential TOD by between 20 to 33% depending on the residential building type
Savings on residential parking costs ranging from 5 to 36%, after accounting for increases in the number of units to be parked resulting from increased residential density, and
Potentially greater developer profits and/or increased housing affordability coming from achieving higher densities, lower capital costs for parking, and reduced traffic impact fees.
Right-sizing parking ratios and traffic generation to the actual performance of TOD is likely to result in some important implications on the physical form and performance of TOD developments:
Local officials and neighborhoods may be more apt to support increases in residential densities near transit if they are shown proof fewer trips result from TODs than in conventional development.
TOD developers will have easier development approvals and the benefits of TOD will not be compromised away.
TOD developers would likely pay lower traffic related impact fees and exactions. Those savings can be passed on to consumers in the form of lower housing costs.
With lower levels of traffic being generated from TODs it can be argued it simply makes no sense to construct roadway improvements for TOD related traffic that is likely not to materialize.

TCRP Report 128 Effects of TOD on Housing, Parking, and Travel
10
Right-sizing new road and intersection improvements to reflect the actual transportation performance can result in more compact development patterns and a higher quality pedestrian environment since less land may be used for road improvements.
The potential for higher densities in TODs because of the decreased amount of land dedicated to parking and the reduced cost of parking.
Smart growth requires smart calculations, thus impact fees, parking ratios and road improvements need to account for the likely trip reduction effects of TOD. The research study results indicate that residential TOD parking ratios can be tightened and, thus, fees lowered to reflect the actual transportation performance of TODs. Given that TODs have historically been over-parked, the incorporation of the research results into revised parking ratios is an important next step toward national recognition of the expected community benefits of TOD.
2. Literature Review
For the TCRP H-27A project, the panel identified a number of fundamental questions pertaining to transit ridership and TOD. For this literature review, the research team has taken the liberty to divide these questions into four general areas: 1) TOD Travel Characteristics; 2) Transit System and Land Use Characteristics; 3) TOD Ridership Strategies; and 4) TOD Resident/Tenant Characteristics. Findings related to these topic areas and specific questions follow.
To briefly summarize, the existing research provides a largely complete story about transit ridership and TOD. There is significant and very detailed information about specific TOD projects in places such as Portland, Oregon, Arlington County in suburban Washington, D.C., and the San Francisco Bay Area, where a significant amount of travel behavior data has been collected via resident surveys (and as the product of academic research). At the “macro level”, US Census data has also been thoroughly analyzed to reveal differences between TOD households and other households with respect to travel behavior and demographics. All of these findings are consistent with each other, and consistent with economic and behavior studies that explain why people travel as they do. For many cities there still remains a lack of detailed primary (survey) data. That said, it is reasonable to assume that the transportation and economic forces that shape TOD residency and travel behavior in California, for instance, would also apply to other settings (e.g., Dallas).

TCRP Report 128 Effects of TOD on Housing, Parking, and Travel
11
We now know a lot more about the travel performance of TODs. Whereas the first generations of TOD focused primarily on advocacy and assisting early adopters, there is now increased measurement and understanding of TOD travel outcomes. Some key findings in this literature review include:
Between 1970 and 2000, transit ridership for work trips increased in TOD zones, whereas ridership declined markedly in the metro areas surrounding TODs.
TOD households are twice as likely to not own a car, and own roughly half as many cars as comparable households not living in TODs.
Among the factors that attract households to TOD, households consistently place high value on neighborhood design, home prices and perceived value, and transit proximity.
Access to high quality transit is becoming increasingly important to firms trying to attract “creative class” workers in the knowledge economy.
In addition to the literature on TOD, there are larger bodies of literature that address transit operations (to maximize ridership) and the travel impacts of development density, mixed uses, and urban design. This literature review does not describe all of those studies, and rather focuses on research pertaining to TOD specifically. That said, some key findings from the general transit and land use literature are included, as they would not be expected to differ significantly for TODs.
TOD Travel Characteristics iii) What are the travel characteristics (e.g., frequency of travel by
different modes) of people who live or work in a TOD?
iv) What was the travel pattern of the TOD resident prior to moving to the TOD?
Key Conclusions
• TOD commuters typically use transit 2 to 5 times more than other commuters in the region. TOD transit mode share can vary from 5% to near 50%.
• Similar findings for non-work trips, transit share is 2 to 5 times higher, although mode shares are typically lower than commute trips (2% to 20%)
• The primary reason for range is that transit use is heavily influenced by relative travel times with automobile and extensiveness of transit service, which can vary markedly across regions. As the transit network links to

TCRP Report 128 Effects of TOD on Housing, Parking, and Travel
12
more job centers, educational opportunities and cultural facilities, transit use increases. From this perspective, TOD type (e.g., suburban neighborhood versus suburban center) is less important than specific location within the region and the quality of connecting transit service.
• The transit mode shares are statistically reliable, and for an existing rail system, one could reasonably infer the approximate transit mode share of a hypothetical new TOD by comparing it to similar TODs in the same system.
• However, there is no rule of thumb or single mode share number that can be easily applied to a hypothetical new TOD along a new rail or bus system, due to widely varying local travel conditions and employment distributions.
• A primary reason for higher TOD transit use is self selection. Current transit users and those predisposed to use transit seek out TOD.
• When work location is unchanged – often a significant percent (e.g., 50%) were transit users.
• Among commuters with no previous transit access, transit use can increase (up to 50%).
Findings
The literature shows that those who live and work near transit stops patronize transit appreciably more than the typical resident of a region. The most recent comprehensive study on the travel characteristics of TOD residents and workers is the 2003 study: Travel Characteristics of Transit-Oriented Development in California (Lund, Cervero, Willson, 2004). In this study, ridership statistics were developed for those living at 26 residential sites near rail stations in California’s four largest metropolitan areas, as well as for a smaller sample of office workers, retail shoppers, hotel workers and guests of projects near rail stations.
Key findings about station-area residents include:
Commute mode share: From travel-diary responses, around one-quarter of the surveyed California TOD residents took transit to work. This was nearly five times higher than transit’s commute-trip modal share by residents who lived in the surrounding community. This five-fold “ridership bonus” associated with transit-oriented living is similar to that found in a comprehensive survey of California TOD residents conducted in 1992 (Cervero, 1993). Patterns varied significantly across the state, with transit capture rates of nearly 50% for several Bay Area TODs, and under 5% for some Southern California locales. Around half of the working residents of all California TODs said they never take transit to work.
Frequency of travel: Across the 26 surveyed residential sites, 29% of tenants who responded to the survey indicated they commute by transit

TCRP Report 128 Effects of TOD on Housing, Parking, and Travel
13
every workday, and another 7% reported they commute several times a week. In the case of the Pleasant Hill TOD, 49% of residents indicated they took BART to work every weekday.
Non-Commuter mode share: Transit served, on average, 8% of non-work trips made by surveyed station-area residents, again with considerable variation across TODs. At BART’s Pleasant Hill station, for instance, transit served 15% of non-work trips compared to less than 2% for sampled projects in Long Beach and Los Angeles. The differential between transit’s modal splits for work versus non-work trips highlights the role that self-selection plays in shaping travel choices. Notably, people tend to move to TODs partly because of the desire to rail-commute and express this preference most visibly in their work-trip modal choice.
Trends: Transit’s modal share remained fairly stable over the 1993-2003 period for neighborhoods surrounding rail stations. However, since transit’s market share of trips generally eroded over this 10-year period, it appears that TOD areas have weathered the secular trend toward declining transit ridership better than most settings.
Length of residency: There is some evidence that those who have lived in California TODs the longest tend to use transit most often. Among those who lived in a TOD for more than a decade, the share taking transit for their “main trips” (both work and non-work purposes) averaged 29% versus 17% among those who had lived in the TOD for less than five years.
Intervening factors: Consistent with other research on mode choice, many other factors were found to play a critical role in influencing the modal choices of station-area residents. Policies that significantly affected modal choices included: free parking at the workplace, flex-time privileges, employer contributions to the cost of transit passes, and to a reduced degree, land-use variables like density and street connectivity. Additional information about these intervening factors is included in subsequent sections of this literature review.
Key findings about station-area office workers include:
Commute mode share: From the survey of those working at 10 predominantly suburban office buildings near California rail stations, on average, around 12% got to work via rail transit. This is around five percentage points higher than rail’s market share for TOD office workers who were surveyed in 1992 (Cervero, 1993). Modal splits varied markedly, however. For two of the ten office projects, 25% or more of surveyed workers rail-commuted. These two projects are in downtown settings with comparatively high densities, good regional accessibility, mandatory parking charges, and situated within a block of the rail station.
TCRP Report 128 Effects of TOD on Housing, Parking, and Travel
14
Intervening factors: Besides proximity to rail transit, other factors that encouraged office workers to rail-commute included: availability of free parking at the workplace, employer-provided transit passes; quality of the walking corridor from the rail station to the office building; and feeder bus frequency.
Key findings about station-area hotel patrons and employees, and retail customers include:
Commute mode share: Of 111 workers surveyed at two hotels near rail transit in California, 41% got to work by rail transit.
Travel by hotel patrons: Transit was not used to access hotels near rail stations among the small sample of guests who were surveyed. More than half of the surveyed guests indicated that they used transit during their stay.
Travel by retail patrons: Of the 1,259 retail patrons surveyed at three shopping facilities near rail stations in California, 13% had arrived by rail transit.
Research from metropolitan Washington, D.C. has also found higher transit market shares among station-area residents, attributable in part to the high levels of accessibility conferred by the WMATA rail network (JHK and Associates,1989). Over the past three decades Arlington County has channeled new development into high-density mixed-use projects around five closely spaced urban rail stations in the Rosslyn-Ballston Corridor, and employed a variety of techniques, including transportation demand management programs, to encourage residents to use transit. As a result, 47% of residents use modes of travel other than the automobile to get to work, and 73% arrive at rail stations on foot, providing a cost savings because neither the county nor WMATA have to provide long-term commuter parking – land parcels that were devoted to parking early on have all been developed. About 40,000 riders board daily at the five urban stations in the Rosslyn-Ballston Corridor. About 29,000 riders board at the four suburban stations farther out along the Orange Line; only 15% of these transit riders arrive at their stations on foot, while 58% arrive by car (Dittmar and Ohland, 2004).
Dittmar and Ohland compiled 2000 Census Journey to Work data for selected TODs in three regions with high transit ridership. These TODs were defined by using a half-mile radius buffer around selected transit stops. Table 1 shows high levels of both transit and walking at each of the stations, higher than the levels in the county as a whole. The Evanston and urban downtown stops had particularly high walking shares, indicating that many downtown residents both live and work downtown, and that transit supports this lifestyle. The walk shares in Arlington, however, were comparatively low, and the authors suggest this is due to the high number of regional jobs in the capital, and a historic
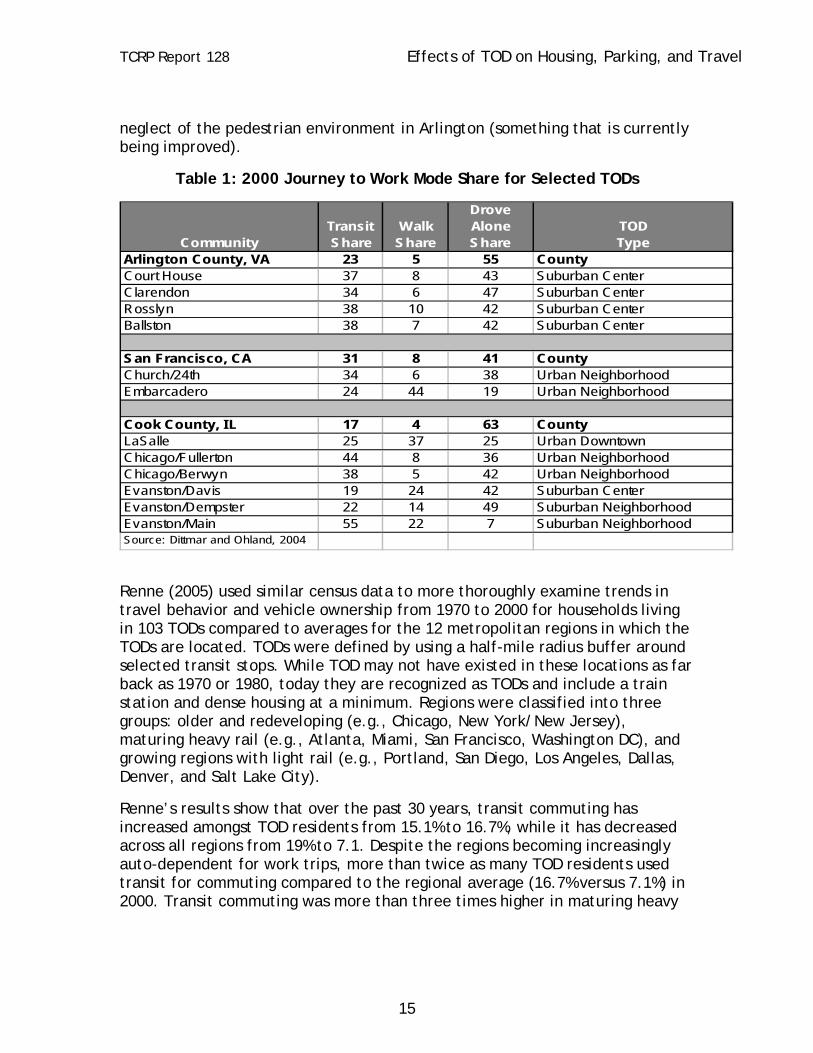
TCRP Report 128 Effects of TOD on Housing, Parking, and Travel
15
neglect of the pedestrian environment in Arlington (something that is currently being improved).
Table 1: 2000 Journey to Work Mode Share for Selected TODs
CommunityTransitShare
WalkShare
DroveAloneShare
TODType
Arlington County, VA 23 5 55 CountyCourt House 37 8 43 Suburban CenterClarendon 34 6 47 Suburban CenterRosslyn 38 10 42 Suburban CenterBallston 38 7 42 Suburban Center
San Francisco, CA 31 8 41 CountyChurch/24th 34 6 38 Urban NeighborhoodEmbarcadero 24 44 19 Urban Neighborhood
Cook County, IL 17 4 63 CountyLaSalle 25 37 25 Urban DowntownChicago/Fullerton 44 8 36 Urban NeighborhoodChicago/Berwyn 38 5 42 Urban NeighborhoodEvanston/Davis 19 24 42 Suburban CenterEvanston/Dempster 22 14 49 Suburban NeighborhoodEvanston/Main 55 22 7 Suburban NeighborhoodSource: Dittmar and Ohland, 2004
Renne (2005) used similar census data to more thoroughly examine trends in travel behavior and vehicle ownership from 1970 to 2000 for households living in 103 TODs compared to averages for the 12 metropolitan regions in which the TODs are located. TODs were defined by using a half-mile radius buffer around selected transit stops. While TOD may not have existed in these locations as far back as 1970 or 1980, today they are recognized as TODs and include a train station and dense housing at a minimum. Regions were classified into three groups: older and redeveloping (e.g., Chicago, New York/New Jersey), maturing heavy rail (e.g., Atlanta, Miami, San Francisco, Washington DC), and growing regions with light rail (e.g., Portland, San Diego, Los Angeles, Dallas, Denver, and Salt Lake City).
Renne’s results show that over the past 30 years, transit commuting has increased amongst TOD residents from 15.1% to 16.7%, while it has decreased across all regions from 19% to 7.1. Despite the regions becoming increasingly auto-dependent for work trips, more than twice as many TOD residents used transit for commuting compared to the regional average (16.7% versus 7.1%) in 2000. Transit commuting was more than three times higher in maturing heavy
TCRP Report 128 Effects of TOD on Housing, Parking, and Travel
16
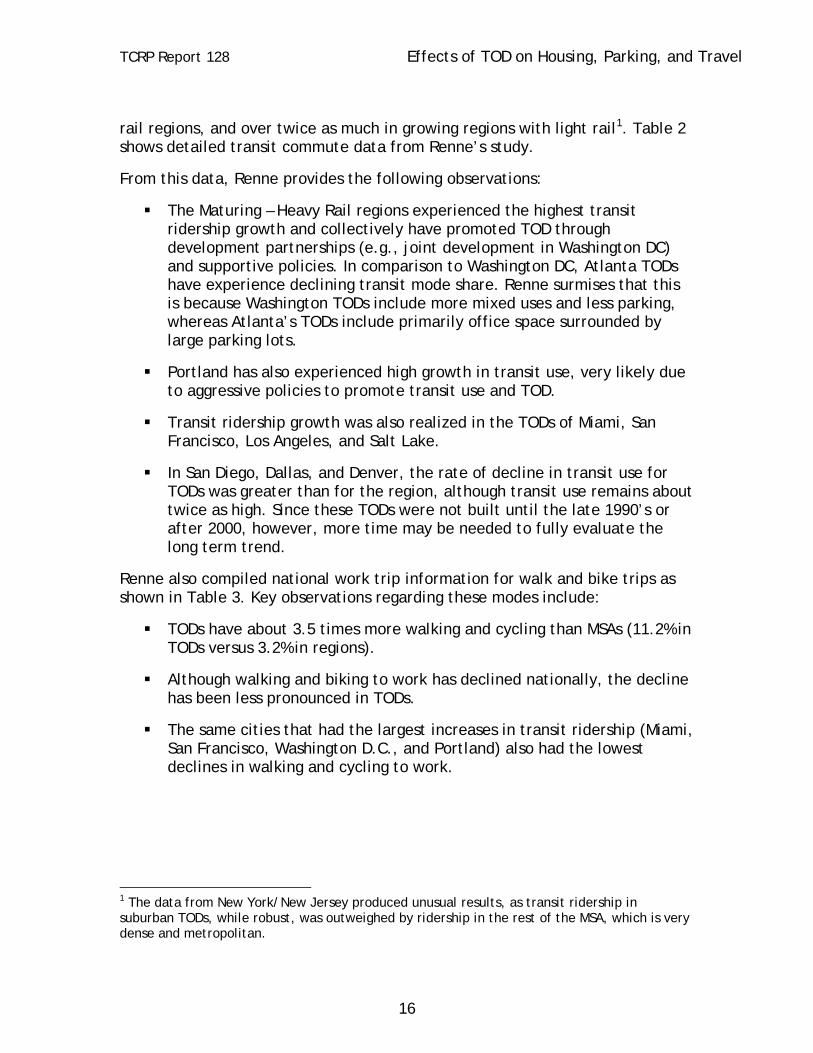
rail regions, and over twice as much in growing regions with light rail1. Table 2 shows detailed transit commute data from Renne’s study.
From this data, Renne provides the following observations:
The Maturing – Heavy Rail regions experienced the highest transit ridership growth and collectively have promoted TOD through development partnerships (e.g., joint development in Washington DC) and supportive policies. In comparison to Washington DC, Atlanta TODs have experience declining transit mode share. Renne surmises that this is because Washington TODs include more mixed uses and less parking, whereas Atlanta’s TODs include primarily office space surrounded by large parking lots.
Portland has also experienced high growth in transit use, very likely due to aggressive policies to promote transit use and TOD.
Transit ridership growth was also realized in the TODs of Miami, San Francisco, Los Angeles, and Salt Lake.
In San Diego, Dallas, and Denver, the rate of decline in transit use for TODs was greater than for the region, although transit use remains about twice as high. Since these TODs were not built until the late 1990’s or after 2000, however, more time may be needed to fully evaluate the long term trend.
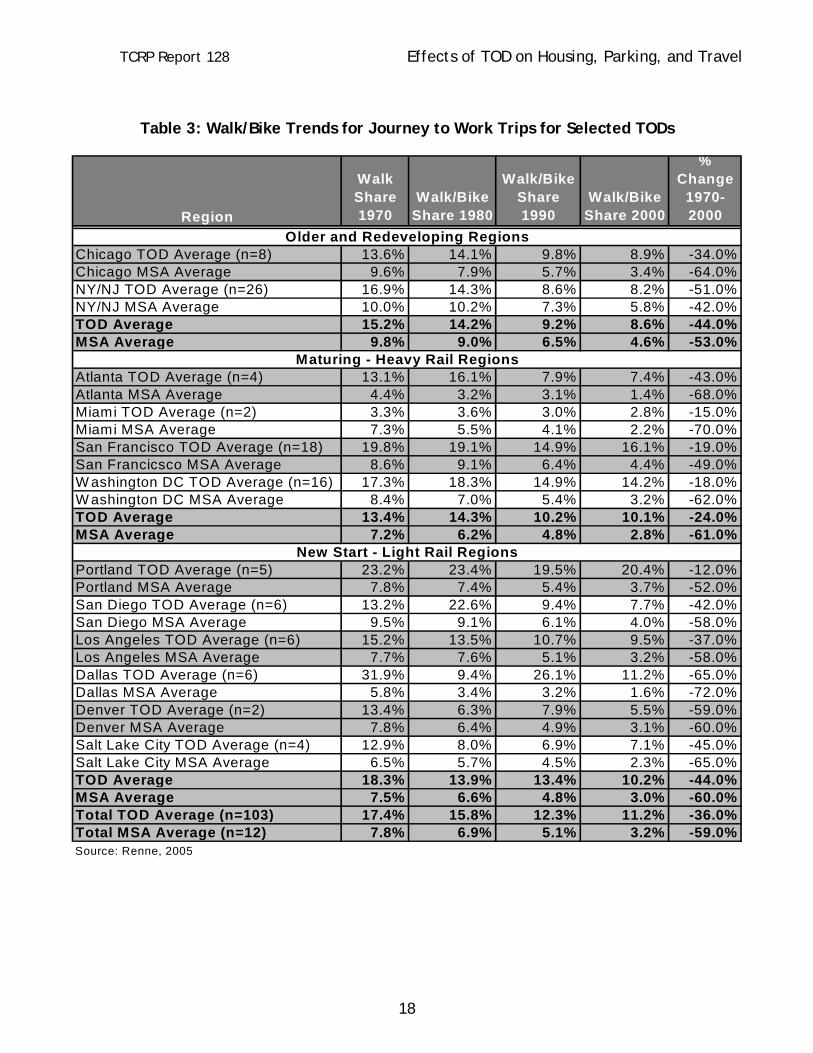
Renne also compiled national work trip information for walk and bike trips as shown in Table 3. Key observations regarding these modes include:
TODs have about 3.5 times more walking and cycling than MSAs (11.2% in TODs versus 3.2% in regions).
Although walking and biking to work has declined nationally, the decline has been less pronounced in TODs.
The same cities that had the largest increases in transit ridership (Miami, San Francisco, Washington D.C., and Portland) also had the lowest declines in walking and cycling to work.
1 The data from New York/New Jersey produced unusual results, as transit ridership in suburban TODs, while robust, was outweighed by ridership in the rest of the MSA, which is very dense and metropolitan.

TCRP Report 128 Effects of TOD on Housing, Parking, and Travel
17
Table 2: Transit Trends for Journey to Work Trips for Selected TODs
Region
TransitShare 1970
TransitShare 1980
TransitShare 1990
TransitShare 2000
% Change
1970-2000
Chicago TOD Average (n=8) 24.0% 21.7% 18.7% 16.7% -30.0%Chicago MSA Average 22.1% 16.6% 13.7% 11.5% -48.0%NY/NJ TOD Average (n=26) 15.7% 13.1% 13.6% 16.4% 4.0%NY/NJ MSA Average 35.5% 26.7% 25.4% 24.9% -30.0%TOD Average 19.8% 17.4% 16.1% 16.5% -17.0%MSA Average 28.8% 21.6% 19.5% 18.2% -37.0%
Atlanta TOD Average (n=4) 20.9% 22.5% 24.9% 19.3% -8.0%Atlanta MSA Average 9.2% 7.7% 4.6% 3.7% -60.0%Miami TOD Average (n=2) 0.5% 2.7% 5.4% 6.5% 1094.0%Miami MSA Average 7.1% 5.0% 4.4% 3.9% -45.0%San Francisco TOD Average (n=18) 17.8% 22.3% 20.1% 21.0% 18.0%San Francicsco MSA Average 11.6% 11.4% 9.6% 9.5% -18.0%Washington DC TOD Average (n=16) 19.0% 27.4% 32.5% 30.0% 58.0%Washington DC MSA Average 15.4% 13.1% 11.3% 9.4% -39.0%TOD Average 14.6% 18.8% 20.7% 19.2% 32.0%MSA Average 10.8% 9.3% 7.5% 6.6% -39.0%
Portland TOD Average (n=5) 9.2% 13.4% 11.8% 14.6% 58.0%Portland MSA Average 5.5% 7.6% 5.0% 5.7% 3.0%San Diego TOD Average (n=6) 8.3% 11.2% 6.5% 6.7% -19.0%San Diego MSA Average 3.7% 3.4% 3.5% 3.4% -7.0%Los Angeles TOD Average (n=6) 6.2% 11.5% 10.2% 8.4% 37.0%Los Angeles MSA Average 4.2% 5.2% 4.7% 4.7% 11.0%Dallas TOD Average (n=6) 14.5% 9.1% 9.2% 3.2% -78.0%Dallas MSA Average 5.2% 3.5% 2.3% 1.8% -66.0%Denver TOD Average (n=2) 9.4% 8.6% 8.4% 7.5% -20.0%Denver MSA Average 4.3% 6.0% 4.2% 4.3% 0.0%Salt Lake City TOD Average (n=4) 2.4% 5.8% 3.2% 5.0% 108.0%Salt Lake City MSA Average 2.2% 5.0% 3.1% 3.0% 36.0%TOD Average 8.3% 9.9% 8.2% 7.6% -9.0%MSA Average 4.2% 5.1% 3.8% 3.8% -9.0%Total TOD Average (n=103) 15.1% 17.0% 16.9% 16.7% 11.0%Total MSA Average (n=12) 19.0% 14.1% 12.0% 7.1% -63.0%Source: Renne, 2005
Older and Redeveloping Regions
Maturing - Heavy Rail Regions
New Start - Light Rail Regions
TCRP Report 128 Effects of TOD on Housing, Parking, and Travel
18
Table 3: Walk/Bike Trends for Journey to Work Trips for Selected TODs
Region
WalkShare 1970
Walk/BikeShare 1980
Walk/BikeShare 1990
Walk/BikeShare 2000
% Change
1970-2000
Chicago TOD Average (n=8) 13.6% 14.1% 9.8% 8.9% -34.0%Chicago MSA Average 9.6% 7.9% 5.7% 3.4% -64.0%NY/NJ TOD Average (n=26) 16.9% 14.3% 8.6% 8.2% -51.0%NY/NJ MSA Average 10.0% 10.2% 7.3% 5.8% -42.0%TOD Average 15.2% 14.2% 9.2% 8.6% -44.0%MSA Average 9.8% 9.0% 6.5% 4.6% -53.0%
Atlanta TOD Average (n=4) 13.1% 16.1% 7.9% 7.4% -43.0%Atlanta MSA Average 4.4% 3.2% 3.1% 1.4% -68.0%Miami TOD Average (n=2) 3.3% 3.6% 3.0% 2.8% -15.0%Miami MSA Average 7.3% 5.5% 4.1% 2.2% -70.0%San Francisco TOD Average (n=18) 19.8% 19.1% 14.9% 16.1% -19.0%San Francicsco MSA Average 8.6% 9.1% 6.4% 4.4% -49.0%W ashington DC TOD Average (n=16) 17.3% 18.3% 14.9% 14.2% -18.0%W ashington DC MSA Average 8.4% 7.0% 5.4% 3.2% -62.0%TOD Average 13.4% 14.3% 10.2% 10.1% -24.0%MSA Average 7.2% 6.2% 4.8% 2.8% -61.0%
Portland TOD Average (n=5) 23.2% 23.4% 19.5% 20.4% -12.0%Portland MSA Average 7.8% 7.4% 5.4% 3.7% -52.0%San Diego TOD Average (n=6) 13.2% 22.6% 9.4% 7.7% -42.0%San Diego MSA Average 9.5% 9.1% 6.1% 4.0% -58.0%Los Angeles TOD Average (n=6) 15.2% 13.5% 10.7% 9.5% -37.0%Los Angeles MSA Average 7.7% 7.6% 5.1% 3.2% -58.0%Dallas TOD Average (n=6) 31.9% 9.4% 26.1% 11.2% -65.0%Dallas MSA Average 5.8% 3.4% 3.2% 1.6% -72.0%Denver TOD Average (n=2) 13.4% 6.3% 7.9% 5.5% -59.0%Denver MSA Average 7.8% 6.4% 4.9% 3.1% -60.0%Salt Lake City TOD Average (n=4) 12.9% 8.0% 6.9% 7.1% -45.0%Salt Lake City MSA Average 6.5% 5.7% 4.5% 2.3% -65.0%TOD Average 18.3% 13.9% 13.4% 10.2% -44.0%MSA Average 7.5% 6.6% 4.8% 3.0% -60.0%Total TOD Average (n=103) 17.4% 15.8% 12.3% 11.2% -36.0%Total MSA Average (n=12) 7.8% 6.9% 5.1% 3.2% -59.0%Source: Renne, 2005
Older and Redeveloping Regions
Maturing - Heavy Rail Regions
New Start - Light Rail Regions

TCRP Report 128 Effects of TOD on Housing, Parking, and Travel
19
High transit commute modal shares among station-area residents are significantly a product of self-selection: those with a lifestyle preference to ride transit consciously move to neighborhoods well-served by transit and act upon their preferences by riding frequently. A recent study by Cervero and Duncan (2002) used nested logit analysis to predict transit ridership as a function of residential location choice in the San Francisco Bay Area. Around 40 percent of the rail commute choice was explained by residential location.
Understanding how residents and employees of TOD previously traveled is important in sorting out the relative importance of self-selection. If most TOD residents patronized transit prior to their move, then net ridership benefits are somewhat reduced. Two California research projects throw some light on this question. The 1992 study of ridership among those living near California rail stops examined how people got to work at their prior residence (Cervero 1994). For those whose job location did not change, surveys showed that 56% of station-area residents rode transit to work at the previous residence. Thus, TOD residency did not yield regional mobility benefits in the case of nearly half of the sample. However, impacts were not inconsequential. Among those who drove to work when they previously lived away from transit, 52% switched to transit commuting upon moving within ½ mile walking distance of a rail station.
Similar findings have been observed in Portland, Oregon. At the Center Commons, an urban neighborhood TOD, about 56% of survey respondents currently use an alternate mode of transportation (i.e., transit, bike, walk, carpool, transit) to get to work; about 46% use transit. Prior to moving into the TOD, about 44% used an alternate mode for work trips, and 31% used transit. In comparison, transit work trip mode share for the city of Portland was 12.3% according to the 2000 Census2. For non-work trips, 55% currently use an alternate mode of transportation, and 32% use transit. Previously, 42% used an alternate mode for non-work trips, and 20% used transit (Switzer, 2002).
At Orenco Station, a more affluent suburban neighborhood TOD, 18% of TOD commuters regularly use transit, 75% travel in single occupancy cars, and 2.7% carpool, bike, or walk (Podobnik, 2002). Sixty-nine percent of survey respondents indicated that they use transit more often than in their previous neighborhood, and 25% use transit at about the same level.
2 Almost 75% of Center Commons respondents had an annual household income of $25,000 or less. About 78% of work
trips on transit and 84% of non-work trips on transit are by residents that make $25,000 or less per year.
TCRP Report 128 Effects of TOD on Housing, Parking, and Travel
20
At The Merrick, an urban downtown TOD, 23% of residents regularly commute to work or school by transit, 44% commute in a private vehicle, and 16% walk (Dill, 2005). Overall in Portland, 12% commute by transit, 76% by private vehicle, and 5% walk. The mode split for all trips at The Merrick is: 18% transit, 53% personal vehicle, and 29% walk. Merrick residents also claim to drive less and use transit and walk more compared to where they used to live:
45% claim to drive a lot less now 23% claim to drive a little less now (total of 68% drive less now) 42% claim to use transit a lot more now 28% claim to use transit a little more now (total of 70% use transit more
now) 31% claim to walk a little more now 16% claim to walk a lot more now (total of 47% claim to walk more now)
The 2003 California survey of transit usage found a clear pattern of changes in travel behavior “before” and “after” moving to a TOD. Among all residents surveyed, around 12% shifted from some form of automobile travel to transit for their main trip purposes; however, around 10% shifted from taking transit to auto travel after moving to a TOD, and 56% drove as much as when they lived away from a TOD. The change to car commuting was thought to reflect the trend toward suburban employment in automobile-oriented settings.
The 2003 California study also provides longitudinal insights into ridership trends among TOD projects. Overall, no evidence was found that transit modal shares changed as TOD housing projects matured. In the case of several surveyed housing projects near BART’s Hayward and Union City stations, the shares of commutes by transit were in the 26%-28% range in both 1992 and 2003. In a few TODs where transit’s commute market shares increased over time, the results could reflect filtering effects: those who use rail transit may stay in place and maintain longer residences while those not using transit may be more likely to leave.
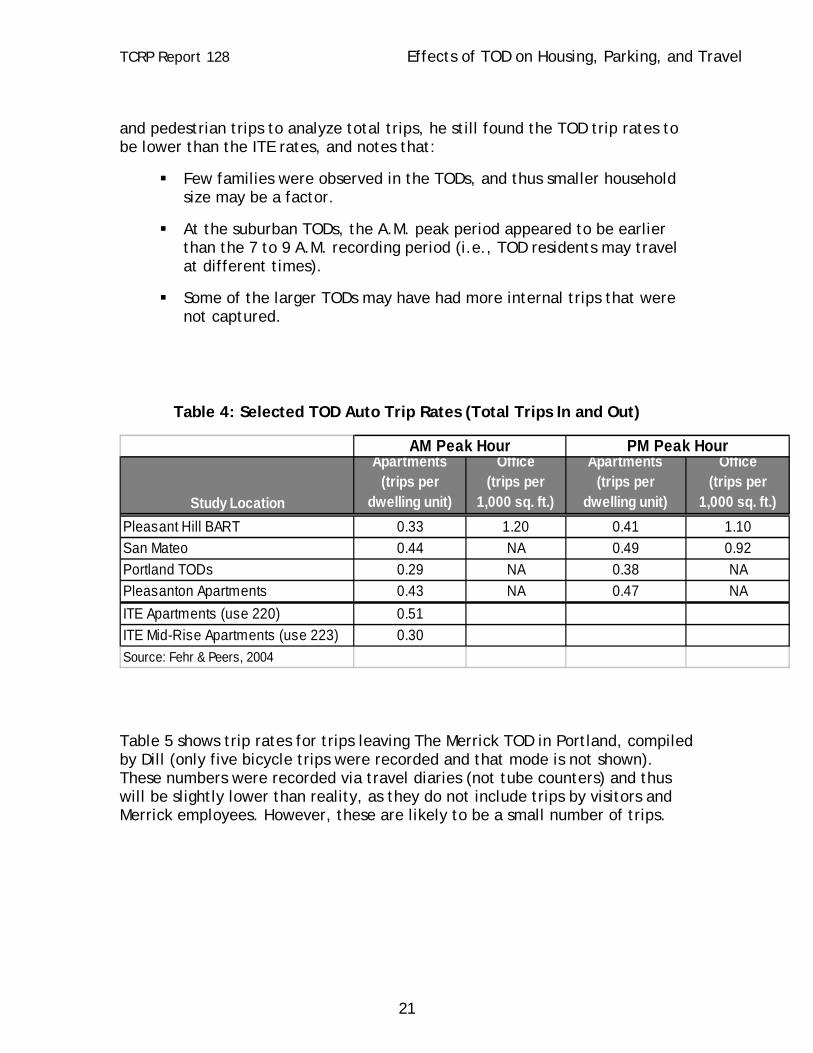
In comparison to mode share, not much information has been captured regarding TOD trip generation rates. Because many TODs have grid-based street networks, there are more project access points than in conventional suburban projects, which tends to increase the cost and complexity of trip generation studies (because more locations must be monitored). Lee (2004) reviewed and compiled TOD trip generation data from four locations, and this data is shown in Table 4. From the data, it is difficult to conclude how TOD trip rates compare to standard ITE trip rates, as the TOD rates generally fall between the two ITE apartment benchmarks. In Portland, Lapham (2001) found that the lower auto trip rates could only partially be explained by higher transit use; the TODs had transit mode shares of 16% in the morning peak period and 11% in the afternoon peak, compared to about 5% for the city. After including transit
TCRP Report 128 Effects of TOD on Housing, Parking, and Travel
21
and pedestrian trips to analyze total trips, he still found the TOD trip rates to be lower than the ITE rates, and notes that:
Few families were observed in the TODs, and thus smaller household size may be a factor.
At the suburban TODs, the A.M. peak period appeared to be earlier than the 7 to 9 A.M. recording period (i.e., TOD residents may travel at different times).
Some of the larger TODs may have had more internal trips that were not captured.
Table 4: Selected TOD Auto Trip Rates (Total Trips In and Out)
Study Location
Apartments(trips per
dwelling unit)
Office(trips per
1,000 sq. ft.)
Apartments(trips per
dwelling unit)
Office(trips per
1,000 sq. ft.)Pleasant Hill BART 0.33 1.20 0.41 1.10San Mateo 0.44 NA 0.49 0.92Portland TODs 0.29 NA 0.38 NAPleasanton Apartments 0.43 NA 0.47 NAITE Apartments (use 220) 0.51 ITE Mid-Rise Apartments (use 223) 0.30 Source: Fehr & Peers, 2004
AM Peak Hour PM Peak Hour
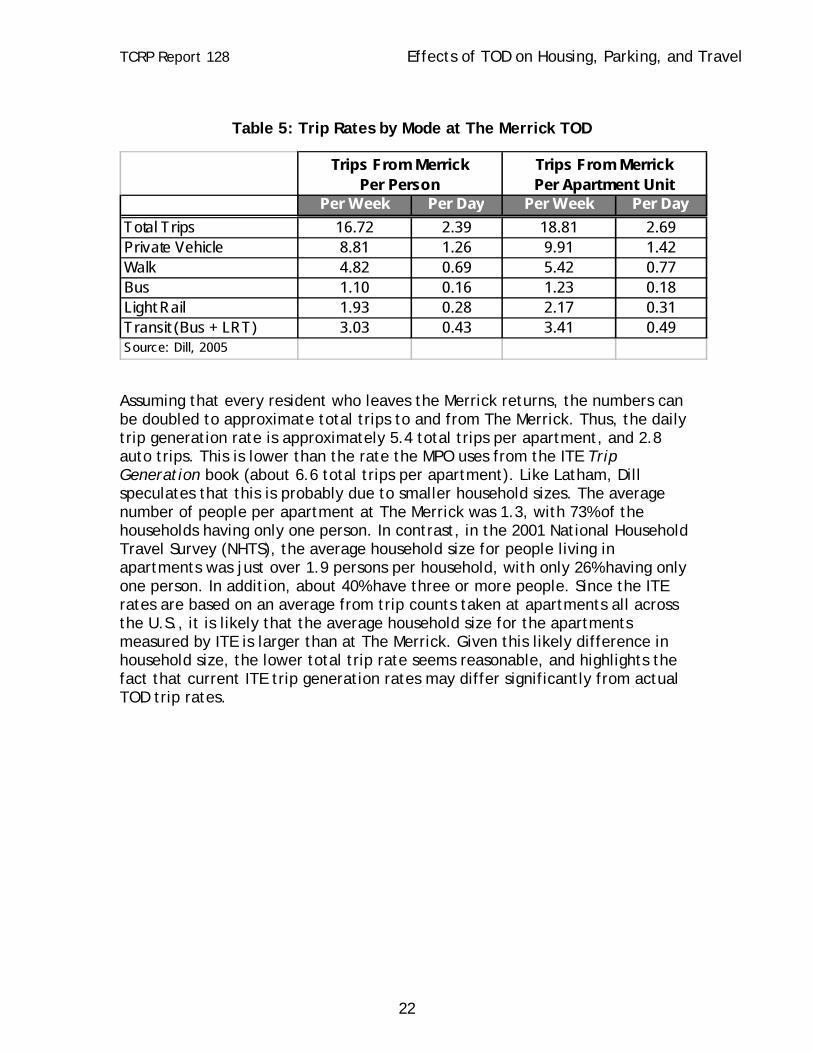
Table 5 shows trip rates for trips leaving The Merrick TOD in Portland, compiled by Dill (only five bicycle trips were recorded and that mode is not shown). These numbers were recorded via travel diaries (not tube counters) and thus will be slightly lower than reality, as they do not include trips by visitors and Merrick employees. However, these are likely to be a small number of trips.
TCRP Report 128 Effects of TOD on Housing, Parking, and Travel
22
Table 5: Trip Rates by Mode at The Merrick TOD
Per Week Per Day Per Week Per DayTotal Trips 16.72 2.39 18.81 2.69Private Vehicle 8.81 1.26 9.91 1.42Walk 4.82 0.69 5.42 0.77Bus 1.10 0.16 1.23 0.18Light Rail 1.93 0.28 2.17 0.31Transit (Bus + LRT) 3.03 0.43 3.41 0.49Source: Dill, 2005
Trips From Merrick Per Person
Trips From Merrick Per Apartment Unit
Assuming that every resident who leaves the Merrick returns, the numbers can be doubled to approximate total trips to and from The Merrick. Thus, the daily trip generation rate is approximately 5.4 total trips per apartment, and 2.8 auto trips. This is lower than the rate the MPO uses from the ITE Trip Generation book (about 6.6 total trips per apartment). Like Latham, Dill speculates that this is probably due to smaller household sizes. The average number of people per apartment at The Merrick was 1.3, with 73% of the households having only one person. In contrast, in the 2001 National Household Travel Survey (NHTS), the average household size for people living in apartments was just over 1.9 persons per household, with only 26% having only one person. In addition, about 40% have three or more people. Since the ITE rates are based on an average from trip counts taken at apartments all across the U.S., it is likely that the average household size for the apartments measured by ITE is larger than at The Merrick. Given this likely difference in household size, the lower total trip rate seems reasonable, and highlights the fact that current ITE trip generation rates may differ significantly from actual TOD trip rates.
TCRP Report 128 Effects of TOD on Housing, Parking, and Travel
23
Transit System and Land Use Influences
iii) What levels of transit connectivity to desired origins and destinations are required to promote transit ridership at TODs?
iv) What TOD land-use and design features (e.g., mixed land-use, traffic calming, bus bulbs, short blocks, street furniture) have had an effect on travel patterns, transit ridership, or the decision to locate in a TOD?
Key Conclusions
• Research shows that system extensiveness is positively correlated with transit ridership.
• Extensive transit networks are also most often found in cities with worse traffic congestion (i.e., slow auto trip times) and higher parking costs, and these 3 factors work together to increase TOD transit ridership.
• General consensus is that transit service headways of 10 minutes is ideal to support a transit lifestyle.
• There is no single, definitive threshold for connectivity, and measures such as “track miles” and “number of transit stations” are not the best predictors of ridership on their own. What matters is transit travel times relative to auto travel times. For example, an extensive but very slow transit system will likely attract few riders if highway congestion is not severe. Conversely, a single fast rail corridor adjacent to a highly congested auto corridor will likely attract high ridership.
• The systems that will generate the highest commute ridership will have a high percentage of regional jobs accessible by fast transit.
• For work trips, proximity to rail stations is a stronger influence on transit use than land use mix or quality of walking environment. Thus, the most effective strategy to increase TOD ridership is to increase development densities in close proximity to transit.
• Employment densities at trip ends have more influence on ridership than population densities at trip origins. It is critical to locate jobs near transit in order to attract households to TODs.
• Relative travel time (transit v. auto) is still more important than any land use factor (density, diversity of uses, design).
• Mixed uses in TODs allow the transit service to be used for a variety of trip purposes throughout the day and week, but as a travel benefit, this is not a primary consideration for prospective TOD residents. Employment access is a primary consideration.
• Mixed uses (e.g., local restaurants) and urban design treatments (e.g., pedestrian pathways) are important for their amenity and design value in attracting residents and visitors/customers. TOD residents highly value

TCRP Report 128 Effects of TOD on Housing, Parking, and Travel
24
“good” neighborhood design in addition to transit access to work. Urban design and the local land use mix may influence which TOD prospective residents choose to live in. Good design may also make a TOD a more desirable location to travel to.
Findings
There is no absolute dividing line or tipping point for transit connectivity that translates into high transit ridership. From a transit perspective, “connectivity” can relate to the number of origins and destinations that can be accessed, the speed of transit service, and/or the frequency of service connecting origins and destinations. Mode choice studies of TOD residents and office workers typically show that transit travel times and their comparison to private car travel times is the strongest predictor of transit ridership. In other words, travel time differentials are a critical factor, and these differentials can vary greatly depending on local circumstances.
Census research by Reconnecting America’s Center for Transit-Oriented Development (CTOD, 2004) provides a macro-level view of this dynamic. CTOD looked at 3,341 fixed guideway transit stations in 27 metropolitan regions. Transit zones were defined as the half-mile radius around the stations, and the 27 transit systems were categorized as small, medium, large, and extensive. Like Renne, CTOD found that commuters in transit zones were much more likely to use transit, and concludes that the size (i.e. extensiveness) and relative speed of the rail transit system is a significant determinant of whether TOD households use cars or transit.
Table 6: 2000 Transit Shares for Work Trios
AreaTransit Zones
MetroArea
Chicago 25% 11%Washington DC 30% 9%Memphis 6% 2%Cleveland 13% 4%Denver 12% 5%Charlotte 4% 1%Los Angeles 16% 5%Source: CTOD, 2004

TCRP Report 128 Effects of TOD on Housing, Parking, and Travel
25
Table 7: 2000 Percent Auto Commuters by Transit System Size
T r a n s i t
S y s t e m S i z e% A u t o
C o m m u t e r sS m a l l 7 2 %M e d i u m 7 7 %L a r g e 6 5 %E x t e n s i v e 4 9 %S o u r c e : C T O D , 2 0 0 4
That said, less is known about specific accessibility “thresholds” (e.g., number of accessible jobs, households) to support a given TOD. In TCRP Project H27, the research team noted that the highest recorded rail capture rates are in the Washington, D.C. area, and surmised that this is likely related to the fact that Metrorail has the most extensive network of any recent-generation system in the country. Lund, Cervero and Willson (2004) partly attribute higher transit mode shares for TOD residents in the Bay Area (e.g., Pleasant Hill, Alameda City) to a more extensive and mature rail system than other TOD places (e.g., Long Beach (LA), Mission Valley (San Diego)). In that research, the authors found a significant relationship between transit ridership and an accessibility measure that divides jobs reachable by transit in 30 minutes by jobs reachable by auto in 30 minutes. As one would expect, the more accessible a trip origin is to jobs by transit (relative to auto), the more likely the trip is to be made by transit3.
Transit travel times have a strong bearing on relative accessibilities (by transit vs. auto) and the decision to use transit. Cervero (2003) found that for non-transit users, auto travel was on average 42 minutes faster than transit (for all trip purposes), but for transit users, auto travel was only 23 minutes faster. This is consistent with many other studies that find that slow transit travel times retard ridership growth. Riders also care a lot about service reliability. Riders have been shown to be more sensitive to unpredictable delay than predictable waiting times (Pratt, Chapter 9). TODs should therefore be focused toward transit facilities that offer clear travel speed and reliability advantages (e.g., rail lines or bus corridors with priority design treatments).
Numerous studies have been completed under the broader topic of transit operations to understand how improved transit service (i.e., faster speeds, improved frequency, different configurations) affects transit ridership. These
3 While regional travel models cannot predict the number of jobs or households that are needed “to support” a particular TOD, they can predict reasonably well the ridership that will result from a TOD based on regional accessibility measures.
TCRP Report 128 Effects of TOD on Housing, Parking, and Travel
26
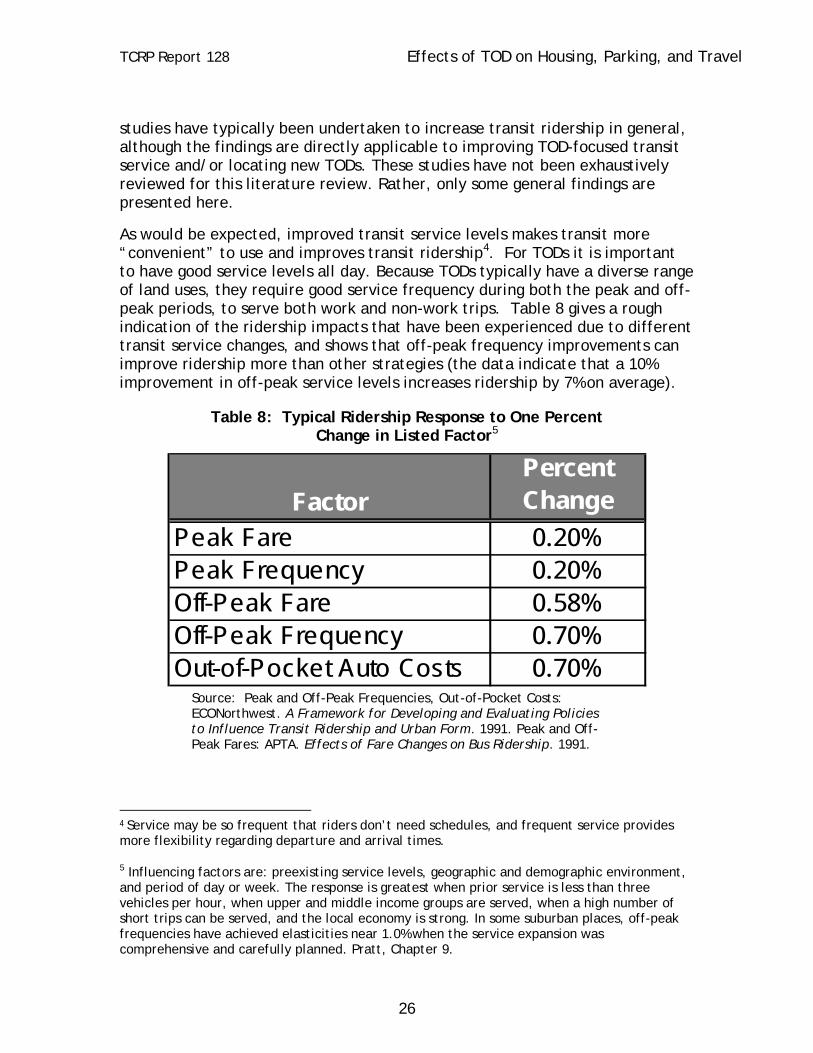
studies have typically been undertaken to increase transit ridership in general, although the findings are directly applicable to improving TOD-focused transit service and/or locating new TODs. These studies have not been exhaustively reviewed for this literature review. Rather, only some general findings are presented here.
As would be expected, improved transit service levels makes transit more “convenient” to use and improves transit ridership4. For TODs it is important to have good service levels all day. Because TODs typically have a diverse range of land uses, they require good service frequency during both the peak and off-peak periods, to serve both work and non-work trips. Table 8 gives a rough indication of the ridership impacts that have been experienced due to different transit service changes, and shows that off-peak frequency improvements can improve ridership more than other strategies (the data indicate that a 10% improvement in off-peak service levels increases ridership by 7% on average).
Table 8: Typical Ridership Response to One Percent Change in Listed Factor5
FactorPercent Change
Peak Fare 0.20%Peak Frequency 0.20%Off-Peak Fare 0.58%Off-Peak Frequency 0.70%Out-of-Pocket Auto Costs 0.70%
Source: Peak and Off-Peak Frequencies, Out-of-Pocket Costs: ECONorthwest. A Framework for Developing and Evaluating Policies to Influence Transit Ridership and Urban Form. 1991. Peak and Off-Peak Fares: APTA. Effects of Fare Changes on Bus Ridership. 1991.
4 Service may be so frequent that riders don’t need schedules, and frequent service provides more flexibility regarding departure and arrival times.
5 Influencing factors are: preexisting service levels, geographic and demographic environment, and period of day or week. The response is greatest when prior service is less than three vehicles per hour, when upper and middle income groups are served, when a high number of short trips can be served, and the local economy is strong. In some suburban places, off-peak frequencies have achieved elasticities near 1.0% when the service expansion was comprehensive and carefully planned. Pratt, Chapter 9.

TCRP Report 128 Effects of TOD on Housing, Parking, and Travel
27
In Portland, for instance, TriMet has pursued a strategy of improving off-peak bus service in its most dense and mixed use (i.e., TOD-like) corridors to expand its non-work trip market. From FY 99 to FY 03, TriMet improved service on 10 lines to “Frequent Service” (15 minutes or less all day, every day). On the improved lines, TriMet experienced a 9% increase in overall ridership, whereas ridership generally remained level for routes with only nominal increases in frequency. For the frequent lines, weekday ridership increased 8%, Saturday ridership increased 14%, and Sunday ridership increased 21%. Frequent bus service now accounts for 45% of weekly bus hours and 57% of weekly bus rides.
A generally accepted service level threshold for TODs is headways of 15 minutes or less during most of the day (Dittmar and Ohland, 2004). It makes little sense to build TOD in places that receive only hourly bus service, as service is not frequent enough to make transit use convenient. Table 9 describes in more detail generally recommended transit service levels for different types of TODs.

TCRP Report 128 Effects of TOD on Housing, Parking, and Travel
28
Table 9: TOD Types With Land Use and Transit Characteristics
Source: Dittmar, Hank and Ohland, Gloria. The New Transit Town: Best Practices in Transit-Oriented Development. Island Press. Washington, D.C. 2004
TCRP Report 128 Effects of TOD on Housing, Parking, and Travel
29
Other studies have focused more on the geographic aspects of transit service (e.g., system configuration) to see how ridership is impacted. Ewing (1995) and others have found that accessibility to regional activities has much more effect on household travel patterns than density or land use mix in the immediate area. Whereas accessibility to shopping or workplaces alone is relatively less important, good access to shopping, services, schools, work, and other households has a strong influence on travel patterns. While Ewing’s research focused on vehicular hours of travel, the findings for TOD are clear. Even if TODs show a propensity to generate higher than average transit ridership, they should not be built in remote locations with reduced accessibility (by all modes) to a wide range of activities.
Recent research on the relative performance of alternative transit configurations reveals that network orientation greatly affects the performance of rail and bus service. Based on data from the National Transit Database, Thompson and Matoff (2000) conclude that:
The best performing systems tend to be express bus-based systems oriented to strong CBD’s in rapidly growing regions, and multi-destinational, coordinated bus/light rail systems in growing regions. In multi-destinational networks, a rail line is a feeder to suburban buses, just as buses are feeders to the rail line6.
Whereas express bus systems are more oriented to peak period commuters traveling to CBD’s, multi-destinational rail/bus networks are oriented to a broader mix of passengers and destinations.
In comparison, traditional CBD-oriented bus transit systems in rapidly growing regions are in decline. In this case, individual routes, or collections of unrelated routes, cannot compete in a dispersed trip market as each route only serves origins and destinations on that single line.
The implications for TOD are that ridership is likely to be maximized when TOD is located in express bus corridors linked to a healthy CBD, or located near rail corridors with robust connecting bus service.
Land use variables that affect travel are frequently described as pertaining to density, diversity (i.e., mixed uses) and design – the “3 Ds”. Cervero and Kockelman (1997) found that the elasticities between various measure of the 3 Ds and travel demand are generally in the 0.06 to 0.18 range, expressed in absolute terms. They conclude that the elasticities between the land use factors and travel demand are modest to moderate, and that higher densities, diverse land uses, and pedestrian-friendly designs must co-exist if ridership
6 Multidestinational networks typically appear in two configurations – as a grid in high-density areas where frequent service on all routes can be supported, and as a timed transfer network in lower density places where frequent service on all routes can’t be justified.

TCRP Report 128 Effects of TOD on Housing, Parking, and Travel
30
benefits are to accrue. In its guidance for air quality conformance testing, FHWA notes that accessibility (i.e., the number of jobs accessible within a certain distance or time by mode) has a much stronger influence on travel than the 3 Ds, and that unless density is above 7-10 dwelling units per acre, it is unlikely that the other Ds will have any effect, even in combination7.
Density, or high shares of development within a 5-minute walk of a station, has generally been shown to be the strongest determinant of transit riding and walking among the land use variables. Cervero (2005) estimated the following density elasticities for transit ridership during the course of developing local ridership models for BART, Charlotte NC, and St. Louis MO.:
Charlotte Transitway TOD Scenarios: 0.192 (for persons per gross acre within a ½ mile of a station).
tBART Extension: 0.233 (for population and employment within a ½ mile of a station).
St. Louis MetroLink South Extension: 0.145 (for dwelling units per gross acre within ½ mile of a station).
While other studies have estimated much higher ridership impacts attributable to development density, these studies typically did not control for transit service levels, household demographics, and/or parking characteristics (e.g., prices), all of which exert strong influence on travel behavior. The TRCR H-1 study, for instance, estimated a high population density elasticity of 0.59, but failed to include a measure of transit service levels. After accounting for transit service levels and other factors, Cervero re-estimated the density elasticity to be 0.192 (and the elasticity for the number of morning inbound trains was 0.59).
Employment densities at destinations are more important than population densities at trip origins. Having an office or workplace near a transit stop is a strong motivator for many Americans to reside near transit, and in turn motivates people to buy into high transit-accessible neighborhoods. The end result is that having both ends of the trip within a convenient walk to and from a transit stop is key to high ridership levels.
Several studies have shown that good job accessibility via transit is among the strongest predictors of whether station-area residents will take transit to work. The 1992 Cervero study of commute choice among TOD residents of Bay Area TODs found that having a workplace near a rail station strongly encouraged rail commuting. Commuting to a job in BART-served downtown San Francisco or Oakland, for example, increased the likelihood of taking transit by 35% to 60%
7 See www.fhwa.dot/gov/environment/conformity/benefits/benefitsd.htm.

TCRP Report 128 Effects of TOD on Housing, Parking, and Travel
31
among residents of suburban East Bay TODs. In another study of California TODs, Cervero (1994) found that four variables – employment density, employment proximity to transit, commute behavior at the worker’s previous job, and occupation – explained 92% of the mode split variation. Original research conducted by the team under TCRP H-27 for the Rosslyn-Ballston corridor of Arlington County showed that nodes of concentrated development along transit corridors translates into higher transit commute shares. In Arlington County, every 100,000 square feet of office and retail floorspace added during the 1985 to 2002 period increased average daily Metrorail boardings and alightings by nearly 50.
Research shows that proximity to rail stations is a stronger determinant of transit usage for work trips than land-use mix or quality of walking environment (Cervero 1994). Thus, concentrating growth around rail stops will often yield high ridership dividends almost regardless of the urban design attributes of the immediate area. Still, all transit trips involve walking to some degree, thus the provision of safe, efficient, and comfortable-feeling walking corridors between transit stations and surrounding communities is an essential attribute of successful TODs. Mixed uses like housing, offices, retail shopping, and entertainment centers are important components of TOD since they produce all-day and all-week transit trips, thus exploiting available transit capacity.
Studies show that the urban design features of TOD tend to have a modest influence (relative to physical proximity) on ridership patterns, and suggest the presence of an “indifference zone” for longer-distance work trips. That is, once work commuters are within one-quarter mile of a rail station, factors like mixed land uses, traffic calming, pedestrian amenities, and even density seem to matter little. This is a consistent finding from studies on the ridership impacts of TOD, including the previously-cited research by Lund, Cervero, and Willson (2004). Strong determinants of whether those working in TODs take transit or not are the availability, price, and convenience of parking.
Lund, Cervero and Willson found that the only neighborhood-design variable that explained commuting transit ridership among TOD residents was street connectivity at the trip destination. Once controlling for the influences of factors like travel time and transit accessibility, no attributes of walking quality or land-use composition in the neighborhoods of TOD residents had a significant impact on transit mode choice. Some of the correlations with transit ridership found in that study are:
Pedestrian connectivity at trip destination: 0.37 Sidewalks along shortest walk route: 0.16 Street trees: 0.079 Street lights: 0.178 Street furniture (benches, bus shelters): 0.137
TCRP Report 128 Effects of TOD on Housing, Parking, and Travel
32
The researchers also found that these urban design variables exert a stronger influence for station area workers than station area residents. Furthermore, within each TOD, some will highly value pedestrian treatments, while others will not be deterred by their absence if transit is nearby. Thus, resident attitudes matter considerably. That said, “good” urban design treatments probably make living at higher densities more attractive.
Ewing and Cervero (2001) note that individual urban design features seldom prove significant. Where an individual feature appears to be significant, as did striped crosswalks in one study, the causality is almost certainly confounded with other variables. In this case, painting a few stripes across the road is not likely to influence travel choices, and the number of crosswalks must have captured other unmeasured features of the built environment.
Cervero (1994) concluded that for work trips: “Within a quarter to a half mile radius of a station, features of the built environment (ignoring issues of safety and urban blight) matter little – as long as places are near a station, the physical characteristics of the immediate neighborhood are inconsequential”. Another assessment underscores the importance of density and proximity to a station, however more value was attached to the land-use composition of a TOD: “transit use depends primarily on local densities and secondarily on the degree of land use mixing” (Ewing and Cervero 2001). For instance, using data on over 15,000 households from the 1985 American Housing Survey, Cervero (1996) found the presence of retail shops within 300 feet of one’s residence increased the probability of transit commuting, on average, by 3% – ostensibly because transit users could pick up convenience items when heading home after work.
Not all recent evidence diminishes the importance of urban design on the travel choices of TOD residents. The TCRP H-27 study found, for example, that the combination of high densities and small city block patterns significantly increased the share of station-area residents in the San Francisco Bay Area who took transit to work in 2000. In addition, auto-restraint measures like traffic calming and car-free streets, likely have some marginal influence on ridership to the degree walking becomes safer, easier, and more enjoyable.
The quality of walk and bus access to and from stations should also be considered. Although parking supplies and prices at the trip destination more strongly affect ridership among TOD residents than parking at the nearby rail station, the design and siting of station parking lots bears some influence on transit demand. Peripheral parking lots that do not sever pedestrian paths to nearby residential neighborhoods, for example, may induce transit usage, although this has not been tested empirically.
To conclude this section, transit travel times, which tend to be short when transit enjoys high connectivity, are far stronger predictors of rail usage for
TCRP Report 128 Effects of TOD on Housing, Parking, and Travel
33
TOD commuters than land-use, urban-design, and demand-management variables. Based on standardized model coefficients, the predictive power of transit travel-time variables tends to be two to three times greater than land-use and policy-related variables, and many travel models can predict transit ridership at TODs reasonably well based on modal travel time differences.
TOD land use features are more likely to affect travel behavior for shorter-distance, non-work trips. To the degree that housing, offices, shops, restaurants and other activities are intermingled, people are less likely to drive and more likely to walk to nearby destinations. Similarly, while urban design is likely to only have a marginal impact on “primary trips” (e.g., whether and how to access work or a shopping center), it is more likely to affect secondary trips from an activity center, which can be made by car, transit, or on foot.
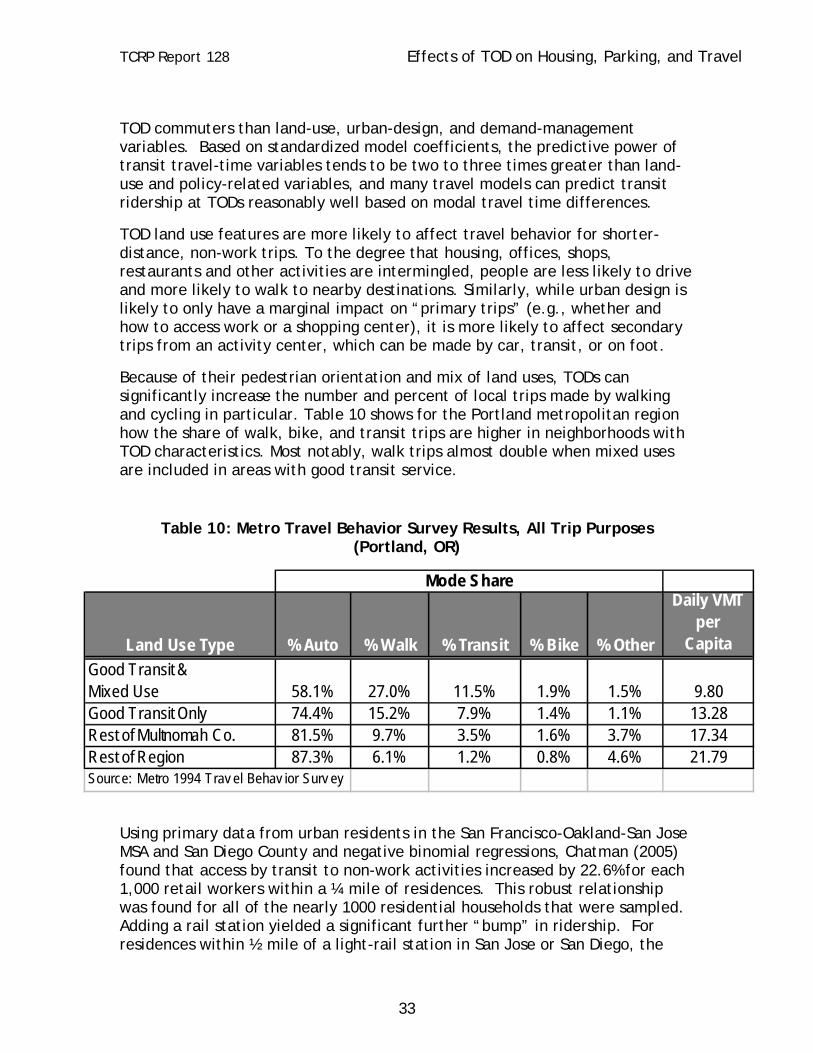
Because of their pedestrian orientation and mix of land uses, TODs can significantly increase the number and percent of local trips made by walking and cycling in particular. Table 10 shows for the Portland metropolitan region how the share of walk, bike, and transit trips are higher in neighborhoods with TOD characteristics. Most notably, walk trips almost double when mixed uses are included in areas with good transit service.
Table 10: Metro Travel Behavior Survey Results, All Trip Purposes (Portland, OR)
Land Use Type % Auto % Walk % Transit % Bike % Other
Daily VMT per
CapitaGood Transit &Mixed Use 58.1% 27.0% 11.5% 1.9% 1.5% 9.80Good Transit Only 74.4% 15.2% 7.9% 1.4% 1.1% 13.28Rest of Multnomah Co. 81.5% 9.7% 3.5% 1.6% 3.7% 17.34Rest of Region 87.3% 6.1% 1.2% 0.8% 4.6% 21.79Source: Metro 1994 Trav el Behav ior Surv ey
Mode Share
Using primary data from urban residents in the San Francisco-Oakland-San Jose MSA and San Diego County and negative binomial regressions, Chatman (2005) found that access by transit to non-work activities increased by 22.6% for each 1,000 retail workers within a ¼ mile of residences. This robust relationship was found for all of the nearly 1000 residential households that were sampled. Adding a rail station yielded a significant further “bump” in ridership. For residences within ½ mile of a light-rail station in San Jose or San Diego, the

TCRP Report 128 Effects of TOD on Housing, Parking, and Travel
34
number of non-work activities by transit rose an additional 6.5%. A far bigger bonus was found for high-performance regional rail services: those living within ½ of a BART heavy-rail or CalTrain commuter rail station, the number of non-worker activities via transit rose a resounding 284%. Besides retail density, pedestrian connectivity increased transit’s mode share of non-work trips. On the other hand, as walking quality increased, transit trips seemed to switch to travel by foot.
Chatman’s work strongly suggests that the quality of the walking environment significantly influences travel choices for non-work travel. Walk/bike travel to non-work activities was found to increase by 7.1% for every 1,000 retail workers within ½ mile radius of sampled residences. These results show that the combination of intensifying retail activities with good pedestrian facilities near regional rail stations can dramatically increase the use of transit for non-work purposes.
Using 2000 data for more than 15,000 households sampled in the San Francisco Bay Area, Gossen (2005) studied travel and socio-demographic attributes for seven distance/density categories based on households’ proximity to rails stations and ferry terminals. Regarding non-work travel, Gossen found that transit made up these shares of non-work trips for the following distance rings: 14.2% (up to ¼ mile); 11.5% (¼ to ½ mile); 6.1% ( ½ to 1 mile); 1.6% (> 1 mile – low-density suburbs). Gossen also found that VMT per capita increased with distance from rail/ferry stations in the following fashion: 19.9% (¼ mile) with); 24.1% (¼ to ½ mile); 29.4% ( ½ to 1 mile); 45.0% (> 1 mile – low-density suburbs).
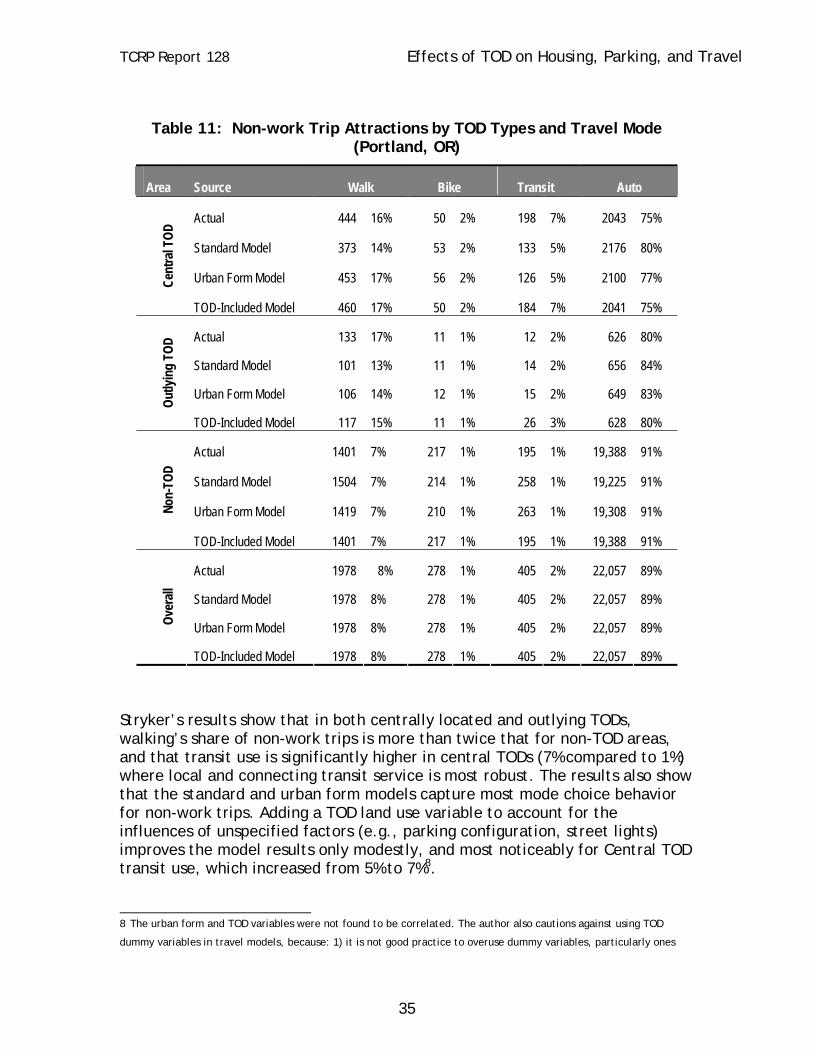
Stryker (2005) conducted research on Portland TODs to see if the presence of TOD design features are detectable using a travel demand model for non-work trips. In other words, does designating a travel analysis zone (TAZ) as including TOD add explanatory power to a base travel model for non-work trips?
In the Portland travel models, an urban design variable that captures the number of retail businesses, households, and street intersections within a 1/2 mile of each zone is currently used to estimate non-work trips. The variable is formulated such that places with a moderate mix of all three elements score higher than places with very high amounts of only one element.
In a test model, the urban design variable was retained, and TAZs that contain built TOD projects were given an additional code (the TODs were identified via a qualitative assessment by local TOD experts). Table 11 shows how inclusion of the TOD variable allows the model to more closely match observed mode share totals.
TCRP Report 128 Effects of TOD on Housing, Parking, and Travel
35
Table 11: Non-work Trip Attractions by TOD Types and Travel Mode (Portland, OR)
Area Source Walk Bike Transit Auto
Actual 444 16% 50 2% 198 7% 2043 75%
Standard Model 373 14% 53 2% 133 5% 2176 80%
Urban Form Model 453 17% 56 2% 126 5% 2100 77% Cent
ral T
OD
TOD-Included Model 460 17% 50 2% 184 7% 2041 75%
Actual 133 17% 11 1% 12 2% 626 80%
Standard Model 101 13% 11 1% 14 2% 656 84%
Urban Form Model 106 14% 12 1% 15 2% 649 83% Outly
ing
TOD
TOD-Included Model 117 15% 11 1% 26 3% 628 80%
Actual 1401 7% 217 1% 195 1% 19,388 91%
Standard Model 1504 7% 214 1% 258 1% 19,225 91%
Urban Form Model 1419 7% 210 1% 263 1% 19,308 91% Non-
TOD
TOD-Included Model 1401 7% 217 1% 195 1% 19,388 91%
Actual 1978 8% 278 1% 405 2% 22,057 89%
Standard Model 1978 8% 278 1% 405 2% 22,057 89%
Urban Form Model 1978 8% 278 1% 405 2% 22,057 89% Over
all
TOD-Included Model 1978 8% 278 1% 405 2% 22,057 89%
Stryker’s results show that in both centrally located and outlying TODs, walking’s share of non-work trips is more than twice that for non-TOD areas, and that transit use is significantly higher in central TODs (7% compared to 1%) where local and connecting transit service is most robust. The results also show that the standard and urban form models capture most mode choice behavior for non-work trips. Adding a TOD land use variable to account for the influences of unspecified factors (e.g., parking configuration, street lights) improves the model results only modestly, and most noticeably for Central TOD transit use, which increased from 5% to 7%8.
8 The urban form and TOD variables were not found to be correlated. The author also cautions against using TOD
dummy variables in travel models, because: 1) it is not good practice to overuse dummy variables, particularly ones

TCRP Report 128 Effects of TOD on Housing, Parking, and Travel
36
Mixed uses and urban design treatments can also reduce average trip distances. Evaluating shopping trips only, Handy (1993) analyzed the impacts of local accessibility on trip distance and frequency, where accessibility reflected convenience to nearby supermarkets, drug stores, and dry cleaners nearby in small centers or stand-alone locations. In this case, accessibility was measured as a function of retail, service, and other non-industrial jobs in nearby zones (attractiveness) and off-peak travel times (impedance). The study concluded that high levels of local access are associated with shorter shopping distances, although no relationship was found for trip frequency.
that may measure a continuous attribute (e.g., degrees of TOD-ness), and 2) using a TOD variable requires an analyst
to arbitrarily designate TODs in the base year and in future years, potentially introducing bias into the model.

TCRP Report 128 Effects of TOD on Housing, Parking, and Travel
37
TOD Ridership Strategies
iv) What motivates or impedes transit ridership in a TOD? v) What strategies have been effective in increasing transit ridership at
TODs? vi) What steps should transit agencies take in supporting TODs to
maximize transit ridership?
Key Conclusions
• Factors that most influence transit ridership are station proximity, transit quality and parking policies.
• Fast, frequent, and comfortable transit service will increase ridership. • High parking charges and/or constrained parking supply will also increase
ridership. • Free or low-cost parking is a major deterrent to transit ridership. • Successful strategies include: TOD transit pass programs, parking
reductions, and car-sharing programs • TOD transit programs will be similar to other transit programs. That said,
because TOD residents and households are by definition the nearest to transit, TODs should be among the first locations that transit agencies implement specialized programs.
• TOD (e.g., mixed uses, high densities, reduced parking) is still “illegal” around station areas in many cities and transit districts
• Steps that transit agencies are taking to promote TOD include: reconsidering replacement parking requirements at park and rides, advocating for zoning changes with TOD entitlements, land assembly, joint development, and educational efforts (e.g., producing TOD guidebooks).
Findings
The “travel fundamentals” of TOD transit ridership are similar to general transit ridership. Among the variables that are amenable to policy change, transit service levels and prices are the strongest predictors of ridership in a TOD. Next in importance tends to be parking supplies and charges, followed by demand-management measures like employer provision of free transit passes. Least influential tends to be land-use and urban design factors. Mixed land-use use and high-quality urban design, however, can be important factors in drawing tenants to station areas in the first place, thus indirectly their role in shaping travel behavior in TODs can be substantial. While the factors listed above – transit service levels and parking management – strongly influence transit ridership, service enhancements and parking programs have usually not been introduced explicitly for the purposes of increasing ridership at TODs.
TCRP Report 128 Effects of TOD on Housing, Parking, and Travel
38
In the transit planning literature, there is a large body of research on what strategies are the most effective in generating increased transit ridership. The 1995 TCRP study, “Transit Ridership Initiative,” identified five main transit strategies to increase ridership: service adjustments; fare and pricing adaptations; market and information activities; planning orientation (community and customer-based approached); and, service coordination, consolidation, and market segmentation. It is reasonable to expect that this family of conventional transit ridership strategies will also be effective in generating increased ridership at TODs (that study is not summarized here). Transit agencies interested in taking steps to maximize ridership at TODs would be well advised to start with these proven strategies. Among the factors that are within the direct control of transit agencies, the provision of frequent, reliable, and comfortable transit services will induce ridership among TOD residents and workers more than anything else. Past ridership models reveal that the quality of transit services (in terms of speed and accessibility) are significant predictors of transit mode choice among station-area residents9.
That said, transit agencies have also shown considerable creativity in pursuing a variety of TOD-specific strategies to increase ridership at TODs. Transportation Demand Management (TDM), targeted pass programs, addressing parking at a number of levels, car-sharing, modifying transit facility design, providing planning assistance and developing TOD design guidelines are some of the things being undertaken by transit agencies to maximize ridership in TODs.
One of the best times to affect travel decisions and to encourage transit use is when there is a change in home or job location. Thus new TOD development offers a good opportunity to implement transit pass programs to attract individuals to use transit, and in general encourage others to change their transportation habits. A survey of commuters who were offered ‘Eco Transit Passes’ through the Santa Clara Valley Transportation Authority (VTA) found that the number of people driving a vehicle by themselves declined from 76 to 60 percent after passes were given away. It also found that transit’s mode share increased from 11 to 27 percent, while parking demand declined roughly 19% (Shoup, 1999).
Portland’s TriMet initiated a TOD Pass Program in September 1998 at four TODs in Westside suburbs in conjunction with the startup of the Westside LRT project. Residents in these TODs were offered free transit passes. Among the key findings: in May 1999, 83% of Orenco Station respondents reported using transit, where only 30% of them used it prior to the Westside LRT opening.
9 To identify the most effective transit service strategies, one needs to know the key determinants of travel demand for a specific setting. One cannot easily generalize the findings from a few urban settings in California and the Washington, D.C. area to all parts of the country.

TCRP Report 128 Effects of TOD on Housing, Parking, and Travel
39
From September 1998 to May 1999, there was a 22% increase in the number of Orenco residents that use transit for commuting purposes.
To estimate the collective impacts of increased parking charges and a new transit pass program, Bianco (2000) conducted a study of the Lloyd District, a TOD employment center near downtown Portland, immediately following the installation of the on-street parking meters. Programs implemented in the Lloyd District included:
The new on-street parking meters
A new transit pass program (Passport)
Emergency Ride Home program
2 new express bus routes to the Lloyd District
Transfer facility improvements
Survey respondents were asked to note how their commute behavior changed one year after these programs were started. For all workers, SOV mode shared declined 7%. For Passport eligible workers, SOV use went down 19%; transit use increased 12%, and carpools increased also. The mode share impacts were immediate and large. Twenty-five percent of respondents indicated that their primary reason for change was for “lifestyle reasons”, 22% noted the parking charges, and 19% because of Passport (other reasons included new transit availability, change in car ownership, and other). Thirty-six percent of respondents listed Passport as their secondary reason for change.
Transit agencies have also tailored car-sharing strategies for TODs. Research described later in this review shows that car ownership rates at TODs are significantly lower than average. At the same time, the need to use a car for some trips remains. Some TODs such as Buckman Heights in Portland have utilized car-sharing as a means to reduce the need for parking in the TOD while providing the option to drive if needed. Car-sharing allows individuals to have the benefits of auto use for personal trips without the hassles and cost of car ownership, and reinforces transit-oriented lifestyles. Transit agencies have played an important role in advocating for and helping to set-up car sharing. Companies like Flexcar provide car sharing in communities such as Portland, Vancouver (WA), Seattle, Washington D.C., the San Francisco Bay area, Long Beach, and other Los Angeles areas (TriMet 1999).
Together with density (i.e., proximity to transit) and good transit service, a major driver of TOD ridership is the provision and management of parking. Market profiles of TOD residences (e.g., small households with few cars) suggest that parking-related strategies, like a relaxation of supply codes and

TCRP Report 128 Effects of TOD on Housing, Parking, and Travel
40
the unbundling of parking and housing costs, could yield long-term ridership dividends. Thus, many transit agencies and local governments desire to affect the amount and price of parking provided.
Numerous studies find that transit ridership increases when parking charges are implemented, and transit agencies and local governments try to affect these too. Mildner, Strathman and Bianco (1997) found that cities with interventionist parking policies, high parking prices and limited supply, frequent transit service, and a high probability that travelers pay to park, are the most likely to have high transit mode shares. Shifting from free to cost-recovery parking (prices that reflect the full cost of providing parking facilities) typically reduces automobile commuting by 10-30%, particularly if implemented with improved travel options and other TDM strategies10.
At The Merrick TOD, only 17% of workers commuted by private vehicle if required to pay for parking at school or work. In contrast, over 70% of those with free parking used a private vehicle. The most recent California study found that the likelihood of transit commuting rose by nearly 70% if station-area residents enjoyed flex-time privileges and had to pay market rates for parking, compared to the scenario of no flex-time and free parking. The 1993 California study found the biggest deterrent to transit riding among those living and working near transit to be the availability of abundant free parking. (Dill, 2005)
See http://www.vtpi.org/tdm/tdm26.htm. Some studies have focused on the impacts of reducing parking supplies, but parking supplies are generally limited where land use is intense and land costs are high. In these cases, it is common to see parking fees that correlate with land values, and the relationship between parking supply and transit demand is captive to the dominant role of parking pricing.

TCRP Report 128 Effects of TOD on Housing, Parking, and Travel
41
Restricted parking supplies at the workplace and employer financial assistance with transit costs also increased the odds of station-area workers opting for rail transit. Figure 1 from the study reveals the relationship. Based on the experiences of the “typical” California TOD office worker, the models showed: at 25 feeder buses per day, a workplace with 50% more parking spaces than workers, and no employer help with transit costs, just 9% of office workers near a California rail station will likely commute by transit. At the other extreme, for a worker leaving a station with 400 daily feeder buses and heading to a work site where the employer provides transit-pass assistance and offers just one parking space for every two workers, the likelihood he or she will commute by transit is 50%.
For transit agencies involved in the development of agency owned land, the policies and procedures they follow for encouraging TOD can have a major impact on the implementation of TOD and directly from that, TOD ridership. Park-and-ride lots are often viewed as land banking for TOD. Ohlone-Chynoweth Commons, located on the Guadalupe light rail transit line in San Jose, is an example of transforming part of a park-and-ride into a medium
0
0.1
0.2
0.3
0.4
0.5
0.6
0 25 50 75 100 125 150 175 200 225 250 275 300 325 350 375 400
Fe e de r Bus Fre que ncy a t Ne a re st S ta tion (buse s pe r da y)
Pro
babi
lity
Chos
e Tr
ansi
t
____ Employer help with transit costs
- - - - - - No employer help with transit costs
0.5 parking space/worker
1 parking space/worker
1.5 parking spaces/worker
0.5 parking space/worker 1 parking space/worker
1.5 parking spaces/worker
Figure 1. Sensitivity of Rail Commuting to Parking Prices< Availability of Flextime Work Schedules, and Travel Time Ratios via Highway verses Transit, Based on Modeling for Predicting the Likelihood of California Station Area Residents Commuting by Rail Transit in 2003. Source: H. Lund, R. Cervero, R. Willson, Travel Characteristics of Transit-Focused Development in California, Oakland, Bay Area Rapid Transit District and California Department of Transportation. 2004

TCRP Report 128 Effects of TOD on Housing, Parking, and Travel
42
density mixed-use TOD. The project’s housing, retail and community facilities were developed on an under-used light rail park-and-ride lot. For this project, Valley Transportation Authority (VTA) issued a request for proposal seeking a developer for the 7.3-acre site. The former 1,100-space park-and-ride now includes: 240 park-and-ride spaces, 195 units of affordable housing, 4,400 sq. feet of retail and a day care center (Parsons Brinckerhoff 2002).
One of the barriers to creating more TODs is that many transit agencies (WMATA in the Washington, D.C. region, the San Francisco Bay Area’s BART, MTA in Maryland and RTD in Denver, among others) have parking replacement policies that result in one-to-one replacement of park-and-ride spaces. In H-27 the team estimated that replacement parking strictures affect at least 1/3 of TOD settings. This has proven to be major obstacle to TOD implementation on transit agency owned parking lots. With structured parking costs running on average between $10,000 and $15,000 a space ($23,000 to $25,000 a space with special features like a ‘retail wrap’) the cost of replacement parking can have a debilitating affect on the financial viability of a proposed TOD and the financial return to the transit agency. For a theoretical 5-acre residential TOD project developed at 40 units per acre, the cost of replacement parking could add between $30,000 to nearly $80,000 to the cost of each unit, making TOD infeasible in many places.
Sometimes, addressing transit parking has more to do with parking location than the amount of parking. There is a growing interest in designing transit parking to encourage TOD. Portland’s TriMet and DART in Dallas have moved parking away from the platform at some stations to accommodate TOD. Newly planned systems such as Phase II of the Gold Line in Los Angeles, Sound Transit in Seattle and the Red Line in Baltimore are considering TOD early on in the location and design of stations. This balances the need for parking to generate ridership while preserving the opportunity to capture additional ridership from TODs within an interesting and attractive walk of the station.
Transit agencies have served as an educator, advocate and financial resource for local jurisdictions to advance the understanding of TOD, and facilitate the preparation and adoption of TOD plans and zoning. The presence of self-selection has clear implications for municipal land-use and zoning strategies. The desire of many households to live in a transit-accessible location argues for market-responsive planning and zoning. Introducing zoning and building codes that are consistent with the lifestyle preferences of TOD residents means individuals can more easily sort themselves into transit-served settings and act upon their travel preferences. Preferential strategies, like Location Efficient Mortgages (LEM), can also make it easier for more households to sort themselves into highly transit-accessible neighborhoods.
The role of transit agencies, in this regard, covers a seemingly ever expanding range of activities. MTA in Maryland has been investing $500,000 to $600,000

TCRP Report 128 Effects of TOD on Housing, Parking, and Travel
43
annually in TOD administration and planning to create more livable places and increase ridership. MTA in Los Angeles, Sound Transit in Seattle, the RT in Sacramento, Triangle Transit in North Carolina, and TriMet in Portland are part of the growing list of transit agencies which have passed transit agency funds through to local governments to plan for TOD as part of developing new rail systems (Arrington 2003).
BART has active planning partnerships underway at a dozen different stations with the objective of building stronger partnerships with local governments and to encourage ridership growth on its system. In an innovative twist on that theme, San Diego’s MTDB has a San Diego city planner assigned to work with MTDB’s planning staff as a liaison on TOD. NJ Transit, the nation’s largest state transportation system, provides TOD assistance to cities through the Transit-Friendly Communities (TFC) program and the Transit Village Initiative. The TFC program, started in 1996, allocates roughly $100,000 per community to hire pre-selected consulting teams to get cities “ready” for serious transit village consideration. Charlotte Area Transit (CATS), together with the City of Charlotte / Mecklenburg County, has developed a 25-year regional Transit/Land-Use Plan, a Joint Development Policy and Station Area Plans to guide growth along centers and corridors. Chicago’s commuter rail operator, Metra, has developed strategies, principles and approaches to residential development in station areas targeted at communities and real estate professionals. Finally, Parsons Brinckerhoff has identified nearly 100 transit agencies which have prepared TOD Design Guidelines as part of a strategy to grow ridership and encourage the implementation of more TODs.

TCRP Report 128 Effects of TOD on Housing, Parking, and Travel
44
TOD Resident/Tenant Characteristics
iii) What are the demographic profiles of TOD residents and employers? iv) What motivates residents or employers to locate in TODs? Examples
of motivators may include the quality of schools, access to jobs, housing affordability, presence of transit services, neighborhood services and amenities, and community perception.
Key Conclusions
• The majority of TOD residents along new transit systems are childless singles or couples.
• They are often younger working professionals, or older “empty-nesters”. There is a wide age spectrum.
• They may have low, medium or high incomes; this is driven by the design and price of the specific TOD housing, and TOD developers will target/be able to predict their market. More higher incomes are being served as the US continues to go through a robust construction phase of denser urban residential product.
• TOD households typically own fewer cars because they have smaller households, and because they may forgo “extra” cars due to transit’s proximity. TOD households are almost twice as likely to not own any car, and own almost half the number of cars of other households.
• The top 3 reasons households give for selecting a TOD are housing/neighborhood design, housing cost, and proximity to transit.
Findings
With an expanding inventory of built TODs to observe and learn from there is a growing body of evidence about who is attracted to work, live, shop and play in TODs. At the macro level, the larger demographic trends washing over America with the aging of the baby boomers and the growth of the Generation X’ers (24-34) are helping drive a growing demand for a more urban real estate product. New Urban News (January/February 2003) cites the following factors as helping to drive the trend: a doubling of demand for homes within an easy walk of stores, and an increase in buyers who prefer dense, compact homes. New Urban News quotes Dowell Meyer’s research indicating that this market segment is expected to account for 31% of 2000-2010 homeowner growth. In addition, the number of US households with children is projected to decline. In 1990 they constituted 33.6% of households; by 2010 they will drop to 29.5% of households. These forces complement and reinforce the growing demand for TOD.

TCRP Report 128 Effects of TOD on Housing, Parking, and Travel
45
Survey data and anecdotal case-study data offer strong insights into the demographic make-up of TOD residents. TODs often have large shares of childless couples, empty-nesters, generation X’ers, and foreign immigrants (some of whom come from places with a heritage of transit-oriented living). Table 12 shows the demographic characteristics of TODs that were studied in the H-27 research. This data is consistent with other data showing that TODs attract smaller, typically childless households.
Other research into who lives in TODs reinforces these findings. A recent study of Transit Villages in New Jersey (Renne 2003) reveals that they cater to a younger population with more racial and ethnic diversity, more immigrants, more singles, and lower income households. AvalonBay, an apartment developer which has emphasized projects close to transit in high cost of entry markets, has learned that the prime market for its developments consists of Generation X’ers, singles and couples with few children, as well as the over-65 market who want to sell the suburban home and move back to the city (AvalonBay 2003).
In Portland’s downtown Pearl District, where virtually all of the buildings are oriented towards transit, 6,400 units of new apartments and condominiums have been built in the past 10 years. According to school district demographers, only 25 school-age children live there, and less than 20 babies are expected each year (Gragg, 2005)11. Anecdotal reasons given for the lack of children include high housing costs (i.e. additional floor space for children is prohibitively expensive), a lack of outdoor play spaces and community center, and a lack of other children.
At The Merrick TOD in Portland, the survey respondents were evenly split between men and women. In addition, the respondents:
Were primarily single-person households (73%); average household size was 1.3
Ranged in age from 20 to 87 (median age is 33 years)
Largely have college degrees (68%) and work full time (75%)
Are childless; only one respondent indicated having a child under age 18
Have a wide range of household income levels, with 41% earning $50,000 or greater (Dill, 2005)
11 In response, the City of Portland recently adopted developer bonuses and potential tax abatements for “family-size” units and children’s play areas in new residential projects. In addition, the City will begin planning a neighborhood park for the northern end of the Pearl District with child play facilities.

TCRP Report 128 Effects of TOD on Housing, Parking, and Travel
46
Table 12: Snapshot of TOD Demographics from Selected TCRP-H27 Case Studies
Project Transit Mode
TOD Type Demographic Snapshot
The Pearl District, Portland, OR
Streetcar
Urban Downtown
High income, retiring seniors, childless urban professionals, limited lower income units by developer agreement
Mockingbird Station, Dallas, TX
Light Rail Urban Neighborhood
30-45 year old professionals who can afford to own but prefer to rent
The Cedars, Dallas, TX
Light Rail Urban Neighborhood
Lofts occupied by young professional couples and empty nesters
Center Commons, Portland, OR
Light Rail Urban Neighborhood
Mixed income by design, 75% earn less than $25,000, seniors housing
Village Green, Arlington Heights IL
Commuter Rail
Suburban Center
Empty nesters and childless professionals
“Triangle TOD,” La Grange, IL
Commuter Rail
Suburban Center
Over 50 empty nesters, under 30 professionals with no kids
Market Square Townhomes Elmhurst IL
Commuter Rail
Suburban Center
Long term local residents seeking smaller easy to maintain properties in town (likely empty nesters)
Addison Circle, Addison, TX
Bus Suburban Center
"Choice renters" singles, empty nesters, yuppies with no kids
The Round, Beaverton, OR
Light Rail Suburban Center
Sales targeted to be targeted to urban, "edgy" market (DINKS, retirees)
Gaslight Common, South Orange, NJ
Commuter Rail
Suburban Neighborhood
“Rail-based housing for childless households.” Just three school-age children live in the 200 apartments
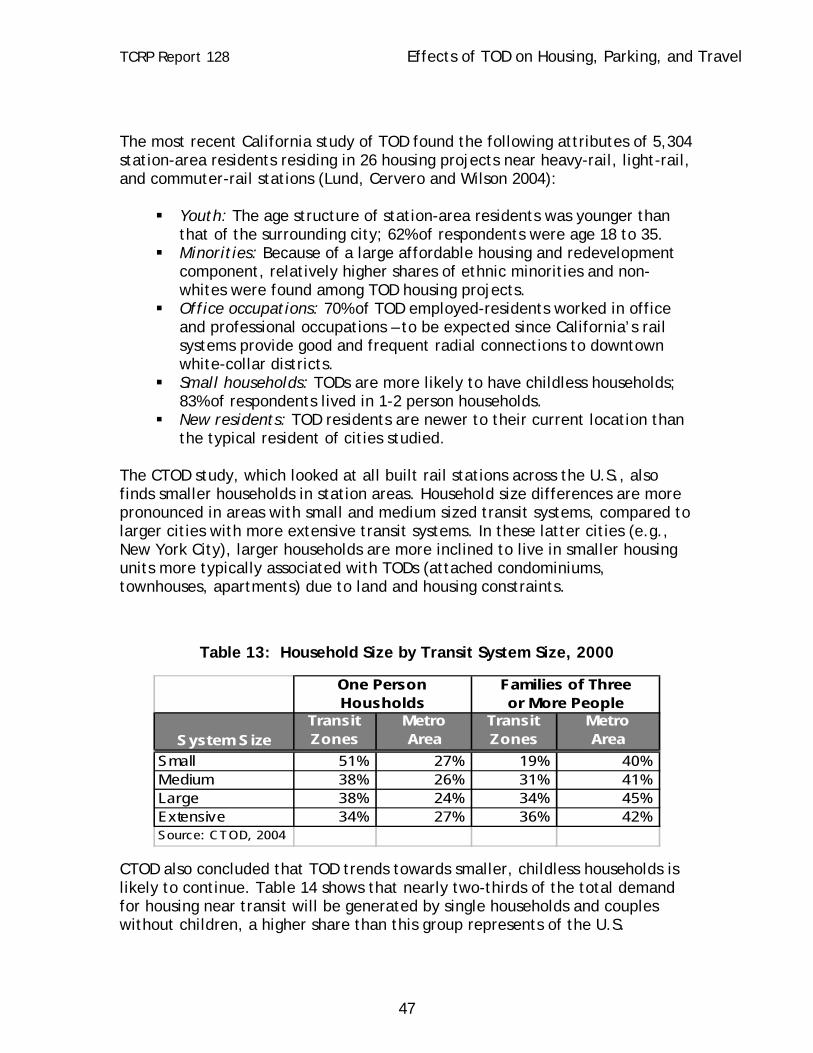
TCRP Report 128 Effects of TOD on Housing, Parking, and Travel
47
The most recent California study of TOD found the following attributes of 5,304 station-area residents residing in 26 housing projects near heavy-rail, light-rail, and commuter-rail stations (Lund, Cervero and Wilson 2004):
Youth: The age structure of station-area residents was younger than that of the surrounding city; 62% of respondents were age 18 to 35.
Minorities: Because of a large affordable housing and redevelopment component, relatively higher shares of ethnic minorities and non-whites were found among TOD housing projects.
Office occupations: 70% of TOD employed-residents worked in office and professional occupations – to be expected since California’s rail systems provide good and frequent radial connections to downtown white-collar districts.
Small households: TODs are more likely to have childless households; 83% of respondents lived in 1-2 person households.
New residents: TOD residents are newer to their current location than the typical resident of cities studied.
The CTOD study, which looked at all built rail stations across the U.S., also finds smaller households in station areas. Household size differences are more pronounced in areas with small and medium sized transit systems, compared to larger cities with more extensive transit systems. In these latter cities (e.g., New York City), larger households are more inclined to live in smaller housing units more typically associated with TODs (attached condominiums, townhouses, apartments) due to land and housing constraints.
Table 13: Household Size by Transit System Size, 2000
System SizeTransit Zones
MetroArea
Transit Zones
MetroArea
Small 51% 27% 19% 40%Medium 38% 26% 31% 41%Large 38% 24% 34% 45%Extensive 34% 27% 36% 42%Source: CTOD, 2004
One Person Housholds
Families of Threeor More People
CTOD also concluded that TOD trends towards smaller, childless households is likely to continue. Table 14 shows that nearly two-thirds of the total demand for housing near transit will be generated by single households and couples without children, a higher share than this group represents of the U.S.
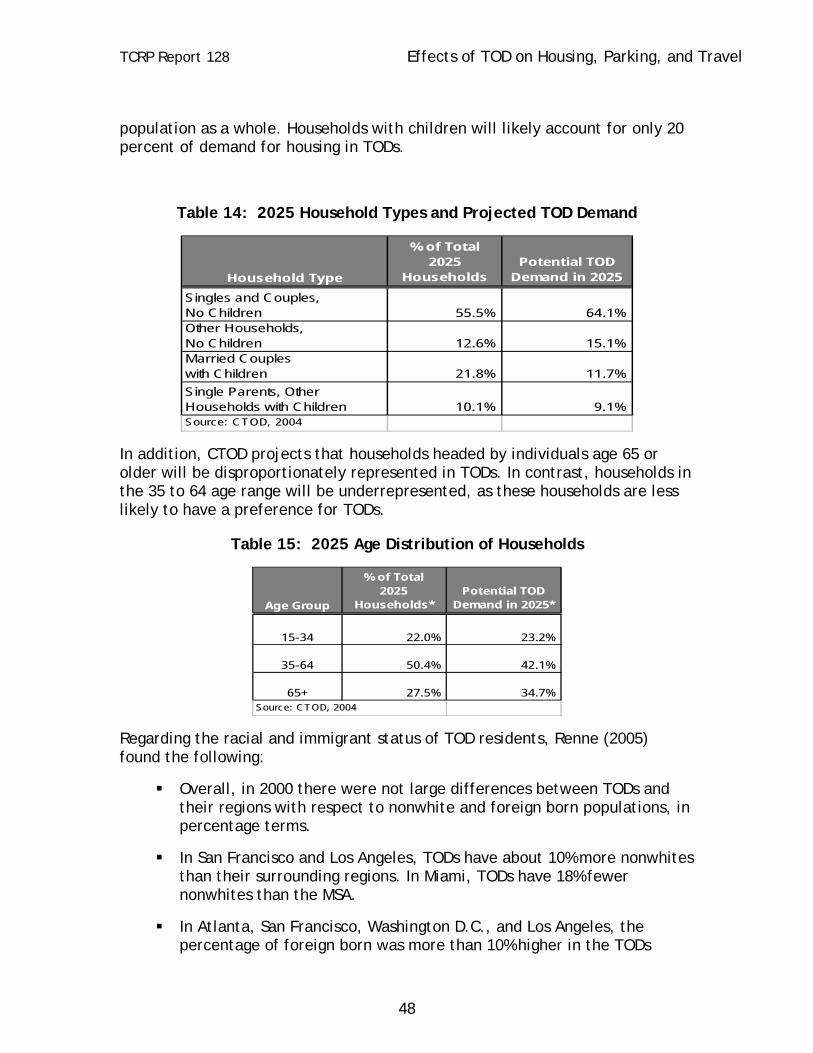
TCRP Report 128 Effects of TOD on Housing, Parking, and Travel
48
population as a whole. Households with children will likely account for only 20 percent of demand for housing in TODs.
Table 14: 2025 Household Types and Projected TOD Demand
Household Type
% of Total 2025
HouseholdsPotential TOD
Demand in 2025Singles and Couples,No Children 55.5% 64.1%Other Households,No Children 12.6% 15.1%Married Coupleswith Children 21.8% 11.7%Single Parents, OtherHouseholds with Children 10.1% 9.1%Source: CTOD, 2004
In addition, CTOD projects that households headed by individuals age 65 or older will be disproportionately represented in TODs. In contrast, households in the 35 to 64 age range will be underrepresented, as these households are less likely to have a preference for TODs.
Table 15: 2025 Age Distribution of Households
Age Group
% of Total 2025
Households*Potential TOD
Demand in 2025*
15-34 22.0% 23.2%
35-64 50.4% 42.1%
65+ 27.5% 34.7%Source: CTOD, 2004
Regarding the racial and immigrant status of TOD residents, Renne (2005) found the following:
Overall, in 2000 there were not large differences between TODs and their regions with respect to nonwhite and foreign born populations, in percentage terms.
In San Francisco and Los Angeles, TODs have about 10% more nonwhites than their surrounding regions. In Miami, TODs have 18% fewer nonwhites than the MSA.
In Atlanta, San Francisco, Washington D.C., and Los Angeles, the percentage of foreign born was more than 10% higher in the TODs
TCRP Report 128 Effects of TOD on Housing, Parking, and Travel
49
versus the region. In Miami and Denver, the percentage of foreign born population is slightly higher in the region than the TODs.
Generalizing about TOD income levels is more difficult than drawing conclusions about household size and lifestyle types. Apartment housing in older TODs was often built to serve lower income, transit dependent households, and some TOD projects are still built today to attract these households. Examples of these projects are the Center Commons, Ohlone-Chynoweth Commons, and Fruitvale Transit Village, where public sector participation and funding were used to construct new, affordable TOD housing that the market would otherwise not provide.
As TOD has become more consciously used by policy makers to shape development and increase transit ridership, however, the pool of prospective tenants has been expanded to include condo-living higher income groups that enjoy urban amenities (though they may live in suburban TODs). Thus, today’s TODs show a broad income range that reflects local land and construction costs, specialized developer niches, and local government policies (e.g., subsidies) to proactively build housing for targeted income levels.
In the Portland region, for instance, downtown Pearl District condominiums sell for over $200 per square foot and are the most expensive housing units in the region. Orenco Station is an affluent suburban TOD where median monthly incomes range from $5,000 to $6,000. At Center Commons, however, about 75% of TOD residents have annual incomes below $25,000 (this was a goal of the project). TOD income disparities like this exist throughout Portland and other regions.
At the national level, CTOD found that the median incomes of households in transit zones tend to be lower than those of households in larger metropolitan regions. For households with incomes between $10,000 and $60,000, the percent of households living in the region as a whole and in transit zones is similar. However, there are fewer households with incomes between $60,000 and $100,000 in transit zones than in the metro regions. In Houston, Tampa and Pittsburgh, transit zone median incomes are slightly higher than regional median incomes.
Renne (2005) found higher than average TOD incomes in Chicago, Atlanta, Miami, Washington D.C., and Dallas, and suggests that these cities are building more expensive and upscale TODs. Renne found that TOD zone incomes were substantially lower than regional averages in San Francisco and Los Angeles, and that these were also the only regions to have both significantly more nonwhite and foreign born residents than the region.
Research by Gossen (2005) suggests that, in urban settings, TOD residents generally have higher incomes than other households. The higher housing price

TCRP Report 128 Effects of TOD on Housing, Parking, and Travel
50
premiums for TOD living could account for this. In the San Francisco Bay Area, Gossen found average incomes were higher within ¼ mile of rail station than anywhere else in urban districts; only those living in suburban areas averaged higher incomes than TOD residents. The highest concentration of low-income households was within ½ to one mile of rail stations.
Regarding auto ownership, TOD residents tend to own fewer cars, and may be inclined to reduce car ownership upon moving into a TOD. Switzer (2002) found that at the Center Commons TOD, 30% of respondents owned fewer cars than they did at their previous residence, and that 37% of respondents did not own any car.
Table 16: Auto Ownership at Center Commons TOD
Previously Currently ChangeNo Car 21 36 42%One Car 60 54 -10%Two Cars 11 4 -64%Three Cars 3 2 -33%Five Cars 1 0 -100%Source: Switzer, 200
At The Merrick TOD, only 8% of residents have no vehicle available, and 73% of households said moving to this place had no impact on the number of vehicles owned. Seventeen percent of households, however, said that they got rid of a vehicle because of the characteristics of the neighborhood. (Dill, 2005)
Table 17: Auto Ownership at The Merrick TOD
% of
HouseholdsNo Car 8%One Car 75%Two Cars 14%Three Cars 3%Source: Dill, 2005
In her recent study of Bay Area TODs in 2000, Gossen (2005) found, consistent with other findings in the literature, that car ownership levels systematically fell with distance from a station. The average vehicles per person were: 0.5 (< ¼ mile); 0.54 (¼ to ½ mile); 0.61 ( ½ to 1 mile); 0.75 (> 1 mile – low-density

TCRP Report 128 Effects of TOD on Housing, Parking, and Travel
51
suburbs). In fact, 70% of zero-vehicle households live within one mile of a Bay Area rail or ferry station.
According to the 2000 Census, more than 12% of Arlington County households are without a vehicle, the highest rate in the region outside the District of Columbia. The proportion of carless households is even higher in Arlington County’s increasingly urban Metro corridors – approaching 20%. In several smaller communities along the Metro system across the Potomac River in Maryland - such as Takoma Park and Silver Spring, to cite two examples – there is also a high proportion of carless households: 16.2% in Takoma Park and 15.5% in Silver Spring. But in the surrounding suburbs, households without a car are a rarity. In Fairfax County, 4% are without cars. In Prince William only 3.5% are without cars. Arlington's healthy proportion of households without cars is fueled in part by the number of singles who live in the county. According to the 2000 Census 40% of households are made up of singles (Dittmar and Ohland, 2004).
In his analysis of 2000 census data, Renne (2005) found that:
TOD households own an average of 0.9 cars compared to 1.6 cars for comparable households not living in TODs.
TOD households are almost twice as likely to not own a car (18.5% versus 10.7%).
While about 66% of non-TOD households own 2 or more cars, only about 40% of TOD households owns as many cars.
In TODs, about 63% of households own fewer than two cars, compared to 45% for other households.
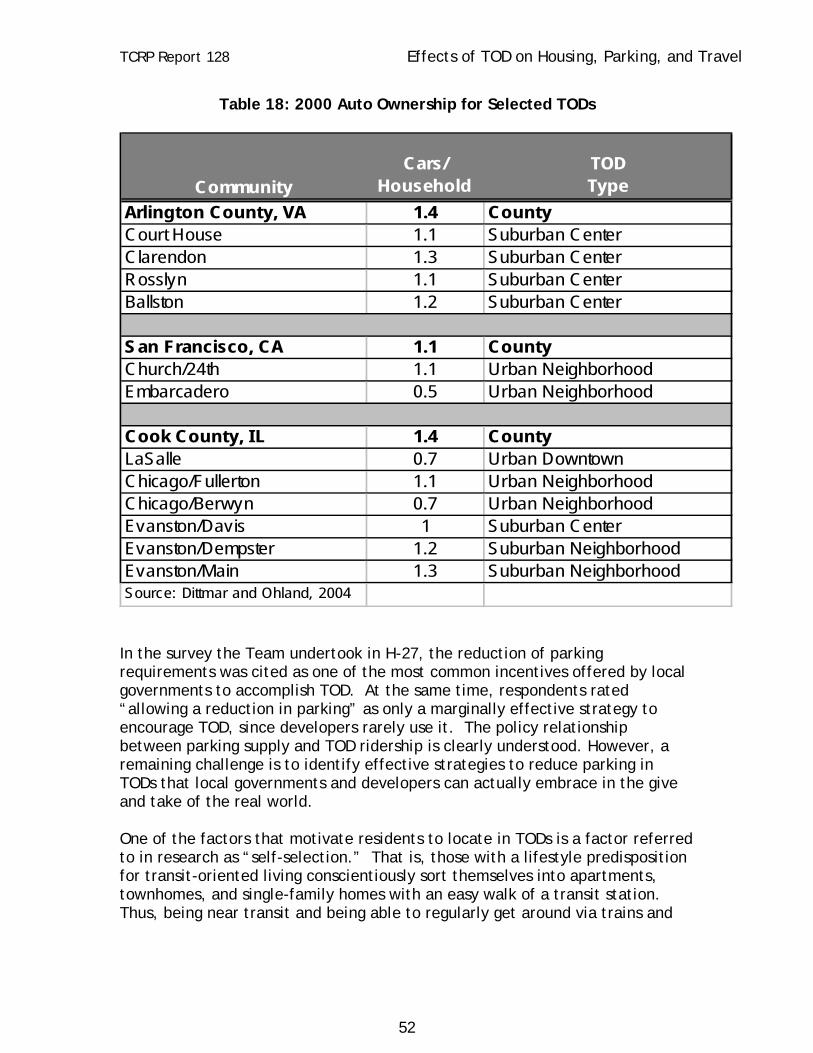
TCRP Report 128 Effects of TOD on Housing, Parking, and Travel
52
Table 18: 2000 Auto Ownership for Selected TODs
CommunityCars/
HouseholdTODType
Arlington County, VA 1.4 CountyCourt House 1.1 Suburban CenterClarendon 1.3 Suburban CenterRosslyn 1.1 Suburban CenterBallston 1.2 Suburban Center
San Francisco, CA 1.1 CountyChurch/24th 1.1 Urban NeighborhoodEmbarcadero 0.5 Urban Neighborhood
Cook County, IL 1.4 CountyLaSalle 0.7 Urban DowntownChicago/Fullerton 1.1 Urban NeighborhoodChicago/Berwyn 0.7 Urban NeighborhoodEvanston/Davis 1 Suburban CenterEvanston/Dempster 1.2 Suburban NeighborhoodEvanston/Main 1.3 Suburban NeighborhoodSource: Dittmar and Ohland, 2004
In the survey the Team undertook in H-27, the reduction of parking requirements was cited as one of the most common incentives offered by local governments to accomplish TOD. At the same time, respondents rated “allowing a reduction in parking” as only a marginally effective strategy to encourage TOD, since developers rarely use it. The policy relationship between parking supply and TOD ridership is clearly understood. However, a remaining challenge is to identify effective strategies to reduce parking in TODs that local governments and developers can actually embrace in the give and take of the real world.
One of the factors that motivate residents to locate in TODs is a factor referred to in research as “self-selection.” That is, those with a lifestyle predisposition for transit-oriented living conscientiously sort themselves into apartments, townhomes, and single-family homes with an easy walk of a transit station. Thus, being near transit and being able to regularly get around via trains and
TCRP Report 128 Effects of TOD on Housing, Parking, and Travel
53
buses is important in residential location choice. High ridership rates in TODs are partly explained as a manifestation of this lifestyle choice.
In the Los Angeles Family and Neighborhood Survey administered by RAND (Sastry et al. 2000), residents were asked an open-ended question about factors they weighed in choosing a neighborhood. Twenty-one percent cited transit access, more than highway access (11%). When asked: “For your personal commute to school or work, which transportation modes were important considerations in deciding where to live”, 14% cited only transit, 9% citied “transit and walk/bike”, and 9% cited some other combination involving transit – that is, around a third located with reference to transit commuting. Auto access alone was cited just by just 12%.
In his 2005 doctoral dissertation based on a survey of residents in the San Francisco Bay Area and San Diego County, Chatman found 74.4% of those living within ½ mile of sampled California rail station sought transit access when making a residential location choice. Furthermore, those seeking transit access to shops or services live an average of 1.8 miles closer to a rail stop. However, proximity to transit for non-work activities is likely a minor factor in residential location choices. Ben-Akiva and Bowman simultaneously modeled residential location choice and activity/travel schedules using a nested logit method, finding little relationship between non-work accessibility and the choice of residential neighborhood. Weighing the collective evidence, Chatman (2005, p. 150) concluded that “auto-oriented self selection does not appear to be particularly important in out-of-home non-work activity participation, but transit self-selection does play a limited role.”
The most recent California study (Lund, Cervero and Willson 2004) found that proximity to transit was ranked third among factors influencing households to move into TODs, behind the cost and quality of housing. The higher density housing found in TODs tends to keep housing prices more affordable. While land prices are higher per square foot, this is more than offset by the smaller total area of dwelling units that are purchased or leased. The California survey found that proximity to transit was most important among residents who had lived in the TOD the longest. This suggests those who self-select into rail-served neighborhoods tend to stay in place. The higher premium they place on proximity to transit is reflected not only in survey responses but also ridership statistics. Because most TOD residents have no children, quality of schools was not a major factor in moving into TOD neighborhoods – fewer than one of 20 surveyed respondents identified this as a “top three” factor in influencing their residential location choice.
In his survey of Center Commons residents, Switzer (2002) found that the most common reasons given for moving into the project were: new product/appealing design (20%), proximity to transit (17%), price (16% - the project includes a significant affordable housing component), and general location (15%).
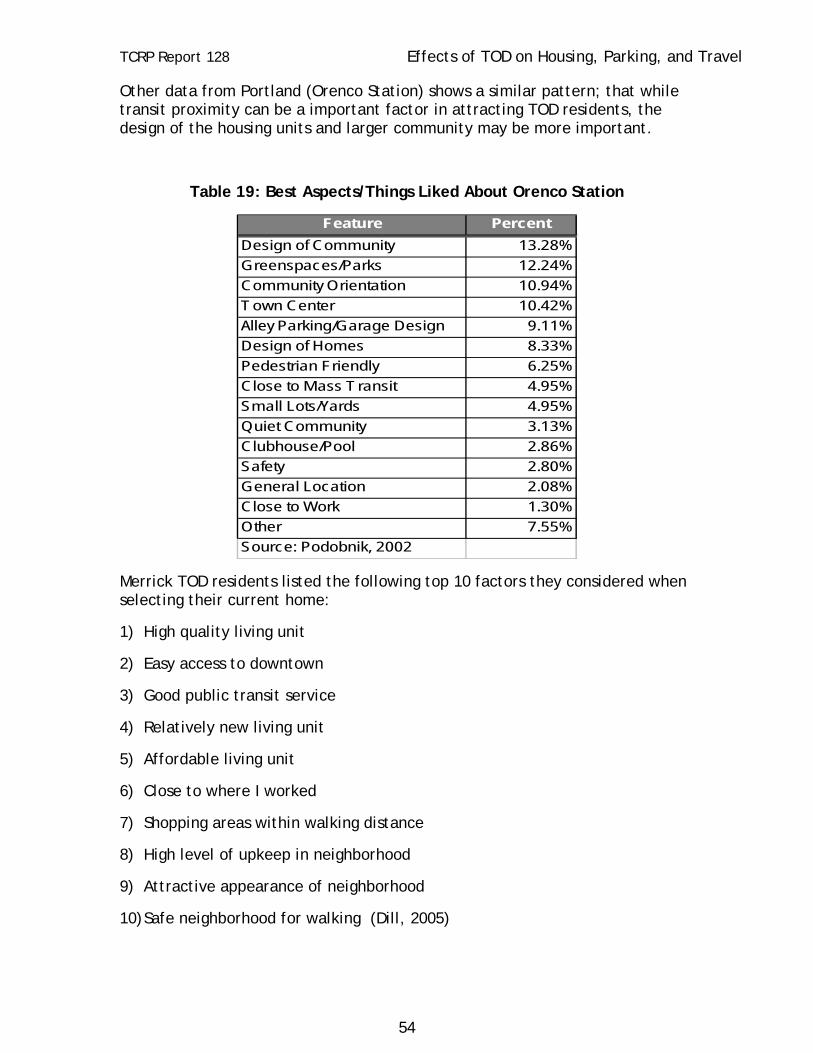
TCRP Report 128 Effects of TOD on Housing, Parking, and Travel
54
Other data from Portland (Orenco Station) shows a similar pattern; that while transit proximity can be a important factor in attracting TOD residents, the design of the housing units and larger community may be more important.
Table 19: Best Aspects/Things Liked About Orenco Station
Feature PercentDesign of Community 13.28%Greenspaces/Parks 12.24%Community Orientation 10.94%Town Center 10.42%Alley Parking/Garage Design 9.11%Design of Homes 8.33%Pedestrian Friendly 6.25%Close to Mass Transit 4.95%Small Lots/Yards 4.95%Quiet Community 3.13%Clubhouse/Pool 2.86%Safety 2.80%General Location 2.08%Close to Work 1.30%Other 7.55%Source: Podobnik, 2002
Merrick TOD residents listed the following top 10 factors they considered when selecting their current home:
1) High quality living unit
2) Easy access to downtown
3) Good public transit service
4) Relatively new living unit
5) Affordable living unit
6) Close to where I worked
7) Shopping areas within walking distance
8) High level of upkeep in neighborhood
9) Attractive appearance of neighborhood
10) Safe neighborhood for walking (Dill, 2005)
TCRP Report 128 Effects of TOD on Housing, Parking, and Travel
55
These studies show that good transit access is indeed a primary factor in residential location decisions, consistent with studies that find high rates of self-selection among TOD residents. Other features that consistently rate as being important are the quality of the housing and community design, and housing cost. In addition, suburban TOD residents often value local services and amenities (e.g., in mixed use buildings, or a “TOD center”), while households in more urban TODs value proximity to the full range of land uses and activities that cities offer. Not surprisingly, school quality does not even register among TOD households, as few TOD households have children.
For projects incorporating affordable housing into a TOD, experience indicates that the issue of affordability often outweighs any transit considerations in making locational decisions. In markets like Portland (e.g., Center Commons) and San Jose (e.g., Ohlone-Chynoweth) where there are shortages of new, well-designed affordable projects, affordability is a prime attractor to TOD (according to TOD project managers).
The most important considerations for all retail developments are location, market, and design; proximity to transit is not a prime consideration, and the market must be viable even in transit’s absence (ULI, 2003). Although a retail component may eventually become an “excitement generator” within a TOD, it cannot be the justification for the development. According to ULI, “Retail is the one land use that is least likely to succeed where it lacks strong support. Thus retail does not drive development around transit; it ‘follows rooftops’.”
TOD plans should carefully consider the volumes that retail developers require, as the “rules” specifying the distance that customers will travel to any particular store are inflexible. High density offices and residences can be good sources of transit riders, but they do not always ensure retail demand, particularly if local retail demand is already being met.
According to CTOD, which tracks national demand for TOD, firms and workers are increasingly exhibiting a preference for "24-Hour neighborhoods". In the past companies preferred suburban campus environments near freeways, and regions lured employers without regard to bigger picture development goals. But now other issues are coming into play, including the rise of the "creative class," and the increasing importance of technology and talent in a region’s economic development strategy. Because firms are chasing talent, which is choosing to locate in diverse, lively urban regions, firms now prefer these locations. According to a recent Jones Lang LaSalle survey (CTOD 2005), access to transit is very important to 70% of “New Economy” companies.
In the Portland area, TOD is becoming increasingly integrated with the high tech sector. Orenco Station in Hillsboro is located very near to Intel (not part of the project), and a large share of Orenco residents are Intel employees that benefit from short commutes. Open Source Development Labs, a global consortium of leading technology companies dedicated to promoting the Linux operating system, located to The Round in Beaverton, in part, to capitalize on

TCRP Report 128 Effects of TOD on Housing, Parking, and Travel
56
rail access to downtown Portland the airport. Just down the line in Hillsboro, Yahoo Inc. recently leased space right along the rail line, citing a mix of factors including: access to public transit, daycare options, affordable housing, and quality of life.
ULI (2003) reiterates that if companies see transit as slow, unreliable, or not reaching enough of their workers, staff in charge of locations decisions will not pay attention to transit. When transit is viewed as a tool for recruiting scarce talent, however, companies will list good transit access as a criterion in site selection choices. ULI also notes that more companies indeed seem to be focusing on transit access for their employees, even if management does not intend to use transit. Table 20 summarizes ULI’s perception of broad office location trends.
Table 20: Workplace Culture: What’s Out and What’s In
"Out" "In"Suburban/exurban campus locations Locations close to transitCorporate campuses Mixed-use developmentsKiss and ride Live, work, play, and rideLocation near CEO's home Location convenient for workersFree parking Free transit passesDriving to lunch Walking to lunchErrands on the way home Errands at lunchtimeCommuting car Fuel-efficient station carQuality of the workplace Qaulity of lifeSource: ULI, 2003
From the perspective of the prospective TOD developer, the development process typically begins with an idea, either a site looking for a use, or a use looking for a site. A developer will usually initiate a TOD project based on experience with similar projects, but a TOD development could also be a natural evolution for a developer with a background in urban or infill projects. The market analysis for such a project, as with all developments, will consider who will buy or rent in such a project at what costs. The land cost sets the broad parameters of the project, along with an understanding of the development costs for such a project, as well as any special construction or

TCRP Report 128 Effects of TOD on Housing, Parking, and Travel
57
assessment costs, such as participation with the transit agency in associated facilities.
Once the broad parameters of the project cost have been established, often with some form of option to hold the property while further feasibility is examined, the developer initiates increasingly detailed studies of market, design, and finance. The market studies will examine not only the potential clients, but also competitive projects, both the supply and demand. The market analysis for a proposed multi family residential project, for example, would compare rents for similar projects targeted to a similar clientele, including projects currently under construction. The analyst’s challenge is to estimate the market share of household growth that would select that project, as well as the likely absorption. The developer’s challenge is to make sure that the estimated market share at the proposed price point is sufficient to ensure the project’s success.
As indicated in H-27, there is growing experience in the development community with TOD projects, among developers, market analysts, architects, transportation consultants, and lenders, and a growing base of information used to support the development process and understand the prospective clientele, residents and businesses. In Washington, D.C., for example, while there have not been statistically rigorous studies of the impact of transit access on property values, market studies establish the premium at about 7% for rental properties. This means that for a project well served by transit, rents can be 7% higher than for comparable properties not so well located. It would also mean, for example, that if a developer were able to offer the same rents, such a project would have enormous competitive appeal.
The expanding portfolio of TOD projects is providing greater insight into TOD market advantages, as well as demographic and lifestyle characteristics of residents. These findings are useful not only in the product development phase, but also in marketing the product. Among developers there is growing awareness that an important sub-market of people are attracted to TOD projects, and greater understanding of who the people are, and why they are attracted to TODs.

TCRP Report 128 Effects of TOD on Housing, Parking, and Travel
58
3. Does TOD Housing Reduce Automobile Trips? Transit-oriented development (TOD) has attracted interest as a tool for promoting smart growth, leveraging economic development, and catering to shifting market demands and lifestyle preferences. Part of the appeal TODs hold is they behave differently from conventional development patterns. People living and working in TODs walk more, use transit more and own fewer cars than the rest of their region. TOD households are twice as likely to not own a car, and own roughly half as many cars as the “average” household. At an individual station TOD can increase ridership by 20 to 40%, and up to five percent overall at the regional level. Residents living near transit are 5 to 6 times more likely to commute by transit than other residents in their region. Self-selection is a major contributor to the benefits of TOD, meaning that people choosing to live in a TOD are predisposed to use transit.12 Given their performance characteristics TODs present an opportunity to accommodate increased density without many of the negative impacts associated with the use of the automobile. While the research clearly points to how TODs perform differently the body of information on the travel characteristics of TODs has yet to have an impact on the industry guidance for projects near major transit stations. This research seeks to bridge one of the widest knowledge gaps on the effects of TOD on travel demand: automobile trip generation rates for residential TODs. Empirical evidence on vehicle trip generation can inform the setting of parking requirements for projects near major transit stations. Despite the existing body of research and supportive local development codes developers and financial institutions still tend to prefer conventional parking ratios in TODs. As a consequence most TODs are thus parked oblivious to the fact that a rail stop is nearby and as a result, their potential benefits (e.g., reduced auto travel) are muted. Structured parking in particular has a significant impact on development costs and is prohibitively expensive in most markets. Lower TOD parking ratios and reduced parking could reduce construction costs, leading to somewhat denser TODs in some markets. Similarly, many proposed TOD projects have been abruptly halted or redesigned at lower densities due to fears that dense development will flood surrounding streets with auto traffic. Part of the problem lies in the inadequacy of current trip generation estimates, which are thought to overstate the potential auto impacts of TOD. The Institute of Transportation
12 R. Cervero, GB Arrington, J. Smith-Heimer. Transit-Oriented Development in the United States: Experiences, Challenges, and Prospects. Transit Cooperative Research Program Report 102. Washington, D.C. 2004
TCRP Report 128 Effects of TOD on Housing, Parking, and Travel
59
Engineers (ITE) trip generation and parking generation rates are the standards from which local traffic and parking impacts are typically derived, and impact fees are set. Some analysts, however, are of the opinion that there is a serious "suburban bias" in the current ITE rates. Typically the empirical data used to set generation rates are drawn from suburban areas with free and plentiful parking and low-density single land uses. Moreover, ITE's auto trip reduction factors, to reflect internal trip capture, are based on only a few mixed-use projects in Florida; there has been little or no observation of actual TODs. The end result is that auto trip generation is likely to be overstated for TODs. This can mean that TOD developers end up paying higher impact fees, proffers, and exactions than they should since such charges are usually tied to ITE rates. Smart growth requires smart calculations, thus impact fees need to account for the likely trip reduction effects of TOD.
1. Study Projects This study aims to fill knowledge gaps by compiling and analyzing original empirical data on vehicle trip generation rates for a representative sample of multi-family housing projects near rail transit stations. This was done by counting the passage of motorized vehicles using pneumatic tubes stretched across the driveways of 17 transit-oriented housing projects of varying sizes in four urbanized areas of the country: Philadelphia/N.E. New Jersey; Portland, Oregon; metropolitan Washington D.C.; and the East Bay of the San Francisco Bay Area (Map 1). Rail services in these areas are of a high quality and span across four major urban rail technologies: commuter rail (Philadelphia SEPTA and NJ Transit); heavy rail (San Francisco BART and Washington Metrorail); light rail (Portland MAX); and streetcar (Portland). Case study sites were chosen in conjunction with the H-27A panel. The most current ITE Trip Generation Manual (7th Edition) includes trip generation data for nearly 1,000 land uses and combinations. The primary focus of this research is on residential housing.13 Our aim is to seed the ITE manual with original and reliable trip generation data for one important TOD land use -- residential housing -- with the expectation that other TOD land uses and combinations (e.g., offices) will be added later. We also hope the research prompts local officials to challenge how they evaluate the likely traffic impacts of housing near major rail transit stations as well as the parking policies set for these projects. The research, moreover, complements several other studies presently underway that aim to further refine trip generation rates to account for the trip-reducing impacts of mixed-use development (typically through internal capture).
13 Institute of Transportation Engineers, 2003. Trip Generation. Washington, D.C.: ITE, 7th edition.
TCRP Report 128 Effects of TOD on Housing, Parking, and Travel
60
The trip- reduction effects of transit-oriented housing is thought to come from three major sources: (1) residential self-selection, wherein for lifestyle reasons people consciously seek out housing near major transit stops for the very reason they want to regularly take transit to work and other destinations; studies in California suggest as much as 40% of the mode choice decision to commute via transit can be attributed to the self-selection phenomenon;14 (2) the presence of in-neighborhood retail sited between residences and stations that promote “rail-pedestrian” trip-chaining; an analysis of the American Housing Survey suggests that the presence of retail near rail stations can boost transit’s commute mode share by as much as 4%;15 and (3) car-shedding (i.e., the tendency to reduce car-ownership when residing in efficient, transit-served locations).16 For studying traffic impacts of multi-family housing near rail stations, we selected mainly multi-family apartments (rental) and in one instance, a condominium project (owner-occupied). Table 1 provides background information on the selected TOD-housing projects and Maps 2 through 5 show their locations within metropolitan areas. Figure 1 shows photo perspectives of the sampled housing projects. Housing projects ranged in size from 90 units (Gresham Central Apartments) to 854 units (Park Regency). Most projects were garden-style in design, around 3-4 stories in height. The sampled Washington Metrorail projects, however, tended to be much higher as revealed by the photo images, with the exception of Avalon near the Bethesda Metrorail station. The average number of parking spaces per project was around 400, yielding an average rate of 1.16 spaces per dwelling unit. The only non-apartment project that was surveyed was Wayside Plaza in Walnut Creek, near the Pleasant Hill BART stations, a condominium project. Six of the surveyed housing projects had ground-floor retail and/or commercial uses, however all were primarily residential in nature (i.e., over 90% of gross floor area was for residential activities). Another selection criterion was that the project not be immediately accessible to a freeway interchange. All of the sampled projects were more than 500 feet from a freeway entrance; five were situated within a quarter mile of a freeway on-
14 R. Cervero. Transit Oriented Development's Ridership Bonus: A Product of Self Selection and Public Policies, Environment and Planning A, Vol. 39, 2007, pp. 2068-2085.
15 R. Cervero, Mixed Land Uses and Commuting: Evidence from the American Housing Survey, Transportation Research A, 30, 5: 361-377, 1996.
16 Holtzclaw, J., Clear, R., Dittmar, H., Goldstein, D., and Haas, P. “Location Efficiency: Neighborhood and Socio-Economic Characteristics Determine Auto Ownership and Use – Studies in Chicago, Los Angeles, and San Francisco”. Transportation Planning and Technology, Vol. 25, pp. 1-27, 2002.
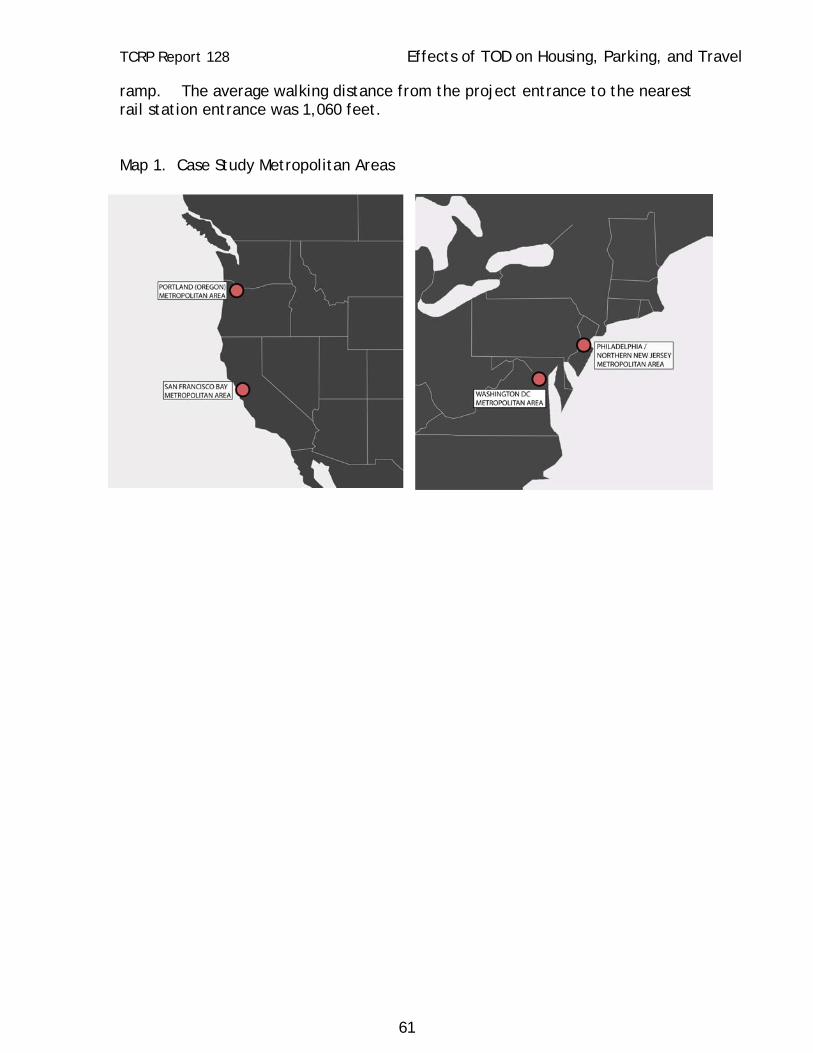
TCRP Report 128 Effects of TOD on Housing, Parking, and Travel
61
ramp. The average walking distance from the project entrance to the nearest rail station entrance was 1,060 feet. Map 1. Case Study Metropolitan Areas

TCRP Report 128 Effects of TOD on Housing, Parking, and Travel
62
Table 1. Background on Case Study TOD Housing Projects
Housing
Other Characteristics
Housing Type
# Stories # Units
# On-Site Parking Spaces
# Driveways
Nearest Rail Station
Shortest Walking Distance from Project to
Nearest Station (feet) Philadelpha/NJ Gaslight Commons (S. Orange NJ) A 4 200 500 3 NJ Transit: South Orange 990 Station Square Apartments (Lansdale PA) A 1-3 346 222 3 Pennbrook SEPTA 625 Portland Center Commons (Portland) A 4 288 150 2 60th Avenue MAX 450 Collins Circle Apartments (Portland) A 6 124 93 1 Goose Hallow MAX 525 Gresham Central Apartments (Gresham) A 3 90 135 2 Gresham Central MAX 620 Merrick Apartments (Portland) A 6 185 218 1 Convention Center MAX 700 Quatama Crossing Apartments (Beaverton) A 3 711 3 Quatama MAX 2000 San Francisco Mission Wells (Fremont) A 2-4 391 508 4 Fremont BART 3810 Montelena Apartment Homes (Hayward) A 3 188 208 3 South Hayward BART 950 Park Regency (Walnut Creek) A 3 854 1352 5 Pleasant Hill BART 1565 Verandas (Union City) A 5 282 282 2 Union City BART 830 Wayside Plaza (Walnut Creek) C 3-4 156 166 1 Pleasant Hill BART 1555 Washington DC Avalon (Bethesda) A 4 497 746 2 Grosvenor Metro 1020 Gallery (Arlington) A 20 231 258 2 Virginia Square Metro 50 Lenox Park Apts. (Silver Spring) A 16 406 406 3 Silver Spring Metro 420 Meridian (Alexandria) A 10-16 457 560 2 Braddock Metro 920 Quincy Plaza (Arlington) A 15-21 499 499 2 Virginia Square Metro 1020 Note: A = Apartments (rental); C = Condominiums (owner-occupied)
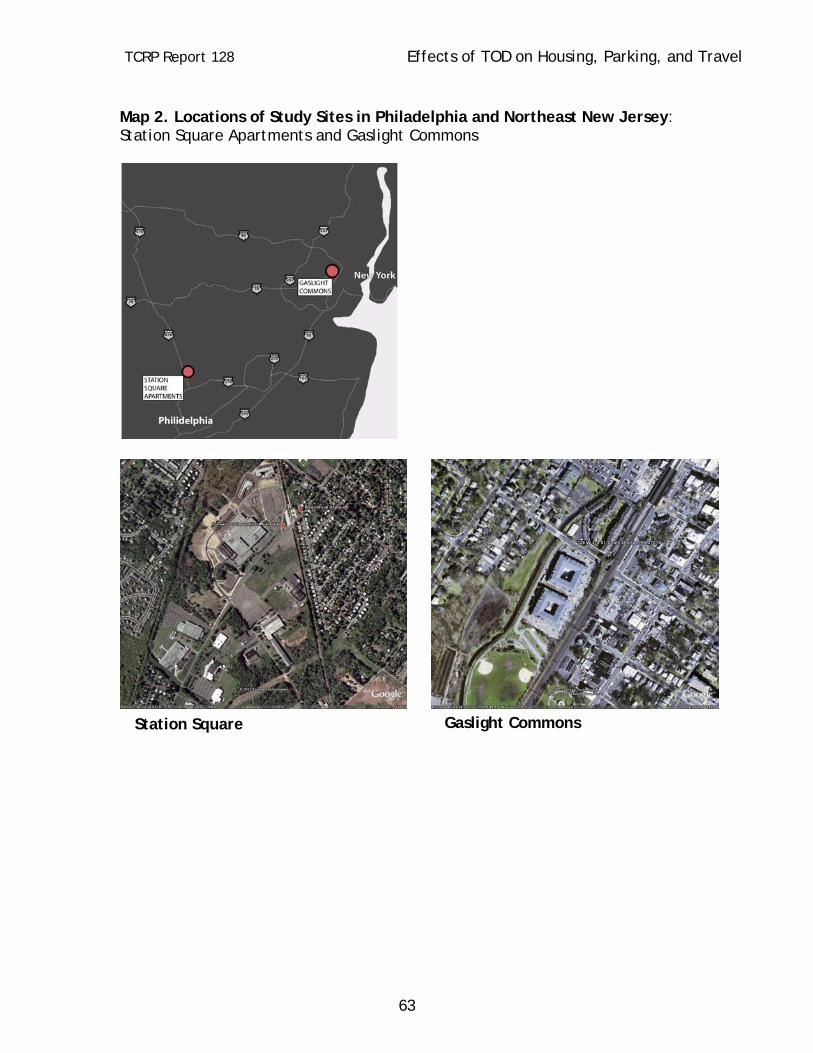
TCRP Report 128 Effects of TOD on Housing, Parking, and Travel
63
Map 2. Locations of Study Sites in Philadelphia and Northeast New Jersey: Station Square Apartments and Gaslight Commons
Station Square Gaslight Commons

TCRP Report 128 Effects of TOD on Housing, Parking, and Travel
64
Map 3. Locations of Study Sites in Metropolitan Washington, D.C.: Avalon; Virginia Square; Meridian; Quincy Plaza; Lenox Park
Avalon at Grosvenor Station
Lenox Park Apartments Gallery at Virginia Square
Quincy Plaza
Meridian at Braddock Park
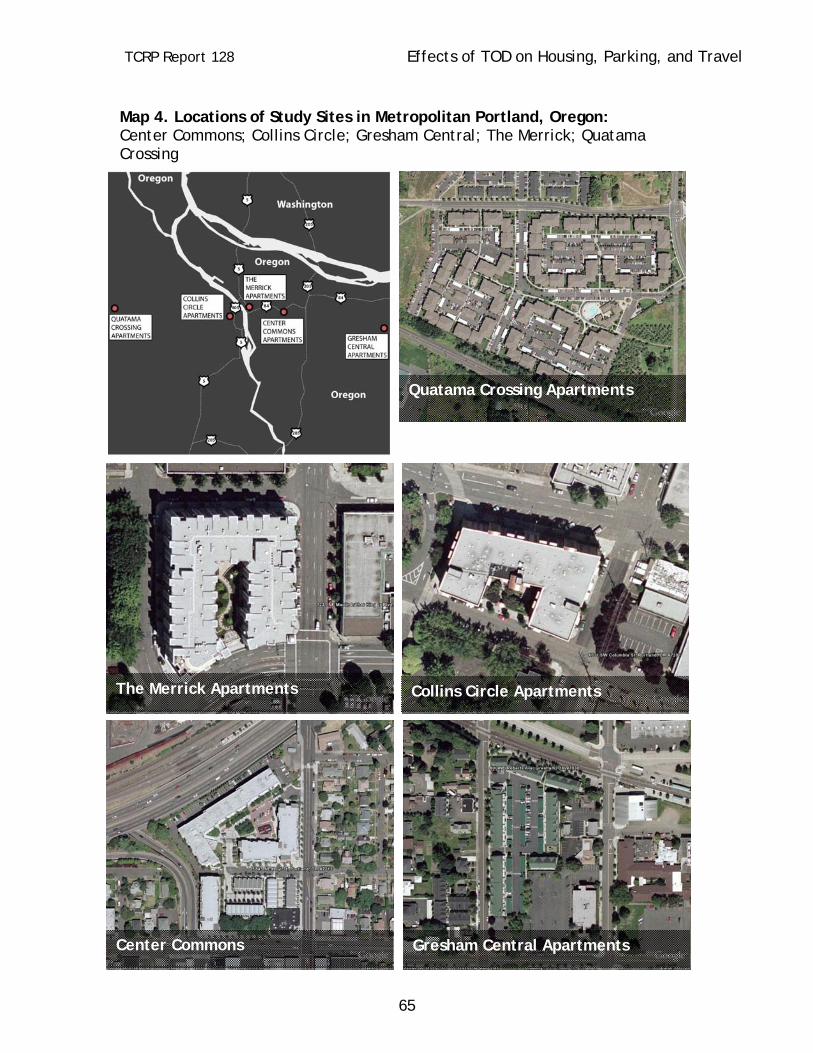
TCRP Report 128 Effects of TOD on Housing, Parking, and Travel
65
Map 4. Locations of Study Sites in Metropolitan Portland, Oregon: Center Commons; Collins Circle; Gresham Central; The Merrick; Quatama Crossing
Quatama Crossing Apartments
Collins Circle Apartments The Merrick Apartments
Center Commons Gresham Central Apartments
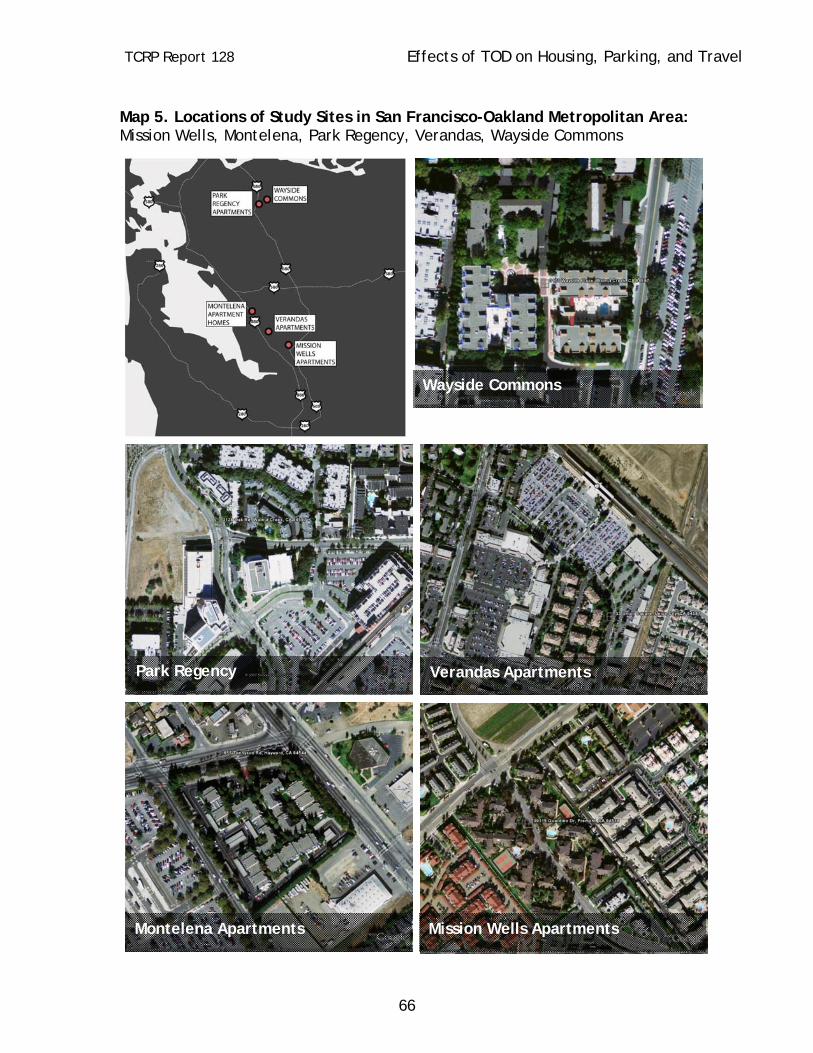
TCRP Report 128 Effects of TOD on Housing, Parking, and Travel
66
Map 5. Locations of Study Sites in San Francisco-Oakland Metropolitan Area: Mission Wells, Montelena, Park Regency, Verandas, Wayside Commons Montelena Apartments Mission Wells Apartments
Wayside Commons
Park Regency Verandas Apartments
TCRP Report 128 Effects of TOD on Housing, Parking, and Travel
67
2. Study Methods Local traffic engineering firms were contacted about the availability of pre-existing data, however no examples of recent trip generation analyses for TOD housing projects were found that could inform this study. After agreement was reached with the TCRP H-27A panel to survey projects in the four rail-served metropolitan areas, candidate sites were visited to make sure they met the selection criteria and also had limited access points and driveways from which pneumatic tube count data could be reliably collected. (As shown in Table 1, all had five or fewer driveways and in most instances there were just a few ways to drive in and out of a project.) Once sites that met the selection criteria were chosen, property owners and property managers were contacted, informed about the purpose of the study, and asked permission to allow on-site observation and the installation of pneumatic-tube recorders at curb cuts and driveways. After receiving permission from property owners to install pneumatic tube counters on their properties, empirical field-work commenced. Local traffic engineering firms which specialize in vehicle trip data-collection were contracted to set up the tube counters and compile the data. Pneumatic tube counters recorded daily vehicle traffic volumes by hour of day and day of week in accordance with standard ITE methods.17 The consecutive two-day periods chosen to compile tube-count data were considered to correspond with “peak conditions”: middle of the week and prior to summer vacation season: Tuesday May 29 and Wednesday May 30, 2007 for the 7 projects on the east coast (Washington, D.C. metropolitan area and Philadelphia/N.E. New Jersey); and Wednesday May 30 and Thursday May 31 for the 10 projects on the west coast (Portland, Oregon and East Bay). To further segment the data collected the team also compiled basic demographic data for the neighborhoods of each of the rail stations serving the selected TODs, including information on residential densities, car ownership, and median income, were compiled using a national database from the Center for Transit Oriented Development (CTOD). Also, pedestrian surveys were conducted to record measures regarding the quality of walking, the availability of amenities (e.g., street trees and furniture), lack of provisions (e.g., no pedestrian cross-walks), and the shortest distance between the main entrance of each case-study project and the fare gates of the nearest rail station.
17 Due to the primarily residential nature of the projects, internal trip making was not expected to be as significant as it would be in larger TODs with a broad array of mixed uses. Measuring internal trip making would require supplemental surveys of residents (e.g., travel diaries) and/or local merchants, and the team has currently not budgeted to estimate these trips.

TCRP Report 128 Effects of TOD on Housing, Parking, and Travel
68
3. Data Compilation Collected data were compiled, coded, cleaned, and entered into a data base. First, simple descriptive statistics were prepared on vehicle trip generation rates, defined in such standard terms as: average weekday vehicle trips per dwelling unit; and one-hour A.M. and P.M. vehicle trips per dwelling unit.18 The vehicle count data obtained in the field were converted to 24-hour as well as A.M. and P.M. peak-hour rates per dwelling unit for each project.19 For all 17 TOD-housing projects combined, a weighted average trip generation rate was estimated.20 The computed rates for TOD-housing projects were compared to those found in the latest edition of the ITE manual for the equivalent land use (i.e., apartments and condominiums).21 Comparisons are drawn using the ITE manual’s “weighted averages” as well as estimates derived from best-fitting regression equations. The degree to which there are systematic differences in estimated and actual trip generation and parking generation rates of TODs are highlighted. The types of TOD projects for which there appear to be the largest discrepancies are identified. Additionally, the results were cross-classified among sampled projects in terms of such factors as distance to CBD, distance to the nearest station, parking provisions, and other factors, including the quality of walking environment (e.g., with or without adjoining sidewalks). Multivariate regression equations are also estimated that predict the trip generation rates of TOD housing as a function of these and other variables. Lastly, the implications of the research findings for various public policies and practices are discussed. To the degree that TOD-housing projects exhibit below-normal trip generation rates, a strong case can be made for using sliding-scale impact fees to evaluate new TOD proposals. This might, for instance, result in the lowering of estimated trip generation rates within, say, ¼ mile of a station and with continuous sidewalk access and in a mixed-use neighborhood by a fixed percent, such as 20%.
18 ITE defines the “average weekday trip rate” as the weekday (Monday through Friday) average vehicle trip generation rate during a 24-hour period. The “average rate for the peak hour” is the trip generation rate during the highest volume of traffic entering and exiting the site during the A.M. or P.M. hours.
19 Since 24-hour counts were obtained for two consecutive weekdays, one-day estimates were computed by dividing the two 24-hour counts by 2.
20 The ITE manual defines the “weighted average” as the sum of trip ends for all projects divided by the sum of the independent variable, which in our case is number of dwelling units.
21 Institute of Transportation Engineers. 2003. Trip Generation. Washington, D.C.: ITE, 7th edition.

TCRP Report 128 Effects of TOD on Housing, Parking, and Travel
69
4. Comparison of Vehicle Trip Generation Rates TOD-housing clearly reduces auto trips in the four urbanized areas that were studied. Below, results for both 24-hour periods as well as peak periods are summarized. Average Weekday Trip Comparisons Table 2 shows that in all cases, 24-hour weekday vehicle trip rates were considerably below the ITE weighted average rate for similar uses.22 Taking the (unweighted) average across the 17 case-study projects, TOD-housing projects generated around 47% less vehicle traffic than that predicted by the ITE manual (3.55 trips per dwelling unit for TOD-housing versus 6.67 trips per dwelling unit by ITE estimates). This held true using both the weighted average ITE rate as well as the ITE rates predicted using the best-fitting regression equations. Results were quite similar in both cases. The biggest trip reduction effects were found in the Washington, D.C. metropolitan area. Among the five mid-to-high rise apartment projects near Metrorail stations outside the District of Columbia, vehicle trip generation rates were more than 60% below that predicted by the ITE manual. There, 24-hour vehicle trip rates ranged from a high of 4.72 trip ends per dwelling unit at the more suburban Avalon project near the Grosvenor Metrorail Station (and outside the beltway) to a low of around one vehicle weekday for every two dwelling units at the Meridian near Alexandria’s Braddock Station. The comparatively low vehicle trip generation rates for TOD-housing near Washington Metrorail stations matches up with recent findings on high transit modal splits for a 2005 survey of 18 residential sites.23 For projects within ¼ mile of a Metrorail station (which matched the locations of all the five TOD-housing projects we studied in the Washington metropolitan area), on average 49% of residents used Metrorail for their commute or school trips. One of the projects we surveyed -- the Avalon apartments at Grosvenor Station – was also 22 The comparable ITE land use category for 16 of the 17 projects is Apartments (ITE Code 220). The average trip rate for apartments is 6.72 vehicle trips per dwelling unit on a weekday based on the experiences of 86 apartment projects across the U.S. (averaging 212 dwelling units in size). The best-fitting regression equation for Apartments is: T = 6.01(X) + 150.35 (R2 = 0.88) where T = Vehicle Trip Ends and X = Number of Dwelling Units. For the Wayside Commons projects, the corresponding ITE land-use category is Residential Condominium (ITE Code 230). The average trip rate for condominiums is 5.68 vehicle trips per dwelling unit on a weekday based on the experiences of 54 owner-occupied condominium and townhouse projects across the U.S. (averaging 183 dwelling units in size). The best-fitting regression equation for Apartments is: Ln(T) = 0.85(X) + 2.55 (R2 = 0.83) where T = Vehicle Trip Ends, X = Number of Dwelling Units, and Ln = natural logarithm.
23 Washington Metropolitan Area Transit Authority, 2005 Development-Related Ridership Survey: Final Report, March 2006.

TCRP Report 128 Effects of TOD on Housing, Parking, and Travel
70
surveyed in this 2005 study. The Avalon, which had the highest trip generation rate among the five projects we surveyed in the Washington area, had an impressively high work-and-school trip transit modal split in the 2005 survey: 54%.
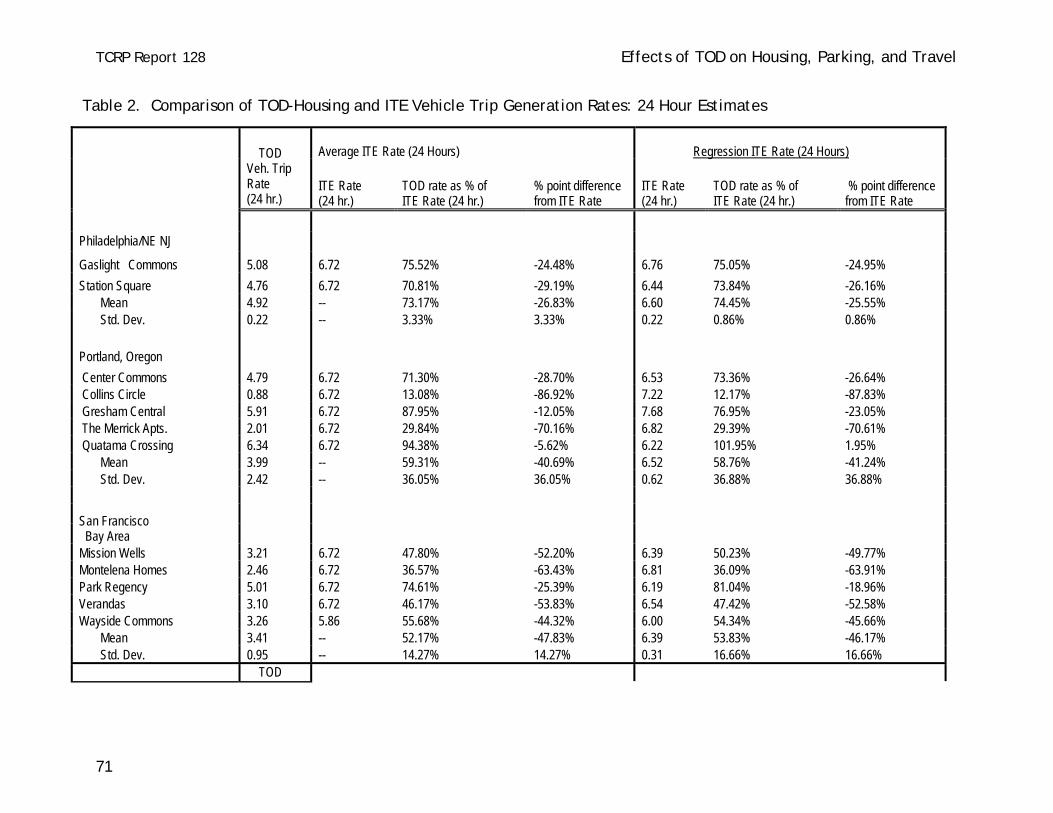
TCRP Report 128 Effects of TOD on Housing, Parking, and Travel
71
Average ITE Rate (24 Hours)
Regression ITE Rate (24 Hours)
TOD Veh. Trip Rate (24 hr.)
ITE Rate (24 hr.)
TOD rate as % of ITE Rate (24 hr.)
% point difference from ITE Rate
ITE Rate (24 hr.)
TOD rate as % of ITE Rate (24 hr.)
% point difference from ITE Rate
Philadelphia/NE NJ Gaslight Commons 5.08 6.72 75.52% -24.48% 6.76 75.05% -24.95% Station Square 4.76 6.72 70.81% -29.19% 6.44 73.84% -26.16% Mean 4.92 -- 73.17% -26.83% 6.60 74.45% -25.55% Std. Dev. 0.22 -- 3.33% 3.33% 0.22 0.86% 0.86% Portland, Oregon Center Commons 4.79 6.72 71.30% -28.70% 6.53 73.36% -26.64% Collins Circle 0.88 6.72 13.08% -86.92% 7.22 12.17% -87.83% Gresham Central 5.91 6.72 87.95% -12.05% 7.68 76.95% -23.05% The Merrick Apts. 2.01 6.72 29.84% -70.16% 6.82 29.39% -70.61% Quatama Crossing 6.34 6.72 94.38% -5.62% 6.22 101.95% 1.95% Mean 3.99 -- 59.31% -40.69% 6.52 58.76% -41.24% Std. Dev. 2.42 -- 36.05% 36.05% 0.62 36.88% 36.88%
San Francisco Bay Area Mission Wells 3.21 6.72 47.80% -52.20% 6.39 50.23% -49.77% Montelena Homes 2.46 6.72 36.57% -63.43% 6.81 36.09% -63.91% Park Regency 5.01 6.72 74.61% -25.39% 6.19 81.04% -18.96% Verandas 3.10 6.72 46.17% -53.83% 6.54 47.42% -52.58% Wayside Commons 3.26 5.86 55.68% -44.32% 6.00 54.34% -45.66% Mean 3.41 -- 52.17% -47.83% 6.39 53.83% -46.17% Std. Dev. 0.95 -- 14.27% 14.27% 0.31 16.66% 16.66% TOD
Table 2. Comparison of TOD-Housing and ITE Vehicle Trip Generation Rates: 24 Hour Estimates
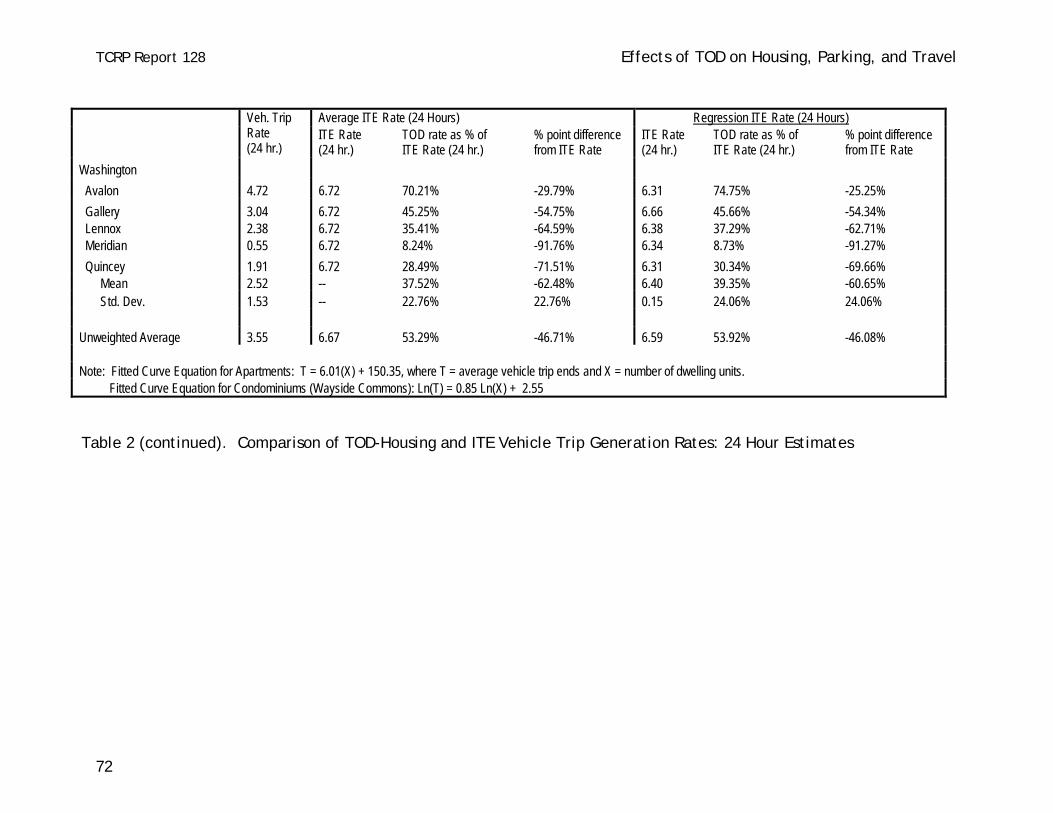
TCRP Report 128 Effects of TOD on Housing, Parking, and Travel
72
Average ITE Rate (24 Hours) Regression ITE Rate (24 Hours) Veh. Trip Rate (24 hr.)
ITE Rate (24 hr.)
TOD rate as % of ITE Rate (24 hr.)
% point difference from ITE Rate
ITE Rate (24 hr.)
TOD rate as % of ITE Rate (24 hr.)
% point difference from ITE Rate
Washington Avalon 4.72 6.72 70.21% -29.79% 6.31 74.75% -25.25% Gallery 3.04 6.72 45.25% -54.75% 6.66 45.66% -54.34% Lennox 2.38 6.72 35.41% -64.59% 6.38 37.29% -62.71% Meridian 0.55 6.72 8.24% -91.76% 6.34 8.73% -91.27% Quincey 1.91 6.72 28.49% -71.51% 6.31 30.34% -69.66% Mean 2.52 -- 37.52% -62.48% 6.40 39.35% -60.65% Std. Dev. 1.53 -- 22.76% 22.76% 0.15 24.06% 24.06% Unweighted Average 3.55 6.67 53.29% -46.71% 6.59 53.92% -46.08% Note: Fitted Curve Equation for Apartments: T = 6.01(X) + 150.35, where T = average vehicle trip ends and X = number of dwelling units. Fitted Curve Equation for Condominiums (Wayside Commons): Ln(T) = 0.85 Ln(X) + 2.55
Table 2 (continued). Comparison of TOD-Housing and ITE Vehicle Trip Generation Rates: 24 Hour Estimates

TCRP Report 128 Effects of TOD on Housing, Parking, and Travel
73
It is important to realize that high transit ridership levels and significant trip reduction in metropolitan Washington is tied to the region’s successful effort to create a network of TODs, as revealed by the Rosslyn-Ballston corridor (and discussed in detail in the predecessor report to this study, TCRP Report 102 on Transit Oriented Development in America: Experiences, Challenges, and Prospects). Synergies clearly derive from having transit-oriented housing tied to transit-oriented employment and transit-oriented shopping. After the Washington area, TOD-housing in the Portland area tended to have the lowest weekday trip generation rates – on average, around 40% below that predicted by the ITE manual. The range of experiences, however, varied a lot, from a low of 0.88 weekday vehicle trips per dwelling unit for Collins Circle in downtown Portland to a high of 6.34 for more suburban Quantama Crossing (only slightly below the average rate from the ITE manual and a bit above the regression-generated estimate from the ITE manual). Among the surveyed Portland-area apartments, also notable for its low trip generation rate is the Merrick Apartments near the MAX light rail Convention Center station in the Lloyd District, across the river from downtown Portland: 2.01 weekday trips. Travel behavior of the residents of the Merrick apartments was also studied in 2005.24 Based on a 43% response rate from 150 surveyed households at the Merrick apartments, trip generation estimates can be imputed from that survey. The 2005 survey asked: “In the past week (Saturday January 29 through Friday February 4), how many times did you go to the following place from your home in a vehicle, walking, bicycling, riding the bus, or riding MAX light rail? Each time you left your home during the week is a trip.” From household responses, an average of 1.42 daily vehicle trips per dwelling from Merrick apartments was made. Doubling this rate (assuming those who drove away each day also returned) yields an estimated daily rate of 2.84 vehicle trips per dwelling unit. This is bit higher than that found in our tube count survey but still substantially lower than the ITE rate.25 The 2005 survey also estimated that 18% of all trips made by residents of the Merrick apartments are by transit (both rail and bus). For work and school trips, transit’s estimated modal split was 23%. A follow-up 2005 survey of Merrick apartment residents further that transit is the primary commute mode for 27.9% of residents.26 24 J. Dill, Survey of Merrick TOD Residents: Final Report, report prepared for Portland Metro, March 2005.
25 Differences are likely due to several factors. Our results are based on objective physical counts whereas the 2005 survey results were based on a sample of self-reported responses. Also, the 2005 study included weekend days whereas our study was based on middle-of-the-week experiences.
26 J. Dill, Travel and Transit Use at Portland Area Transit-Oriented Developments (TODs), report prepared for Transportation Northwest (TransNow), Portland, Oregon, May 2006.

TCRP Report 128 Effects of TOD on Housing, Parking, and Travel
74
Another study further sheds light on the results for one of Portland’s surveyed apartments: Center Commons in east Portland. Our survey found a weekday rate of 4.79 trips per dwelling unit for Center Commons, more than one-quarter below ITE’s estimated rates for apartments. In a thesis prepared for the Master of Urban and Regional Planning degree at Portland State University, a mailback survey was conducted in 2002 of 246 residents of Center Commons, producing a response rate of 39%. That survey found that 45.8% of responding residents of Center Commons takes MAX light rail or bus to work. Just as in the case of metropolitan Washington, Portland’s success at reducing automobile trips around transit-oriented housing cannot be divorced from the regional context. High ridership and reduced car travel at the surveyed housing projects stems to a significant degree from the successful integration of urban development and rail investments along the Gresham-downtown-westside axis. In Portland, as in Washington, TODs are not isolated islands but rather nodes along corridors of compact, mixed-use, walking friendly development – a “necklace of pearls” urban form. The San Francisco Bay Area also averaged vehicle trip generation rates substantially below those estimated by the ITE manual. Among the East Bay TOD-housing projects studied, Montelena Homes (formerly called Archstone Barrington Hills) had the lowest weekday rate: 2.46 trip ends per dwelling unit, 63% below ITE’s rate. A 2003 survey of residents of this project found very high transit usage among Montelena Homes residents: 55% stated they commute by transit (both rail and bus).27 The 2003 found the following commute-trip transit modal splits (compared to our recorded weekday trip rates): Wayside Commons: 56% (3.26 daily trips per dwelling unit); Verandas: 54% (3.1 daily trips per dwelling unit); Park Regency: 37% (5.01 daily trips per dwelling unit); and Mission Wells: 13% (3.21 daily trips per dwelling unit). Lastly, the two apartment projects near suburban commuter rail stations outside of Philadelphia and the Newark metropolitan area of northeast New Jersey averaged weekday vehicle trip generation rates that were roughly one-quarter less than that predicted by the ITE manual. This is an appreciable difference given the relatively low-density settings of these projects and that commuter rail offers limited midday and late-night services.
27 H. Lund, R. Cervero, and R. Willson, Travel Characteristics of Transit-Oriented Development in California, Oakland, California, CalTrans Transport Grant, January 2004.

TCRP Report 128 Effects of TOD on Housing, Parking, and Travel
75
AM Peak Comparisons Table 3 compares recorded trip generation rates with those from the ITE manual for the AM Peak.28 In general, patterns were quite similar to those found for the 24-hour period. As before, the greatest differential between AM trip generation and ITE estimates were for TOD-housing closest to CBDs – notably, Collins Circle and The Merrick Apartments in the case of Portland, and the Meridian Apartments near the Braddock Metrorail station in Alexandria, VA. PM Peak Comparisons Table 4 shows the results for the PM peak.29 PM trip generation rates are generally higher than in the morning peak since commute traffic often intermixes with trips for shopping, socializing, recreation, and other activities. In general, PM trip generation rates for TOD-housing were closer to ITE predictions than in the AM peak. Notable exceptions were the lowest trip generators. For example, the PM rates for Collins Circle and Meridian were 84.3% and 91.7% below ITE predictions, respectively. For the AM period, the differentials were 78.7% and 90.0%, respectively (from Table 3).
28 In tabulating the results, the one-hour period in the AM peak with the highest tube count was treated as the “AM peak”. In most instances, this fell between the 7AM and 9AM period.
29 The one-hour period in the PM peak with the highest tube could was treated as the “PM peak”. This generally occurred in the 4PM to 7PM period.

TCRP Report 128 Effects of TOD on Housing, Parking, and Travel
76
Average Rate
Regression Rate
Veh. Trip Rate (AM peak hr.)
ITE Rate (AM peak hr.)
TOD rate as % of ITE Rate (AM pk hr.)
% Below ITE Rate
ITE Rate (AM peak hr.)
TOD rate as % of ITE Rate (AM pk hr.)
% Below ITE Rate
Philadelphia/NE NJ Gaslight Commons 0.40 0.55 72.73% -27.27% 0.55 72.59% -27.41% Station Square 0.36 0.55 66.21% -33.79% 0.54 67.17% -32.83% Mean 0.38 -- 69.47% -30.53% -- 69.88% -30.12% Std. Dev. 0.03 -- 4.61% 4.61% -- 3.83% 3.83% Portland, Oregon Center Commons 0.25 0.55 45.45% -54.55% 0.54 45.90% -54.10% Collins Circle 0.12 0.55 21.26% -78.74% 0.56 20.74% -79.26% Gresham Central 0.59 0.55 107.07% 7.07% 0.58 102.10% 2.10% The Merrick Apts. 0.13 0.55 23.10% -76.90% 0.55 22.98% -77.02% Quatama Crossing 0.30 0.55 54.98% -45.02% 0.54 56.42% -43.58% Mean 0.28 -- 50.37% -49.63% -- 39.70% -60.30% Std. Dev. 0.19 -- 34.83% 34.83% -- 23.65% 23.65%
San Francisco Bay Area Mission Wells 0.48 0.55 86.72% -13.28% 0.54 88.20% -11.80% Montelena Homes 0.17 0.55 31.43% -68.57% 0.55 31.30% -68.70% Park Regency 0.34 0.55 61.85% -38.15% 0.53 63.59% -36.41% Verandas 0.19 0.55 35.14% -64.86% 0.54 35.47% -64.53% Wayside Commons 0.21 0.44 47.35% -52.65% 0.62 33.50% -66.50% Mean 0.28 -- 52.50% -47.50% -- 50.41% -49.59% Std. Dev. 0.13 -- 22.53% 22.53% -- 24.88% 24.88%
Table 3. Comparison of TOD-Housing and ITE Vehicle Trip Generation Rates: AM Peak Estimates

TCRP Report 128 Effects of TOD on Housing, Parking, and Travel
77
Average Rate
Regression Rate
Veh. Trip Rate (AM peak hr.)
ITE Rate (AM peak hr.)
TOD rate as % of ITE Rate (AM pk hr.)
% Below ITE Rate
ITE Rate (AM peak hr.)
TOD rate as % of ITE Rate (AM pk hr.)
% Below ITE Rate
Washington Avalon 0.44 0.55 80.30% -19.70% 0.54 82.02% -17.98% Gallery 0.25 0.55 44.86% -55.14% 0.55 45.01% -54.99% Lennox 0.18 0.55 32.47% -67.53% 0.54 33.05% -66.95% Meridian 0.05 0.55 9.95% -90.05% 0.54 10.15% -89.85% Quincey 0.18 0.55 32.91% -67.09% 0.54 33.62% -66.38% Mean 0.22 -- 40.10% -59.90% -- 21.88% -78.12% Std. Dev. 0.14 -- 25.78% 25.78% -- 16.60% 16.60% Unweighted 0.28 0.54 51.30% -48.70% 0.55 50.64% -49.36% Average Note: Fitted Curve Equation for Apartments: T = 0.53(X) + 4.21 where T = average vehicle trip ends and X = number of dwelling units. Fitted Curve Equation for Condominium (Wayside Commons): Ln(T) = 0.82 Ln(X) + 0.17
Table 3 (continued). Comparison of TOD-Housing and ITE Vehicle Trip Generation Rates: AM Peak Estimates
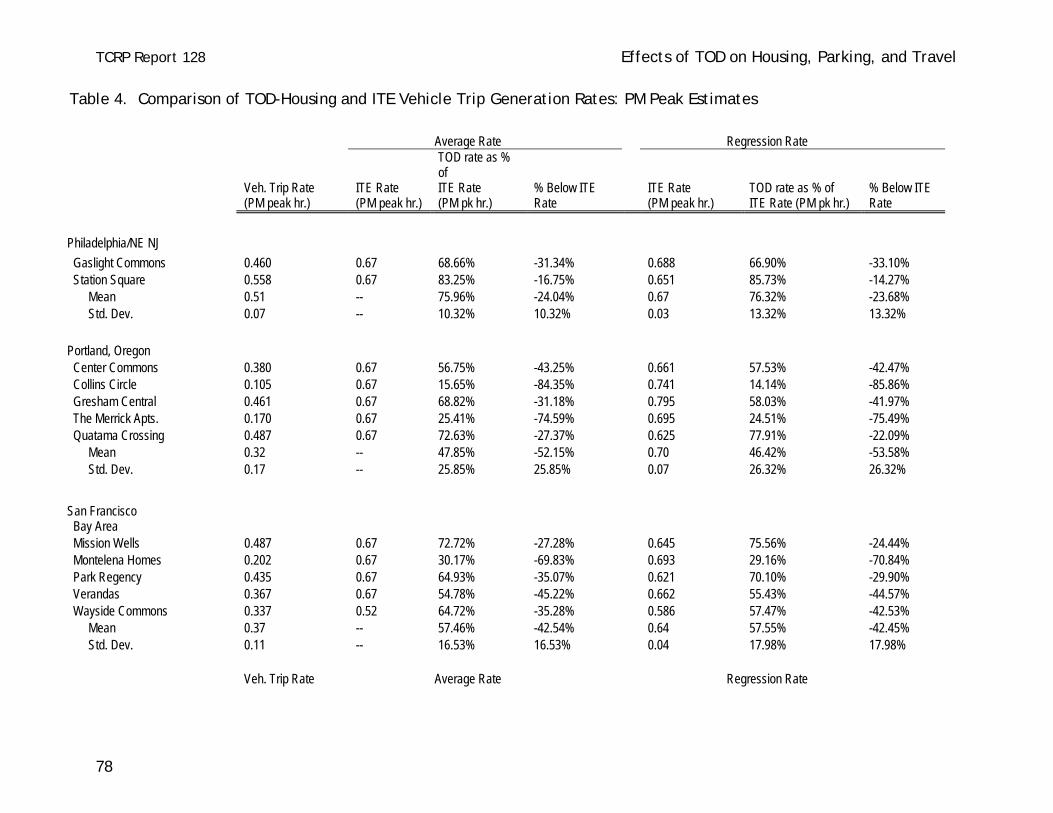
TCRP Report 128 Effects of TOD on Housing, Parking, and Travel
78
Average Rate Regression Rate
Veh. Trip Rate (PM peak hr.)
ITE Rate (PM peak hr.)
TOD rate as % of ITE Rate (PM pk hr.)
% Below ITE Rate
ITE Rate (PM peak hr.)
TOD rate as % of ITE Rate (PM pk hr.)
% Below ITE Rate
Philadelphia/NE NJ Gaslight Commons 0.460 0.67 68.66% -31.34% 0.688 66.90% -33.10% Station Square 0.558 0.67 83.25% -16.75% 0.651 85.73% -14.27% Mean 0.51 -- 75.96% -24.04% 0.67 76.32% -23.68% Std. Dev. 0.07 -- 10.32% 10.32% 0.03 13.32% 13.32% Portland, Oregon Center Commons 0.380 0.67 56.75% -43.25% 0.661 57.53% -42.47% Collins Circle 0.105 0.67 15.65% -84.35% 0.741 14.14% -85.86% Gresham Central 0.461 0.67 68.82% -31.18% 0.795 58.03% -41.97% The Merrick Apts. 0.170 0.67 25.41% -74.59% 0.695 24.51% -75.49% Quatama Crossing 0.487 0.67 72.63% -27.37% 0.625 77.91% -22.09% Mean 0.32 -- 47.85% -52.15% 0.70 46.42% -53.58% Std. Dev. 0.17 -- 25.85% 25.85% 0.07 26.32% 26.32%
San Francisco Bay Area Mission Wells 0.487 0.67 72.72% -27.28% 0.645 75.56% -24.44% Montelena Homes 0.202 0.67 30.17% -69.83% 0.693 29.16% -70.84% Park Regency 0.435 0.67 64.93% -35.07% 0.621 70.10% -29.90% Verandas 0.367 0.67 54.78% -45.22% 0.662 55.43% -44.57% Wayside Commons 0.337 0.52 64.72% -35.28% 0.586 57.47% -42.53% Mean 0.37 -- 57.46% -42.54% 0.64 57.55% -42.45% Std. Dev. 0.11 -- 16.53% 16.53% 0.04 17.98% 17.98% Veh. Trip Rate Average Rate Regression Rate
Table 4. Comparison of TOD-Housing and ITE Vehicle Trip Generation Rates: PM Peak Estimates

TCRP Report 128 Effects of TOD on Housing, Parking, and Travel
79
(PM peak hr.)
ITE Rate (PM peak hr.)
TOD rate as % of ITE Rate (PM pk hr.)
% Below ITE Rate
ITE Rate (PM peak hr.)
TOD rate as % of ITE Rate (PM pk hr.)
% Below ITE Rate
Washington Avalon 0.370 0.67 55.26% -44.74% 0.635 58.28% -41.72% Gallery 0.234 0.67 34.89% -65.11% 0.676 34.59% -65.41% Lennox 0.220 0.67 32.90% -67.10% 0.643 34.28% -65.72% Meridian 0.056 0.67 8.33% -91.67% 0.638 8.74% -91.26% Quincey 0.201 0.67 30.06% -69.94% 0.635 31.71% -68.29% Mean 0.22 -- 32.29% -67.71% 0.65 33.52% -66.48% Std. Dev. 0.11 -- 16.69% 16.69% 0.02 17.55% 17.55%
0.391 0.661 62.10% -37.90% 0.664 49.42% -50.58% Unweighted Average Note: Fitted Curve Equation for Apartments: T = 0.60(X) + 17.52 where T = average vehicle trip ends and X = number of dwelling units Fitted Curve Equation for Condominium (Wayside Commons): T = 0.34(X) + 38.17
Table 4 (Continued). Comparison of TOD-Housing and ITE Vehicle Trip Generation Rates: PM Peak Estimates

TCRP Report 128 Effects of TOD on Housing, Parking, and Travel
80
Weighted Average Comparisons The summary results presented so far are based on unweighted averages – i.e., each project is treated as a data point in computing averages regardless of project size. The ITE manual, however, presents “weighted averages” of trip generation by summing all trip ends among cases and dividing by the sum of dwelling units. Thus for “apple to apple” comparisons, weighted average vehicle trip rates were computed for all 17 projects combined for weekday, AM peak, and PM peak.30 Figure 1 summarizes the results. Over a typical weekday period, the 17 surveyed TOD-housing projects averaged 44% fewer vehicle trips than that estimated by the ITE manual (3.754 versus 6.715). The weighted average differentials were even larger during peak periods – 49% lower rates during the AM peak and 48% lower rates during the PM peak. To the degree that impact fees are based on peak travel conditions, one can infer that traffic impacts studies might end up overstating the potential congestion-inducing effects of TOD-housing in large rail-served metropolitan areas, such as Washington D.C., by as much as 50%.
Figure 1. Comparison of Weighted Average Vehicle Trip Rates: TOD Housing and ITE Estimates
30 As done in the ITE manual, the weighted average was computed by summing all trip ends among the 17 projects and dividing by the sum of dwelling units.
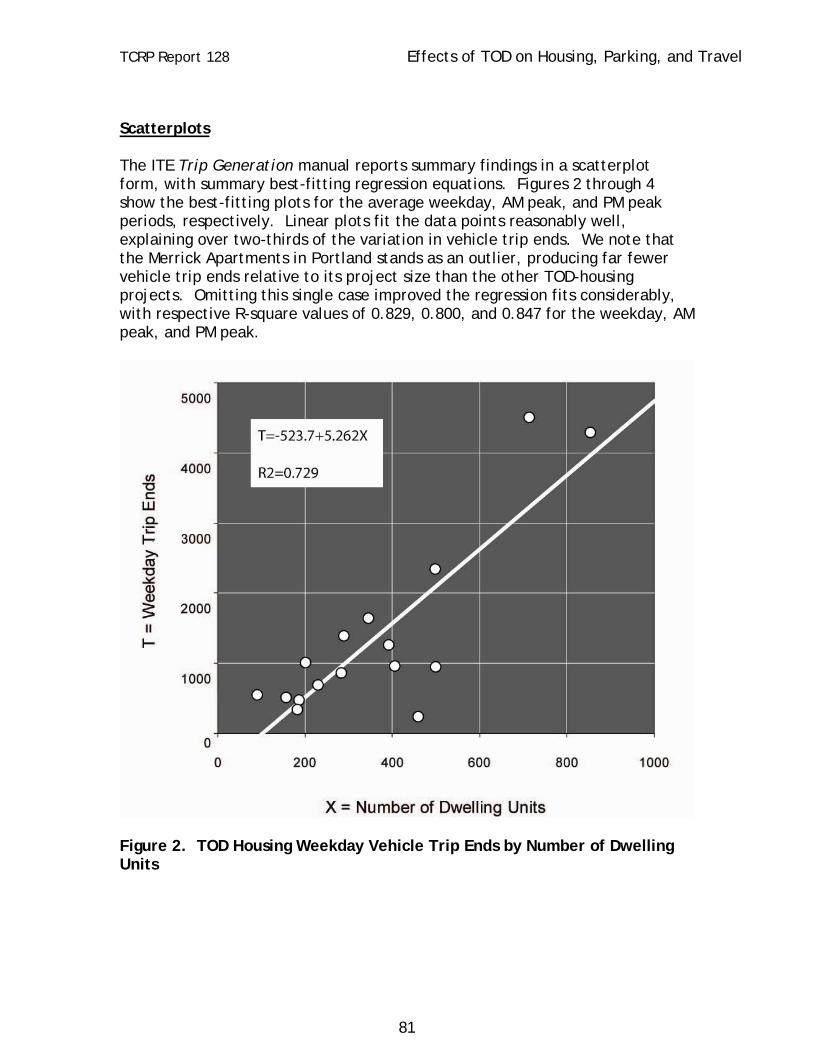
TCRP Report 128 Effects of TOD on Housing, Parking, and Travel
81
Scatterplots The ITE Trip Generation manual reports summary findings in a scatterplot form, with summary best-fitting regression equations. Figures 2 through 4 show the best-fitting plots for the average weekday, AM peak, and PM peak periods, respectively. Linear plots fit the data points reasonably well, explaining over two-thirds of the variation in vehicle trip ends. We note that the Merrick Apartments in Portland stands as an outlier, producing far fewer vehicle trip ends relative to its project size than the other TOD-housing projects. Omitting this single case improved the regression fits considerably, with respective R-square values of 0.829, 0.800, and 0.847 for the weekday, AM peak, and PM peak.
Figure 2. TOD Housing Weekday Vehicle Trip Ends by Number of Dwelling Units

TCRP Report 128 Effects of TOD on Housing, Parking, and Travel
82
Figure 3. TOD Housing AM Peak Vehicle Trip Ends by Number of Dwelling Units Using the average weekday best-fitting regression equation in Figure 3, the estimated number of daily vehicle trips generated by a 400-unit apartment project is 1,725.31 For the same apartment land-use category (ITE code of 220), the latest ITE Trip Generation Manual would predict 2,795 daily vehicle trips for the same 400-unit apartment.32 Thus, based on the empirical experiences of the sampled projects, the ITE regression equation for apartments overstates traffic impacts of transit-oriented housing by 39%.
31 -523.7 + (5.26*400) = 1,725
32 150.35 + (6.01*400) = 2,795
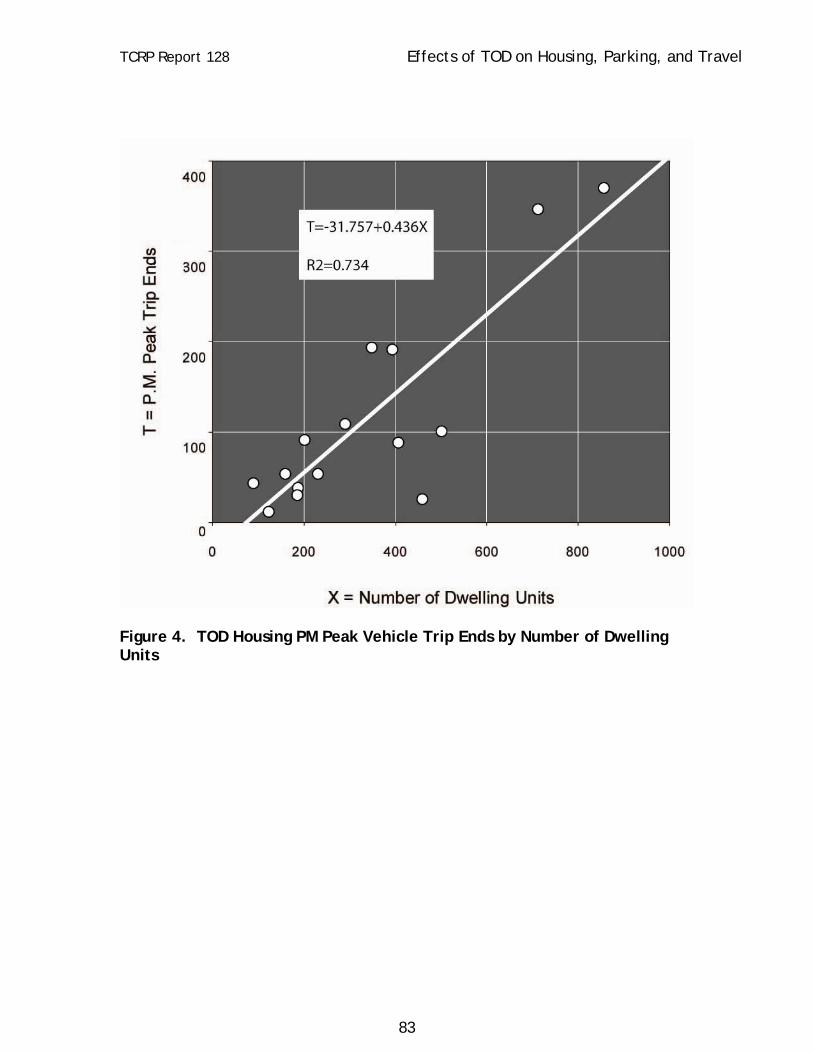
TCRP Report 128 Effects of TOD on Housing, Parking, and Travel
83
Figure 4. TOD Housing PM Peak Vehicle Trip Ends by Number of Dwelling Units
TCRP Report 128 Effects of TOD on Housing, Parking, and Travel
84
5. How Do Rates Vary? In order to better understand the nature of vehicle trip generation for TOD-housing projects, additional analyses were carried out that explored associations between trip generation and various explanatory variables. For ratio-scale variables, scatterplots and bivariate regression equations were estimated. Such analyses treat every observation the same, thus the cases are un-weighted. For those analyses with reasonably good statistical fits, cases were broken into subgroups and weighted average values are presented for each category. As suggested by Tables 2 through 4, presented previously, the greatest variations in TOD trip generation rates are by metropolitan area/rail systems. Metropolitan Washington, with among the nation’s worst traffic conditions, most extensive modern-day railway networks, and densest (and arguably best planned) TOD housing projects, had the lowest trip generation rates. This was followed by Metro Portland, whose comparatively low rates are all the more remarkable given that it is smaller than the other urbanized regions and has a less extensive light rail system that operates in mixed-traffic conditions. Average trip generation rates were slightly higher for Bay Area TODs than in Portland, and as noted earlier, were the highest for the Philadelphia and Northeast New Jersey cases, due in part to the nature of commuter rail services (focused mainly on peak periods). Below, TOD trip generation rates are examined as a function of: (1) Distance of project to CBD; (2) Distance of project to station; (3) Residential densities around station; and (4) Parking provisions. While relationships were explored for other variables as well, only these factors proved to be reasonably strong predictors. The analysis ends with best-fitting multiple regression equations for predicting trip generation rates of TOD-housing. Distance to CBD For the weekday period, a fairly weak relationship was found between TOD-housing trip generation rates and distance to the CBD. This is suggested by Figure 5 – rates were actually lower for projects more than 12 miles from the CBD than more intermediate-distance projects in the 6 to 12 mile range.33 During peak periods, however, relationships were stronger – rates increased
33 The >12 mile group is dominated by Bay Area cases – all five projects are more than 20 miles from downtown San Francisco.

TCRP Report 128 Effects of TOD on Housing, Parking, and Travel
85
with distance of a project from the CBD. Table 5 summarizes the bivariate results for predicting trip generation rates as well as “TOD rates as a proportion of ITE rates”. In all cases, vehicle trip generation rates tend to rise as one goes farther away from the urban core. The weakest fit was for the 24-hour period whereas the strongest was for the PM peak. The best fit was the prediction of the “TOD trip generation rate as a proportion of the ITE Rate” during the PM peak. That model, explained more than 38% of the variation in vehicle trip rates. The scatterplot shown in Figure 6 reveals a fairly good fit for this variable (based on the reasonably steep slope). Figure 5. Vehicle Trip Generation Rates by Distance to CBD: Comparisons of Weighted Averages for Weekday, AM Peak, and PM Peak
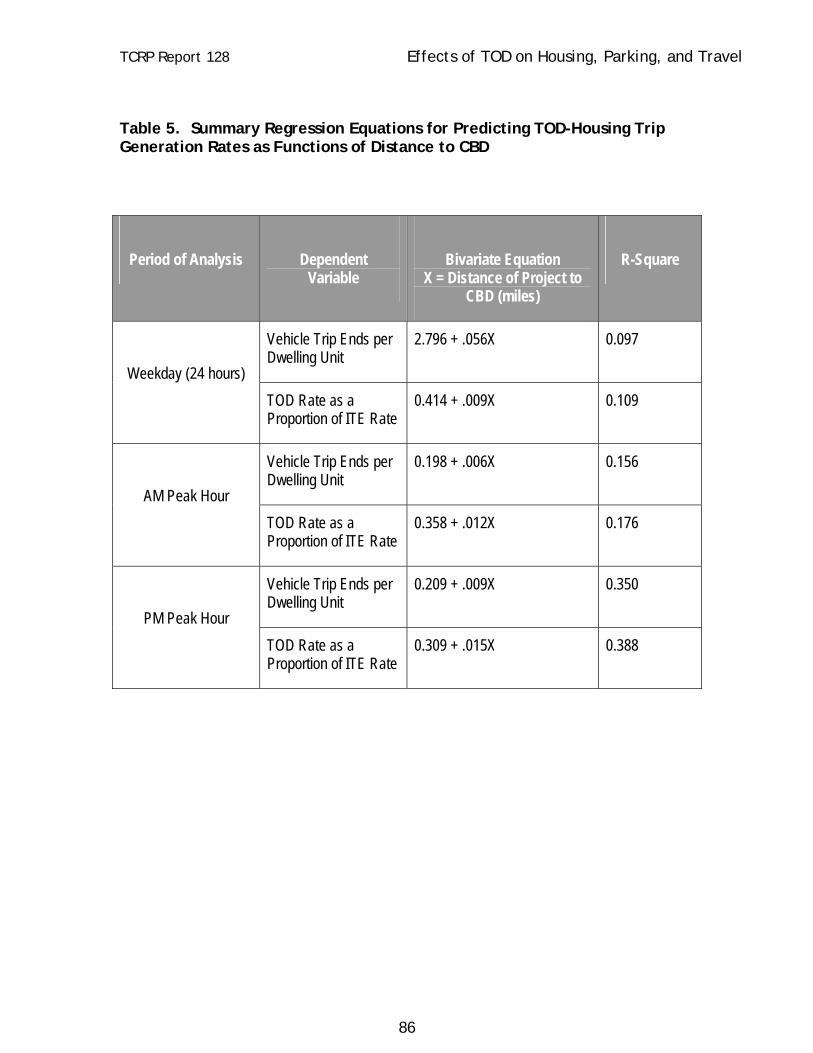
TCRP Report 128 Effects of TOD on Housing, Parking, and Travel
86
Table 5. Summary Regression Equations for Predicting TOD-Housing Trip Generation Rates as Functions of Distance to CBD
Period of Analysis
Dependent Variable
Bivariate Equation X = Distance of Project to
CBD (miles)
R-Square
Vehicle Trip Ends per Dwelling Unit
2.796 + .056X 0.097
Weekday (24 hours) TOD Rate as a Proportion of ITE Rate
0.414 + .009X 0.109
Vehicle Trip Ends per Dwelling Unit
0.198 + .006X 0.156
AM Peak Hour TOD Rate as a Proportion of ITE Rate
0.358 + .012X 0.176
Vehicle Trip Ends per Dwelling Unit
0.209 + .009X 0.350
PM Peak Hour TOD Rate as a Proportion of ITE Rate
0.309 + .015X 0.388
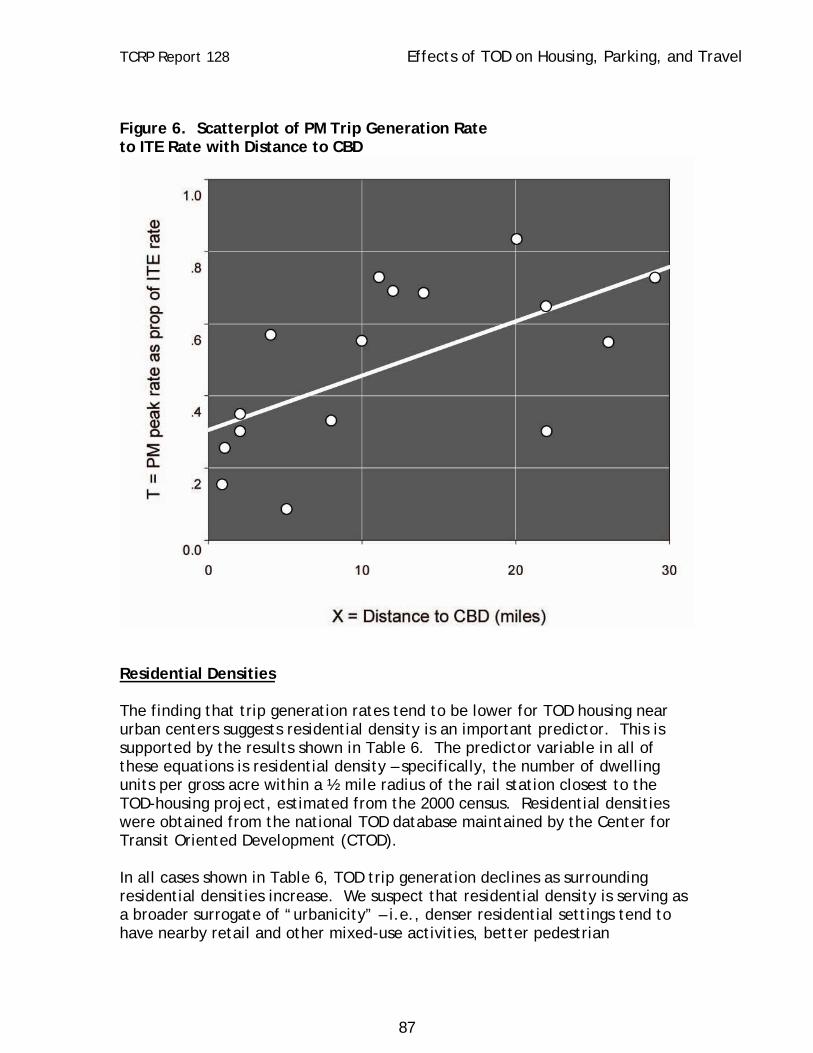
TCRP Report 128 Effects of TOD on Housing, Parking, and Travel
87
Figure 6. Scatterplot of PM Trip Generation Rate to ITE Rate with Distance to CBD
Residential Densities The finding that trip generation rates tend to be lower for TOD housing near urban centers suggests residential density is an important predictor. This is supported by the results shown in Table 6. The predictor variable in all of these equations is residential density – specifically, the number of dwelling units per gross acre within a ½ mile radius of the rail station closest to the TOD-housing project, estimated from the 2000 census. Residential densities were obtained from the national TOD database maintained by the Center for Transit Oriented Development (CTOD). In all cases shown in Table 6, TOD trip generation declines as surrounding residential densities increase. We suspect that residential density is serving as a broader surrogate of “urbanicity” – i.e., denser residential settings tend to have nearby retail and other mixed-use activities, better pedestrian

TCRP Report 128 Effects of TOD on Housing, Parking, and Travel
88
connectivity, and often a more socially engaging environment. Residential densities most strongly influenced PM trip generation rates among the sample of 17 TOD housing projects. Figure 7 shows the scatterplot of these two variables. Table 6. Summary Regression Equations for Predicting TOD-Housing Trip Generation Rates as Functions of Residential Densities (within ½ mile of stations)
Period of Analysis Dependent Variable
Bivariate Equation
X = Dwelling Units per
Gross Acre within ½ Mile of Station
R-Square
Vehicle Trip Ends per Dwelling Unit
5.369 - .211X 0.430
Weekday (24 hours) TOD Rate as a Proportion of ITE Rate
0.801 - .096X 0.424
Vehicle Trip Ends per Dwelling Unit
0.400 - .014X 0.276
AM Peak Hour TOD Rate as a Proportion of ITE Rate
0.731 - .026X 0.274
Vehicle Trip Ends per Dwelling Unit
0.493 - .019X 0.449
PM Peak Hour TOD Rate as a Proportion of ITE Rate
0.741 + .028X 0.423

TCRP Report 128 Effects of TOD on Housing, Parking, and Travel
89
Figure 7. Scatterplot of PM Trip Generation Rate with Residential Densities

TCRP Report 128 Effects of TOD on Housing, Parking, and Travel
90
TOD Parking Supplies Parking provisions are known to have a strong influence on travel behavior, particularly in suburban settings where most of the sample projects are located.34 Bivariate equations for predicting TOD-housing trip generation rates as a function of parking per dwelling unit are presented in Table 7. The relationships are weaker than that found for “Distance to CBD” and “Residential Densities”. Vehicle trip generation rates tend to be higher for TOD projects with more plentiful parking. The strongest fit was between AM peak trip generation and parking supply. Figure 8 presents the scatterplot of this relationship. Table 7. Summary Regression Equations for Predicting TOD-Housing Trip Generation Rates as Functions of Parking per Dwelling Unit
Period of Analysis Dependent Variable
Bivariate Equation
X = Parking Spaces per Dwelling Units
R-Square
Vehicle Trip Ends per Dwelling Unit
1.683 + 1.504X 0.158
Weekday (24 hours) TOD Rate as a Proportion of ITE Rate
0.258+ .221X 0.153
Vehicle Trip Ends per Dwelling Unit
0.098 + .145X 0.206
AM Peak Hour TOD Rate as a Proportion of ITE Rate
0.189 + .260X 0.202
Vehicle Trip Ends per Dwelling Unit
0.207 + .098X 0.088
PM Peak Hour TOD Rate as a Proportion of ITE Rate
0.325 + .140X 0.078
34 D. Shoup, 2005. The High Cost of Free Parking, Chicago: Planners Press; R. Willson, 1995, Suburban Parking Requirements: A Tacit Policy for Automobile Use and Sprawl, Journal of the American Planning Association, Vol. 61, No. 1, pp. 29-42.

TCRP Report 128 Effects of TOD on Housing, Parking, and Travel
91
Figure 8. Scatterplot of AM Trip Generation Rate with Parking Spaces per Dwelling Unit
The results in Table 7 and Figure 8 are unweighted by project size. Figure 9 compares average rates for three levels of parking supplies, weighted by project size. No clear pattern emerges from these weighted-average results, consistent with the fairly weak fits shown in Table 7. In general, trip generation rates were lower for TOD projects with intermediate levels of parking (1.0 to 1.15 spaces per dwelling unit). This was mainly an artifact of three of these projects being in metropolitan Washington, D.C.

TCRP Report 128 Effects of TOD on Housing, Parking, and Travel
92
Figure 9. Vehicle Trip Generation Rates by Parking Spaces per Dwelling Unit: Comparisons of Weighted Averages for Weekday, AM Peak, and PM Peak
Walking Distance to Station The relationship between TOD-housing trip generation and walking distance of the project to the nearest station was generally weaker than the other variables reviewed so far. Table 8 shows a positive slope for the explanatory variable, distance to station. This indicates that vehicle trip generation rates tend to be lower the closer a TOD-housing project is to a rail station. The relationships were thrown off, in part, by one Bay Area project – Mission Wells – that was situated beyond a half-mile of the nearest station. Figure 10 shows the weak scatterplot fit for the weekday (24 hour) estimate, with the Mission Wells observation (nearly 4000 feet from the station) standing out as an outlier. Dropping this single case provides an appreciably better fit, as revealed in Figure 11. As Table 8 indicates, the strongest linear pattern between TOD trip rate (as a proportion of the ITE rate) and distance to station was for the PM peak hour. Figure 12 shows this scatterplot. Retaining the Mission Wells observation, a slightly better fit was obtained using a quadratic equation of the form: T = 0.195 + 0.21X – 0.0000032X2 R2 = .195 where: T = TOD-housing PM trip rate as a proportion of ITE rate; and X = walking distance of project to nearest station (in 1000s of feet).
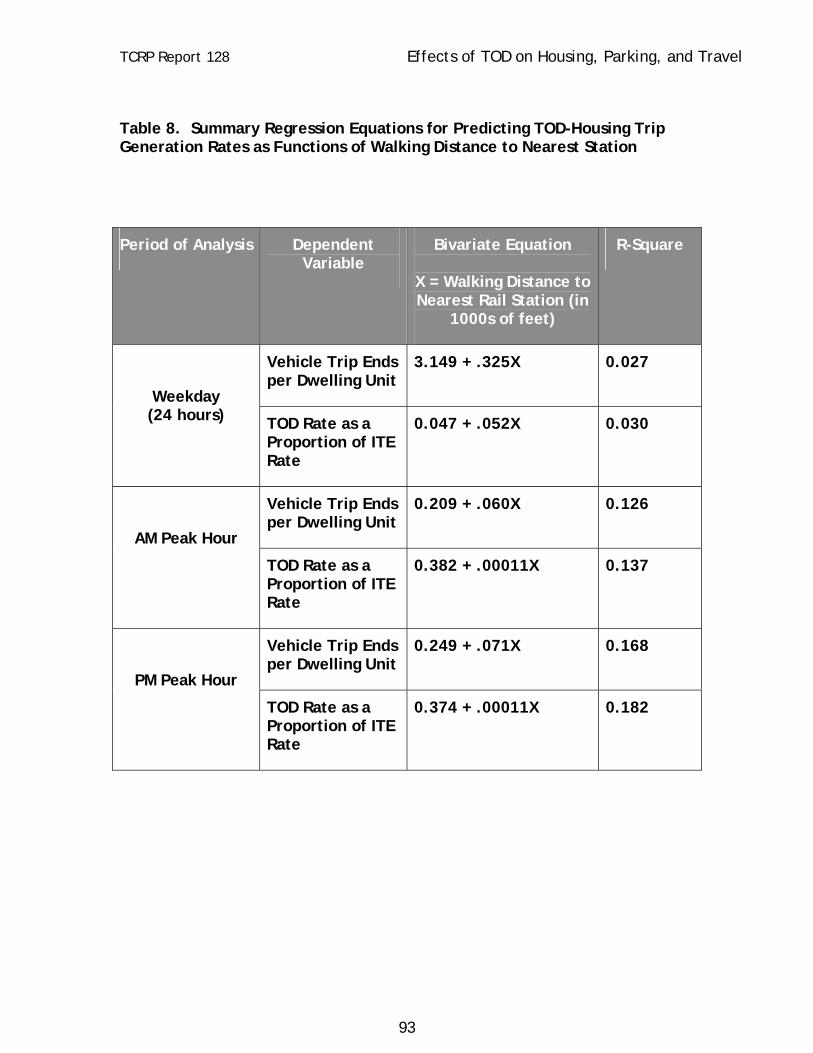
TCRP Report 128 Effects of TOD on Housing, Parking, and Travel
93
Table 8. Summary Regression Equations for Predicting TOD-Housing Trip Generation Rates as Functions of Walking Distance to Nearest Station
Period of Analysis Dependent Variable
Bivariate Equation
X = Walking Distance to Nearest Rail Station (in
1000s of feet)
R-Square
Vehicle Trip Ends per Dwelling Unit
3.149 + .325X 0.027
Weekday (24 hours) TOD Rate as a
Proportion of ITE Rate
0.047 + .052X 0.030
Vehicle Trip Ends per Dwelling Unit
0.209 + .060X 0.126
AM Peak Hour
TOD Rate as a Proportion of ITE Rate
0.382 + .00011X 0.137
Vehicle Trip Ends per Dwelling Unit
0.249 + .071X 0.168
PM Peak Hour
TOD Rate as a Proportion of ITE Rate
0.374 + .00011X 0.182
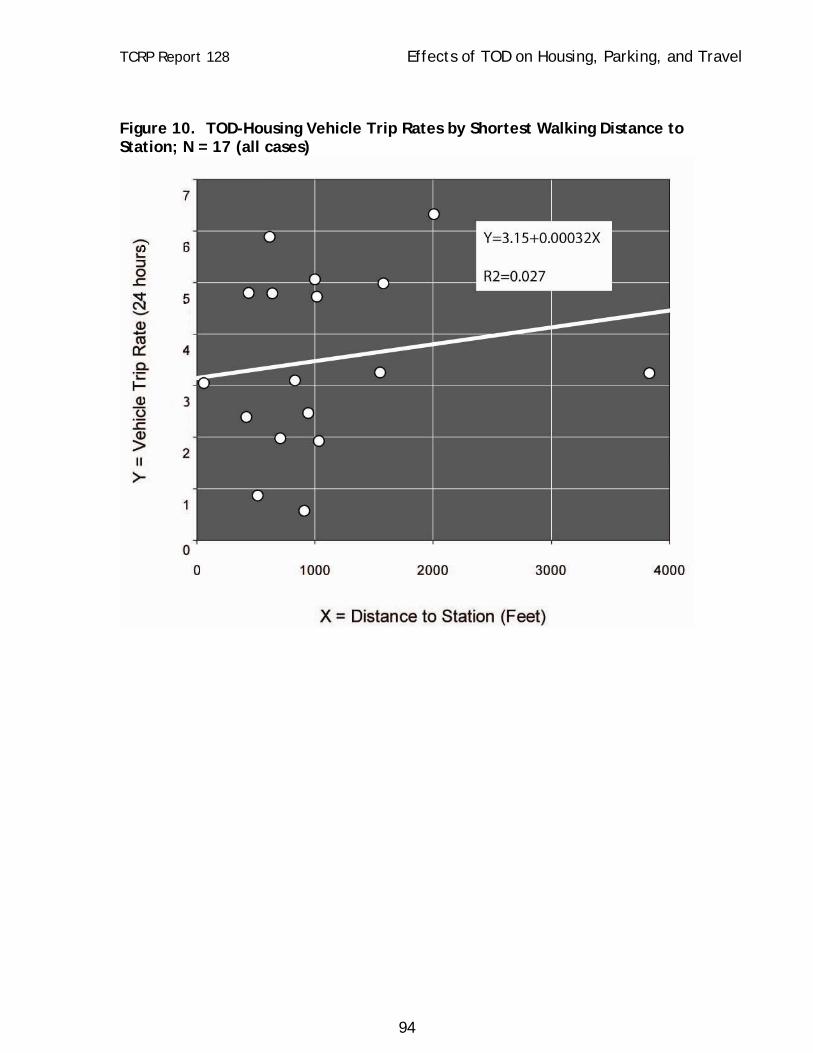
TCRP Report 128 Effects of TOD on Housing, Parking, and Travel
94
Figure 10. TOD-Housing Vehicle Trip Rates by Shortest Walking Distance to Station; N = 17 (all cases)
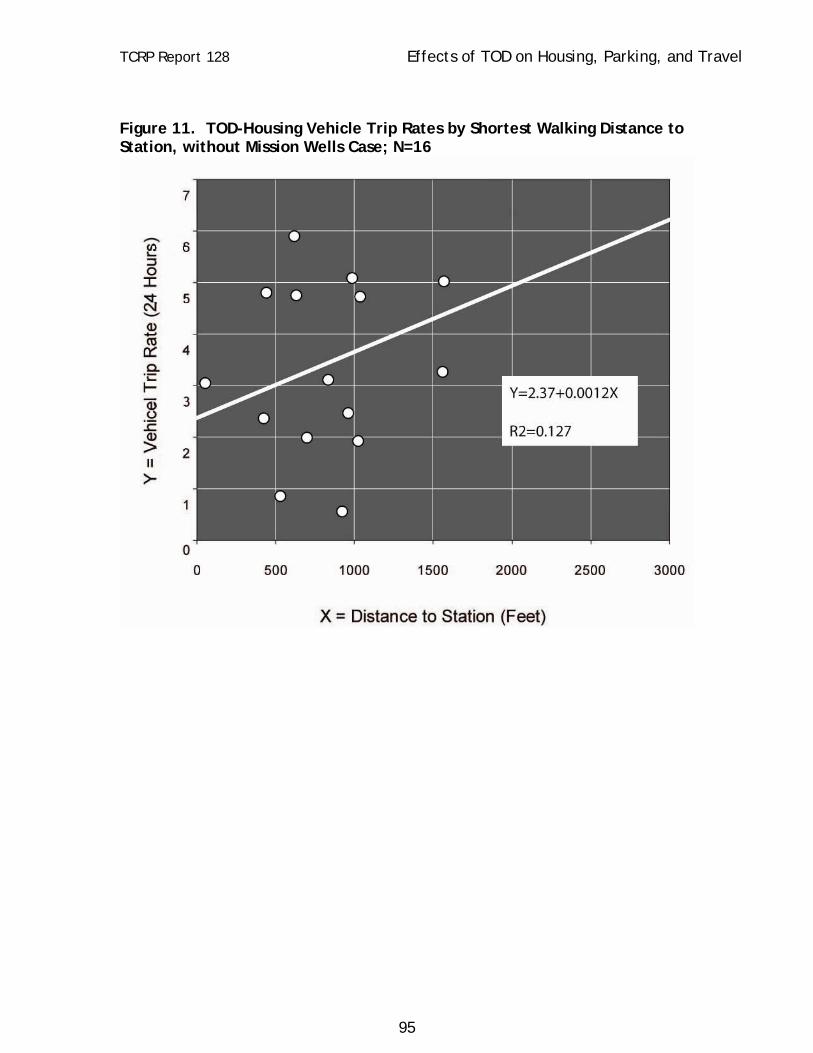
TCRP Report 128 Effects of TOD on Housing, Parking, and Travel
95
Figure 11. TOD-Housing Vehicle Trip Rates by Shortest Walking Distance to Station, without Mission Wells Case; N=16

TCRP Report 128 Effects of TOD on Housing, Parking, and Travel
96
Figure 12. TOD-Housing Vehicle Trip Rate (as a Proportion of ITE Rate) by Walking Distance to Station; Quadratic Curve; N=17
TCRP Report 128 Effects of TOD on Housing, Parking, and Travel
97
6. Multiple Regression Predictions of TOD-Housing Trip Generation Rates The previous section found modest to moderate relationships between TOD-housing trip generation rates and four variables: distance to CBD, residential density, parking per dwelling unit, and distance to station. In general, the bivariate relationships between TOD trip generation and other explanatory variables (such as compiled in the pedestrian survey and through the CTOD database) were very weak and statistically insignificant. This section presents multiple regression equation which combines explanatory variables to produce the best-fitting predictive models. These results provide insight into how other factors combine with proximity of multi-family housing to rail stations to influence vehicle trip generation rates. Weekday TOD Trip Generation Model The simple bivariate models shown in Table 6 provided the best fit for predicting weekday TOD trip generation rates (as well as rates as a proportion of the ITE rate). That is, once controlling for residential density around the station, none of the other variables - walking quality, parking supply, socio-demographic characteristics of the surrounding neighborhood – provided significant marginal explanatory power. Again, density is thought to function as a proxy for many of these factors. The finding that walking quality has little bearing on vehicle trip generation rate is also consistent with research findings from California.35 That work suggested the presence of an “indifference zone” – as long as most residents were within 5 or so minutes of a station, walking quality matters relatively little. The presence of an integrated sidewalk network, street trees, and various pedestrian amenities likely have more influence on longer-distance walking behavior than encountered by most TOD residents.
35 H. Lund, R. Cervero, and R. Willson, Travel Characteristics of Transit-Oriented Development in California, Oakland, California, CalTrans Transport Grant, January 2004.
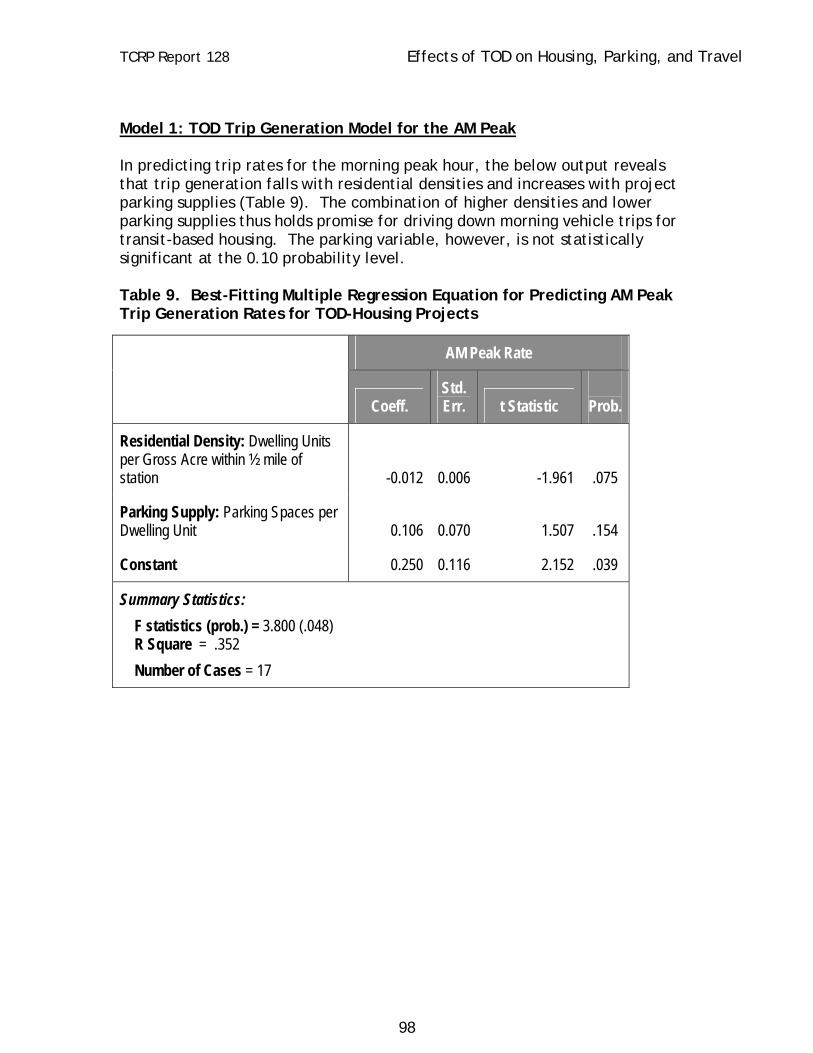
TCRP Report 128 Effects of TOD on Housing, Parking, and Travel
98
Model 1: TOD Trip Generation Model for the AM Peak In predicting trip rates for the morning peak hour, the below output reveals that trip generation falls with residential densities and increases with project parking supplies (Table 9). The combination of higher densities and lower parking supplies thus holds promise for driving down morning vehicle trips for transit-based housing. The parking variable, however, is not statistically significant at the 0.10 probability level. Table 9. Best-Fitting Multiple Regression Equation for Predicting AM Peak Trip Generation Rates for TOD-Housing Projects
AM Peak Rate
Coeff. Std. Err. t Statistic
Prob.
Residential Density: Dwelling Units per Gross Acre within ½ mile of station -0.012 0.006 -1.961 .075
Parking Supply: Parking Spaces per Dwelling Unit 0.106 0.070 1.507 .154
Constant 0.250 0.116 2.152 .039
Summary Statistics: F statistics (prob.) = 3.800 (.048) R Square = .352 Number of Cases = 17

TCRP Report 128 Effects of TOD on Housing, Parking, and Travel
99
Model 2: TOD Trip Generation Model for AM Peak (as a Proportion of ITE Rate) Comparable results were found for predicting AM Peak Rates as a proportion of the ITE rate (Table 10). Table 10. Best-Fitting Multiple Regression Equation for Predicting A.M. Peak Trip Generation Rates as a Proportion of ITE Rate for TOD-Housing Projects
AM Peak Rate
Coeff. Std. Err. t Statistic Prob.
Residential Density: Dwelling Units per Gross Acre within ½ mile of station -0.021 0.011 -1.948 .072
Parking Supply: Parking Spaces per Dwelling Unit 0.189 0.128 1.484 .160
Constant 0.462 0.210 2.196 .045
Summary Statistics: F statistics (prob.) = 4.154 (.038) R Square = .372 Number of Cases = 17

TCRP Report 128 Effects of TOD on Housing, Parking, and Travel
100
Model 3: TOD Trip Generation Model for the PM Peak A better fitting model was obtained for predicting TOD trip generation in the afternoon peak (Table 11). The results, which explained 60% of the variation in PM trip rates, reveal that vehicle travel in the afternoon rises with distance to the CBD and falls with both residential density and household size. Table 11. Best-Fitting Multiple Regression Equation for Predicting AM Peak Trip Generation Rates for TOD-Housing Projects
AM Peak Rate
Coeff. Std. Err. t Statistic Prob.
Distance to CBD (in miles) 0.007 0.003 2.145 .051
Residential Density: Dwelling Units per Gross Acre within ½ mile of station -0.018 0.006 -2.846 .014
Household Size: Persons per Dwelling Unit within ½ mile of station -0.103 0.074 -1.390 .188
Constant 0.608 0.182 3.346 .005
Summary Statistics: F statistics (prob.) = 6.497 (.006) R Square = .600 Number of Cases = 17
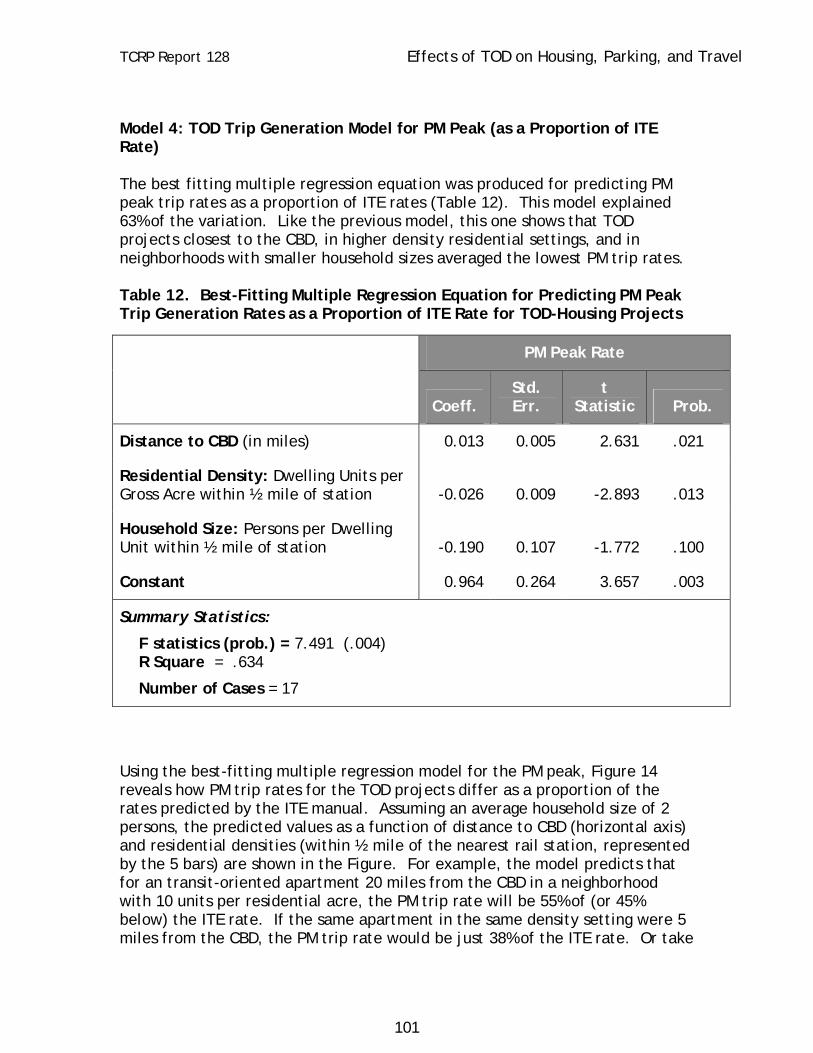
TCRP Report 128 Effects of TOD on Housing, Parking, and Travel
101
Model 4: TOD Trip Generation Model for PM Peak (as a Proportion of ITE Rate) The best fitting multiple regression equation was produced for predicting PM peak trip rates as a proportion of ITE rates (Table 12). This model explained 63% of the variation. Like the previous model, this one shows that TOD projects closest to the CBD, in higher density residential settings, and in neighborhoods with smaller household sizes averaged the lowest PM trip rates. Table 12. Best-Fitting Multiple Regression Equation for Predicting PM Peak Trip Generation Rates as a Proportion of ITE Rate for TOD-Housing Projects
Using the best-fitting multiple regression model for the PM peak, Figure 14 reveals how PM trip rates for the TOD projects differ as a proportion of the rates predicted by the ITE manual. Assuming an average household size of 2 persons, the predicted values as a function of distance to CBD (horizontal axis) and residential densities (within ½ mile of the nearest rail station, represented by the 5 bars) are shown in the Figure. For example, the model predicts that for an transit-oriented apartment 20 miles from the CBD in a neighborhood with 10 units per residential acre, the PM trip rate will be 55% of (or 45% below) the ITE rate. If the same apartment in the same density setting were 5 miles from the CBD, the PM trip rate would be just 38% of the ITE rate. Or take
PM Peak Rate
Coeff. Std. Err.
t Statistic Prob.
Distance to CBD (in miles) 0.013 0.005 2.631 .021
Residential Density: Dwelling Units per Gross Acre within ½ mile of station -0.026 0.009 -2.893 .013
Household Size: Persons per Dwelling Unit within ½ mile of station -0.190 0.107 -1.772 .100
Constant 0.964 0.264 3.657 .003
Summary Statistics:
F statistics (prob.) = 7.491 (.004) R Square = .634
Number of Cases = 17

TCRP Report 128 Effects of TOD on Housing, Parking, and Travel
102
another example. For two transit-oriented apartments 10 miles from the CBD, if the surrounding residential densities are 10 units per acre, the PM trip rate will be 45% of the ITE manual’s rate. And if the surrounding densities are 20 units per acre, they will be just 20% of the rate or 80% lower. Figure 14. Influences of Residential Densities and Distance to CBD on Transit-Oriented Housing PM Trip Rate as a Proportion of the ITE Rate
TCRP Report 128 Effects of TOD on Housing, Parking, and Travel
103
7. Applying the Research: Four TOD Housing Case Studies This section takes a look at some of the physical implications of varying residential parking by analyzing four TOD case studies designed with two different parking ratios. Using four different representative TOD residential development products, the analysis provides a glimpse at how changing the provision of parking within a TOD can have an impact in terms of factors such as improving physical form, increasing the density of potential development, lowering the capital cost for parking, enhancing the financial viability of TODs, and increasing transit ridership. Building TOD Case Studies As an input to this part of the research, TOD master planners from PB PlaceMaking were asked to prepare alternative site plans for an eight-acre residential TOD. Parking ratios were varied between the alternatives – one reflected conventional ratios in many existing TODs and one tested tighter ratios more consistent with the results of this research. The site plans were prepared for four different representative TOD residential development products (garden apartments, townhomes, a “Texas Donut”36 and mid-rise housing) for a total of eight different site plans. The potential development types tested were selected because they are indicative of the residential development products found in a number of US TODs. The potential development types are also reflective of the range of built products included in the field research for this study. The site plans ranged in density from 24 to 120 units per acre. In choosing what parking ratios to test in the site plans there are no clear national standards to refer to for parking TODs. To guide the analysis, a quick survey of parking ratios in adopted station area plans was conducted. The review revealed a considerable range of latitude in how TODs are parked. For the case studies, parking ratios were selected from two different TOD zoning ordinances for station areas on the Washington Metrorail: one in Maryland; and one in Virginia. The “TOD 1” ratio of 1.1 parking spaces per unit (one space per
36 A “Texas Donut refers to a parking structure surrounded by usable residential space. In an article in Places Brian O’Looney and Neal Payton describe Texas Donuts as unadorned parking decks bordered on two sides by a 10-15 foot zone for open ventilation, and wrapped on all four sides by 35-40 foot deep four-story wood-frame liner residential buildings. http://repositories.cdlib.org/cgi/viewcontent.cgi?article=1998&context=ced/places

TCRP Report 128 Effects of TOD on Housing, Parking, and Travel
104
unit and 1 visitor space for every ten units) is consistent with how Arlington County Virginia parks high density TOD in the Rosslyn-Ballston Corridor on the Orange Line.37 The “TOD 2” ratio is 2.2 parking spaces per unit (two spaces per unit and 1 visitor space for every five units) and is consistent with how Prince Georges’ County Maryland parks high density TOD for the West Hyattsville TOD on the Green Line.38 To allow for an apple to apples comparison, the underlying assumptions were held constant for each of the potential development products even though in a real word example they would be expected to vary somewhat to respond to unique site conditions. In each case study the unit size was assumed to be 910 square feet net or 1200 square feet gross. This provides for a mix of unit sizes (1, 2 and 3 bedroom units) within the project. Parking is assumed to consume 300 square feet per space allowing for aisles and landscaping. While it is understood that parking ratios vary considerably across the United States these ratios provide a means to help isolate the impacts of parking ratios on urban form. The parking ratios tested in the site plans was 2.2 spaces per unit and 1.1 spaces per unit.
37 U.S. Environmental Protection Agency, Parking Spaces / Community Places: Finding the Balance through Smart Growth Solutions, Washington, D.C. January 2006
38 Prince Georges County Planning Department, Approved West Hyattsville Transit District Development Plan and TDOZMA for the Transit District Overlay Zone, Marlboro, MD, July 2006
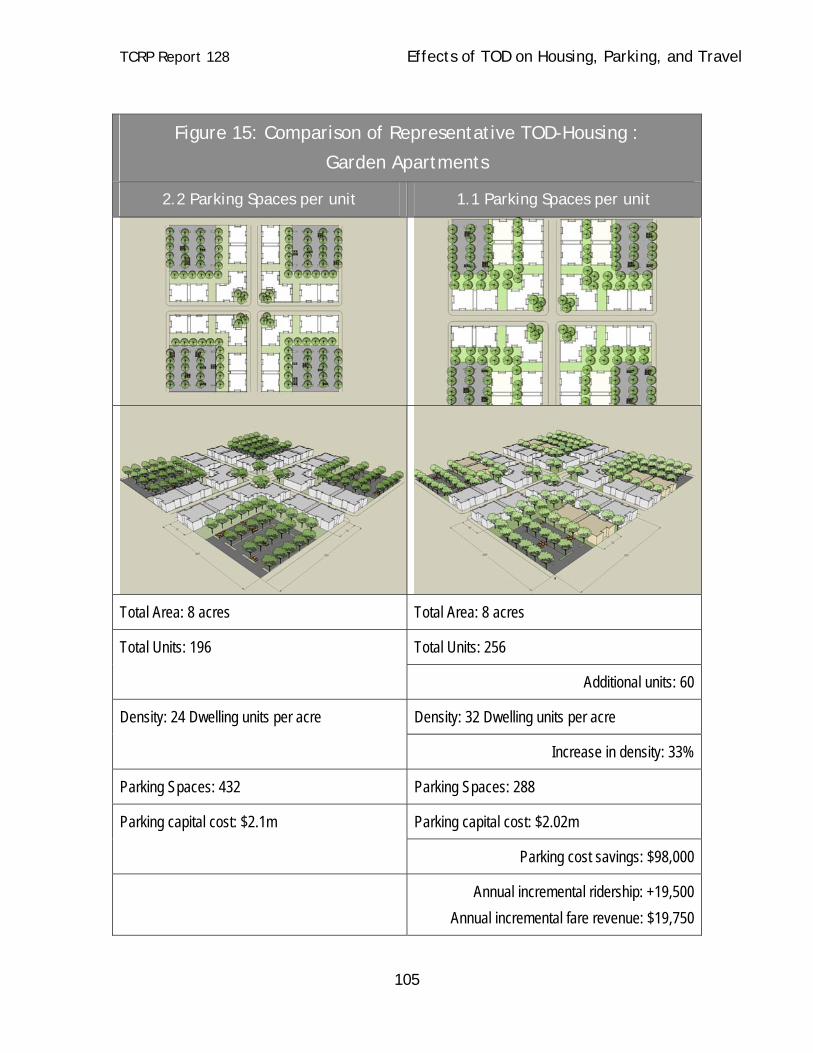
TCRP Report 128 Effects of TOD on Housing, Parking, and Travel
105
Figure 15: Comparison of Representative TOD-Housing :
Garden Apartments
2.2 Parking Spaces per unit 1.1 Parking Spaces per unit
Total Area: 8 acres Total Area: 8 acres
Total Units: 256 Total Units: 196
Additional units: 60
Density: 32 Dwelling units per acre Density: 24 Dwelling units per acre
Increase in density: 33%
Parking Spaces: 432 Parking Spaces: 288
Parking capital cost: $2.02m Parking capital cost: $2.1m
Parking cost savings: $98,000
Annual incremental ridership: +19,500 Annual incremental fare revenue: $19,750

TCRP Report 128 Effects of TOD on Housing, Parking, and Travel
106
Figure 16: Comparison of Representataive TOD-Housing : Townhomes
2.2 Parking Spaces per unit 1.1 Parking Spaces per unit
Total Area: 8 acres Total Area: 8 acres
Total Units: 384 Total Units: 288
Additional units: 96
Density: 48 Dwelling units per acre Density: 36 Dwelling units per acre
Increase in density: 33%
Parking Spaces: 648 Parking Spaces: 448
Parking capital cost: $5.82m Parking capital cost: $6.56m
Parking cost savings: $736,000
Annual incremental ridership: +31,200 Annual incremental fare revenue: $31,600

TCRP Report 128 Effects of TOD on Housing, Parking, and Travel
107
Figure 17: Comparison of Representative TOD-Housing :
Mid-Rise 6-Story
2.2 Parking Spaces per unit 1.1 Parking Spaces per unit
Total Area: 8 acres Total Area: 8 acres
Total Units: 963 Total Units: 801
Additional units: 162
Density: 120 Dwelling units per acre Density: 100 Dwelling units per acre
Increase in density: 20%
Parking Spaces: 1800 Parking Spaces: 1152
Parking capital cost: $21.31m Parking capital cost: $33.3m
Parking cost savings: $12m
Annual incremental ridership: +52,650 Annual incremental fare revenue: $53,330
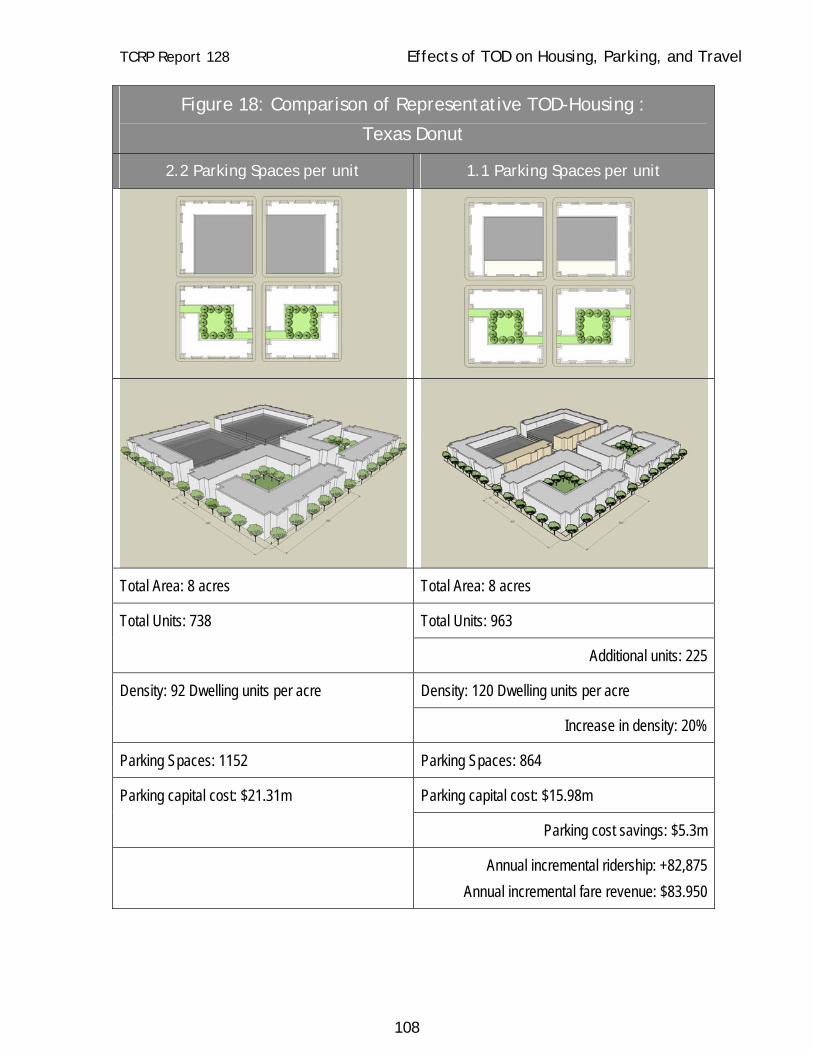
TCRP Report 128 Effects of TOD on Housing, Parking, and Travel
108
Figure 18: Comparison of Representative TOD-Housing :
Texas Donut
2.2 Parking Spaces per unit 1.1 Parking Spaces per unit
Total Area: 8 acres Total Area: 8 acres
Total Units: 963 Total Units: 738
Additional units: 225
Density: 120 Dwelling units per acre Density: 92 Dwelling units per acre
Increase in density: 20%
Parking Spaces: 1152 Parking Spaces: 864
Parking capital cost: $15.98m Parking capital cost: $21.31m
Parking cost savings: $5.3m
Annual incremental ridership: +82,875 Annual incremental fare revenue: $83.950

TCRP Report 128 Effects of TOD on Housing, Parking, and Travel
109
Table 13. Summary of Analysis for Potential TOD-Housing Site Plan Case Studies: Impact of Lower TOD Parking Ratios
Units Density Parking
Total Additional Per acre
% increase
Spaces Cost Difference
Annual Incremental Ridership
Garden Apartments
TOD 1 ratio
256 +60 units
32 +33% 288 $2.02m
TOD 2 ratio
196 24 432 $2.1m
$98,000 savings
19,500 transit trips
$19,750 fares
Townhomes
TOD 1 ratio
384 +96 units
48 + 33% 448 $5.82m
TOD 2 ratio
288 36 648 $6.56m
$736,000 savings
31,200 transit trips
$31,600 fares
Mid Rise 6-Story
TOD 1 ratio
963 +162 units
120 +20% 1152 $21.31M
TOD 2 ratio
801 100 1800 $33.3m
$12 million
savings
52,650 transit trips
$53,330 fares
Texas Donut
TOD 1 ratio
963 +225 units
120 +30% 1152 $21.31m
TOD 2 ratio
738 92 864 $15.98m
$5.3 million
savings
82,875 transit trips
$83,950 fares
Assumptions: Parking ratios: TOD 1 - 1.1 spaces per unit; TOD 2 - 2.2 spaces per unit Cost per space: surface parking $7,000; tuck under parking $14,000; structured parking $18,500 Transit ridership: 3.55 trips per TOD household allocated as follows: 1.5 work trips per TOD HH * TOD units * .40 TOD work mode share + 4 non-work trips per TOD HH * TOD units * .10 TOD non-work mode share. (Lund et al) = daily ridership x 325 annualization factor = annual incremental increase in ridership. Fare revenue: assumes average fare of $1.013 TriMet March 2008 Month Performance Report, year-to-date Average Fare, April 2008

TCRP Report 128 Effects of TOD on Housing, Parking, and Travel
110
TCRP Report 128 Effects of TOD on Housing, Parking, and Travel
111
Learning from the Case Studies The representative site plans (Figures 14 - 17) help to illustrate some of the potential implications for TOD-housing of how adjusting parking ratios reflect the actual transportation performance of TODs in terms of form, density, and performance. Varying parking ratios and holding other factors constant suggests a number of important differences in what could ultimately be constructed on our eight-acre theoretical TOD. Table 13 provides a summary of some of the quantifiable differences in density, cost and ridership from varying parking ratios for the potential residential TOD products analyzed in the case studies. Those differences include:
A 20 to 33% increase in the number of potential units in a TOD. As might be expected, a lower parking ratio results in less land being used for parking which can in turn be used for development. In the four case studies, the yield in potential additional residential units made possible from lower parking ratios ranged from an increase of between 20 to 33%.
The case studies show how the two ratios tested result in significantly different density being achieved on a site. The most pronounced increase in potential units on a percentage basis was seen with the lower density garden apartment and townhome examples. This is because with these development products, all of the parking is with surface spaces. Reducing parking from 2.2 to 1.1 spaces per unit resulted in the ability to increase the potential number of units on the site by 33% for both the garden apartments and townhomes. The greatest absolute increase in the number of units was achieved by lowering the parking ratios for the higher density products, the Texas Donut and the mid-rise building.
Lower total construction costs for parking even with more residential units. Parking in any form is expensive to build. Reducing the amount of parking required in a TOD by right-sizing parking as suggested by the results of this research can be important to the economic viability of a TOD. To help understand the cost implications of parking, a review of 2007 parking costs was completed39. The review shows just how expensive parking can be. Surface parking spaces can cost from $5,000 per space for low-end asphalt to $10,000 with details like cobbles and brick pavers. Parking tucked under a townhome can cost about $14,000 a space. In dense conventional multi-family development such as the Texas Donut or mid-rise buildings open undecorated parking decks cost anywhere from $17 - $20,000 per space. If the parking deck is to be incorporated into the urban fabric of a community the cost of a special feature like a retail wrap or an enhanced façade typically pushes the cost of a space to around $28-$32,000.
39 Parking cost information provided by Garland Stewart, C.P.E. Manager, Atlanta Estimating Group of Parsons Brinkerhoff, December 2007

TCRP Report 128 Effects of TOD on Housing, Parking, and Travel
112
Table 14: Impact of Lower TOD Parking Ratios
Units Gained Spaces Saved Capital Cost Savings
Garden Apartments
60 144 $98,000 5%
Townhomes 96 200 $736,000 11%
Mid Rise 6-Story 162 648 $12,000,000 36%
Texas Donut 225 288 $5,300,000 25%
As the site plan studies help demonstrate, using tighter parking ratios can be a key driver in the capital cost of TODs. The cost savings were most pronounced with the higher density development prototypes (mid-rise and Texas Donut) where structured parking is employed. In these examples the savings in reducing parking ranged from 25 to 36%. For the lower density examples the parking savings was in the order of between 5 and 11%depending on the development product. The real significance of the parking capital cost numbers indicated in the case studies is to understand the numbers are not simply an apple to apples comparison of reducing the parking by half. As the case study shows a reduction in parking also results in an increase in the number of potential units on the site (which need to be parked) by 20 to 33% (see Table 14). With the mid-rise case study, for example, an additional 162 units could be built and still result in a developer saving approximately $12 million in the cost of parking. In this instance reducing the parking ratio by 50% resulted in a capital cost savings of 25% for parking while also increasing the number of residential units by 20%.
Higher transit ridership. Increasing the potential number of residential units in a TOD can also be expected to increase transit ridership. The actual increase in ridership can be expected to vary considerably depending on local conditions. Drawing on the body of existing research summarized in the Literature Review it is possible to make some crude preliminary assessments of the ridership implications of increasing the potential density in a TOD40. As one might expect the incremental ridership benefit increases proportionally to the number of additional units.
40 Transit ridership was estimated consistently for each of the case studies: drawings on the field research 3.55 trips were assumed for each TOD household. Transit ridership: 3.55 trips per TOD household allocated as follows: 1.5 work trips per TOD HH * TOD units * .40 TOD work mode share + 4 non-work trips per TOD HH * TOD units * .10 TOD non-work mode share. (Lund et al) = daily ridership x 325 annualization factor = the annual incremental increase in ridership attributable to changes in parking ratios. Because the mode share factors are specifically for TODs, no additional adjustments were made for changes in density or automobile ownership.

TCRP Report 128 Effects of TOD on Housing, Parking, and Travel
113
The additional annual transit ridership which might be attributable from the potential units made possible by lowering parking ratios is summarized in Table 15.
Table 15: Impact of Lower TOD Parking Ratios
Additional Units Annual Incremental Ridership
Annual Incremental Fare Revenues
Garden Apartments
+60 units 19,500 transit trips $19,750
Townhomes +96 units 31,200 transit trips $31,600
Mid Rise 6-Story +162 units 52,650 transit trips $53,330
Texas Donut +225 units 82,875 transit trips $83,950
Parking and the financial feasibility of TODs. Apart from the impacts on the physical form of a TOD the shear amount and cost of parking can be a driver in the financial viability of a proposed TOD and in turn the financial return to a developer. As was discussed earlier, lowering parking ratios can impact the financial viability of a TOD in a number of ways. In particular lower capital costs for parking and a greater yield of units on a site could be expected to result in more TOD projects being financially viable since a developer would be able to potentially increase the number of units on a site while at the same time reduce the capital cost for parking. With land cost constituting a growing percentage of housing prices, potentially increasing the number of units on a particular site can play an increasingly important role in the financial viability of a TOD. A 2006 Federal Reserve study shows the growing impact of land on housing prices. Averaging across the 46 largest US cities, the value of residential land accounted for about 50 percent of the total market value of housing, up from 32 percent in 1984 according the study.41
Parking and urban form. Creating an active pedestrian environment is a core principle
and an essential characteristic of well planned TODs. For TOD designers that means creating as many active street edges (lining streets with people oriented uses) as possible. The TOD site plans help to demonstrate the impact different parking ratios can have on creating an active pedestrian environment. The result is most noticeable with the moderate density garden apartment example where surface parking is employed. With the 2.2 parking ratio approximately 50% of the “street edge” is
41 Davis, Morris A. and Palumbo, Michael, "The Price of Residential Land in Large U.S. Cities" (June 2006). FEDS Working Paper No. 2006-26 Available at SSRN: http://ssrn.com/abstract=943771

TCRP Report 128 Effects of TOD on Housing, Parking, and Travel
114
dominated by parking. With the 1.1 parking ratio the amount of the street edge taken by parking decreases by half to 25% of the total site street edge.
8. Implications of Applying New Standards for TOD-Housing The research findings and literature review provides solid evidence to support the belief that people living in TODs drive less often than their neighbors in conventional developments. Based on this evidence, public officials and government regulators may chose to develop new, more realistic standards for parking, assessing impact fees and mitigation for TODs. The research suggests important implications are likely to flow from permitting and developing TODs based on an accurate assessment of their parking needs and trip generation. Some of the likely consequences of permitting and building TOD consistent with the findings of this research include: More compact development. As the site plan case studies help to demonstrate, more compact environmentally sustainable development can result from less land being consumed for parking. The case studies showed an increase in density for residential TOD of 20 to 33% could be achieved. This tracks well with U.S. EPA estimates that each on-site parking space in infill locations can reduce the number of new housing units or other uses by 25 percent or more.42 It must be noted that the ability to increase density should not necessarily translate to the higher density in all cases. Parking and trip generation are only two variables of many in the very complex issue of increasing density. Easier development approvals. One of the major challenges developers face with TOD is the increased time and expense of getting development approvals for infill development because of inevitable neighborhood concerns about traffic. Interviews with TOD developers43 reveal an interesting cycle which plays itself out over and over in response to community concerns about the traffic impacts of new development. One way to explain the sequence is in a five act TOD morality play:
1. Act One “vision”: Planners, citizens and smart growth advocates secure adoption of a compact transit village plan allowing compact dense residential development around a rail station.
2. Act Two “optimism”: Time passes and a progressive developer presents the local community a proposal for a dense TOD allowed under the transit village plan.
42 U.S. Environmental Protection Agency, January 2006
43 Parsons Brinckerhoff. Factors for Success in California’s Transit-Oriented Development. Sacramento: California Department of Transportation, Statewide Transit-Oriented Development Study. 2002
TCRP Report 128 Effects of TOD on Housing, Parking, and Travel
115
3. Act Three “opposition”: Community members concerns about change inevitably focus on perceived traffic impacts and overflow parking from the dense TOD development.
4. Act Four “compromise”: The developer offers to cut the density below transit supportive levels in the adopted plan and increase the parking in order to get a development approval and recover his fixed costs.
5. Act Five “The lesson”: Many of the hoped for community benefits of TOD at the rail station and the financial return to the developer are not realized because the development is built below the allowed density with increased parking, and the developer may be less apt to pursue TOD.
Getting new information on the performance of TODs out into the field may help to break this cycle of compromising away the benefits of TOD. Local officials and neighborhoods may be more apt to support increases in residential densities near transit if they are shown proof that up to half of the trips result from TODs than in conventional development. Using a 700-unit California condominium project as a reference point, the expected daily traffic rates would be reduced by as much as half with a likely number of 2350 trips with the TOD traffic generation rates rather than 4700 daily trips using the ITE rates.44 Lower fees for TODs. Applying new standards trip generation could result in wholesale changes in how we address the cost, impact and feasibility of residential development near transit. The implications of new standards are varied and would need to be scaled to the quality of transit service present. Developers would likely pay lower fees and exactions by as much as 50% to reflect the actual performance of residential TODs. Those savings could be passed on to homeowners and tenants in the form of lower housing costs. For instance, that same 700-unit condominium development could see its traffic impact fee reduced by half—from $4,500 per unit to $2,250 per unit—if it were based on the likely traffic generation of a TOD rather than the ITE rates. In this case, the developer would save $1.6 million—presumably making the units more affordable. Downsizing new road construction. Traffic based impact fees are used to help fund intersection and roadway improvements such as street widening. The same mathematical equations which result in over-charging impact fees for TODs also can result in over-building road facilities to serve TODs. With lower levels of traffic being generated from TODs it can be argued it makes no sense to construct roadway improvements to serve TOD related traffic that is likely not to materialize. Right-sizing new road and intersection improvements to reflect the actual transportation performance can result in more compact development patterns and a higher quality pedestrian environment since less land may be used for road improvements.
44 Estimate based City of West Sacramento impact fees. Email from Shanna Zuspan, West Sacramento Redevelopment Agency, November 5, 2007
TCRP Report 128 Effects of TOD on Housing, Parking, and Travel
116
Enhanced housing affordability. Housing affordability is one of the areas where the research may have significant implications. Housing affordability is driven by a myriad of factors. With land costs constituting 50 percent of the total market value of housing, the TOD site plan case studies suggest reducing parking ratios to reflect the transportation performance of TODs can also have the additional benefit of increasing the number of housing units on the same piece of land by between 20 and 33% which can translate into lower housing costs. 45 The TOD housing affordability connection has received attention from some housing advocates because automobile ownership is one of a household’s largest expenses, second only to the cost of housing.46 The poorest families spend the greatest share of their income on transportation.47 Instead of paying a quarter or a third of their income for housing, low-income families sometimes pay half or even more for a place to live. Reducing transportation expenditures by living in TODs can free-up disposable income to be used for other uses such as housing.
9. Conclusions and Recommendations This research helps confirm what had been intuitively obvious: TOD-housing produced considerably less traffic than is generated by conventional development. Yet most TODs are parked on the assumption that there is little difference between TOD and conventional development with respect to the traffic they generate. One likely result of this fallacious assumption is that fewer TOD projects get built. Those TOD developments that do get built are certainly less affordable and less sustainable than they might be, because they are subject to incorrect assumptions about the traffic impact they generate. Therefore many of the hoped for benefits (less time stuck in traffic and lower housing costs to name two) from nearly $75 billion in public dollars invested in rail transit48 over the past 11 years are not being realized. One end result is that auto trip generation is likely to be overstated for TODs. This can mean that TOD developers end up paying higher impact fees, proffers, and exactions than they should since such charges are usually tied to ITE rates. Another implication of the research is that parking ratios for residential TODs are also likely to be overstated for TODs by the same
45 Davis, Morris A. and Palumbo, Michael, 2006
46 According to the Bureau of Transportation Statistics, in 1998 the average household spent 33 percent of its income on housing and 19 percent on transportation (Only 6 percent of transportation spending went toward travel by air, taxi, and public transportation). Food related expenditures come in third, at 14 percent. Bureau of Transportation Statistics. 2000. Pocket Guide to Transportation. U. S. Department of Transportation, BTS00-08.
47 http://www.transact.org/Progress/jan01/table.htm
48 Email from John Neff Senior Policy Researcher, American Public Transportation Association, October 26, 2007
TCRP Report 128 Effects of TOD on Housing, Parking, and Travel
117
order of magnitude since they are also based on ITE data. More research on parking generation will be needed to confirm whether TOD residents own cars at the same rate as conventional development, but use them less. Some of the cumulative impacts of over-parking TODs are illustrated in the site plan case studies. The TOD site plan case studies help to demonstrate that under the right conditions lowering residential parking ratios by 50% for TODs in station areas with quality transit service can result in:
An increase in the density of a residential TOD by between 20 to 33% depending on the residential building type;
Savings on residential parking costs ranging from 5 to 36% after accounting for increases in the number units to be parked resulting from increased residential density, and;
Potentially greater developer profits and/or increased housing affordability coming from achieving higher densities, lower capital costs for parking, and reduced traffic impact fees.
Right-sizing parking ratios and traffic generation to the actual performance of TOD is likely to result in some important implications on the physical form and performance of TOD developments:
Local officials and neighborhoods may be more apt to support increases in residential densities near transit if they are shown proof fewer trips result from TODs than in conventional development.
TOD developers would likely pay lower traffic related impact fees and exactions. Those savings can be passed on to consumers in the form of lower housing costs.
With lower levels of traffic being generated from TODs it can be argued it simply makes sense no to construct roadway improvements for TOD related traffic that is likely not to materialize.
Right-sizing new road and intersection improvements to reflect the actual transportation performance can result in more compact development patterns and a higher quality pedestrian environment since less land may be used for road improvements.
Clear policy directions fall out of this research. The appreciably lower trip generation rates of transit-oriented housing projects call for adjustments in the measurement of traffic impacts. For peak periods (that often govern the design of roads and highways), this research shows transit-oriented apartments average around one half the norm of vehicle trips per dwelling unit. The rates varied, however, from 70%-90% lower for projects near downtown to 15% to 25% lower for complexes in low-density suburbs. Regardless, smart growth needs smart calculus – those who build projects that reduce trips should be rewarded in the form of reduced traffic impact fees and exactions. The expectation is developers would pass on some of the cost savings to tenants, thus making housing more affordable near rail stations. To date, few jurisdictions have introduced sliding scale fee structures to reflect the lowering of trip generation for TODs. Santa Clara County California’s Congestion Management Agency has produced guidelines calling for a 9% trip reduction for housing within 2,000 feet of a light-
TCRP Report 128 Effects of TOD on Housing, Parking, and Travel
118
rail or commuter-rail station. While this is a positive step, according to our research findings, this adjustment is a bit tepid. Similarly, the URBEMIS software program sponsored by the California Air Resources Board, used to estimate the air quality impacts of new development, calls for up to a 15% lowering of trip rates for housing in settings with intensive transit services – again, likely on the low side based on our findings. More in line with the findings presented here are the vehicle trip reductions granted to the White Flint Metro Center project, a mega-scale, mixed-use joint development project now being built at Washington Metrorail’s New Carrollton Station. With some 1.2 million square feet of office space, 250,000 square feet of commercial-retail, and 375 residential units scheduled at build out, the project was granted a 40% reduction in estimated trip rates for the housing component based on proximity to transit. The trip reduction benefits of TOD call for other development incentives, like lower parking ratios, flexible parking codes, market-responsive zoning, streamlining the project review and permitting process, and investments in supportive public infrastructure. Trip reduction also suggests TODs are strong markets for car-sharing. Recent research in the San Francisco Bay Area reveals that those who participate in carsharing lower their car ownership levels by around 10%, with higher vehicle-shedding rates among those living near rail stations (Cervero et al., 2007). The combination of reducing off-street parking and increasing carsharing options would yield other benefits, including reducing the amount of impervious surface (and thus water run-off and heat island effects) and the creation of more walkable scales of development. Such practices are not heavy-handed planning interventions but rather market-oriented responses – namely, efforts to set design standards and provide mobility options that are in keeping with the market preferences of those who opt to live near rail transit stations. Recommendations With this research data to support the belief that people living in TODs drive less often than their neighbors in conventional developments, public officials and government regulators have the evidence needed to develop new, more realistic standards for assessing impact fees and mitigation for TODs. Developing residential TODs based on an accurate assessment of their traffic impacts should result easier development approvals, better planned and more compact communities, increased transit ridership, and more affordable housing. Tightening residential TOD parking ratios to reflect the actual transportation performance of TODs will be a very important step toward realizing the expected community benefits of TOD and enhancing their financial feasibility. In many TODs, the community and developer benefits have been understated because they have been over-parked. Additional research is also suggested to further address some of the questions addressed in the Literature Review. To help realize the benefits of TOD the team recommends the following:
1. Work with ITE and ULI to develop new trip generation and parking guidance for TOD.
In the opinion of the authors the highest priority should be placed on working with ITE and the ULI to develop and implement new guidance on trip generation and parking for TOD-housing. The research suggests developers are being charged impact fees for non-existent trips and required to build expensive parking spaces which are not needed. Parking ratios developed using ITE trip generation rates over-park TODs by as much as 50%. In developing new guidance
TCRP Report 128 Effects of TOD on Housing, Parking, and Travel
119
on parking it will be important to account for a variance in trip generation factors such as the quality of transit service and the distance of a station from the central business district. The project team contacted ITE to share the panel’s interest in working with ITE to develop new guidelines. In response, Lisa M. Fontana Tierney, P.E., Traffic Engineering Senior Director ITE, commented “Once the results of the study are finalized and submitted to ITE, we will review the information and consider it for inclusion in a future ITE resource. Based on my understanding of the work, it seems that it would be appropriate to consider the results of your study as part of a future edition of the ITE Trip Generation Handbook. We expect to begin the update process for this Handbook in early 2009”
2. Broadly disseminate the findings of this research. The benefits of TOD are muted since most TODs are parked and traffic impacts are accessed oblivious to the fact that a rail stop is nearby. Broadly distributing the results of the research can help to lead to right-sizing TOD-housing regulations for parking and transportation related impact fees, and higher intensity of development appropriate for TODs. And with the information in-hand to confirm TOD-housing produces fewer trips than conventional development, it should be somewhat easier to get local approvals to build additional TODs without unnecessarily negotiating away the intensity of development envisioned in adopted TOD plans. As an interim step the findings of the research have been presented at the 2007 Rail~Volution Conference in Miami, the 2008 Congress for the New Urbanism Conference in Austin, and a transportation seminar at Portland State University. They are also slated to be presented at the 2008 ITE Annual Conference in Anaheim and have been accepted for publication by the Journal of Public Transportation. The findings will also be shared with other researchers doing similar research including the Mixed-Use Trip Generation research being done at the Texas Transportation Institute and NCHRP 08-66 “Trip Generation Rates for Transportation Impact Analysis of Infill Development.”
3. Seek funding for additional research on TOD land uses. The research presented here covers only one of a myriad of land use types found in TODs. Additional research will be necessary to broaden the knowledge of the trip generation, the parking characteristics of TOD land uses and the impact of TOD on ensuring ridership in TODs. The research needs identified by the team and the panel flow from the field research, the Literature Review and the state-of-the practice of what we know and don’t know about ensuring ridership from TOD:
a. Research into the parking demand and trip generation characteristics of office, retail and mixed-use in TODs. This research should also consider the parking demands of the land uses and the degree to which different land uses have different annual peak parking demands, and how the annual peak parking demands differ from the average daily demand. Parking utilization information is needed for all TOD land uses.

TCRP Report 128 Effects of TOD on Housing, Parking, and Travel
120
b. Research into self selection and change in travel patterns after residents move into a TOD. A mode share survey could be mailed to residents of selected TODs and analyzed at a cost of approximately $3,500 per TOD. The before and after study of Center Commons referenced in the literature review was done in this manner. c. Research on the impact of design features (e.g., mixed land-use, traffic calming, bus bulbs, short blocks, street furniture) travel patterns, transit ridership, or the decision to locate in a TOD. Intuitively we know ‘design matters’ but there is very little data to show the impact of design on transit use, on locational decisions to live in a TOD or what design features have the greatest impact. d. Research into what motivates employers to locate in TODs? There is a growing body of information on residential TODs and locational decisions. At the same time there is very little understanding of how to impact retail and commercial locational decisions to be part of a TOD. As a starting point phone interviews of commercial leasing agents and tenants in TODs could be undertake to distinguish what role TOD / transit may play in locational decisions.

TCRP Report 128 Effects of TOD on Housing, Parking, and Travel
121
Literature Review References
Arrington, G. Light Rail and the American City: State-of-the-Practice for Transit-Oriented Development. Transportation Research Circular E-C058. Washington, D.C. 2003.
Arrington, G. “Reinventing the American Dream of a Livable Community: Light Rail and Smart Growth in Portland”. Conference on Light Rail Transit Investment for the Future. Dallas, Texas. 2000.
AvalonBay Communities, Inc. A Developer’s Perspective. APTA Rail Conference, June 2003.
Belzer, D. and Autler, G. Transit Oriented Development: Moving from Rhetoric to Reality. Great American Station Foundation and Brookings Center on Metropolitan Policy, Brookings Institution. Washington, D.C. June, 2002.
Ben-Akiva, Moshe and John Bowman. Integration of an Activity-Based Model System and a Residential Location Model. Urban Studies. 35 (7): pp. 1231-1253. 1998
Bianco, Martha J. Portland State University. Effective Transportation Demand Management: Combining Parking Pricing, Transit Incentives and Transportation Management in a Mixed-Use District in Portland, Oregon. Paper no. 00-1619 Presented at 79th Annual Meeting of Transportation Research Board. Washington, D.C. 2000.
Center for Transit-Oriented Development (CTOD) website Bringing TOD to Scale. http://www.reconnectingamerica.org/html/TOD/tod_to_scale.htm accessed, September 30, 2005
Cervero, R. Ridership Impacts of Transit-Focused Development in California, Berkeley, Institute of Urban and Regional Development, Research Monograph 45, 1994.
Cervero, R. TCRP Research Results Digest 4. “Transit Ridership Initiative.” Transportation Research Board, National Research Council, Washington, D.C. 1995.
Cervero, R. Mixed Land Uses and Commuting: Evidence from the American Housing Survey, Transportation Research Record A, Vol. 30, No. 5, pp. 361-377. 1996,.
Cervero, R. and Kara Kockelman. Travel Demand and the 3Ds: Density, Design, and Diversity. Transportation Research D, Vol. 2, No. 3, pp. 199-219. 1997
Cervero, R. Ridership Impacts of Transit-Focused Development in California. Berkeley: Institute of Urban and Regional Development, University of California, Monograph 45. 2003.
Cervero, op cit., 1994; R. Cervero, Built Environments and Mode Choice: Toward a Normative Framework, Transportation Research D, Vol. 7, 2002, pp. 265-284; Lund, Cervero, and Willson, 2004.
Cervero, R and M. Duncan, “Residential Self-Selection and Rail Commuting: A Nested Logit Analysis”. Institute of Urban and Regional Development. Berkeley, California. 2002.
TCRP Report 128 Effects of TOD on Housing, Parking, and Travel
122
Cervero, R. Transit Oriented Development in America: Experiences, Challenges, and Prospects. Washington, D.C.: Transit Cooperative Research Program, National Research Council. 2003.
Cervero, R. Off-Line Modeling of Transportation and Land Use Futures. Department of City and Regional Planning. University of California. Berkeley, California. May 2005.
Chatman, D. How the Built Environment Influences Non-Work Travel: Theoretical and Empirical Essays. Dissertation Submitted to the Graduate Program in Urban Planning, University of California at Los Angeles 2005.
Community Building Sourcebook, TriMet, Portland, OR (1999).
Dill, Jennifer. Survey of Merrick TOD Residents. Portland State University. March, 2005.
Dittmar, H and Ohland, G. The New Transit Town: Best-Practices in Transit Oriented Development. Island Press. Washington, D.C. 2004.
Dueker, K., Strathman, J., and Martha Bianco. Strategies to Attract Auto Users to Public Transportation. TCRP Report 40. Transit Cooperative Research Program. Transportation Research Board. National Academy Press. Washington, D.C. 1998.
Evans, J. and Stryker, A. TCRP Project B-12B - Technical Report 1. Prepared for Richard H. Pratt, Consultant, Inc. and the Transit Cooperative Research Program by Jay Evans Consulting LLC and PB Consult Inc. Unpublished report available through Stephan A. Parker ([email protected]), Senior Program Officer, TCRP Project B-12. March, 2005.
Ewing, R and R. Cervero, Travel and the Built Environment: A Synthesis, Transportation Research Record 1780, 2001.
Ewing, Reid. Beyond Density, Mode Choice, and Single-Purpose Trips. Transportation Quarterly, Vol. 49, No. 4, Fall 1995.
Federal Transit Administration, FTA New Starts Workshop, San Jose, California, June 12, 2003.
Rachel Gossen. Travel Characteristics of TOD and Non-TOD Residents in the San Francisco Bay Area: Evidence from the 2000 Bay Area Travel Survey. Oakland: Metropolitan Transportation Commission, working paper. 2005.
Gragg, Randy. “No Kids on the Block”. The Oregonian Newspaper. July 7, 2005.
JHK and Associates, Development-Related Survey II, Washington Metropolitan Area Transit Authority, 1987 and 1989.
Handy, Susan. Regional Versus Local Accessibility: Implications for Non-Work Travel. Transportation Research Record No. 1400. National Research Council, Transportation Research Board. Washington, D.C. 1993.
Lapham, Michael. Transit Oriented Development – Trip Generation and Mode Split in the Portland Metropolitan Region. Portland State University. March 2001.

TCRP Report 128 Effects of TOD on Housing, Parking, and Travel
123
Lee, Richard W. Review of Literature on TOD Trip Generation Relevant to Hacienda Business Park. Memorandum Presented to Hacienda Business Park Owners Association by Fehr & Peers. August 2004.
Lund, Hollie M. and Robert Cervero and Richard Willson. Travel Characteristics of Transit-Focused Development in California. Oakland. Bay Area Rapid Transit District and California Department of Transportation. 2004.
Mildner, Gerard and James Strathman and Martha Bianco. “Parking Policies and Commuting Behavior”. Transportation Quarterly, Vol. 51, No.1, pp. 111-125. Winter 1997.
New Urban News. “America Must Urbanize as the Population Ages”. January/February 2003. Accessed March 28, 2003. http://www.newurbannews.com/housingmarketing.html.
Parsons Brinckerhoff. Factors for Success in California’s Transit-Oriented Development. Sacramento: California Department of Transportation, Statewide Transit-Oriented Development Study. 2002.
Parsons Brinckerhoff. Northwest Transit Corridor TOD implementation Guidebook. Northwest Municipal Conference, May 2003.
Parsons Brinckerhoff, J. Zupan, R. Cervero, and Stein-Hudson. TCRP Report 16: Transit and Urban Form. Transportation Research Board, National Research Council. Washington, D.C.. 1996.
Podobnik, Bruce. The Social and Environmental Achievements of New Urbanism: Evidence from Orenco Station. Lewis and Clark College. November 2002.
Pratt, Richard H. Traveler Response to Transportation System Changes. TCRP Web Document 12. Transit Cooperative Research Program. Transportation Research Board. National Academy Press. Washington, D.C. March, 2000.
Reconnecting America’s Center for Transit Oriented Development (CTOD). Hidden in Plain Sight: Capturing the Demand for Housing Near Transit. Oakland, California. September 2004.
Renne, J. Evaluation of the New Jersey Transit Village Initiative Executive Summary. Alan M. Voorhees Transportation Center, Edward J. Bloustein School of Planning and Public Policy, Rutgers University December 2003.
Renne, J. Transit Oriented Development: Measuring Benefits, Analyzing Trends, and Evaluating Policy. Dissertation Submitted to Graduate Program in Urban Planning and Policy Development, Rutgers University 2005.
Ross, Catherine L. and Anne E. Dunning. Land Use Transportation Interaction: An Examination of the 1995 NPTS Data. U.S. Department of Transportation Federal Highway Administration. October 1997.
Sastry, Naravan, Bonnie Ghosh-Dastidar, John Adams, and Anne Pebley. The Design of a Multilevel Longitudinal Survey of Children, Families, and Communities: The Los Angeles Family and Neighborhood Survey. Santa Monica: RAND. 2000.

TCRP Report 128 Effects of TOD on Housing, Parking, and Travel
124
Shoup, Donald C. In Lieu of Required Parking. Journal of Planning Education and Research. Volume 18, Issue 4. Association of Collegiate Schools of Planning. 1999.
Shoup, D. Truth in Transportation Planning, Journal of Transportation and Statistics, Vol. 66, 2003, pp. 1-16.
Switzer, C. The Center Commons Transit Oriented Development: A Case Study. Master of Urban and Regional Planning Thesis, Portland State University. 2002.
Thompson, Gregory and Thomas Matloff. Network Philosophy Affects Performance of Transit Investments in U.S. Urban Areas. Paper presented at 8th Joint Conference on Light Rail Transit. Dallas, Texas. November 2000.
Urban Land Institute. Ten Principles for Successful Development Around Transit. Washington, D.C. 2003.
Whoriskey, Peter. Tysons Project Adds Dimension to Rail Proposal. Washington Post, June 22, 2003.