teacher preparation experiences and early teaching
TRANSCRIPT

Teacher Preparation Experiences and Early
Teaching Effectiveness
U.S. Department of Education September 2019
Barbara Goodson Linda Caswell Cristofer Price Daniel Litwok
Abt Associates
Mark Dynarski Pemberton Research
Edward Crowe Bench Group, LLC
Robert Meyer Andrew Rice
Education Analytics

NCEE 2019-4007 Teacher Preparation Experiences and Early Teaching Effectiveness i
Contents Executive Summary .................................................................................................................................... v
Introduction .......................................................................................................................................... 1 Organization of This Report ................................................................................................... 2
Study Design ......................................................................................................................................... 3 Selection and Recruitment of Districts and States ................................................................. 3 Teacher Eligibility Criteria .................................................................................................... 4 Teacher Sample ...................................................................................................................... 4 Sample Characteristics ........................................................................................................... 5 Preparation Providers, Certification Routes, and Degree Programs ...................................... 9 Teacher Survey on Preparation Experiences ........................................................................ 11 2.6.1 Identifying the 13 Competency Areas ..................................................................... 11 2.6.2 Identifying Sets of Five Teaching Strategies for Each Competency Area .............. 13 2.6.3 Defining the Four Types of Learning Opportunities ............................................... 13 2.6.4 Format of the Survey ............................................................................................... 14 2.6.5 Cognitive Testing of the Survey ............................................................................. 14 Preparation Experience Measures ........................................................................................ 15 2.7.1 Average Measures ................................................................................................... 15 2.7.2 Broad Category Measures ....................................................................................... 16 2.7.3 Assessment of Measurement Error in Teacher Survey Responses ......................... 17 Teaching Effectiveness Measures ........................................................................................ 18 2.8.1 Estimating Teaching Effectiveness ......................................................................... 19 2.8.2 Relating Preparation Experiences to Teaching Effectiveness ................................. 19
Average Frequencies and Variation of Teacher Preparation Experiences ................................... 20 Preparation Experiences With Competency Areas .............................................................. 20 3.1.1 Relative Frequency Across Competency Areas ...................................................... 20 3.1.2 Variation Across Teachers in Competency Areas ................................................... 21 Preparation Experiences Obtained Through Different Types of Learning Opportunities ... 25 3.2.1 Relative Frequency Across Types of Learning Opportunities ................................ 25 3.2.2 Variation Across Teachers in Types of Learning Opportunities ............................. 28 Preparation Experiences With Two Broad Categories Within Four Types of Learning Opportunities ........................................................................................................................ 30 3.3.1 Average Frequencies of Preparation Experiences in Two Broad Categories
Within Four Types of Learning Opportunities ....................................................... 30 3.3.2 Variation of Preparation Experiences in Two Broad Categories Within Four
Types of Learning Opportunities ............................................................................ 30
Relationships of Preparation Experiences to Teaching Effectiveness ........................................... 32 Relationships of Preparation Experiences to Teaching Effectiveness in ELA and Math .... 32 Relationships of Preparation Experiences to Teaching Effectiveness Over the First Three Years of Teaching ...................................................................................................... 35
Areas for Future Research ................................................................................................................ 37

NCEE 2019-4007 Teacher Preparation Experiences and Early Teaching Effectiveness ii
References .................................................................................................................................................. 38
Acknowledgements ................................................................................................................................... 43
Disclosure of Potential Conflicts of Interest ........................................................................................... 43

NCEE 2019-4007 Teacher Preparation Experiences and Early Teaching Effectiveness iii
List of FiguresFigure ES.1: Taxonomy of Preparation Experiences for This Study ........................................................... vi
Figure ES.2: Example Survey Items for “Maintaining a Positive Classroom Climate” Competency Area ............................................................................................................................................................. vii
Figure ES.3: Teachers’ Preparation Experiences by Competency Area .................................................... viii
Figure ES.4: Teacher-Reported Frequency of Preparation Experiences by Learning Opportunity ............. ix
Figure ES.5: Relationships Between Preparation Experiences and Teaching Effectiveness in ELA and Math ....................................................................................................................................................... x
Figure 2.1: Study Sample .............................................................................................................................. 5
Figure 2.2: States in the Sample by Number of Study Teachers .................................................................. 6
Figure 2.3: Percentage of Study Districts by Demographic Characteristics, Weighted by Number of Teachers .................................................................................................................................................... 7
Figure 2.4: Comparison of Study Teachers and “Eligible” SASS Teachers ................................................. 8
Figure 2.5: States in the Sample by Number of Preparation Providers ......................................................... 9
Figure 2.6: Percentage of Study Teachers by Certification Route and Degree Program ............................ 10
Figure 2.7: Example Survey Items for “Maintaining a Positive Classroom Climate” Competency Area ............................................................................................................................................................. 14
Figure 2.8: Taxonomy of Preparation Experiences for This Study ............................................................ 17
Figure 3.1: Teacher-Reported Frequency of Preparation Experiences by Competency Area .................... 22
Figure 3.2: Percentage of Teachers Reporting At Least A Few Experiences in Competency Areas .......... 23
Figure 3.3: Percentage of Teachers Reporting Many Preparation Experiences in Competency Areas ........................................................................................................................................................... 23
Figure 3.4: Teacher-Reported Frequency of Preparation Experiences Obtained Through Types of Learning Opportunities ............................................................................................................................... 25
Figure 3.5: Teacher-Reported Frequency of Preparation Experiences With Competency Areas by Type of Learning Opportunity .................................................................................................................... 27
Figure 3.6: Percentage of Teachers Reporting At Least A Few Preparation Experiences Obtained Through Types of Learning Opportunities ................................................................................................. 28
Figure 3.7: Percentage of Teachers Reporting Many Preparation Experiences Obtained Through Types of Learning Opportunities ................................................................................................................ 29
Figure 3.8: Teacher-Reported Frequency of Preparation Experiences by Type of Learning Opportunity and Broad Category ................................................................................................................ 31
NCEE 2019-4007 Teacher Preparation Experiences and Early Teaching Effectiveness iv
List of TablesTable 4.1: Standardized Regression Coefficients for Relationships of Preparation Experiences with Creating a Productive Learning Environment to ELA and Math Teaching Effectiveness by Type of Learning Opportunity .................................................................................................................... 33
Table 4.2: Standardized Regression Coefficients for Relationships of Preparation Experiences With Promoting Analytic Thinking Skills to ELA and Math Teaching Effectiveness by Type of Learning Opportunity) ................................................................................................................................ 34

NCEE 2019-4007 Teacher Preparation Experiences and Early Teaching Effectiveness v
Executive Summary
This report provides information about new teachers’ preparation experiences and explores whether particular types of experiences are related to teachers’ effectiveness in improving their students’ test scores.
Prior research indicates that teaching effectiveness is the largest in-school factor affecting student achievement (Chetty, Friedman, and Rockoff 2014a, 2014b). Research also shows that new teachers are less effective than more experienced teachers (Clotfelter, Ladd, and Vigdor 2007) and frequently begin their careers in high-poverty schools (Bruno, Rabovsky, and Strunk 2019), where students are in greatest need of effective instruction. Improving the preparation that teachers receive is a potential strategy for increasing new teachers’ effectiveness and for closing the student achievement gap, which is a primary goal of the Every Student Succeeds Act of 2015.1
Understanding whether certain ways of preparing teachers are more effective than others is important, but very little is currently known about what teacher preparation emphasizes at a fine-grained level and how those experiences are related to teaching effectiveness. Research identifying which preparation experiences are related to improved student performance can generate hypotheses for improving teacher preparation.
About the Study
Through an online survey administered in spring 2015, this study collected information from new teachers about their preparation experiences. It also examined the relationship between the frequency of these experiences and teachers’ effectiveness in improving student test scores.
Study Sample
The study recruited a sample of large districts/states that could provide student-teacher linked achievement data for the calculation of teacher value-added. The sample consisted of 242 districts in 18 states. These were primarily large, urban districts, located in the South, with high levels of students in poverty and high proportions of minority students and English learners.
Within these districts, 3,294 teachers in grades 4 through 6 completed the survey. This large, opportunistic teacher sample was similar to a nationally representative sample of novice upper elementary teachers from the 2011–12 Schools and Staffing Survey (SASS) in terms of sex, age, and certification route (alternative or traditional). Study teachers had participated in the preparation programs of 566 different providers.
To examine the relationships between preparation experiences and teaching effectiveness, the study collected student test score data for a subset of 2,533 of these teachers.2
1 Every Student Succeeds Act of 2015. P.L. 114-95 § 114 Stat. 1177 (2015-2016). 2 Because of considerations of cost and expected numbers of surveyed teachers in each district/state, we limited
the collection of student-teacher linked achievement data to the 19 largest districts/states.

NCEE 2019-4007 Teacher Preparation Experiences and Early Teaching Effectiveness vi
Preparation Experience Measures
The survey asked study teachers about the preparation experiences they received as part of their preparation program for initial certification. It asked teachers about their preparation experiences with instructional strategies across 13 competency areas. Those areas fell into two broad categories: strategies for creating a productive learning environment and strategies for promoting analytic thinking skills. Figure ES.1 shows the study’s taxonomy of competency areas and broad categories.
The teacher survey was developed based on prior research that linked classroom practices within each competency area with gains in student achievement and in consultation with national experts.3 It asked the study teachers to rate the extent to which, during their preparation program, they had experiences with each of the instructional strategies obtained through each of four types of learning experiences: (1) Coursework, (2) Observation, (3) Practice, and (4) Feedback.
Specifically, the survey items asked teachers to rate on a five-point scale (from 1 = “Rarely/Never” experienced to 5 = “Very often” experienced) the extent to which they (1) read about, heard about, or saw a role play of the strategy (such as during coursework); (2) observed a teacher using the strategy in a K–12 classroom; (3) practiced the strategy in a K–12 classroom; or (4) received feedback on their use of the strategy. (See figure ES.2.) This taxonomy of types of learning opportunities aligns with qualitative research and theory that suggest that the four types form a continuum and that all are required for learning to take place (Grossman, Compton et al. 2009; McDonald, Kazemi, and Kavanagh 2013). Within each competency area and within each type of learning opportunity, teachers’ ratings were averaged and reported as very few (1 ≤ avg ≤ 2); few (2 < avg ≤ 3); some (3 < avg ≤ 4); or many (4 < avg ≤ 5).
3 Bill and Melinda Gates Foundation. Measures of Effective Teaching: 1 - Study Information. ICPSR34771-v2. Ann Arbor, MI: Inter-university Consortium for Political and Social Research [distributor], 2013-09-23. https://doi.org/10.3886/ICPSR34771.v2.
Figure ES.1: Taxonomy of Preparation Experiences for This Study

NCEE 2019-4007 Teacher Preparation Experiences and Early Teaching Effectiveness vii
Figure ES.2: Example Survey Items for “Maintaining a Positive Classroom Climate” Competency Area
SOURCE: Study’s teacher survey, 2015.
Given that the competency areas included on the survey cover aspects of teaching previously shown to be related to student outcomes, it is worthwhile to see whether those experiences were included in teachers’ preparation and to what extent. In addition, recent emphasis on increasing teachers’ clinical experiences leads to interest in the extent to which preparation included hands-on experiences with feedback. Finally, the relationship between preparation experiences and early teaching effectiveness might generate hypotheses for improving teacher preparation.
Key Findings Average Frequencies and Variation of Preparation Experiences
Teachers’ preparation experiences included a broad array of competency areas, although teachers reported more frequent experiences in some competency areas than others.
The study examined the extent to which teachers reported experiences across the 13 competency areas in order to explore whether programs include the broad array of content believed to be important to preparing effective teachers. At least 64 percent of teachers reported some or many preparation experiences with teaching strategies in 12 of the 13 competency areas. Effective Instruction for English Learners was the one competency area in which less than half of teachers (43 percent) reported at least some experiences (figure ES.3).
As part of your preparation program for initial certification, how often did you:
How useful have your preparation experiences been for your classroom instruction?
Read about, hear about or see a role play of this strategy(such as during coursework)?
Observe a teacher using this strategy in a K-12 classroom(include videos and direct observations during your fieldwork or student teaching)?
Practice this strategy in a K-12 classroom prior to becoming a full-time teacher?
Receive feedback on your use of this strategy fromprogram staff or a cooperating teacher that included information aboutwhat you did well/how you could improve?
Instructional Strategies for “Maintaining a Positive Classroom Climate” R
are
ly/N
eve
r
Ve
ry o
fte
n
Ra
rely
/Ne
ver
Ve
ry o
fte
n
Ra
rely
/Ne
ver
Ve
ry o
fte
n
Ra
rely
/Ne
ver
Ve
ry o
fte
n
Ha
ve n
ot
use
d
No
t u
sefu
l
So
me
wh
at
use
ful
Use
ful
Ve
ry u
sefu
l
Communicating respect and warmth both in words and non-verbally (making eye contact, being in physical proximity) when interacting with individual students and the class as a whole.
1 2 3 4 5 1 2 3 4 5 1 2 3 4 5 1 2 3 4 5 1 2 3 4 5
Demonstrating knowledge of and interest in students’ lives inside and outside of school. 1 2 3 4 5 1 2 3 4 5 1 2 3 4 5 1 2 3 4 5 1 2 3 4 5
Listening closely and with genuine interest when studentstalk and encouraging students to listen to each other. 1 2 3 4 5 1 2 3 4 5 1 2 3 4 5 1 2 3 4 5 1 2 3 4 5
Encouraging cooperation among students, such asworking together and sharing materials. 1 2 3 4 5 1 2 3 4 5 1 2 3 4 5 1 2 3 4 5 1 2 3 4 5
Responding to students’ efforts and participation with positive comments (e.g., “What a great idea!,” “You guysare working together really well on that project.”).
1 2 3 4 5 1 2 3 4 5 1 2 3 4 5 1 2 3 4 5 1 2 3 4 5

NCEE 2019-4007 Teacher Preparation Experiences and Early Teaching Effectiveness viii
Figure ES.3: Teachers’ Preparation Experiences by Competency Area
NOTE: Teachers’ responses to the survey questions about preparation experiences ranged from 1 to 5, where 1 = “Rarely/Never” and 5 = “Very often.” This figure shows the proportion of teachers in four groups based on teachers’ average preparation experiences with each competency area. The 13 competency areas are listed in order of highest to lowest average score. Sample size varied between 3,249 and 3,289 due to nonresponse. All sample averages are statistically different from one another (p < .05) except these: (1) Effective English Language Arts Instruction, Building Students’ Higher-Order Thinking Skills, and Facilitating Extended Classroom Discussions are not different from one another; and (2) Effective Mathematics Instructions and Building Comprehension of Academic Concepts are not different from each other. FIGURE READS: Three percent of teachers reported having had very few preparation experiences with Maintaining a Positive Classroom Climate. The sample average rating for preparation experiences with Maintaining a Positive Classroom Climate was 4.0. SOURCE: Study’s teacher survey data, 2015.
Although teachers learned about competency areas through all four types of learning opportunities, Coursework was the most frequent and Feedback was the least frequent.
Teachers reported that they received preparation experiences most frequently through Coursework (average of 3.8 on the five-point scale), and least frequently through Feedback (average of 3.4). This pattern is also reflected in the proportion of teachers who reported at least some preparation experiences through each type of learning opportunity: 83 percent for Coursework versus 65 percent for Feedback (figure ES.4). However, nearly a quarter or more of teachers reported few or very few experiences with three of the four types of learning opportunities: 24 percent for Observation, 26 percent for Practice, and 34 percent for Feedback.
33
10
15
8
7
8
9
8
6
5
5
4
3
24
27
20
25
21
21
21
22
21
19
17
16
11
26
40
36
40
42
42
37
37
37
39
39
38
37
17
24
29
26
30
30
33
33
36
38
40
42
49
Sample Avg = 2.8
Sample Avg = 3.4
Sample Avg = 3.4
Sample Avg = 3.4
Sample Avg = 3.5
Sample Avg = 3.5
Sample Avg = 3.5
Sample Avg = 3.6
Sample Avg = 3.7
Sample Avg = 3.7
Sample Avg = 3.8
Sample Avg = 3.8
Sample Avg = 4.0
0 25 50 75 100
Effective Instruction for English Learners
Building Comprehension of Academic Concepts
Effective Mathematics Instruction
Providing Feedback that Helps Student Learning
Facilitating Extended Classroom Discussions
Building Students' Higher-Order Thinking Skills
Effective English Language Arts Instruction
Designing and Using Assessments of Student Learning
Demonstrating Sensitivity to Student Needs
Conveying the Importance of Learning
Productive Use of Classroom Time
Managing Student Behavior to Maximize Learning Time
Maintaining a Positive Classroom Climate
Percentage of Teachers
Com
pete
ncy
Area
Very few (1 ≤ Avg ≤ 2) Few (2 < Avg ≤ 3) Some (3 < Avg ≤ 4) Many (4 < Avg ≤ 5)

NCEE 2019-4007 Teacher Preparation Experiences and Early Teaching Effectiveness ix
Figure ES.4: Teacher-Reported Frequency of Preparation Experiences by Learning Opportunity
NOTE: Teachers’ responses to the survey questions about preparation experiences ranged from 1 to 5, where 1 = “Rarely/Never” and 5 = “Very often.” This figure shows the proportion of teachers in four groups based on teachers’ frequency of preparation experiences (averaged across the 13 competency areas) obtained through each type of learning opportunity. The four types of learning opportunities are listed in order of highest to lowest average score. Sample size varied between 3,286 and 3,288. All sample averages are statistically different from one another (p < .05). FIGURE READS: The average frequency of preparation experiences obtained through Coursework was very few for 3 percent of teachers. The sample average rating for preparation experiences obtained through Coursework was 3.8. SOURCE: Study’s teacher survey data, 2015.
Within each type of learning opportunity, teachers reported more preparation experiences with strategies for creating a productive learning environment than with strategies for promoting analytic thinking skills.
Using a statistical technique called factor analysis, the study categorized each of the 13 competency areas into two broad categories of preparation experiences--creating a productive learning environment and promoting analytic thinking skills. Regardless of type of learning opportunity examined, teachers reported more experiences with creating a productive learning environment than with promoting analytic thinking skills. For example, for Coursework, the average rating for strategies for creating a productive learning environment was 3.8, compared to the average rating of 3.6 for strategies for promoting analytic thinking skills (not shown).
Relationships Between Preparation Experiences and Teaching Effectiveness
Teachers who reported more frequent preparation experiences with strategies for creating a productive learning environment were more effective in the classroom than were teachers who received fewer such experiences.
For ELA, the relationships between preparation experiences for creating a productive learning environment and teaching effectiveness were positive (i.e., more frequent preparation experiences were related to greater effectiveness) and statistically significant for three of the four types of learning opportunities: Observation, Practice, and Feedback. For math, the relationships between preparation experiences for creating a productive learning environment and teaching effectiveness were positive for all four types of learning opportunities and statistically significant for Practice (Exhibit ES.5).
9
7
6
3
25
19
18
14
39
44
46
43
26
30
31
40
Sample Avg = 3.4
Sample Avg = 3.5
Sample Avg = 3.6
Sample Avg = 3.8
0 25 50 75 100
Feedback
Practice
Observation
Coursework
Percentage of Teachers
Type
ofLe
arni
ngO
ppor
tuni
ty
Very few (1 ≤ Avg ≤ 2) Few (2 < Avg ≤ 3) Some (3 < Avg ≤ 4) Many (4 < Avg ≤ 5)

NCEE 2019-4007 Teacher Preparation Experiences and Early Teaching Effectiveness x
Figure ES.5: Relationships Between Preparation Experiences and Teaching Effectiveness in ELA and Math
* Coefficient for relationship of experience to effectiveness is significantly different from zero, with p < .05.** Coefficient for relationship of experience to effectiveness is significantly different from zero, with p < .01.NOTE: Coefficients for the relationship of preparation experiences to ELA teaching effectiveness were estimated using data fromn = 2,032 ELA teachers. Coefficients for the relationship of preparation experiences to math teaching effectiveness were estimatedusing data from n = 1,894 math teachers.FIGURE READS: The horizontal line represents average teaching effectiveness for teachers in the sample. Bars above the lineindicate that the preparation experience is related to greater effectiveness, while bars below the line indicate that the preparationexperience is related to lesser effectiveness. The regression coefficient for the relationship of preparation experiences with creatinga productive learning environment obtained through Coursework to ELA teaching effectiveness is 0.045, meaning a one-unitincrease in preparation experiences is related to an increase of 0.045 standard deviation units above average effectiveness. Thisestimate is not statistically different from zero.SOURCE: Study’s teacher survey data, 2015. Effectiveness measures: study’s teacher-student linked data, 2012–15.
To give a sense of the magnitudes of the statistically significant relationships between preparation experiences and teaching effectiveness, we compared the sizes of those relationships to the sizes of the average differences in teaching effectiveness between first- and second-year teachers in ELA and math. The difference in ELA effectiveness that was associated with a one-point difference in preparation experiences for creating a productive learning environment through Observation, Practice, or Feedback was about half the size of the average difference in ELA effectiveness between first-year and second-year teachers. The association between preparation experiences for creating a productive learning environment through Feedback and math effectiveness was about one fifth of the size of the difference between first- and second-year teachers in math effectiveness.
Teacher preparation experiences with strategies for promoting analytic thinking skills were not related to teachers’ effectiveness in the classroom.
The relationships between preparation experiences for promoting analytic thinking skills and teaching effectiveness were not statistically significant for either ELA or math. This finding was consistent across all four of the types of learning opportunities (Coursework, Observation, Practice, Feedback).
.045
.081*.092**
.067*
.030 .029.046 .047
.008
.049.061*
.029
-.012
.003.012
.001
Cour
sew
ork
Obs
erva
tion
Prac
tice
Feed
back
Cour
sew
ork
Obs
erva
tion
Prac
tice
Feed
back
Creating a Productive Learning Environment Promoting Analytic Thinking Skills
Broad Categories of Preparation Experiences
ELA Math
Average Effectiveness
Abov
e Av
erag
e Ef
fect
riven
ess
Belo
w A
vera
ge
Effe
ctiv
enes
s

NCEE 2019-4007 Teacher Preparation Experiences and Early Teaching Effectiveness xi
Concluding Thoughts
There are some limitations to this study, which provides information about the preparation experiences reported by a large, but purposive sample of elementary-level teachers in general-education classrooms. The study examined effectiveness only for teachers in upper elementary grades for which test scores were available. In addition, preparation experiences were self-reported by teachers and may have been subject to measurement error. Despite these limitations, the detailed nature of these data provides more information about teacher preparation than typically provided in the literature.
The study found variation across teachers in the extent of the preparation experiences they reported both for competency areas and types of learning opportunities. This variation allowed the study to explore relationships between preparation experiences and classroom effectiveness during teachers’ first few years of teaching. These types of analyses are a useful first step in generating hypotheses for improving teacher preparation, a primary objective of this study.
The study found significant relationships between strategies for creating a productive learning environment and teaching effectiveness. Practice was the only type of learning opportunity that showed a statistically significant relationship to teaching effectiveness in both ELA and math. Having obtained preparation experiences through Coursework was not significantly related to effectiveness for either subject area. These analyses suggest that there might be promise in preparation programs emphasizing strategies for creating a productive learning environment, particularly using more hands-on methods for learning these strategies. This finding is not causal and more rigorous research is needed to reinforce it.
Regardless of the type of learning opportunity, there were no statistically significant relationships between preparation experiences with promoting analytic thinking skills and teaching effectiveness. The lack of relationships is concerning, since research suggests that students’ ability to employ higher-order thinking skills about academic material is a predictor of overall academic success (Allen et al., 2011; Hamre and Pianta, 2005). However, it would be premature to conclude that experiences focused on promoting analytic thinking skills are not an important component of effective preparation programs. It could be that the particular strategies within promoting analytic thinking skills that this study focused on may not be the most essential ones, and that other strategies not measured but aimed at improving students’ analytic thinking may be effective. More exploratory research is needed to better understand this relationship.

NCEE 2019-4007 Teacher Preparation Experiences and Early Teaching Effectiveness 1
Introduction
Prior research indicates that teaching effectiveness is the largest in-school factor affecting student achievement (Chetty, Friedman, and Rockoff 2014a, 2014b). Yet studies suggest that teachers are least effective at influencing students’ academic learning in their early years in the classroom (Clotfelter, Ladd, and Vigdor 2007). In addition, novice teachers frequently begin their careers in high-poverty schools (Bruno, Rabovsky, and Strunk 2019), where students are in greatest need of effective instruction. Improving the preparation teachers receive is therefore a potential strategy for increasing novice teachers’ effectiveness and for closing the student achievement gap, which is a primary goal of the Every Student Succeeds Act of 2015.4 Understanding whether certain ways of preparing teachers matter more than others is important, but very little is currently known.
What does research tell us about how teachers are prepared and what aspects of that preparation matter most to their effectiveness in the classroom? According to the latest data available from the U.S. Department of Education, there are about 1,700 providers of teacher preparation nationwide.5 Case studies of individual programs (e.g., Darling-Hammond 2012) provide rich descriptions of a few selected examples, but they represent a narrow slice of the teacher preparation universe. Research examining preparation experiences more broadly provides only basic information regarding what teacher preparation providers offer (Cochran-Smith and Zeichner 2005). For instance, findings from reviews conducted by the National Council on Teacher Quality (Greenberg, McKee, and Walsh 2014; Greenberg, Walsh, and McKee 2013) are limited to analysis of course syllabi for those preparation providers that agreed to submit materials for review. While the paucity of information about preparation providers has been a barrier to efforts to guide program improvement, a more universal critique of the teacher preparation field has been the lack of rigorous research that directly relates preparation to teaching effectiveness (Grossman, Ronfeldt, and Cohen 2011; Wilson, Floden, and Ferrini-Mundy 2001).
Partly in response to this critique, a growing body of research has focused on examining the relationship between teacher preparation and teaching effectiveness. This research has predominantly addressed questions about differences in teaching effectiveness associated with preparation providers or routes to certification. To date, multiple studies comparing preparation providers consistently show that the provider has little or no relationship to teaching effectiveness when measured using teacher value-added scores (Boyd et al. 2009; Gansle, Noell, and Burns 2012; Goldhaber, Liddle, and Theobald 2012; Koedel et al. 2016; Mihaly et al. 2013; von Hippel et al. 2015; von Hippel et al. 2016; von Hippel et al. 2018). Research comparing teachers trained through alternative versus traditional routes to certification has been mixed, with results differing depending on the alternative route provider (Clark et al. 2013, 2015; Constantine et al. 2009). Thus, focusing on providers or certification routes has not been fruitful for helping the field understand how to prepare new teachers to be effective at increasing student achievement. Overall, the research shows that effectiveness varies among teachers within the same preparation provider or certification route more than it does among teachers across different providers or different routes (Boyd et al. 2006; Constantine et al. 2009; Koedel et al. 2016).
4 Every Student Succeeds Act of 2015. P.L. 114-95 § 114 Stat. 1177 (2015-2016). 5 U.S. Department of Education. Higher Education Act Title II State Data Files for the 2012-13 School Year.
Retrieved May 12, 2016, from https://title2.ed.gov/Public/DataTools/Files.aspx.

NCEE 2019-4007 Teacher Preparation Experiences and Early Teaching Effectiveness 2
The purpose of this study is to examine the relationship between teacher preparation experiences of novice teachers and their early effectiveness in the classroom, to generate hypotheses for improving teacher preparation. We defined novice teachers as those in their first, second, or third year of teaching. We included teachers in their second and third year of teaching to increase the sample size and because they are still early in their career and therefore relevant to the study’s focus on early teaching effectiveness. We included teachers in grades 4–6 because we wanted teachers who taught in grades in which math and English language arts were tested using state assessments.
Two overarching research questions frame the study:
1. What experiences do novice teachers report having received as part of their preparation?
2. What are the relationships between teacher-reported preparation experiences and novice teachers’effectiveness in improving student achievement?
This study differs from prior research on teacher preparation in three key ways: first, the study provides information on individual teachers’ experiences during preparation. Prior research has generally examined experiences at the program level, without acknowledging that teachers’ experiences within the same program may vary. Second, the instructional strategies that the study focuses on were selected from four observation instruments of classroom practices that have been shown in prior research to correlate with student achievement (Kane and Staiger 2012). Third, the study examines not only whether teachers reported experiences with particular strategies, but also the type of learning opportunity—how teachers learned those strategies.
In addition to providing descriptive information on teachers’ preparation experiences with promising instructional strategies, this study examines the relationships between the broad categories of teachers’ preparation experiences in which those instructional strategies fall and teachers’ effectiveness in improving student achievement. In this way, the study develops hypotheses regarding ways to effectively prepare teachers for the classroom.
Organization of This Report
The rest of this report describes in detail the design of the study and its findings.
• Chapter 2 describes the selection and recruitment of states, districts, and teachers and thecharacteristics of the resulting study sample. It also describes the development of the teacher surveyand the construction of the measures used in analyses.
• Chapter 3 presents an overall picture of the content of what teachers reported they experienced duringpreparation and the ways in which they experienced that content. It reports both frequency ofpreparation experiences and variation across teachers in the 13 competency areas, four types oflearning opportunities, and two broad categories of preparation experiences, all developed specificallyfor these analyses.
• Chapter 4 examines the relationships between preparation experiences and teaching effectiveness inEnglish language arts and math.
• Chapter 5 summarizes the study’s key findings and discusses their implications for future research.

NCEE 2019-4007 Teacher Preparation Experiences and Early Teaching Effectiveness 3
Study Design
The study uses data from a large sample of teachers in their first three years of teaching who were prepared by a diverse group of preparation providers and who taught in numerous districts and states across the country. This chapter describes the selection and recruitment of districts and states, the teacher eligibility criteria for the study, and the number of teachers in the analytic sample. It also presents the states in which study teachers taught and the characteristics of the districts and the teachers in the sample. A separate section describes the study teachers’ preparation providers, routes to certification, and degree programs. The final sections of this chapter describe the content of the teacher survey developed specifically for this study, the analytic variables created from the survey data, and the approach to estimating value-added measures of teaching effectiveness.
Selection and Recruitment of Districts and States
The study recruited a purposive sample of districts and states that had a large number of novice teachers and were willing to provide the study with student test scores and student-teacher links for four school years: 2011–12, 2012–13, 2013–14, and 2014–15. These data were needed to estimate teaching effectiveness (an estimate of the teacher’s contribution to student achievement gain over a single school year) for novice teachers (those hired as of the 2012–13 school year).6
The study team took a multi-pronged approach to recruiting districts and states that met these selection criteria. To develop an initial list of districts for recruitment, the study team used the National Center for Education Statistics (NCES) Common Core of Data (CCD)7 from the latest year available at the time of selection, which was for the 2011–12 school year, to determine which districts had the largest student enrollments. This was based on the assumption that these districts would have the largest numbers of novice teachers.
The team started with a list of the 100 largest districts8 and then added another 48 districts and nine states the study team believed from prior knowledge would be able to provide student test scores and student-teacher links for the four school years of interest. Of those, 28 of the districts and two of the states agreed to participate in the study. The two states represented another 214 districts, resulting in a final group of 242 districts in 18 states in the full sample.
6 Data were needed as early as 2011–12 in order to obtain a baseline measure for students of teachers who were in their first year of teaching in 2012–13.
7 U.S. Department of Education. Common Core of Data for the 2011–12 School Year. Retrieved May 12, 2016, from https://nces.ed.gov/ccd/search.asp.
8 The study ultimately had to drop all California districts from this list (n = 10) because the state had decided that no individual-level student data would be released for the 2013–14 school year, its first year implementing the Smarter Balanced assessments. This meant that no California districts could provide the data needed to estimate teaching effectiveness for first- and second-year teachers.

NCEE 2019-4007 Teacher Preparation Experiences and Early Teaching Effectiveness 4
Teacher Eligibility Criteria
Teachers were eligible for the study if they were
• in their first, second, or third year as a teacher of record for a general education classroom; and
• responsible (or had been responsible) for teaching English language arts (ELA), math, or both in theirfirst, second, or third year of teaching grade 4, 5, or 6 students.
The study team used these teacher eligibility criteria for three reasons. First, including first-, second-, and third-year teachers in the sample increased the potential sample size of novice teachers. Second- and third-year teachers are still early in their career and relevant to the study’s focus on early teaching effectiveness. Second, these teachers were more likely to remember their preparation experiences, whereas more experienced teachers might not.
Finally, to support the planned analyses of the relationships between preparation experiences and effectiveness, teachers had to teach (or have taught) in a general education classroom in which students took annual state assessments in ELA and math.
We extended the eligibility criteria to grade 6 because it is the highest grade included in most state elementary teaching certifications. We did not include grade 7 and 8 teachers because many of them would have received preparation experiences through secondary certification programs, which we knew could differ significantly from elementary certification programs. By limiting the sample to teachers in grades 4–6, the study’s focus is on the preparation experiences of teachers who all have been prepared to teach the same age range of students.
Teacher Sample
The study team collected data from participating districts and states on their teachers, including year of teaching, grade, subject, and contact information. Districts and states varied in what data they had available to determine teachers’ eligibility for the study, including date of hire, years of experience, or both. We then developed a list of potentially eligible teachers in each district or state.9
In spring 2015, we sent a total of 15,065 teachers a link to the study’s online survey. The survey included a set of screening questions at the beginning that determined whether teachers met the eligibility criteria.10 At the end of the screener, teachers who met the criteria were invited to complete the full survey.
Of the teachers sent a link to the survey, 6,729 teachers (45 percent) responded to the screening questions; 8,336 (55 percent) did not (see figure 2.1). The percentage of eligible and ineligible teachers responding across districts and states varied from 4 percent to 87 percent. See appendix A, table A.1 for response rates for all districts and states.
9 This was the process followed in the vast majority of districts and states. Three districts, however, elected to not share teacher names and contact information with the study team. In these cases, district staff developed the list of potentially eligible teachers based on the study criteria and sent them the survey link on the study’s behalf.
10 This approach resulted in both eligible and ineligible teachers being in the pool of survey respondents. This over-inclusion was necessary because district- and state-level data may have been unreliable, particularly in accurately reflecting total years of teaching experience.

NCEE 2019-4007 Teacher Preparation Experiences and Early Teaching Effectiveness 5
Figure 2.1: Study Sample
FIGURE READS: Of the 15,065 teachers invited to take the survey, 6,729 (45 percent) responded and 8,336 (55 percent) did not respond.
Among those who responded to the screening questions, 3,294 (49 percent) were determined to be eligible and completed the full survey; 3,435 (51 percent) were determined to be ineligible and completed only the screener. The eligibility rate varied greatly across districts and states—from 21 percent to 94 percent (see appendix A, table A.1 for eligibility rates for all districts and states), with the resulting sample being an opportunistic but large sample of teachers. It is also important to note that among those teachers who were eligible and began the survey, nearly all (95 percent) completed the preparation experience questions.
Analyses describing teachers’ preparation experiences are based on the full sample of 242 districts and 3,294 teachers in 18 states. Due to considerations of cost and expected numbers of surveyed teachers in each district or state, we limited the analyses examining the relationships between teachers’ preparation experiences and teaching effectiveness to a subsample consisting of a subset of districts (n = 169) and teachers (n = 2,533) in 14 states. Like the full sample, the resulting subsample is a large but opportunistic sample of teachers. See appendix A, table A.2 for a breakdown of teachers by year of teaching for both the full and the subsample.
Sample Characteristics
Below we present information about the full sample of teachers, including information about the states and districts in which the study teachers taught and the characteristics of the study teachers themselves. The sample is not nationally representative. It includes teachers who were trained by a large number of

NCEE 2019-4007 Teacher Preparation Experiences and Early Teaching Effectiveness 6
providers, but because larger districts were recruited, teachers in the sample were likely to be from districts in the South, which has larger than average districts because many Southern states have county-wide school districts.
We conducted separate analyses for the subsample of teachers used in the relational analyses and found that the subsample was similar to the full sample in terms of teacher characteristics such as route to certification and characteristics of the districts in which teachers taught, such as district size, urbanicity, and distribution of high-need students (see appendix B).11 Below we report findings on the full sample.
Study teachers taught in 18 states from different regions of the country.
The highest numbers of study teachers (in decreasing order) taught in New York, Oklahoma, Florida, Georgia, Texas, and Illinois (see figure 2.2). The states that teachers taught in were spread across the country but the majority of them were in the southern and western regions of the United States.
Figure 2.2: States in the Sample by Number of Study Teachers
NOTE: Map reflects state of employment for 3,294 study teachers (the full sample) at the time of survey administration. FIGURE READS: Florida, New York, and Oklahoma each had 400 or more teachers in the full sample. SOURCE: Administrative data from participating districts and states.
Study teachers taught in large, urban districts, primarily located in the South.
The study team examined characteristics of the districts (n = 242) in which the full sample of study teachers taught. District characteristics came from the most recent CCD dataset at the time of analysis, which was for the 2013–14 school year and are weighted by the number of study teachers in each district.12 Nearly two-thirds of teachers taught in districts in the South (63 percent), more than half were urban (56 percent), and nearly all were large (93 percent; see figure 2.3).
11 Although a few differences between the two samples are statistically significant, it should be noted that when testing the statistical significance of differences between two large samples, small differences—such as 1 or 2 percentage points—can be statistically significant. The large sample sizes and the small sizes of the differences lead us to conclude that the two samples are similar.
12 We weighted districts at the teacher level to align with subsequent analyses, which are at the teacher level.

NCEE 2019-4007 Teacher Preparation Experiences and Early Teaching Effectiveness 7
Study teachers taught in districts with high levels of students in poverty, high proportions of minority students, and high proportions of English learners.
For the full sample, 86 percent of teachers taught in districts where at least half of students were eligible for free or reduced-price lunch (FRPL), and 65 percent of teachers taught in districts with more than two-thirds minority students. More than half of teachers’ districts had at least 10 percent English learner students (see figure 2.3).
Figure 2.3: Percentage of Study Districts by Demographic Characteristics, Weighted by Number of Teachers
FRPL is free or reduced-price lunch eligibility, a proxy for low-income status. NOTE: Characteristics are weighted by the number of study teachers in each district. District size classifications are based on quartiles of the national distribution of districts in the Common Core of Data as follows: “Large” > 2,350 students; “Mid-Size” 800–2,350 students; “Small” 300–799 students; “Very Small” < 300 students. Minority indicates any of the following races based on the CCD: American Indian/Alaska Native, Asian, Hispanic, Black, Two or More Races. Sample size differs across district characteristics due to missing data in the CCD. From a full sample of 1,394 teachers in 242 districts, sample size varied from 3,290 to 3,294 teachers in 240 to 242 districts. FIGURE READS: Sixty-three percent of study districts were in the South census region, 9 percent were in the West, 10 percent were in the Midwest, and 19 percent were in the Northeast. SOURCE: U.S. Census for region. Common Core of Data for 2013–14 for urbanicity; size; and percentages FRPL, minority, and English learners.
Many characteristics of teachers in the study were similar to characteristics of a nationally representative sample of novice teachers.
We compared study teachers in the full sample with a nationally representative sample of teachers on measured demographic and background characteristics. We limited the comparison to 2011–12 data for “eligible” teachers from the Schools and Staffing Survey (SASS)13—that is, teachers with 1 to 3 years of experience who taught ELA or math to students in grades 4–6. Responses to questions about teacher
13 The study team used a restricted-use file from NCES for these analyses. This file included SASS data from the 2011–12 school year, which was the latest year available at the time.
63%
9% 10%19%
56%
34%
5% 5%
93%
3% 2%1%
86%
14%
65%
29%
6%
51%
15%
34%
0%
20%
40%
60%
80%
100%
Census Region Urbanicity Size % FRPL % Minority % EnglishLearners
Perc
enta
ge o
f Dis
tric
ts
NCEE 2019-4007 Teacher Preparation Experiences and Early Teaching Effectiveness 8
characteristics that were asked on both the study’s teacher survey and the SASS survey are shown in figure 2.4.
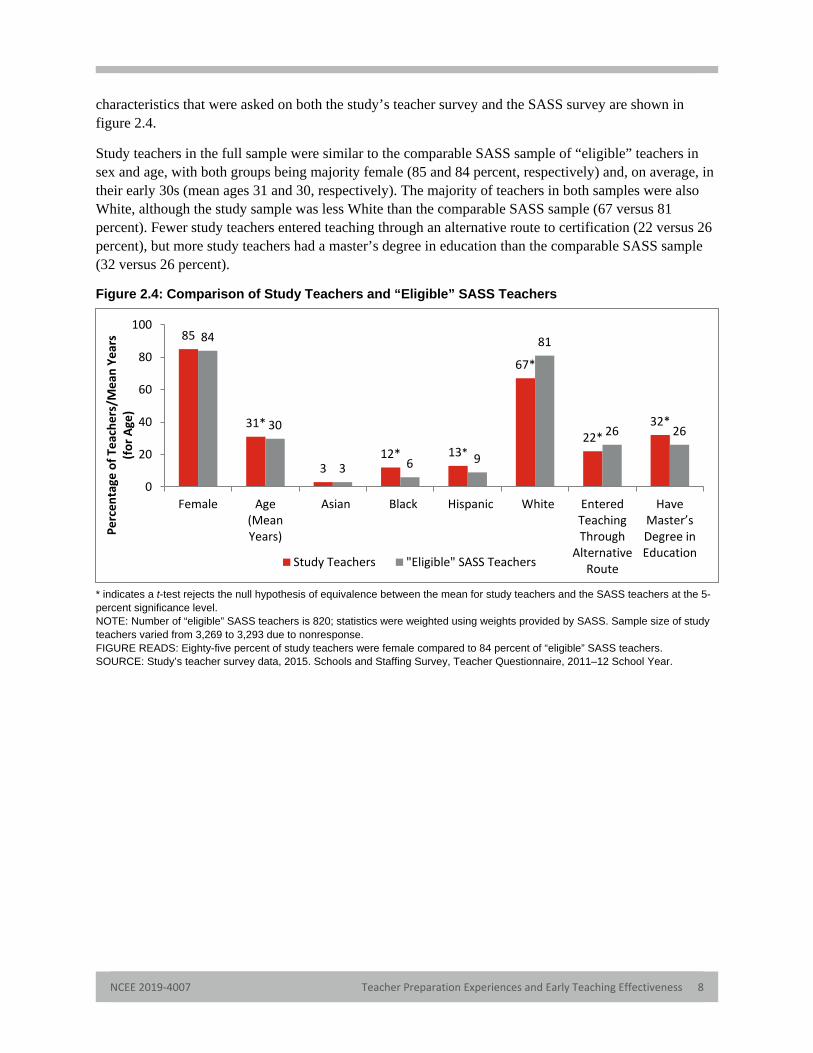
Study teachers in the full sample were similar to the comparable SASS sample of “eligible” teachers in sex and age, with both groups being majority female (85 and 84 percent, respectively) and, on average, in their early 30s (mean ages 31 and 30, respectively). The majority of teachers in both samples were also White, although the study sample was less White than the comparable SASS sample (67 versus 81 percent). Fewer study teachers entered teaching through an alternative route to certification (22 versus 26 percent), but more study teachers had a master’s degree in education than the comparable SASS sample (32 versus 26 percent).
Figure 2.4: Comparison of Study Teachers and “Eligible” SASS Teachers
* indicates a t-test rejects the null hypothesis of equivalence between the mean for study teachers and the SASS teachers at the 5-percent significance level.NOTE: Number of “eligible” SASS teachers is 820; statistics were weighted using weights provided by SASS. Sample size of studyteachers varied from 3,269 to 3,293 due to nonresponse.FIGURE READS: Eighty-five percent of study teachers were female compared to 84 percent of “eligible” SASS teachers.SOURCE: Study’s teacher survey data, 2015. Schools and Staffing Survey, Teacher Questionnaire, 2011–12 School Year.
85
31*
312* 13*
67*
22*32*
84
30
3 6 9
81
26 26
0
20
40
60
80
100
Female Age(MeanYears)
Asian Black Hispanic White EnteredTeachingThrough
AlternativeRoute
HaveMaster’s Degree in Education
Perc
enta
ge o
f Tea
cher
s/M
ean
Year
s(fo
rAge
)
Study Teachers "Eligible" SASS Teachers

NCEE 2019-4007 Teacher Preparation Experiences and Early Teaching Effectiveness 9
Preparation Providers, Certification Routes, and Degree Programs
The survey asked study teachers to name their preparation provider (institution or organization), route to certification (traditional or alternative), and degree program (4-year bachelor’s degree, 5-year bachelor’s degree, master’s degree, or no degree).
The study includes a large number of preparation providers in almost all states.
Study teachers in the full sample were prepared by 566 providers in 46 states (all states except Hawaii, Montana, Vermont, and Wyoming) and the District of Columbia and Puerto Rico (see figure 2.5). This stands in contrast to the much smaller number of states where study teachers worked (n = 18; see figure 2.2). The largest number of preparation providers represented in the sample were located (in descending order) in Texas, New York, Florida, Illinois, and Georgia.
According to U.S. Department of Education data from the 2012–13 school year, there were 1,705 preparation providers nationwide, meaning that the study included teachers from a third of all preparation providers. On average, there were 6 teachers per preparation provider in our sample, ranging from 1 to 96 teachers, and 72 percent of preparation providers had prepared fewer than 5 study teachers.
Figure 2.5: States in the Sample by Number of Preparation Providers
NOTE: Map reflects state of preparation provider for 3,288 study teachers; 6 teachers were missing preparation provider information due to survey nonresponse. Among responses, teachers who listed their preparation provider as “Other” were excluded (n = 25). This resulted in 566 unique preparation providers that were represented by at least one teacher in the sample. Eleven preparation
Key Terms Preparation provider—An institution or organization that offers teacher preparation. Providers can offer traditional or alternative routes to certification or both, as well as multiple degree programs.
Certification route—Whereby candidates obtain certification to teach. Can be traditional or alternative. Alternative routes to certification include candidates who have a bachelor’s but do not have a degree in education and are completing their certification requirements while teaching full-time.
Degree program—Candidates earn a 4-year or 5-year bachelor’s degree or a master’s degree from a traditional preparation provider. For alternative routes, programs may or may not culminate in a degree.

NCEE 2019-4007 Teacher Preparation Experiences and Early Teaching Effectiveness 10
providers appeared in multiple states (e.g., due to offering online degree programs). As a result, this figure is based on 599 preparation provider-by-state observations. FIGURE READS: Florida, New York, and Texas each had 40 or more preparation providers represented in the sample. SOURCE: Study’s teacher survey data, 2015.
The majority of study teachers entered teaching through traditional routes to certification and received a bachelor’s degree.
Teachers in the full sample were more likely to enter teaching through traditional routes to certification than through alternative routes to certification (77 percent versus 21 percent of the sample;14 see figure 2.6). Fifty-two (52) percent of study teachers described their preparation program as a “traditional” undergraduate program culminating in a 4-year bachelor’s degree. Two (2) percent indicated that their preparation program was a “traditional” post-baccalaureate or fifth-year program, and 23 percent indicated their program was a “traditional” master’s degree or a joint bachelor’s/master’s degree program. The remaining study teachers indicated they entered teaching though an alternative route to certification, with 8 percent of the full sample describing their preparation program as an “alternative” route to certification program that leads to a master’s degree and 13 percent that does not lead to a master’s degree.
Figure 2.6: Percentage of Study Teachers by Certification Route and Degree Program
NOTE: Sample size is 3,291. Certification route and degree program information was missing for three study teachers as a result of survey nonresponse. Total does not equal 100 percent due to rounding. Total percentage of sample entering through alternative route does not correspond with figure 2.4 due to rounding. FIGURE READS: Fifty-two percent of teachers obtained bachelor’s degrees through traditional routes to certification. SOURCE: Study’s teacher survey data, 2015.
14 These percentages are calculated by summing the percentages that appear in figure 2.6, which have been rounded to the nearest integer. Summing without rounding would yield 78 percent of the sample entering through traditional routes and 22 percent through alternative routes.
Bachelor's Degree (Post-Baccalaureate
or Fifth-Year)2%
Master's Degree or Joint
Bachelor's/Master's23%
Master's Degree8%
No Master's Degree13%
Bachelor's Degree (4-Year)
52%
Traditional Route toCertificationAlternative Route toCertification

NCEE 2019-4007 Teacher Preparation Experiences and Early Teaching Effectiveness 11
Teacher Survey on Preparation Experiences
We developed the teacher survey specifically for this study to measure preparation experiences as reported by individual teachers. This approach is in contrast to other studies that document course offerings or graduation requirements of specific programs or providers. On our survey, teachers were asked to indicate how often they received various experiences in their preparation program for initial certification.
Specifically, the study survey asked about teachers’ experiences with instructional strategies within 13 competency areas.
One underlying premise of the survey is that individual teacher candidates—even those within the same preparation program—may vary in the competency areas covered by their preparation experiences, and these differences might explain why we see variation in novice teachers’ effectiveness.
A second premise of the survey is that types of learning opportunities—how teachers learned about instructional strategies in the competency areas—also could make a difference in their early effectiveness. The survey therefore asked study teachers to indicate the extent to which, as part of their preparation, they had experiences obtained through each of four types of learning opportunities: (1) Coursework, (2) Observation, (3) Practice, and (4) Feedback.
In this way, the study’s multidimensional definition of preparation experiences captures both the what and the how of learning to teach. The design of the teacher survey—capturing strategies in a range of competency areas learned through the various types of learning opportunities—was vital to the study’s ability to provide a nuanced picture of teachers’ preparation experiences that ultimately provides a basis for looking at individual preparation experiences and their relationship with teachers’ early effectiveness.15
2.6.1 Identifying the 13 Competency Areas
The study team developed 12 of the 13 competency areas by drawing on four observation instruments that were used in the Measures of Effective Teaching (MET) Project16 to assess instructional quality.17 The
15 See appendix C, figure C.2, for a description of the process of developing the survey. 16 Bill and Melinda Gates Foundation. Measures of Effective Teaching: 1 - Study Information. ICPSR34771-v2.
Ann Arbor, MI: Inter-university Consortium for Political and Social Research [distributor], 2013-09-23. https://doi.org/10.3886/ICPSR34771.v2.
17 The four instruments: Framework for Teaching (FFT) (Danielson 2011); Classroom Assessment Scoring System (CLASS), K–3 (Pianta and Hamre 2009); Protocol for Language Arts Teaching Observation–Prime (PLATO Prime) (Grossman, Hammerness, and McDonald 2009); and Mathematical Quality Instruction Lite (MQI Lite) (Hill et al. 2008).
Key Terms Competency areas—Broad areas of teaching practice describing various instructional strategies shown in prior research to correlate with student achievement. The study defined 13 competency areas, such as Maintaining a Positive Classroom Climate; Building Students’ Higher-Order Thinking Skills; and Effective Mathematics Instruction.
Types of learning opportunities—Ways in which teachers could learn during their preparation about the competency areas. The study defined four types: Coursework, Observation, Practice, and Feedback.

NCEE 2019-4007 Teacher Preparation Experiences and Early Teaching Effectiveness 12
reason for focusing on these four observation instruments was that we were seeking competency areas that research had linked to student achievement.
The four observation instruments together include 34 constructs. (See appendix C, figure C.1, for a list of the full set of constructs.) To reduce the set of 34 constructs to 12 competency areas, we first conducted statistical analyses using the MET Project data. We eliminated six constructs that had either a) a weak relationship with teacher value-added scores (Cohen’s d < .05), b) low variation across the interquartile range, c) a highly skewed distribution. We then conducted a content analysis of the remaining 28 constructs, grouping the constructs that covered similar content into a single competency area. This resulted in 12 competency areas, which we renamed to reflect the underlying content.
We added the 13th competency area to ensure that the survey content was relevant to concerns about preparing new teachers for the growing population of English learners in school districts. Because none of the four observation instruments in the MET Project assessed competency areas related to English learners specifically, the study team consulted with national experts and used existing research to develop one.18
The final list of 13 competency areas is:
• Maintaining a Positive Classroom Climate;
• Managing Student Behavior to Maximize Learning Time;
• Productive Use of Classroom Time;
• Conveying the Importance of Learning;
• Demonstrating Sensitivity to Student Needs;
• Facilitating Extended Classroom Discussions;
• Designing and Using Assessments of Student Learning;
• Building Students’ Higher-Order Thinking Skills;
• Providing Feedback That Helps Student Learning;
• Building Comprehension of Academic Concepts;
• Effective ELA Instruction;
• Effective Mathematics Instruction; and
• Effective Instruction for English Learners.
18 For the research base, the study team relied on the Institute of Education Sciences Practice Guide Teaching Academic Content and Literacy to English Learners in Elementary and Middle School (Baker et al. 2014).

NCEE 2019-4007 Teacher Preparation Experiences and Early Teaching Effectiveness 13
2.6.2 Identifying Sets of Five Teaching Strategies for Each Competency Area
Instead of the survey asking teachers about their preparation experiences with the competency areas themselves, which represent fairly broad aspects of instruction, it asked teachers about their preparation experiences with five specific instructional strategies within each competency area.
For the first 12 sets of five instructional strategies, we drew from examples provided in training manuals for the observation instruments used in the MET Project. For the 13th set, we developed five instructional strategies in consultation with national experts to ensure that the strategies represented instructional approaches that the field commonly recognizes as key in improving English learners’ academic achievement.
2.6.3 Defining the Four Types of Learning Opportunities
We defined these four types of learning opportunities based on a review of the types of opportunities to learn about content that teachers typically receive during their preparation. The four types—Coursework, Observation, Practice and Feedback—align with a framework of a continuum of methods for preparing teachers (Grossman, Compton et al. 2009). These four types of learning opportunities can serve different purposes. For example, Coursework or Observation might help teacher candidates understand a teaching practice; Feedback might help candidates implement a new strategy in their teaching practice. Qualitative research and theory have suggested that all four of these types of learning opportunities are required for learning to take place (McDonald, Kazemi, and Kavanagh 2013).
The survey described the four types of learning opportunities as follows:
• Coursework: “Read about, hear about, or see a role play of the strategy (such as duringcoursework)?”
• Observation: “Observe a teacher using this strategy in a K–12 classroom (include videos and directobservations during your fieldwork or student teaching)?”
• Practice: “Practice this strategy in a K–12 classroom prior to becoming a full-time teacher?”
• Feedback: “Receive feedback on your use of this strategy from program staff or a cooperatingteacher that included information about what you did well/how you could improve?”
Then on a five-point scale, the survey asked teachers to rate the frequency of their preparation experiences (“How often did you…”) obtained through each of the four types of learning opportunities, for each of the five instructional strategies within each of the 13 competency areas. The frequency scale ranged from 1 = “Rarely/Never” experienced that instructional strategy to 5 = “Very often” experienced it. Note that the survey asked teachers to rate the frequency of their preparation experiences individually, without regard to their other ratings for that instructional strategy for that competency area. That is, it was not expected that a teacher would provide ratings of relative frequency; for example, a teacher might give a rating of “Very often” to one, two, three, or all four types of learning opportunities for a strategy.
Finally, the survey also asked teachers to use a five-point scale to assess the usefulness of their preparation experiences for each instructional strategy (across the four types of learning opportunities) now that they had begun teaching. The usefulness scale ranged from 1 = “Have not used” or 2 = “Not useful” to 5 = “Very useful.”
NCEE 2019-4007 Teacher Preparation Experiences and Early Teaching Effectiveness 14
2.6.4 Format of the Survey
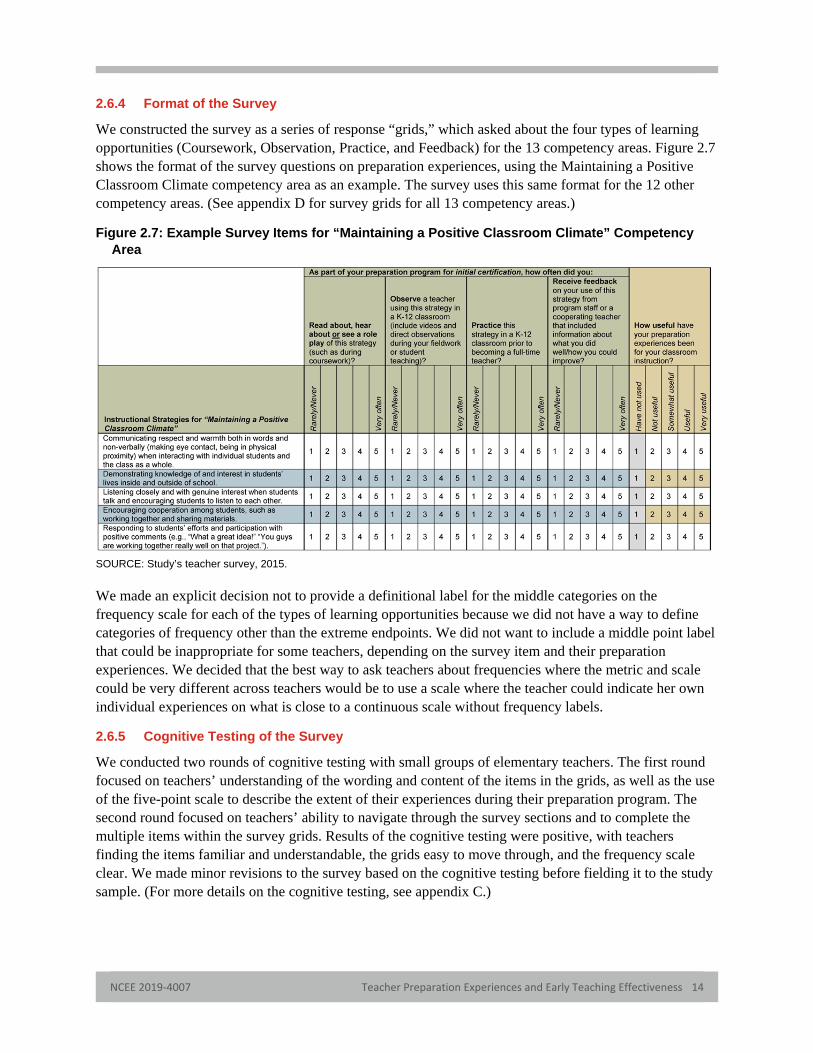
We constructed the survey as a series of response “grids,” which asked about the four types of learning opportunities (Coursework, Observation, Practice, and Feedback) for the 13 competency areas. Figure 2.7 shows the format of the survey questions on preparation experiences, using the Maintaining a Positive Classroom Climate competency area as an example. The survey uses this same format for the 12 other competency areas. (See appendix D for survey grids for all 13 competency areas.)
Figure 2.7: Example Survey Items for “Maintaining a Positive Classroom Climate” Competency Area
SOURCE: Study’s teacher survey, 2015.
We made an explicit decision not to provide a definitional label for the middle categories on the frequency scale for each of the types of learning opportunities because we did not have a way to define categories of frequency other than the extreme endpoints. We did not want to include a middle point label that could be inappropriate for some teachers, depending on the survey item and their preparation experiences. We decided that the best way to ask teachers about frequencies where the metric and scale could be very different across teachers would be to use a scale where the teacher could indicate her own individual experiences on what is close to a continuous scale without frequency labels.
2.6.5 Cognitive Testing of the Survey
We conducted two rounds of cognitive testing with small groups of elementary teachers. The first round focused on teachers’ understanding of the wording and content of the items in the grids, as well as the use of the five-point scale to describe the extent of their experiences during their preparation program. The second round focused on teachers’ ability to navigate through the survey sections and to complete the multiple items within the survey grids. Results of the cognitive testing were positive, with teachers finding the items familiar and understandable, the grids easy to move through, and the frequency scale clear. We made minor revisions to the survey based on the cognitive testing before fielding it to the study sample. (For more details on the cognitive testing, see appendix C.)

NCEE 2019-4007 Teacher Preparation Experiences and Early Teaching Effectiveness 15
Preparation Experience Measures
We used teachers’ responses on the survey to create two types of measures of teachers’ preparation experiences: (1) measures that averaged ratings from the individual survey items; and (2) measures based on broad categories derived from a two-stage exploratory factor analysis of teachers’ survey responses.
2.7.1 Average Measures
We constructed average measures for teachers’ ratings of preparation experiences with the 13 competency areas (combined across the types of learning opportunities); with the four types of learning opportunities (combined across the competency areas); and with the 13 competency areas by type of learning opportunity. (See appendix E for a more detailed description of the construction of these average frequency measures.)19
The average for each competency area is a measure of the total frequency of preparation experiences with that competency, regardless of the type of learning opportunity through which the experiences were received. For example, for a particular competency area, a teacher may have assigned a rating of 4 to having had opportunities to read about the competency area, a rating of 2 to opportunities to observe it being used, a rating of 3 to her own opportunities to practice it, and a rating e of 1 to opportunities to receive feedback about her practice of it. The average of her ratings (average frequency of 2.5) provides a measure of the overall frequency of preparation experiences that teacher received with that competency area through all types of learning opportunities. By averaging in this way, the underlying variation in types of learning opportunities is masked. That is, two teachers may have received very different frequencies of preparation experiences through the four types of learning opportunities but end up having the same overall average frequency for a competency area.
When preparation experiences are averaged within each type of learning opportunity, the average indicates the frequency of preparation experiences that a teacher received with all competency areas through that type of learning opportunity. For example, a teacher may have rated her opportunities through Coursework as 5 for six of the competency areas, as 4 for five of the competency areas, and as 3 for two competency areas. The average of these ratings—((5 x 6) + (4 x 5) + (3 x 2))/13 = average frequency of 4.3) measures how frequently the teacher received preparation experiences through that type of learning opportunity. Again, by averaging this way, the underlying variation in competency areas is masked, since two teachers may arrive at the same average for a learning opportunity but have different frequency patterns across the competency areas.
Because the survey questions used a five-point rating scale, all of the average measures have values between 1 and 5. To facilitate the analysis and presentation of teachers’ responses but maintain a frequency metric similar to the one on the survey, we categorized the average frequencies that teachers reported into four frequency “buckets” as follows:
19 We also constructed an average measure for teachers’ ratings of the usefulness of their preparation experiences (see appendix F, table F.1). Because we found high correlations (from .78 to .85) between teachers’ usefulness ratings and their reported frequency of preparation experiences with the competency areas, we concluded that the usefulness ratings did not provide additional information above and beyond the ratings of the frequency of preparation experiences with competency areas. Therefore, we do not report on usefulness ratings (e.g., as predictors of teaching effectiveness). For more detail on the usefulness ratings reported by study teachers, see appendix F.

NCEE 2019-4007 Teacher Preparation Experiences and Early Teaching Effectiveness 16
• rating less than or equal to 2: very few preparation experiences;
• rating greater than 2 and less than or equal to 3: few preparation experiences;
• rating greater than 3 and less than or equal to 4: some preparation experiences; and
• rating greater than 4: many preparation experiences.
2.7.2 Broad Category Measures
Because there were such a large number of variables from the teacher survey, most of which were highly correlated with each other, we used a two-stage exploratory factor analysis within each of the four types of learning opportunities to reduce the 13 competencies to a small set of measures of preparation experiences for the purposes of analysis.20 The factor analysis identified the same two broad categories of preparation experiences within each of the four types of learning opportunities:
• strategies for creating a productive learning environment; and
• strategies for promoting analytic thinking skills.
This resulted in a total of eight measures—one for each of the broad categories within each of the four types of learning opportunities. See appendix E, table E.1 for a list of the eight resulting measures. Figure 2.8 shows the pattern of loadings of the 13 competency areas on the two broad categories for the four types of learning opportunities.
20 For a detailed discussion of the factor analysis methodology and the factor loadings, see appendix G.

NCEE 2019-4007 Teacher Preparation Experiences and Early Teaching Effectiveness 17
Figure 2.8: Taxonomy of Preparation Experiences for This Study
NOTE: Competency areas 1–4 and 8–13 loaded heavily on the designated broad category for all four types of learning opportunities. Competency areas 5–7 loaded heavily on the designated broad category for only one or two of the types of learning opportunities. We defined “heavily” as when a competency area had factor loadings that were larger than 0.40 and were more than 1.5 times as large as their loadings for the other broad category. FIGURE READS: The teaching competency areas of Maintaining a Positive Classroom Climate, Managing Student Behavior to Maximize Learning Time, Productive Use of Classroom Time, Conveying the Importance of Learning, and Demonstrating Sensitivity to Student Needs fall under the broad category of creating a productive learning environment.
2.7.3 Assessment of Measurement Error in Teacher Survey Responses
Because our measures of teachers’ preparation experiences are based solely on teacher self-report, we conducted analyses to increase our confidence that the measures were credible and that the observed variation on these measures was not just measurement error.
To try to rule out the possibility that the variation in teacher responses was all measurement error we conducted three types of analyses to investigate whether the variation in teacher ratings was systematic. In general, the results of these analyses gave us confidence that the survey responses were credible measures of teachers’ experiences and not simply the result of measurement error.

NCEE 2019-4007 Teacher Preparation Experiences and Early Teaching Effectiveness 18
The first analysis explored whether individual teachers varied in their ratings across instructional strategies. We expected that teachers would not actually have had the same frequency of preparation experiences with all of the 65 instructional strategies across the 13 competency areas, and therefore there should be within-teacher variation in responses. We found that only 3 percent of the teachers reported having the same frequency of preparation experiences with all 65 instructional strategies. Ninety-four (94) percent of the teachers used three or more ratings of the frequency of their preparation experiences with different instructional strategies (ratings from 1 to 5, representing Rarely/Never having preparation experiences with a strategy to Very Often having them) across the 65 instructional strategies.
A second analysis looked at preparation experiences as a function of a teacher’s certification pathway. We expected that teachers certified through traditional routes would report more preparation experiences than teachers certified through alternative routes. Teachers certified through traditional routes generally have higher coursework requirements and typically complete their programs prior to becoming teachers of record. Many alternative-certification programs enroll students who are teachers of record while they are completing the requirements. Our analysis showed that teachers prepared through traditional routes to certification reported statistically significantly more preparation experiences in 12 of the 13 competency areas and through all four types of learning opportunities than did teachers certified through alternative routes to certification. (For detailed findings, see appendix H.)
In a third analysis, we compared the frequency of preparation experiences that teachers reported having obtained through the four types of learning opportunities. We expected that across the four types of learning opportunities, Coursework would be the most frequently reported type of learning opportunity, Observation the second most frequent, Practice the third most frequent, and Feedback the least frequent. The results of our analyses confirmed this pattern, with statistically significant differences in the frequency of preparation experiences among the four types of learning opportunities.
Across these three types of analyses, the consistency of the teachers’ survey results with our a priori expectations is reassuring and makes it unlikely that the results were due to measurement error. However, they do not rule out the possibility that respondents made measurement errors in recalling their experiences. Of course, if responses consisted entirely of measurement error, averages would show no patterns at all. Nevertheless, errors in measuring preparation experiences are likely to be present to some degree, as with any survey asking respondents to recall past events. The study’s large sample means measurement errors are likely to offset and averages will be robust—some respondents may estimate on the high side but others will estimate on the low side. That said, we acknowledge that in the analyses relating preparation experiences to teaching effectiveness, where we use preparation experiences as independent variables, that any measurement error in these variables will cause underestimation of the relationships between experiences and measures of teaching effectiveness (Weisberg 1985).
Teaching Effectiveness Measures
As described in section 2.3, we used the full sample (n = 3,294 teachers) for the analyses focused on the average frequency and variation in teachers’ preparation experiences, but used the subsample (n = 2,533 teachers) for the analyses relating teacher preparation experiences and teaching effectiveness. Teachers in the subsample could have effectiveness scores in ELA, math, or both. Analytic samples include 2,032 teachers with ELA effectiveness scores and 1,894 teachers with math effectiveness scores. The study included 1,394 teachers who had both math and ELA effectiveness scores.

NCEE 2019-4007 Teacher Preparation Experiences and Early Teaching Effectiveness 19
In order to estimate teaching effectiveness for this subsample of study teachers, we obtained student achievement outcomes from administrative data linking student-level ELA and math state achievement test scores to the teacher(s) who were responsible for the students’ ELA or math instruction in grades 4–6 in the 2012–13, 2013–14, or 2014–15 school year. We linked the student records over time and included the prior year such that baseline (pre-test) measures of ELA and math achievement and baseline student demographic measures were available for each student.
Below we describe the methodology for creating teaching effectiveness measures and estimating the relationships of teacher preparation experiences to effectiveness. Additional technical details appear in appendix I.
2.8.1 Estimating Teaching Effectiveness
The measures of ELA and math teaching effectiveness are estimates of each teacher’s contribution to his or her students’ learning over a single school year. The basic premise of the estimation is that given a student’s grade level, prior year ELA and math achievement scores, and demographic characteristics, the student will have a predicted ELA or math achievement level for the current year that will represent the average score of other students with similar characteristics in the same district or state. To the extent that the student’s current-year ELA or math achievement score (1) is higher than the score that was predicted for that student, the teacher is credited with being more effective than average for that student; or (2) is lower than the score that was predicted for that student, the teacher is credited with being less effective than average for that student.
Thus, a teacher’s effectiveness measure is an average of the difference between observed and predicted achievement scores of all of his or her students. Teachers with positive effectiveness measures have students that, on average, scored higher on end-of-year achievement tests than did other students with similar baseline achievement levels and demographic characteristics.
2.8.2 Relating Preparation Experiences to Teaching Effectiveness
To describe the relationships between teachers’ preparation experiences and their teaching effectiveness, we report estimates from a series of regression models. Each regression model has a measure of ELA or math teaching effectiveness as the dependent variable, a preparation experience measure as an independent variable, and several covariates included as statistical controls. The result of fitting a model to the data is a regression coefficient for each preparation experience measure that estimates the relationship between that preparation experience and teaching effectiveness. Thus, positive regression coefficients that are statistically significant are interpreted as an indication that more of those preparation experiences are associated with greater teaching effectiveness.21
21 Even when a significant association is found, we cannot conclude that there is a causal relationship between preparation experiences and teaching effectiveness. For example, individuals who possess some unmeasured trait might be more effective teachers regardless of their preparation experiences, and the teachers with that trait might also be more likely to obtain more of that preparation experience.

NCEE 2019-4007 Teacher Preparation Experiences and Early Teaching Effectiveness 20
Average Frequencies and Variation of Teacher Preparation Experiences
This chapter presents results from analyses to describe preparation experiences reported by study teachers, which answer the study’s first research question: What experiences do novice teachers report having received as part of their preparation?
First, we summarize the average frequencies of preparation experiences reported by teachers for each of the 13 competency areas and the four types of learning opportunities defined in chapter 2. These analyses inform our understanding of the relative frequency that teachers reported for each competency area and type of learning opportunity.
Second, we examine the extent to which teachers varied in the average frequencies of preparation experiences they reported for the 13 competency areas and four types of learning opportunities; that is, did most teachers report similar frequencies of preparation experiences, or did some teachers report few preparation experiences and others many preparation experiences?
Third, we examine the average frequencies and variation of preparation experiences with the two broad categories—creating a productive learning environment and promoting analytic thinking skills.
Analyses of preparation experiences were initially conducted for all teachers regardless of the number of years of teaching experience and then separately for first-, second-, and third-year teachers. Because the results were not statistically significantly different by years of teaching experience, the results presented below are for all teachers.
Preparation Experiences With Competency Areas
This section provides information about the relative frequency of preparation experiences that teachers reported with the 13 competency areas and the extent to which the frequency might vary across teachers. Although states set content requirements, preparation providers are free to meet those requirements in diverse ways. As a result, providers can differ in what competency areas their programs emphasize (Grossman et al. 2008), as well as in the way they organize and deliver preparation experiences (Grossman et al. 2008; Zeichner and Conklin 2005).
3.1.1 Relative Frequency Across Competency Areas
Results below describe the relative frequency in teachers’ preparation experiences among the 13 competency areas. Because these analyses focus on content regardless of how that content was obtained, we averaged teachers’ ratings across the four types of learning opportunities.
Key Findings
• For 12 of the 13 competency areas andfor each of the four types of learningopportunity, a majority of teachersreported receiving at least somepreparation experiences.
• For each of the 13 competency areasand the four types of learningopportunities, teachers reportedpreparation experience ratings acrossthe full range of the scale, from 1(rarely/never) to (5) very often.
• Across all 13 competency areas,Coursework was the most commonlyreported type of learning opportunityand Feedback was the least commonlyreported.
• For each type of learning opportunity,teachers reported more preparationexperiences with creating a productivelearning environment than withpromoting analytic thinking skills.

NCEE 2019-4007 Teacher Preparation Experiences and Early Teaching Effectiveness 21
For 12 of the 13 competency areas (excluding Effective Instruction for English Learners), a majority of teachers reported at least some preparation experiences.
At least some preparation experiences describes a rating greater than 3 on the five-point scale (in figure 3.1, the sum of the two rightmost sections of the bars). For the 12 competency areas where a majority of the teachers reported at least some experiences, this percentage ranged from 86 percent of teachers on Maintaining a Positive Classroom Climate to 64 percent on Building Comprehension of Academic Concepts. Average ratings for the 12 competencies (i.e., excluding Effective Instruction for English Learners) were between 3.4 and 4.0.
Teachers reported that they received relatively fewer experiences related to Effective Instruction for English Learners compared with the other competency areas.
Less than half of the teachers (43 percent) reported at least some preparation experiences with Effective Instruction for English Learners. The average rating (2.8) is consistent with fewer teachers receiving extensive preparation on this competency area than on the other 12 areas. This finding is notable considering that more than half (51 percent) of study teachers taught in districts with at least 10 percent English learners (see figure 2.3).
3.1.2 Variation Across Teachers in Competency Areas
We examined variation across teachers in the frequency of preparation experiences with each competency area, which provided an overall picture of the variation across teachers in the sample. To the extent that all 13 competency areas are important in preparing teachers to be effective in the classroom, it is of interest to learn whether all teacher candidates received preparation experiences in all these areas. Also of interest is whether those experiences are limited or extensive.
For all 13 competency areas, teachers reported preparation experience ratings across the full range of the scale, from 1 (Rarely/Never) to 5 (Very often).
Across the 13 competencies, between 3 and 33 percent of teachers reported very few preparation experiences. Between 11 and 27 percent of teachers reported a few preparation experiences. Between 26 and 42 percent of teachers reported some preparation experiences. Between 17 and 49 percent of teachers reported many preparation experiences (see figure 3.1).
Since we do not have evidence about how many preparation experiences are enough to prepare teachers to demonstrate competencies effectively in the classroom, we looked at within-teacher frequencies in two ways. First, we assessed the number of competency areas (out of 13) for which teachers reported receiving at least a few preparation experiences. Second, we assessed the number of competency areas for which teachers reported receiving many preparation experiences.
More than half of teachers (57 percent) reported at least a few preparation experiences with the full set of 13 competency areas.
An additional 38 percent of teachers reported at least a few preparation experiences with between seven and 12 competency areas, and a small percentage of teachers (5 percent) reported at least a few experiences with up to six of the competency areas (see figure 3.2).

NCEE 2019-4007 Teacher Preparation Experiences and Early Teaching Effectiveness 22
Figure 3.1: Teacher-Reported Frequency of Preparation Experiences by Competency Area
NOTE: Teachers’ responses to the survey questions about preparation experiences ranged from 1 to 5, where 1 = “Rarely/Never” and 5 = “Very often.” This figure shows the proportion of teachers in four groups based on teachers’ reported frequency of preparation experiences (averaged across the four types of learning opportunities) for each competency area. The 13 competency areas are listed in order of highest to lowest average score. Sample size varied between 3,249 and 3,289 due to nonresponse. All sample averages are statistically different from one another (p < .05) except these: (1) Effective English Language Arts Instruction, Building Students’ Higher-Order Thinking Skills, and Facilitating Extended Classroom Discussions are not different from one another; and (2) Effective Mathematics Instructions and Building Comprehension of Academic Concepts are not different from each other. FIGURE READS: Three percent of teachers reported having had very few preparation experiences with Maintaining a Positive Classroom Climate. The sample average rating SOURCE: Study’s teacher survey data, 2015.
33
10
15
8
7
8
9
8
6
5
5
4
3
24
27
20
25
21
21
21
22
21
19
17
16
11
26
40
36
40
42
42
37
37
37
39
39
38
37
17
24
29
26
30
30
33
33
36
38
40
42
49
Sample Avg = 2.8
Sample Avg = 3.4
Sample Avg = 3.4
Sample Avg = 3.4
Sample Avg = 3.5
Sample Avg = 3.5
Sample Avg = 3.5
Sample Avg = 3.6
Sample Avg = 3.7
Sample Avg = 3.7
Sample Avg = 3.8
Sample Avg = 3.8
Sample Avg = 4.0
0 25 50 75 100
Effective Instruction for English Learners
Building Comprehension of Academic Concepts
Effective Mathematics Instruction
Providing Feedback that Helps Student Learning
Facilitating Extended Classroom Discussions
Building Students' Higher-Order Thinking Skills
Effective English Language Arts Instruction
Designing and Using Assessments of Student Learning
Demonstrating Sensitivity to Student Needs
Conveying the Importance of Learning
Productive Use of Classroom Time
Managing Student Behavior to Maximize Learning Time
Maintaining a Positive Classroom Climate
Percentage of Teachers
Com
pete
ncy
Area
Very few (1 ≤ Avg ≤ 2) Few (2 < Avg ≤ 3) Some (3 < Avg ≤ 4) Many (4 < Avg ≤ 5)

NCEE 2019-4007 Teacher Preparation Experiences and Early Teaching Effectiveness 23
Figure 3.2: Percentage of Teachers Reporting At Least A Few Experiences in Competency Areas
NOTE: Receipt of at least a few preparation experiences is defined as an average rating for that competency area of 2 or greater on the five-point scale. The three groups shown in this figure are based on the number of competency areas with which teachers reported at least a few preparation experiences. Sample size varied between 3,249 and 3,289 due to nonresponse. FIGURE READS: Fifty-seven percent of the teachers reported at least a few preparation experiences with the 13 competency areas. SOURCE: Study’s teacher survey data, 2015.
Seven percent of teachers reported many preparation experiences with the full set of 13 competency areas.
In addition, another 23 percent of teachers reported many preparation experiences with between seven and 12 competency areas. Slightly more than a quarter (28 percent) of teachers did not report this frequency of preparation experiences with any of the competency areas (see figure 3.3).
Figure 3.3: Percentage of Teachers Reporting Many Preparation Experiences in Competency Areas
NOTE: Receipt of many preparation experiences with a competency area is defined as an average rating for that competency area of more than 4 on the five-point scale. The four groups shown in this figure are based on the number of competency areas for which teachers reported many preparation experiences. Sample size varied between 3,286 and 3,288 due to nonresponse. FIGURE READS: Seven percent of the teachers reported many preparation experiences with all 13 competency areas. SOURCE: Study’s teacher survey data, 2015.
5
38
57
0
10
20
30
40
50
60
70
80
90
100
Perc
enta
ge o
f Tea
cher
s13 Competencies7-12 CompetenciesUp to 6 Competencies
28
42
23
7
0102030405060708090
100
Perc
enta
ge o
f Tea
cher
s
13 Competencies7-12 Competencies1-6 CompetenciesNo Competencies

NCEE 2019-4007 Teacher Preparation Experiences and Early Teaching Effectiveness 24
Most of the variation in preparation experiences with competency areas was at the level of the individual teacher as opposed to being associated with preparation provider.
We conducted analyses to examine the sources of the variance in teachers’ reported preparation experiences with each of the competency areas. We compared three sources of variation: (1) variation among teachers within the same degree programs within preparation providers; (2) variation between degree programs within preparation providers; and (3) variation between preparation providers. For all 13 competency areas, there was more variation among teachers within degree programs within providers than between degree programs or between providers.
For the 13 competency areas, a minimum of 86 percent of the variance in preparation experiences was at the level of individual teachers, with only 14 percent or less being explained by degree programs and preparation providers (see appendix J). These results, while based on a limited number of preparation providers and degree programs, help explain the findings of prior research that has produced little or no evidence that some providers or programs produce more effective teachers than others (Boyd et al. 2009; Goldhaber, Liddle, and Theobald 2013; Henry et al. 2011a, 2011b; Koedel et al. 2016; Mihaly et al. 2013; Noell 2009).22 If knowing a teacher’s preparation provider or degree program conveys little information about the preparation experiences that an individual teacher received, then it is not surprising that providers and programs are poor predictors of subsequent teaching effectiveness.
Measurement error may be contributing to variation within programs. However, the degree to which measurement error is responsible for variation is difficult to know because individual teacher candidate experiences within preparation programs can differ. Even within the same degree program, there are differences in which professors teach courses, how professors structure clinical experiences and the emphases they put on them, and how teacher candidates are placed in different schools. Without diary-level data on experiences, it is impossible to know whether variation in reported experiences within programs is a result of measurement error or the result of real variation in experiences. That said, the multiple analyses that we conducted to address concerns of measurement error described in section 2.7.3 and appendix H provide some assurance that the results are not solely due to measurement error. It is also worth noting that the 14 percent of variation in preparation experiences that is explained by providers would not arise if reported experiences were entirely measurement error (i.e., teachers guessed at every response). These errors would not be correlated with a teacher’s provider.
The finding that there is greater variation within programs and providers than between them supports and motivates the analyses presented in chapter 4. Those analyses seek to answer the question of whether individuals’ unique preparation experiences, regardless of the program in which teachers obtained them, are associated with subsequent teaching effectiveness.
22 Although some of these studies initially suggest a modest amount of variation in preparation program performance, they have methodological issues that resulted in over-estimation of the true variability (Koedel et al. 2016). Taken as a whole, the body of research suggests little or no variation in effectiveness associated with preparation programs.
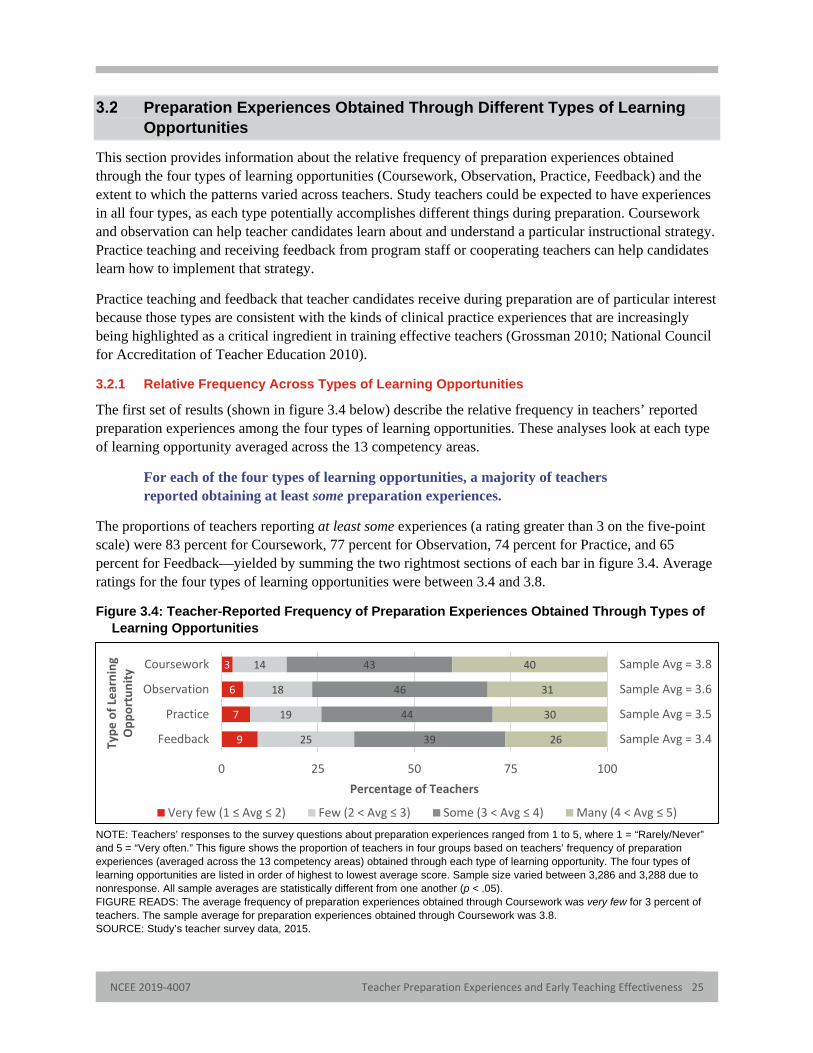
NCEE 2019-4007 Teacher Preparation Experiences and Early Teaching Effectiveness 25
Preparation Experiences Obtained Through Different Types of Learning Opportunities
This section provides information about the relative frequency of preparation experiences obtained through the four types of learning opportunities (Coursework, Observation, Practice, Feedback) and the extent to which the patterns varied across teachers. Study teachers could be expected to have experiences in all four types, as each type potentially accomplishes different things during preparation. Coursework and observation can help teacher candidates learn about and understand a particular instructional strategy. Practice teaching and receiving feedback from program staff or cooperating teachers can help candidates learn how to implement that strategy.
Practice teaching and feedback that teacher candidates receive during preparation are of particular interest because those types are consistent with the kinds of clinical practice experiences that are increasingly being highlighted as a critical ingredient in training effective teachers (Grossman 2010; National Council for Accreditation of Teacher Education 2010).
3.2.1 Relative Frequency Across Types of Learning Opportunities
The first set of results (shown in figure 3.4 below) describe the relative frequency in teachers’ reported preparation experiences among the four types of learning opportunities. These analyses look at each type of learning opportunity averaged across the 13 competency areas.
For each of the four types of learning opportunities, a majority of teachers reported obtaining at least some preparation experiences.
The proportions of teachers reporting at least some experiences (a rating greater than 3 on the five-point scale) were 83 percent for Coursework, 77 percent for Observation, 74 percent for Practice, and 65 percent for Feedback—yielded by summing the two rightmost sections of each bar in figure 3.4. Average ratings for the four types of learning opportunities were between 3.4 and 3.8.
Figure 3.4: Teacher-Reported Frequency of Preparation Experiences Obtained Through Types of Learning Opportunities
NOTE: Teachers’ responses to the survey questions about preparation experiences ranged from 1 to 5, where 1 = “Rarely/Never” and 5 = “Very often.” This figure shows the proportion of teachers in four groups based on teachers’ frequency of preparation experiences (averaged across the 13 competency areas) obtained through each type of learning opportunity. The four types of learning opportunities are listed in order of highest to lowest average score. Sample size varied between 3,286 and 3,288 due to nonresponse. All sample averages are statistically different from one another (p < .05). FIGURE READS: The average frequency of preparation experiences obtained through Coursework was very few for 3 percent of teachers. The sample average for preparation experiences obtained through Coursework was 3.8. SOURCE: Study’s teacher survey data, 2015.
9
7
6
3
25
19
18
14
39
44
46
43
26
30
31
40
Sample Avg = 3.4
Sample Avg = 3.5
Sample Avg = 3.6
Sample Avg = 3.8
0 25 50 75 100
Feedback
Practice
Observation
Coursework
Percentage of Teachers
Type
ofLe
arni
ngO
ppor
tuni
ty
Very few (1 ≤ Avg ≤ 2) Few (2 < Avg ≤ 3) Some (3 < Avg ≤ 4) Many (4 < Avg ≤ 5)
NCEE 2019-4007 Teacher Preparation Experiences and Early Teaching Effectiveness 26
Coursework was the most common type of learning opportunity through which teachers received experiences with various competency areas, and Feedback was the least common.
Teachers reported that Coursework was the type of learning opportunity through which they received the most preparation experiences (average of 3.8 on the five-point scale) and Feedback was the least (average of 3.4). This pattern is also reflected in the proportion of teachers who reported at least some preparation experiences with each type: 83 percent for Coursework versus 65 percent for Feedback (see figure 3.4 above). However, nearly a quarter or more of teachers reported few or very few experiences with three of the four types of learning opportunities: 24 percent for observation, 26 percent for practice, and 34 percent for feedback.
The pattern of receiving the most preparation experiences through Coursework and the least through Feedback was consistent across the 13 competency areas.
As demonstrated in figure 3.5 (below), within each of the competency areas, the Coursework average frequency is higher than that for Feedback. For example, teacher reports of average preparation experiences with Maintaining a Positive Classroom Climate is 4.1 for Coursework and 3.7 for Feedback. In general, there is a pattern across the competency areas of higher sample averages from left to right (from Coursework to Feedback).

NCEE 2019-4007 Teacher Preparation Experiences and Early Teaching Effectiveness 27
Figure 3.5: Teacher-Reported Frequency of Preparation Experiences With Competency Areas by Type of Learning Opportunity
NOTE: Teachers’ responses to the survey questions about frequency of preparation experiences ranged from 1 to 5, where 1 = “Rarely/Never” and 5 = “Very often.” Sample size varied between 3,249 and 3,289. For every competency area, the Coursework mean was significantly higher than the Feedback mean (p < .05). FIGURE READS: The sample average of frequency of preparation experiences with Maintaining a Positive Classroom Climate through Coursework was 4.1. SOURCE: Study’s teacher survey data, 2015.
4.1 4.0 4.0
3.73.9 3.9 3.8
3.6
3.9 3.8 3.7 3.6
3.93.7 3.7
3.5
3.8 3.7 3.6 3.5
3.9
3.6 3.5 3.4
3.83.6
3.4 3.3
3.8
3.5 3.5 3.4
3.73.5 3.4 3.4
3.6 3.5 3.4 3.3
3.63.4 3.3 3.2
3.5 3.4 3.3 3.2 3.2
2.8 2.7 2.6
1.0
1.5
2.0
2.5
3.0
3.5
4.0
4.5
5.0Ma
intain
ing a
Posit
iveCl
assro
om C
limate
Mana
ging S
tuden
t Beh
avior
toMa
ximize
Lear
ning T
ime
Prod
uctiv
e Use
ofCl
assro
omTim
e
Conv
eying
the I
mpor
tance
ofLe
arnin
g
Demo
nstra
ting S
ensit
ivity
toSt
uden
tNee
ds
Desig
ning a
nd U
sing
Asse
ssme
nts of
Stud
ent
Lear
ning
Effec
tive E
nglis
h Lan
guag
eAr
tsIns
tructi
on
Build
ing S
tuden
ts' H
igher
-Or
derT
hinkin
g Skil
ls
Facil
itatin
g Exte
nded
Clas
sroom
Disc
ussio
ns
Prov
iding
Fee
dbac
ktha
t Help
sSt
uden
tLea
rning
Effec
tive M
athem
atics
Instru
ction
Build
ing C
ompr
ehen
sion o
fAc
adem
icCo
ncep
ts
Effec
tive I
nstru
ction
for E
nglis
hLe
arne
rs
Aver
age L
evel
of P
repa
ratio
nEx
perie
nces
Competency Area

NCEE 2019-4007 Teacher Preparation Experiences and Early Teaching Effectiveness 28
3.2.2 Variation Across Teachers in Types of Learning Opportunities
Similar to the analyses conducted for competency areas in section 3.1, we examined variation in the types of learning opportunities that teachers experienced. To the extent that the four types of learning opportunities serve different purposes, it is of interest to learn whether all teachers have experiences in all four types. Also of interest is whether those experiences are limited or extensive.
For each type of learning opportunity, teachers reported preparation experience ratings across the full range of the scale, from 1 to 5.
Across the four types of learning opportunities, between 3 and 9 percent of teachers reported very few preparation experiences (a rating of less than or equal to 2 on the five-point scale). Between 14 and 25 percent of teachers reported few preparation experiences (a rating of greater than 2 and less than or equal to 3 on the five-point scale). Between 39 and 46 percent of teachers reported some preparation experiences (a rating greater than 3 and less than or equal to 4). Between 26 and 40 percent of teachers reported many preparation experiences (a rating of greater than 4 on the five-point scale; see figure 3.4 above).
Because there is no criterion for how many preparation experiences through the different types of learning opportunities are optimal for preparing teachers to effectively use an instructional strategy, we calculated for each teacher the number of competency areas for which he/she obtained a few as well as many preparation experiences through each of the four types of learning opportunities.
Most teachers reported at least a few preparation experiences obtained through all four types of learning opportunities.
Eighty-seven (87) percent of teachers reported at least a few experiences obtained through each of the four types of learning opportunities. Six (6) percent of teachers reported at least a few experiences obtained through three of the types of learning opportunities, and 7 percent reported at least a few experiences obtained through two or fewer types of learning opportunities (see figure 3.6).
Figure 3.6: Percentage of Teachers Reporting At Least A Few Preparation Experiences Obtained Through Types of Learning Opportunities
NOTE: Receipt of at least a few preparation experiences obtained through any one type of learning opportunity is defined as an average frequency rating of greater than 2 on the five-point scale. The three groups shown in this figure are based on the number of types of learning opportunities for which teachers reported at least a few preparation experiences. Sample size varied between 3,286 and 3,288 due to nonresponse.
76
87
0
10
20
30
40
50
60
70
80
90
100
Perc
enta
ge o
f Tea
cher
s
4 Types of Learning Opportunities
3 Types of Learning Opportunities
Up to 2 Types of LearningOpportunities

NCEE 2019-4007 Teacher Preparation Experiences and Early Teaching Effectiveness 29
FIGURE READS: Eighty-seven percent of the teachers reported at least a few (rating of greater than 2 out of 5) preparation experiences with all four types of learning opportunities. SOURCE: Study’s teacher survey data, 2015.
About a fifth of the teachers reported many preparation experiences obtained through all four types of learning opportunities.
Twenty-one (21) percent of teachers reported that their preparation experiences obtained through all four types of learning opportunities were many (greater than 4 on the five-point scale). More than half of the teachers (52 percent) did not report receiving many experiences obtained through any of the types (see figure 3.7).
Figure 3.7: Percentage of Teachers Reporting Many Preparation Experiences Obtained Through Types of Learning Opportunities
NOTE: Receipt of many preparation experiences obtained through any one type of learning opportunity is defined as a rating for that type of greater than 4 on the five-point scale. The five groups shown in this figure are based on the number of types of learning opportunities for which teachers reported many preparation experiences. Sample size varied between 3,286 and 3,288 due to nonresponse. FIGURE READS: Twenty-one percent of the teachers reported many (rating of greater than 4 out of 5) preparation experiences obtained through all four types of learning opportunities. SOURCE: Study’s teacher survey data, 2015.
Most of the variation in preparation experiences with types of learning opportunities was at the level of the individual teacher as opposed to being associated with preparation provider.
We conducted analyses to examine the sources of the variance in teachers’ reported experiences with each of the types of learning opportunities. We compared three sources of variation: (1) variation among teachers within the same degree programs within preparation providers; (2) variation between degree programs within preparation providers; and (3) variation between preparation providers. For all four types of learning opportunities, there was more variation among teachers within degree programs within providers than between degree programs or between preparation providers. We found that for three of the four types of learning opportunities (the exception was Practice), individual teachers accounted for nearly 90 percent of the variance in types of learning opportunities. For Practice, a somewhat smaller portion of
52
14
85
21
0
10
20
30
40
50
60
70
80
90
100
Perc
enta
ge o
fTea
cher
s
4 Types of Learning Opportunities
3 Types of Learning Opportunities
2 Types of Learning Opportunities
1 Type of Learning Opportunity
No Type of Learning Opportunity

NCEE 2019-4007 Teacher Preparation Experiences and Early Teaching Effectiveness 30
the variance (83 percent) was at the individual teacher level (see appendix J). As noted in the previous section, measurement error may play some role in explaining this variation.
Preparation Experiences With Two Broad Categories Within Four Types of Learning Opportunities
As described in chapter 2, to develop a more manageable set of measures of preparation experiences for comparative and relational analyses, we reduced the 13 competency areas to two broad categories of preparation experiences—creating a productive learning environment and promoting analytic thinking skills--within each of the four types of learning opportunities. This resulted in eight scores—one for each broad category measure for each type of learning opportunity. Scores based on the two broad category measures behaved similarly to the scores for the average measures of the individual competency areas.
3.3.1 Average Frequencies of Preparation Experiences in Two Broad Categories Within Four Types of Learning Opportunities
The first analyses we conducted focused on the relative frequency in preparation experiences across the two broad categories.
Teachers reported more preparation experiences with creating a productive learning environment than with promoting analytic thinking skills.
For each type of learning opportunity, teachers reported more preparation experiences with creating a productive learning environment than with promoting analytic thinking skills (p < .05). Looking first at preparation experiences obtained through Coursework: the average rating of 3.8 with creating a productive learning environment was greater than the average rating of 3.6 with promoting analytic thinking skills (p < .05). The other three types of learning opportunities also were more frequent for the broad category of creating a productive learning environment than for promoting analytic thinking skills: 3.6 versus 3.4 for Observation (p < .05); 3.6 versus 3.3 for Practice (p < .05); and 3.5 versus 3.2 for Feedback (p < .05) (see figure 3.8 below).
3.3.2 Variation of Preparation Experiences in Two Broad Categories Within Four Types of Learning Opportunities
Teachers varied considerably in the frequency of preparation experiences reported for the two broad categories.
For both creating a productive learning environment and promoting analytic thinking skills, teachers reported preparation experience ratings across the full range, from 1 to 5, for each type of learning opportunity. For example, for creating a productive learning environment through Coursework, 3 percent of teachers reported very few preparation experiences, 13 percent reported few preparation experiences, 40 percent reported some preparation experiences, and 44 percent reported many preparation experiences. Similarly, for promoting analytic thinking skills through Coursework, 5 percent of teachers reported very few preparation experiences, 18 percent reported few preparation experiences, 43 percent reported some preparation experiences, and 34 percent reported many preparation experiences (see figure 3.8 below).

NCEE 2019-4007 Teacher Preparation Experiences and Early Teaching Effectiveness 31
Figure 3.8: Teacher-Reported Frequency of Preparation Experiences by Type of Learning Opportunity and Broad Category
NOTE: Teachers’ responses to the survey questions about preparation experiences ranged from 1 to 5, where 1 = “Rarely/Never” and 5 = “Very often.” This figure shows the proportion of teachers in four groups based on teachers’ average preparation experiences with each type of learning opportunity within each broad category. The four types of learning opportunities are listed in order of highest to lowest average score. Sample size varied between 3,249 and 3,289 due to nonresponse. For each type of learning opportunity, sample averages were significantly larger for creating a productive learning environment than for promoting analytic thinking skills (p < .05). Additionally, within each broad category, all sample averages for different types of learning opportunities were significantly different from one another. FIGURE READS: The average frequency of preparation experiences with creating a productive learning environment–Coursework was very few for 3 percent of teachers. The average frequency of preparation experiences with creating a productive learning environment–Coursework was 3.8. SOURCE: Study’s teacher survey data, 2015
For both of the broad categories, Coursework was the most common type of learning opportunity, and Feedback was the least common.
For creating a productive learning environment, teachers reported that they received the most experiences through Coursework (average of 3.8), and the least through Feedback (average of 3.5). For promoting analytic thinking skills, teachers again reported that they received the most experiences through Coursework (average of 3.6), and the least through Feedback was (average of 3.2) (see figure 3.8 above).
12
9
7
5
8
6
4
3
28
25
23
18
19
14
15
13
38
45
47
43
42
44
44
40
22
21
24
34
31
36
37
44
Sample Avg = 3.2
Sample Avg = 3.3
Sample Avg = 3.4
Sample Avg = 3.6
Sample Avg = 3.5
Sample Avg = 3.6
Sample Avg = 3.6
Sample Avg = 3.8
0 25 50 75 100
Feedback
Practice
Observation
Coursework
Feedback
Practice
Observation
CourseworkPr
omot
ing
anal
ytic
thin
king
skill
s
Crea
ting
apr
oduc
tive
lear
ning
envi
ronm
ent
Percentage of Teachers
Type
of L
earn
ing
Opp
ortu
nity
and
Broa
d Ca
tego
ry
Very few (1 ≤ Avg ≤ 2) Few (2 < Avg ≤ 3) Some (3 < Avg ≤ 4) Many (4 < Avg ≤ 5)

NCEE 2019-4007 Teacher Preparation Experiences and Early Teaching Effectiveness 32
Relationships of Preparation Experiences to Teaching Effectiveness
This chapter presents results of analyses of the relationships of teachers’ preparation experiences to teaching effectiveness in ELA and math, which answer the study’s second research question: What are the relationships between teacher-reported preparation experiences and novice teachers’ effectiveness in improving student achievement?
In addition to examining overall relationships between teaching effectiveness and preparation experiences with the two broad categories of preparation experiences (creating a productive learning environment, promoting analytic thinking skills) by type of learning opportunity, the chapter also looks at these relationships across teachers’ first three years of teaching.
Relationships of Preparation Experiences to Teaching Effectiveness in ELA and Math
There is much debate about the types of competencies that should be taught in teacher preparation programs. However, both of the broad categories of instructional strategies that we have used as measures of teacher preparation experiences are viewed as essential to teaching effectiveness: creating a productive learning environment as a foundational skill to having command of the classroom, and promoting analytic thinking skills as a more advanced but still essential skill necessary to facilitate student learning (Gill et al. 2016).
Further, there is strong interest in the field in the methods by which teachers learn these skills, with a growing consensus of the importance of providing teachers more opportunities for practice and feedback in classroom settings prior to their becoming full-time classroom teachers (Grossman 2010; Grossman, Hammerness and McDonald 2009; National Council for Accreditation of Teacher Education 2010). This study provides a new lens on teacher preparation, by asking teachers to report in detailed ways about the frequency of preparation experiences—including through practice and feedback—that they had with very specific instructional strategies in those two broad categories of teaching skills. This detailed information on teachers’ preparation experiences allows the current study to move beyond prior research that focused only on preparation programs and to explore whether what and how teachers learn in these programs are related to their early effectiveness.
To describe the relationships between teacher preparation experiences and teaching effectiveness in this section, we report estimates from a series of regression models. Each regression model has a measure of ELA or math teaching effectiveness as the dependent variable, one of the study’s two broad categories of preparation experiences as an independent variable, and several covariates included as statistical controls, as described in section 2.8.2. Results of these analyses are described below.
Key Findings
• More preparation experiences with creating aproductive learning environment were related togreater teaching effectiveness, particularly in ELA.
• Preparation experiences with promoting analyticthinking skills were not related to teachingeffectiveness.
• The relationships of preparation experiences withcreating a productive learning environment toteaching effectiveness remained relativelyconstant across teachers’ first three years ofteaching.

NCEE 2019-4007 Teacher Preparation Experiences and Early Teaching Effectiveness 33
More preparation experiences with creating a productive learning environment were related to greater teaching effectiveness, particularly in ELA.
Preparation experiences with creating a productive learning environment obtained through the learning opportunities of Observation, Practice, and Feedback had positive and statistically significant associations with ELA teaching effectiveness. Additionally, preparation experiences obtained through Practice were positively and significantly associated with math teaching effectiveness (table 4.1).23
Table 4.1: Standardized Regression Coefficients for Relationships of Preparation Experiences with Creating a Productive Learning Environment to ELA and Math Teaching Effectiveness by Type of Learning Opportunity
Creating a Productive Learning Environment by Type of Learning Opportunity
Coursework Observation Practice Feedback ELA (n = 2,032 teachers) 0.045 0.081* 0.092** 0.067*
Math (n = 1,894 teachers) 0.008 0.049 0.061* 0.029
* p < .05; ** p < .01.FIGURE READS: The regression coefficient for the relationship of preparation experiences with creating a productive learningenvironment obtained through Practice to ELA teaching effectiveness is 0.092 and is statistically significantly greater than zero(p < .01). This result indicates that a one-unit increase in preparation experiences (on a five-point scale ranging from 1 =Rarely/Never to 5 = Very often) is associated with an increase in teaching effectiveness equal to 0.092 standard deviation units ofteaching effectiveness. The relationship was estimated using data from n = 2,032 ELA teachers.SOURCE: Preparation experience measures: study’s teacher survey data, 2015. Effectiveness measures: study’s teacher-studentlinked data, 2012–15.
To understand the magnitude of the relationships, we compared the benefit of more frequent preparation experiences to the increase in teaching effectiveness over a year of teaching. Multiple studies have shown that teaching effectiveness improves as teachers gain more experience in the classroom (Boyd et al. 2009; Harris and Sass 2007, 2011; Kini and Podolsky 2016; Xu, Hannaway, and Taylor 2009). This comparison assesses the value of more frequent preparation experiences in the context of typical gains shown to occur in teaching effectiveness over time. To assess the magnitude of the relationships of preparation experiences with creating a productive learning environment to teaching effectiveness, we compared the increase in effectiveness associated with a one-point increase in preparation experiences (measured on a five-point scale ranging from 1 = “Rarely/Never” to 5 = “Very often”) versus the average year-to-year differences in teaching effectiveness of study teachers.
In ELA, for preparation experiences with creating a productive learning environment, the difference in effectiveness that was associated with that one-point increase in preparation experiences ranged from 0.07 to 0.09 standard deviation (SD) units of teaching effectiveness across Observation, Practice, and Feedback. These differences are about half the size of the average difference in effectiveness between first- and second-year ELA teachers in the study’s sample (0.15 SD units).
In math, for preparation experiences with creating a productive learning environment, the difference in effectiveness that was associated with that one-point increase in experiences was 0.06 SD units of
23 Alternative models with different sets of control variables produced similar results and did not fundamentally change the conclusions about the relationships of preparation experiences to teaching effectiveness (see appendix K for details).

Teacher Preparation Experiences and Early Teaching Effectiveness 34
teaching effectiveness for Practice. The difference in effectiveness in math associated with a one-unit increase in preparation experiences with creating a productive learning environment obtained through Practice is about a fifth the size of the average difference in effectiveness between first- and second-year math teachers (0.30 SD units).
An alternative way of expressing these effects is that first-year teachers who reported more frequent preparation experiences are more like second-year teachers in terms of their effectiveness. Because a year of teaching amounts to about 1,000 hours, these effects are notable, equivalent to about 600 hours of teaching for ELA and about 200 hours for math.24
Preparation experiences with promoting analytic thinking skills were not related to teaching effectiveness.
Regardless of the type of learning opportunity (Coursework, Observation, Practice, or Feedback), preparation experiences with promoting analytic thinking skills were not significantly associated with teaching effectiveness in ELA or math (table 4.2).
Table 4.2: Standardized Regression Coefficients for Relationships of Preparation Experiences With Promoting Analytic Thinking Skills to ELA and Math Teaching Effectiveness by Type of Learning Opportunity)
Promoting Analytic Thinking Skills by Type of Learning Opportunity
Coursework Observation Practice Feedback ELA (n = 2,032 teachers) 0.030 0.029 0.046 0.047
Math (n = 1,894 teachers) –0.012 0.003 0.012 0.001
NOTE: None of the coefficients is statistically significant. FIGURE READS: The regression coefficient for the relationship of preparation experiences with promoting analytic thinking skills obtained through Practice to ELA teaching effectiveness is 0.046, but is not statistically significantly greater than zero. The relationship was estimated using data from n = 2,032 ELA teachers. SOURCE: Preparation experience measures: study’s teacher survey data, 2015. Effectiveness measures: study’s teacher-student linked data, 2012–15.
The study also examined subgroups of teachers who had (1) higher and lower percentages of students eligible for free or reduced-price lunch (FRPL), and (2) classrooms in which average baseline achievement was above and below the median of baseline achievement for the district or state. The results of these analyses showed some of the same statistically significant relationships for creating a productive learning environment, depending on how subgroups were defined, and only one statistically significant relationship between preparation experiences and promoting analytic thinking skills.
The study also examined the relationships of experiences with the broad categories creating a productive learning environment and promoting analytic thinking skills and with the competency area Effective Instruction for English Learners to teaching effectiveness with a particular subgroup of students: English learners. These analyses did not identify any statistically significant relationships. (See appendix L for more information.)
24 An average elementary-school year is 180 days and about 6 hours a day, which, allowing for nonteaching days, yields about 1,000 hours.
NCEE 2019-4007

NCEE 2019-4007 Teacher Preparation Experiences and Early Teaching Effectiveness 35
Additionally, the study conducted tests of whether the relationship between preparation experiences and teaching effectiveness differed depending on the frequency of another preparation experience by entering interaction terms into the analysis model. These analyses explored, for example, whether the relationship between Practice with creating a productive learning environment and teaching effectiveness was larger if teachers also reported higher frequencies of preparation experiences through Coursework, Observation, or Feedback with creating a productive learning environment. We also conducted tests for interactions between the frequencies of preparation experiences with the two broad categories and each type of learning opportunity. These analyses sought to answer questions such as, does the relationship between Practice with creating a productive learning environment and teaching effectiveness differ depending on the frequency of Coursework, Observation, Practice, or Feedback with promoting analytic thinking skills? We did not find any significant interactions.
Relationships of Preparation Experiences to Teaching Effectiveness Over the First Three Years of Teaching
Having found positive relationships between some types of preparation experiences and teaching effectiveness over the first three years of teaching, we then asked about the pattern of these relationships by year of teaching. We were interested in whether the relationship between preparation experiences appeared to be transitory or more permanent—was there a positive relationship of preparation experiences for novice teachers only for their first year of teaching, with teachers with less preparation experiences catching up as they gained experience in the classroom? Or were these teachers with more frequent preparation experiences more effective even after multiple years of teaching experience?
If the positive relationships of preparation experiences and teaching effectiveness were found to be only a temporary advantage (e.g., for the first year), then this would weaken the argument for pre-service requirements. On the other hand, if the positive relationships were found to continue over multiple years of teaching, then this would heighten the importance of pre-service teacher preparation experiences. Given the data used, this study is able to look at teachers over only their first three years.
Increases in effectiveness related to preparation experiences with creating a productive learning environment were similar in each of the first three years of teaching.
We conducted cross-sectional analyses to test whether the magnitudes of the relationships of preparation experiences to teaching effectiveness differed for teachers in their first, second, or third year of teaching. We found no statistical differences in the size of the relationships between preparation experiences and effectiveness by years of teaching experience for the four preparation experience measures that were shown in the main analyses to have a significant relationship to teaching effectiveness or for any of the other preparation experiences measures (see appendix M).
In these analyses, all teachers were included if they had a measure of effectiveness in any of their first three years of teaching. We also conducted identical analyses using the subset of teachers who had

NCEE 2019-4007 Teacher Preparation Experiences and Early Teaching Effectiveness 36
effectiveness data in all three study years. We found that the results from these longitudinal analyses of the subset supported the results from the cross-sectional analyses of the cross-sectional sample.25
These findings suggest that more frequent preparation experiences with creating a productive learning environment are associated with greater effectiveness, at least through the early years of teaching. However, our data are not able to show whether the relationships between preparation experiences and effectiveness are visible past these early years of teaching.
25 The cross-sectional analyses examining relationships between preparation experiences and effectiveness in ELA and math used data from 2,032 and 1,894 teachers, respectively. Each teacher had one, two, or three years of effectiveness data. The longitudinal analyses using the subset of teachers who had effectiveness data in all three years in ELA and math included 558 and 504 teachers, respectively. Though the longitudinal analyses are based on a considerably smaller sample size than are the cross-sectional analyses, that fact eliminates the possibility that changes in the relationships as teachers gain more experience are being masked by year-to-year changes in the composition of the sample as some teachers leave the profession after their first or second year.
NCEE 2019-4007 Teacher Preparation Experiences and Early Teaching Effectiveness 37
Areas for Future Research
This study has some limitations. The study sample included a large, but purposive sample of teachers in general-education classrooms in grades 4 through 6 who taught mostly in large, urban districts, primarily in the South. The study examined effectiveness only for teachers in upper elementary grades for which test scores were available. In addition, preparation experiences were self-reported by teachers and may have been subject to measurement error.
With those limitations in mind, the study yielded evidence that the frequency of specific types of experiences during teacher preparation is related to teaching effectiveness. In particular, experiences related to strategies about creating a productive learning environment, such as maintaining a positive classroom environment, managing student behavior, making productive use of classroom time, conveying the importance of learning, and demonstrating sensitivity to student needs, are promising areas for programs to emphasize. The study showed that the relationship between preparation experiences for creating a productive learning environment and teaching effectiveness when teachers had the opportunity to observe a teaching using the strategies or the opportunity to practice the strategies themselves and receive feedback. Reading about the strategies was not related to Teaching Effectiveness. However, on average, Practice and Feedback were the least frequent types of learning opportunities through which teachers reported receiving preparation experiences. Rather, study teachers reported receiving more experiences through Coursework and Observation. This finding supports recent policy and practitioner calls for teacher preparation programs to include job-embedded opportunities during preparation and to expand clinical experiences, at least in emphasizing strategies about creating a productive learning environment. As noted previously, this finding is not causal, and more rigorous research is needed to reinforce it.
Unlike creating a productive learning environment, the study found no evidence that the frequency of preparation experiences with strategies about promoting analytic thinking skills is related to later Teaching Effectiveness. This is surprising, yet consistent with other recent research which shows that classroom practices about students’ analytic thinking skills may be less strongly related to teaching effectiveness than are practices about the learning environment (Gill et al. 2016). It is often noted that correlation does not imply causation, but a lack of correlation does suggest a lack of an underlying relationship.
The lack of relationship between preparation experiences and promoting analytic thinking skills is concerning, since research suggests that students’ ability to employ higher-order thinking skills about academic material is a predictor of overall academic success (Allen et al., 2011; Hamre and Pianta, 2005). However, it would be premature to conclude that promoting analytic thinking skills is not an important component of effective preparation programs. It could be that the particular strategies within promoting analytic thinking skills that this study focused on may not be the most essential ones, but that other strategies not measured but aimed at improving students’ analytic thinking may be effective. More exploratory research is needed to better understand this relationship.

NCEE 2019-4007 Teacher Preparation Experiences and Early Teaching Effectiveness 38
References
Allen, J. P., Pianta, R. C., Gregory, A., Mikami, A. Y., & Lun, J. (2011). An interaction-based approach to enhancing secondary school instruction and student achievement. Science, 333(6045): 1034–1037. https://eric.ed.gov/?id=ED556046
Baker, S., N. Lesaux, M. Jayanthi, J. Dimino, C. P. Proctor, J. Morris, R. Gersten, K. Haymond, M.J. Kieffer, S. Linan-Thompson, and R. Newman-Gonchar. 2014. Teaching Academic Content and Literacy to English Learners in Elementary and Middle School (NCEE 2014-4012). Washington, DC: National Center for Education Evaluation and Regional Assistance, Institute of Education Sciences, U.S. Department of Education. http://ies.ed.gov/ncee/wwc/publications_reviews.aspx
Bastian, K., and G. Henry. 2015. “Teachers Without Borders: Consequences of Teacher Labor Force Mobility. Educational Evaluation and Policy Analysis 37(2): 163-183.
Boyd, D., P. Grossman, K. Hammerness, H. Lankford, S. Loeb, M. Ronfeldt, and J. Wyckoff. 2009. Recruiting Effective Math Teachers: How Do Math Immersion Teachers Compare? Evidence From New York City (NBER Working Paper No. 16017). Cambridge, MA: National Bureau of Economic Research. http://www.nber.org/papers/w16017
Boyd, D.J., P. Grossman, H. Lankford, S. Loeb, N.M. Michelli, and J. Wyckoff. 2006. “Complex by Design: Investigating Pathways Into Teaching in New York City Schools.” Journal of Teacher Education 57(2): 155-166. http://jte.sagepub.com/content/57/2/155.short
Bruno, P., S. Rabovsky, and K. Strunk. 2019. Taking their First Steps: The Distribution of New Teachers into School and Classroom Contexts and Implications for Teaching Effectiveness and Growth (Working Paper No. 212-0119-1). National Center for Analysis of Longitudinal Data in Education Research. Washington, DC: American Institutes for Research.
Carifio, J., and R. Perla. 2008. “Resolving the 50-Year Debate Around Using and Misusing Likert Scales.” Medical Education 42(12): 1150-1152.
Chetty, R., J.N. Friedman, and J.E. Rockoff. 2014a. “Measuring the Impacts of Teachers. I: Teacher Value-Added and Student Outcomes in Adulthood.” American Economic Review 104(9): 2593-2632.
Chetty, R., J.N. Friedman, and J.E. Rockoff. 2014b. “Measuring the Impacts of Teachers. II: Teacher Value-Added and Student Outcomes in Adulthood.” American Economic Review 104(9): 2633-2679.
Clark, M.A., H.S. Chiang, T. Silva, S. McConnell, K. Sonnenfeld, A. Erbe, and M. Puma. 2013. The Effectiveness of Secondary Math Teachers From Teach For America and the Teaching Fellows Programs (NCEE 2013-4015). Washington, DC: National Center for Education Evaluation and Regional Assistance, Institute of Education Sciences, U.S. Department of Education. http://eric.ed.gov/?id = ED544171
Clark, M.A., E. Isenberg, A.Y. Liu, L. Makowsky, and M. Zukiewicz. 2015. Impacts of the Teach For America Investing in Innovation Scale-Up: Final Report. Princeton, NJ: Mathematica Policy Research.

NCEE 2019-4007 Teacher Preparation Experiences and Early Teaching Effectiveness 39
Clotfelter, C., H.F. Ladd, and J. Vigdor. 2007. How and Why Do Teacher Credentials Matter for Student Achievement? (Working Paper 2). Washington, DC: National Center for Analysis of Longitudinal Data in Education Research. http://www.caldercenter.org/sites/default/files/1001058_Teacher_Credentials.pdf
Cochran-Smith, M., and K.M. Zeichner, K.M., eds. 2005. Studying Teacher Education: The Report of the AERA Panel on Research and Teacher Education. Mahwah, NJ: Erlbaum.
Constantine, J., D. Player, T. Silva, K. Hallgren, M. Grider, and J. Deke. 2009. An Evaluation of Teachers Trained Through Different Routes to Certification. Final Report (NCEE 2009-4043). Washington, DC: National Center for Education Evaluation and Regional Assistance, Institute of Education Sciences, U.S. Department of Education. http://eric.ed.gov/?id = ED504313
Danielson, C. 2011. Enhancing Professional Practice: A Framework for Teaching, 2nd ed. Alexandria, VA: Association for Supervision and Curriculum Development.
Darling-Hammond, L. 2012. Powerful Teacher Education: Lessons From Exemplary Programs. New York: Wiley.
Decker, P.T., D.P. Mayer, and S. Glazerman. 2004. The Effects of Teach For America on Students: Findings From a National Evaluation. Princeton, NJ: Mathematica Policy Research.
Gansle, K., G. Noell, and J. Burns. 2012. “Do Student Achievement Outcomes Differ Across Teacher Preparation Programs? An Analysis of Teacher Education in Louisiana.” Journal of Teacher Education 63(5): 304-317.
Gill, B., M. Shoji, T. Coen, and K. Place. 2016. The Content, Predictive Power, and Potential Bias in Five Widely Used Teacher Observation Instruments (REL 2017-191). Washington, DC: Regional Educational Laboratory Mid-Atlantic, National Center for Education Evaluation and Regional Assistance, Institute of Education Sciences, U.S. Department of Education. http://ies.ed.gov/ncee/edlabs
Goldhaber, D., S. Liddle, and R. Theobald. 2013. “The Gateway to the Profession: Assessing Teacher Preparation Programs Based on Student Achievement.” Economics of Education Review 34: 29-44.
Greenberg, J., A. McKee, and K. Walsh. 2014. Teacher Prep Review: A Review of the Nation’s Teacher Preparation Programs. Washington, DC: National Council on Teacher Quality. http://www.nctq.org/dmsStage/Teacher_Prep_Review_2014_Report
Greenberg, J. A., K. Walsh, and A. McKee. 2013. Teacher Prep Review: A Review of the Nation’s Teacher Preparation Programs. Washington, DC: National Council on Teacher Quality. http://www.nctq.org/dmsStage/Teacher_Prep_Review_2013_Report
Grossman, P. 2010. Learning to Practice: The Design of Clinical Experience in Teacher Preparation (Policy Brief). Partnership for Teacher Quality. New York: American Association of Colleges for Teacher Education.
Grossman, P., C. Compton, D. Igra, M. Ronfeldt, E. Shahan, and P. Williamson. 2009). “Teaching Practice: A Cross-Professional Perspective.” Teachers College Record 111(9): 2055-2100.
NCEE 2019-4007 Teacher Preparation Experiences and Early Teaching Effectiveness 40
Grossman, P., K. Hammerness, and M. McDonald. 2009. “Redefining Teaching, Re-Imagining Teacher Education.” Teachers and Teaching: Theory and Practice 15(2): 273-289. http://www.tandfonline.com/doi/abs/10.1080/13540600902875340
Grossman, P., K. Hammerness, M. McDonald, and M. Ronfeldt. 2008. “Constructing Coherence: Structural Predictors of Perceptions of Coherence in NYC Teacher Education Programs.” Journal of Teacher Education 59(4): 273-287.
Grossman, P., M. Ronfeldt, and J. Cohen. 2011. “The Power of Setting: The Role of Field Experience in Learning to Teach.” In APA Educational Psychology Handbook: Applications to Teaching and Learning (Vol. 3), edited by S. Graham, K. Harris, and T. Urdan, 311-334. Washington, DC: American Psychological Association.
Hamre, B.K. and Pianta, R.C. (2005). Can Instructional and Emotional Support in First Grade Classrooms Make a Difference for Children At Risk of School Failure? Child Development, 76 (5): 949-967. http://www.jstor.org/stable/3696607
Hanushek, E.A. 1974. “Efficient Estimators for Regression Coefficients.” The American Statistician 28(2): 66-67.
Harris, D.N., and T.R. Sass. 2007. Teacher Training, Teacher Quality, and Student Achievement (Working Paper 3). National Center for Analysis of Longitudinal Data in Education Research. Washington, DC: Urban Institute.
Harris, D.N., and T.R. Sass. 2011. “Teacher Training, Teacher Quality, and Student Achievement.” Journal of Public Economics 95(7-8): 798-812.
Henry, G. T., C.L. Thompson, K.C. Bastian, C.K. Fortner, D.C. Kershaw, J.V. Marcus, and R.A. Zulli. 2011a. UNC Teacher Preparation Program Effectiveness Report. Chapel Hill, NC: Carolina Institute for Public Policy.
Henry, G. T., C.L. Thompson, C.K. Fortner, K.C. Bastian, and J.V. Marcus. 2011b. Technical Report: UNC Teacher Preparation Program Effectiveness Report. Chapel Hill, NC: Carolina Institute for Public Policy.
Hill, H.C., M.L. Blunk, C.Y. Charalambous, J.M. Lewis, G.C. Phelps, L. Sleep, and D. Lowenberg Ball. 2008. “Mathematical Knowledge for Teaching and the Mathematical Quality of Instruction: An Exploratory Study.” Cognition and Instruction 26(4). doi:10.1080/07370000802177235
Kane, T.J., and D.O. Staiger. 2012. Gathering Feedback for Teaching: Combining High-Quality Observations With Student Surveys and Achievement Gains (Research Paper). MET Project. Seattle: Bill and Melinda Gates Foundation. http://eric.ed.gov/?id = ED540960
Kini, T., and A. Podolsky. 2016. Does Teaching Experience Increase Teaching Effectiveness? A Review of the Research. Palo Alto, CA: Learning Policy Institute. https://learningpolicyinstitute.org/sites/default/files/product-files/Teaching_Experience_Report_June_2016.pdf
Koedel, C., K. Mihaly, and J.E. Rockoff. 2015. “Value-Added Modeling: A Review.” Economics of Education Review 47(C): 180-195.

NCEE 2019-4007 Teacher Preparation Experiences and Early Teaching Effectiveness 41
Koedel, C., E. Parsons, M. Podgursky, and M. Ehlert. 2016. “Teacher Preparation Programs and Teacher Quality: Are There Real Differences Across Programs?” Education Finance and Policy 10(4): 508-534.
Lewis, J.B., and D.A. Linzer. 2005. “Estimating Regression Models in Which the Dependent Variable Is Based on Estimates.” Political Analysis 13: 345-364.
McDonald, M., E. Kazemi, and S. Kavanagh. 2013. “Core Practices and Pedagogies of Teacher Education: A Call for a Common Language and Collective Activity.” Journal of Teacher Education 20(10): 1-9.
Mihaly, K., D. McCaffrey, T. Sass, and J.R. Lockwood. 2013. “Where You Come From or Where You Go? Distinguishing Between School Quality and the Effectiveness of Teacher Preparation Program Graduates.” Education Finance and Policy 8(4): 459-493.
Morgan, C., L. Dunn, S. Parry, and M. O’Reilly. 2004. The Student Assessment Handbook: New Directions in Traditional and Online Assessment. London: Routledge Falmer.
National Council for Accreditation of Teacher Education. 2010. Transforming Teacher Education Through Clinical Practice: A National Strategy to Prepare Effective Teachers. http://www.ncate.org/LinkClick.aspx?fileticket = zzeiB1OoqPk%3D&tabid = 7
Noell, G.H., K.A. Gansle, R.M. Patt, and J.M. Schafer. 2009. Value-Added Assessment of Teacher Preparation in Louisiana: 2005-2006 to 2007-2008. Baton Rouge, LA: Board of Regents, State of Louisiana. http://www.laregentsarchive.com/Academic/TE/2009/2008-09VATechnical(8.24.09).pdf
O’Connor, B.P. 2000. “SPSS and SAS Programs for Determining the Number of Components Using Parallel Analysis and Velicer’s Map Test.” Behavior Research Methods, Instrumentation, and Computers 32: 396-402.
Pianta, R.C., and B.K. Hamre. 2009. “Conceptualization, Measurement, and Improvement of Classroom Processes: Standardized Observation Can Leverage Capacity.” Educational Researcher 38(2): 109-119.
von Hippel, P.T., and L. Bellows. 2018. “How much does teacher quality vary across teacher preparation programs? Reanalyses from six states.” Economics of Education Review 64: 298-312.
von Hippel, P.T., L. Bellows, C. Osborne, J.A. Lincove, and N. Mills. 2016. “Teacher quality differences between teacher preparation programs: How big? How reliable? Which programs are different?” Economics of Education Review 53: 31-45.
von Hippel, P.T., C. Osborne, J. Lincove, L. Bellows, and N. Mills. 2015. “Seeking Exceptional Teacher Preparation Programs Among Many Noisy Estimates: The Dangers of Being Fooled by Randomness.” Paper presented at the Association for Public Policy Analysis and Management Fall Research Conference, Miami.
Weisberg, S. 1985. Applied Linear Regression. New York: Wiley.
Wilson, S.M., R.E. Floden, and J. Ferrini-Mundy. 2001. Teacher Preparation Research: Current Knowledge, Gaps, and Recommendations. Center for the Study of Teaching and Policy. Lansing, MI: Michigan State University.

NCEE 2019-4007 Teacher Preparation Experiences and Early Teaching Effectiveness 42
Xu, Z., J. Hannaway, and C. Taylor. 2009. Making a Difference? The Effects of Teach For America in High School (Working Paper No. 17). National Center for Analysis of Longitudinal Data in Education Research. Washington, DC: Urban Institute.
Zeichner, K., and H. Conklin, H. 2005. “Teacher Education Programs.” In Studying Teacher Education, edited by M. Cochran-Smith and K. Zeichner, 645-736. Washington, DC: American Educational Research Association.

NCEE 2019-4007 Teacher Preparation Experiences and Early Teaching Effectiveness 43
Acknowledgements
This study has benefited from the contributions of many people throughout its design, data analysis and report writing. We appreciate the advice of our expert technical working group members: David Francis, University of Houston; Pam Grossman, University of Pennsylvania; Jane Hannaway, Georgetown University and American Institutes for Research; Cory Koedel, University of Kansas; Mari Koerner, Arizona State University; Kata Mihaly; RAND Corporation; Steve Rivkin, University of Illinois at Chicago; and Suzanne Wilson, University of Connecticut. For the design of the survey on teacher preparation experiences, we were fortunate to have the expert advice of David Francis, Pam Grossman, Catherine McClellan, Trish Stoddart, and Cynthia Tocci. For the creation of the survey measures, we thank Sam Rikoon for his expertise and guidance on factor analysis.
We gratefully acknowledge the staff at Education Analytics for their collegiality above all but also for their diligence in recruitment and for their expertise in the creation of value-added measures. Specifically, we thank Sean McLaughlin, Michael Christian, Peter Witham, Anne Marie Weber, Selina Eadie Dhillon, Jennifer Winter Craver, Gabe Rosen, Jordan Mader, Joe Schubert, Constanza Liborio, Nate Sullivan, Tanner O'Brien.
We also extend our thanks to the staff at Westat for their collaborative approach to survey development and administration, and their assiduousness in survey follow-up. Specifically, we thank Janet Friedman, Camilla Heid, Kim Standing and Patty Nicchitta.
At Abt Associates, we acknowledge the contributions of Erin Bumgarner, Kim Dadisman (currently of the Massachusetts Institute of Technology), Heather He, Kelly Lack, Tamara Linkow, Bry Pollack, Cindy Prenovitz, Anne St. George, and Fatih Unlu (currently of RAND Corporation).
We appreciate the willingness of state, district and school leaders to allow us to survey their teachers to gain valuable information about teacher preparation experiences and to provide us with the data necessary to estimate value-added scores.
Last, but certainly not least, we thank the thousands of teachers who took time out of their busy schedules to respond to the survey.
Disclosure of Potential Conflicts of Interest
The research team for this evaluation included staff from Abt Associates and its subcontractors, Pemberton Research; Westat; The Bench Group, LLC; Education Analytics; Dillon Goodson Research Associates; Chesapeake Research Associates; and Analytica. None of the research team members has financial interests that could be affected by findings from the study of Teacher Preparation Experiences and Early Teaching Effectiveness. None of the 10 members of the two technical working groups, convened by the research team over the course of the study to provide advice and guidance, has financial interests that could be affected by findings from the evaluation.

NCEE 2019-4007 Teacher Preparation Experiences and Early Teaching Effectiveness 44
U.S. Department of Education
Betsy DeVos
Secretary
Institute of Education Sciences
Mark Schneider
Director
National Center for Education Evaluation and Regional Assistance
September 2019
This report was prepared for the Institute of Education Sciences under Contract ED-IES-11-C-0072. The project officer is Melanie Ali in the National Center for Education Evaluation and Regional Assistance.
IES evaluation reports present objective information on the conditions of implementation and impacts of the programs being evaluated. IES evaluation reports do not include conclusions or recommendations or views with regard to actions policymakers or practitioners should take in light of the findings in the report.
This report is in the public domain. Authorization to reproduce it in whole or in part is granted. While permission to reprint this publication is not necessary, the citation should read: Goodson, B., Caswell, L., Dynarski, M., Price, C., Litwok, D., Crowe, E., Meyer, R., and Rice, A. (2019). Teacher Preparation Experiences and Early Teaching Effectiveness (NCEE 2019-4007). Washington, DC: National Center for Education Evaluation and Regional Assistance, Institute of Education Sciences, U.S. Department of Education.
This report is available on the Institute of Education Sciences website at http://ies.ed.gov/ncee.
Alternate Formats: Upon request, this report is available in alternate formats, such as Braille, large print, audiotape, or computer diskette. For more information, please contact the Department’s Alternate Format Center at 202-260-9895 or 202-205-8113.
