teachers in the indian education system 20 oct 2015.pdf
TRANSCRIPT

TEACHERS IN THE
INDIAN EDUCATION
SYSTEMSynthesis of a nine state study
A study done under the aegis of RGF Chair
National University for Educational Planning and
Administration (NUEPA), 2014-15

Acknowledgement
a. National University for Educational Planning and Administration (NUEPA)
b. Rajeev Gandhi Foundation;
c. The World Bank (New Delhi): Technical and research partner
d. Core Team:
i. NUEPA: Vimala Ramachandran, Prerna Goel Chatterjee, Nikhil Mathur and Anupam Pachauri
ii. World Bank: Toby Linden, Tara Béteille, Sangeeta Dey, Sangeeta Goyal and Chiraag Mehta
e. State research partners:
i. CBPS, Bangalore – Karnataka and Jharkhand
ii. CERP, Jaipur – Rajasthan
iii. Eklavya, Bhopal – Madhya Pradesh
iv. IASE, Aizawl – Mizoram
v. Lokdrusti, Naupada – Odisha
vi. SCERT, Chennai – Tamil Nadu
vii. SCERT, Lucknow – Uttar Pradesh
viii. SCERT, Chandigarh - Punjab
ix. Centre for Law and Policy Research –Analysis of legal cases across 9 states
2
20 October 2015NUEPA & The World Bank

Why this study?
a. Teachers are central to student learning and development;
b. Teacher effectiveness is a key challenge world-wide
c. Building a quality teaching force depends on how they are
recruited, managed and positioned in the education system;
d. This study does not comment on the capacity and quality of
teachers who are recruited;
e. It is about finding out whether the government is able to recruit
and deploy teachers where necessary; whether practices on the
ground are informed by policies; and whether recruitment,
deployment and transfer is done in a transparent manner;
3
20 October 2015NUEPA & The World Bank

9 States covered
1. Karnataka,
2. Jharkhand,
3. Madhya Pradesh,
4. Mizoram,
5. Odisha,
6. Punjab,
7. Rajasthan,
8. Tamil Nadu and
9. Uttar Pradesh
20 October 2015
4
NUEPA & The World Bank

We explored
Teacher recruitment, deployment and transfers;
Compensation - salary and non-salary benefits;
Physical working conditions;
Professional growth (promotions, career advancement);
Autonomy, freedom and day-to-day management;
Retirement rules and benefits;
Teacher representation and voice; and
Grievance redressal.
5
20 October 2015NUEPA & The World Bank

Scope
a. Main focus of the study:
i. Regular teachers;
ii. Non-regular teachers - contracts / fixed tenure;
iii. Part-time teachers; and
iv. Guest teachers
b. At what level?
i. Elementary schools – government only
ii. Secondary schools – government and government-aided only
6
20 October 2015NUEPA & The World Bank

Findings and insights
20 October 2015NUEPA & The World Bank
7

The current scenario (2012-13) for elementary
teachers
61.6%
35.6%
2.8% By mgmt
Govt
Pvt
Other
Total size: 7.35 million1
42.7% female
7.5% contract
21.3% SC/ST
2.5%10.9%
22.3%
38.1%
24.9% 1.4%
< Sec Sec HSec Grad PG MPhil
Qualifications
1 All teachers in elementary schools, as per State Report Card 2012-1320 October 2015NUEPA & The World Bank
8

Profile: Elementary teachers, 2012-13
20 October 2015NUEPA & The World Bank
9
Number % Women % SC/ST %Contract%
Graduates% Trained Avg. PTR
India 7,354,151 46% 21% 7% 64% 26% 28.8
Punjab 226,570 72% 17% 8% 83% 18% 15.8
Rajasthan 560,412 31% 24% 4% 80% 12% 26.6
Uttar Pradesh 953,807 38% 15% 19% 71% 13% 44.6
Mizoram 19,108 44% 98% 25% 48% 26% 13.9
Jharkhand 170,509 32% 31% 49% 67% 29% 37.9
Odisha 272,173 40% 25% 2% 56% 34% 23.7
Madhya
Pradesh464,018 41% 27% 0% 67% 9% 34.4
Karnataka 306,350 58% 18% 1% 12% 39% 21.3
Tamil Nadu 474,211 73% 16% 4% 75% 36% 28.9
Source: DISE Report Cards

Profile: Secondary teachers 2012-13
20 October 2015NUEPA & The World Bank
10
Source: UDISE Raw Data, 2012-13
Number % Women % SC/ST % Contract%
Graduates
% Schools with 4
subject teachers
India 946,786 38 17 8 86 12
Jharkhand 7,652 32 21 9 92 6
Karnataka 97,078 39 18 5 38 15
Madhya Pradesh 23,642 38 27 24 95 8
Mizoram 4,324 35 95 67 95 73
Odisha 65,273 28 10 14 86 17
Punjab 42,663 67 14 29 93 4
Rajasthan 72,886 26 22 1 89 2
Tamil Nadu 74,036 63 16 10 94 11
Uttar Pradesh 88,802 21 9 1 85 6

Who belongs to what cadre?
20 October 2015NUEPA & The World Bank
11
State
Elementary SecondarySpecific to
stateBlock /
Municipal Cadre
District / Zillah Cadre
State Cadre Block CadreDistrict / Divisional
CadreState Cadre
JharkhandAll regular in district
cadre
All regular in state cadre
Contract assigned to
school
KarnatakaAll block
cadreAll divisional
cadre
Seniority list maintained in
district
Madhya Pradesh
Samvida and Adyapak are Janpad cadre
Shikshak are district cadre
Samvida / Adyapak are Janpad cadre
Shikshak are a divisional cadre
No transfer of Samvida or
Adyapak
MizoramAll state
cadreAll State
Cadre
OdishaElementary
cadre (regular)Secondary cadre
(regular)
Contract teachers
appointed to school
PunjabZilla
Parishad Teachers
SSA & Other Regular Teachers
Zilla Parishad Teachers
Secondary regular and
RMSA teachers
No clarity, fluid situation
RajasthanAll district
cadreAll divisional
cadreSchool level
cadre
Tamil Nadu
All Block cadre
All District cadre
School level
Uttar Pradesh
All district cadre
All divisional
cadre
Shiksha Mitraschool cadre

Phases in growth of teacher workforce
a. 2003 to 2008: Number of schools, students and
teacher workforce increased, with growth rate of
teacher workforce outpacing the other two;
b. 2008 to 2010: Slowdown in the rate of expansion of
all three;
c. Post RTE 2010: Momentum picked up again,
growth in numbers of teachers outpaced the other
two. This is to bring PTR closer to what RTE
required.
20 October 2015NUEPA & The World Bank
12
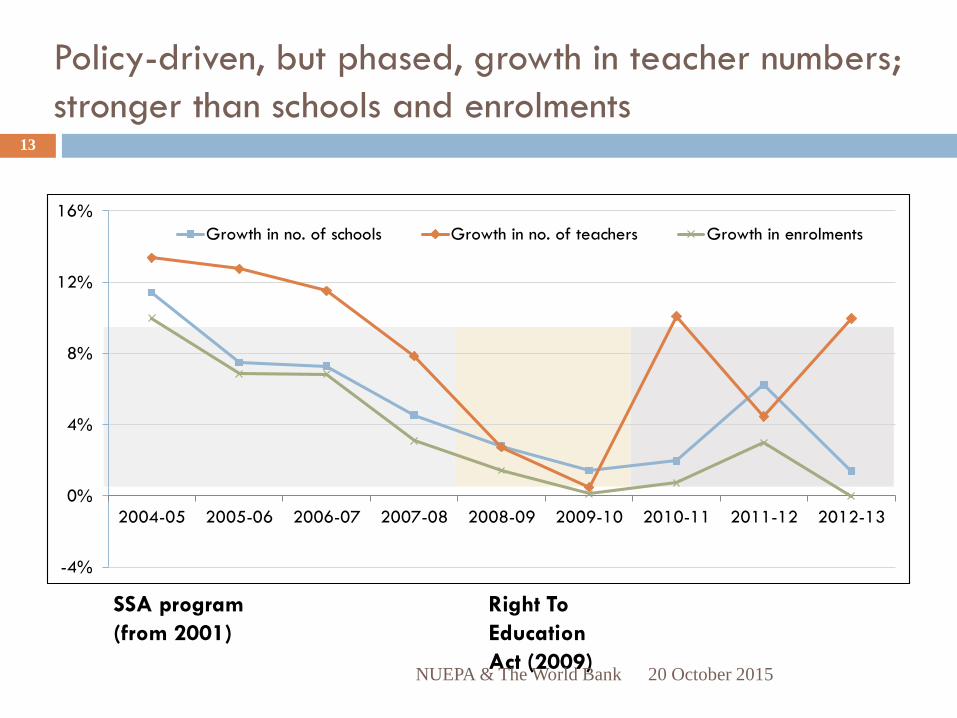
Policy-driven, but phased, growth in teacher numbers;
stronger than schools and enrolments
-4%
0%
4%
8%
12%
16%
2004-05 2005-06 2006-07 2007-08 2008-09 2009-10 2010-11 2011-12 2012-13
Growth in no. of schools Growth in no. of teachers Growth in enrolments
SSA program
(from 2001)
Right To
Education
Act (2009)20 October 2015NUEPA & The World Bank
13

Status of regular & contract teachers
20 October 2015NUEPA & The World Bank
14
STATE REGULAR CONTRACT
Jharkhand YesYes, as per Government decision 50% posts reserved for contract
teachers
Karnataka Yes No since 1989
Madhya Pradesh YesYes at all levels, during probation and they are made regular after 3
years
Mizoram Not since 1998 Increasingly all contract teachers at all levels
Odisha YesYes at all levels, during probation and they are made regular after 6
years
Punjab Yes Yes, initial contract is 1.5 years, then 3 years and then regularised
Rajasthan Yes No since 2013 - after order of the High Court of Rajasthan
Tamil Nadu YesYes, since 2002 as part-time teachers in specific subjects like arts,
craft, PET
Uttar Pradesh YesOnly in IT and vocational in secondary. Gradual phasing out of
contract teachers

Large inter-state variations in contract teacher
percentages driven by policy differences
0%
10%
20%
30%
40%
50%
2004-05 2005-06 2006-07 2007-08 2008-09 2009-10 2010-11 2011-12 2012-13
% contract teachers over timeIND
PB
RJ
UP
MZ
JH
OR
MP
KA
TN
20 October 2015NUEPA & The World Bank
15

Contract teacher trends reversing!
Elementary Schoola. Trend of appointing contract teachers has been reversed in MP (0%), Rajasthan (4%) and Odisha (2%)b. Karnataka (1%) and Tamil Nadu (4%) has lowest numbers of contract teachers c. Maximum percentage of contract teachers are in Jharkhand (49%), Mizoram (25%) and UP (19%). Punjab is close to national average of 7%Secondary Schoold. Rajasthan and UP (1% each) have the lowest numbers of contract teachers, while Jharkhand (9%) and Tamil Nadu (10%) are close to the national average, which is 8% e. Mizoram 67% and Punjab (29% RMSA) have maximum number of contract teachers, followed by Madhya Pradesh (24%) and Odisha (14%).
20 October 2015NUEPA & The World Bank
16

Policy on quotas (and female ed. attainment) resulted
in higher representation of women
30%
34%
38%
42%
46%
50%
0.0
0.5
1.0
1.5
2.0
2.5
3.0
3.5
4.0
2004-05 2005-06 2006-07 2007-08 2008-09 2009-10 2010-11 2011-12 2012-13
Millions
No. of women teachers (left axis) % women teachers (right axis)
Similar story for disadvantaged groups (Scheduled
Tribes and, to a lesser extent, Scheduled Castes)
20 October 2015NUEPA & The World Bank
17

Policy led to steady improvement in teachers’ educational qualifications
10%
30%
50%
70%
90%
04-05 05-06 06-07 07-08 08-09 09-10 10-11 11-12 12-13
% teachers who are at least graduates
PB RJ UP MZ JH OR MP TN
20 October 2015NUEPA & The World Bank
18

Poor policy on deployment means PTR varies within
states more than across states (counterintuitive)…
15
25
35
45
55
65
0% 20% 40% 60% 80% 100%
PTR plotted against % rural population for all MP districts (2011-12)
MP PTR=34.0
20 October 2015NUEPA & The World Bank
19

The paradox of schools with few
teachers … but low PTR
Elementary Schools Secondary Schools
Single teacher
schools
Schools with
2 teachers
Single teacher
schools
Schools with
2 teachers
India 10.9 31 7 7.4
Jharkhand 15.6 48 13.8 8.1
Karnataka 8.6 30 3.4 1.7
Madhya Pradesh 18.6 45 9.7 9.8
Mizoram 1.1 5.3 0 0
Odisha 10.1 41 3.8 4.3
Punjab 6 29 2.1 6.4
Rajasthan 19.6 32 5.5 14.9
Tamil Nadu 6.8 42 3.8 6.6
Uttar Pradesh 8.2 13 26.1 9.820 October 2015NUEPA & The World Bank
20

• Healthy PTR reduction, conforms to 3 phases of EE growth
• PTR reduction across all schools as well as in private schools has been driven by faster
growth in no. of teachers than in enrolments
• But impressive PTR reduction in govt. schools mostly piggy-backs on declining enrolments
since 2007-08
Significant reduction in PTR, though drivers differ
between private and govt. schools
0
1,000
2,000
3,000
20
30
40
50
60
70
80All schools
No. of teachers (lakhs)PTREnrolment (lakhs) (right)
1,150
1,200
1,250
1,300
1,350
20
30
40
50
05-06 06-07 07-08 08-09 09-10 10-11 11-12 12-13
Govt. schools
0
200
400
600
800
10
15
20
25
30
35
05-06 06-07 07-08 08-09 09-10 10-11 11-12 12-13
Pvt. schools
20 October 2015NUEPA & The World Bank
21
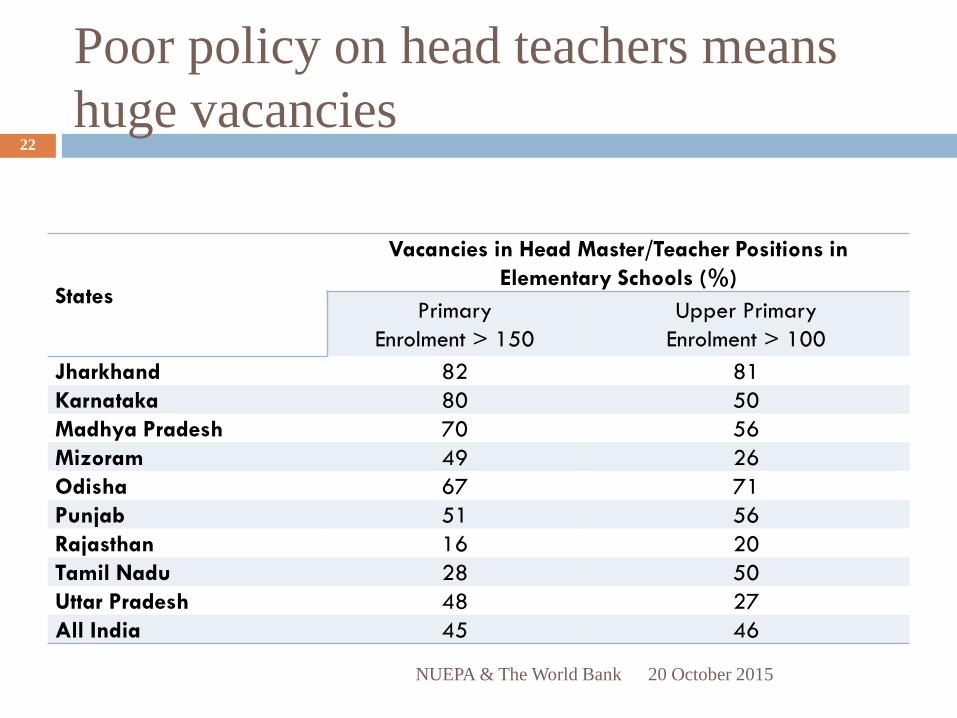
Poor policy on head teachers means
huge vacancies
States
Vacancies in Head Master/Teacher Positions in
Elementary Schools (%)
Primary
Enrolment > 150
Upper Primary
Enrolment > 100
Jharkhand 82 81
Karnataka 80 50
Madhya Pradesh 70 56
Mizoram 49 26
Odisha 67 71
Punjab 51 56
Rajasthan 16 20
Tamil Nadu 28 50
Uttar Pradesh 48 27
All India 45 46
20 October 2015NUEPA & The World Bank
22

Who can become a teacher?
a. Across 9 states, NCTE norms for entry level qualification of elementary
and secondary is accepted, although:
i. Some face shortage of trained candidates, some for ST / SC
ii. Some continue to seek relaxation
b. No exclusive norms for teachers reservation
c. Teacher Eligibility Test adopted by all states
i. In TN, Karnataka & Rajasthan additional examination
d. Additional criteria used for recruitment:
i. Minimum-maximum age limit,
ii. Criteria used for merit list preparation varies from state to state – based on
state-reservation roster
20 October 2015NUEPA & The World Bank
23

Impact of RtE and TET
a. Justice Verma Committee recommendations
b. NCTE revised guidelines for pre-service teacher education
(2014)
c. Acknowledged serious quality issues in school, college and
teacher training
d. Acknowledged need for more research to understand why so
many candidates do not qualify
20 October 2015NUEPA & The World Bank
24

Recruitment
a. With the exception of two states (Karnataka and Tamil
Nadu), teacher recruitment policies in India are decided year
to year.
b. Many states do not have a systematic process for calculating
how many teachers are needed, their specific qualifications
and characteristics.
c. In a number of states, the factors affecting recruitment are
political decision taken at the highest level (CM).
20 October 2015NUEPA & The World Bank
25
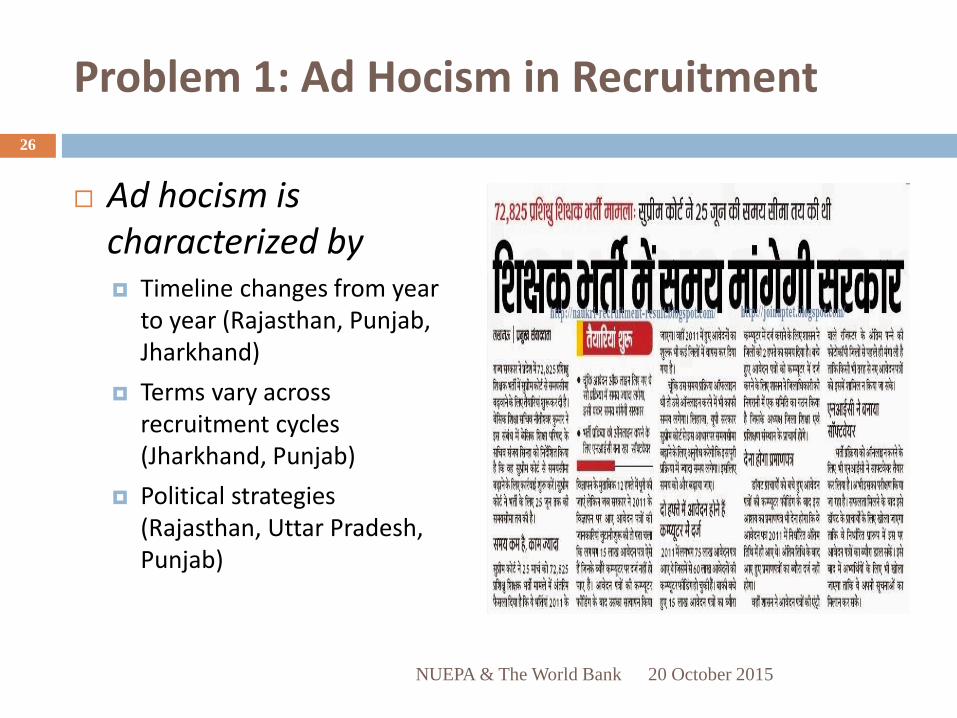
Problem 1: Ad Hocism in Recruitment
Ad hocism is characterized by Timeline changes from year
to year (Rajasthan, Punjab, Jharkhand)
Terms vary across recruitment cycles (Jharkhand, Punjab)
Political strategies (Rajasthan, Uttar Pradesh, Punjab)
20 October 2015NUEPA & The World Bank
26

Problem 2: Recruitment strategies rarely respond to school-level teacher needs systematically
Problems in identifying school need
Rely primarily on block or district averages of teacher need. School-wise vacancies not considered when assigning teachers
Recruitment does not happen at the school level, so schools cannot choose the teacher they want
No interviews due to discretionary element
Criteria relaxed for SC/ST teachers
Even when recruitment is smooth, delay in appointment
20 October 2015NUEPA & The World Bank
27

Lessons from states
Karnataka and Tamil Nadu have mature, systematic policies and processes for recruitment Identifying teacher vacancies systematically
Matching demand for teachers and state budget
Transparent system for recruitment and appointment (large parts computerized)
Even with mature systems, delays in appointment mean schools go without teachers for months
20 October 2015NUEPA & The World Bank
28

Teacher transfers can play an important role in teacher management
Help correct distortions in allocation of teachers to school (aggregate number and subject-wise distortions)
Motivate and encourage teachers
Disciplinary transfers are counter-productive
20 October 2015NUEPA & The World Bank
29

Teachers can be officially transferred for several reasons
Only regular teachers can be transferred in policy (except Odisha) Administrative reasons
Teacher request Mutual transfer
Disciplinary grounds/ public interest
Teacher’s cadre is important in determining transfer options Teachers can belong to different cadres
Transfers are done within a cadre in general, but teachers can also request inter-cadre transfers Inter-cadre transfers come at the cost of losing unit of seniority in many states
Least complaints from teachers regarding transfers when block-level cadre
20 October 2015NUEPA & The World Bank
30
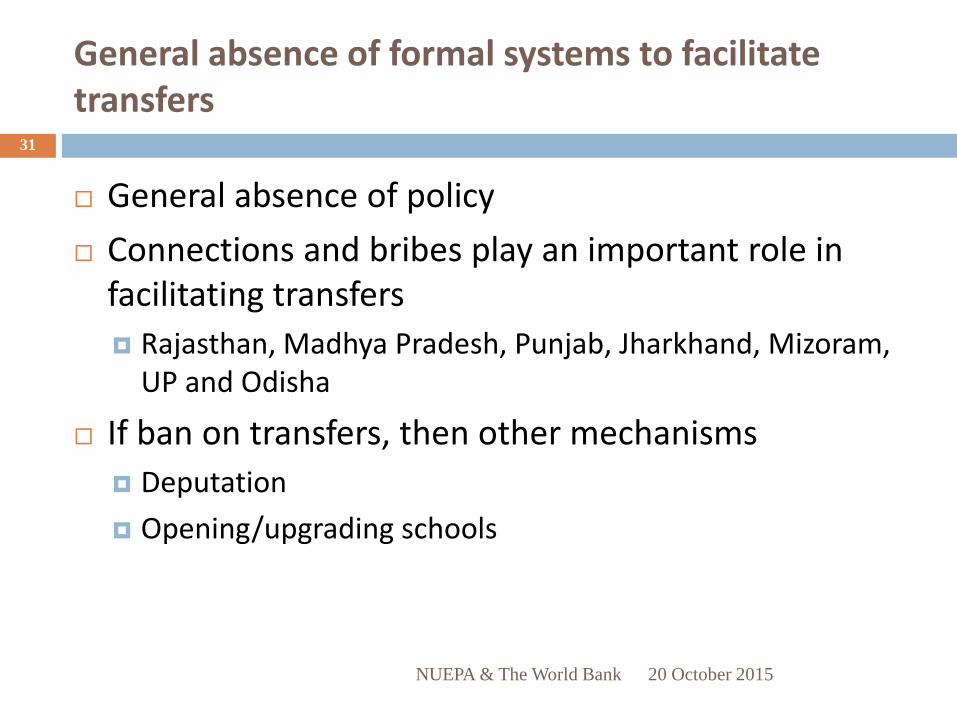
General absence of formal systems to facilitate transfers
General absence of policy
Connections and bribes play an important role in facilitating transfers
Rajasthan, Madhya Pradesh, Punjab, Jharkhand, Mizoram, UP and Odisha
If ban on transfers, then other mechanisms
Deputation
Opening/upgrading schools
20 October 2015NUEPA & The World Bank
31

Trends in transfer
a. Karnataka and Tamil Nadu teacher transfer is policy driven, systematic and transparent.
b. Madhya Pradesh and Odisha have Government Orders (GO) that clearly spells out transfer process.
c. Mizoram has a policy that provides a broad guideline but it is not always followed.
d. Jharkhand, Uttar Pradesh and Punjab do not (as yet) have a transfer policy.
e. We were informed during the course of this study that Rajasthan is planning to announce a policy soon. No announcement was made up to 31 December 2014.
20 October 2015NUEPA & The World Bank
32

Karnataka and TN have transfer policies and
systems
In Karnataka and TN, transfers are transparent and efficient with clear policies and practices that
Specify number of years in rural areas
Specify how many teachers can be transferred in a year
Have transparent prioritization rules for different categories of teachers
Clear timelines
Use IT
Even here, disciplinary transfers remain a concern as outside the system
20 October 2015NUEPA & The World Bank
33
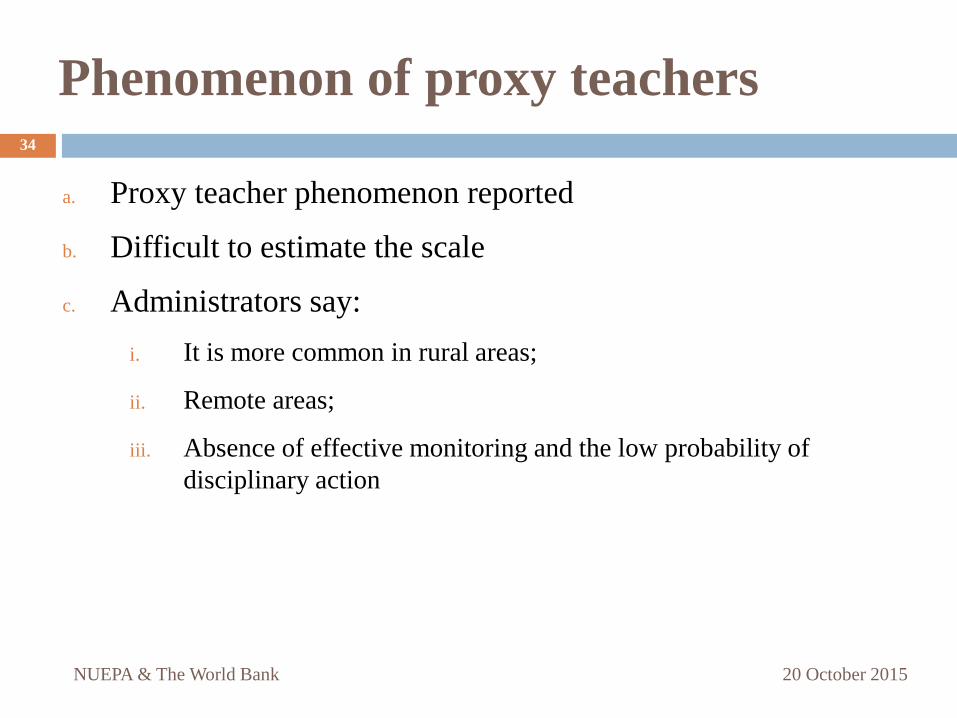
Phenomenon of proxy teachers
a. Proxy teacher phenomenon reported
b. Difficult to estimate the scale
c. Administrators say:
i. It is more common in rural areas;
ii. Remote areas;
iii. Absence of effective monitoring and the low probability of
disciplinary action
20 October 2015NUEPA & The World Bank
34

Grievance Redressal Systems
Administrative system (headmaster, block officer, tribunals and so forth)
Courts
Teachers Unions
20 October 2015NUEPA & The World Bank
35
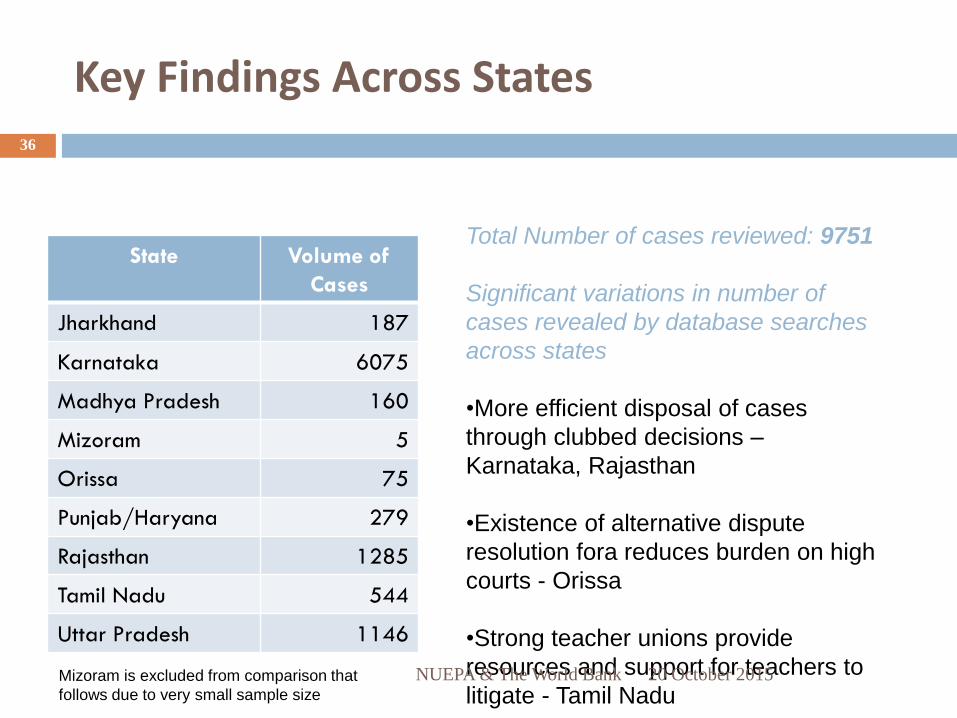
Key Findings Across States
State Volume of
Cases
Jharkhand 187
Karnataka 6075
Madhya Pradesh 160
Mizoram 5
Orissa 75
Punjab/Haryana 279
Rajasthan 1285
Tamil Nadu 544
Uttar Pradesh 1146
Total Number of cases reviewed: 9751
Significant variations in number of
cases revealed by database searches
across states
•More efficient disposal of cases
through clubbed decisions –
Karnataka, Rajasthan
•Existence of alternative dispute
resolution fora reduces burden on high
courts - Orissa
•Strong teacher unions provide
resources and support for teachers to
litigate - Tamil NaduMizoram is excluded from comparison that
follows due to very small sample size
20 October 2015NUEPA & The World Bank
36

Types of Grievances
State Predominant Case Type
Jharkhand Appointment (31.01%) Service Benefits
(29.41%)
Retirement Benefits
(14.97%)
Karnataka Service Benefits
(65%)
Appointment
(22.9%)
Regularization
(3%)
Madhya Pradesh Retirement Benefits
(45%)
Appointment
(31.25%)
Service Benefits
(12.5%)
Orissa Termination
(48%)
Appointment
(29.33%)
Transfer
(10.67%)
Punjab/Haryana Appointment
(60.93%)
Transfer
(12.19%)
Termination
(11.11%)
Rajasthan Appointment
(69.96%)
Regularization
(12.14%)
Service Benefits
(10.58%)
Tamil Nadu Service Benefits
(42.10%)
Appointment
(22.24%)
Examination Standard
(13.6%)
Uttar Pradesh Appointment
(46.29%)
Regularization
(18.95%)
Service Benefits
(14.85%)20 October 2015NUEPA & The World Bank
37

Outcomes of High Court Decisions
State Teacher
Prevailed
State Prevailed Remand to
Respondents
Jharkhand 40.11% 29.94% 22.46%
Karnataka 30.25% 15.52% 45.25%
Madhya Pradesh 15% 56.25% 25%
Orissa 61.33% 12% 25.33%
Punjab/
Haryana
46.95% 14.69% 28.67%
Rajasthan 3.97% 94.5% 1.01%
Tamil Nadu 35.29% 55.14% 6.43%
Uttar Pradesh 32.80% 42.84% 3.14%
20 October 2015NUEPA & The World Bank
38

Other Grievance Redressal Mechanisms
Odisha - Weekly grievance day with commissioner, toll free helpline, Manual on addressing complaints
Rajasthan – Committee to resolve service matters at pre-litigation stage, portal for online airing of grievances
UP – Legislative council has 9 teacher members
20 October 2015NUEPA & The World Bank
39

Salary
a. Teachers happy with their salary
b. Electronic transfer the norm across all 9 states
i. Delays when it comes to allowances & reimbursements (difference
between who pays).
ii. In some states, teachers with same qualifications and teaching
same class get different salaries (Odisha and Tamil Nadu)
c. No reported case of salaries being withheld
More details in session in salary and working conditions
20 October 2015NUEPA & The World Bank
40

Salaries of government teachers
NUEPA & The World Bank
41
a. 5th and 6th pay commissions have ensured that government
teachers are paid at par with other central government
employees.
i. Except for Karnataka and Punjab, other states have adopted the
recommendations of 6th Pay Commission and contextualized it.
ii. Elementary school teachers in Punjab are the highest paid teachers of all
9 states.
b. Along with salary hike, government teachers receive other
benefits such as annual increments (three percent of total pay),
dearness allowance and HRA, medical insurance, revised
pension schemes etc.
20 October 2015
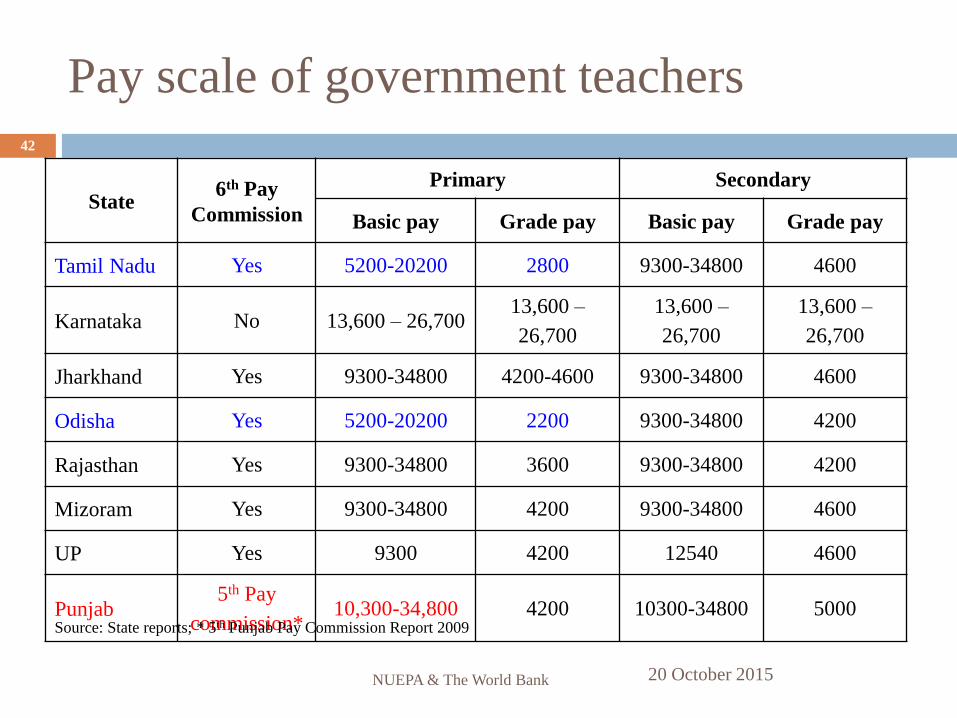
Pay scale of government teachers
NUEPA & The World Bank
42
State6th Pay
Commission
Primary Secondary
Basic pay Grade pay Basic pay Grade pay
Tamil Nadu Yes 5200-20200 2800 9300-34800 4600
Karnataka No 13,600 – 26,70013,600 –
26,700
13,600 –
26,700
13,600 –
26,700
Jharkhand Yes 9300-34800 4200-4600 9300-34800 4600
Odisha Yes 5200-20200 2200 9300-34800 4200
Rajasthan Yes 9300-34800 3600 9300-34800 4200
Mizoram Yes 9300-34800 4200 9300-34800 4600
UP Yes 9300 4200 12540 4600
Punjab5th Pay
commission*10,300-34,800 4200 10300-34800 5000
Source: State reports; * 5th Punjab Pay Commission Report 2009
20 October 2015

Actual take home salaries
NUEPA & The World Bank
43
State
Primary Secondary
Salary of a new
appointee
Salary after 15
years
Salary of a new
appointee
Salary after 15
years
Tamil
Nadu15,345 28,660 15,345 28,660
Karnataka18,794 (R)
21,814 (U)
26,098 (R)
30,198 (U)
24,272 (R)
28,102 (U)
34,618 (R)
39,978 (U)
Jharkhand28,650 (R)
31,600 (U)
39,780 (R)
43,260 (U)
37,494 (R)
39,208 (U)
57,523 (R)
60,160 (U)
Odisha 14,031 26,659 25,625 37,806
Rajasthan 26,013 NA 28,331 NA
Mizoram 16,504 NA NA NA
UP 29,293 39,683 37,226 47,716
Punjab35,936 (R)
36,588 (U)
59,113 (R)
60,194 (U)
40,602 (R)
41,340 (U)
66,868 (R)
68,092 (U)
Source: State reports; R – Rural; U - Urban20 October 2015

Salary of teachers in Madhya Pradesh
NUEPA & The World Bank
44
Level Primary Secondary
Cadre LDTSahayak
Adhyapak
SSS grade
III
Atithi
ShikshakUDT Adhyapak
Salarie
s
5200-20200
+2400
(grade pay)
4500-
25,000+125
0 (grade
pay)
5000 100 per day
9300-34800
+3200
(grade pay)
4500-
25,000+160
0 (grade
pay)
Source: Madhya Pradesh State Report
20 October 2015

Salary of contract teachers
NUEPA & The World Bank
45
State Consolidated pay + cadre
Tamil Nadu Rs 5000 (part time special teachers under SSA)
JharkhandRs /-untrained, Rs 6200/-trained & Rs 6700/-trained +TET (Contract
teachers hired under SSA/JPEC)
OdishaRs 5200 – Shiksha Sahayak (under SSA); Rs 7000 – Junior teacher (under
SSA)
RajasthanRs 4800 - Vidhyarthi Mitra Level I/Level II (under PRI)
Rs 5300 - Vidhyarthi Mitra Secondary (under PRI)
MizoramRs 16,200 - Trained graduate (primary); Rs 20,568 – Trained graduate
(UPS/Secondary)
Uttar Pradesh Rs 3500 – Shiksha Mitra; Rs 7000 – Anudeshak (UPS)
Punjab Rs 19,200 – IERT; 28,000 - SSA Primary; Rs 31,500 – SSA (UPS)/RMSA
Madhya Pradesh Rs 100 – 150 – Atithi Shilshak
Source: State Reports
20 October 2015

Time spent on non-teaching duties?
a. Karnataka calculated using UDISE data and it comes to
7.32% in 2009-10 and only 1.62% in 2012-13;
i. Is this the RtE impact or because there are many more teachers
now?
b. Time-on Task study in Andhra Pradesh, Madhya Pradesh and
Uttar Pradesh - actual teaching time is 81-87 percent out of
223-231 school-calendar days
c. Of the teaching time, only 24% on student centric activities
20 October 2015NUEPA & The World Bank
46

Schools visited / inspected
20 October 2015NUEPA & The World Bank
47
StatePercentage of schools visited by
CRC Coordinators in 2011-12
Percentage of schools
inspected in 2011-12
Jharkhand 79 45
Karnataka 96 44
Madhya Pradesh 71 54
Mizoram 90 51
Odisha 78 42
Punjab 32 28
Rajasthan 54 61
Tamil Nadu 86 67
Uttar Pradesh 52 40
All India 68 51
Source: DISE Analytical Table 2012-13
Teacher MIS related
a. Most states have some form of teacher MIS – for release of
salary
i. Does not include training related information
b. Karnataka HRMS:
i. Name, date of birth, entry date, designation, qualifications, caste,
service record (how many years in school/rural/urban), subjects
taught, physical handicap/medical condition, salary details
(including different allowances, loans, insurance deductions,
pension deductions etc.), leave credits and encashment, seniority
list, retirement details, release of/arrears in salary/allowances,
complaints against the teacher
20 October 2015NUEPA & The World Bank
48

Professional growth
a. All States: promotions solely on the basis of seniority;
b. Several states have specific programs to assist teachers
acquire higher qualifications;
c. No state has policy for in-service teacher training – mostly
through SSA and RMSA;
d. Trainings exclusively funded by SSA and RMSA; Calendar
submitted AWPB;
e. Some states have reported a teacher performance appraisal
process, but on pilot basis so far.
20 October 2015NUEPA & The World Bank
49

Teacher appraisal
a. MHRD GOI has introduced a Teacher Appraisal format in
July 2014 - there are 7 formats which teachers have to fill
(for data base, self assessment). This system is yet to be
implemented, although some activities have started.
b. States yet to adopt it
c. MHRD informed that several states have attempted pilots in
a few block – information not available to research team
20 October 2015NUEPA & The World Bank
50

Grievance Redressal
20 October 2015NUEPA & The World Bank
51
a. There are two main mechanisms available for grievance
redressal outside the courts:
i. Non-statutory mechanisms offered by Executives: Grievance
redressal sessions offered by state education officers at block,
district or state level;
ii. Statutory/Quasi-Judicial Mechanism: Specialized dispute
resolution tribunals that deal with service related matters or education
related matters

Grievance redressal
a. In this study of teacher grievance redressal through the courts,
high court cases that were disposed in the last 5 years were
analysed:
i. Majority of the judgment were recruitment and service benefits
related petitions filed by existing teachers and by teacher applicants;
ii. Grievances related to appointments, regularization and disputes over
examination standards were disposed quickly compared to those
related to service and retirement benefits
iii. Two main types of grievances related to appointments (33.2%) and
service benefits (47.01%);
52
20 October 2015NUEPA & The World Bank

Recommendations
20 October 2015
53
NUEPA & The World Bank

Ideas we can take forward
20 October 2015NUEPA & The World Bank
54
a. Streamlined teacher recruitment and deployment policies and
processes;
b. Strengthen the institution of headmasters / principals and
give more powers (not only more responsibilities), including
academic;
c. Systematic induction programme for teachers
d. Booklets of information related to teacher role /
responsibility, rights are spelt out.
i. Explore the idea of assigning mentors to teachers

Ideas we can take forward
20 October 2015NUEPA & The World Bank
55
e. Teachers must know that there are systems in place to protect
their professional interests and aspirations and that their
performance matters and will be acknowledged.
i. Positive incentive / encouragement for job well done
f. Transparent grievance redressal mechanisms
g. Transparent performance appraisal
i. Both two sides of the same coin.

Teacher MIS
20 October 2015NUEPA & The World Bank
56
a. Robust teacher information system would address:
i. Delays in promotion / increments / transfers due to administrative
inefficiencies like maintenance of service book / teacher records;
and
ii. Deputing teachers for training on the basis of their needs / past
training experience.
iii. Enable the government to include information that could be used
for teacher appraisal, thereby bringing more clarity to whom /
what teachers are accountable to.
iv. Bihar, MP, TN, Karnataka and Rajasthan have teacher MIS.
Worthwhile to study them.

Finally
20 October 2015NUEPA & The World Bank
57
a. Our study shows a number of administrative problems
caused by poorly-developed policies or practices;
b. State governments could consult each other and initiate
debate.
a. There is evidence that states do learn from each other. Odisha sent
officials to Karnataka to study the teacher recruitment and transfer
policy and practice.
c. Beyond enhancing administrative efficiency, this approach
would have the added benefit of promoting transparency