teaching genetic linkage and recombination through mapping with molecular markers note for...
TRANSCRIPT

Teaching Genetic Linkage and Recombination through Mapping with Molecular
Markers
Note for instructors: Please see the notes field for comments that might be useful to you as an
instructor when running this lesson.
Lisa McDonnell & Jennifer Klenz

Mapping with Molecular Markers
Where is the drought tolerance locus?

Lesson Plan
Part 1• Assessing genetic linkage between a trait of interest
and a molecular marker if we do a testcross (dihybrid F1 x homozygous recessive).
Part 2• Predicting and assessing genetic linkage when we
do a dihybrid x dihybrid cross (F1 x F1)
• Explain how molecular markers (such as SNPs, microsatellites, VNTRs) can be used to map the location of genes/loci, including what crosses you would do, and why.
• From analysis of data from a cross (such as gel banding patterns) determine if crosses involve linked genes.
• Be able to justify your analysis by describing the information in the data that allows you to determine genes are linked.
• Use linkage information between multiple loci to construct a genetic map
Learning Objectives
Brainstorm in your groups
1. If we know the location of some genes in a genome, how can we use that information to determine what DNA sequences cause specific traits of interest?
2. What are some examples of traits for which you (or someone) might want to know the location of a gene in the genome that controls that trait?
3. Why would you want to know the location of a gene?
Genes closer together on a chromosome are more often inherited together
Write down your group answers and hand them in
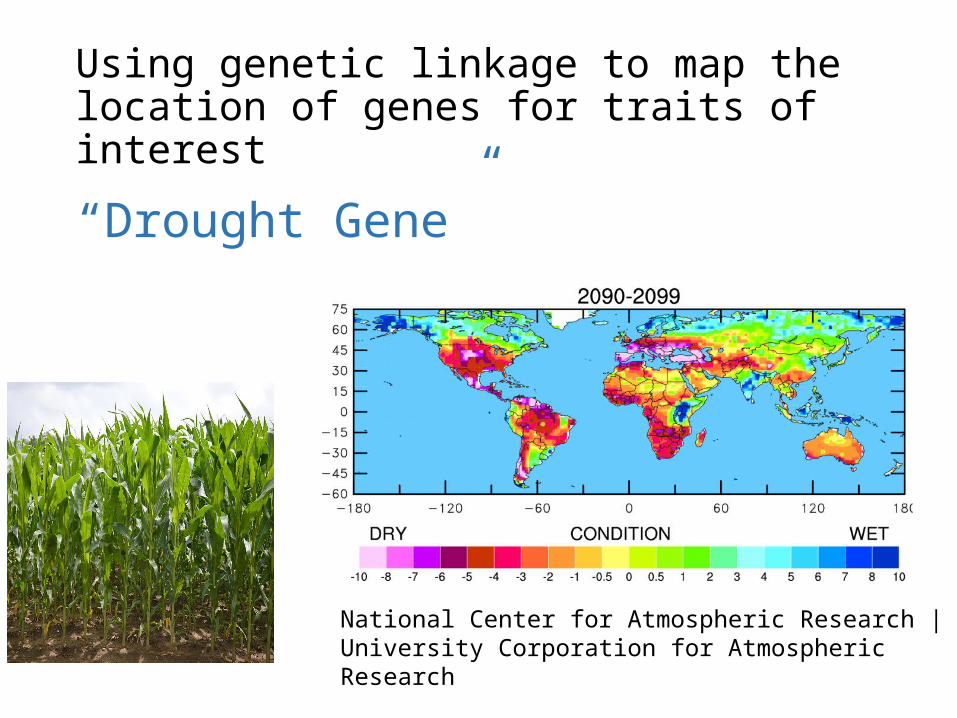
National Center for Atmospheric Research | University Corporation for Atmospheric Research
Using genetic linkage to map the location of genes for traits of interest
“Drought Gene”

Example: a drought tolerant plant.
Most plants do not thrive in drought conditions. They may still reproduce, but they have lower yield.
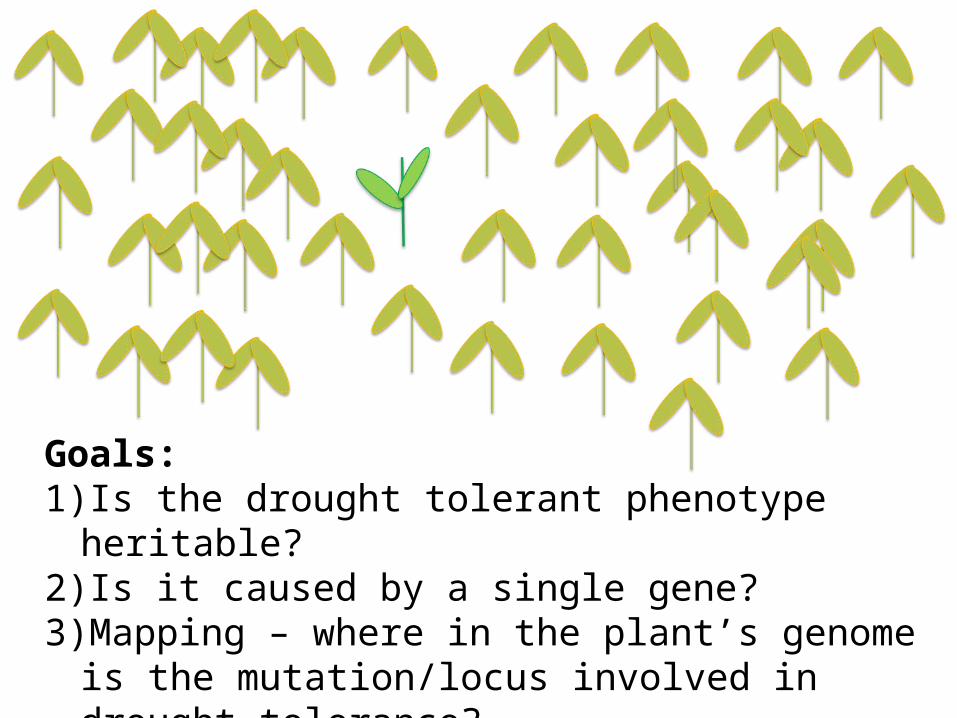
Goals:1) Is the drought tolerant phenotype heritable? 2) Is it caused by a single gene? 3) Mapping – where in the plant’s genome is the
mutation/locus involved in drought tolerance?
x
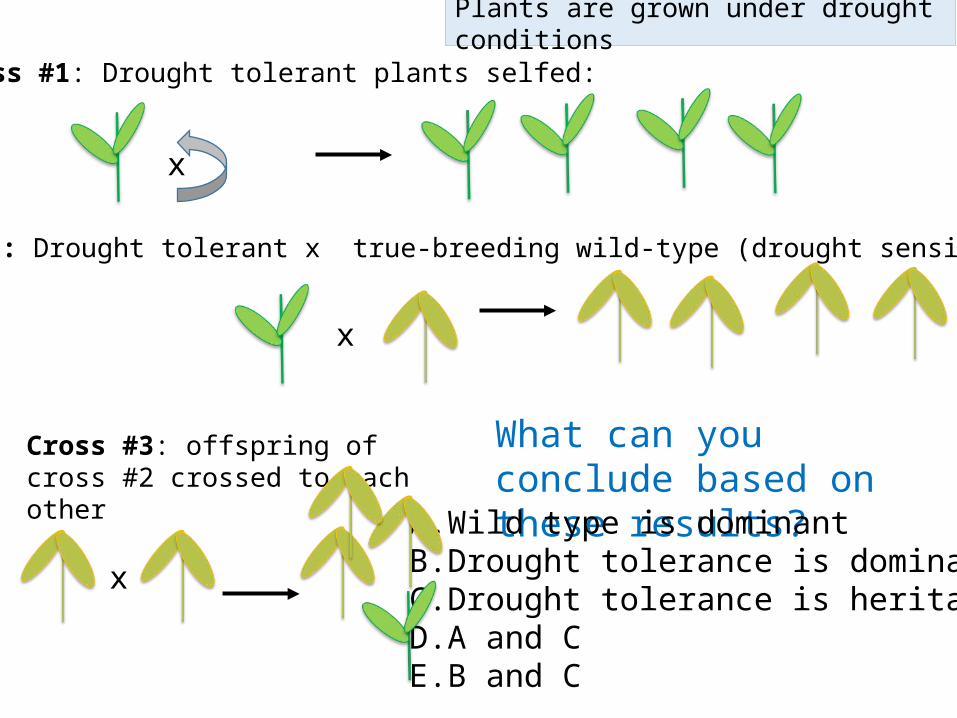
Cross #1: Drought tolerant plants selfed:
What can you conclude based on these results? A. Wild type is dominantB. Drought tolerance is dominantC. Drought tolerance is heritableD. A and CE. B and C
Plants are grown under drought conditions
x
Cross #2: Drought tolerant x true-breeding wild-type (drought sensitive)
Cross #3: offspring of cross #2 crossed to each other
x
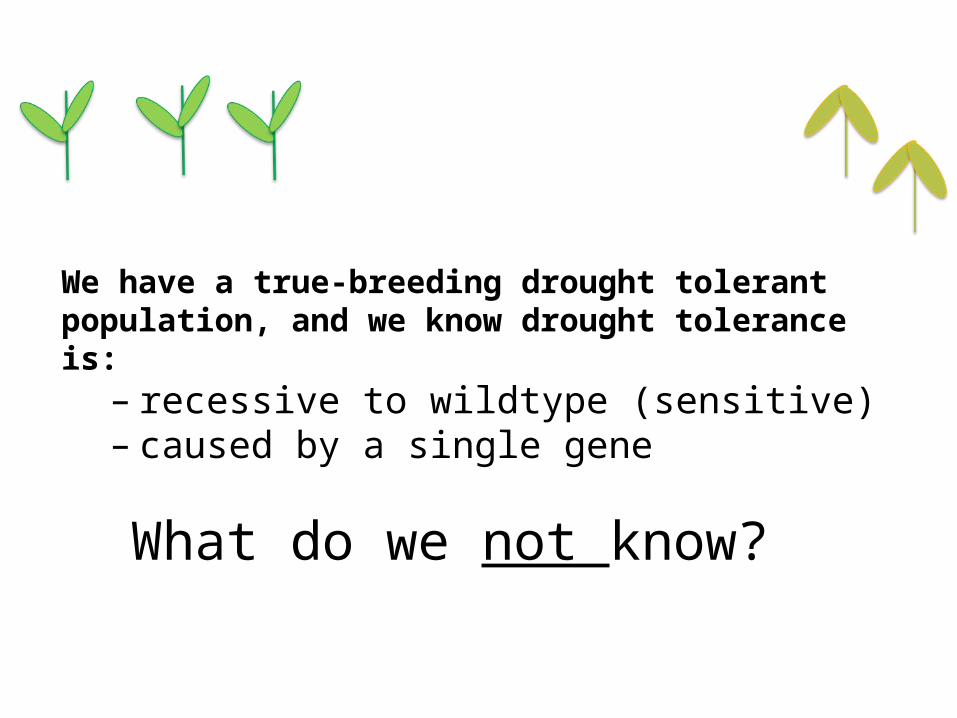
We have a true-breeding drought tolerant population, and we know drought tolerance is:
– recessive to wildtype (sensitive)– caused by a single gene
What do we not know?

Goal: Map (identify) the location of the locus/gene/mutation that causes the drought
tolerant phenotype.
• Wildtype is drought sensitive, DRS
• New mutant is drought tolerant, DRT
• DRS is dominant to DRT
• We only know the phenotype and hypothetical genotypes assigned based on the results of crosses:
F1:
DRT / DRT DRS /DRS
X
DRT / DRS
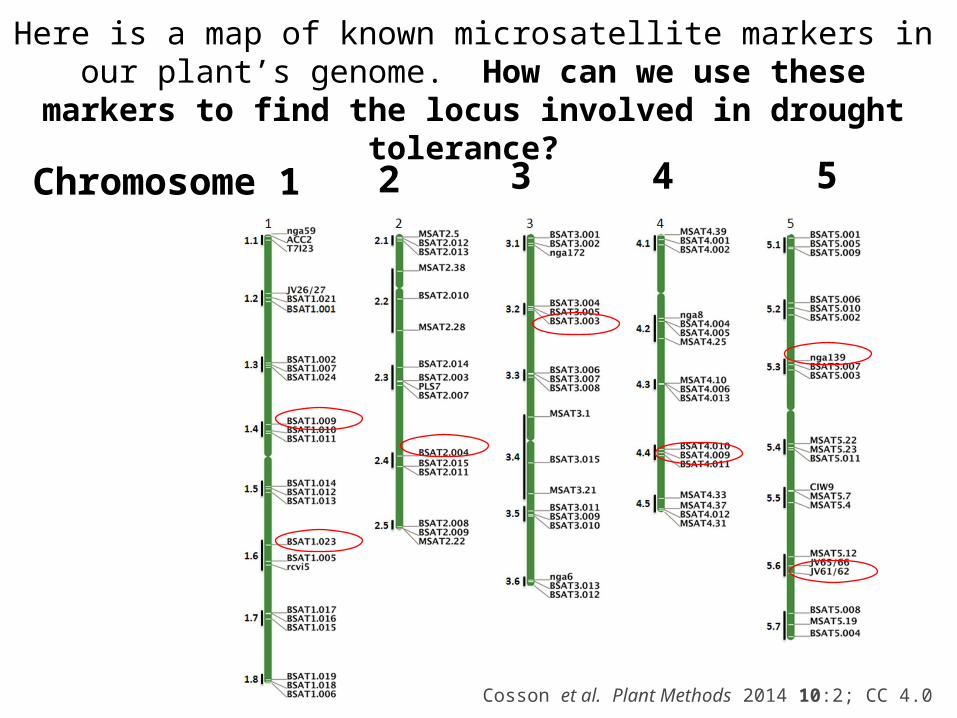
Here is a map of known microsatellite markers in our plant’s genome. How can we use these markers to find the locus
involved in drought tolerance?
12
Chromosome 1 2 3 4 5
Cosson et al. Plant Methods 2014 10:2; CC 4.0
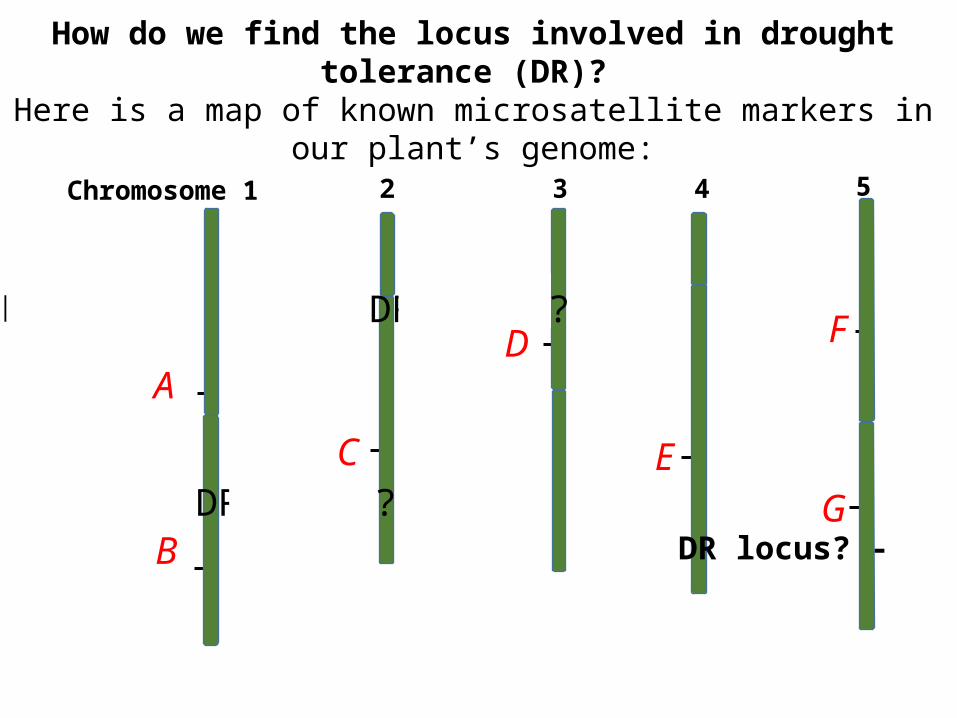
How do we find the locus involved in drought tolerance (DR)?
Here is a map of known microsatellite markers in our plant’s genome:
B
D
EC
A
Chromosome 1 2 3 4 5
F
G
DR locus?
DR locus?
DR locus?
DR locus? -
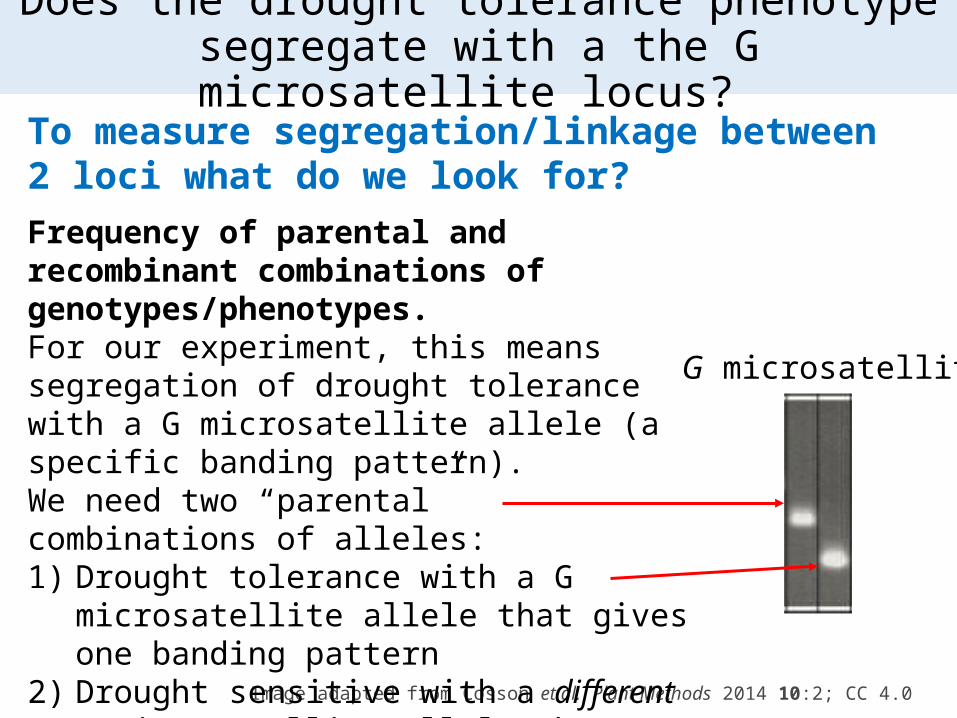
Does the drought tolerance phenotype segregate with a the G microsatellite locus?
Image adapted from Cosson et al. Plant Methods 2014 10:2; CC 4.0
To measure segregation/linkage between 2 loci what do we look for? Frequency of parental and recombinant combinations of genotypes/phenotypes. For our experiment, this means segregation of drought tolerance with a G microsatellite allele (a specific banding pattern). We need two “parental” combinations of alleles:1) Drought tolerance with a G microsatellite allele
that gives one banding pattern 2) Drought sensitive with a different G
microsatellite allele that gives a different banding pattern
G microsatellite
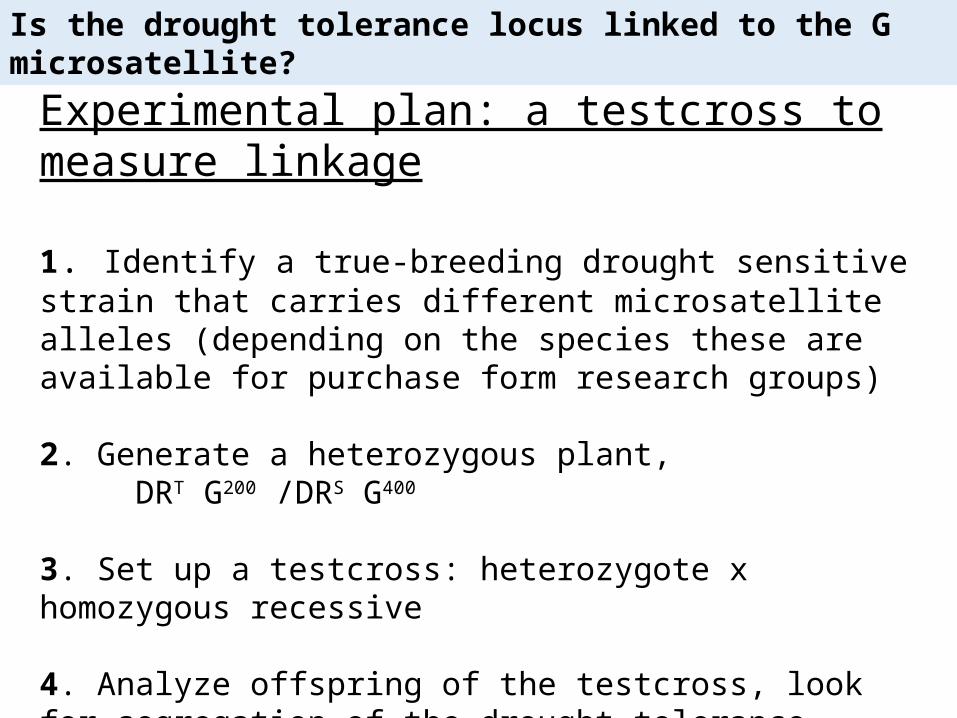
Is the drought tolerance locus linked to the G microsatellite?
Experimental plan: a testcross to measure linkage
1. Identify a true-breeding drought sensitive strain that carries different microsatellite alleles (depending on the species these are available for purchase form research groups)
2. Generate a heterozygous plant, DRT G200 /DRS G400
3. Set up a testcross: heterozygote x homozygous recessive
4. Analyze offspring of the testcross, look for segregation of the drought tolerance phenotype with G200 and G400 alleles.
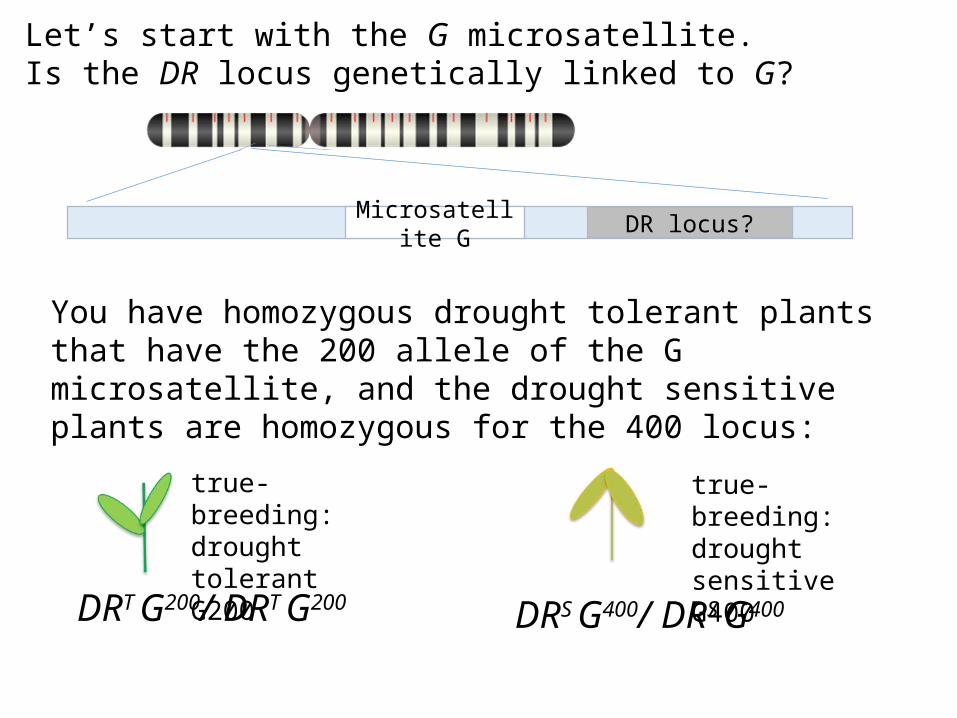
Let’s start with the G microsatellite. Is the DR locus genetically linked to G?
You have homozygous drought tolerant plants that have the 200 allele of the G microsatellite, and the drought sensitive plants are homozygous for the 400 locus:
Microsatellite G DR locus?
DRT G200/ DRT G200 DRS G400/ DRS G400
true-breeding: drought tolerant G200
true-breeding: drought sensitive G400

Is the drought tolerance locus linked to the G microsatellite?
Drought tolerant
DRTG200 / DRTG200
Drought sensitive
DRS G400 / DRSG400
Ultimately we need to look for recombination (or independent assortment) between the DR and G loci.
Parent plants:
What crosses will we do next?

Generating a heterozygous plant
DRT G200 / DRT G200 DRS G400 / DRS G400
X
• Draw chromosomes of the parent plants and the resulting F1.
• What phenotypes will we see in the F1?
• What G microsatellite banding patterns will we see from the parent and F1 plants?
F1
F1 plant:
Parent: Parent:
200
400

F1:P generation:
F1 plant: drought sensitive
Parent: drought tolerant
Parent: Drought sensitive
200
400
Expected F1 phenotypes and banding patterns
DRS G400/ DRT G200DRT G200 / DRT G200 DRS G400 / DRS G400
X

Assessing linkage: using a testcross
Drought sensitiveDRS G400 / DRT G200
1. What gamete genotypes will each plant produce? (draw the chromosomes!)
2. Which are parental? Recombinant? 3. What phenotype (drought tolerant or sensitive) and what
banding patterns will F2 have? (draw a Punnett Square to make your predictions)?
4. What F2 results will suggest linkage between the DR locus and G microsatellite locus?
F2
DRT G200 / DRT G200
Drought tolerant
F1 x homozygous recessive (“tester”)
F2
200
400
Drought tolerant
Drought tolerant
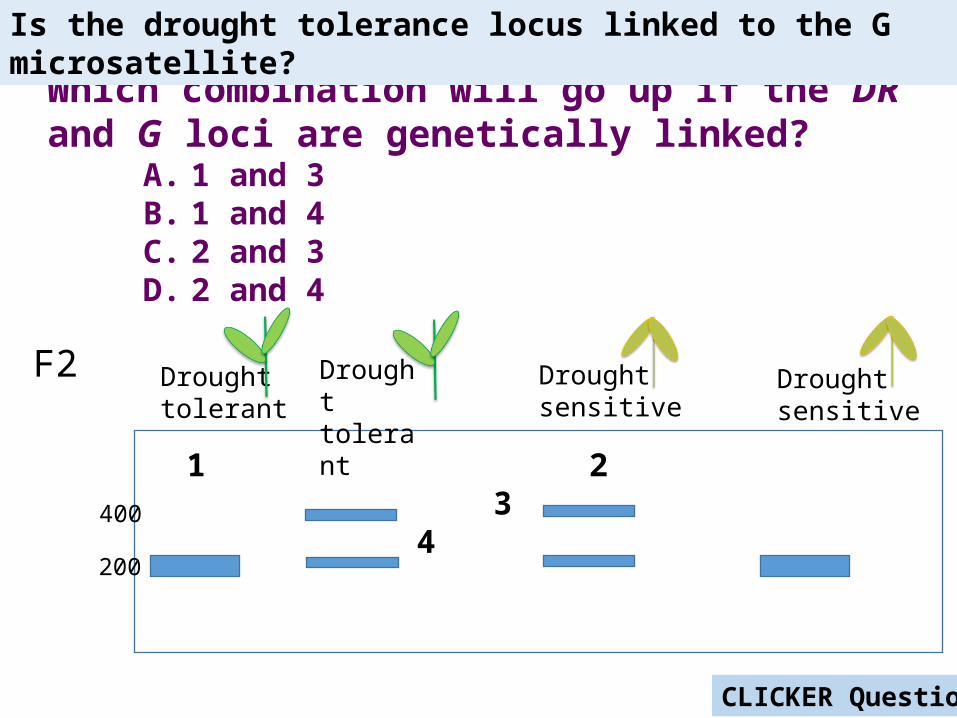
Which combination will go up if the DR and G loci are genetically linked?
A. 1 and 3 B. 1 and 4 C. 2 and 3 D. 2 and 4
1 2 3 4
Drought sensitive
Drought sensitive
Is the drought tolerance locus linked to the G microsatellite?
CLICKER Question
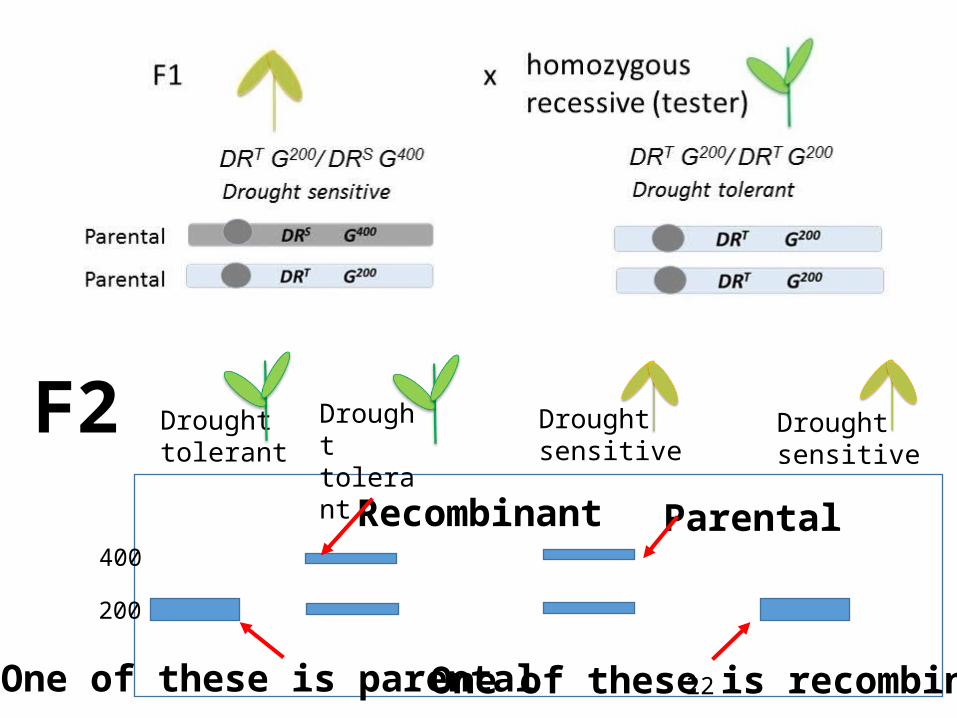
F2
200
400
Drought tolerant
Drought sensitive
Drought tolerant
Drought sensitive
22One of these is parental
Recombinant Parental
One of these is recombinant

Linkage: less than 50% recombinant types
• If two loci assort independently we expect 50% parental types and 50% recombinant types.
• If two loci are linked we expect less than 50% recombinant types
Frequency of recombinants = Number of recombinant types Total number of samples analyzed

Now that we’ve made predictions, let’s analyze some data
Our testcross scenario: F1 x homozygous recessive F2
Examine the four gels and determine which (if any) indicates the drought tolerance locus is genetically linked to the G microsatellite? (gels are on the next two slides)
What is the map distance?
Is the drought tolerance locus linked to the G microsatellite?
200
400
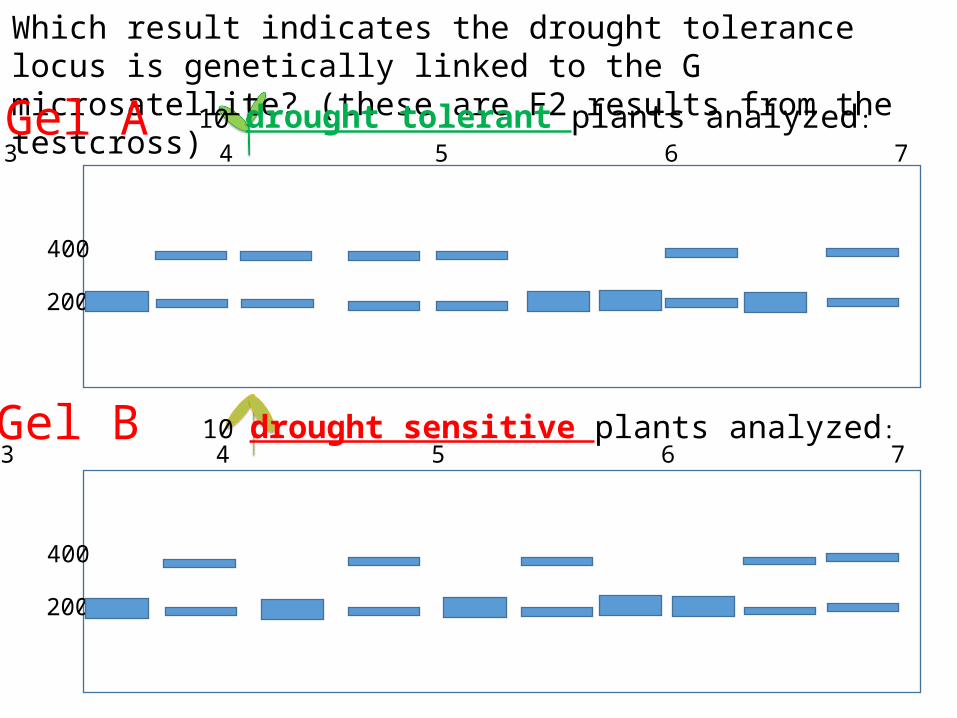
Which result indicates the drought tolerance locus is genetically linked to the G microsatellite? (these are F2 results from the testcross)
200
400
1 2 3 4 5 6 7 8 9 10
1 2 3 4 5 6 7 8 9 10Gel A
Gel B
10 drought tolerant plants analyzed:
10 drought sensitive plants analyzed:

200
400
Which result indicates the drought tolerance locus is genetically linked to the G microsatellite? (these are F2 results from the testcross)
10 drought tolerant plants analyzed:
200
400
10 drought sensitive plants analyzed:1 2 3 4 5 6 7 8 9 10
1 2 3 4 5 6 7 8 9 10Gel C
Gel D
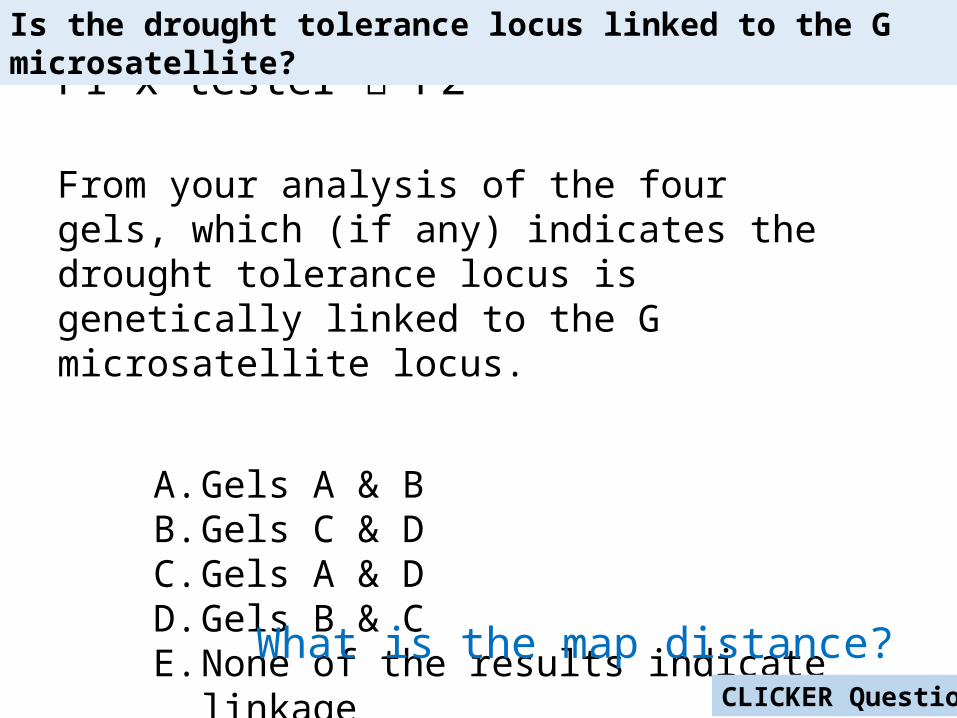
F1 x tester F2
From your analysis of the four gels, which (if any) indicates the drought tolerance locus is genetically linked to the G microsatellite locus.
A. Gels A & BB. Gels C & DC. Gels A & DD. Gels B & CE. None of the results indicate linkage
What is the map distance?
Is the drought tolerance locus linked to the G microsatellite?
CLICKER Question

Always determine what allele combination is considered parental, and which is recombinant. Draw the chromosomes of the parents and F1 to be sure you keep track of information correctly.
If you do an F1 testcross you can analyze the entire F2 population to determine linkage. You always know what gamete genotype the tester donates, so the F2 phenotype proportions are representative of the recombination events (and frequencies) that happened in the F1.
Summary

Part 2: Determining linkage when we do
a dihybrid cross
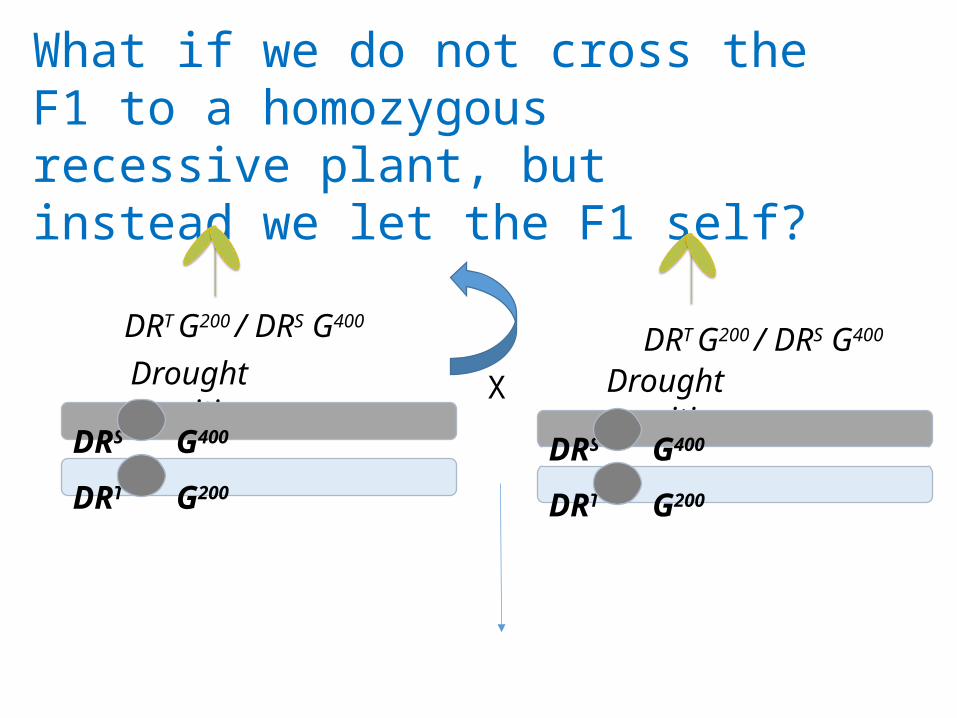
What if we do not cross the F1 to a homozygous recessive plant, but instead we let the F1 self?
Drought sensitiveDRT G200 / DRS G400
DRT G200
DRS G400
Drought sensitive
DRT G200
DRS G400
X
DRT G200 / DRS G400

Experimental PlanSelfed Many hundreds of F2 plants.
Screen phenotypes & use PCR for the microsatellite marker
Plants are grown under drought conditions
DRT G200 / DRS G400

Insert a picture of a growth chamber, such as the picture found at: http://www.rochmechatronics.com/Humidity-enviornmental-chamber.html

F1:
P generation:
Predict what the F2 data will look like if there is linkage
Predict what the F2 data will look like if there is independent assortment
Drought sensitive Self-fertilized
DRTG200 / DRT G200 DRS G400/DRS G40
X
DRT G200 / DRS G400

Students assemble into groups of 6 and then break into 2 mini-groups: 3 people in each mini-group.
3 people will predict what the F2 will look
like, and banding patterns, if marker
and DR locus are not linked (assort
independently)
Come back together in your group of 6. Teach each other about your predictions and identify how they are different, and how they are different from when we did an F1 x tester cross. COMPLETE HANDBOUT B.
3 people will “predict what the F2 will look like,
and banding patterns, if marker
and DR locus are linked”
Prediction Activity
Each group, on the flip chart paper: draw gametes,
chromosomes with alleles labelled, banding patterns on a gel. Put your work on the
wall when you are done. COMPLETE HANDOUT A
You have 15 minutes!
Class Slide 1
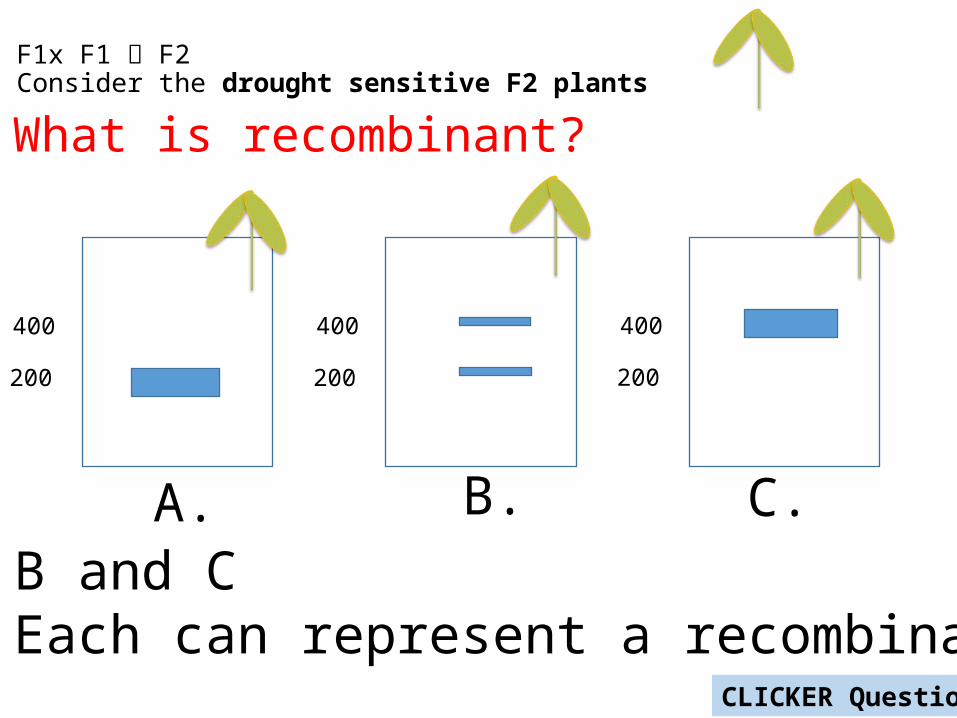
F1x F1 F2 Consider the drought sensitive F2 plants
200
400
200
400
200
400
A. B. C.D. B and CE. Each can represent a recombinant
What is recombinant?
CLICKER Question

F1 self. Drought tolerant F2 plants only
200
400
200
400
200
400
A. B. C.
D. B and CE. Each contains a recombinant band
What is recombinant?
CLICKER Question

A. The entire F2 population
B. The F2 drought tolerant plants only
C. The F2 drought sensitive plants only
Which plants would you use to test for genetic linkage?
CLICKER Question
200
400
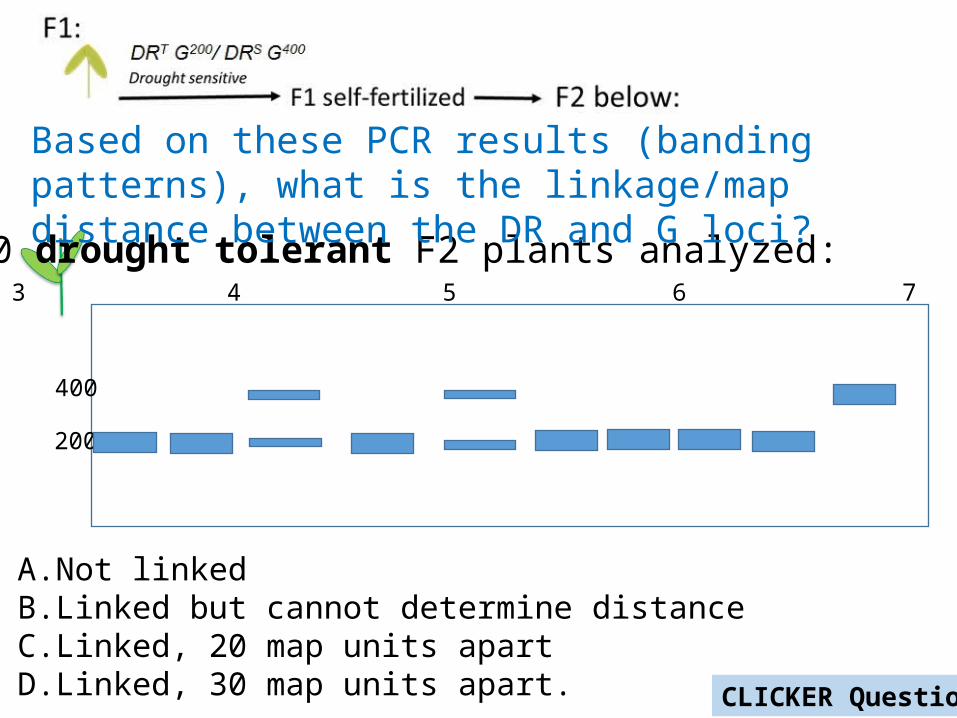
10 drought tolerant F2 plants analyzed:1 2 3 4 5 6 7 8 9 10
Based on these PCR results (banding patterns), what is the linkage/map distance between the DR and G loci?
A. Not linkedB. Linked but cannot determine distanceC. Linked, 20 map units apartD. Linked, 30 map units apart. CLICKER Question

homozygous recessiveDRT G200/ DRT G200
x
• Only gametes from the F1 can contain recombinant genotypes (chromosomes)
• Each F2 plant receives one gamete from the F1, so only one “band” in each F2 plant can be parental ore recombinant.
• Count the number of recombinant bands/total number of plants
How do we calculate map distance? x
F1 self or F1 x F1
• Gametes from each F1 can be parental or recombinant.
• Both gametes that make the F 2plant come form the F1, so both “band” in an F2 need to be classified as either parental or recombinant
• Count the number of recombinant bands/total number bands
DRT G200 / DRS G400
F1
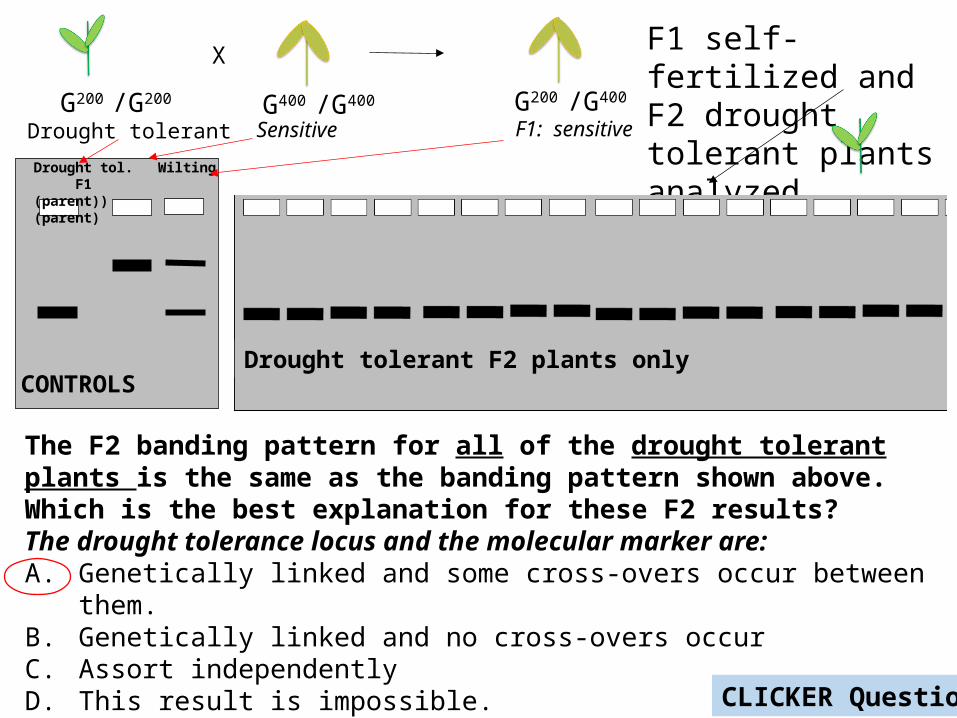
Drought tolerant Sensitive
X
G200 G400 /G400/G200
F1: sensitiveG200 /G400
The F2 banding pattern for all of the drought tolerant plants is the same as the banding pattern shown above. Which is the best explanation for these F2 results? The drought tolerance locus and the molecular marker are:A. Genetically linked and some cross-overs occur between them.B. Genetically linked and no cross-overs occurC. Assort independentlyD. This result is impossible.
F1 self-fertilized and F2 drought tolerant plants analyzed.
Drought tol. Wilting F1(parent)) (parent)
CONTROLSDrought tolerant F2 plants only
CLICKER Question

Practice Assessing Linkage by analyzing results of an F1 x F1 cross
New trait of interest: potatoes that are resistant to the Colorado Potato Beetle.
a pest that destroys millions of dollars of potato crops each year (and the beetle is resistant to most insecticides)
© 2008, Pilise Gábor.Creative Commons 3.0
You have found a potato plant that potato beetles do not attack. Is the plant producing something that deters attack from the beetle (or kills the beetle)?

Goal: Find the locus involved in beetle resistance (BR)
C
D
B
43
A
Chromosome 1 2 3 4 5
E
F
We’ll call the locus involved in potato beetle resistance BRBRR is the resistance alleleBRS is the wildtype allele (potatoes are susceptible to beetle attack)BRS is dominant to BRR
We have six molecular markers we are using: A-F

HANDOUT CIn your teams of 3, analyze the banding patterns and decide if linkage is occurring between the BR locus and the microsatellite markers.
Marker Allele in resistant parent plant
Allele in susceptible parent plant
A 200 400B 350 100C 90 550D 50 75E 675 600F 220 410
Resistant plant XBRR A200/BRR A200
Which F2 plants will we select for our analysis?- Beetle resistant- Normal
F1s self-fertilized
Susceptible plant
BRS A400/BRS A400
F1s: Susceptible BRR A200/BRS A400

Use handouts with gel data from different markers to determine the location
• Determine linkage• Calculate map distance• First group of 3 with the correct
answer wins bragging rights!

For your interest: What do you do next?
If the genome for this plant is sequenced: Look at the genes in this approximate location. At a specific map location there could be anywhere from 20-500 genes depending on the genome.
Depending on the phenotype of interest it could be difficult or easy to make educated guesses as to possible target genes.
For species like Arabidopsis there are databases with additional sources of helpful information such as whether any gene is expressed under specific conditions, including attack by pests such as the beetle. Genes in this region could be checked to see what their wild-type expression pattern looks like under pest attack.
You could compare the DNA sequence of your beetle resistant plant to wildtype for your most likely candidate genes to look for sequence differences causing the mutant phenotype.
You could take a wild copy of a likely candidate gene and add it to the mutant to see if the wild type phenotype is restored. 46
B
A
BR, Beetle resistant locus