teaching leadership in agricultural...
TRANSCRIPT

TEACHING LEADERSHIP IN AGRICULTURAL SCIENCE:
BEHAVIORAL FACTORS THAT INFLUENCE SECONDARY AGRICULTURAL SCIENCE LEADERSHIP INSTRUCTION
By
ALAN CHRISTIAN MORGAN
A DISSERTATION PRESENTED TO THE GRADUATE SCHOOL OF THE UNIVERSITY OF FLORIDA IN PARTIAL FULFILLMENT
OF THE REQUIREMENTS FOR THE DEGREE OF DOCTOR OF PHILOSOPHY
UNIVERSITY OF FLORIDA
2004

Copyright 2004
by
Alan Christian Morgan

This document is dedicated to my best friend, my wife Susan Morgan, and my three children, Tyler, Allison and Spencer for supporting me while I followed God’s lead
pursuing this degree.

ACKNOWLEDGMENTS
I would like to thank my wife and children for enduring the past three years while I
have spent numerous hours studying, writing, and generally being pre-occupied with
earning this degree. They have been more than supportive in my endeavor and I am
forever indebted to them.
I would also like to thank my parents. First my mother Nancy Morgan, who has
always held education in high esteem and instilled that value in me. And my father Tom
Morgan, who demonstrated endurance and tenacity, two qualities that have proved useful
to me during these past three years.
A tremendous amount of gratitude goes out to my committee chair, Dr. Rick Rudd,
who has helped to form this agriculture teacher into a researcher and writer. He may
have suffered more frustrations with my program than I have. Dr. Rudd spent more
hours than should be required editing my writing, expanding my thinking, and mentoring
me through this process. His patience and encouragement are to be commended.
I could not have completed this degree without my committee, Drs. Howard
Ladewig, Shannon Washburn, and James Doud. They assisted me in designing a good
study, and forced me to explain and defend my actions. Their persistence has helped
hone my research skills. All of them have been very supportive and have exhibited a
great deal of patience with me during this process, and I thank them for that.
My friends and colleagues in 310 Rolfs Hall were supportive throughout this
process. Not only did we challenge each other on issues, which allowed us all to grow,
iv
they were particularly supportive during the struggles I encountered while pursuing this
degree. A heart-felt thank you goes to each one of you.
Finally, a gracious thank you goes to my Lord and Savior Jesus Christ. It was by
His leading that I pursued this degree, and His grace that supported me through this
process. Had I not believed that God wanted me to pursue this endeavor, I would not
have had the tenacity to earn this degree. Thank you Lord.
v

TABLE OF CONTENTS Page ACKNOWLEDGMENTS ................................................................................................. iv
LIST OF TABLES...............................................................................................................x
LIST OF FIGURES .......................................................................................................... xii
ABSTRACT..................................................................................................................... xiv
CHAPTER 1 INTRODUCTION ........................................................................................................1
Introduction to the Study ..............................................................................................1 Background...................................................................................................................1 Problem Statement........................................................................................................5 Significance ..................................................................................................................6 Purpose .........................................................................................................................7 Assumptions .................................................................................................................8 Limitations....................................................................................................................8 Definitions ....................................................................................................................9 Chapter Summary .........................................................................................................9
2 REVIEW OF THE LITERATURE ............................................................................11
Defining Leadership ...................................................................................................12 The Importance of Teaching Leadership....................................................................13 Youth Leadership Development .................................................................................14
Existing Youth Programs ....................................................................................15 High School Youth Programs..............................................................................16 Career and Technical Education Youth Programs ..............................................17 Impact of Agricultural Science and FFA Programs on Youth Leadership .........18 Section Summary.................................................................................................22
A Leadership Curriculum for Youth...........................................................................23 The Model of Youth Leadership Development...................................................24 LifeKnowledge Curriculum Origin and Development........................................25 Curriculum Adoption...........................................................................................28 Section Summary.................................................................................................32
Why High School Agricultural Science Instructors Teach Leadership......................33 Theories of Behavior ...........................................................................................33
vi

Modified Triandis Model of Behavior ................................................................34 Population Studied...............................................................................................36 High School Agricultural Science Instructor Leadership Teaching Behavior ....37 Explanatory Variables .........................................................................................37
Knowledge ...................................................................................................37 Attitude.........................................................................................................37 Expectations .................................................................................................38 Demographics...............................................................................................38
Section Summary.................................................................................................39 Chapter Summary .......................................................................................................39
3 METHODS.................................................................................................................41
Context of the Study ...................................................................................................42 Place ....................................................................................................................42 Time.....................................................................................................................42 National FFA Organization .................................................................................43
Research Design .........................................................................................................43 Research Objectives....................................................................................................44 Population ...................................................................................................................45 Sample ........................................................................................................................45 Instrumentation ...........................................................................................................45 Procedures...................................................................................................................48
Pilot Study ...........................................................................................................48 Data Collection Procedures .................................................................................49 Response Rate .....................................................................................................50
Data Analysis..............................................................................................................51 Summary.....................................................................................................................54
4 RESULTS...................................................................................................................55
Objective One: Determine the Demographic Characteristics of High School Agricultural Science Instructors ............................................................................57
Age, Years Teaching, and Years Teaching in Current Position..........................57 Gender .................................................................................................................60 Number of Instructors at School..........................................................................61 School Location...................................................................................................63 Educational Background .....................................................................................65 FFA Involvement.................................................................................................66 High School and College Leadership Activities .................................................67 Professional and Civic Organization Leadership Experience .............................68 Committee Participation, and Workshops and Seminar Presentations ...............71 School and Vocational Department Leadership Positions, and Attending the
Advisors Washington Leadership Conference.................................................73 Leadership Course Taught in Agricultural Science Program..............................74
Objective Two: Determine the Extent to which Leadership Education is being Taught in High School Agricultural Science Classrooms .....................................76
vii

Objective Three: Based on National FFA LifeKnowledge Leadership Curriculum, Determine High School Agricultural Science Instructor Leadership Knowledge .............................................................................................................78
Objective Four: Determine High School Agricultural Science Instructor Attitude towards Teaching Leadership ................................................................................80
Objective Five: Determine the Expectations that High School Agricultural Science Instructors have of the Agriculture Students after Leadership has been Taught ....................................................................................................................82
Objective Six: Determine the Relationship between High School Agricultural Science Instructor Leadership Knowledge, Instructor Attitude Towards Teaching Leadership, Instructor Expectations of Students after Teaching Leadership, and Instructor Demographics to Instructor Leadership Teaching Behavior.................................................................................................................84
Correlations .........................................................................................................84 Regression ...........................................................................................................85
Summary.....................................................................................................................87 5 DISCUSSION.............................................................................................................89
Problem Statement......................................................................................................90 Review of Research Design........................................................................................90 Summary of Results....................................................................................................91
Objective One......................................................................................................91 Objective Two .....................................................................................................92 Objective Three ...................................................................................................93 Objective Four .....................................................................................................93 Objective Five .....................................................................................................93 Objective Six .......................................................................................................94
Conclusions.................................................................................................................95 Discussion and Implications .......................................................................................96
Objective One: Determine the Demographic Characteristics of High School Agricultural Science Instructors ......................................................................96
The average agricultural science instructor is 39.37 years old, has been teaching for 14.85 years, and has been teaching in their current position for 10.61 years...........................................................................96
Most agricultural science instructors are male, teach in a rural location, are in a single teacher department, received their certification through a university agriculture teacher program, and earned their bachelor’s of science degree in agricultural education ...........................97
Instructors in teaching in urban locations were less likely to have participated in FFA as a high school student ........................................100
Most agricultural science instructors were an FFA member in high school, an FFA chapter officer, and held at least one office in other high school organization outside of FFA..............................................101
Most agricultural science instructors took at least one leadership course in college and were an officer in at least one college organization ......102
viii
Most participants were active in leadership roles beyond their teaching responsibilities ......................................................................................103
The demographic characteristics of agricultural science instructors that teach in rural areas differ from the demographic characteristics of agricultural science instructors in urban areas ......................................105
Females and males differ in their leadership experiences..........................106 There are significant age differences between genders..............................107
Objective Two: Determine the Extent to which Leadership Education is being Taught in High School Agricultural Science Classrooms ...................107
Objective Three: Based on National FFA LifeKnowledge Leadership Curriculum, Determine High School Agricultural Science Instructor Leadership Knowledge ..................................................................................110
Objective Four: Determine High School Agricultural Science Instructor Attitude towards Teaching Leadership ..........................................................111
Objective Five: Determine the Expectations that High School Agricultural Science Instructors have of the Agriculture Students after Leadership has been Taught....................................................................................................112
Objective Six: Determine the Relationship between High School Agricultural Science Instructor Leadership Knowledge, Instructor Attitude towards Teaching Leadership, Instructor Expectations of Students after Teaching Leadership, and Instructor Demographics to Instructor Leadership Teaching Behavior ......................................................................114
Recommendations.....................................................................................................116 Suggestions for Additional Research........................................................................117
APPENDIX A PAPER INSTRUMENT ...........................................................................................119
B INTERNET INSTRUMENT....................................................................................127
C SURVEY CORRESPONDENCE ............................................................................131
D TABLES ...................................................................................................................137
LIST OF REFERENCES.................................................................................................142
BIOGRAPHICAL SKETCH ...........................................................................................153
ix

LIST OF TABLES
Table page 3-1 Correlation Magnitude Descriptors ..........................................................................53
4-1 Participant Mean Age, Years Teaching, and Years Teaching in Current Position (n=167) .....................................................................................................................57
4-2 Pearson’s Product Moment Correlations Between Age, Years Teaching, Years Teaching in Current Position, and Selected Variables (n=157) ...............................60
4-3 Independent Groups t-test for Significant Variables by Gender (n=167) ................61
4-4 Pearson’s Product Moment Correlations between Gender and Selected Variables (n=156) .....................................................................................................................62
4-5 Number of agricultural science instructors at school (n=156) .................................62
4-6 Pearson’s Product Moment Correlations between Number of Instructors at School and Selected Variables (n=156) ...................................................................64
4-7 Location of school (n=154) ......................................................................................64
4-8 Pearson’s Product Moment Correlations between School Location and Selected Variables (n=154).....................................................................................................65
4-9 Educational Background (n=158) ............................................................................65
4-10 Pearson’s Product Moment Correlations Between Educational Background and Selected Variables (n=157) ......................................................................................66
4-11 FFA Involvement (n=158) .......................................................................................67
4-12 Pearson’s Product Moment Correlations between FFA Involvement and Selected Variables (n=158).....................................................................................................67
4-13 High School and College Leadership Activities of Participants ..............................68
4-14 Pearson’s Product Moment Correlations between High School and College Leadership Activities and Selected Variables (n=158) ............................................69
4-15 Number of Offices Held in Professional and Civic Organizations ..........................69
x

4-16 Pearson’s Product Moment Correlations Between Professional and Civic Organization Leadership Experience and Selected Variables (n=158)....................70
4-17 Pearson’s Product Moment Correlations Between Professional Development Organization Membership and Holding Office, and Selected Variables (n=158) ...71
4-18 Mean Committee Participation, and Workshops and Seminars Presented (n=158) 72
4-19 Pearson’s Product Moment Correlations Between Committee Participation, and Workshops and Seminar Presentations and Selected Variables (n=158).................73
4-20 Mean Number of Leadership Positions Held in Local School or Vocational Department and Advisors’ Washington Leadership Conference Attendance..........74
4-21 Pearson’s Product Moment Correlations Between School and Vocational Department Leadership Positions, and Attending the Advisors Washington Leadership Conference and Selected Variables (n=158) .........................................75
4-22 Pearson’s Product Moment Correlations Between Leadership Course Taught in Agricultural Science Program and Selected Variables (n=158)...............................75
4-23 Pearson’s Product Moment Correlations Between Instructor Leadership Teaching Behavior and Selected Variables (n=156)................................................................78
4-24 Pearson’s Product Moment Correlations Between Instructor Attitude Towards Teaching Leadership and Selected Variables (n=158).............................................81
4-25 Pearson’s Product Moment Correlations Between Instructor Expectations after Leadership has been Taught and Selected Variables (n=157) .................................84
4-26 Backward Regression Explaining Leadership Teaching Behavior (n=145) ............86
4-27 Crosstabs of Single-Instructor Department by Gender and Instructor Leadership Teaching Behavior ...................................................................................................87
D-1 Pearson’s Product Moment Correlations Between Age, Years Teaching, Years Teaching in Current Position, and Selected Variables (n=157) .............................137
D-2 Pearson’s Product Moment Correlations between Number of Instructors at School and Selected Variables (n=156) .............................................................................138
D-3 Pearson’s Product Moment Correlations Between Committee Participation, and Workshops and Seminar Presentations and Selected Variables (n=158)...............139
D-4 Pearson’s Product Moment Correlations between High School and College Leadership Activities and Selected Variables (n=158) ..........................................140
D-5 Pearson Product Moment Correlations between Instructor Leadership Teaching Behavior and Variables Studied.............................................................................141
xi
LIST OF FIGURES
Figure page 2-1 Model of Youth Leadership Development...............................................................25
2-2 Theoretical Model of Behavior ................................................................................36
4-1 Distribution of Participant Age ................................................................................58
4-2 Distribution of Participants’ Years Teaching...........................................................59
4-3 Distribution of Participants’ Years Teaching in Current Position ...........................59
4-4 Distribution of Number of Agriculture Instructors in School ..................................63
4-5 The Distribution of Instructor Leadership Teaching Behavior ................................77
4-6 Distribution of Instructor Leadership Knowledge ...................................................80
4-7 Instructor Attitude Toward Teaching Leadership. ...................................................81
4-8 Instructor Expectations after Leadership Has Been Taught.....................................83
4-9 Explanatory Model of Instructor Leadership Teaching Behavior............................86
A-1 Questionnaire Cover...............................................................................................119
A-2 Questionnaire Inside Cover ....................................................................................120
A-3 Questionnaire Section I ..........................................................................................121
A-4 Questionnaire Section II.........................................................................................122
A-5 Questionnaire Section III .......................................................................................123
A-6 Questionnaire Sections IV and V ...........................................................................124
A-7 Questionnaire Section V Continued.......................................................................125
A-8 Questionnaire Qualitative Questions......................................................................126
B-1 Screen Capture of the Introductory Web Page.......................................................127
xii
B-2 Screen Capture of Section I Web Form Questionnaire, Measuring Instructor Leadership Teaching Behavior...............................................................................128
B-3 Screen Capture of Section II Web Form Questionnaire, Measuring Instructor Expectations of Students after Leadership Instruction...........................................128
B-4 Screen Capture of Section III Web Form Questionnaire, Measuring Instructor Leadership Knowledge...........................................................................................129
B-5 Screen Capture of Section IV Web Form Questionnaire, Measuring Instructor Attitude toward Teaching Leadership ....................................................................129
B-6 Screen Capture of Section V Web Form Questionnaire, Instructor Demographics130
B-7 Screen Capture of Thank You Web Page...............................................................130
C-1 Pre-notice Letter .....................................................................................................132
C-2 Cover Letter for First Questionnaire ......................................................................133
C-3 Informed Consent Form .........................................................................................134
C-4 Thank You/ Reminder Postcard .............................................................................135
C-5 Cover Letter for Second Questionnaire..................................................................136
xiii

Abstract of Dissertation Presented to the Graduate School of the University of Florida in Partial Fulfillment of the Requirements for the Degree of Doctor of Philosophy
TEACHING LEADERSHIP IN AGRICULTURAL SCIENCE: BEHAVIORAL FACTORS THAT INFLUENCE SECONDARY AGRICULTURAL
SCIENCE LEADERSHIP INSTRUCTION
By
Alan Christian Morgan
August 2004
Chair: Rick D. Rudd Major Department: Agricultural Education and Communication
The extent to which leadership is being taught in agricultural science classrooms is
unknown and the attributes of high school agricultural science instructors that influence
their decision to formally teach leadership are unclear. Research has been conducted to
determine the predictors of agricultural science program quality and how leadership skills
affect youth and community, but no research has been conducted to determine the extent
to which leadership is being taught in the formal agricultural science classroom or why
agricultural science instructors choose to teach leadership. The following questions were
addressed in this study: To what extent are high school agricultural science instructors
teaching leadership in the formal classroom? What are the factors that influence high
school agricultural science instructors to teach leadership?
This study, framed by the National FFA’s LifeKnowledge curriculum, examined
behavioral factors that influence high school agricultural science instructors to teach
leadership in agricultural science classrooms. Using ex post facto research methods, a
xiv

model was developed to explain the dependent variable, level of leadership teaching
behavior in high school agricultural science classrooms, in light of the independent
variables, instructor leadership knowledge, instructor expectations of students after
teaching leadership, instructor attitude toward teaching leadership, instructor leadership
knowledge, and instructor demographics.
An alpha level of 0.05 was set a priori. A national sample of 400 instructors was
contacted and 167 responded via mail and the Internet, yielding a 41.8% response rate. A
regression model was used to explain leadership teaching behavior. The following
variables significantly explained 33% of instructor leadership teaching behavior:
Leadership course taught in agricultural science program, urban location of school,
gender, and instructor attitude toward the teaching of leadership. Findings revealed most
agricultural science instructors have a moderate attitude toward teaching leadership, have
moderate expectations of students after leadership instruction, and moderate leadership
knowledge, based on the LifeKnowledge curriculum. A recommendation was to provide
LifeKnowledge curriculum training to pre-service teachers and provide professional
development programs for in-service teachers to help increase instructor leadership
knowledge.
xv

CHAPTER 1 INTRODUCTION
Introduction to the Study
This study examined behavioral factors that influence high school agricultural
science instructors to teach leadership in agricultural science classrooms. Using ex post
facto research methods (Ary, Jacobs, & Razavieh, 1996) a model was developed to
explain the dependent variable, instructor leadership teaching behavior of high school
agricultural science instructors, in light of the independent variables, high school
agricultural science instructor leadership knowledge, high school agricultural science
instructor attitude towards teaching leadership, high school agricultural science instructor
expectations after teaching leadership, and high school agricultural science instructor
demographics. This chapter frames the study by defining leadership and providing a
rationale for teaching leadership in high school. It then provides the historical
background and current status of leadership instruction in agricultural education and the
National FFA Organization. A brief description of the National FFA’s LifeKnowledge
curriculum is provided along with an explanation of how the curriculum spawned this
research. Finally, the research problem and its significance are discussed.
Background
As we explore this issue, two questions should be addressed: “What is
leadership?” and “Why should leadership be taught to high school students?” Leadership
is a term with many definitions. The Merriam-Webster Dictionary (2003) defines
leadership as “the office or position of a leader; the capacity to lead; the act or an instance
1

2
of leading.” Northouse (2001) defines leadership as “a process whereby an individual
influences a group of individuals to achieve a common goal” (p.3 ). Kouzes and Posner
(1997) define leadership as “The art of mobilizing others to want to struggle for shared
aspirations” (p. 30). The LifeKnowledge curriculum defines leadership as “Influence –
the ability to obtain followers” (p. 5). Maxwell (1993) simply defines leadership as
“influence” (p. 1). For the purpose of this study the definition offered by Northouse
(2001) will be used.
Why should leadership be taught to high school students? Throughout the United
States businesses and government organizations are finding it difficult to fill leadership
positions because of a lack of trained leaders--a leadership void (Bisoux, 2002; Burns,
1979; Figura, 1999). In an effort to prepare youth for successful careers, the U.S.
Department of Labor (1999) published the Secretary’s Commission on Achieving
Necessary Skills (SCANS) that outlined the skills and competencies necessary for young
people to succeed in the workplace. The goal was for the skills and competencies
outlined in the SCANS report to be taught to youth through the secondary school system.
One of the competencies deemed necessary in the SCANS report for workplace success
was
Exercises Leadership—Communicates thoughts, feelings, and ideas to justify a position, encourages, persuades, convinces, or otherwise motivates an individual or groups, including responsibly challenging existing procedures, policies, or authority. Demonstrating competence in exercising leadership includes making positive use of the rules/values followed by others; justifying a position logically and appropriately; establishing credibility through competence and integrity; and taking minority viewpoints into consideration. (U.S. Department of Labor, 1999)
In an effort to fill the existing leadership void and properly prepare youth for workplace
challenges it is necessary to teach leadership to high school students.

3
For the past 75 years, high school agricultural education courses have created an
environment for students to “exercise leadership” and acquire many of the competencies
outlined in the SCANS report through the teaching of leadership skills (National
Research Council, 1988). Today leadership remains a cornerstone of the agricultural
education curriculum with many of the over 12,000 high school agricultural science
instructors teaching leadership competencies, including parliamentary law, proper
business meeting procedure and public speaking, to over 712,000 students enrolled in
agriculture courses (Barrett, 1983; National FFA Organization, 2002). A variety of
curriculum resources specifically designed for agricultural education students are
available for teaching leadership including material published by North Carolina State
University (2003), Instructional Materials Service (2003), Interstate Publishers (Prentice
Hall, 2003), and Delmar Publishers (2003).
In addition to leadership instruction in the agriculture classroom, the co-curricular
partnership with the National FFA Organization provides opportunities for youth to
practice and demonstrate leadership competencies to prepare youth for successful careers.
Historically, the marriage of agriculture and leadership grew out of the need for farmers
to share successful agricultural practices with one another. Agricultural societies were
formed so that new farming techniques could be shared with others and published,
benefiting farmers in a local community. Out of these agricultural societies grew corn
clubs for boys and girls, which provided opportunities for youth to meet, learn and
participate in agricultural competitions. The boys’ and girls’ clubs were the forerunner of
the Future Farmers of America, now the National FFA Organization (Barrett, 1983;
Hillison & Bryant, 2001).

4
Since its inception in 1928, the National FFA Organization has provided an avenue
for young people to exercise and develop their leadership skills. The 33 young men that
gathered in Kansas City to form the National FFA Organization specifically stated the
goal of the organization: to “provide leadership training for high school students of
vocational agriculture” (National FFA Organization, 2002, p. 5). Today the National
FFA Organization continues this tradition of developing leadership skills in its 461,000
members. The mission statement links the original goal of the organization to the present
by stating, “FFA makes a positive difference in the lives of students by developing their
potential for premier leadership, personal growth and career success through agricultural
education” (National FFA Organization, 2002, p.5).
The link between the high school agricultural science program and the co-curricular
National FFA Organization is unique. The agricultural science classroom provides a
venue where the high school agricultural science instructor has the opportunity to teach
leadership skills and students can learn leadership knowledge and actively engage in
leadership activities. The FFA reinforces these leadership skills by providing
opportunities for young people to participate in nonformal laboratory settings such as
competitive leadership activities and opportunities (officers, committee chairs, etc.) for
youth to lead at the local level and beyond. Although leadership education has been
espoused by agricultural education and the FFA since its inception, no studies have been
conducted to determine the extent to which leadership is taught through formal
agricultural education curricula.
To strengthen leadership instruction in agricultural science classrooms the National
FFA Organization, with the assistance of high school agricultural science instructors,

5
college faculty, state department of education staff, agriculture industry partners, the
USDA, and others recently completed the LifeKnowledge curriculum. The instructional
materials associated with the new curriculum consists of over 267 50-minute lessons that
were distributed nationally and utilized in agricultural science classrooms beginning in
spring and summer 2004. The curriculum materials may be used as a stand-alone
curriculum or the lessons may be incorporated into existing classes. The goal of the
curriculum is to
Provide quality instructional materials so teachers can infuse premier leadership, personal growth and career success into every facet of agricultural education and provide teachers with additional practical learning strategies and corresponding instructional materials to empower young people to live the FFA mission every day. (National FFA Organization, 2003)
High school agricultural science instructors have a great deal of influence over
what curriculum they teach in the classroom (Rogers, 1999). By controlling the quantity
and quality of curriculum taught in the classroom they are a key element in education
(Kimpston & Anderson, 1982). Because the high school agricultural science instructor
has such an important role, the following questions arise: To what extent is leadership
being taught in agricultural science classrooms? What factors influence high school
agricultural science instructors to teach leadership? Will the introduction of the new
LifeKnowledge curriculum increase the frequency and quality of leadership instruction in
high school agricultural education programs? To help determine the impact of this
curriculum, baseline data must be gathered to determine current levels of leadership
instruction in agricultural science classrooms.
Problem Statement
The extent to which leadership is being taught in agricultural science classrooms is
unknown and the attributes of high school agricultural science instructors that influence

6
their decision to formally teach leadership are unclear. Research has been conducted to
determine predictors of agricultural science program quality (Vaughn & Moore, 2000)
and how leadership skills affect youth (Carter & Spotanski, 1989; Dormody, 1994a;
Ricketts & Newcomb, 1984; Rutherford, Townsend, Briers, Cummins, & Conrad, 2002;
Scanlon & Burket, 1986; Townsend & Carter, 1983) and community (Brannon, Holley &
Key, 1989) but no research has been conducted to determine the extent to which
leadership is being taught in the formal agricultural science classroom or why high school
agricultural science instructors choose to teach leadership.
The following research questions are addressed in this study: To what extent are
high school agricultural science instructors teaching leadership in the formal classroom?
What are the factors that influence high school agricultural science instructors to teach, or
not teach, leadership?
Significance
The outcomes of this study have the potential to impact both high school
agricultural science instructors and students. By determining the factors that influence
high school agricultural science instructors to teach leadership, pre-service programs
could be tailored to motivate future high school agricultural science instructors to teach
leadership. In-service workshops could be planned to specifically motivate the behavior
of high school agricultural science instructors in such a way that they may increase the
level of leadership instruction in agricultural classrooms. Students could benefit by
receiving high quantity leadership instruction in high school agricultural education
programs that has the potential to broaden their leadership skills, increase their personal
growth and enhance their career success throughout their lives.

7
In addition, writers of current leadership curriculum, such as that developed by the
National FFA Organization, could revise and tailor their materials to enhance their
impact on high school agricultural science instructors. In-service opportunities could be
designed to target the factors that motivate high school agricultural science instructors to
teach leadership, possibly leading to the full integration of the leadership curriculum.
Other organizations may benefit from this research as well because the information found
here may enable them to motivate their instructors to be better prepared to teach
leadership principles.
Furthermore, gathering baseline data on the leadership teaching behavior of
agricultural science instructors will allow future studies to measure change in leadership
teaching behavior and gauge the impact of the LifeKnowledge curriculum.
Previous studies have determined predictors of successful agricultural science
programs, determined the benefits of teaching leadership to youth, justified the teaching
of leadership in agriscience classrooms, and determined the qualities of an effective high
school agricultural science instructor, but few have specifically looked at what influences
high school agricultural science instructors to teach a specific subject. The breadth of
influence of this study has the potential to be significant by eliciting behavior change in
high school agricultural science instructors to formally teach leadership to youth.
Purpose
The purpose of the study was to determine the extent to which high school
agricultural science instructors are currently teaching leadership in formal agricultural
science classrooms and to explain what influences high school agricultural science
instructors to teach leadership in the classroom. The specific objectives were to

8
• Determine the demographic characteristics of high school agricultural science instructors;
• determine the extent to which leadership is being taught in high school agricultural science classrooms;
• determine high school agricultural science instructor leadership knowledge based on National FFA LifeKnowledge leadership curriculum;
• determine high school agricultural science instructor attitude towards teaching leadership;
• determine the expectations that high school agricultural science instructors have of the agriculture students after leadership has been taught; and
• explain the relationships between high school agricultural science instructor leadership knowledge, attitude towards teaching leadership, expectations of students, and high school agricultural science instructor demographics in light of high school agricultural science leadership content area teaching behavior.
Assumptions
Two assumptions were made in this study: first, that the local agricultural science
program has sufficient support (logistical, financial, etc., from district, community,
principal and others) to teach leadership; second, that the high school agricultural science
instructors will respond honestly to the questionnaire.
Limitations
The results of this study can only be extended to the population studied, which is
high school agricultural science instructors in the United States during the 2003-2004
school year. Individuals chosen to be part of the research sample cannot be forced to
participate in the study; therefore only high school agricultural science instructors that
want to participate will provide survey information.
The instrument has limited reliability in that it has not previously been used with a
national population.

9
Definitions
For the purposes of this study, the following terms were defined operationally:
• Agricultural education: describes the profession of teaching students about all areas of agriculture from production to consumption. Many times it is used in this study to denote any agricultural situation, occurrence, or topic where a student may learn something as an outcome, whether an agricultural educator is present or not (Ricketts, 2003).
• Civic organizations: organizations established to serve the community (e.g., Lions Club and Kiwanis).
• FFA Organization: formerly the Future Farmers of America, it is a youth organization of individuals enrolled in agricultural education courses. It is intended to supplement the agricultural education process with opportunities for students to develop their leadership, personal growth, and success in their future careers (Ricketts, 2003).
• High school agricultural science instructor leadership knowledge: knowledge of elements and principles of leadership based on the LifeKnowledge (National FFA Organization, 2003) curriculum.
• High school agricultural science instructor leadership teaching behavior: the extent to which leadership instruction is conducted by the high school agricultural science instructor.
• Professional development organizations: professional organizations open to people desiring to develop their professional and business skills (e.g., Toastmasters).
• Professional education organizations: professional organizations such as state education association, Association for Career and Technical Education (ACTE), and National Association of Agricultural Educators (NAAE) for educators.
• Student leadership organizations, other than FFA: youth organizations such as 4-H, Vocational Industrial Clubs of America (VICA), Distributive Education Clubs of America (DECA), student council, and National Honor Society.
• Student organizations at the college level: honor and social organizations such as Collegiate FFA, Alpha Tau Alpha, fraternities, sororities, and student government.
Chapter Summary
The primary purpose of this study was to describe the extent to which high school
agricultural science instructors are currently teaching leadership and to identify factors

10
that influence the level of high school agricultural science instructors teaching of
leadership in the classroom. This chapter provided a brief history of the role of
leadership in agriculture, agricultural education and the National FFA Organization. FFA
has been a proponent of teaching leadership to agriculture students since its inception.
Because of this, the FFA has recently developed the LifeKnowledge curriculum to teach
leadership principles to students enrolled in secondary agricultural education courses.
Few previous studies have addressed factors influencing high school agricultural
science instructors’ teaching of a specific subject. This research investigated factors that
influence agricultural science instructors to teach leadership. The results of this study
may influence future pre-service and in-service activities, and will provide baseline data
for future research in this area.
The specific factors studied were high school agricultural science instructor
leadership knowledge, high school agricultural science instructor leadership attitude
toward teaching leadership, high school agricultural science instructor leadership
expectations of students and high school agricultural science instructor demographics.
These four factors were used to explain the high school agricultural science instructor
behavior of teaching leadership.

CHAPTER 2 REVIEW OF THE LITERATURE
Chapter 1 introduced this study, discussed the importance of teaching leadership to
youth, and described why teaching leadership is an integral part of high school
agricultural education. Also discussed were the National FFA Organization’s role in
youth leadership education and their participation in the development of the
LifeKnowledge curriculum. In addition, an outline of the research problem was
presented and the significance of this study was explained.
The purpose of this study was to determine the extent to which high school
agricultural science instructors are currently teaching leadership in formal agricultural
science classrooms and to explain what influences high school agricultural science
instructors to teach leadership in the classroom. To accomplish this, a modified version
of the Triandis (1971) behavioral model which incorporates knowledge, attitude and
expectations to explain behavioral outcomes was used. Specifically this study sought to
• Determine the demographic characteristics of high school agricultural science instructors;
• determine the extent to which leadership is being taught in high school agricultural science classrooms;
• determine high school agricultural science instructor leadership knowledge based on National FFA LifeKnowledge leadership curriculum;
• determine high school agricultural science instructor attitude towards teaching leadership;
• determine the expectations that high school agricultural science instructors have of the agriculture students after leadership has been taught; and
11

12
• explain the relationship between high school agricultural science instructor leadership knowledge, high school agricultural science instructor attitude towards teaching leadership, high school agricultural science instructor expectations of students, and high school agricultural science instructor demographics in light of high school agricultural science instructor leadership content area teaching behavior.
This chapter presents the conceptual and theoretical framework of the research.
Specifically, this chapter describes previous research conducted about the importance to
teaching leadership, youth leadership development, leadership curriculum, the theoretical
behavior model, and the explanatory variables of behavior. Included are refereed articles,
non-refereed publications, research conference proceedings, dissertations, theses,
textbooks, articles from the ERIC Document Reproduction Service, and government
publications.
Defining Leadership
Leadership is a term with many definitions. The Merriam-Webster Dictionary
(2003) defines leadership as “the office or position of a leader; the capacity to lead; the
act or an instance of leading.” Burns (1979) in his book Leadership defines it as “leaders
inducing followers to act for certain goals that represent the values and the motivations---
the wants and needs, the aspirations and expectations--of both leaders and followers
[italics in original text]” (p. 19). Gardner (1990) tells us that leadership is “the process of
persuasion or example by which an individual (or leadership team) induces a group to
pursue objectives held by the leader or shared by the leader and his or her followers” (p.
1). Bass (1990) defines leadership as “an interaction between two or more members of a
group that often involves a structuring or restructuring of the situation and the
perceptions of the members” (p. 19). The definition of leadership formed by Kouzes and

13
Posner (1997) is “The art of mobilizing others to want to struggle for shared aspirations”
(p. 30).
Hersey, Blanchard and Johnson (2001) refer to leadership as influencing others,
“whenever one person attempts to influence the behavior of an individual or group,
regardless of the reason” (p. 9). Similarly Northouse (2001) defines leadership as “a
process whereby an individual influences a group of individuals to achieve a common
goal” (p. 3). Maxwell (1993) simply defines leadership as “influence” (p. 1).
Ricketts and Rudd’s (2002) Model for Youth Leadership Curriculum states that
leadership consists of these components: knowledge and information; attitude, will and
desire; decision making, reasoning and critical thinking; intrapersonal and interpersonal
skills; and oral and written communication skills. When defining leadership for youth
van Linden and Fertman (1998) define leadership as “a physical sensation: a need to
share ideas, energy, and creativity, and not let personal insecurities be an obstacle” (p.
17). For the purpose of this study, the definition offered by Northouse (2001) will be
used.
The Importance of Teaching Leadership
People are needed to fill leadership roles at all levels of society, from the soccer
coach to the president of the homeowners association to leading problem-solving groups
in the workforce, we need leaders (Gardner, 1990). Yet education has focused on
equipping people with technical job skills while overlooking leadership skills critical to
career success (Benson, 1983). “Aging baby boomers with key management positions”
(Figura, 1999, p. 20) will be retiring in the coming years, taking with them a vast amount
of experience and leadership skills. Due to lower birth rates in the 1960’s and 1970’s, a

14
smaller pool of young talent will be available fill these leadership positions, causing a
leadership void.
From an industry perspective, the business environment is becoming increasingly
global, requiring leadership skills that can guide companies to success (Karnes &
Stephens, 1999; Wah, 1999; Stewart, 1998). These leaders, whether they are employees,
supervisors, managers, administrators, or CEOs, will need leadership skills such as
honesty, integrity, teamwork, communication skills, and interpersonal skills to be
successful (McKinley, Birkenholz, & Stewart, 1993; Morrison, 2000; Spotauski &
Carter, 1993; University of North Carolina, 2003).
The need for skilled leaders will continue in the years to come. To help fill this
leadership void, high schools should prepare to train leaders (Barrett, 1983). Students
who have been taught leadership are better prepared to act in a leadership capacity
because they better understand the phenomena of leadership as a personal and attainable
undertaking (Ricketts & Rudd, 2002).
Early studies of leadership focused on innate leadership traits, but as the study of
leadership has evolved over the years, we know that leadership knowledge and skill can
be taught and learned (Bass, 1990; Gardner, 1990; McCall, 1998; Northouse, 2001).
Furthermore, studies reveal that leadership can and should be taught to youth (Jones,
1938; Schmidt, 2001; van Linden & Fertman, 1998; Zeldin & Camino, 1999).
Youth Leadership Development
The value of developing leadership knowledge and skills in youth in order to
prepare them for their future roles as citizens has been known for a number of years (Boy
Scouts of America, 2003; Boys and Girls Clubs, 2003; van Linden & Fertman, 1998).

15
This section will discuss some of the youth organizations that seek to instill leadership in
youth.
Existing Youth Programs
Many programs are available in which youth can gain leadership skills. Boy
Scouts have a history of producing leaders by training “young people in citizenship,
service, and leadership” (Boy Scouts of America, 2003). Boys and Girls Clubs strive to
develop youth into productive citizens through developing leadership skills (Boys and
Girls Clubs, 2003). Van Linden and Fertman (1998) discuss a number of youth
organizations and opportunities for leadership development including YMCA, Red Cross,
and leadership camps.
The 4-H organization has a long history of youth development in an agricultural
context. Mueller (1989) investigated the belief that 4-H youth leadership involvement
improves self-esteem. Of the 868 members in the sample, 402 responded, revealing that
4-H youth's level of participation in leadership activities was significantly related to
leadership skill gain, relationship with 4-H leaders, and frequency of involvement in
planning, implementing, and evaluating activities. Mueller’s results indicated that
leadership activities can help prepare youth for participation in leadership roles, and that
working with adults was an important factor of leadership development.
Seevers and Dormody (1994) surveyed 4-H members to describe the involvement
of senior 4-H members in planning, implementing and evaluating 4-H youth leadership
activities. A 59% response rate with 234 respondents revealed that participation in 4-H
leadership life skills activities was greatest at the club level. Activities identified and
ranked as contributing highly toward leadership life skills development were holding
office, teaching younger members, fairs, livestock shows, judging contests,

16
demonstrations, public speaking, and community service. 4-H members indicated their
greatest involvement in leadership development activities was through implementing
activities, followed by evaluating activities. This finding is important in that it illustrates
youth benefit most when they have the opportunity to become involved with the
planning, implementation, and the evaluation of activities. Although this study illustrates
how youth can develop leadership skills through participation in organized life skills
activities, it is based on self-perceived leadership skills and doesn’t objectively analyze
what leadership skills the members possess.
High School Youth Programs
The high school environment has many leadership opportunities for students.
Wallin (2003), in her case study of 40 students, found that students accept leadership
roles in student council, athletics, and co-curricular activities. She also found that
upperclassmen set the tone for leadership participation. Her results included suggestions
for student involvement with administrative decisions and setting high standards for
students to achieve. In addition, Chmielewski (2000) reinforced that it is important for
teachers and administrators to take a proactive role with student organizations, including
seminar and workshop attendance for leadership skill development. These studies
reinforce the importance of adult involvement in youth organizations for leadership skills
to develop.
Organizations such as Students Active in Leadership (SAIL) provide students
leadership opportunities that allow students to organize activities that benefit the
community (Brutcher, 2003). This provides opportunities for students to develop
leadership skills through activities such as securing funding for local projects through

17
grants and donations. Additional leadership skills are developed through interaction with
local officials and volunteers.
Some schools have implemented student leadership camps and retreats to assist
students in developing leadership skills. At these camps students are provided training in
being a role model, dealing with peer pressure, making good choices, and the qualities of
a leader (Wolff, 2002).
The value of students learning about or experiencing leadership is important.
Carter and Spotanski (1989) surveyed a convenience sample of 3437 Iowa high school
students, located in three schools, over a three-year period and found that students who
have served as a committee chair, officer, or have received formal leadership training,
consistently rated each of the 10 measurement scales used significantly higher than
students without these leadership experiences. Although the instrument assessed self-
perceived skills, it is worth noting that students with leadership experience had greater
self-perception, and possibly greater self-confidence, than did the students without
leadership experience. A recommendation of this research was to develop curriculum
materials for leadership education in high school.
Career and Technical Education Youth Programs
High school career and technical education programs are in a prime position to
teach leadership skills to youth. Federal and state guidelines require these programs to
teach students leadership skills along with technical job skills. These leadership skills
help to provide students with the human resource skills required in the current work place
(Leventhal, 1999; Ricketts & Rudd, 2002).
To quantify the leadership benefits to students in career and technical programs, a
study was conducted of 427 distributive education students who were active in the high
18
school career and technical student organization DECA, as compared to distributive
education students who had little or no activity in DECA. Results showed that students
who are involved in career and technical club leadership activities tend to develop or
acquire more leadership characteristics than students who are not involved in these
activities (Clark, 1977). This study illustrates that leadership activity involvement can
lead to youth leadership skill development.
To determine and compare perceptions of advisors and chapter presidents of career
and technical student organizations, a study was conducted using a random sample of 200
Ohio youth organization chapters including DECA, National FFA Organization, Future
Homemakers of America, and Vocational Industrial Clubs of America. It was
determined that leadership skills were being developed in the chapter presidents of these
organizations (White, 1982). Although developing leadership skills in club presidents is
beneficial, ideally all members of a youth organization would have the opportunity to
develop leadership skills.
Impact of Agricultural Science and FFA Programs on Youth Leadership
Agricultural science programs encourage students to develop leadership skills
through a wide variety of opportunities such as classroom instruction, supervised
agricultural experience and FFA activities (Esters, 2002). This is a strength of these
programs, in that they provide leadership training in the classroom and reinforce that
training through FFA activities.
The local chapters of the National FFA Organization shoulder the primary
responsibility for providing leadership training and realistic leadership experiences for
students involved in agricultural education (Brannon, Holley & Key, 1989; National FFA
Organization, 2002). Leadership development has been a goal of FFA from the inception

19
of the organization in 1928 (Connors, 1999; National Research Council, 1988). Through
participation in FFA events, students have been able to obtain valuable leadership
experiences in both formal and non-formal activities (Esters, 2002).
A study by Townsend and Carter (1983) described the relationship between
participation in FFA activities and development of leadership competencies. The
population consisted of Iowa senior agriculture students from 54 randomly selected high
schools, which generated 426 responses yielding a 67% response rate. Findings of the
study show that self-perceived leadership competencies had a significant correlation with
FFA participation. The results suggest the leadership trait is enhanced with FFA activity.
In addition, students who attended state and national FFA conferences had a higher
perception of their leadership abilities than did non-participants. These findings were
similar to the findings of Seevers and Dormody (1994) and Clark (1977), providing some
evidence of the benefits of youth involvement in organized leadership activities. A
limiting factor with these three studies is they measure self-perceived leadership traits.
Using an objective measure may have increased the validity of these studies.
Ricketts and Newcomb (1984) surveyed 258 high school students, from 16
randomly selected high schools, to describe leadership and personal development abilities
possessed by high school seniors. The study revealed that agriculture students and FFA
members from both superior and non-superior chapters possess significantly more
leadership and personal development abilities than did students not enrolled in
agriculture. They also found that students who are more active tend to develop higher
levels of leadership and personal development ability, and that vocational agriculture
students and FFA members from superior FFA chapters are more active in FFA activities

20
than vocational agriculture students and FFA members from non-superior chapters. It
was also determined that the level of chapter member activity has a higher relationship to
leadership and personal development abilities possessed by FFA members than member
involvement at district or regional, state and national levels. Therefore, the more active a
student is in the local chapter, the greater their self-perceived leadership and personal
development abilities. Once again, the positive relationship between self-perceived
leadership ability and FFA involvement is revealed, illustrating that students enrolled in
agriculture classes have a higher perceived level of leadership ability than their peers not
enrolled in agriculture classes.
Stewart, Smith, Ehlert, and Mihalevich (1985) came to similar conclusions when
they surveyed 483 advisors and FFA members from 44 FFA chapters. They found that
local FFA chapter officers realized greater achievement from FFA membership than did
regular members. This reinforces the previous findings that the more involved a student
is in the organization, the greater their rewards. In addition, these results indicate that
students holding an office benefit more in terms of perceived level of achievement, than
those students that did not hold an office.
Dormody and Seevers (1994b) using a stratified random sample technique,
surveyed 400 FFA members from three states to determine predictors of youth leadership
life skills development. A 67% response rate was achieved. Achievement expectancy, or
a combination of the level of evaluation FFA members expect from others and the level
of performance they expect from themselves in FFA activities and projects, had a positive
relationship with youth leadership life skills development. Participation in FFA
leadership activities had a weak positive relationship with youth leadership life skills

21
development. In addition, judging contests, public speaking, chapter meetings, holding
office, and parliamentary procedure were often cited as activities that made the greatest
contribution to the students’ leadership life skills.
Using the Dormody and Seevers instrument, Wingenbach (1995) analyzed self-
perceived youth leadership and life skills of Iowa FFA members. Wingenbach used a
random sample survey and received 316 usable questionnaires. A 79% response rate was
achieved. The activities of chapter meetings, fundraising events, chapter banquets, SAE
projects, and being an FFA committee member were found to have a significant
relationship with the youth leadership and life skill development score. Also found were
low positive correlations between youth leadership and life skills development scores and
FFA leadership activities, and years of membership in the FFA. The major finding of
this study was that participation in FFA leadership activities, in combination with the
variables of after school jobs, years in FFA, self-reported cumulative grades, and gender,
accounted for 22% of the variance in youth leadership and life skills development scores,
with FFA activity being the most significant predictor of youth leadership and life skills
development. This reinforces early studies in which FFA activity lead to self-perceived
leadership skills.
A survey of FFA chapter officers found that participation in FFA activities had a
positive influence on the students’ perceived leadership skills. Rutherford, Townsend,
Briers, Cummins, and Conrad (2002) surveyed student FFA members attending the
National FFA Organization’s Washington Leadership Conference (WLC). Of the 2086
student conference attendees, 279 self-selected attendees completed the instrument. No
steps were taken to control for non-response error, and as such, the results were only
22
applied to the participants of the study. The purpose of the study was to determine
relationships between WLC participants' self-perception of their leadership skills and
their chapter size, length of membership, level of involvement, and involvement in an
officer position. This instrument was based on the instrument used by Townsend (1983).
Findings revealed that a significant positive relationship was found between self-
perceived leadership skills and FFA level of involvement. Results concerning level of
FFA involvement found that self-perceived leadership traits of youth are enhanced by
participation in FFA activities and supported research of several authors (Carter &
Spotanski, 1989; Townsend & Carter, 1983). The positive, though not strong, correlation
between level of FFA involvement and the instrument leadership scales reinforces the
positive relationship between FFA activity and perceived leadership skills.
Section Summary
From Scouting to 4-H, youth organizations have been developing leadership skills
in youth for many years. An abundance of research exists showing that these
organizations develop self-perceived leadership skills in young people. For many youth,
involvement in these organizations begins in high school through participation in
extracurricular and intracurricular organizations. Career and technical organizations are
particularly suited to develop leadership skills in youth, as Federal and State guidelines
mandate that leadership training be incorporated into the curriculum.
The National FFA Organization stands out from these organizations by providing a
wide range of opportunities for students to develop leadership skills and through
classroom leadership instruction. It has been well documented that students’
participation in FFA activities leads to increased student self-perceived leadership skill
development.
23
The importance of student involvement in youth leadership organizations cannot be
stressed enough. Involvement in these organizations allows youth the opportunity to
develop leadership skills that will benefit them throughout their lives. Franklin Roosevelt
stated, “We cannot always build the future for our youth, but we can build our youth for
the future” (Riordon, 2000, p. 202). Agricultural science classrooms are an excellent
place to begin building youth for the future through the teaching of leadership.
A Leadership Curriculum for Youth
The preceding research illustrates the benefits of youth being exposed to leadership
opportunities through extra-curricular and co-curricular activities. Unfortunately, not all
students participate in these activities. What is needed is a curriculum that can be taught
in the classroom so that all students can have the opportunity to learn leadership
knowledge and skills (Carter & Spotanski, 1989; Ricketts & Rudd, 2001). Although high
school agricultural science instructors have the skills to develop their own curriculum
materials, they prefer to use pre-existing materials (Wingenbach, Gartin, & Lawarence,
2000) and the use of a quality curriculum provides a strong foundation for quality
teaching to occur (Swan, 1996).
Boccia (1997) points out “there is a meager base of programmatic guidelines for
successful student leadership in schools” (p. 76). Leadership textbooks are available
(Delmar Learning, 2003; Prentice Hall, 2003) and leadership curriculum has been
developed for some states (Commonwealth of Virginia Board of Education, 2001;
Instructional Materials Service, 2003; North Carolina State University, 2003; Virginia
Division of Policy and Public Affairs, 2001) to address local needs, but no national
curriculum is currently available.

24
The Model of Youth Leadership Development
To develop a framework for a comprehensive youth leadership curriculum, Ricketts
and Rudd (2002) conducted a meta-analysis of youth leadership development literature.
Based on this research, the Model of Youth Leadership Development was developed (see
figure 2.1). This model consists of five dimensions:
• Leadership knowledge and information--Base knowledge needed about leaders and leadership before application of leadership concepts.
• Leadership attitude, will and desire--Focuses on disposition, motivation, self-realization, and health to prepare students for leadership.
• Decision making, reasoning, and critical thinking--Using critical thinking skills to address problems and make decisions with incomplete information.
• Oral and written communication skills--Skills necessary to effectively sharing information and convey ideas, attitudes, opinions and feelings.
• Intrapersonal and interpersonal relations--Includes conflict resolution, stress management, teamwork and ethics viewed through the framework of diversity, learning styles and personality types (Ricketts, 2003).
Each dimension represents one construct for which a curricular unit was
developed. Each curricular unit is designed so it can be taught at three different levels of
cognition: awareness, integration and mastery. By addressing each stage in each
dimension, a complete and cohesive nature of a leadership curriculum is possible
(Ricketts & Rudd, 2001).

25
Figure 2-1. Model of Youth Leadership Development. From Ricketts, J. C., & Rudd, R. D. (2002). A comprehensive leadership education model to train, teach, and develop leadership in youth. Journal of Career and Technical Education, 19 (1), 7-17.
LifeKnowledge Curriculum Origin and Development
The LifeKnowledge curriculum grew out of the mission statement of the National
FFA Organization: To make a positive difference in lives of students by developing their
potential for premier leadership, personal growth and career success through agricultural
education. To better serve organization members, FFA leadership began to take the steps
necessary to develop a curriculum that would address the elements of the mission
statement (Derner, 2004). The FFA mission and The Model of Youth Leadership

26
Development framework (Ricketts & Rudd, 2002) were used as a guide to conceptualize
and construct the LifeKnowledge leadership curriculum.
The first step taken by the National FFA Organization brought together educators,
business leaders, government leaders, agricultural education leaders, and FFA leaders to
define measurable outcomes needed to master the constructs related to leadership,
personal growth and career success. Once the outcomes were defined, money was
secured to fund the development of a curriculum to address these constructs (Derner,
2004).
Agriculture instructors, graduate students and university faculty were brought
together to develop lessons for the curriculum. Once these lessons were written, they
were sent to agriculture instructors for “trial” use and evaluation. Based on comments
received from the evaluating instructors, corrections were made to the lessons. The
lessons were then combined into a curriculum that was made available to agriculture
instructors nationwide in 2004 (Derner, 2004).
The purpose of this curriculum is to provide quality instructional materials so
teachers can infuse premier leadership, personal growth, and career success into every
facet of agricultural education and to provide teachers with additional practical learning
strategies and corresponding instructional materials to empower young people to live the
FFA mission every day. While the LifeKnowledge curriculum addresses the three areas
of the FFA mission statement, this study addresses only the leadership component of this
curriculum.
Six leadership constructs are included in the curriculum: action, vision, character,
relationships, awareness, and continuous improvement. The LifeKnowledge curriculum
27
defines action as “demonstration of the skills and competencies needed to achieve the
desired results” (National FFA Organization, 2003, p. 10). Action “embraces
empowerment, risk, communication, focusing on results, decision-making, problem
solution, investment in individuals, and resource use and access” (National FFA
Organization, 2003, p. 10).
Vision is defined by the LifeKnowledge curriculum as “setting a clear image of
what the future should be.” Vision “embraces enthusiasm, creativity, the future,
conviction, mission, courage, concept, focus, principles, and change” (National FFA
Organization, 2003, p. 10).
The LifeKnowledge curriculum defines character as “a collection of virtues by
which we live our lives.” Character “embraces integrity, courage, values, attitude, ethics,
humility, perseverance, self-discipline and responsibility” (National FFA Organization,
2003, p. 10).
Relationships are defined by the LifeKnowledge curriculum as “building a
constituency.” Relationships “embrace compassion, service, listening, coaching,
developing others, team development, and understanding and appreciating others”
(National FFA Organization, 2003, p. 10).
Awareness is defined as “a quest for purposeful understanding.” Awareness
includes “self, community, diversity, environment, global and knowledge” (National FFA
Organization, 2003, p. 10).
The LifeKnowledge curriculum defines continuous improvement as “the pursuit of
learning and growth.” Continuous improvement “embraces innovation, intuition,

28
adaptation, life-long learning, and coachability” (National FFA Organization, 2003, p.
10).
Curriculum Adoption
Having a new curriculum with which to teach high school students leadership
knowledge and skills has the potential to be advantageous to students’ learning, but prior
to students benefiting from the curriculum the instructors must first adopt it. Studies
have found a common set of characteristics that lead to curriculum adoption (Bland,
Starnaman, Wersal, Moorhead-Rosenburg, Zonia, & Henry, 2000). Bland et al. identified
five categories for successful curriculum change: politics, participation by organization
members, human resource development, evaluations and leadership.
Politics revolve around the allocation of scarce resources (Bolman & Deal, 1997).
These resources include internal networking and resource allocation. Internal networking
consists of formal and informal channels through which people are influenced by opinion
leaders (Bland et al., 2000; Rogers, 2003). Successful change requires advocates within
this network. Resource allocation requires having the necessary funds to implement the
change. These funds may be required for purchasing curriculum, or may be necessary for
faculty training of the curriculum. Fortunately, the National FFA Organization has
sufficient financial support to provide the LifeKnowledge curriculum and training to
agricultural science instructors throughout the country.
Possibly the most influential political element in curriculum adoption today is the
popularity of standardized testing and accountability within the school system (Frontline,
2002). Students in many states are required to pass a standardized test prior to moving on
to the next grade level. Using the student scores from these tests, schools can be rated
and held accountable for students’ passing and failing these tests (Doherty, 2004).

29
Because of the impact these tests have upon the students’ success as well as the school’s
accountability, a tremendous amount of effort goes into preparing students to pass these
tests (FairTest.org, 2004). This may have an impact on the subjects offered in the
schools. Subjects that do not have a direct positive impact on student standardized test
scores may be at risk of being eliminated from the school course offerings. Standardized
tests usually assess the students’ knowledge of mathematics, reading and grammar
(Doherty, 2004). Typically, leadership is not a concept that students are held accountable
for with these tests, and therefore a leadership curriculum may not be adopted in a school
because it does not contribute to the success of students on standardized tests. This
would be an unfortunate situation, because the skills learned through leadership
instruction are skills that will benefit students regardless of the career in which they enter,
providing them with the leadership and communication skills desired by employers
(Boccia, 1997; Figura, 1999).
Participation by organization members is a key element to successful change
(Bland et al., 2000). Curriculum adoption efforts must have the support of instructors for
the adoption effort to be a success. One method to accomplish this is to include
instructors in the implementation of the adoption process (Butler, 1999; Lowery, 2000).
As stated by Connors (1999), “Teachers must see a need for change, believe it is justified,
and be able to recognize problems that can be addressed by adoption of the curriculum”
(p. 54). Including instructors in the adoption process increases their skill development
and the likelihood of curriculum implementation (Bland et al., 2000). Therefore,
instructors must be willing to participate in the curriculum change for success to occur.
High school agricultural science instructors have been involved with the LifeKnowledge
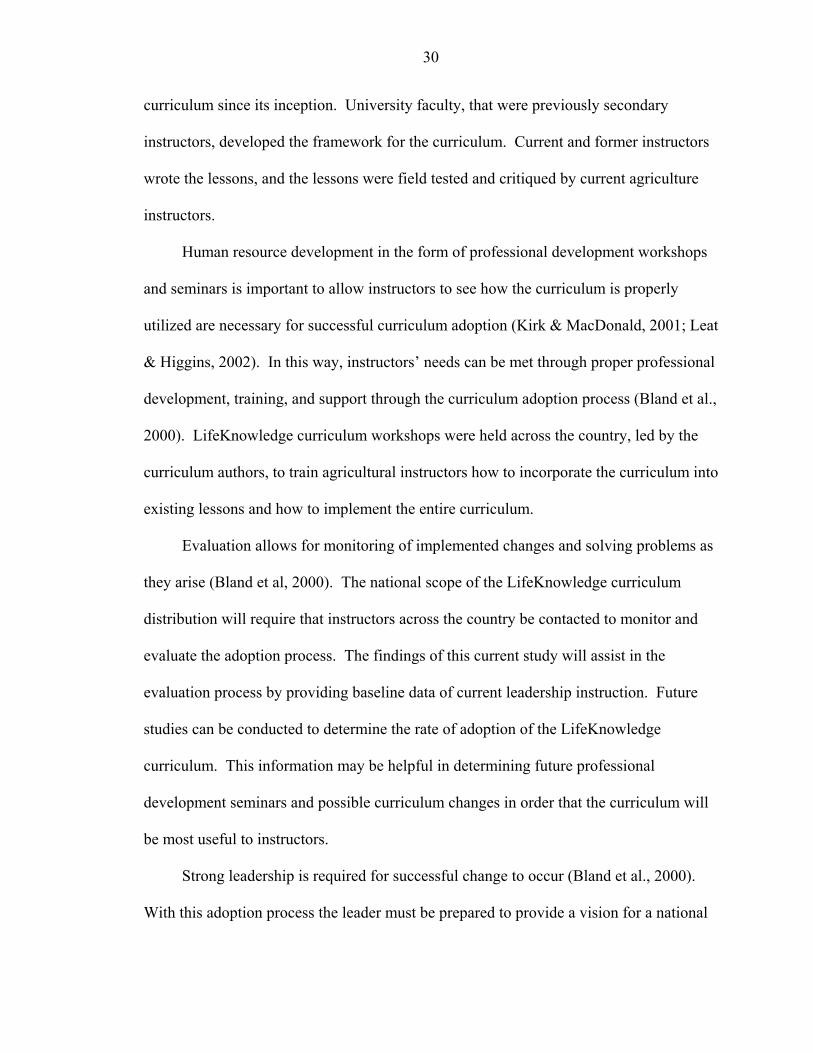
30
curriculum since its inception. University faculty, that were previously secondary
instructors, developed the framework for the curriculum. Current and former instructors
wrote the lessons, and the lessons were field tested and critiqued by current agriculture
instructors.
Human resource development in the form of professional development workshops
and seminars is important to allow instructors to see how the curriculum is properly
utilized are necessary for successful curriculum adoption (Kirk & MacDonald, 2001; Leat
& Higgins, 2002). In this way, instructors’ needs can be met through proper professional
development, training, and support through the curriculum adoption process (Bland et al.,
2000). LifeKnowledge curriculum workshops were held across the country, led by the
curriculum authors, to train agricultural instructors how to incorporate the curriculum into
existing lessons and how to implement the entire curriculum.
Evaluation allows for monitoring of implemented changes and solving problems as
they arise (Bland et al, 2000). The national scope of the LifeKnowledge curriculum
distribution will require that instructors across the country be contacted to monitor and
evaluate the adoption process. The findings of this current study will assist in the
evaluation process by providing baseline data of current leadership instruction. Future
studies can be conducted to determine the rate of adoption of the LifeKnowledge
curriculum. This information may be helpful in determining future professional
development seminars and possible curriculum changes in order that the curriculum will
be most useful to instructors.
Strong leadership is required for successful change to occur (Bland et al., 2000).
With this adoption process the leader must be prepared to provide a vision for a national
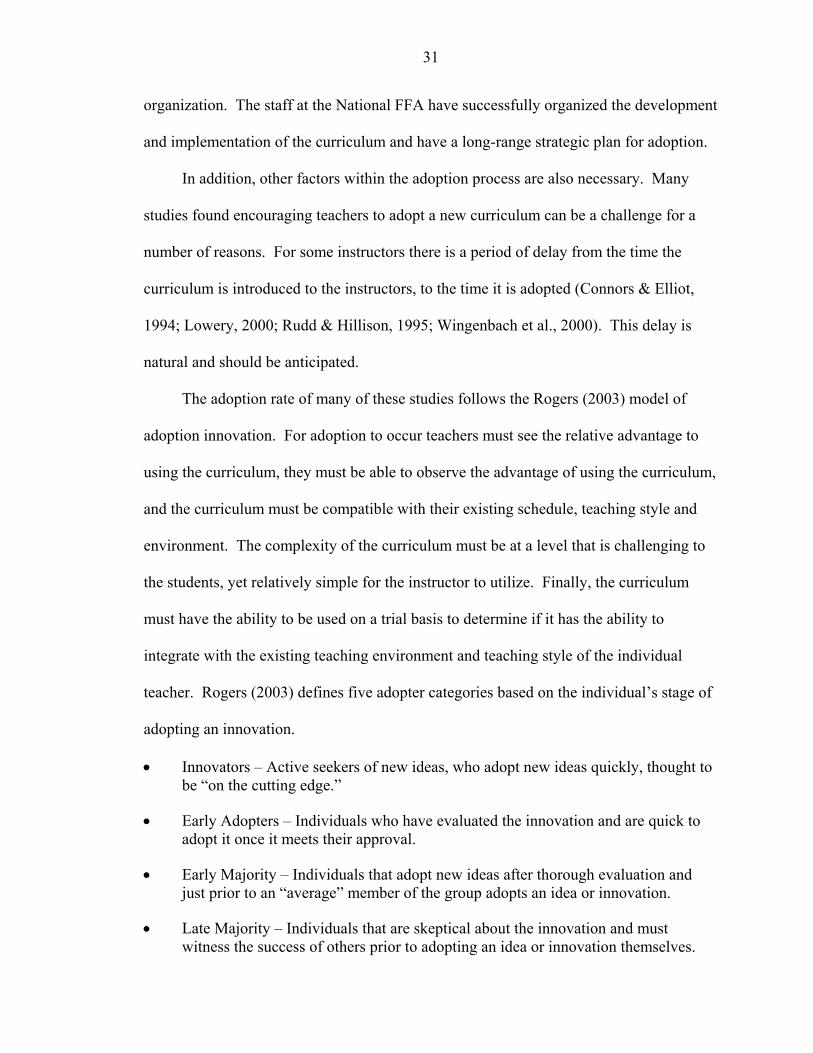
31
organization. The staff at the National FFA have successfully organized the development
and implementation of the curriculum and have a long-range strategic plan for adoption.
In addition, other factors within the adoption process are also necessary. Many
studies found encouraging teachers to adopt a new curriculum can be a challenge for a
number of reasons. For some instructors there is a period of delay from the time the
curriculum is introduced to the instructors, to the time it is adopted (Connors & Elliot,
1994; Lowery, 2000; Rudd & Hillison, 1995; Wingenbach et al., 2000). This delay is
natural and should be anticipated.
The adoption rate of many of these studies follows the Rogers (2003) model of
adoption innovation. For adoption to occur teachers must see the relative advantage to
using the curriculum, they must be able to observe the advantage of using the curriculum,
and the curriculum must be compatible with their existing schedule, teaching style and
environment. The complexity of the curriculum must be at a level that is challenging to
the students, yet relatively simple for the instructor to utilize. Finally, the curriculum
must have the ability to be used on a trial basis to determine if it has the ability to
integrate with the existing teaching environment and teaching style of the individual
teacher. Rogers (2003) defines five adopter categories based on the individual’s stage of
adopting an innovation.
• Innovators – Active seekers of new ideas, who adopt new ideas quickly, thought to be “on the cutting edge.”
• Early Adopters – Individuals who have evaluated the innovation and are quick to adopt it once it meets their approval.
• Early Majority – Individuals that adopt new ideas after thorough evaluation and just prior to an “average” member of the group adopts an idea or innovation.
• Late Majority – Individuals that are skeptical about the innovation and must witness the success of others prior to adopting an idea or innovation themselves.
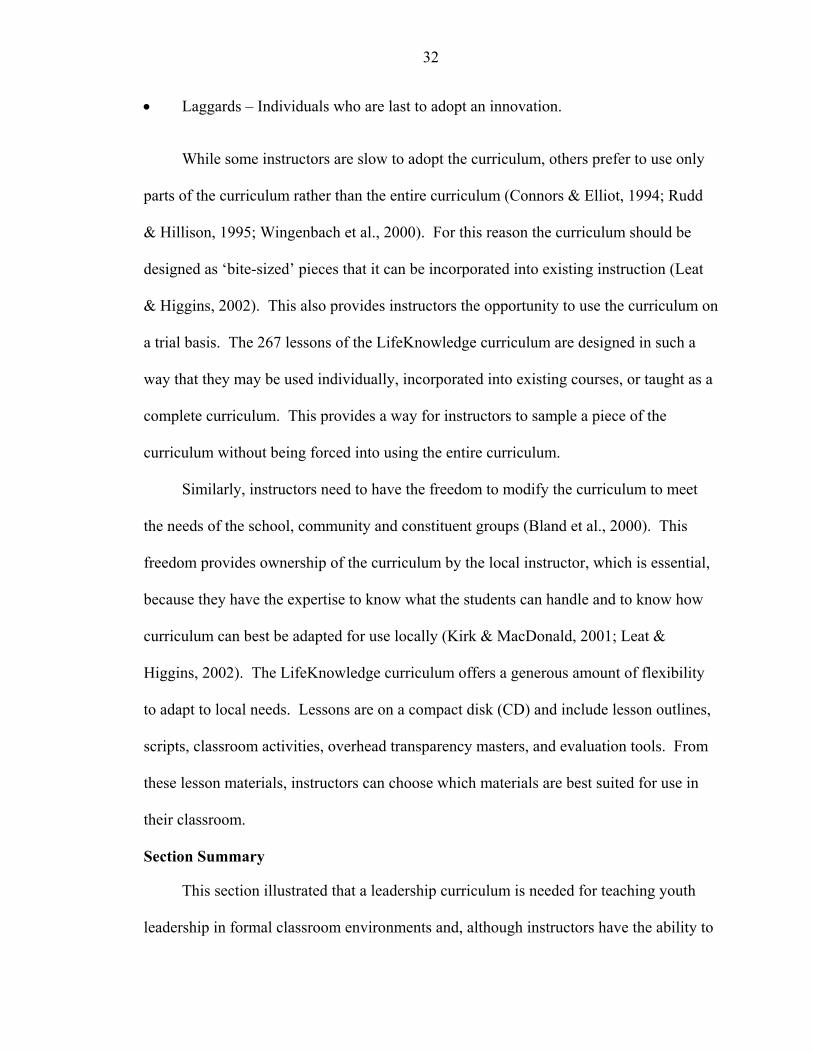
32
• Laggards – Individuals who are last to adopt an innovation.
While some instructors are slow to adopt the curriculum, others prefer to use only
parts of the curriculum rather than the entire curriculum (Connors & Elliot, 1994; Rudd
& Hillison, 1995; Wingenbach et al., 2000). For this reason the curriculum should be
designed as ‘bite-sized’ pieces that it can be incorporated into existing instruction (Leat
& Higgins, 2002). This also provides instructors the opportunity to use the curriculum on
a trial basis. The 267 lessons of the LifeKnowledge curriculum are designed in such a
way that they may be used individually, incorporated into existing courses, or taught as a
complete curriculum. This provides a way for instructors to sample a piece of the
curriculum without being forced into using the entire curriculum.
Similarly, instructors need to have the freedom to modify the curriculum to meet
the needs of the school, community and constituent groups (Bland et al., 2000). This
freedom provides ownership of the curriculum by the local instructor, which is essential,
because they have the expertise to know what the students can handle and to know how
curriculum can best be adapted for use locally (Kirk & MacDonald, 2001; Leat &
Higgins, 2002). The LifeKnowledge curriculum offers a generous amount of flexibility
to adapt to local needs. Lessons are on a compact disk (CD) and include lesson outlines,
scripts, classroom activities, overhead transparency masters, and evaluation tools. From
these lesson materials, instructors can choose which materials are best suited for use in
their classroom.
Section Summary
This section illustrated that a leadership curriculum is needed for teaching youth
leadership in formal classroom environments and, although instructors have the ability to
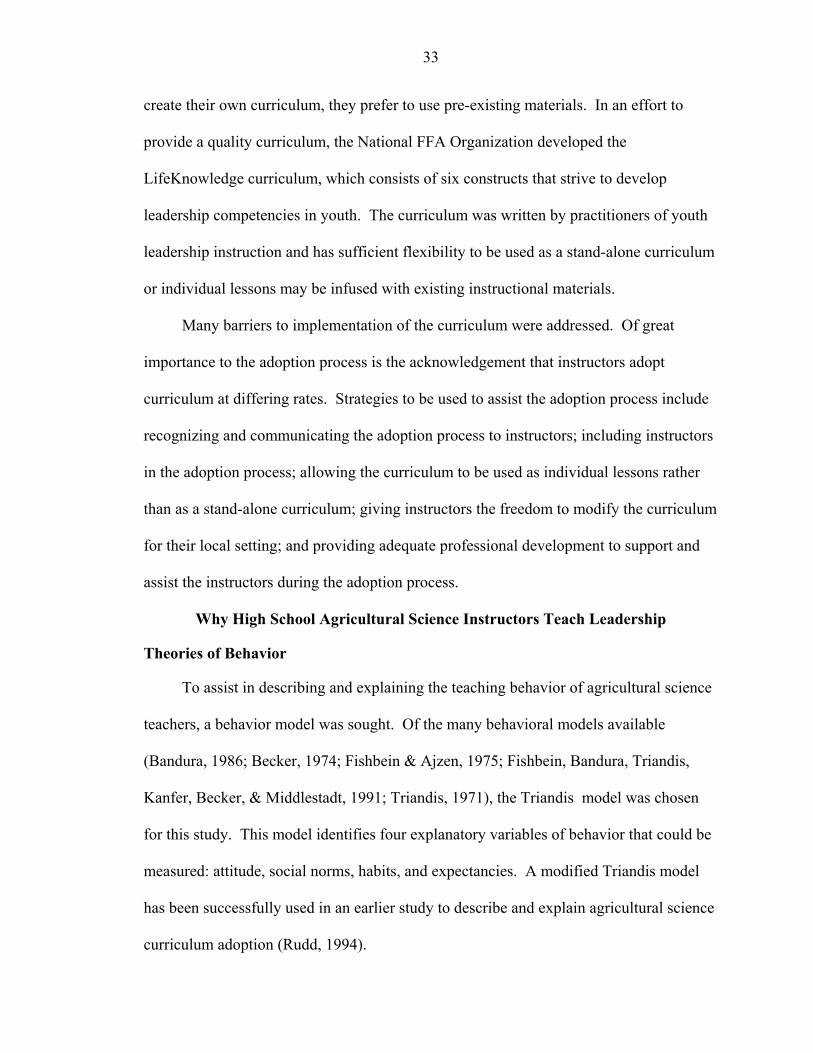
33
create their own curriculum, they prefer to use pre-existing materials. In an effort to
provide a quality curriculum, the National FFA Organization developed the
LifeKnowledge curriculum, which consists of six constructs that strive to develop
leadership competencies in youth. The curriculum was written by practitioners of youth
leadership instruction and has sufficient flexibility to be used as a stand-alone curriculum
or individual lessons may be infused with existing instructional materials.
Many barriers to implementation of the curriculum were addressed. Of great
importance to the adoption process is the acknowledgement that instructors adopt
curriculum at differing rates. Strategies to be used to assist the adoption process include
recognizing and communicating the adoption process to instructors; including instructors
in the adoption process; allowing the curriculum to be used as individual lessons rather
than as a stand-alone curriculum; giving instructors the freedom to modify the curriculum
for their local setting; and providing adequate professional development to support and
assist the instructors during the adoption process.
Why High School Agricultural Science Instructors Teach Leadership
Theories of Behavior
To assist in describing and explaining the teaching behavior of agricultural science
teachers, a behavior model was sought. Of the many behavioral models available
(Bandura, 1986; Becker, 1974; Fishbein & Ajzen, 1975; Fishbein, Bandura, Triandis,
Kanfer, Becker, & Middlestadt, 1991; Triandis, 1971), the Triandis model was chosen
for this study. This model identifies four explanatory variables of behavior that could be
measured: attitude, social norms, habits, and expectancies. A modified Triandis model
has been successfully used in an earlier study to describe and explain agricultural science
curriculum adoption (Rudd, 1994).

34
Modified Triandis Model of Behavior
This current study used a variation of the Triandis model that uses four variables to
explain behavior: attitude, social norms, habits, and expectations (Rudd & Hillison,
1995). For the purpose of this study, attitude is defined as “a mental position with regard
to a fact or state” (Merriam-Webster, 2003) towards leadership.
As defined by Triandis (1971) social norms are what people think they should do
(p.14), based upon experiences and beliefs. In the case of agriculture instructors, the
fundamental social norm is they are expected to teach. If this is extended to agriculture
instructors teaching leadership, we see that instructors are expected to teach leadership.
However, what is included within leadership? This may be defined by what agriculture
instructors have taught in the past.
Therefore, we may define social norms within in agricultural science leadership as
those elements of leadership that should be taught in agriculture. Although no studies
could be found that defined the social norms within agricultural leadership, elements of
leadership in secondary agricultural education measured by researchers in previous
studies include: participation in public speaking, judging contests, chapter banquet
planning, committee work, leadership camp, parliamentary procedure, state conventions,
national convention, chapter activities, community service, Washington Leadership
conference, fundraising, supervised agricultural experience, Program of Activities (POA)
planning, public relations, holding FFA office, earning proficiency awards, FFA
membership, highest FFA degree held, exhibiting at fairs and shows, working with
groups, understanding self, communicating, making decisions, leadership, and creed
speaking (Brannon, Holley & Key, 1989; Clark, 1977; Dormody & Seevers, 1994a; Karr,

35
Keith, Lockaby, & Vaughn, 2001; Ricketts & Newcomb, 1984; Rutherford et al., 2002;
Thorp, Cummins, & Townsend, 1998; Townsend & Carter, 1983; Wingenbach, 1995).
When an element of leadership was found in four or more of the studies, it was
decided to retain that element as a social norm. Based on the consistencies found in these
studies, social norms within agricultural leadership are defined in this study as
participation in public speaking, judging contests, chapter banquet, committee work,
leadership camp, parliamentary procedure, state conventions, proficiency awards,
national convention, program of activities planning, and holding FFA office.
Because these elements of leadership are found in multiple studies it is concluded
that these elements are most likely what agricultural science researchers believe are the
social norms of secondary agricultural leadership, and as such, are generally the same for
each instructor, being “reflected in the current condition of agricultural education” (Rudd,
1994). If they are the same for each instructor, they need not be measured and therefore
can be excluded from the behavioral model.
Although these leadership skills described as the social norms are reflected in the
current thinking of our agricultural instructors, these are not the leadership skills
presented in the LifeKnowledge curriculum. The LifeKnowledge curriculum goes
beyond parliamentary procedure and teaches interpersonal skills and intrapersonal skills,
skills that allow a person to understand themselves and to understand others as well.
Habits are defined as what a person has usually done (Triandis, 1971) and are based
upon experiences, which are influenced by knowledge (Lee, 2000). Likewise, a person’s
past experiences are a function of their demographics (Taylor, Basen-Engquist, Shinn, &
Bodurka, 2004; Variyam, 1999). Therefore, a person’s habits are a function of their
36
knowledge and demographics. In this study, habits will be measured through high school
agricultural science instructors’ knowledge (Peasley & Henderson, 1992; Rudd, 1994) of
leadership concepts and high school agricultural science instructor demographics
(Connors & Elliot, 1994).
Expectations are measured as expected benefits, or outcomes, of teaching
leadership to students (Mischel & Mischel, 1977; Rudd, 1994). The modified behavioral
model is diagrammed below:
f Behavior = Attitude + Knowledge + Demographics + Expectations Figure 2-2. Theoretical Model of Behavior
This study measured the behavior of high school agricultural science instructors’
teaching of leadership in the classroom. Also measured were high school agricultural
science instructor attitude towards teaching leadership, high school agricultural science
instructor knowledge of leadership, high school agricultural science instructor
demographic variables, and high school agricultural science instructor expectations of
students after leadership had been taught in the classroom.
Population Studied
The population studied was high school agricultural science instructors from
throughout the United States. The population was developed from a list of active FFA
chapters provided by the National FFA Organization. Because the LifeKnowledge
curriculum is to be distributed nationally, it was important to conduct the study on a
national scale so the results could be generalizable to the national population of high
school agricultural science instructors.
37
High School Agricultural Science Instructor Leadership Teaching Behavior
Two methods of determining behavior are self-perceived and observation. Self-
perceived behavior is information provided by the participants about their own behavior.
Observation is information provided by a researcher who observes the participant and
records findings (Ary et al., 1996). This research measured self-perceived high school
agricultural science instructor behavior using a series of questions to determine if specific
content areas of the LifeKnowledge curriculum were being taught using a self-report
form.
Explanatory Variables
This section serves to address research specific to the variables used in this study.
These variables are knowledge, attitude, expectations, and demographics.
Knowledge
Using knowledge as a descriptor for teacher behavior has been used successfully.
Rudd (1994) found that knowledge alone explained 39% of the variance associated with
the behavior of instructor curriculum adoption. This study measured high school
agricultural science instructor leadership knowledge based the individual leadership
development lessons from unit two of the FFA LifeKnowledge leadership curriculum.
Attitude
Instructor attitude is of great importance as it affects the instructors’ teaching and
the students in their classrooms (ERIC Clearing House on Tests Measurement and
Evaluation, 1985). Instructor attitude has been used in many studies to gather data on a
wide range of issues. Osborne and Dyer (1998) measured attitudes of science instructors
to determine their perceptions of high school agriculture programs. Likewise, Cano
(1990) measured attitudes of male agricultural science instructors towards female
38
agriculture science instructors. In two separate studies, attitude was found to be an
explanatory variable when evaluating instructor attitudes towards curriculum (Peasley &
Henderson, 1992; Rudd, 1994). This study measured instructor attitude towards the
teaching of leadership.
Expectations
Along with attitudes, instructor expectations may have an effect on their own
teaching behavior and student success (Happerlen, Clay, Henly, & Barke, 2002).
Instructor expectations of student behavior after leadership instruction were measured in
this study.
Demographics
When describing groups of instructors, demographics for each group can be
significantly different. Instructors with low effectiveness had significantly different
demographics from the instructors with high effectiveness (Miller, Kahler, & Rheault,
1989). Demographics measured by Miller et al. were instructor age, years teaching
experience, years at present location, professional organization membership, civic
organization membership, and leadership positions held in civic organizations.
When explaining FFA program quality, Vaughn and Moore (2000) found that the
demographic characteristics of number of teachers per department and instructor’s
leadership experiences explained 36% of the variance of program quality. Demographic
characteristics measured by Vaughn and Moore were years teaching experience, number
of teachers in department, bachelor’s degree in agricultural education, master’s degree
earned, number of teachers pr department, FFA membership in high school, FFA office
above chapter level, non-FFA positions held in high school, collegiate organization
membership, professional education organization membership, civic organization

39
membership, state and regional committee participation, agricultural education
workshops and seminars conducted, vocational leadership position held in school, and
Advisor’s Washington Leadership Conference attendance.
When studying curriculum adoption, demographic variables were found to be a
significant predictor of adoption (Connors & Elliot, 1994; Rudd, 1994). This exploratory
study will analyze individual demographic characteristics to explain instructor leadership
teaching behavior.
Section Summary
Modified versions of the Triandis behavior model have successfully been used in
the past and offer a simple way to explain behavior with a limited number of variables.
The variables used have the ability to be self-reported, which allows this model to be
adapted for use with a survey instrument.
The variables selected have provided explanatory ability in previous studies, and
were expected to do the same in this study. Knowledge is fundamental in teaching
subject matter and providing instructor self-confidence. Attitude has shown to be a
strong predictor of instructor performance and the addition of expectations to the model
provides a good framework for explaining instructor behavior. In addition, selected
demographic variables have been shown to account for a substantial amount of variance
in explanatory models.
Chapter Summary
The purpose of this chapter was to describe previous research conducted about how
leadership is defined, the importance of teaching leadership, youth leadership
development, leadership curriculums for youth, and explaining why instructors teach
leadership.

40
Definitions of leadership were discussed and the importance of teaching leadership
to youth was provided. The literature suggests that leadership skills are in high demand
by employers and will continue to be so, yet schools have focused on teaching job skills,
and have overlooked teaching leadership skills. This has led previous researchers to
conclude that leadership training needs to occur in high school.
Youth leadership organizations allow high school youth to develop leadership skills
that will benefit them throughout their lives. The National FFA Organization stands out
among youth organizations by providing a wide range of opportunities for students to
develop leadership skills. It has been well documented that students’ participation in
FFA activities leads to increased student leadership skill development. Due to the
partnership between agricultural education and FFA, the agricultural science classroom is
an excellent place to begin building youth for the future through formal classroom
teaching of leadership. To accomplish this the National FFA Organization developed the
LifeKnowledge curriculum. The curriculum was written by practitioners of youth
leadership instruction and has sufficient flexibility to be used alone or with existing
materials. Many barriers to implementation of the curriculum were addressed along with
methods used to increase the rate of adoption.
To determine why high school agricultural science instructors teach leadership a
modified version of the Triandis behavioral model was described. The variables of
knowledge, attitude, expectations and demographics have been successfully used to
explain instructor teaching behavior, and will be used in this study to explain the extent to
which high school agricultural science instructors teach leadership.

CHAPTER 3 METHODS
Chapter 1 provided a brief history of the relationship of agriculture and leadership,
then went on to describe the National FFA Organization’s role in preparing youth for
leadership responsibilities and why leadership is an integral part of agricultural education.
Chapter 1 also described the importance of conducting this research.
The purpose of this study was to determine the extent to which high school
agricultural science instructors are currently teaching leadership in formal agricultural
science classrooms and to explain what influences high school agricultural science
instructors to teach leadership in the classroom. To accomplish this, a modified version
of the Triandis (1971) behavioral model was used which incorporates knowledge, attitude
and expectations to explain behavioral outcomes.
Chapter 2 reviewed previous research conducted about youth leadership and
provided a theoretical framework based on Triandis’ behavioral model (Ricketts, 2003;
Rudd, 1994; Triandis, 1980) from which to build a theoretical model. Areas of review
included defining leadership, the importance of teaching leadership, previous research on
youth leadership, leadership curriculum for youth, why instructors teach leadership, the
theoretical behavior model, and explanatory variables of behavior.
This chapter will describe the research context of the study, research design,
research questions, population, sample, instrumentation, procedures used to collect the
data, and data analysis.
41

42
Context of the Study
Place
The study was conducted via mail and on-line using the Internet, therefore the place
of data collection was the classroom, home or other location of the high school
agricultural science instructor. The instructors were located in every U.S. state, with the
exception of five states in which the curriculum had been pilot tested: Kansas, Maine,
Nebraska, New Jersey, and Pennsylvania.
Postal mailings notifying the participants of the survey and required emails were
sent from the researcher’s office on the University of Florida campus in Gainesville, FL.
The survey instruments used were both paper and pencil, and on-line forms. The paper
and pencil instrument consisted of an eight-page questionnaire mailed to the participants.
The on-line instrument consisted of web pages and web forms, loaded on a World Wide
Web file server located on the University of Florida campus. Data collected from the
paper and pencil instrument were entered manually by the researcher. Data collected
from the on-line instrument were sent to a text file on the file server and simultaneously
emailed to the researcher. Data analyses, conclusions, and recommendations were
completed at the University of Florida.
Time
Preliminary instrument development began on October 21, 2002. A preliminary
instrument was completed on January 29, 2004. A panel of experts, consisting of the
researcher’s committee reviewed the instrument and suggested additions and corrections
that should be made to the instrument. Based on the panel’s comments, modifications
were made to the instrument. The pilot study was administered to a sample of high
school agricultural science instructors from Nebraska on February 26, 2004. Data

43
analysis from the pilot study was conducted and revisions to the instrument were made on
March 31, 2004.
The national survey began on April 5, 2004. Final data collection was completed
on May 17, 2004. Data were then analyzed beginning on May 17, 2004. The entire
study was conducted between February 26, 2004 and May 17, 2004.
National FFA Organization
The National FFA Organization was instrumental in the development of this study.
The LifeKnowledge curriculum developed by the FFA provided the leadership content
areas with which this study was framed. In addition, the National FFA Organization
provided a comprehensive list of high school agricultural science programs from across
the United States from which the sample was derived.
Research Design
The study was conducted using survey research, and a correlational, ex post facto
design. A correlational design involves the collection of two or more sets of data from a
group of subjects with the attempt to determine the subsequent relationship between those
sets of data (Tuckman, 1994). Ex post facto is a study in which the researcher examines
the effects of a naturally occurring treatment after the treatment has occurred. The
researcher relates the after-the-fact treatment to an outcome or dependent measure
(Tuckman, 1994).
The dependent variable measured was instructor leadership teaching behavior as
determined by the level of formal leadership instruction taught in the high school
agricultural science classroom. Independent variables measured were instructor
leadership knowledge, instructor attitude towards teaching leadership, instructor
expectations after teaching leadership to students, and instructor demographics. The

44
measures of instructor behavior, instructor knowledge and instructor expectations were
developed using lesson objectives in unit two of the LifeKnowledge curriculum (National
FFA Organization, 2003). These variables will be discussed in more detail in the
instrumentation section.
Research Objectives
Much research has been done regarding youths’ self-perception of their own
leadership ability and skill (Rutherford et al., 2002; Seevers & Dormody, 1995;
Townsend & Carter, 1983; Wingenbach, 1995). Yet, little research has been conducted
on instructor teaching behavior. Additionally, the author could find neither research that
quantified the amount of leadership being taught in agricultural science classrooms nor
research that addressed the factors that influence instructors to teach leadership. This
study sought to address the following research objectives:
• Determine the demographic characteristics of high school agricultural science instructors;
• determine the extent to which leadership is being taught in high school agricultural science classrooms;
• based on National FFA LifeKnowledge leadership curriculum, determine high school agricultural science instructor leadership knowledge;
• determine high school agricultural science instructor attitude towards teaching leadership;
• determine the expectations that high school agricultural science instructors have of the agriculture students after leadership has been taught; and
• explain the relationship between high school agricultural science instructor leadership knowledge, high school agricultural science instructor attitude towards teaching leadership, high school agricultural science instructor expectations of students, and high school agricultural science instructor demographics in light of high school agricultural science instructor leadership content area teaching behavior.

45
Population
The population for the study was all FFA advisors at high school agricultural
science programs (National FFA Organization, 2002) with the exception of FFA advisors
in five states where the curriculum had been pilot tested: Kansas, Maine, Nebraska, New
Jersey, and Pennsylvania. The programs were identified through the National FFA
Organization.
Sample
Nationally, there are 7,193 high school agricultural science programs (National
FFA Organization, 2002). A 95% confidence level with 5% sampling error was chosen
for this study. Based on sample size information from Dillman (2000), a sample size of
367 was required for a population of 8,000. The confidence level and sampling error are
contingent upon receiving 367 usable responses. To account for incorrect addresses,
inactive programs, etc. a sample size of 400 was chosen. Using a list of active FFA
chapters provided by the National FFA Organization, 400 participants were selected by
simple random sample selection (Agresti & Finlay, 1997). To accomplish this, that
Active Chapter List was entered into an Excel® file. Random numbers were assigned to
each chapter in the sample frame and sorted. The first 400 chapters of the sorted list were
used in the study.
Instrumentation
The instrument was designed to measure the level of leadership taught in the
agricultural science classroom, the attitude of the instructor towards the teaching of
leadership, the leadership knowledge of the instructor, demographic information of the
instructor, and instructor expectations of students after leadership had been taught in the
classroom (see Appendix A).

46
Instructor leadership knowledge and the constructs of level of leadership being
taught, instructor attitude towards teaching leadership, and instructor expectations of
agricultural students were framed with the LifeKnowledge curriculum developed by the
National FFA Organization (2003). Level of leadership instruction and leadership
knowledge questions used in the instrument were based on lessons from unit two of the
LifeKnowledge curriculum. This unit included elements from all six content areas of the
LifeKnowledge curriculum and covers a broad mix of leadership concepts. A series of
demographic questions were asked to gather information about the instructor (Miller et
al., 1989; Vaughn & Moore, 2000).
Section I of the instrument measured the teaching of leadership content areas
contained in unit two of the LifeKnowledge curriculum (see Appendix A). Using a series
of 30 statements, the high school agricultural science instructor was asked if they taught
leadership by indicating either yes they taught the particular concept or no they did not
teach the concept (Connors & Elliot, 1994; Rudd & Hillison, 1995). The instrument was
developed as a paper and pencil instrument and as a web page for use on the Internet (see
Appendix B). Answers for the web-based instrument were indicated by using the
computer mouse to click on a “radio button” to indicate their answer using the
dichotomous scale.
Section II of the instrument measured high school agricultural science instructor
expectations of the student for each of the leadership content areas in unit two of the
LifeKnowledge curriculum (see Appendix A). Eighteen expectation statements were
provided and a dichotomous scale was used to record the participant’s responses, yes if

47
they expected the student to perform the action, or no if they did not expect the student to
perform the action (Rudd & Hillison, 1995).
Section III of the instrument measured the leadership knowledge of the instructors
(see Appendix A). Thirty questions from the lesson objectives and evaluation tools found
in unit two of the LifeKnowledge curriculum were used (National FFA Organization,
2003). Questions were in the form of true-false and multiple-choice. Curriculum defined
knowledge content areas measured were values, beliefs, responsibility and accountability,
character, leader, vision, influence, motivation, risk taking, self-worth, character, time
management, goal setting, and mentors.
Section IV of the instrument measured the high school agricultural science
instructor’s attitude towards teaching leadership using a semantic differential technique
consisting of 12 pairs of words (see Appendix A). A scale consisting of six spaces or
radio buttons placed between the words was provided to indicate level of agreement with
one of each of the pair of words. The pairs of words used were necessary/unnecessary,
boring/interesting, positive/negative, practical/impractical, useful/useless, helpful/not
helpful, wanted/unwanted, not worthwhile/worthwhile, valuable/worthless,
successful/unsuccessful, wise/foolish, and bad/good. Word pairs were determined using
established pairs of terms (Jenkins, Russell, & Suci, 1958; Rudd, 1994).
Section V of the instrument addressed demographic questions about the high school
agricultural science instructor (see Appendix A). Questions asked were school location,
highest level of education, gender, if they had been certified through a university
agriculture teacher certification program, was their bachelor degree in agricultural
education, FFA membership in high school, FFA chapter officer in high school, FFA

48
office above chapter level, age, years teaching agriculture, years teaching in current
position, number of agriculture teachers at school, number of leadership courses taken in
college, number of offices held in student leadership organizations other than FFA,
offices held in college student organizations, offices held in professional education
organizations, number of offices held in civic organizations, membership in professional
development organizations, number of offices held in professional development
organizations, participation on state or regional agricultural science committees, number
of workshops or seminars conducted for agriculture teachers, number of workshops or
seminars conducted for non-agriculture teachers, number of leadership positions held in
local school or vocational department, number of times they attended the Advisors’
Washington Leadership Conference, and if a leadership course was taught in their
agricultural science program (Miller et al., 1989; Vaughn & Moore, 2000).
The instrument was checked for validity by a panel of experts consisting of the
researcher’s committee members.
Procedures
Procedures used to collect the data are included in this section of the chapter. This
includes a description of the pilot study, and the survey, including notification of
participants, follow up contacts, etc.
Pilot Study
To pilot test the instrument, subjects (n =40) were selected at random from the
Nebraska FFA chapters on the FFA Active Chapter List. A modified version of the
Tailored Design Method (Dillman, 2000) was used for data collection. A pre-notice
letter was sent on February 26, 2004 notifying the pilot sample that they had been
selected to participate in this survey. Instructions were provided as to how they could

49
access the study via the Internet. Three days later, March 1, 2004, a paper form of the
instrument was sent to the participants. Seven days later, on March 8, 2004, a thank
you/reminder postcard was sent to the participants. Seven days later March 15, 2004, a
replacement questionnaire was sent to participants that had not yet responded. Seven
days later March 22, 2004, a personal contact was made with non-respondents by a
colleague in Nebraska, encouraging them to complete the questionnaire. Nine additional
days were allowed for collection of electronic and mailed paper responses. Twenty pilot
instruments were returned for a pilot response rate of 50%.
Pilot instrument reliability was analyzed using SPSS® to determine Coefficient
alpha based on the three instrument constructs. From these results, the following changes
were made to the instrument:
Section I which measured the teaching of leadership content areas, had a reliability
of alpha=0.92. Two questions were removed to increase the reliability to alpha=0.93.
Section II which measured instructor expectations of the student, had a reliability of
alpha=0.79. Eight questions were removed to increase the reliability to alpha=0.81.
Section IV which measured instructor attitude toward teaching leadership, had a
reliability of alpha=0.91. No changes were made to this portion of the instrument.
Data Collection Procedures
A modified version of the Tailored Design Method (Dillman, 2000) was used for
data collection from the sample. A pre-notice letter (see Appendix C) was sent on April
5, 2004 notifying the sample that they had been selected to participate in this survey.
Instructions were provided as to how they could access the study via the Internet. Four
days later, April 9, 2004, a paper form of the instrument (see Appendix A), that included
the IRB informed consent form (see Appendix C), was sent to the participants. Ten days

50
later, on April 19, 2004, a thank you/reminder postcard was sent to the participants (see
Appendix C). Ten days later April 29, 2004, a replacement questionnaire was sent to
participants that had not yet responded (see Appendix C). Eight days later May 7, 2004,
phone calls were placed to non-respondents encouraging them to complete the
questionnaire. Ten additional days were allowed for collection of electronic and mailed
paper responses. Thank you postcards were mailed to all respondents acknowledging
receipt of their questionnaire and thanking them for their participation in the study. The
postcard also provided the respondents with an Internet address where the results of this
research could be located.
Response Rate
The final response rate for the study was 41.8% (n=167). This response rate
appears to be low, but this may be influenced by a number of factors. First, it may be
indicative of a trend in agricultural education. A review of studies in the Journal of
Agricultural Education that sampled agriculture teachers shows response rates have been
declining over the past 14 years (Balschweid & Thompson, 2002; Birkenbolz & Maricle,
1991; Boone, Gartin, Wright, Lawrence, & Odell, 2002; Conroy & Walker, 2000;
Croom, 2003; Delnero & Montgomery, 2001; Dormody, 1993; Dormody, Seevers, &
Clason, 1996; D. W. Duncan, 2004; Eaton & Bruening, 1996; Elbert, 2003; Fraze,
Hardin, Brashears, Haygood, & Smith, 2003; Harris & Birkenbolz, 1996; Kotrlik &
Drueckhammer, 1987; Kotrlik, Redmann, & Douglas, 2003; Layfield & Dobbins, 2002;
Myers, Dyer, & Breja, 2003; Rogers, Townsend, & Lindner, 2004; Thobega & Miller,
2003; Thomas & Groves, 1986; Whent, 1994). When response rates are averaged for
each decade, and separated into the categories of national study, regional study, and state
51
study, a downward trend occurs. Response rates for national studies, averaged by
decade, have declined from 84.4% in the 1980’s to 57.9% currently.
Another cause of the low response rate may be the time of the year. Follow up
phone calls to the 320 instructors that had not responded after the third mailing revealed
that many instructors were busy with spring activities such as livestock shows, banquets,
final exams, inputting grades, etc. Many stated they had been too busy to complete the
form. When instructors were asked if emailing a web link to the web based questionnaire
would be helpful, most instructors stated that they would be more likely to complete the
questionnaire if a link were sent to them.
Finally, even with a response rate below 50%, this is higher than what is expected
in many disciplines. Response rates in education, marketing, and applied health typically
range from 1% to 31% (Fox, Robinson, & Boardley, 1998), while business marketing
survey research rates are usually below 15% (Wilson, 1999). At the same time, response
rates from healthcare organizations range from 8.2% to 24.8% (Hikmet & Chen, 2003).
Even more dramatic are the response rates found in direct mail, which are typically 1% to
10% (Response Rates, 2000; Souccar, 2000; Teichgraeber, 2001).
Based on this information, the response rate of the current study is reasonable for
this population, and is above the expectations of some disciplines. Based on the sample
size formula in Dillman (2000), the 167 responses of this study allow the results to have a
95% confidence level with 7.5% sampling error.
Data Analysis
Data were collected via paper and pencil questionnaires (see Appendix A) and the
Internet using the on-line instrument (see Appendix B). Data from the paper and pencil
instruments were entered into a Microsoft® Excel® spreadsheet by the researcher. Data

52
from the Internet-based instrument were stored in a comma delimited text file on the
University file server and sent as an email to the researcher. The text file containing all
of the data was converted to a Microsoft® Excel® spreadsheet. The data from the pencil
and paper version and the electronic version of the instrument were combined in Excel®,
then imported to Statistical Package for the Social Sciences for Windows™ (SPSS®)
version 12.0 for analysis.
To control for non-response bias a t-test was used to compare early respondents to
late respondents (Miller & Smith, 1983). Early respondents (n=130) were compared with
late respondents (n=37). Independent sample t-tests were conducted on each variable of
interest and no significant differences were found between early and late respondents.
Likewise, a t-test was conducted to compare participants that responded using the
paper and pencil instrument sent in via the mail and the participants that responded using
the Internet web-form. Paper and pencil respondents (n=96) were compared with Internet
respondents (n=71). Independent sample t-tests were conducted on each variable of
interest and no significant differences were found between pencil and paper, and Internet
respondents.
The instrument post-hoc reliability was analyzed using SPSS by computing an
alpha coefficient for each of the three measured constructs. Instrument reliability was
analyzed using SPSS® to determine Coefficient alpha based on the three instrument
constructs. Section I which measured the teaching of leadership content areas, had a
reliability of alpha=0.95. Section II which measured instructor expectations of the
student, had a reliability of alpha=0.84. Section IV which measured instructor attitude
toward teaching leadership, had a reliability of alpha=0.92.

53
Descriptive statistics and frequencies were compiled from the data. Previous
studies summed leadership and demographic variables (Vaughn & Moore, 2000) and
provided insufficient explanation for how they had been coded (Miller et al., 1989). Due
to this lack of information regarding the relationships of the variables used in this study,
it was decided to conduct correlations on all variables for this exploratory study. For
correlational and regression analysis the variable gender was coded as a dichotomous
dummy variable, 1=male; 0=female. The following variables were also coded as dummy
variables, 1=yes; 0=no: rural school location, suburban school location, urban school
location, certified through a university agriculture teacher certification program, bachelor
degree in agricultural education, FFA member in high school, FFA chapter officer, FFA
officer above chapter level, and leadership course taught in agricultural science program.
Pearson’s Product Moment correlation was performed with all of the variables to
determine relationships. Magnitude of correlations will be described using the terms
discussed by Miller (1998) (see Table 3-1). Variables having the greatest correlation
with instructor teaching behavior were selected for use in regression analysis. Backwards
multiple regression analysis was performed to determine relationship and explanatory
qualities of the data. Regression models were analyzed for significance and explanatory
qualities. An alpha level of 0.05 was set a priori for the statistical analysis. Results of
this analysis are presented in chapter four of this study.
Table 3-1. Correlation Magnitude Descriptors r Descriptor 1.0 Perfect 0.70 – 0.99 Very high 0.50 – 0.69 Substantial 0.30 – 0.49 Moderate 0.10 – 0.29 Low 0.01 – 0.09 Negligible

54
From Miller, L. (1998). Appropriate analysis. Journal of Agricultural Education 39(2), 1-10.
Summary
This chapter described the methods used to research the current level of leadership
taught in agricultural science classrooms and factors associated with describing and
explaining the instructional behavior of leadership with high school agricultural science
instructors.
This is a descriptive study using ex post facto and correlational designs to reveal
relationships and explain instructor teaching behavior. The development and analysis of
the instrument were discussed and methods used for data collection were provided. Data
were collected from n=167 high school agricultural science instructors located throughout
the United States. Statistical analyses performed on the data were described in this
chapter. Chapter four discusses the findings of this study.

CHAPTER 4 RESULTS
Chapter 1 provided a brief history of the relationship of agriculture and leadership
then went on to describe the National FFA Organization’s role in preparing youth for
leadership responsibilities and why leadership is an integral part of agricultural education.
Chapter 1 also described the necessity of conducting this research.
The purpose of this study was to determine the extent to which high school
agricultural science instructors are currently teaching leadership in formal agricultural
science classrooms and explain what influences agricultural science instructors to teach
leadership in the classroom. To accomplish this, a modified version of the Triandis
(1971) behavioral model was used, which incorporates knowledge, attitude and
expectations to explain behavioral outcomes. Specifically this study sought to:
• Determine the demographic characteristics of high school agricultural science instructors;
• determine the extent to which leadership is being taught in high school agricultural science classrooms;
• based on National FFA LifeKnowledge leadership curriculum, determine high school agricultural science instructor leadership knowledge;
• determine high school agricultural science instructor attitude towards teaching leadership;
• determine the expectations that high school agricultural science instructors have of the agriculture students after leadership has been taught; and
• explain the relationship between high school agricultural science instructor leadership knowledge, high school agricultural science instructor attitude towards teaching leadership, high school agricultural science instructor expectations of
55
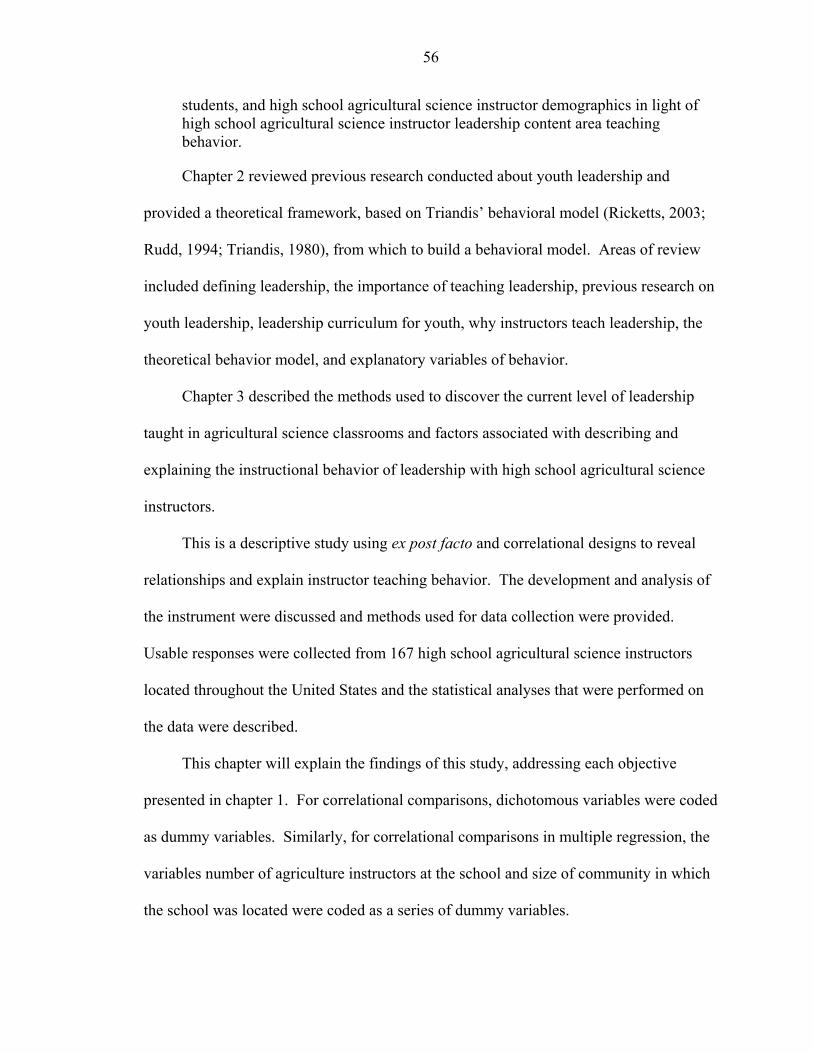
56
students, and high school agricultural science instructor demographics in light of high school agricultural science instructor leadership content area teaching behavior.
Chapter 2 reviewed previous research conducted about youth leadership and
provided a theoretical framework, based on Triandis’ behavioral model (Ricketts, 2003;
Rudd, 1994; Triandis, 1980), from which to build a behavioral model. Areas of review
included defining leadership, the importance of teaching leadership, previous research on
youth leadership, leadership curriculum for youth, why instructors teach leadership, the
theoretical behavior model, and explanatory variables of behavior.
Chapter 3 described the methods used to discover the current level of leadership
taught in agricultural science classrooms and factors associated with describing and
explaining the instructional behavior of leadership with high school agricultural science
instructors.
This is a descriptive study using ex post facto and correlational designs to reveal
relationships and explain instructor teaching behavior. The development and analysis of
the instrument were discussed and methods used for data collection were provided.
Usable responses were collected from 167 high school agricultural science instructors
located throughout the United States and the statistical analyses that were performed on
the data were described.
This chapter will explain the findings of this study, addressing each objective
presented in chapter 1. For correlational comparisons, dichotomous variables were coded
as dummy variables. Similarly, for correlational comparisons in multiple regression, the
variables number of agriculture instructors at the school and size of community in which
the school was located were coded as a series of dummy variables.

57
Objective One: Determine the Demographic Characteristics of High School Agricultural Science Instructors
The average high school agricultural science instructor in this study is 39.37 years
old, has been teaching for 14.85 years, and has been teaching at their current location for
10.61 years. Most instructors are male, teach in a one-instructor department, and their
school is located in a rural community. Most earned their bachelor’s degree in
agricultural education and were certified through a university agriculture teacher
education program. In addition, most instructors were FFA chapter officers in high
school. Specific characteristics and experiences of the participants of this study are
presented later in this chapter.
Age, Years Teaching, and Years Teaching in Current Position
The age of the participants ranged from 23 to 61, with an average age of M=39.37
years. The number of years teaching for participants ranged from one to 38, with an
average of M=14.85. The number of years teaching in their current position ranged from
one to 34, with an average of M=10.61 (see Table 4-1).
Table 4-1. Participant Mean Age, Years Teaching, and Years Teaching in Current Position (n=167)
n M SD Minimum Maximum Age 157 39.37 10.31 23 61 Years teaching 158 14.85 10.16 1 38 Years teaching in current position 158 10.61 8.87 1 34
The distribution of participant age is shown in Figure 4-1. The distribution shows a
group of participants from age 23 to age 33, then another group from age 35 to age 58.
These two groups form somewhat of a bimodal distribution. When a normal curve is
superimposed on top of the distribution, it appears slightly skewed left.
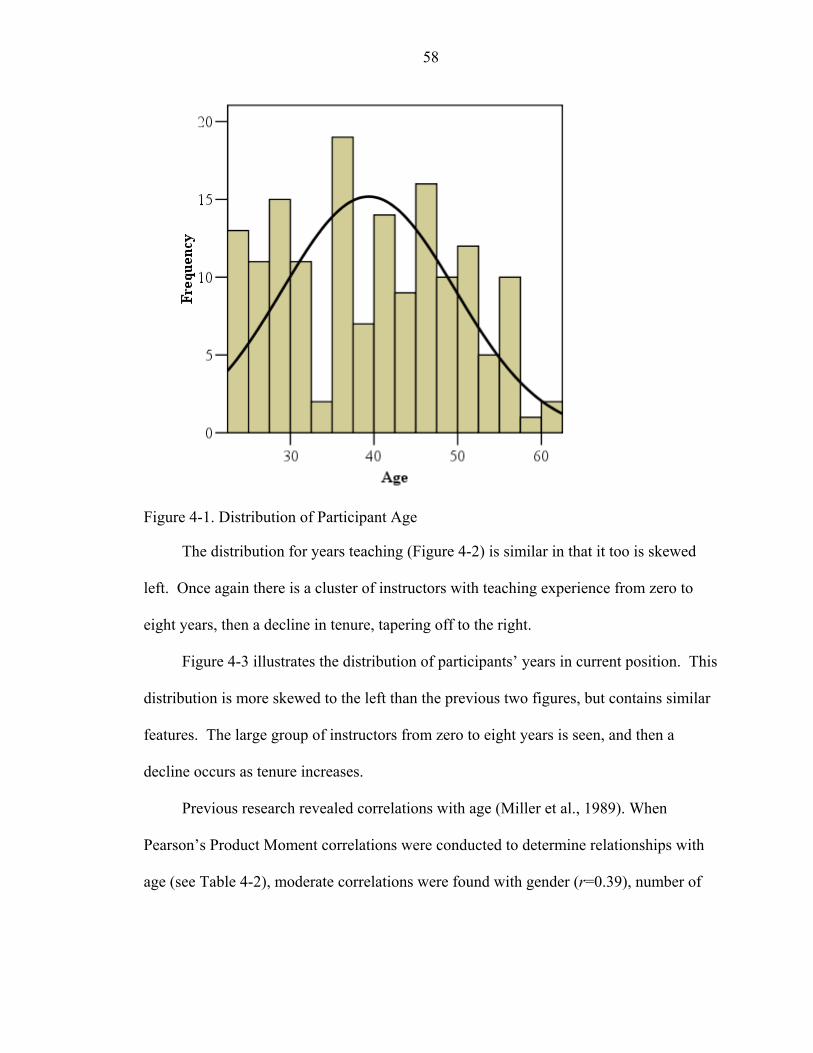
58
Figure 4-1. Distribution of Participant Age
The distribution for years teaching (Figure 4-2) is similar in that it too is skewed
left. Once again there is a cluster of instructors with teaching experience from zero to
eight years, then a decline in tenure, tapering off to the right.
Figure 4-3 illustrates the distribution of participants’ years in current position. This
distribution is more skewed to the left than the previous two figures, but contains similar
features. The large group of instructors from zero to eight years is seen, and then a
decline occurs as tenure increases.
Previous research revealed correlations with age (Miller et al., 1989). When
Pearson’s Product Moment correlations were conducted to determine relationships with
age (see Table 4-2), moderate correlations were found with gender (r=0.39), number of
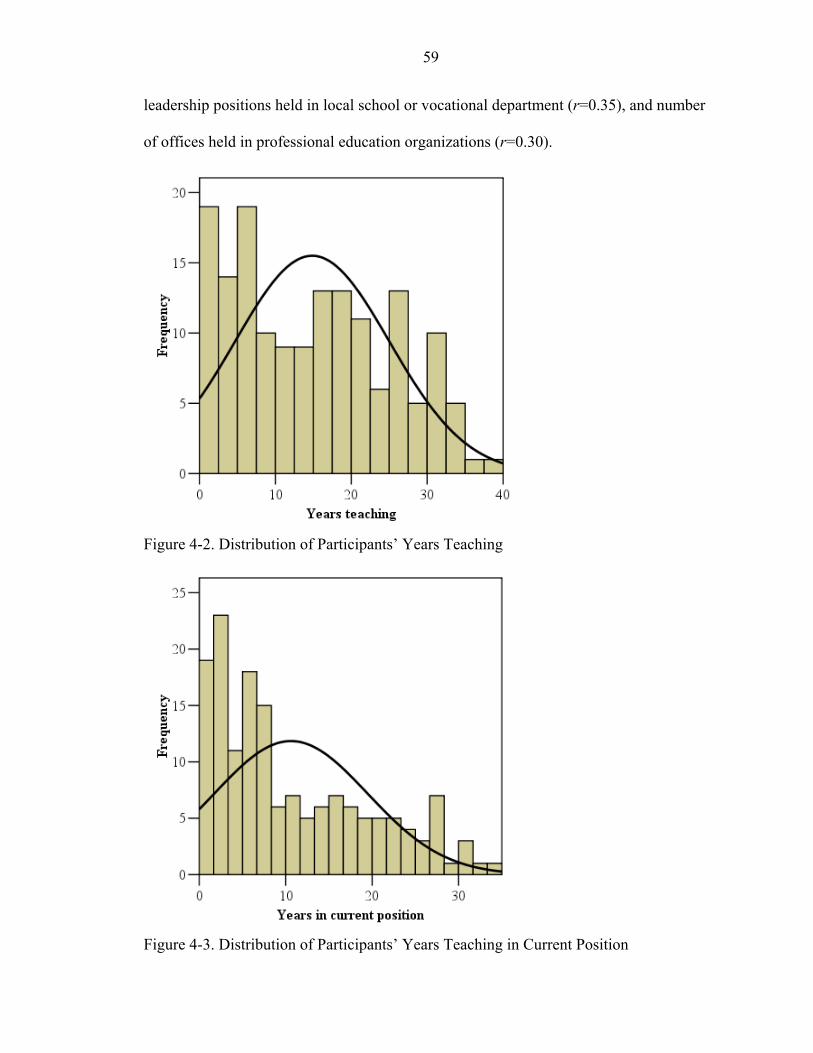
59
leadership positions held in local school or vocational department (r=0.35), and number
of offices held in professional education organizations (r=0.30).
Figure 4-2. Distribution of Participants’ Years Teaching
Figure 4-3. Distribution of Participants’ Years Teaching in Current Position

60
Table 4-2 shows moderate correlations which occurred between years teaching and
gender (r=0.43), number of offices held in professional education organizations (r=0.37),
and number of leadership positions in local school or vocational department (r=0.39).
Number of years teaching in current position (see Table 4-2) had moderate
relationships with number of offices held in civic organizations (r=0.40), gender (r=0.37)
number of workshops and seminars for agriculture teachers (r=0.32), and level of
education (r=0.31). Additional correlations for age, years teaching, and years teaching in
current position are shown in Appendix D, Table D-1.
Table 4-2. Pearson’s Product Moment Correlations Between Age, Years Teaching, Years Teaching in Current Position, and Selected Variables (n=157)
Variable Age Years
Teaching Years Teaching in Current Position
Gender2 0.39* 0.43* 0.37* Number of leadership positions held in local
school or vocational department 0.35* 0.39* 0.25*
Number of offices held in professional education organizations
0.30* 0.37* 0.40*
Number of offices held in civic organizations
0.25* 0.32* 0.19*
Number of workshops and seminars for agriculture teachers
0.25* 0.29* 0.32*
Level of education 0.18* 0.25* 0.31* Age -- 0.91* 0.69* Years teaching -- -- 0.80* Notes: * = p<0.05; 1 = Yes coded as 1, No coded as 0; 2 = Males coded as 1, Females coded as 2. Gender
Males comprised 73.1% (n=114) of the sample. An independent groups t-test
was conducted to determine if any significant differences existed between the female and
male participants. Significant gender differences were found in the variables age
t(153)=5.26, years teaching t(154)=5.90, and years teaching in current position
t(154)=4.90. The results of this test are presented in Table 4-3.

61
Table 4-3. Independent Groups t-test for Significant Variables by Gender (n=167) Variable t df Age 5.26* 153 Years teaching 5.90* 154 Years teaching in current position 4.90* 154 Certified through a university agriculture teacher education program 2.77* 154 Bachelor degree in agricultural education 2.46* 153 Number of offices held in high school organizations outside of FFA -2.35* 153 Number of offices held in professional education organizations 2.42* 153 Number of offices held in civic organizations 2.38* 152 Number of offices held in college organizations -2.22* 154 Leadership course taught in agricultural science program 2.00* 151 Note: *=p<0.05
Previous research did not investigate the influence of gender on instructor behavior.
Because gender had not been researched as an explanatory variable in the past studies
(Miller et al., 1989; Vaughn & Moore, 2000), it was decided to conduct correlations
using this variable. Correlations were conducted for gender (see Table 4-4), with males
coded as one and females coded as zero. The analysis revealed moderate correlations
with years teaching (r=0.43), age (r=0.39), and years teaching in current position
(r=0.37).
Number of Instructors at School
The number of agriculture instructors at the school ranged from one to six, with an
average of M=1.56 instructors per department. Of the 156 participants that responded to
this question, 59.0% (n=92) were located in one-instructor departments and 32.1%
(n=50) were in two-instructor departments (see Table 4-5).

62
Table 4-4. Pearson’s Product Moment Correlations between Gender and Selected Variables (n=156)
Variable Gender2 Years teaching 0.43* Age 0.39* Years in current teaching position 0.37* Instructor leadership teaching behavior 0.23* Certified through a university agriculture teacher education program1 0.22* Bachelor degree in agricultural education1 0.20* Number of offices held in professional education organizations 0.19* Number of offices held in civic organizations 0.19* Four or more instructor department1 0.18* Leadership course taught in agricultural science program1 0.16* Number of offices held in high school organizations outside of FFA -0.19* Number of offices held in college organizations -0.18* Note: *=p<0.05; 1=Yes coded as 1, No coded as 0; 2=Males coded as 1, Females coded as 2.
Table 4-5. Number of agricultural science instructors at school (n=156) n %One-instructor school 92 59.0Two-instructor school 50 32.1Three-instructor school 8 5.1Four-or-more instructor school 6 3.8
Figure 4-4 shows the distribution of the number of agriculture instructors in school.
The curve is skewed left, illustrating the large number of one-instructor and two-
instructor agricultural science departments.
Relationships with number of agricultural science instructors in school shows a
negative, moderate correlation with rural school location (r=-0.34) and a positive,
moderate correlation with suburban school location (r=0.31), indicating that as the school
location becomes more urban (i.e. less rural), the number of agriculture instructors at a
school increases (see Table 4-6).

63
Figure 4-4. Distribution of Number of Agriculture Instructors in School
Participants located in four-or-more instructor departments (see Table 4-6) had a
moderate correlation with number of offices held in high school organizations outside of
FFA (r=0.42). This reveals that participants teaching at schools with over three
agriculture instructors were more likely to have participated in high school organizations
outside of FFA, than were the participants teaching at schools with fewer instructors.
Additional correlations with number of instructors at school can be found in Appendix D,
Table D-2.
School Location
Participants were asked to describe the location of the community in which their
school was located. Table 4-7 shows 73.4% (n=113) indicated their school was in a rural
community, consisting of a population under 10,000 (Pennsylvania State University,

64
2004; U.S. Census Bureau, 2004; Wingenbach, 1995). For determining correlational
relationships, the locations of rural, suburban, and urban were coded as dichotomous
dummy variables.
Table 4-6. Pearson’s Product Moment Correlations between Number of Instructors at School and Selected Variables (n=156)
Variable
Number of Agricultural
Science Instructors
One Instructor
Two Instructor
Three Instructor
Four or More
InstructorsRural school location 1 -0.34* 0.27* -0.05 -0.22* -0.23* Suburban school location1 0.31* -0.20* 0.03 0.16 0.19* Location of school 0.28* -0.24* 0.05 0.21* 0.20* Number of workshops and
seminars for non-agriculture teachers
0.21* -0.19* 0.04 0.26* 0.20*
Number of offices held in high school organizations outside of FFA
0.20* -0.11 -0.04 0.11 0.42*
Level of education1 0.18* -0.15 0.01 0.22* 0.05 Instructor leadership teaching
behavior 0.13 -0.12 0.04 0.18* 0.07
Number of agricultural science instructors in school
-- -0.78* 0.35* 0.39* 0.40*
One instructor department1 -- -- -0.81* -0.28* -0.17* Two instructor department1 -- -- -- -0.16* -0.10 Three instructor department1 -- -- -- -- -0.03 Notes: *=p<0.05; 1=Yes coded as 1, No coded as 0. Table 4-7. Location of school (n=154) Location n %
Rural (<10,000) 113 73.4
Suburban (10,000-49,999) 25 16.2
Urban (>49,000) 16 10.4
Pearsons’ Product Moment correlations produced strong correlations between the
dichotomous location variables and the parent variable location. All other relationships
were low (see Table 4-8). It is interesting to note that the relationships between FFA
involvement and school location, although low in magnitude, reveal that instructors at

65
rural schools were more likely to have been involved in FFA than were the instructors at
urban schools. In addition, instructors in urban schools were less likely to have earned
their bachelor’s degree in agricultural education, revealing that many urban instructors
have a technical specialization outside of agricultural education.
Table 4-8. Pearson’s Product Moment Correlations between School Location and Selected Variables (n=154)
Variable Location Rural1 Suburban1 Urban1 Rural school location1 -0.93* -- -0.73* 0.57* Urban school location1 0.84* -- -- -- Suburban school location1 0.42* -- -- -0.15 FFA chapter officer1 -0.25* 0.24* -0.12 -0.20* Number of workshops and seminars for non-
agriculture teachers 0.24* -0.17* -0.03 0.28*
Bachelor degree in agricultural education1 -0.23* 0.22* -0.12 -0.18* FFA member in high school1 -0.22* 0.22* -0.12 -0.17* FFA officer above chapter level1 -0.16* 0.17* -0.12 -0.10 Instructor leadership teaching behavior 0.13 -0.06 -0.08 0.19* Note. *=p<0.05; 1=Yes coded as 1, No coded as 0. Educational Background
When asked to indicate their highest level of education, 50.6% (n=80) of the
participants held a masters degree (see Table 4-9). When asked to indicate if they were
certified through a university agricultural teacher certification program, 96.8% (n=153)
had been certified through a university agriculture teacher education program, and 85.4%
(n=134) stated their bachelor degree was in agricultural education.
Table 4-9. Educational Background (n=158) n % Less than a bachelor degree 3 1.9 Bachelor degree 75 47.5 Masters degree 80 50.6 Certified through a university agriculture teacher certification program 153 96.8 Bachelor degree in agricultural education 134 85.4
Pearson’s Product Moment correlations revealed a moderate relationship between
level of education and number of offices held in professional education organizations

66
(r=0.31) (see Table 4-10). Relationships with the variable bachelor degree in agricultural
education include two moderate correlations, the first with FFA member in high school
(r=0.40) and the second with FFA chapter officer (r=0.36).
FFA Involvement
Table 4-11 presents the participants’ FFA involvement. Of the participants, 86.1%
(n=136) stated they had been FFA members, and 75.9% (n=120) had been an FFA
chapter officer.
Table 4-10. Pearson’s Product Moment Correlations Between Educational Background and Selected Variables (n=157)
Variable Level of Education
Certified through a University Agriculture Teacher Education Program 1
Bachelor Degree in Agricultural Education 1
Certified through a university agriculture teacher education program1
0.10 -- --
Bachelor degree in agricultural education1 -0.03 0.23* -- Number of offices held in professional
education organizations 0.31* 0.13 0.07
Number of offices held in civic organizations
0.16* 0.02 0.06
Gender2 0.15 0.22* 0.20* Leadership course taught in agricultural
science program1 0.09 0.17* 0.21*
FFA chapter officer1 0.07 0.07 0.36* Instructor expectations after leadership has
been taught 0.07 0.17* 0.20*
Instructor attitude towards the teaching of leadership
-0.06 0.16* 0.06
Instructor leadership teaching behavior -0.03 0.09 0.09 FFA member in high school1 0.03 0.14 0.40* Number of leadership courses taken in
college 0.03 0.01 0.16*
Membership in professional development organizations
-0.02 - 0.01 0.18*
Note. *=p<0.05; 1=Yes coded as 1, No coded as 0; 2=Males coded as 1, Females coded as 2.

67
Table 4-11. FFA Involvement (n=158) n % FFA member in high school 136 86.1 FFA chapter officer 120 75.9 FFA officer above chapter level 52 33.1
Most instructors were FFA members in high school, however Table 4-12 shows
that FFA membership had a negligible relationship to instructor leadership teaching
behavior. A moderate relationship was found between holding an FFA office above
chapter level and number of offices held in college organizations (r=0.31).
Table 4-12. Pearson’s Product Moment Correlations between FFA Involvement and Selected Variables (n=158)
Variable FFA
Member1 FFA Chapter
Officer 1 FFA Officer above
Chapter Level 1 FFA member in high school1 -- 0.72* 0.25* FFA chapter officer1 -- -- 0.33* Number of offices held in college
organizations 0.20* 0.22* 0.31*
Age -0.17* -0.16* -0.20* Number of leadership positions in local
school or vocational department -0.17* -0.12 -0.10
Number of offices held in high school organizations outside of FFA
0.08 0.15 0.16*
Instructor leadership teaching behavior 0.05 -0.01 -0.04 Note. *=p<0.05; 1=Yes coded as 1, No coded as 0.
High School and College Leadership Activities
High school and college leadership activities of participants are listed in Table 4-
13. Of the participants, 74.1% (n=117) held offices in high school organizations outside
of FFA. In terms of college leadership activities, 73.1% (n=114) had taken one or more
college leadership courses and 67.3% (n=107) held one or more offices in college
organizations.

68
Table 4-13. High School and College Leadership Activities of Participants n M SD Minimum Maximum Number of offices held in high school
organizations outside of FFA 158 2.72 3.18 0 20
Number of leadership courses in college 156 1.67 1.62 0 10 Number of offices held in student organizations
at the college level 159 1.83 2.15 0 15
Correlations in Table 4-14 reveal that number of offices held in high school
organizations outside of FFA had a substantial relationship with number of offices held in
college organizations (r=0.52), and a moderate relationship between number of offices in
college organizations and holding FFA office above chapter level (r=0.31). An
interesting finding is the relationship of these variables to instructor leadership teaching
behavior. Number of leadership courses taken in college had a low relationship with
instructor leadership teaching behavior, while negligible relationships were found with
number of offices in high school organizations outside of FFA and number of offices in
college organizations. These findings indicate these leadership activities had little
influence on the amount of leadership taught in the agricultural science classroom.
Additional correlations can be found in Appendix D, Table D-4.
Professional and Civic Organization Leadership Experience
Participant experience in professional and civic organizations is shown in Table 4-
15. The number of offices held in professional education organizations ranged from zero
to 15, with an average of M=2.03 offices per instructor. Of these participants, 51.9%
(n=82) held one or more offices. Similarly, 79.2% (n=126) of the participants had
membership in at least one professional development organization, and 36.1% (n=57) of
the participants held an office in a professional development organization. When looking

69
at how many offices were held in civic organizations, 58.0% (n=91) of the participants
held one or more offices.
Table 4-14. Pearson’s Product Moment Correlations between High School and College Leadership Activities and Selected Variables (n=158)
Variable
Number of Leadership Courses in
College
Number of Offices in High
School Organizations
Number of Offices in College
Organizations Number of offices held in college
organizations 0.14 0.52* --
Leadership course taught in agricultural science program1
0.28* -0.03 0.07
Instructor leadership teaching behavior 0.22* 0.09 0.07 Three-instructor department1 0.21* 0.11 0.23* Membership in professional development
organizations 0.13 0.23* 0.14
Number of regional or state agricultural education committees participated in
-0.10 0.15 0.19*
FFA member in high school1 0.10 0.08 0.20* FFA chapter officer1 0.09 0.15 0.22* Number of workshops and seminars for
non-agriculture teachers 0.07 0.24* 0.16*
FFA officer above chapter1 -0.06 0.16* 0.31* Four or more instructor department1 -0.06 0.27* 0.10 Note. *=p<0.05; 1=Yes coded as 1, No coded as 0; 2=Males coded as 1, Females coded as 2.
Table 4-15. Number of Offices Held in Professional and Civic Organizations n M SD Minimum Maximum Number of offices in professional education
organizations 158 2.03 2.93 0 15
Membership in professional development organizations
159 2.16 1.77 0 8
Number of offices held in professional development organizations
158 0.68 1.14 0 6
Number of offices in civic organizations 157 1.65 2.52 0 17
Pearson’s Product Moment correlations, shown in Table 4-16, revealed moderate
correlations between offices in professional education organizations and number of
regional or state agricultural education committees participated in (r=0.46), years in

70
current teaching position (r=0.40), years teaching (r=0.37), number of workshops and
seminars for agriculture teachers (r=0.33), level of education (r=0.31), and age (r=0.30).
Offices in civic organizations had moderate relationships with number of offices held in
professional development organizations (r=0.38), number of leadership positions in local
school or vocational department (r=0.34), and years teaching (r=0.32).
Table 4-16. Pearson’s Product Moment Correlations Between Professional and Civic Organization Leadership Experience and Selected Variables (n=158)
Variable
Offices in Professional Education
Organizations Offices in Civic Organizations
Number of regional or state agricultural education committees participated in
0.46* 0.16*
Years in current teaching position 0.40* 0.19* Years teaching 0.37* 0.32* Number of workshops and seminars for agriculture
teachers 0.33* 0.09
Level of education 0.31* 0.16* Age 0.30* 0.25* Number of offices held in professional development
organizations 0.26* 0.38*
Number of leadership positions in local school or vocational department
0.23* 0.34*
One-instructor department1 -0.21* -0.13 Number of offices held in civic organizations 0.21* -- Number of workshops and seminars for non-agriculture
teachers 0.20* 0.20*
Gender2 0.19* 0.19* Instructor attitude towards the teaching of leadership -0.18* -0.11 Number of agricultural science instructors in school1 0.17* 0.06 Three-instructor department1 0.13 0.22* Membership in professional development organizations1 0.10 0.23* Instructor leadership teaching behavior 0.03 0.15 Note. *=p<0.05; 1=Yes coded as 1, No coded as 0; 2=Males coded as 1, Females coded as 2.
Correlations with membership in professional development organizations, as shown
in Table 4-17, revealed only low and negligible relationships. Moderate relationships
were revealed between offices in professional development organizations and number of

71
offices held in civic organizations (r=0.38), number of regional or state agricultural
education committees participated in (r=0.39), and number of leadership positions in
local school or vocational department (r=0.39).
Table 4-17. Pearson’s Product Moment Correlations Between Professional Development Organization Membership and Holding Office, and Selected Variables (n=158)
Variable
Membership in Professional Development Organizations
Offices in Professional Development Organizations
Number of workshops and seminars for agriculture teachers
0.25* 0.25*
Number of leadership positions in local school or vocational department
0.24* 0.39*
Number of offices held in high school organizations outside of FFA
0.23* 0.09
Number of offices held in civic organizations 0.23* 0.38* Number of regional or state agricultural education
committees participated in 0.21* 0.39*
Instructor leadership teaching behavior 0.20* 0.19* Bachelor degree in agricultural education1 0.18* 0.14 Instructor attitude towards the teaching of leadership 0.17* 0.11 Years in current teaching position 0.10 0.22* Number of offices held in professional education
organizations 0.10 0.26*
Years teaching 0.08 0.28* Age 0.07 0.28* Number of times attended Advisor’s Washington
Leadership Conference 0.06 0.24*
Membership in professional development organizations -- 0.50* Notes: *=p<0.05; 1=Yes coded as 1, No coded as 0.
Committee Participation, and Workshops and Seminar Presentations
Regional and state agricultural education committee participation ranged from zero
to 35 committees, with an average of M=3.67 committees (see Table 4-18) per
participant. Of the participants, 78.0% (n=124) had participated on one or more
committees. When asked about workshops and training seminars presented to agriculture
teachers, 51.9% (n=82) had conducted workshops and seminars for agriculture

72
instructors, while 54.7% (n=87) had presented workshops and seminars for non-
agriculture teachers.
Table 4-18. Mean Committee Participation, and Workshops and Seminars Presented (n=158)
M SD Minimum Maximum Number of regional and state agricultural education
committees served on 3.67 5.29 0 35
Number of workshops and seminars conducted for agriculture teachers
2.37 4.71 0 30
Number of workshops and seminars conducted for non-agriculture teachers
2.89 5.62 0 31
Table 4-19 shows correlations of selected variables with number of regional or
state agricultural education committees. A substantial relationship was found with
number of workshops and seminars for agriculture teachers (r=0.50). Moderate
relationships were found with number of offices held in professional education
organizations (r=0.46), number of offices held in professional development organizations
(r=0.39), and number of leadership positions in local school or vocational department.
Number of workshops and seminars for agriculture teachers, as shown in Table 4-
19, had moderate relationships with number of leadership positions in local school or
vocational department (r=0.49), number of workshops and seminars for non-agriculture
teachers (r=0.42). In addition, moderate relationships were found with number of times
attended Advisor’s Washington Leadership Conference (r=0.38), number of offices held
in professional education organizations (r=0.33), and years teaching in current position
(r=0.32). When correlations were conducted with number of workshops and seminars
for non-agriculture teachers, a moderate relationship was found with number of
leadership positions held in local school or vocational department (r=0.35). Additional
correlations with these variables can be found in Appendix D, Table D-3.

73
Table 4-19. Pearson’s Product Moment Correlations Between Committee Participation, and Workshops and Seminar Presentations and Selected Variables (n=158)
Variable
Number of Regional or State
Agricultural Education
Committees Participated in
Number of Workshops
and Seminars for
Agriculture Teachers
Number of Workshops
and Seminars for Non-
Agriculture Teachers
Number of workshops and seminars for agriculture teachers
0.50* -- --
Number of offices held in professional education organizations
0.46* 0.33* 0.20*
Number of offices held in professional development organizations
0.39* 0.25* 0.09
Number of leadership positions in local school or vocational department
0.32* 0.49* 0.35*
Years in current teaching position 0.29* 0.32* 0.10 Number of workshops and seminars for
non-agriculture teachers 0.21* 0.42* --
Membership in professional development organizations
0.21* 0.25* 0.13
Number of offices held in college organizations
0.19* 0.12 0.16*
Number of times attended Advisor’s Washington Leadership Conference
0.19* 0.38* 0.07
Number of offices held in civic organizations
0.16 0.09 0.20*
Note. *=p<0.05; 1=Yes coded as 1, No coded as 0.
School and Vocational Department Leadership Positions, and Attending the Advisors Washington Leadership Conference
When looking at the number of leadership positions participants have held in their
local school or vocational department, 82.9% (n=131) held leadership positions, with an
average of M=2.58 positions per participant, and a range of zero to 12 positions. In terms
of number of times attending the Advisor’s Washington Leadership Conference, 15.1%
(n=24) instructors had attended the conference (see Table 4-20).
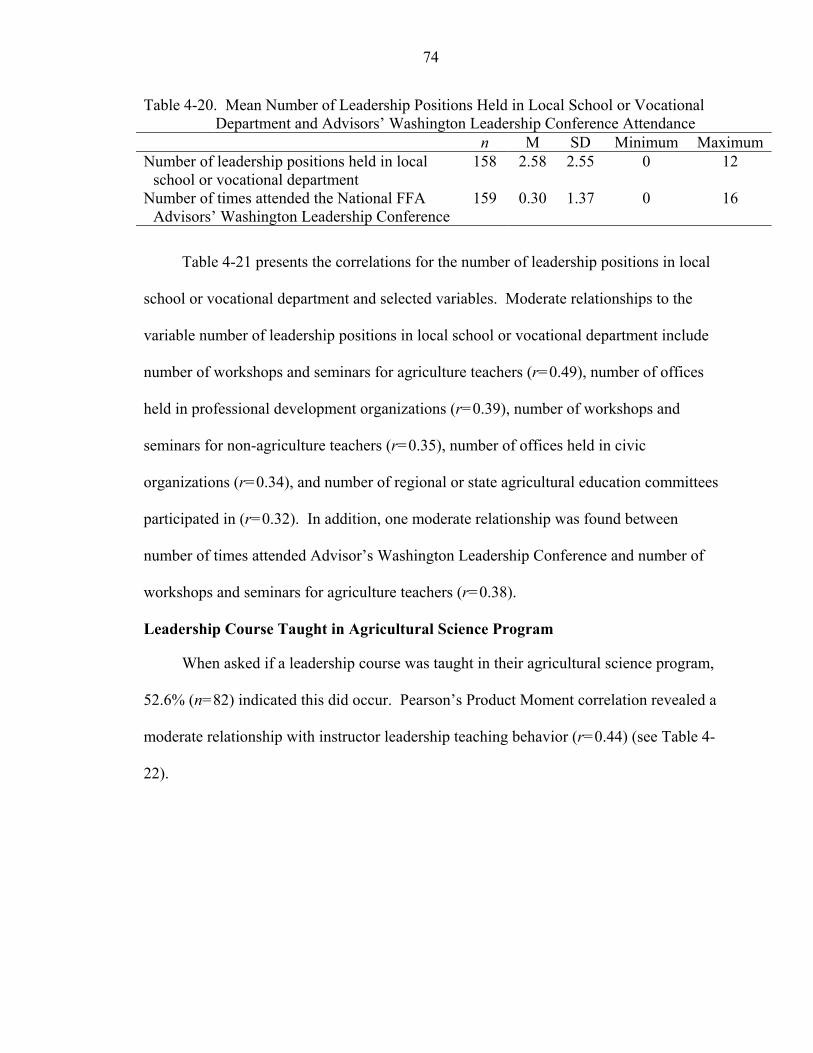
74
Table 4-20. Mean Number of Leadership Positions Held in Local School or Vocational Department and Advisors’ Washington Leadership Conference Attendance
n M SD Minimum Maximum Number of leadership positions held in local
school or vocational department 158 2.58 2.55 0 12
Number of times attended the National FFA Advisors’ Washington Leadership Conference
159 0.30 1.37 0 16
Table 4-21 presents the correlations for the number of leadership positions in local
school or vocational department and selected variables. Moderate relationships to the
variable number of leadership positions in local school or vocational department include
number of workshops and seminars for agriculture teachers (r=0.49), number of offices
held in professional development organizations (r=0.39), number of workshops and
seminars for non-agriculture teachers (r=0.35), number of offices held in civic
organizations (r=0.34), and number of regional or state agricultural education committees
participated in (r=0.32). In addition, one moderate relationship was found between
number of times attended Advisor’s Washington Leadership Conference and number of
workshops and seminars for agriculture teachers (r=0.38).
Leadership Course Taught in Agricultural Science Program
When asked if a leadership course was taught in their agricultural science program,
52.6% (n=82) indicated this did occur. Pearson’s Product Moment correlation revealed a
moderate relationship with instructor leadership teaching behavior (r=0.44) (see Table 4-
22).
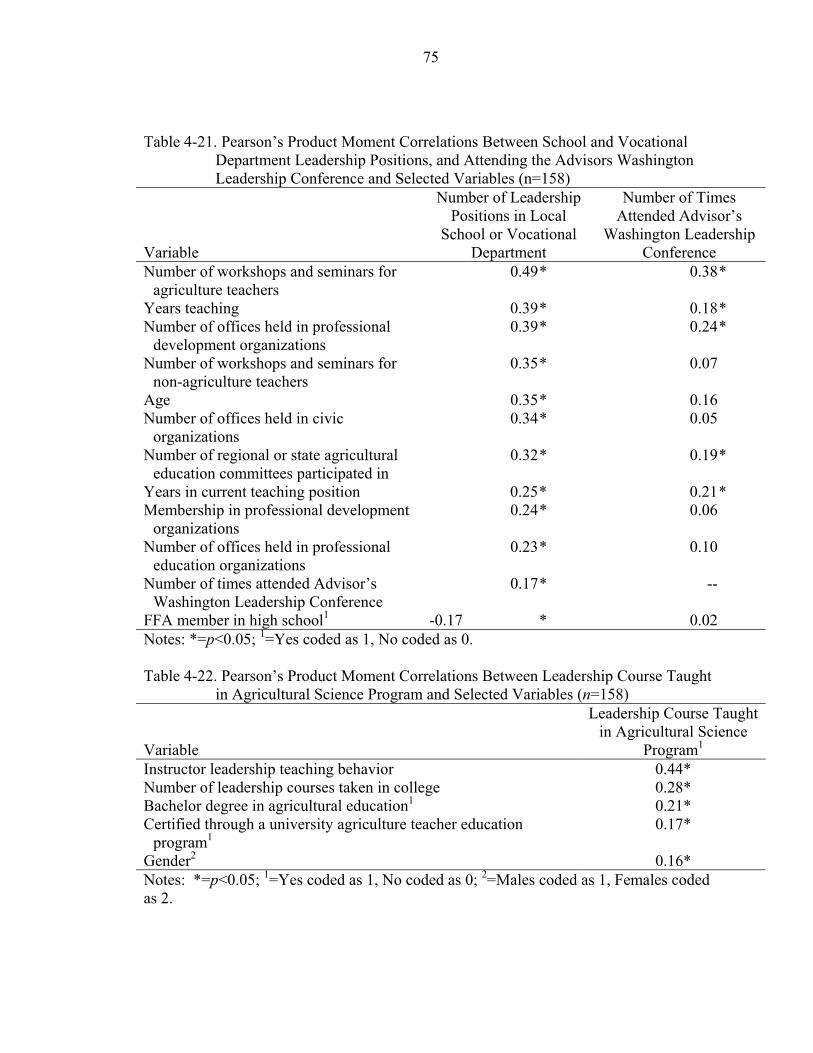
75
Table 4-21. Pearson’s Product Moment Correlations Between School and Vocational Department Leadership Positions, and Attending the Advisors Washington Leadership Conference and Selected Variables (n=158)
Variable
Number of Leadership Positions in Local
School or Vocational Department
Number of Times Attended Advisor’s
Washington Leadership Conference
Number of workshops and seminars for agriculture teachers
0.49* 0.38*
Years teaching 0.39* 0.18* Number of offices held in professional
development organizations 0.39* 0.24*
Number of workshops and seminars for non-agriculture teachers
0.35* 0.07
Age 0.35* 0.16 Number of offices held in civic
organizations 0.34* 0.05
Number of regional or state agricultural education committees participated in
0.32* 0.19*
Years in current teaching position 0.25* 0.21* Membership in professional development
organizations 0.24* 0.06
Number of offices held in professional education organizations
0.23* 0.10
Number of times attended Advisor’s Washington Leadership Conference
0.17* --
FFA member in high school1 -0.17 * 0.02 Notes: *=p<0.05; 1=Yes coded as 1, No coded as 0. Table 4-22. Pearson’s Product Moment Correlations Between Leadership Course Taught
in Agricultural Science Program and Selected Variables (n=158)
Variable
Leadership Course Taught in Agricultural Science
Program1 Instructor leadership teaching behavior 0.44* Number of leadership courses taken in college 0.28* Bachelor degree in agricultural education1 0.21* Certified through a university agriculture teacher education
program1 0.17*
Gender2 0.16* Notes: *=p<0.05; 1=Yes coded as 1, No coded as 0; 2=Males coded as 1, Females coded as 2.

76
Objective Two: Determine the Extent to which Leadership Education is being Taught in High School Agricultural Science Classrooms
Participants were asked 28 questions to determine instructor leadership teaching
behavior, that is, the extent to which leadership was being taught in the participants’
classroom. These questions, based on curriculum content areas contained in unit two of
the LifeKnowledge curriculum, were used to provide an indication of the level of
leadership instruction occurring in the classroom. These questions were reviewed by an
expert panel and pilot tested. Using a series of 28 statements, the participant was asked if
they taught leadership by indicating either yes they taught the particular concept or no
they did not teach the concept (Connors & Elliot, 1994; Rudd & Hillison, 1995). The
instrument was developed as a paper and pencil instrument (see Appendix A) and as a
web page for use on the Internet (see Appendix B). Answers for this section of the web-
based instrument were indicated by using the computer mouse to click on a “radio
button” to indicate their answer using the dichotomous scale.
Responses to these 28 statements were summated and analyzed as a construct. The
greater the number of leadership concepts taught, the greater the level of instructor
leadership teaching behavior. The average participant indicated they were formally
teaching specific lessons addressing an average of M=18.88, SD=8.21, of the 28 concepts
of leadership. The median was 20.00 with a range of zero to 28. Of these, 94.0%
(n=157) were teaching one or more specific lessons addressing these leadership concepts.
Based on responses to statements in section one of the instrument (see Appendix
A), participants taught the most lessons on the following leadership concepts: “leaders
are important,” “to identify leaders,” and “to develop a vision for the future.” Lessons

77
taught the least by the participants were “the value of having a mentor” and “to select a
mentor.”
The distribution of instructor leadership teaching behavior is shown in figure 4-5.
The distribution shows a normal curve that is skewed right. The figure reveals a group
on the left of approximately 10 participants that taught few or none of the leadership
concepts inquired about, then reveals a general increase in the frequency of leadership
concepts taught. The far right side of the figure illustrates a large group of participants
that indicated they taught all or nearly all of the leadership concepts about which the
instrument inquired.
Figure 4-5. The Distribution of Instructor Leadership Teaching Behavior
Pearson Product Moment correlations were conducted for instructor leadership
teaching behavior, shown in Table 4-23. These correlations were conducted based on the

78
explanatory variables of behavior found in previous studies (Miller, Kahler, & Rhealt,
1989; Vaughn & Moore, 2000) and the theoretical behavioral model used in this study.
Relationships with leadership teaching behavior revealed moderate correlations with
leadership course taught in agricultural science program (r=0.44), and instructor attitude
towards the teaching of leadership (r=0.38). Other correlations found, although
significant, were low. An exhaustive table of correlations with instructor leadership
teaching behavior is found in Appendix D, Table D-5.
Table 4-23. Pearson’s Product Moment Correlations Between Instructor Leadership Teaching Behavior and Selected Variables (n=156)
Variable Instructor Leadership Teaching Behavior
Leadership course taught in agricultural science program1 0.44* Instructor attitude towards the teaching of leadership 0.38* Gender2 0.23* Number of leadership courses taken in college 0.22* Instructor expectations after leadership has been taught 0.21* Membership in professional development organizations 0.20* Number of offices held in professional development organizations 0.19* Urban location of school1 0.19* Three-instructor department1 0.18* Years teaching 0.16* Note. *=p<0.05; 1=Yes coded as 1, No coded as 0; 2=Males coded as 1, Females coded as 2.
Objective Three: Based on National FFA LifeKnowledge Leadership Curriculum, Determine High School Agricultural Science Instructor Leadership Knowledge
The instructor leadership knowledge score consisted of eight multiple choice and
seven true-false questions. These questions were developed from the lesson objectives
and evaluation tools found in unit two of the LifeKnowledge curriculum. They were then
reviewed by an expert panel and pilot tested. The answers to these questions were
summated to determine a knowledge score. Scores ranged from four correct answers to

79
15 correct answers, with an average score of M=10.19, SD=1.98, and a median of 10.00
of a possible 15.
Responses to the instrument questions (see Appendix A) indicated the questions
answered correctly most frequently by the participants were, “Something that someone
wants to achieve is a: Goal,” “Delegating tasks takes more time than it saves: False,” and
“Discouragement and giving up on a project is part of being responsible and
accountable.” Questions answered incorrectly most frequently by the participants were,
“Being responsible and accountable means: Being answerable for key areas of our life
with qualified people,” “Personal self-worth is: The value I place in my own
contributions,” and “When a person has dedicated time and effort to improving
themselves (and their lives) in the areas of social/family life, work/school life, and
personal life, we call this: Balance.”
Figure 4-6 provides a visual representation of the distribution of instructor leadership
knowledge construct. The knowledge construct had a normal distribution, indicating a
majority of the participants provided answers towards the center of the scale. Based on a
similar mean (M=10.19) and median (10.00), the average level of participant leadership
knowledge could be interpreted as moderate. When Pearson’s Product Moment
correlations were conducted with instructor leadership knowledge, they revealed only
low relationships with other variables.

80
Figure 4-6. Distribution of Instructor Leadership Knowledge
Objective Four: Determine High School Agricultural Science Instructor Attitude towards Teaching Leadership
A semantic differential consisting of 12 pairs of words was used to obtain the
attitude construct. Answers from the questions were summated, with a higher score
indicating a more positive attitude toward teaching leadership. The summated answers
ranged from 25 to 72, with a median of 66.00. Participants had an average attitude score
of M=64.69, SD=6.81 out of a possible 72.
The distribution of instructor attitude toward teaching leadership is presented in
figure 4-7. The distribution is skewed to the right. Based on the participants’ attitude
mean (M=64.69) and median (66.00), the average attitude score can be interpreted as
moderate.

81
Figure 4-7. Instructor Attitude Toward Teaching Leadership.
Based on previous research (Miller, Kahler, & Rhealt, 1989; Vaughn & Moore,
2000) it was decided to conduct correlations on selected variables. Pearson’s Product
Moment correlation with instructor attitude toward teaching leadership (see Table 4-24)
revealed moderate correlations with instructor teaching behavior (r=0.38) and instructor
expectations after leadership has been taught (r=0.34).
Table 4-24. Pearson’s Product Moment Correlations Between Instructor Attitude Towards Teaching Leadership and Selected Variables (n=158)
Variable
Instructor Attitude Towards Teaching
Leadership Instructor leadership teaching behavior 0.38* Instructor expectations after leadership has been taught 0.34* Certified through a university agriculture teacher education program1 0.16* Notes: *=p<0.05; 1=Yes coded as 1, No coded as 0.

82
Objective Five: Determine the Expectations that High School Agricultural Science Instructors have of the Agriculture Students after Leadership has been Taught
The instructor expectations after leadership has been taught consisted of 22
dichotomous questions, the answers of which were summated to form a construct. The
expectation questions were based on the leadership concepts in unit two of the
LifeKnowledge curriculum. Higher scores indicated higher instructor expectations of
students after teaching leadership. The range of summated answers ranged from four to
22 with a median of 18.00. The expectation average score was M=17.45, SD=3.92 out of
a possible 22.
Based on responses to section two of the questionnaire (see Appendix A),
participants responded “yes” most frequently to the following statements: “After my
students learn about self-worth I would expect students to have greater confidence in
their own ideas,” “After my students learn about leaders I would expect students to
identify ways they can lead others,” and “After my students learn about goals I would
expect students to demonstrate how to prioritize personal goals.” Statements that
participants responded “no” to most frequently were, “After my students learn about
mentors I would expect students to set an appointment with their mentor,” “After my
students learn about personal values I would expect students to write a set of standards by
which they will evaluate decisions,” and “After my students learn about vision I would
expect students to create a vision that others can see and internalize.”
The distribution of instructor expectations after leadership has been taught is shown
in Figure 4-8, showing a distribution skewed right. When the mean (M=17.45) and
median (18.00) of the distribution are taken into consideration, the average participant
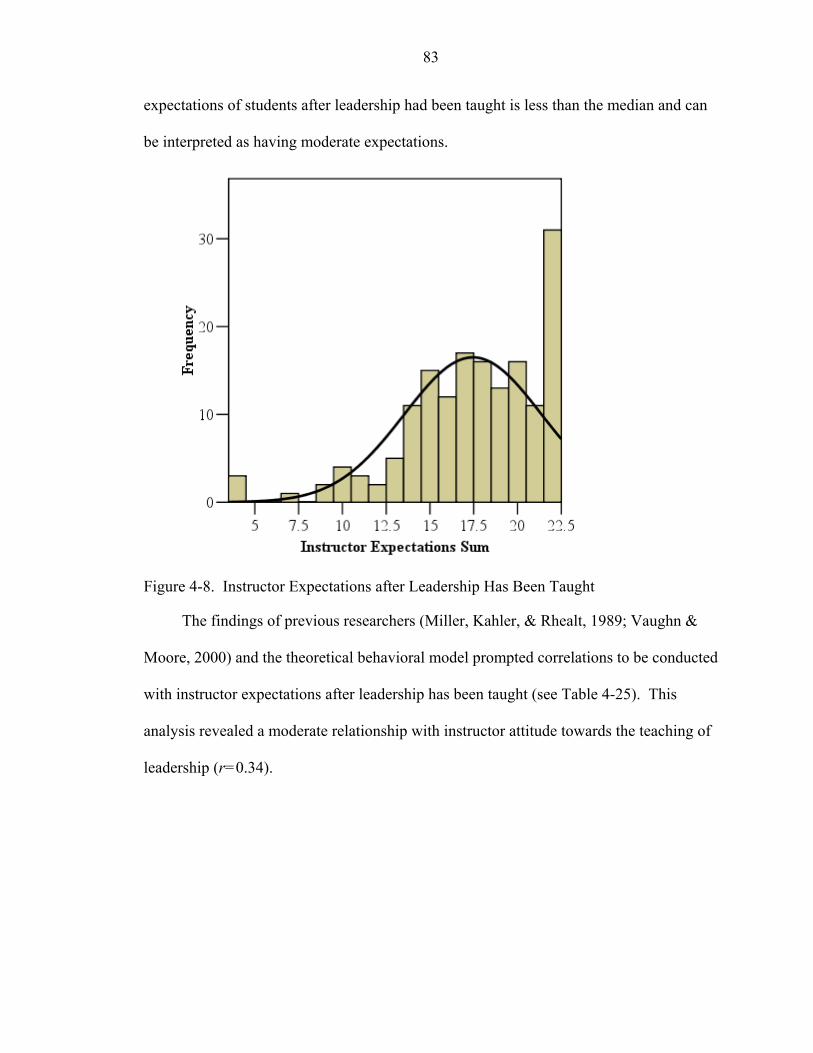
83
expectations of students after leadership had been taught is less than the median and can
be interpreted as having moderate expectations.
Figure 4-8. Instructor Expectations after Leadership Has Been Taught
The findings of previous researchers (Miller, Kahler, & Rhealt, 1989; Vaughn &
Moore, 2000) and the theoretical behavioral model prompted correlations to be conducted
with instructor expectations after leadership has been taught (see Table 4-25). This
analysis revealed a moderate relationship with instructor attitude towards the teaching of
leadership (r=0.34).

84
Table 4-25. Pearson’s Product Moment Correlations Between Instructor Expectations after Leadership has been Taught and Selected Variables (n=157)
Variable
Instructor Expectations after Leadership
Instruction Instructor attitude towards the teaching of leadership 0.34* Instructor leadership teaching behavior 0.21* Bachelor degree in agricultural education 0.20* Number of offices held in high school organizations outside of FFA
0.19*
Certified through a university agriculture teacher education program
0.17*
Notes: *=p<0.05; 1=Yes coded as 1, No coded as 0.
Objective Six: Determine the Relationship between High School Agricultural Science Instructor Leadership Knowledge, Instructor Attitude Towards Teaching Leadership, Instructor Expectations of Students after Teaching Leadership, and
Instructor Demographics to Instructor Leadership Teaching Behavior
Correlations
A Pearson’s Product Moment Correlation table was constructed using the
demographic variables, including the dummy coded variables, instructor leadership
knowledge score, and the constructs of instructor leadership teaching behavior, instructor
expectations after leadership has been taught, and instructor attitude towards teaching
leadership. The significant correlations for these variables in relation to instructor
leadership teaching behavior are provided in Table 4-23 and an exhaustive list is found in
Appendix D, Table D-5.
The variables with significant correlation to the construct of behavior were
leadership course taught in agricultural science program (dummy coded) (r=0.44),
instructor attitude towards the teaching of leadership (r=0.38), gender (dummy coded)
(r=0.23), number of leadership courses taken in college (r=0.22), instructor expectations
after leadership has been taught (r=0.21), number of offices held in professional

85
development organizations (r=0.20), membership in professional development
organizations (r=0.20), urban location of school (dummy coded) (r=0.19), three-
instructor department (dummy coded) (r=0.18), and years teaching (r=0.16). These
variables were then placed into SPSS® 12.0 for Windows to develop an explanatory
regression model.
The variables leadership course taught in agricultural science program, urban
location of school, gender, and instructor attitude towards the teaching of leadership,
were included in the model that best explained total variance in agricultural science
instructor leadership teaching behavior. Regression analysis revealed that this model
significantly explained 33% of the variance in instructor leadership teaching behavior, the
dependent variable.
Regression
Backwards regression was chosen because it is most appropriately used when the
research goal is primarily exploratory (Gliem, 2003). Using backwards multiple
regression techniques, a significant explanatory model was developed with a R-square
value of 0.35 and an adjusted R-square value of 0.33, F(4,145)=19.15, p<0.05. This
model used the explanatory variables leadership course taught in agricultural science
program, urban location of school, gender, and instructor attitude towards the teaching of
leadership. Unstandardized regression coefficients (B), intercept, and standardized
regression coefficients (β) for each variable are presented in Table 4-26.

86
Table 4-26. Backward Regression Explaining Leadership Teaching Behavior (n=145) B SE Beta t Sig.
(Constant) -11.79 5.64 -- -2.09 0.04
Leadership course taught in agricultural science program
6.12 1.16 0.37 5.28 0.00
Instructor attitude towards the teaching of leadership 0.38 0.09 0.30 4.39 0.00
Gender 3.37 1.29 0.18 2.62 0.01
Urban location of school 4.75 1.84 0.18 2.58 0.01
Note: F(4,145)=19.15, p<0.00, Adjusted R2=0.33
The explanatory model produced by regression analysis is presented in Figure 4-9.
This model illustrates that instructor leadership teaching behavior is a function of if a
leadership course is taught in the high school agricultural science program, instructor
attitude toward the teaching of leadership, gender, and urban location of school.
Figure 4-9. Explanatory Model of Instructor Leadership Teaching Behavior
Within this model gender is coded as 1=male and 0=female. Because it seemed
unlikely that the gender of the instructor would directly affect the teaching of leadership,
that is instructor leadership teaching behavior, statistical analyses using crosstabs were
conducted on the data to determine if other variables were influencing gender.
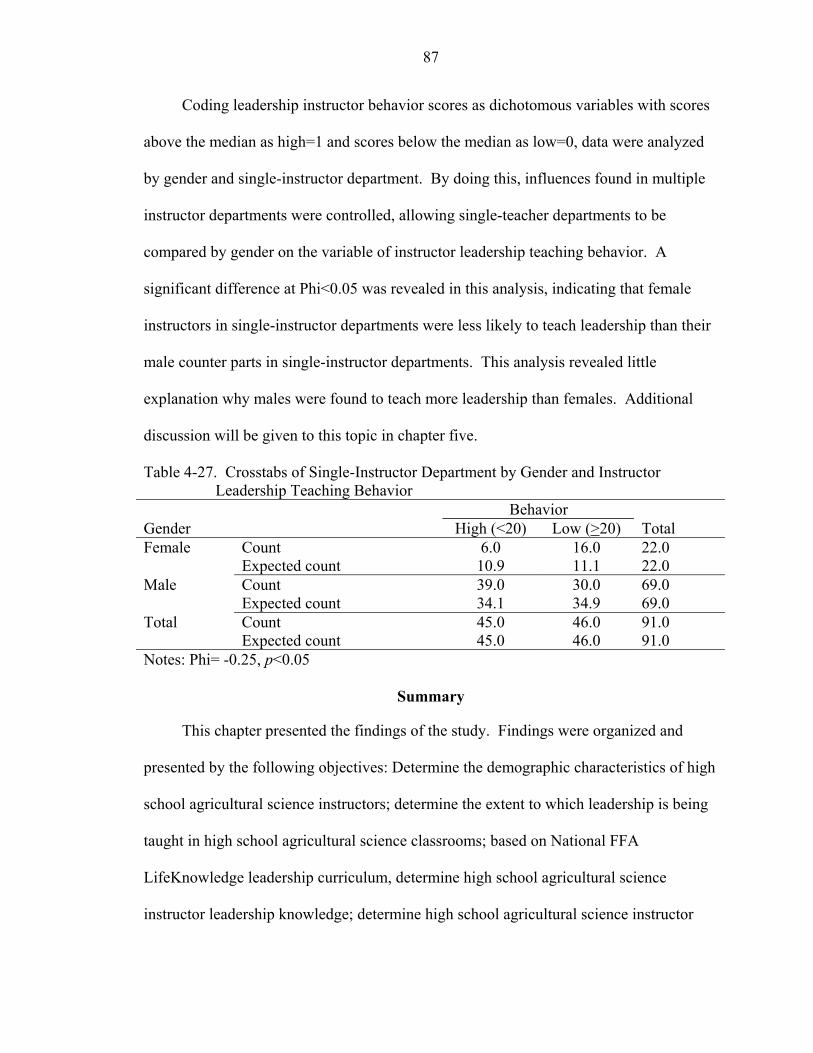
87
Coding leadership instructor behavior scores as dichotomous variables with scores
above the median as high=1 and scores below the median as low=0, data were analyzed
by gender and single-instructor department. By doing this, influences found in multiple
instructor departments were controlled, allowing single-teacher departments to be
compared by gender on the variable of instructor leadership teaching behavior. A
significant difference at Phi<0.05 was revealed in this analysis, indicating that female
instructors in single-instructor departments were less likely to teach leadership than their
male counter parts in single-instructor departments. This analysis revealed little
explanation why males were found to teach more leadership than females. Additional
discussion will be given to this topic in chapter five.
Table 4-27. Crosstabs of Single-Instructor Department by Gender and Instructor Leadership Teaching Behavior
Behavior Gender High (<20) Low (>20) Total Female Count 6.0 16.0 22.0 Expected count 10.9 11.1 22.0 Male Count 39.0 30.0 69.0 Expected count 34.1 34.9 69.0 Total Count 45.0 46.0 91.0 Expected count 45.0 46.0 91.0 Notes: Phi= -0.25, p<0.05
Summary
This chapter presented the findings of the study. Findings were organized and
presented by the following objectives: Determine the demographic characteristics of high
school agricultural science instructors; determine the extent to which leadership is being
taught in high school agricultural science classrooms; based on National FFA
LifeKnowledge leadership curriculum, determine high school agricultural science
instructor leadership knowledge; determine high school agricultural science instructor

88
attitude towards teaching leadership; determine the expectations that high school
agricultural science instructors have of the agriculture students after leadership has been
taught; and determine the relationship between high school agricultural science instructor
leadership knowledge, instructor attitude towards leadership, instructor expectations of
students, and instructor demographics to instructor leadership teaching behavior.
Chapter 5 will present a more detailed discussion of the findings. Conclusions and
recommendations will also be presented.

CHAPTER 5 DISCUSSION
The purpose of this study was to determine the extent to which high school
agricultural science instructors are currently teaching leadership in formal agricultural
science classrooms and to explain what influences agricultural science instructors to
teach leadership in the classroom. To accomplish this, a modified version of the Triandis
(1971) behavioral model was used, which incorporates knowledge, attitude and
expectations to explain behavioral outcomes. Specifically this study sought to:
• Determine the demographic characteristics of high school agricultural science instructors;
• determine the extent to which leadership is being taught in high school agricultural science classrooms;
• based on National FFA LifeKnowledge leadership curriculum, determine high school agricultural science instructor leadership knowledge;
• determine high school agricultural science instructor attitude towards teaching leadership;
• determine the expectations that high school agricultural science instructors have of the agriculture students after leadership has been taught; and
• explain the relationship between high school agricultural science instructor leadership knowledge, high school agricultural science instructor attitude towards teaching leadership, high school agricultural science instructor expectations of students, and high school agricultural science instructor demographics in light of high school agricultural science instructor leadership content area teaching behavior.
Chapter two reviewed previous research conducted about youth leadership and
provided a theoretical framework around which this research is framed. Chapter three
89

90
described the research methods used in this study. Chapter four reported the findings of
this study.
This chapter will present a more detailed discussion of the findings. Conclusions
and recommendations will also be presented. For the benefit for the reader, a brief
summary of the problem statement, methods, and findings are also included.
Problem Statement
The extent to which leadership is being taught in agricultural science classrooms is
unknown and the attributes of agricultural science instructors that influence their decision
to formally teach leadership are unclear. Research has been conducted to determine
predictors of agricultural science program quality (Vaughn & Moore, 2000) and how
leadership skills affect youth (Carter & Spotanski, 1989; Dormody & Seevers, 1994a;
Ricketts & Newcomb, 1984; Rutherford et al., 2002; Scanlon & Burket, 1986; Townsend
& Carter, 1983) and community (Brannon, Holley & Key, 1989) but no research has been
conducted to determine the extent to which leadership is being taught in the formal
secondary agricultural science classroom or why instructors choose to teach leadership.
The following research questions were posited: To what extent are high school
agricultural science instructors teaching leadership in the formal classroom and what are
the factors that influence high school agricultural science instructors to teach, or not
teach, leadership?
Review of Research Design
The study was conducted using survey research. A correlational and ex post facto
design was employed. A correlational design involves the collection of two or more sets
of data from a group of subjects with the attempt to determine the subsequent relationship
between those sets of data (Tuckman, 1994). Ex post facto is a study in which the

91
researcher examines the effects of a naturally occurring treatment after the treatment has
occurred. The researcher relates the after-the-fact treatment to an outcome or dependent
measure (Tuckman, 1994).
The dependent variable measured was instructor behavior as determined by the
level of formal leadership instruction taught in the agricultural science classroom.
Independent variables measured were instructor leadership knowledge, instructor attitude
towards teaching leadership, instructor expectations after teaching leadership to students,
and instructor demographics. The measures of instructor behavior, instructor knowledge
and instructor expectations were developed using lesson objectives in unit two of the
LifeKnowledge curriculum (National FFA Organization, 2003).
Summary of Results
Objective One
Objective one sought to determine the demographic characteristics of high school
agricultural science instructors. Of the participants in this study, 73.1% (n=114) were
male. The age of the participants ranged from 23 to 61, with an average age of 39.37
years. The number of years teaching for participants ranged from one to 38, with an
average of 14.85 years. The number of years teaching in their current position ranged
from one to 34, with an average of 10.61 years. The number of agriculture instructors at
the school ranged from one to six, with an average of 1.56 instructors.
When participants were asked to describe the location of the community in which
their school was located, 73.4% taught in a rural community, 16.2% taught in a suburban
community, and 10.4% taught in an urban community.
Of the participants in this study, 1.9% had less than a bachelor’s degree, 47.5% had
a bachelor’s degree, 50.6% had a master’s degree and 96.8% had been certified through a

92
university agriculture teacher education program. Most participants (85.4%) stated their
bachelor’s degree was in agricultural education.
Many participants were an FFA member in high school (86.1%), an FFA chapter
officer, (75.9%), and some (33.1%) had been an officer above the chapter level. Most
(74.1%) participants held offices outside of FFA. Participants took an average of 1.67
leadership courses in college, 73.1% had taken one or more college leadership courses,
and 67.3% held office in a college student organization.
Fifty-one percent (51%) of the participants held an office in a professional
education organization, 58.0% held an office in civic organizations, 79.2% were
members of a professional development organization, and 36.1% had held office in a
professional development organization.
Regional and state agricultural education committee participation ranged from zero
to 35 committees, with 78.0% having participated on one or more committees. Many
(51.9%) had conducted workshops and seminars for agriculture instructors, while 54.7%
had presented workshops and seminars for non-agriculture teachers. In addition, 82.9%
of the participants held leadership positions held in their local school or vocational
department, while 15.1% (n=24) had attended the Advisor’s Washington Leadership
Conference, and 52.6% indicated there was a leadership course taught in their agricultural
science program.
Objective Two
Objective two sought to determine the extent to which leadership content areas
are being taught in agricultural science classrooms. Participants were asked 28 questions
to determine instructor leadership teaching behavior based on the National FFA
LifeKnowledge curriculum. Each question asked if the participant formally taught a
93
specific lesson topic that addressed a particular concept of leadership. The answers to
these questions were summated. The average participant indicated they were formally
teaching specific lessons addressing an average of 18.88 leadership concepts. Of these,
94.0% were teaching one or more specific lessons addressing these leadership concepts.
Objective Three
The purpose of objective three was to determine the level of leadership knowledge
based on the National FFA’s LifeKnowledge curriculum. The instructor leadership
knowledge score consisted of eight multiple choice and seven true-false questions. The
answers to these questions were summated to determine a knowledge score. Scores
ranged from four correct answers to 15 correct answers, with an average score of 10.19
out of 15.
Objective Four
Objective four sought to determine high school agricultural science instructor
attitude towards teaching leadership. A semantic differential consisting of 12 pairs of
words was used to obtain the attitude construct. Answers from the questions were
summated, with a higher score indicating a more positive attitude. The summated
answers ranged from 25 to 72, with an average of 64.69 out of 72.
Objective Five
The purpose of objective five was to determine the expectations that high school
agricultural science instructors have of the agriculture students after leadership has been
taught. The expectation construct consisted of 22 questions based on the National FFA
LifeKnowledge curriculum, the answers of which were summated. Higher scores
indicated higher expectations of students after teaching leadership. The range of
94
summated answers was 4 to 22 with an average expectation score of 17.45 out of a
possible 22.
Objective Six
Objective six sought to determine the relationship between high school agricultural
science instructor leadership knowledge, instructor attitude towards teaching leadership,
instructor expectations of students after teaching leadership, and instructor demographics
to instructor leadership teaching behavior. For statistical analysis, all dichotomous
variables were coded as dummy variables. Using Pearson’s Product Moment correlation,
correlations between the construct of instructor leadership teaching behavior and the
variables studied were determined. Significant correlations were found with the
following variables: gender, construct of instructor expectations of students after
leadership has been taught, construct of instructor attitude toward teaching leadership,
membership in professional development organizations, number of offices held in
professional development organizations, if a leadership course was taught in their
agricultural science program, number of leadership courses taken in college, years
teaching, urban school location, and the dummy coded variable three-instructor
department. These variables were then used to develop an explanatory regression model.
Using backwards stepwise multiple regression techniques, a significant explanatory
model was developed with a R-square value of 0.35 and an adjusted R-square value of
0.33, F(4,145)=11.96, p<0.05. This model used the explanatory variables if a leadership
course was taught in the agricultural science program, the construct of attitude toward
teaching leadership, gender, and urban school location to explain instructor leadership
teaching behavior.

95
Conclusions
This study randomly selected agricultural science instructors from throughout the
United States to participate in this study. Therefore, the results of this study should not
be generalized beyond the population of United Stated high school agricultural science
instructors during the 2003-2004 school year. With this limitation in mind, the following
conclusions were drawn from the findings of the study:
• The average agricultural science instructor is well established in their career, at 39.37 years of age, having taught for 14.85 years, and has been teaching in their current position for 10.61 years.
• Most agricultural science instructors are male, teach in a rural location, are in a single-teacher department, received their certification through a university agriculture teacher program, and earned their bachelors of science degree in agricultural education.
• FFA participation is a common theme among instructors who responded, as most agricultural science instructors were an FFA member in high school, an FFA chapter officer, and held at least one office in another high school organization outside of FFA.
• Most instructors sampled have limited formal preparation in leadership with most agricultural science instructors having taken at least one leadership course in college.
• Instructors surveyed have a great deal of informal leadership experience with most participants having leadership roles beyond their teaching responsibilities.
• The demographic characteristics of agricultural science instructors that teach in rural areas differ from the demographic characteristics of agricultural science instructors in urban areas.
• Females and males differ in their leadership experiences.
• Based on the National FFA LifeKnowledge curriculum, some leadership is being taught in most participants’ agricultural science classrooms.
• Based on the National FFA LifeKnowledge curriculum, the average participant has a moderate level of leadership knowledge.
• Most participants have a positive attitude towards the teaching of leadership.
96
• Based on the National FFA LifeKnowledge curriculum, most participants have positive expectations of students after leadership has been taught.
• Teaching a leadership course in the agricultural science program, being in an urban location, gender, and the instructor having a positive attitude toward student actions after leadership was taught are the variables that best explained leadership teaching behavior.
Discussion and Implications
Objective One: Determine the Demographic Characteristics of High School Agricultural Science Instructors
The average agricultural science instructor is 39.37 years old, has been teaching for 14.85 years, and has been teaching in their current position for 10.61 years
Based on the demographic information collected in this study, the average
agricultural instructor is 39.37 years old. This is similar to the findings of Dormody,
Seevers and Clason (1996). Their national study found the mean age of agriculture
teachers to be 40.2 years of age. Whent (1994) found in her national study that the mean
age of teachers was 37.6 years. This information shows that the average age of
agricultural science instructors in the profession has changed very little over the past 10
years.
Likewise, the average instructor has been teaching for 14.85 years and has been
teaching in their current position for 10.61 years. This is similar to what Thobega and
Miller (2003) found in Iowa and what Dormody, Seevers and Clason (1996) found in a
national study. Iowa agriculture instructors had 14 years teaching experience and
Dormody et al. found the mean numbers of years teaching to be 14.1 nationally. In
addition, Dormody et al. (1993) found the average number of years teaching to be 14.5.
These findings illustrate the number of years teaching for agriculture instructors has
remained consistent during the past ten years.

97
This study found that the average teacher has been in their current teaching position
for 10.61 years. This is less than what has been reported in other studies. Odell,
Cochran, Lawrence and Garton (1990) in their regional study reported the number of
years in their current teaching position to be 15.5 years and a state study by Vaughn and
Moore (2000) stated the number of years teaching in current position was 13.1. It would
seem as though the findings of this study indicate a decrease in the number of years that
instructors have taught in their current position. This may indicate that instructors are
becoming transient in their teaching positions than in years past. Due to the response rate
of this study, and the corresponding sampling error, additional research should be
conducted to determine if this observed decline in years teaching in current position is a
trend.
Most agricultural science instructors are male, teach in a rural location, are in a single teacher department, received their certification through a university agriculture teacher program, and earned their bachelor’s of science degree in agricultural education
This study found that the majority (73.1%) of agriculture instructors are male. This
finding is similar to a study of Virginia agriculture instructors by Duncan (2004) in which
he found that 67.0% of Virginia’s agriculture instructors are male. However, this finding
is different from the findings of other national studies. Dormody (1993) found that
93.4% of the agriculture instructors were male, and Dormody, Seevers and Clason (1996)
discovered that 95% of agriculture instructors were male and 5% were female. Although
the majority of agriculture instructors in this study are male, these findings seem to
indicate a trend over the last 10 years in an increase of the number of female agriculture
instructors teaching high school agricultural science.

98
Most agriculture programs are in rural areas (73.4%), with 16.2% located in
suburban areas, and 10.4% in urban areas. Other studies have found that 75.2% of the
agriculture programs are in rural areas (Odell et al., 1990) . This study found that urban
programs show a stronger, positive relationship to instructor teaching behavior. This may
be due in part to the nature of the urban programs. Trede and Russell (1999) found that
many urban programs teach courses in areas such as biotechnology rather than in
production agriculture. More discussion of this topic is found later in this chapter in the
section addressing objective two of the study.
Most instructors are in a single-instructor department (59.0%), and many are in
two-instructor departments (32.1%). This is similar to Croom’s (2003) national study
and nearly identical to the North Carolina study by Vaughn and Moore (2000). Croom
found that agriculture instructors in the Southeastern United States were predominantly in
single-instructor departments (42%) and many were in two-instructor departments (38%).
Vaughn and Moore (2000) determined that 57.3% of the instructors were in single-
instructor departments and 31.2% of the instructors were in two-instructor departments.
However, these findings are different from the national study by Dormody et al. (1996),
in which single-instructor departments made up 76.0% of the participants and two-
instructor departments made up 20.0% of the participants. There is some discrepancy
between these studies. This could be attributed to the time between each study. In the
time since the Dormody et al. study was conducted, it appears that the number of single-
instructor departments have decreased, while at the same time an increase has occurred in
the number of two-instructor departments. If this is the case, then a trend exists towards
multiple-instructor departments.

99
When the variable number of instructors in each agricultural science department
was dummy coded as dichotomous variables, participants in three-instructor departments
were found to have a significant relationship with instructor leadership teaching behavior.
These results indicate participants in three-instructor departments were more likely to
teach leadership in the classroom than participants in departments with fewer or more
instructors. Perhaps multiple instructor departments have the flexibility to teach a wider
variety of subjects, including leadership, than do single-instructor departments, and if so,
an valiant effort should be made to equip these instructors with the resources in the
LifeKnowledge curriculum.
Certification from a university agriculture teacher certification program was
prevalent (96.8%) in this study. Although this study did not inquire if participants were
certified through an alternative means, there has been some concern about alternatively
certified teachers entering the agricultural education discipline. Yet this study indicates
that a strong majority of agriculture instructors are traditionally certified.
A significant correlation emerged between participant certification from a
university agriculture teacher certification program and teaching a leadership course in
their agricultural science program. This indicates that participants who were certified
through a university agriculture teacher education program had a greater propensity to
teach leadership courses than participants who had not been certified through a university
agricultural education program.
At the same time, most teachers received their bachelor degree in agricultural
education (85.4%). This is similar to findings of Croom (2003), in which 86.7% of the
instructors from the Southeastern region of the United States earned their bachelor degree

100
in agricultural education. This finding emphasizes the potential influence that university
teacher education programs have on the secondary agriculture education discipline.
University agriculture teacher education programs have the opportunity to influence the
future of agricultural education based on the experiences and training they provide for
pre-service instructors. This includes encouraging pre-service instructors to use specific
curriculums, such as LifeKnowledge.
Two significant correlations were found between the variable participants who
received their bachelor degree in agricultural education and the variables of high school
FFA membership and holding an FFA chapter office. These findings reveal participants
that earned a bachelor degree in agricultural education were more likely to have
participated in FFA as a high school student. This may have implications for student
recruitment into the agriculture teacher pre-service program.
Instructors in teaching in urban locations were less likely to have participated in FFA as a high school student
Negative correlations emerged between school location and the variables of FFA
member in high school and FFA chapter officer. These relationships show that as the
school location became more urban, the participants were less likely to have been an FFA
member in high school or to have held an FFA chapter office. It may be that instructors
that have not participated in FFA activities are drawn to suburban and urban agricultural
science programs. Combined with the earlier finding that urban programs have a stronger
relationship to instructor leadership teaching behavior, these findings suggest that urban
high school agriculture instructors, with less FFA experience, teach more leadership than
do their counterparts from non-urban locations with more FFA experience. More
research should be conducted to investigate these findings.
101
Most agricultural science instructors were an FFA member in high school, an FFA chapter officer, and held at least one office in other high school organization outside of FFA
Most instructors were an FFA member in high school (86.1%) and an FFA chapter
officer (72.3%). These findings are similar to those found by Vaughn and Moore (2000)
who found 73.2% of the instructors in North Carolina were an FFA member and 62.4%
were an FFA chapter officer. These findings indicate that a high percentage of
agriculture instructors were involved in FFA as a high school student. The enjoyment of
FFA participation may lead some students into the profession of becoming an agriculture
instructor.
Because only a few FFA members have the opportunity to hold office above the
chapter level, it comes as little surprise that 31.0% of the participants were officers above
the chapter level. Vaughn and Moore (2000) found similar results (29.9%) in their study.
However, participants that were an officer above the chapter level were more likely to
hold office in other high school organizations and in college organizations. Perhaps the
officer experiences in high school prepared these participants for officer roles in FFA
positions above chapter level and college organizations.
Many participants (69%) held one or more offices in high school organizations
other than FFA. This finding is similar to the findings of Vaughn and Moore (2000) who
determined that 62.4 % of the instructors in their state study held offices in high school
organizations other than FFA. Significant correlations found with number of offices held
in high school organizations outside of FFA included the variables number of offices held
in college organizations, membership in professional development organizations, and
number of agricultural education committees served on at the regional and state level.
From these findings, it appears that holding an office in high school organizations outside

102
of FFA is a predictor of college organization involvement. In addition, holding office in
high school organizations outside of the FFA may provide a foundation that fosters
participation in professional development organizations and on committees.
These findings lead the researcher to conclude that although agricultural science
instructors have taken advantage of leadership opportunities in their youth, as evidenced
from the number of instructors who have held offices in youth organizations, this
leadership experience has negligible influence on their leadership teaching behavior. The
question for future research becomes why do these experiences not have a greater affect
on agricultural science instructor leadership teaching behavior? A broader question that
needs to be addressed is do these leadership experiences during youth have an impact on
leadership skills as an adult?
Most agricultural science instructors took at least one leadership course in college and were an officer in at least one college organization
Learning about leadership appears to have appeal to agricultural science instructors,
as two-thirds (67.8%) of them have taken at least one leadership course in college, with
many taking two (22.6%), and three (9.7%) courses. When correlated with instructor
leadership teaching behavior, this relationship proved to be significant and positive. Also
of interest is the significant, positive correlation between number of leadership courses
taken in college and a leadership course taught in the agricultural science program. These
positive relationships may be due to an increased level of leadership knowledge provided
from the college courses (Cruickshank, 1990). More research should be conducted to
fully investigate these relationships.
In addition, significant positive correlations were found between number of
leadership courses taken in college, and the variables suburban school location and
103
instructor teaching in a three-instructor department. This interesting finding demands
additional research. One possible explanation is that instructors that take leadership
courses in college have well-developed interpersonal skills, as might be taught in college
leadership courses, which allows them to effectively work in multiple-instructor
departments.
The trend of agricultural instructors holding leadership positions in youth
organizations continued into college with 67.3% of the participants holding at least one
office in a college organization, while some participants held as many as 15 offices. An
earlier study (Vaughn & Moore, 2000) found only 51% of the participants held office.
Relationships with number of offices held in college organizations revealed participants
who held offices in college organizations had significant, positive correlations with the
variables committee membership and with working in a three-instructor department.
Perhaps participation as an officer in college organizations provides the skills required for
committee involvement and for working in a multiple-instructor department. These
relationships deserve additional research so they may be fully understood.
Most participants were active in leadership roles beyond their teaching responsibilities
Most participants were active in some form of leadership role, such as holding
leadership positions in the local school or vocational department (82.9%), membership in
professional development organizations (79.2%), and participating on regional and state
agricultural education committees (78.0%). These findings are quite different from an
earlier study (Vaughn & Moore, 2000) in which 64.3% held positions in the local school
or vocational department, 16.6% were members of professional development
organizations, and 71.3% participated on regional and state agricultural education

104
committees. These findings suggest that leadership activity has increased, however other
explanations may include differences between state and national studies.
Significant relationships with number of leadership positions in the local school
and vocational department occurred between many variables. Number of offices held in
professional education organizations, number of offices held in civic organizations,
membership in professional development organizations, number of offices held in
professional development organizations, number of state and regional agricultural
education committees served on, number of workshops and seminars presented for
agriculture teachers, and number of workshops and seminars presented for non-
agriculture teachers all had significant relationships with number of leadership positions
in the local school and vocational department. This indicates that instructors are involved
in a number of leadership positions, and may benefit from leadership instruction so they
may carry out their responsibilities effectively.
In addition, many of these variables had significant relationships with each other.
Number of offices held in professional education organizations had significant
relationships with number of offices held in civic organizations, number of offices in held
in professional development organizations, number of regional or state agricultural
education committees participated in, number of workshops and seminars for agriculture
teachers, and number of workshops and seminars for non-agriculture teachers. Number
of offices in civic organizations had significant relationships with membership in
professional development organizations, number of offices held in professional
development organizations, number of regional or state agricultural education committees
participated in, and number of workshops and seminars for non-agriculture teachers.
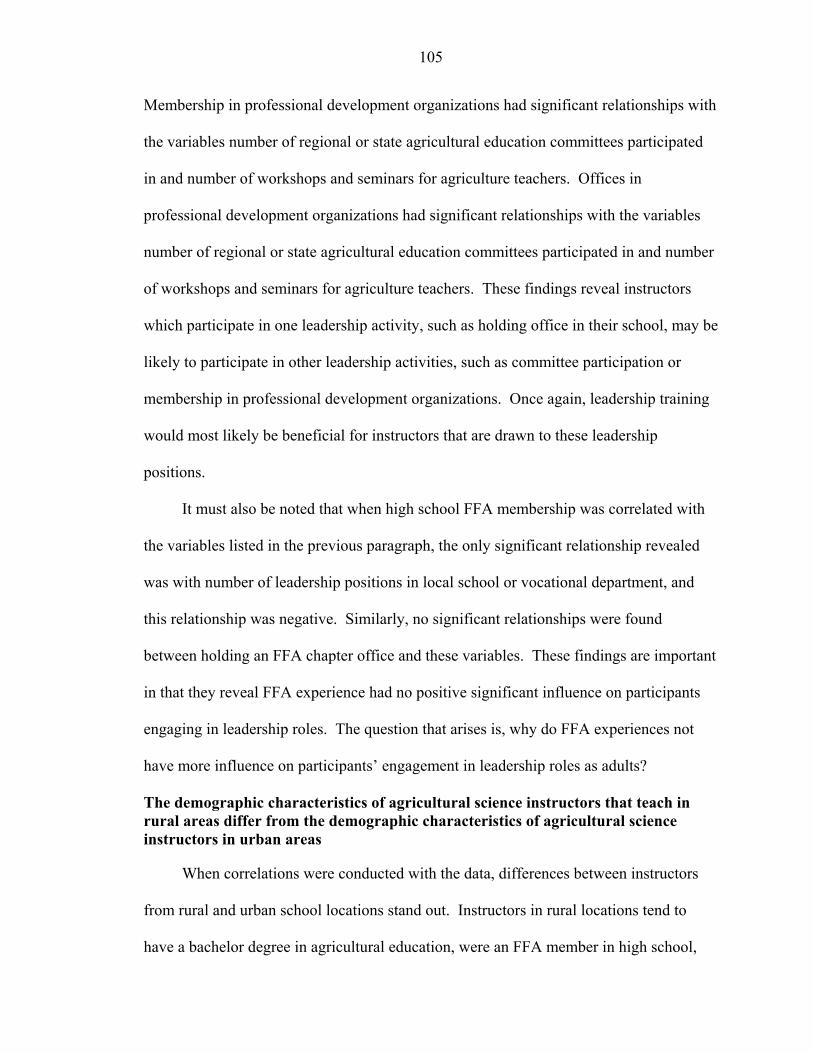
105
Membership in professional development organizations had significant relationships with
the variables number of regional or state agricultural education committees participated
in and number of workshops and seminars for agriculture teachers. Offices in
professional development organizations had significant relationships with the variables
number of regional or state agricultural education committees participated in and number
of workshops and seminars for agriculture teachers. These findings reveal instructors
which participate in one leadership activity, such as holding office in their school, may be
likely to participate in other leadership activities, such as committee participation or
membership in professional development organizations. Once again, leadership training
would most likely be beneficial for instructors that are drawn to these leadership
positions.
It must also be noted that when high school FFA membership was correlated with
the variables listed in the previous paragraph, the only significant relationship revealed
was with number of leadership positions in local school or vocational department, and
this relationship was negative. Similarly, no significant relationships were found
between holding an FFA chapter office and these variables. These findings are important
in that they reveal FFA experience had no positive significant influence on participants
engaging in leadership roles. The question that arises is, why do FFA experiences not
have more influence on participants’ engagement in leadership roles as adults?
The demographic characteristics of agricultural science instructors that teach in rural areas differ from the demographic characteristics of agricultural science instructors in urban areas
When correlations were conducted with the data, differences between instructors
from rural and urban school locations stand out. Instructors in rural locations tend to
have a bachelor degree in agricultural education, were an FFA member in high school,

106
were an FFA chapter officer, were an FFA chapter above the chapter level, teach in a
single-instructor department, and are less likely to present workshops for non-agriculture
teachers.
In contrast, instructors in urban schools tend to not have a bachelor degree in
agricultural education, were not an FFA member in high school, were not a chapter
officer, are more likely to present workshops to non-agriculture teachers, and were more
likely to teach leadership.
This is an interesting finding with possible implications when we begin to consider
pre-service instructor programs that are preparing students to teach in urban locations, in
particular the lack of FFA experience that appears with instructors in urban programs and
the additional interest in leadership instruction.
Females and males differ in their leadership experiences
The leadership experiences of females and males differ. Significant relationships
occurred between females and number of offices in high school organizations other than
FFA and number of offices in college organizations. In contrast, males had significant
relationships between the number of offices in professional education organizations, and
the number of offices in civic organizations. These findings show the females tend to be
more involved in high school organizations other than FFA and college organizations,
while males tend to be more involved in professional education organizations and civic
organizations. Questions that require further inquiry are: why are females drawn to
leadership roles in high school and college organizations; and why do males tend to
obtain leadership positions in professional and civic organizations?

107
There are significant age differences between genders
Of the participants in this study that indicated gender, 42 (26.9%) stated they were
female and 114 (73.1%) indicated they were male. When an independent groups t-test
was conducted to determine if significant differences existed between gender within
variables, 12 variables proved to have significant differences at the alpha 0.05 level.
Four of these variables were discussed in the previous section: number of offices held in
high school organizations other than FFA, number of offices in college organizations,
number of offices in professional education organizations, and number of offices in civic
organizations.
Of particular interest within these significant variables are the variables that address
time. For age the female average was 32.71 years old, and the male average was 41.73
years old. These averages reveal a 9.02 year age difference between female and male
participants. Similarly, years teaching had a difference of 9.75 years between genders,
with females having an average of 7.62 years teaching and males with 17.37 years
teaching. Years in current position revealed an average for females of 5.29 years, and an
average of 12.64 years for males, with a difference between the genders of 7.35 years.
These findings may be caused by late entrance of females into the field of agricultural
education (Foster, 2001). Further examination should be conducted to understand why
these differences exist.
Objective Two: Determine the Extent to which Leadership Education is being Taught in High School Agricultural Science Classrooms
Based on the National FFA LifeKnowledge Curriculum, leadership is being taught in most agricultural science classrooms
Overall 92.9% of the participants are teaching at least one of the surveyed
leadership concepts in their classroom, with an average of 18.73 surveyed leadership
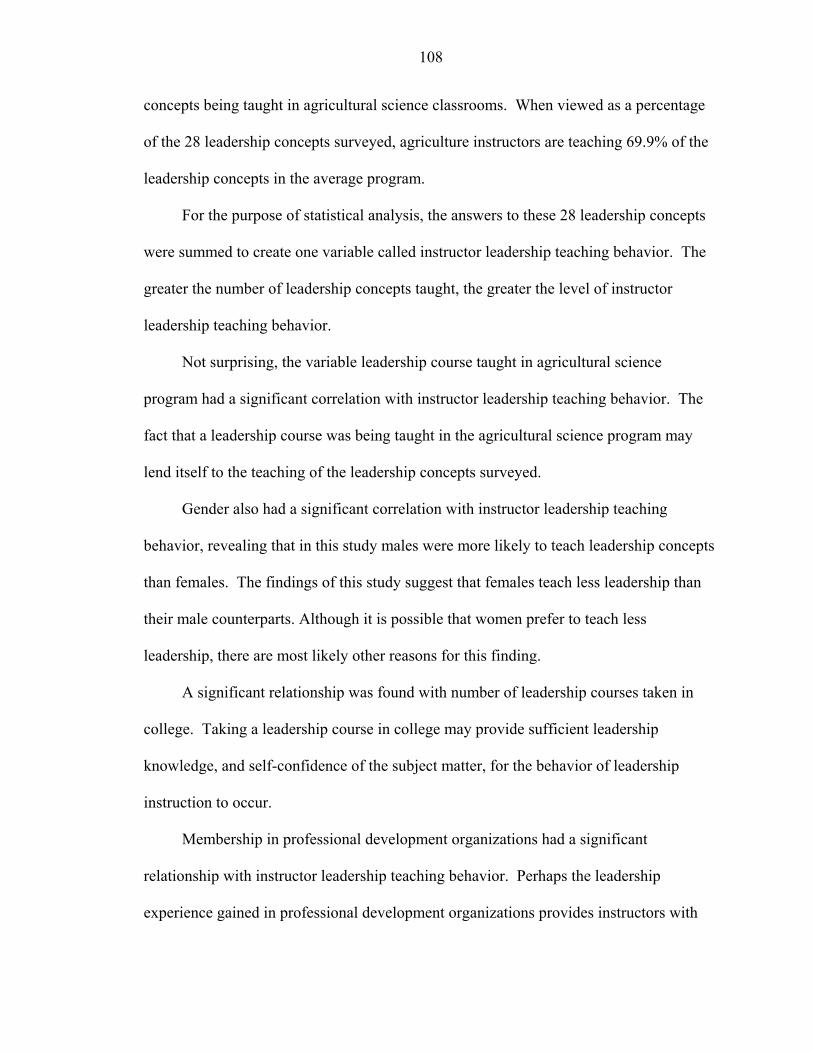
108
concepts being taught in agricultural science classrooms. When viewed as a percentage
of the 28 leadership concepts surveyed, agriculture instructors are teaching 69.9% of the
leadership concepts in the average program.
For the purpose of statistical analysis, the answers to these 28 leadership concepts
were summed to create one variable called instructor leadership teaching behavior. The
greater the number of leadership concepts taught, the greater the level of instructor
leadership teaching behavior.
Not surprising, the variable leadership course taught in agricultural science
program had a significant correlation with instructor leadership teaching behavior. The
fact that a leadership course was being taught in the agricultural science program may
lend itself to the teaching of the leadership concepts surveyed.
Gender also had a significant correlation with instructor leadership teaching
behavior, revealing that in this study males were more likely to teach leadership concepts
than females. The findings of this study suggest that females teach less leadership than
their male counterparts. Although it is possible that women prefer to teach less
leadership, there are most likely other reasons for this finding.
A significant relationship was found with number of leadership courses taken in
college. Taking a leadership course in college may provide sufficient leadership
knowledge, and self-confidence of the subject matter, for the behavior of leadership
instruction to occur.
Membership in professional development organizations had a significant
relationship with instructor leadership teaching behavior. Perhaps the leadership
experience gained in professional development organizations provides instructors with
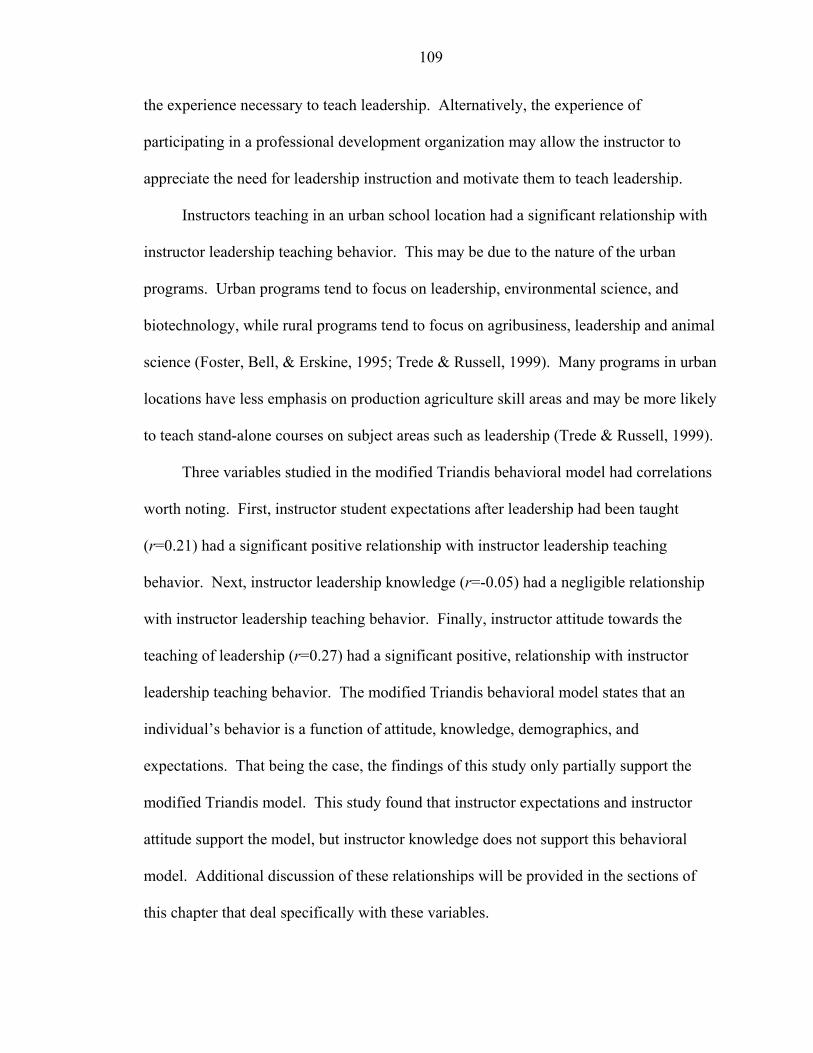
109
the experience necessary to teach leadership. Alternatively, the experience of
participating in a professional development organization may allow the instructor to
appreciate the need for leadership instruction and motivate them to teach leadership.
Instructors teaching in an urban school location had a significant relationship with
instructor leadership teaching behavior. This may be due to the nature of the urban
programs. Urban programs tend to focus on leadership, environmental science, and
biotechnology, while rural programs tend to focus on agribusiness, leadership and animal
science (Foster, Bell, & Erskine, 1995; Trede & Russell, 1999). Many programs in urban
locations have less emphasis on production agriculture skill areas and may be more likely
to teach stand-alone courses on subject areas such as leadership (Trede & Russell, 1999).
Three variables studied in the modified Triandis behavioral model had correlations
worth noting. First, instructor student expectations after leadership had been taught
(r=0.21) had a significant positive relationship with instructor leadership teaching
behavior. Next, instructor leadership knowledge (r=-0.05) had a negligible relationship
with instructor leadership teaching behavior. Finally, instructor attitude towards the
teaching of leadership (r=0.27) had a significant positive, relationship with instructor
leadership teaching behavior. The modified Triandis behavioral model states that an
individual’s behavior is a function of attitude, knowledge, demographics, and
expectations. That being the case, the findings of this study only partially support the
modified Triandis model. This study found that instructor expectations and instructor
attitude support the model, but instructor knowledge does not support this behavioral
model. Additional discussion of these relationships will be provided in the sections of
this chapter that deal specifically with these variables.

110
Objective Three: Based on National FFA LifeKnowledge Leadership Curriculum, Determine High School Agricultural Science Instructor Leadership Knowledge
Based on the National FFA LifeKnowledge Curriculum, the average participant has a moderate level of leadership knowledge.
Of the 15 questions asked to assess instructor leadership knowledge, the average
instructor answered 10.19 questions correctly, equating to 67.9% correct. When using
the median (10.00) as a dividing point for determining low and high knowledge, the mean
(10.19) level of instructor knowledge may be considered moderate. If the knowledge
scores are viewed as percentages it could be said that scores ranged from 27% correct to
100% correct, illustrating that some instructors have a great deal of leadership
knowledge, while other instructors may benefit from some professional development in
leadership. For instructors to teach a particular curriculum there must be a critical level
of familiarity and knowledge with the subject matter for the instructor to feel comfortable
teaching the curriculum (Cruickshank, 1990).
More information may be revealed when viewing specific question which the
instructors most frequently and least frequently scored correctly. Responses to the
instrument questions (see Appendix A) indicated the questions answered correctly most
frequently by the participants were, “Something that someone wants to achieve is a:
Goal,” “Delegating tasks takes more time than it saves: False,” and “Discouragement and
giving up on a project is part of being responsible and accountable: False.” Questions
answered incorrectly most frequently by the participants were, “Being responsible and
accountable means: Being answerable for key areas of our life with qualified people,”
“Personal self-worth is: The value I place in my own contributions,” and “When a person
has dedicated time and effort to improving themselves (and their lives) in the areas of
social/family life, work/school life, and personal life, we call this: Balance.” This
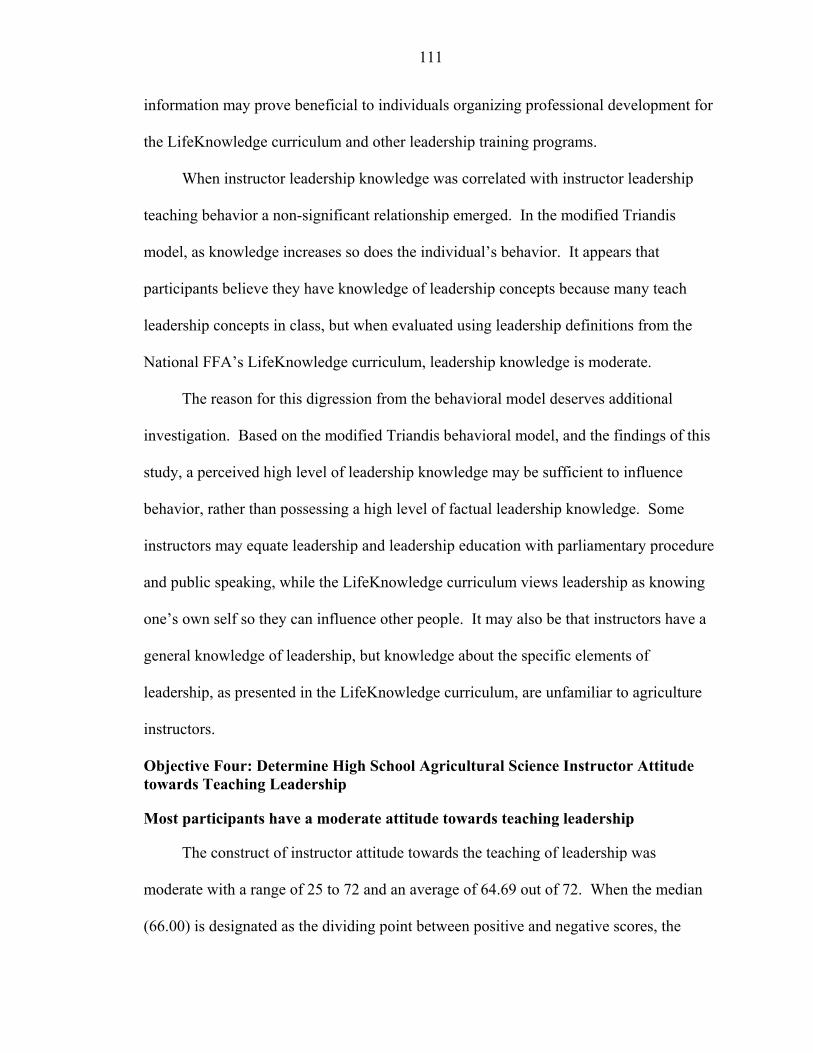
111
information may prove beneficial to individuals organizing professional development for
the LifeKnowledge curriculum and other leadership training programs.
When instructor leadership knowledge was correlated with instructor leadership
teaching behavior a non-significant relationship emerged. In the modified Triandis
model, as knowledge increases so does the individual’s behavior. It appears that
participants believe they have knowledge of leadership concepts because many teach
leadership concepts in class, but when evaluated using leadership definitions from the
National FFA’s LifeKnowledge curriculum, leadership knowledge is moderate.
The reason for this digression from the behavioral model deserves additional
investigation. Based on the modified Triandis behavioral model, and the findings of this
study, a perceived high level of leadership knowledge may be sufficient to influence
behavior, rather than possessing a high level of factual leadership knowledge. Some
instructors may equate leadership and leadership education with parliamentary procedure
and public speaking, while the LifeKnowledge curriculum views leadership as knowing
one’s own self so they can influence other people. It may also be that instructors have a
general knowledge of leadership, but knowledge about the specific elements of
leadership, as presented in the LifeKnowledge curriculum, are unfamiliar to agriculture
instructors.
Objective Four: Determine High School Agricultural Science Instructor Attitude towards Teaching Leadership
Most participants have a moderate attitude towards teaching leadership
The construct of instructor attitude towards the teaching of leadership was
moderate with a range of 25 to 72 and an average of 64.69 out of 72. When the median
(66.00) is designated as the dividing point between positive and negative scores, the

112
mean score (64.69) may be interpreted as moderate. The correlation of this variable to
instructor leadership teaching behavior was significant and positive.
As mentioned previously, the modified Triandis model uses attitude as a predictor
of behavior. This study validated that attitude is positively correlated with behavior and
reinforces the importance attitude has on behavior. This finding supports Fishbein and
Ajzen (1975), “attitude toward the behavior is often related to performance of the
behavior.” This also reveals that high school agricultural science instructors with a
positive attitude toward teaching leadership may be more inclined to teach leadership.
Additionally, a significant positive correlation was found between instructor
attitude toward teaching leadership and instructor expectations after leadership has been
taught. This relationship helps to support the modified Triandis model, illustrating that
an increase in attitude coincides with an increase in expectations.
Number of offices held in professional education organizations proved to be a
negative relationship with instructor attitude towards the teaching of leadership.
Although holding office in a professional education organization may at times be a
challenging leadership experience, it may also be rewarding. This interesting finding
deserves further investigation to fully understand the relationship.
Objective Five: Determine the Expectations that High School Agricultural Science Instructors have of the Agriculture Students after Leadership has been Taught
Based on the National FFA Life Knowledge Curriculum, most participants have moderate positive expectations of students after leadership has been taught
Of the 22 questions used to determine instructors expectations of students, the
participant’s responses ranged from 4 to 22, with an average of 17.45. If the mean is
viewed as a percentage of the number of questions asked, then participants agreed with
80% of the expectations. When the median (18.00) is defined as the dividing point

113
between positive and negative expectations, the mean (17.45) reveals moderate
participant expectations of students after leadership instruction.
Specific responses to expectation statements from section two of the questionnaire
(see Appendix A), reveal participants responded “yes” most frequently to the following
statements: “After my students learn about self-worth I would expect students to have
greater confidence in their own ideas,” “After my students learn about leaders I would
expect students to identify ways they can lead others,” and “After my students learn
about goals I would expect students to demonstrate how to prioritize personal goals.”
Statements that participants responded “no” to most frequently were, “After my students
learn about mentors I would expect students to set an appointment with their mentor,”
“After my students learn about personal values I would expect students to write a set of
standards by which they will evaluate decisions,” and “After my students learn about
vision I would expect students to create a vision that others can see and internalize.” This
information may be beneficial to individuals planning professional development
workshops for the LifeKnowledge curriculum or other leadership training. Areas in
which instructors responded most frequently may not need to be addressed in training,
while areas with lower response frequencies may need additional training in order that
instructors may see how leadership training can prepare students to accomplish these
activities.
Participant answers to these 22 questions were summated for statistical analysis.
When instructor expectations were correlated with instructor leadership teaching
behavior the relationship was significant. This finding supports the modified Triandis
model and the work of other researchers (Fishbein et al., 1991), that a person’s

114
expectations of the results of a behavior influence their performance of that behavior. In
this case, instructors who expected students to benefit from leadership instruction were
more likely to teach leadership in the classroom.
Other significant correlations with the variable expectations of instructor after
leadership has been taught include the variables certified through a university agricultural
teacher certification program, number of offices held in high school organizations other
than FFA, instructor attitude toward the teaching of leadership, and teaching in a three-
instructor department. The relationship with number of offices held in high school
organizations other than FFA may illustrate that participants see a value in their high
school leadership experience, and believe that leadership instruction will benefit others.
The correlation with instructor attitude toward teaching leadership helps to support the
theory of the modified Triandis model that expectations and attitude influence behavior.
The relationship with teaching in a three-instructor department may support previous
findings in this study that participants in multiple-instructor departments have time to
pursue leadership activities and therefore may see benefits of leadership instruction,
resulting in high student expectations.
Objective Six: Determine the Relationship between High School Agricultural Science Instructor Leadership Knowledge, Instructor Attitude towards Teaching Leadership, Instructor Expectations of Students after Teaching Leadership, and Instructor Demographics to Instructor Leadership Teaching Behavior
Leadership course taught in agricultural science program, urban location of school, gender, and instructor attitude toward the teaching of leadership are the variables that best explained leadership teaching behavior
The variables leadership course taught in agricultural science program, urban
location of school, gender, and instructor attitude towards the teaching of leadership were
included in the model that best explained total variance in agricultural science instructor

115
leadership teaching behavior. Regression analysis revealed that this model significantly
explained 33% of the variance in instructor leadership teaching behavior, the dependent
variable. Although explaining 33% of the variance is laudable, 67% still remains
unexplained, allowing room for additional research in this area.
Based on this information, the best predictor of instructor leadership teaching
behavior is if a leadership course is currently being taught in the agricultural science
program. This would appear to be an expected finding, except for two relevant facts.
First, the social norm is leadership consists of activities such as teaching parliamentary
procedure and attending the state FFA convention, yet these were not the items measured
to determine instructor leadership teaching behavior. The behavior construct used in the
questionnaire asked instructors if instructors were teaching leadership concepts as
leadership is defined in the LifeKnowledge curriculum, which does not include the social
norms. This finding reveals that instructors teaching a leadership course in the
agricultural science classroom were teaching leadership concepts similar to those found
in the LifeKnowledge curriculum.
In this study, instructor attitude was an explanatory variable of leadership teaching
behavior. This illustrates the importance of a moderate to positive attitude toward
teaching leadership before leadership instruction will occur.
Gender was also an explanatory variable in this model, revealed that male
participants in this study were more likely to teach leadership than female participants.
Crosstabs was conducted to attempt to gain a further understanding of this relationship,
but no additional information was revealed. There may be a number of explanations for
this occurrence. It may be that female instructors in multiple instructor departments do

116
not have the opportunity teach courses that allow leadership concepts to be taught.
Perhaps the locations at which female participants teach do not allow the flexibility for
the incorporation of leadership concepts into the courses. Based on the findings of the
study only speculative answers can be gleaned. The finding of this relationship raise a
number of questions that require further research to fully understand. One question to be
addressed is what courses are these female agriculture instructors teaching, and how do
these courses compare to their male counterparts.
Finally, urban location of school was an explanatory variable in this study. Based
on the findings of this study we have gained some insight into the demographic
differences between urban and rural agriculture instructors, but do not have sufficient
information to fully understand why urban location has such explanatory power. More
research should be undertaken to better understand this relationship.
Recommendations
Based upon the findings and conclusions of this study, the following
recommendations were made:
• Teacher preparation institutions should modify their programs to address the changing demographics of agricultural educators. Specifically, programs should address the growing number of female instructors and the increase in multi-instructor departments.
• The findings of this study suggest that teacher preparation institutions should be prepared to provide additional FFA training to pre-service instructors desiring to teach in an urban location. The findings of this study indicate that a larger percentage of instructors teaching in urban locations have limited FFA experience.
• Teacher preparation institutions have the potential to influence the adoption of the LifeKnowledge curriculum and should provide pre-service instructors with LifeKnowledge curriculum training so they will be prepared to teach leadership in agricultural science classrooms. Approximately 85% of high school agricultural science instructors graduated from a university agriculture teacher education program, indicating that these university programs, through pre-service training, can influence a majority of the instructors in the profession.
117
• FFA experiences should be reviewed and modified so youth may acquire skills that will encourage them to engage in leadership activities as an adult. The findings of this study indicate that high school FFA experiences have little influence on adult leadership involvement.
• Because enrollment in a college leadership course was positively related to leadership instruction, it is recommended that pre-service instructors be encouraged to take a leadership course so they will be better prepared to teach leadership concepts as an instructor.
• Because involvement in professional development organizations was related to leadership instruction and other leadership activities, it is recommended that agricultural science instructors be encouraged to become a member of a professional development organization. Through participation in these organizations instructors will have the opportunity to develop skills that allow them to advance professionally, develop a network of professionals outside of the education profession, and educate others about agricultural education.
• Since instructors are teaching leadership with a moderate amount of leadership knowledge, leadership professional development programs should be offered to increase instructor leadership knowledge. The results of the knowledge component of the instrument used in this study may be beneficial for developing these programs.
Suggestions for Additional Research
Based upon the findings and conclusions of this study, the following suggestions
for additional research were made:
• Because of the changing demographics of agriculture instructors, a census study should be conducted to determine current demographic characteristics of instructors, and to determine if any trends exist.
• Determine why certain demographic characteristics influence the amount of leadership instruction. Specifically, determine why gender and urban school location influence leadership instruction in agricultural science classrooms.
• This study found that activity in professional education organizations had a negative affect on the participants’ attitude towards teaching leadership. Additional research should be conducted to understand this relationship.
• Because of the differences of the leadership experiences between genders, additional research should be conducted to determine why males and females participate in different leadership organizations.

118
• Because participants’ leadership knowledge scores based on the LifeKnowledge curriculum were moderate, additional research should be conducted to determine the knowledge instructors have related to leadership and how instructors define leadership.
• In order to better prepare agricultural science instructors to teach leadership, a study should be conducted to determine what leadership knowledge and skills a secondary agricultural education student should have upon graduation.
• Because of the relationships found with youth leadership activities and adult leadership engagement, research should be conducted to determine how youth leadership experiences impact adult leadership skills and leadership engagement. Specifically, determine why participant’s past FFA experiences have little influence on leadership activity.
• Based on the modified Triandis behavioral model, further research should be conducted to determine why neither knowledge nor expectations were a function of behavior in this study.
• Because this study was conducted using only unit two of the LifeKnowledge curriculum, it is recommended that similar studies be conducted to explain teaching behavior for units one, three, four, and five of the Life Knowledge curriculum.
• A follow-up study should be conducted after five years of LifeKnowledge curriculum dissemination to determine if there is a change in instructor leadership teaching behavior
APPENDIX A PAPER INSTRUMENT
Figure A-1. Questionnaire Cover
119
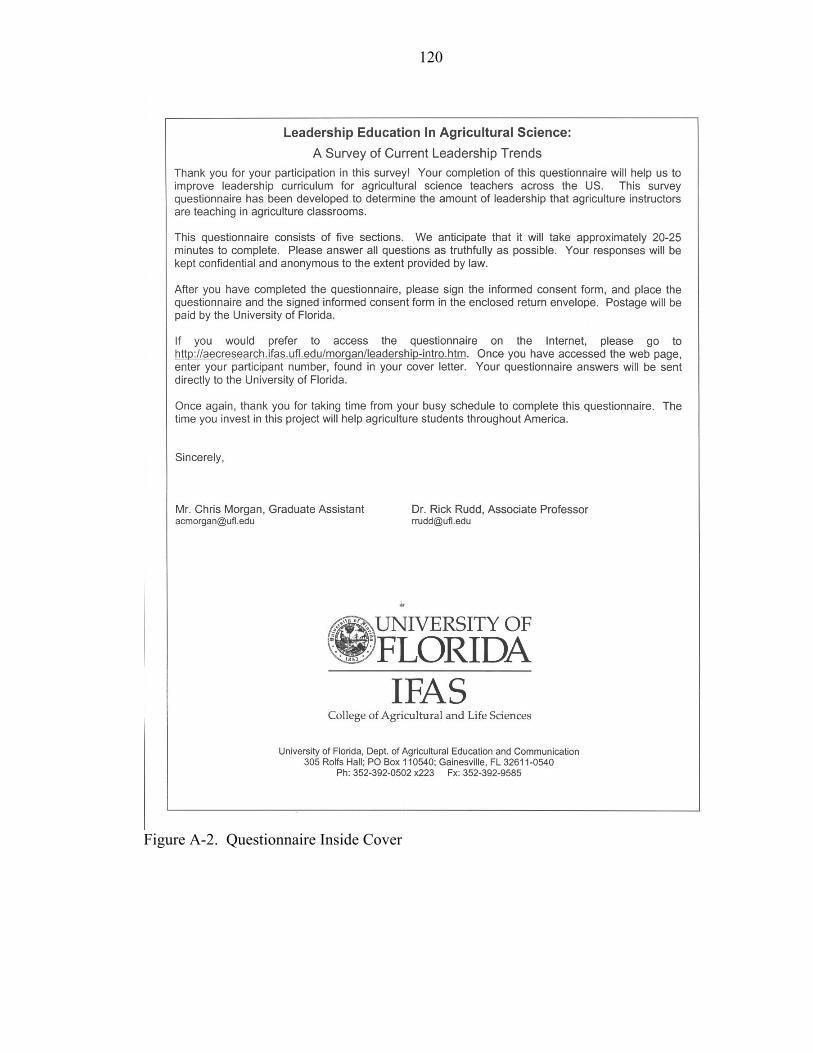
120
Figure A-2. Questionnaire Inside Cover

121
Figure A-3. Questionnaire Section I

122
Figure A-4. Questionnaire Section II
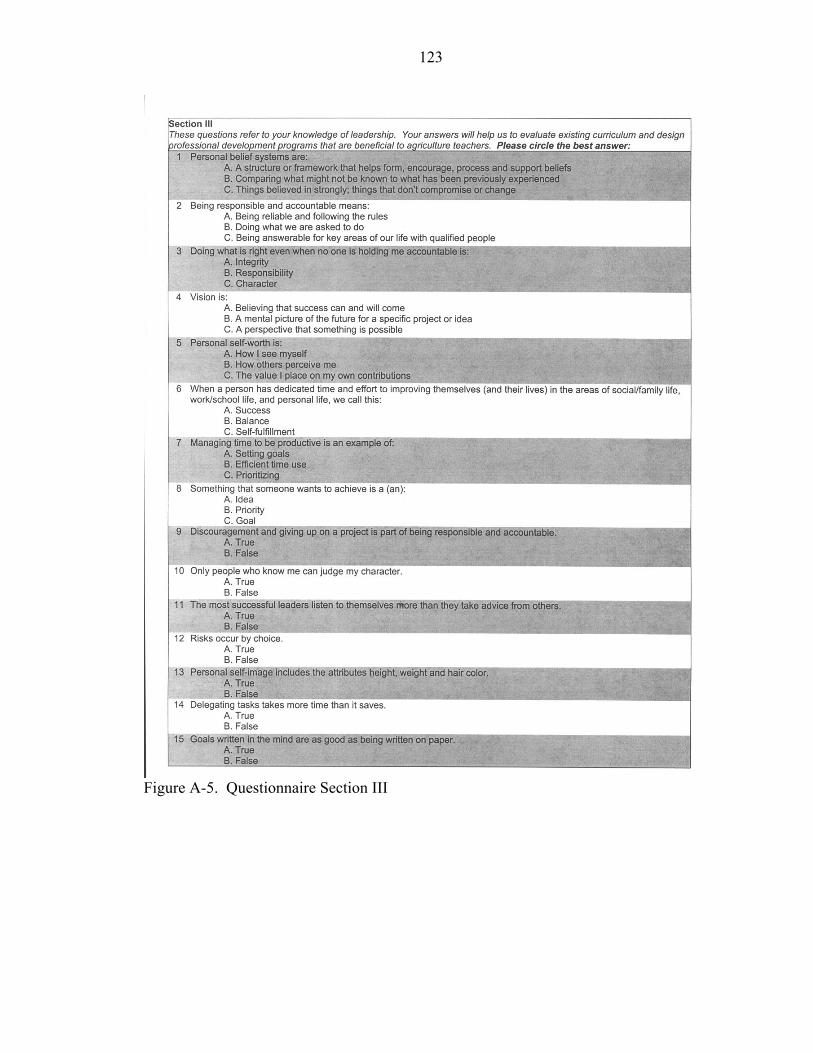
123
Figure A-5. Questionnaire Section III

124
Figure A-6. Questionnaire Sections IV and V
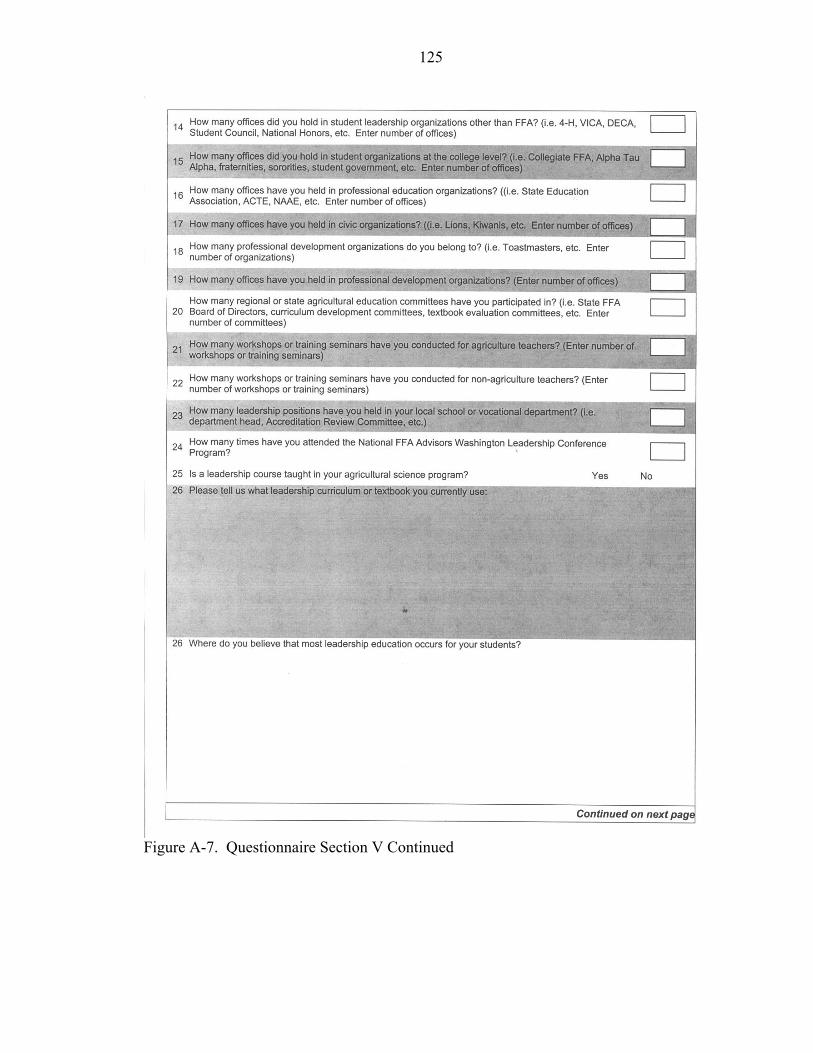
125
Figure A-7. Questionnaire Section V Continued

126
Figure A-8. Questionnaire Qualitative Questions

APPENDIX B INTERNET INSTRUMENT
Figure B-1. Screen Capture of the Introductory Web Page
127
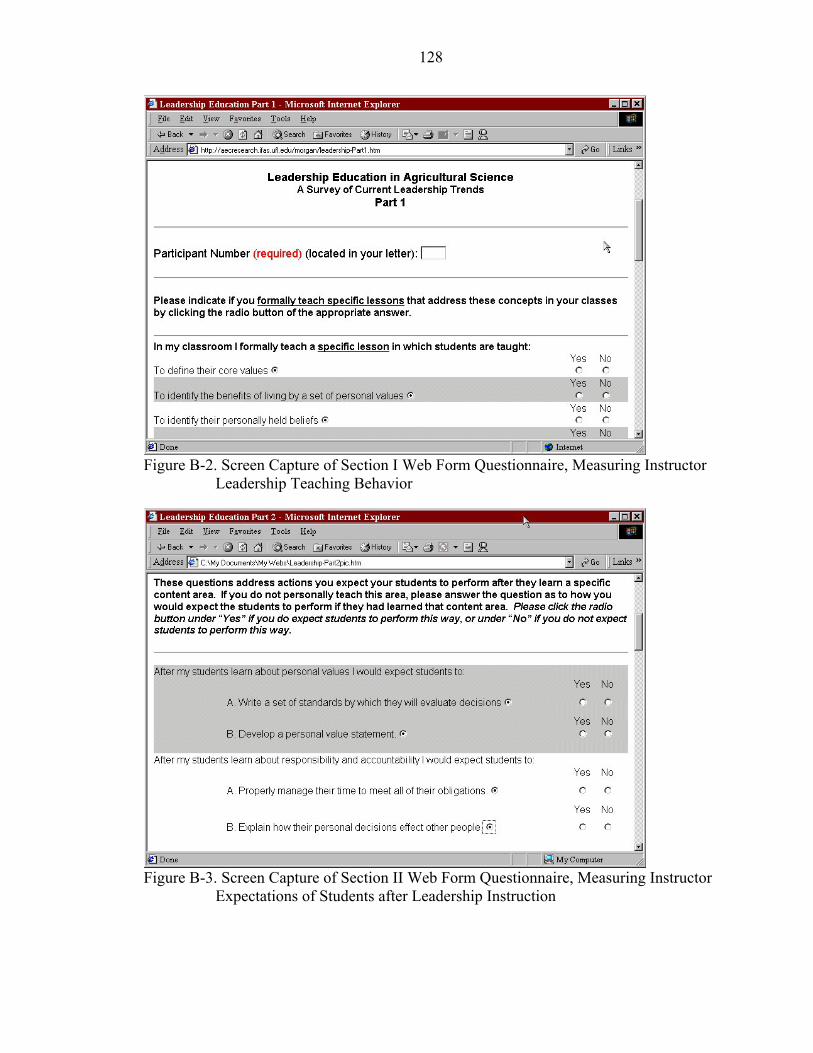
128
Figure B-2. Screen Capture of Section I Web Form Questionnaire, Measuring Instructor
Leadership Teaching Behavior
Figure B-3. Screen Capture of Section II Web Form Questionnaire, Measuring Instructor
Expectations of Students after Leadership Instruction
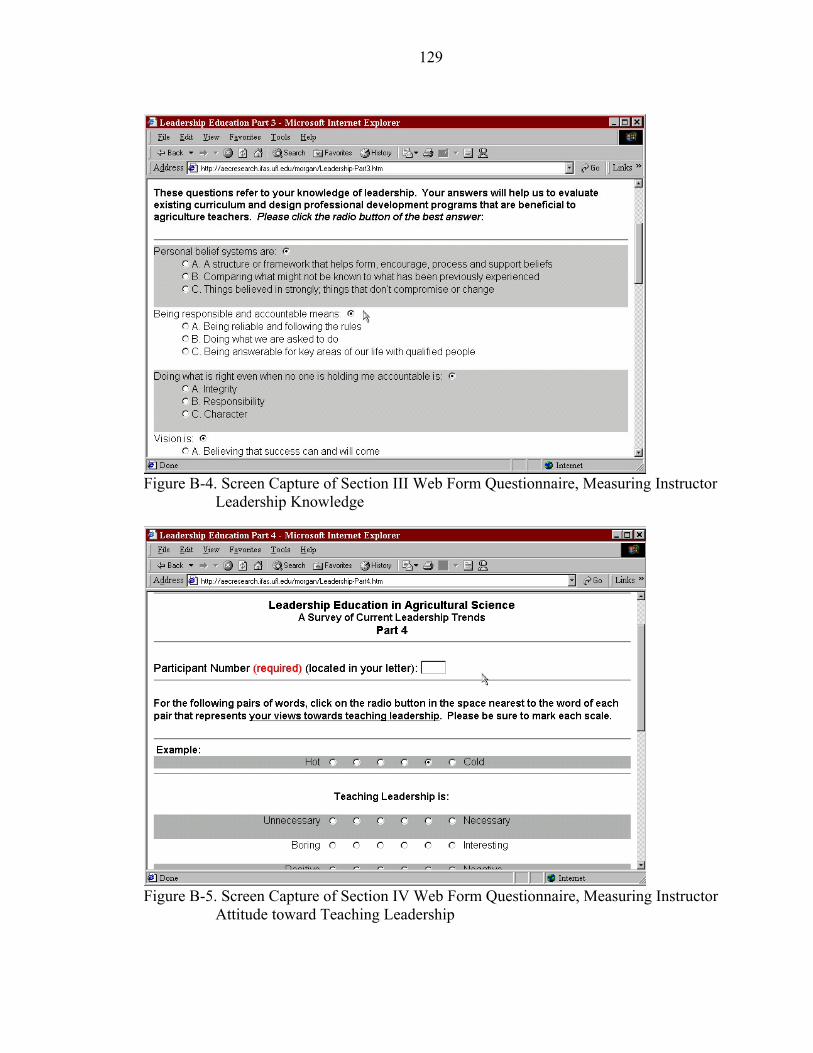
129
Figure B-4. Screen Capture of Section III Web Form Questionnaire, Measuring Instructor
Leadership Knowledge
Figure B-5. Screen Capture of Section IV Web Form Questionnaire, Measuring Instructor
Attitude toward Teaching Leadership
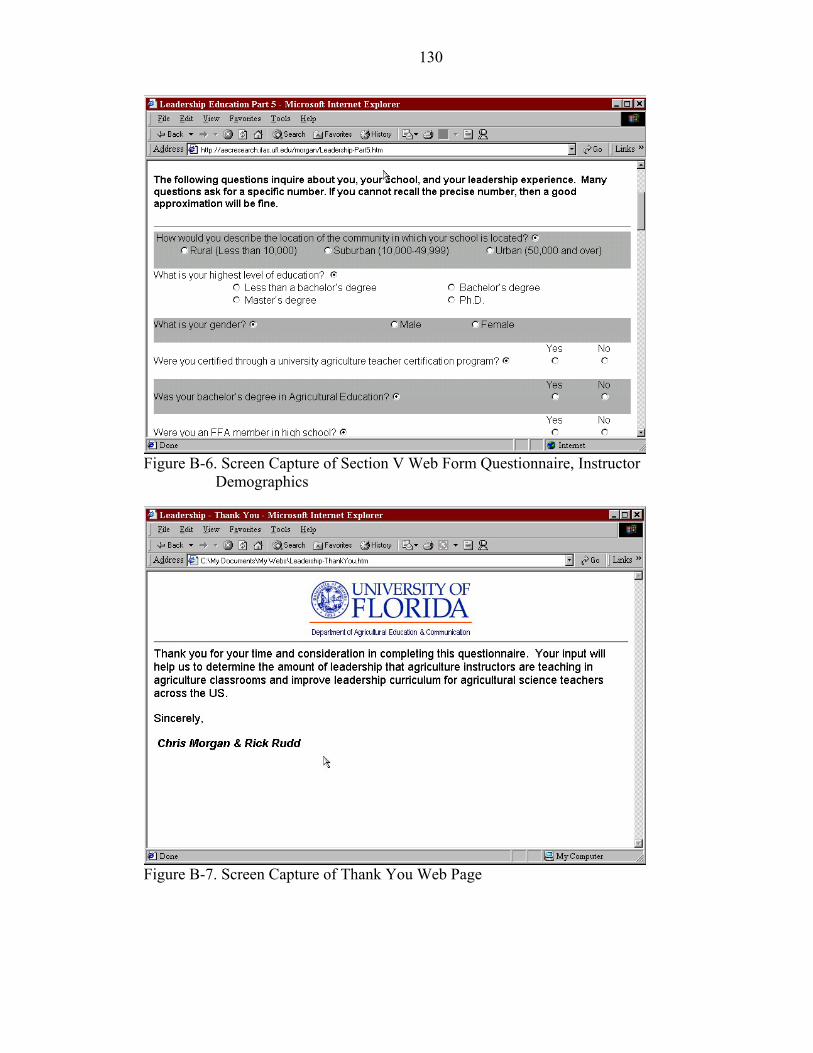
130
Figure B-6. Screen Capture of Section V Web Form Questionnaire, Instructor
Demographics
Figure B-7. Screen Capture of Thank You Web Page

APPENDIX C SURVEY CORRESPONDENCE

132
132
Institute of Food and Agricultural Sciences Department of Agricultural Education and Communication
305 Rolfs Hall PO Box 110540
Gainesville, FL 32611-0540 Telephone: (352) 392-0502
Fax: (352) 392-9585FFA Advisor Participant Number 1 April 5, 2004 Dear FFA Advisor, You have been selected to participate in a national study to determine the amount of leadership formally taught in agricultural science classrooms. Your input is vital to help us understand the current status and direction of leadership education in the agricultural science classroom. It is our belief that excellent teaching occurs in many agricultural science programs. It is also our belief that agricultural science instructors are the best source for information related to current teaching practices occurring in agricultural science classrooms. This study seeks to determine how much leadership is being taught in agricultural science classrooms and what factors influence the teaching of leadership. In the next few days you will receive a questionnaire. We anticipate that it will take approximately 20-25 minutes to complete. Please answer all questions as truthfully as possible. Your responses will be kept confidential and anonymous to the extent provided by law. If you do not want to participate, please contact me requesting to be removed and we will not include you in the study. Please remember that by not participating your valued input will not be available to improve future curriculum. If you prefer to access the questionnaire via the Internet, please go to the web address http://aecresearch.ifas.ufl.edu/morgan/Leadership-Intro.htm and enter your participant number 1. If you have any questions, please feel free to contact me at 352-392-0502 ext. 223 or at [email protected]. Once again, thank you for your anticipated participation in this study. Your time and effort is very appreciated and will be valuable for improving leadership curriculum in the future. Respectfully, Chris Morgan Rick Rudd, Ph.D. Graduate Assistant Associate Professor Figure C-1. Pre-notice Letter

133
Institute of Food and Agricultural Sciences Department of Agricultural Education and Communication
305 Rolfs Hall PO Box 110540
Gainesville, FL 32611-0540 Telephone: (352) 392-0502
Fax: (352) 392-9585FFA Advisor Participant 1 April 8, 2004 Dear FFA Advisor, Thank you for taking this opportunity to participate in this national study to determine the amount of leadership formally taught in agricultural science classrooms. Your input is valued and appreciated.
Please take a few minutes to complete the enclosed questionnaire. The questionnaire consists of five sections which should take 20-25 minutes to complete. The first section asks if you teach specific lessons on topics relating to leadership. The next section addresses how you expect students to act after you teach a particular leadership concept. The third section consists of both multiple choice questions and true/false questions to determine your level of leadership knowledge. The fourth section asks your views about teaching leadership. The final section asks questions related to you, your school, and your community. After completing the questionnaire, please sign the enclosed Informed Consent form, and place the questionnaire and the signed Informed Consent form in the enclosed Business Reply Mail envelope. Postage will be paid by the University of Florida. The questionnaire may also be accessed via the Internet by entering the following address into your web browser: http://aecresearch.ifas.ufl.edu/morgan/Leadership-Intro.htm. To complete the questionnaire on-line you will need to enter your participant number 1. Your participation in this study will help us to understand how much formal leadership education is occurring in agricultural science classrooms and help us to refine leadership curriculum. Therefore, your participation has the potential to influence the shape of leadership curriculum in years to come. Thank you for taking time to complete the questionnaire. If you have any questions, please feel free to contact me at 352-392-0502 ext. 223 or at [email protected]. Once again, thank you for participating in this study. Your time and effort is very appreciated and will be valuable for improving leadership curriculum in the future. Respectfully, Chris Morgan Rick Rudd, Ph.D. Graduate Assistant Associate Professor Figure C-2. Cover Letter for First Questionnaire

134
Informed Consent Project title: Leadership Education in Agricultural Science: An Evaluation of Current Leadership Trends. Purpose of the research study: To solicit input from high school agricultural science teachers to determine: (1) the amount of leadership being taught in agricultural science classrooms; (2) the attitude of agricultural science teachers towards teaching leadership; (3) the level of leadership knowledge of agricultural science teachers; (4) the expectations of agricultural science teachers of students if leadership is taught, and: (5) demographic information about agricultural science teachers. What will you be asked to do in the study: Complete one instrument. Time required: Approximately 20-25 minutes. Risks: No risk of physical, psychological or economic harm to participants is foreseen. Benefits/Compensation: There is no compensation, monetary or otherwise, to you for participation. There are no benefits to participation in this study. Confidentiality: Your identity will be kept confidential to the extent provided by the law. Your responses to the instrument will be anonymous. Voluntary participation: Your participation is completely voluntary. There is no penalty for not participating. Right to withdraw from the study: You have the right to withdraw from the study at anytime without consequence. Whom to contact if you have questions about the study: Chris Morgan, M. Ed., Graduate Assistant University of Florida Dept. of Agricultural Education and Communication 305 Rolfs Hall; PO Box 110540 Gainesville, FL 32611-0540 Ph: 352-392-0502 x223 Fx: 352-392-9585 E-mail: [email protected]
Rick Rudd, Ph.D., Associate Professor University of Florida Dept. of Agricultural Education and Communication 305 Rolfs Hall; PO Box 110540 Gainesville, FL 32611-0540 Ph: 352-392-0502 x239 Fx: 352-392-9585 E-mail: [email protected]
Whom to contact about your rights in the study: University of Florida Institutional Review Board Office PO Box 112250 University of Florida Gainesville, FL 32611-2250 ph: 352-392-0433 Agreement: I have read the procedure described above. I voluntarily agree to participate in the procedure and have received a copy of this description. Participant: ____________________________________ Date: _____________ Principal Investigator: ____________________________ Date: _____________ Chris Morgan, M.Ed. Supervisor: ____________________________________ Date: _____________ Rick Rudd, Ph.D. Figure C-3. Informed Consent Form

135
Dear Agriscience Instructor,
Approximately one week ago a questionnaire seeking your input about leadership education in agricultural science was sent to you. Your name was randomly selected from a national list of agricultural science instructors.
If you have already completed and returned the questionnaire to us, please accept our sincere thanks. If not, could you please find time today to complete it? I know this is a busy time of year, but if you could take a few moments to provide your ideas and experiences we would appreciate it greatly. It is only by asking people like you to share your thoughts and insights that we can determine how much leadership is being taught in agricultural classrooms and improve future curriculum.
Please complete the previously mailed questionnaire and return it to us using the postage paid envelope. You may also access the questionnaire on the Internet at http://aecresearch.ifas.ufl.edu/morgan/leadership-intro.htm. Your participant number is «Part No». If you would prefer that a questionnaire be mailed to you, please contact me at (352) 392-0502 ext. 223 or at [email protected] and one will be mailed to you immediately.
Thank you in advance for your time and consideration. Please return the questionnaire by April 28, 2004.
Sincerely, Chris Morgan, Graduate Assistant
Institute of Food and Agricultural Sciences
University of Florida Department of Agricultural Education and Communication; 352-392-0502 Figure C-4. Thank You/ Reminder Postcard

136
Institute of Food and Agricultural Sciences Department of Agricultural Education and Communication
305 Rolfs Hall PO Box 110540
Gainesville, FL 32611-0540 Telephone: (352) 392-0502
Fax: (352) 392-9585FFA Advisor Participant Number 1 April 28, 2004 Dear FFA Advisor, Approximately three weeks ago you were sent a questionnaire seeking your input about leadership education in agricultural science. As of today we have not received your questionnaire. If you have recently returned the questionnaire, thank you for your assistance in this study. If this is the case, this letter and your questionnaire have probably crossed in the mail. The comments of people who have already responded have provided some insight into the leadership being taught in high schools across the country. We believe the results from this study will be very useful in determining how much leadership is currently being taught in agricultural science classrooms and help to improve future curriculum. I am writing again because of the importance that your questionnaire has for helping to get accurate results. Although we have sent questionnaires to teachers throughout the country, it’s only by hearing from nearly everyone in the sample that we can be sure that the results are truly representative. I realize the end of a semester can be a busy time of the year, however your ideas are highly valued. Please take a few minutes today to complete the study. We anticipate that the questionnaire will take approximately 20-25 minutes to complete. I have enclosed another copy of the questionnaire in the event that you did not receive the first mailing. After completing the questionnaire, please sign the enclosed Informed Consent form, and place the questionnaire and the signed Informed Consent form in the enclosed Business Reply Mail envelope. Postage will be paid by the University of Florida. The questionnaire may also be accessed via the Internet by entering the following address into your web browser: http://aecresearch.ifas.ufl.edu/morgan/Leadership-Intro.htm. To complete the questionnaire on-line you will need to enter your participant number “1.” We hope that you will fill out and return the questionnaire soon, but if for any reason you prefer not to answer it, please let us know by returning your blank questionnaire in the postage paid envelope or sending an email to [email protected]. If you have any questions, please contact me by email or phone at (352) 392-0502 x223. Thank you in advance for participating in this study. Your time and effort is very appreciated and will be valuable for improving leadership curriculum in the future. Respectfully, Chris Morgan Rick Rudd, Ph.D. Graduate Assistant Associate Professor Figure C-5. Cover Letter for Second Questionnaire

APPENDIX D TABLES
Table D-1. Pearson’s Product Moment Correlations Between Age, Years Teaching, Years Teaching in Current Position, and Selected Variables (n=157)
Variable Age Years
Teaching Years Teaching in Current Position
Gender2 0.39* 0.43* 0.37* Number of leadership positions held in local school or vocational department
0.35* 0.39* 0.25*
Number of offices held in professional education organizations
0.30* 0.37* 0.40*
Number of offices held in college organizations
-0.28* -0.20* -0.12
Number of offices held in professional development organizations
0.28* 0.28* 0.22*
Number of offices held in civic organizations
0.25* 0.32* 0.19*
Number of workshops and seminars for agriculture teachers
0.25* 0.29* 0.32*
Number of regional or state agricultural education committees participated in
0.23* 0.29* 0.29*
Number of workshops and seminars for non-agriculture teachers
0.22* 0.22* 0.10
FFA officer above chapter level1 -0.20* -0.17* -0.12 Number of offices held in high school organizations outside of FFA
-0.19* -0.14 -0.14
Level of education 0.18* 0.25* 0.31* FFA member in high school1 -0.17* -0.04 0.05 FFA chapter officer1 -0.16* -0.03 0.02 Number of times attended Advisor’s Washington Leadership Conference
0.16 0.18* 0.21*
Instructor leadership teaching behavior 0.12 0.16* 0.12 Instructor attitude towards the teaching of leadership
0.09 0.08 0.17*
Certified through a university agriculture teacher education program1
0.08 0.10 0.16*
Age -- 0.91* 0.69* Years teaching -- -- 0.80* Notes: * = p<0.05; 1 = Yes coded as 1, No coded as 0; 2 = Males coded as 1, Females coded as 2.
137

138
Table D-2. Pearson’s Product Moment Correlations between Number of Instructors at School and Selected Variables (n=156)
Variable
Number of Agricultural
Science Instructors
One Instructor
Two Instructor
Three Instructor
Four or More
InstructorsRural school location 1 -0.34* 0.27* -0.05 -0.22* -0.23* Suburban school location1 0.31* -0.20* 0.03 0.16 0.19* Location of school 0.28* -0.24* 0.05 0.21* 0.20* Number of workshops and
seminars for non-agriculture teachers
0.21* -0.19* 0.04 0.26* 0.20*
Number of offices held in high school organizations outside of FFA
0.20* -0.11 -0.04 0.11 0.42*
Level of education1 0.18* -0.15 0.01 0.22* 0.05 Number of offices held in
professional education organizations
0.18* -0.21* 0.15 0.13 0.14
Number of regional or state agricultural education committees participated in
0.15 -0.21* 0.13 0.22* 0.02
Number of workshops and seminars for agriculture teachers
0.14 -0.15 0.07 0.12 0.18*
Instructor leadership teaching behavior
0.13 -0.12 0.04 0.18* 0.07
Number of offices held in college organizations
0.13 -0.07 -0.07 0.23* 0.10
Number of leadership courses taken in college
0.12 -0.08 -0.02 0.21* -0.06
Urban location of school1 0.12 -0.14 0.04 0.13 0.11 Number of offices held in civic
organizations 0.06 -0.13 0.09 0.22* -0.07
Bachelor degree in agricultural education
-0.10 -0.06 0.17* 0.02 -0.07
Number of agricultural science instructors in school
-- -0.78* 0.35* 0.39* 0.40*
One instructor department1 -- -- -0.81* -0.28* -0.17* Two instructor department1 -- -- -- -0.16* -0.10 Three instructor department1 -- -- -- -- -0.03 Notes: *=p<0.05; 1=Yes coded as 1, No coded as 0.

139
Table D-3. Pearson’s Product Moment Correlations Between Committee Participation, and Workshops and Seminar Presentations and Selected Variables (n=158)
Variable
Number of Regional or State
Agricultural Education
Committees Participated in
Number of Workshops
and Seminars for
Agriculture Teachers
Number of Workshops
and Seminars for Non-
Agriculture Teachers
Number of workshops and seminars for agriculture teachers
0.50* -- --
Number of offices held in professional education organizations
0.46* 0.33* 0.20*
Number of offices held in professional development organizations
0.39* 0.25* 0.09
Number of leadership positions in local school or vocational department
0.32* 0.49* 0.35*
Years teaching 0.29* 0.29* 0.22* Years in current teaching position 0.29* 0.32* 0.10 Age 0.23* 0.25* 0.22* Three-instructor department1 0.22* 0.12 0.26* One-instructor department1 -0.21* -0.15 -0.19* Number of workshops and seminars for
non-agriculture teachers 0.21* 0.42* --
Membership in professional development organizations
0.21* 0.25* 0.13
Number of offices held in college organizations
0.19* 0.12 0.16*
Number of times attended Advisor’s Washington Leadership Conference
0.19* 0.38* 0.07
Number of offices held in civic organizations
0.16 0.09 0.20*
Number of agricultural science instructors in school
0.15 0.14 0.21*
Number of offices held in high school organizations outside of FFA
0.15 0.14 0.24*
Instructor leadership teaching behavior 0.11 0.09 0.08 Instructor leadership knowledge 0.10 0.19* -0.02 Location of school -0.03 0.16 0.24* Rural school location1 0.03 -0.16 -0.17* Urban location of school1 -0.01 0.11 0.28* Note. *=p<0.05; 1=Yes coded as 1, No coded as 0.

140
Table D-4. Pearson’s Product Moment Correlations between High School and College Leadership Activities and Selected Variables (n=158)
Variable
Number of Leadership Courses in
College
Number of Offices in High
School Organizations
Number of Offices in College
Organizations Number of offices held in high school
organizations outside of FFA 0.02 -- --
Number of offices held in college organizations
0.14 0.52* --
Leadership course taught in agricultural science program1
0.28* -0.03 0.07
Instructor leadership teaching behavior 0.22* 0.09 0.07 Three instructor department1 0.21* 0.11 0.23* Bachelor’s degree in agricultural education1 0.16* 0.16 0.12 Membership in professional development
organizations 0.13 0.23* 0.14
Number of agricultural science instructors in school
0.12 0.20* 0.13
Number of regional or state agricultural education committees participated in
-0.10 0.15 0.19*
FFA member in high school1 0.10 0.08 0.20* FFA chapter officer1 0.09 0.15 0.22* Instructor expectations after leadership has
been taught 0.09 0.19* 0.07
Years teaching -0.08 -0.14 -0.20* Number of workshops and seminars for
non-agriculture teachers 0.07 0.24* 0.16*
FFA officer above chapter1 -0.06 0.16* 0.31* Age -0.06 -0.19* -0.28* Four or more teacher department1 -0.06 0.27* 0.10 Gender2 -0.05 -0.19* -0.18* Note. *=p<0.05; 1=Yes coded as 1, No coded as 0; 2=Males coded as 1, Females coded as 2.

141
Table D-5. Pearson Product Moment Correlations between Instructor Leadership Teaching Behavior and Variables Studied
r n Sig. (2-tailed)
Leadership course taught in agricultural science program1 0.44 156 0.00 Instructor attitude towards the teaching of leadership 0.38 160 0.00 Gender2 0.23 156 0.01 Number of leadership courses taken in college 0.22 156 0.01 Instructor expectations after leadership has been taught 0.21 162 0.01 Membership in professional development organizations 0.20 159 0.01 Number of offices held in professional development
organizations 0.20 159 0.01
Urban location of school1 0.19 154 0.02 Three-instructor department1 0.18 157 0.03 Years teaching 0.16 158 0.05 Number of offices held in civic organizations 0.15 157 0.06 Location of school 0.13 154 0.11 Number of agricultural science teachers in school 0.13 156 0.11 One-instructor department1 -0.12 157 0.14 Age 0.12 157 0.14 Years in current teaching position 0.12 158 0.14 Number of leadership positions in local school or vocational
department 0.11 158 0.11
Number of regional or state agricultural education committees participated in
0.11 159 0.18
Bachelor’s degree in agricultural education1 0.09 157 0.27 Certified through a university agriculture teacher education
program1 0.09 158 0.27
Number of offices held in high school organizations outside of FFA
0.09 158 0.28
Number of workshops and seminars for agriculture teachers 0.09 158 0.29 Suburban school location1 -0.08 154 0.32 Number of workshops and seminars for non-agriculture teachers 0.08 159 0.31 Number of offices held in college organizations 0.07 159 0.36 Four-or-more instructor department1 0.07 157 0.38 Rural school location1 -0.06 154 0.43 Instructor leadership knowledge -0.06 161 0.49 Number of times attended Advisor’s Washington Leadership
Conference 0.06 159 0.49
FFA member in high school1 0.05 158 0.58 FFA officer above chapter1 -0.04 157 0.62 Two-instructor department1 0.04 157 0.63 Level of education -0.03 158 0.71 Number of offices held in professional education organizations 0.03 158 0.74 FFA chapter officer1 -0.01 158 0.94 Note. Bold=p<0.05; 1=Yes coded as 1, No coded as 0; 2=Males coded as 1, Females coded as 2.

LIST OF REFERENCES
Agresti, A., & Finlay, B. (1997). Statistical methods for the social sciences (3rd ed.). Upper Saddle River, NJ: Prentice Hall.
Ary, D., Jacobs, L. C., & Razavieh, A. (1996). Introduction to research in education (5th ed.). Fort Worth, TX: Harcourt Brace College Publishers.
Balschweid, M. A., & Thompson, G. W. (2002). Integrating science in agricultural education: Attitudes of Indiana agricultural science and business teachers. Journal of Agricultural Education 43(2), 1-10.
Bandura, A. (1986). Social foundations of thought and action: A social cognitive theory. Englewood Cliffs, NJ: Prentice-Hall.
Barrett, L. A. (1983). Leadership education for agricultural students. NACTA Journal, 27(1), 6, 47-48.
Bass, B. M. (1990). Bass and Stogdill's handbook of leadership (3rd ed.). New York: Free Press.
Becker, M. H. (1974). The health belief model and personal health behavior. Health Education Monographs, 2, 324-508.
Benson, G. L. (1983). On the campus: How well do business schools prepare graduates for the business world? Personnel, 60(4), 61-65.
Birkenbolz, R. J., & Maricle, G. L. (1991). Adult education in agriculture: A national survey. Journal of Agricultural Education, 32(4), 19-24.
Bisoux, T. (2002, September). The mind of a leader. BizEd, 26-31.
Bland, C. J., Starnaman, S., Wersal, L., Moorhead-Rosenburg, L., Zonia, S., & Henry, R. (2000). Curricular change in medical schools. Academic Medicine, 75, 575-594.
Boccia, J. A. (1997). Students taking the lead. San Francisco: Jossey-Bass.
Bolman, L. G., & Deal, T. E. (1997). Reframing organizations (2nd ed.). San Francisco: Jossey-Bass.
142

143
Boone, H. N., Gartin, S. A., Wright, C., Lawrence, L. D., & Odell, K. (2002). Adult education philosophies practiced by agricultural education teachers in Pennsylvania, Virginia, and West Virginia. Journal of Agricultural Education, 43(3), 37-48.
Boy Scouts of America. (2003). Scouting FAQs. Retrieved October 24, 2003 from http://www.scouting.org
Boys and Girls Clubs. (2003). Program leadership. Retrieved October 24, 2003 from http://www.bgca.org/programs/leadership.asp
Brannon, T., Holley, C. W. & Key, J. P. (1989). Impact of vocational agriculture/FFA on community leadership. Journal of Agricultural Education, 30(3), 37-45.
Brutcher, R. W. (2003). Developing leadership skills. School Administrator, 60(3), 6.
Burns, J. M. (1979). Leadership. New York: Harper & Row.
Butler, J. B. (1999). Global studies in Arkansas: An experiment in statewide curriculum reform. International Journal of Social Reform, 14(1), 93-110.
Cano, J. (1990). Male vocational agriculture teachers' attitude and perception towards female teachers of agriculture. Journal of Agricultural of Education, 31(3), 19-23.
Carter, R. I., & Spotanski, D. R. (1989). Perceptions of leadership and personal development of selected high school students in Iowa. Journal of Agricultural Education, 30(4), 30-34.
Chmielewski, T. R. (2000). Student leadership. Principal Leadership (High School Ed.), 1(2), 18-23.
Clark, A. A. (1977). An analysis of leadership and self-confidence and or self-acceptance outcomes from student participation in Distributive Education Clubs of America. Unpublished Dissertation, The University of Minnesota.
Commonwealth of Virginia Board of Education. (2001). Linking leadership to instruction: A leadership development curriculum for Virginia public schools. Retrieved October 10, 2003, from www.pen.k12.va.us/VDOE/Instruction/leadership/index.html
Connors, J. J. (1999). Division report: Agricultural education. Techniques, 74(2), 54.
Connors, J. J., & Elliot, J. (1994). Teacher perceptions of agriscience and natural resources curriculum. Journal of Agricultural Education, 35(4), 15-19.
Conroy, C. A., & Walker, N. J. (2000). An examination of integration of academic and vocational subject matter in the aquaculture classroom. Journal of Agricultural Education, 41(2), 54-64.
144
Croom, D. B. (2003). Teacher burnout in agricultural education. Journal of Agricultural Education, 44(2), 1-13.
Cruickshank, D. R. (1990). Research that informs teachers and teacher educators. Bloomingdale, IN: Phi Delta Kappa.
Delmar Learning. (2003). Leadership: Personal development, career success. Retrieved October 2, 2003 from http://www.delmarlearning.com/samplechapters/sampchaps_index.aspx?disc=8
Delnero, J., & Montgomery, D. (2001). Perceptions of work among California agriculture teachers. Journal of Agricultural Education, 42(2), 56-67.
Derner, S. (2004). An overview of LifeKnowledge. The Agricultural Education Magazine, 76, 5-8.
Dillman, D. (2000). Mail and internet surveys: The tailored design method (2nd ed.). New York: John Wiley & Sons, Inc.
Doherty, K. M. (2004, July). Assessment. Education Week. Retrieved June 26, 2004, from http://www.edweek.org/context/topics/issuespage.cfm?id=41
Dormody, T. J. (1993). Science credentialing and science credit in secondary school agricultural education. Journal of Agricultural Education, 34(2), 63-70.
Dormody, T. J., & Seevers, B. S. (1994a). Participation of FFA members in leadership development activities: A tri-state study. Journal of Agricultural Education, 35(4), 42-48.
Dormody, T. J., & Seevers, B. S. (1994b). Predicting youth leadership life skills development among FFA members in Arizona, Colorado, and New Mexico. Journal of Agricultural Education, 35(2), 65-71.
Dormody, T. J., Seevers, B. S., & Clason, D. L. (1996). Teacher perceptions of the goals achieved by adult organizations in agricultural education. Journal of Agricultural Education, 37(1), 31-40.
Duncan, D. W. (2004). Knowledge and perceptions of Virginia secondary agriculture educators toward the agricultural technology program at Virginia Tech. Journal of Agricultural Education, 45(1), 21-28.
Eaton, D. W., & Bruening, T. H. (1996). The strategic plan for agricultural education: An assessment in Pennsylvania. Journal of Agricultural Education, 37(1), 56-64.
Elbert, C. D. (2003). Teacher competence for working with disabled students as perceived by secondary level agricultural instructors in Pennsylvania. Journal of Agricultural Education, 44(1), 105-115.

145
ERIC Clearing House on Tests Measurement and Evaluation. (1985). Measuring teacher attitudes toward mainstreaming (ERIC Document Reproduction Service ED289885). Princeton, NJ: ERIC.
Esters, L. T. (2002). Leadership development in an urban program. The Agricultural Education Magazine, 75, 20-21.
FairTest.org. (2004). The dangerous consequences of high-stakes standardized testing. Retrieved June 26, 2004, from http://www.fairtest.org/facts/Dangerous%20Consequences.html
Figura, S. Z. (1999, September). Leadership void. Government Executive. Retrieved October 2, 2003 from www.govexec.com/news/index.cfm?mode=report&articleid=16021
Fishbein, M., & Ajzen, I. (1975). Belief, attitude, intention and behavior: An introduction to theory and research. Boston: Addison-Wesley.
Fishbein, M., Bandura, A., Triandis, H. C., Kanfer, F. H., Becker, M. H., & Middlestadt, S. E. (1991). Factors influencing behavior and behavior change. In A. Baum, T. Revenson & J. Singer (Eds.), Handbook of health psychology (pp. 3-17). Mahwah, NJ: Lawrence Erlbaum..
Foster, B. (2001, December). Women in agricultural education: Who are you? Paper presented at the National Agricultural Educators Research Conference, New Orleans.
Foster, R., Bell, L., & Erskine, N. (1995). The importance of selected instructional areas in the present and future secondary agricultural education curriculum as perceived by teachers, principals, and superintendents in Nebraska. Journal of Agricultural Education, 36(3), 1-7.
Fox, C. M., Robinson, K. L., & Boardley, D. (1998). Cost-effectiveness of follow-up strategies in improving the response rate of mail surveys. Industrial Marketing Management, 27, 127-133.
Fraze, S. D., Hardin, K. K., Brashears, M. T., Haygood, J. L., & Smith, J. H. (2003). The effects of delivery mode upon survey response rate and perceived attitudes of Texas agri-science instructors. Journal of Agricultural Education, 44(2), 27-37.
Frontline. (2002). Testing. Teaching. Learning?. Retrieved June 26, 2004 from http://www.pbs.org/wgbh/pages/frontline/shows/schools/testing/
Gardner, J. W. (1990). On leadership. New York: The Free Press.
Gliem, J. A. (2003, December). Use and interpretation of multiple linear regression. Paper presented at the American Association for Agricultural Education Research Pre-Session, Orlando, FL.

146
Happerlen, T. M., Clay, D. L., Henly, G. A., & Barke, C. R. (2002). Measuring teacher attitudes and expectations toward students with ADHD: Development of the test of knowledge about ADHD. Journal of Attention Disorders, 5(3), 133-142.
Harris, C. R., & Birkenbolz, R. J. (1996). Agricultural literacy of Missouri secondary school educators. Journal of Agricultural Education, 37(2), 63-71.
Hersey, P., Blanchard, K. H., & Johnson, D. E. (2001). Management of organizational behavior (8th ed.). Upper Saddle River, NJ: Prentice Hall.
Hikmet, N., & Chen, S. K. (2003). An investigation into low mail survey response rates of information technology users in health care organizations. International Journal of Medical Informatics, 72(1), 29-24.
Hillison, J., & Bryant, B. (2001). Agricultural societies as antecedents of the FFA. Paper presented at the Southern Agricultural Educators Research Conference, Fort Worth, TX.
Instructional Materials Service. (2003). Description of leadership and communications courses. Retrieved October 2, 2003 from http://www-ims.tamu.edu/index.aspx?page=123
Jenkins, J. J., Russell, W. A., & Suci, G. J. (1958). An atlas of semantic profiles for 360 words. American Journal of Psychology, 71(4), 688-699.
Jones, A. J. (1938). The education of youth for leadership (1st ed.). New York: McGraw-Hill.
Karnes, F. A., & Stephens, K. R. (1999). Planning for the future: Leadership education in the schools. Educational Horizons, 77, 89-93.
Karr, K., Keith, L., Lockaby, J., & Vaughn, P. (2001, February). The self-perceived impact of participation in the Texas 4-H council by former council members. Paper presented at the Southern Agricultural Education Research Conference, Fort Worth, TX.
Kimpston, R. D., & Anderson, D. H. (1982). A study to analyze curriculum decision making in school districts. Educational Leadership, 40(2), 63-67.
Kirk, D., & MacDonald, D. (2001). Teacher voice and ownership of curriculum change. Journal of Curriculum Studies, 33, 551-567.
Kotrlik, J. W., & Drueckhammer, D. (1987). The importance of selected external factors and programmatic components in planning vocational agriculture programs. Journal of Agricultural Education, 28(4), 26-31.
147
Kotrlik, J. W., Redmann, D. H., & Douglas, B. B. (2003). Technology integration by agriscience teachers in the teaching/learning process. Journal of Agricultural Education, 44(3), 78-89.
Kouzes, J. M., & Posner, B. Z. (1997). The leadership challenge (2nd ed.). San Francisco: Jossey-Bass.
Layfield, K. D., & Dobbins, T. (2002). Inservice needs and perceived competencies of South Carolina agricultural educators. Journal of Agricultural Education, 43(4), 46-55.
Leat, D., & Higgins, S. (2002). The role of powerful pedagogical strategies in curriculum development. The Curriculum Journal, 13(1), 71-85.
Lee, J. A. (2000). Adapting Triandis' model of subjective culture and social behavior relations to consumer behavior. Journal of Consumer Psychology, 9(2), 117-126.
Leventhal, J. I. (1999). Providing leadership development for all students: an integral part of classroom instruction. Tech Directions, 59, 22-24.
Lowery, M. (2000). Math lessons: A case study in the adoption of an innovative math curriculum. NASSP Bulletin, 86(615), 61-73.
Maxwell, J. C. (1993). Developing the leader within you. Nashville, TN: Thomas Nelson.
McCall, M. W. (1998). High flyers: Developing the next generation of leaders. Boston: Harvard Business School Press.
McKinley, B. G., Birkenholz, R. J., & Stewart, B. R. (1993). Characteristics and experiences related to the leadership skills of agriculture students in college. Journal of Agricultural Education, 34(3), 76-83.
Merriam-Webster. (2003). Merriam-Webster Dictionary. Retrieved December 18, 2003 http://www.m-w.com
Miller, L. E. (1998). Appropriate analysis. Journal of Agricultural Education, 39(2), 1-10.
Miller, L. E., & Smith, K. L. (1983). Handling nonresponse issues. Journal of Extension, 21, 45-50.
Miller, W. W., Kahler, A. A., & Rheault, K. (1989). Profile of the effective vocational agriculture teacher. Journal of Agricultural Education, 30(2), 33-40.
Mischel, W., & Mischel, H. N. (1977). Essentials of psychology. New York: Random House.

148
Morrison, G. R. (2000). Graduation is the beginning, not the end: Are your students ready? High School Magazine, 7, 5-7.
Mueller, D. M. (1989). Relationships between 4-H youth leadership involvement and self esteem. Unpublished Thesis, Washington State University.
Myers, B. E., Dyer, J. E., & Breja, L. M. (2003). Recruitment strategies and activities used by agriculture teachers. Journal of Agricultural Education, 44(4), 94-105.
National FFA Organization (2002). FFA Key Statistics. National FFA Organization. Retrieved December 2, 2002 http://www.ffa.org/about_ffa/organization/html/ffa.html
National FFA Organization (2003). FFA® LifeKnowledge initiative. Indianapolis, IN.
National Research Council. (1988). Understanding agriculture: New directions for education. Washington, D.C.: National Academy Press.
North Carolina State University. (2003). Agricultural leadership I curriculum. Retrieved October 2, 2003 from http://www.ces.ncsu.edu/plymouth/aee/agLdrshp1.html
Northouse, P. G. (2001). Leadership: Theory and practice (2nd ed.). Thousand Oaks, CA: Sage.
Odell, K. S., Cochran, J. E., Lawrence, L. D., & Gartin, S. A. (1990). The job and marital satisfaction of secondary agriculture teachers and their spouses. Journal of Agricultural Education, 34(3), 14-18.
Osborne, E. W., & Dyer, J. E. (1998). Attitudes of Illinois high school science teachers toward educational programs in agriculture. Journal of Agricultural Education, 39(1), 8-16.
Peasley, D. D., & Henderson, J. L. (1992). Agriscience curriculum in Ohio agricultural education: Teacher utilization, attitudes, and knowledge. Journal of Agricultural Education, 33(1), 37-45.
Pennsylvania State University. (2004). Definitions of terms used in the A-100 Report. Pennsylvania State University. Retrieved March 26, 2004 http://ict.cas.psu.edu/Support/Downloads/Guides/A-100/5_A-100_2003_Definitions.pdf
Prentice Hall. (2003). Developing leadership and communication skills. Retrieved October 2, 2003 from http://www.phschool.com/catalog/cat_3.cfm?prog_id=8921&sub_id=16
Response rates to howl about. (2000, Jan. 17). Brandweek Marketing.
149
Ricketts, J. C. (2003). Critical thinking skills of selected youth leaders: The efficacy of leadership development, critical thinking dispositions, and student academic performance. Unpublished Dissertation, University of Florida, Gainesville, FL.
Ricketts, J. C., & Rudd, R. D. (2001). Developing leadership competence: A coherent curriculum framework for youth in agricultural education. Journal of Southern Agricultural Education Research, 51(1). Retrieved December 2, 2003, from http://aaaeonline.ifas.ufl.edu/Research%2020Conferences/Saerc/2001/Index.htm.
Ricketts, J. C., & Rudd, R. D. (2002). A comprehensive leadership education model to train, teach, and develop leadership in youth. Journal of Career and Technical Education, 19(1). Retrieved December 2, 2003 from http://scholar.lib.vt.edu/ejournals/JCTE/v2019n2001/pdf/rickets.pdf.
Ricketts, S. C., & Newcomb, L. H. (1984). Leadership and personal development abilities possessed by high school seniors who are members in superior and non-superior FFA chapters, and by seniors who were never enrolled in vocational agriculture. Journal of the American Association of Teacher Educators in Agriculture, 25(2), 51-59.
Riordon, J. T. (2000). Building our youth for the future. Chain Store Age, 76, 202.
Rogers, B. (1999). Conflicting approaches to curriculum: Recognizing how fundamental beliefs can sustain or sabotage school reform. Peabody Journal of Education, 74(1), 29-69.
Rogers, E. M. (2003). Diffusion of innovations (5th ed.). New York: Simon and Schuster.
Rogers, J. F., Townsend, C. D., & Lindner, J. R. (2004). Perseverance of agricultural educators by academic attainment. Journal of Agricultural Education, 45(1), 74-85.
Rudd, R. D. (1994). Teacher characteristics related to the adoption of agriscience curriculum in Virginia middle school agricultural science education programs. Unpublished Dissertation, Virginia Polytechnic Institute and State University, Blacksburg, VA.
Rudd, R. D., & Hillison, J. H. (1995). Teacher characteristics related to the adoption of agriscience curriculum in Virginia middle school agricultural education programs. Journal of Agricultural Education, 36(2), 19-27.
Rutherford, T. A., Townsend, C. D., Briers, G. E., Cummins, R., & Conrad, C. R. (2002). Leadership self-perceptions of WLC participants. Journal of Agricultural Education, 43(2), 22-33.
Scanlon, D. C., & Burket, L. (1986). The influence of selected FFA factors in developing the interpersonal skills of students studying vocational agriculture. Journal of the American Association of Teacher Educators in Agriculture, 27(4), 51-56.

150
Schmidt, R. (2001). JROTC cadets in leadership training display significantly higher personal development than typical students. Education (Chula Vista, Calif.), 122, 302-306.
Seevers, B. S., & Dormody, T. J. (1994). 4-H youth participation in leadership development activities: A tri-state study. Journal of Agricultural Education, 35(4), 49-54.
Seevers, B. S., & Dormody, T. J. (1995). Leadership life skills development: perceptions of senior 4-H youth. Journal of Extension, 33(4).
Souccar, M. K. (2000, Feb. 16). Mass-mailing misfires still bedeviling card issuers despite technical advances. American Banker, 165.
Spotauski, D. R., & Carter, R. I. (1993). Self evaluation of leadership practices and behaviors used by department executive officers in agricultural education. Journal of Agricultural Education, 34(3), 17-25.
Stewart, B. R., Smith, C. L., Ehlert, M. W., & Mihalevich, J. R. (1985). Member, officer, and advisor perceptions of FFA organizational goals and activities. Journal of the American Association of Teacher Educators in Agriculture, 26(2), 47-55.
Stewart, T. A. (1998). Why leadership matters: America's most admired companies. Fortune, 137, 71-73.
Swan, E. T. (1996). Let's put more quality into TQM. Contemporary Education, 67, 97-98.
Taylor, C. L. C., Basen-Engquist, K., Shinn, E. H., & Bodurka, D. C. (2004). Predictors of sexual functioning in ovarian cancer patients. Journal of Clinical Oncology, 22(5), 881-889.
Teichgraeber, T. (2001). Tech profile: Hotwire Interactive Inc., marketing firm boosts response rate with technology. Business Journal, 21(50), 19.
Thobega, M., & Miller, G. (2003). Relationship of instructional supervision with agriculture teachers' job satisfaction and their intention to remain in the teaching profession. Journal of Agricultural Education, 44(4), 57-66.
Thomas, L., & Groves, R. (1986). Vocational agriculture teachers' opinions relative to selected animal science competencies. Journal of Agricultural Education, 27(3), 20-28.
Thorp, L., Cummins, R., & Townsend, C. (1998). Women's self-perceived leadership skills in a collegiate agricultural education course. Journal of Agricultural Education, 39(1), 55-62.

151
Townsend, C. D., & Carter, R. I. (1983). The relationship of participation in FFA activities and leadership, citizenship and cooperation. Journal of the American Association of Teacher Educators in Agriculture, 24(1), 20-25.
Trede, L., & Russell, D. (1999, December). Perceptions of stakeholders towards linkages and curriculum in urban agricultural education programs. Paper presented at the National Agricultural Education Research Conference, Orlando, FL.
Triandis, H. C. (1971). Attitude and attitude change. New York: John Wiley and Sons.
Triandis, H. C. (1980). Values, attitudes, and interpersonal behavior. In M. M. Page (Ed.), Nebraska Symposium on Motivation, 1979 Vol. 27 (pp. 195-259). Lincoln, NE: University of Nebraska Press.
Tuckman, B. W. (1994). Conducting educational research (4th ed.). Orlando, FL: Harcourt Brace & Company.
U.S. Census Bureau. (2004). Appendix A: Census 2000 geographic terms and concepts. US Census Bureau. Retrieved March 26, 2004 from www.census.gov/geo/www/tiger/glossry2.pdf
U.S. Department of Labor. (1999). Skills and tasks for jobs: A SCANS report for America 2000. Washington, DC: The Secretary's Commission on Achieving Necessary Skills.
University of North Carolina. (2003). Job outlook 2003: Finding a job is your first job. University of North Carolina Career Services. Retrieved October 7, 2003 from www.uncwil.edu/stuaff/career/students/joboutlook2003.htm
van Linden, J. A., & Fertman, C. I. (1998). Youth leadership: A guide to understanding leadership development in adolescents. San Francisco, CA: Jossey-Bass Publishers.
Variyam, J. N. (1999). America's eating habits: Changes and consequences (AIB-750). Washington, DC: Economic Research Service.
Vaughn, Z. J., & Moore, G. E. (2000, December). Predictors of FFA program quality. Paper presented at the National Agricultural Education Research Conference, San Diego, CA.
Virginia Division of Policy and Public Affairs. (2001). Board of education adopts optional leadership curriculum. Virginia Department of Education. Retrieved October 10, 2003 from http://www.pen.k12.va.us/VDOE/VA_Board/jun20sum.pdf
Wah, L. (1999, October). Global leader of the future. Management Review, 88, 9.
152
Wallin, D. (2003). Student leadership and democratic schools: A case study. NASSP Bulletin, 87(636), 55-78.
Whent, L. (1994). Factors influencing resource sharing between agriculture and science teachers participation in the agriscience program. Journal of Agricultural Education, 35(3), 11-17.
White, C. D. (1982). Leadership developed through vocational student organizations. Unpublished Dissertation, The Ohio State University.
Wilson, E. J. (1999). Research practice in business marketing. Industrial Marketing Management, 28, 257-260.
Wingenbach, G. J. (1995). Self-perceived youth leadership and life skills development among Iowa FFA members. Unpublished Dissertation, Iowa State University.
Wingenbach, G. J., Gartin, S. A., & Lawarence, L. D. (2000). Assessing the aquaculture curriculum in the northeastern region. Journal of Agricultural Education, 41(2), 2-10.
Wolff, B. (2002). Student leadership as a moral anchor. Educational Digest, 68, 7-10.
Zeldin, S., & Camino, L. (1999). Youth leadership: Linking research and program theory to exemplary practice. New designs for youth development, 15(2). Retrieved October 15, 2003 from http://www.cydjournal.org/NewDesigns/ND2099Spr/camino.html
BIOGRAPHICAL SKETCH
Alan Christian “Chris” Morgan is the husband of his best friend Susan Morgan and
the father of three wonderful children, Tyler, Allison and Spencer. He enjoys spending
time with his family and traveling.
Chris was born in San Francisco, CA, and adopted into a wonderful family at the
age of three months. While a youth he lived in California, Pennsylvania, and Texas. He
graduated in 1982 from Duncanville High School, and then attended Texas A&M
University earning a Bachelor Degree of horticulture in 1988.
With his degree in hand, he moved to Houston, TX where he worked in the
horticulture industry for eight years in management and sales. During this time he met
and married his best friend, Susan.
Feeling led to teach, Chris returned to Texas A&M to earn a teaching certificate
and a master’s degree in agricultural education, awarded in 1997. Chris taught
agricultural science four years at Marcus High School in Flower Mound, TX. During this
time he taught a wide variety of courses, from introduction to agriculture to floral design.
He was also instrumental in procuring a greenhouse for the program and encouraged
students to become involved in many functions including livestock shows and National
FFA Convention.
Believing it was God’s desire for him to teach at the college level, Chris moved his
family to Gainesville, FL so he could pursue a Ph.D. in agricultural education and
leadership at the University of Florida. There he shared an office with 12 outstanding
153

154
graduate students, and had the opportunity to teach college courses and conduct research.
After many struggles, both academic and personal, he graduated in August 2004.
Chris’ goal is to equip students for successful careers. He is currently pursuing this
goal as a faculty member at Oklahoma State University.