genetic, pharmacogenetic, and pharmacotherapeutic...
TRANSCRIPT

1
GENETIC, PHARMACOGENETIC, AND PHARMACOTHERAPEUTIC RISK FACTORS FOR THIAZIDE-INDUCED DYSGLYCEMIA
By
JASON HANSEN KARNES
A DISSERTATION PRESENTED TO THE GRADUATE SCHOOL OF THE UNIVERSITY OF FLORIDA IN PARTIAL FULFILLMENT
OF THE REQUIREMENTS FOR THE DEGREE OF DOCTOR OF PHILOSOPHY
UNIVERSITY OF FLORIDA
2012

2
© 2012 Jason Hansen Karnes

3
To my mother and father

4
ACKNOWLEDGMENTS
I would like to express my sincerest gratitude to Dr. Rhonda Cooper-DeHoff and
Dr. Julie Johnson for their mentorship and support throughout the past four years, for
the incredible training experience they have given me, and for the future opportunities
this has provided. I would also like to thank Dr. Yan Gong, Dr. Lauren McIntyre, Dr.
Marian Limacher, and Dr. Taimour Langaee for their help, encouragement, and
expertise.
I would like to thank the present and former graduate students and postdocs in the
department of Pharmacotherapy and Translational Research. I would not have survived
the graduate experience without their mentorship, compassion, and friendship. A
special thanks to Dr. Martin Brunner, Benjamin Burkley, Cheryl Galloway, Dr.
Maximilian Lobmeyer, Dr. Caitrin McDonough, Dr. Mike Pacanowski and Lynda
Stauffer, who facilitated so much of the research included in this dissertation. I would
also like to thank all the summer students who have contributed so much to the
completion of this research.
I would like to thank the UF Clinical and Translational Sciences Institute for their
support, facilitation of our original clinical study, and their role in PEAR and PEAR-2. I
would also like to thank the J Craig Venter Institute Resequencing and Genotyping
Service, particularly Samuel Levy, Tim Stockwell, and Ewen Kirkness, for their large
part in the sequencing of TCF7L2.
Finally, I would like to thank my family, Mom, Dad, and Emily, who have supported
me constantly, and my friends, who have occasionally provided a welcome distraction
from pharmaceutical research. Far more individuals than I can list here deserve
gratitude for supporting me and making this research and training possible.

5
TABLE OF CONTENTS page
ACKNOWLEDGMENTS .................................................................................................. 4
LIST OF TABLES ............................................................................................................ 8
LIST OF FIGURES ........................................................................................................ 11
LIST OF ABBREVIATIONS ........................................................................................... 13
ABSTRACT ................................................................................................................... 17
CHAPTER
1 INTRODUCTION AND BACKGROUND ................................................................. 19
Hypertension and Type 2 Diabetes ......................................................................... 19 Blood Pressure Reduction with Thiazide Diuretics ................................................. 20
Thiazide-Induced Dysglycemia ............................................................................... 21 Mechanisms of Thiazide-Induced Dysglycemia ...................................................... 23
Genetics of Type 2 Diabetes ................................................................................... 24 The Transcription Factor 7-Like 2 Gene (TCF7L2) ................................................. 26
Pharmacogenetics of Thiazide-Induced Dysglycemia............................................. 27 Short and Long Term Thiazide-Induced Dysglycemia ............................................ 29
2 SEQUENCING, DETERMINATION OF LINKAGE DISEQUILIBRIUM STRUCTURE, AND ASSOCIATION ANALYSIS IN TCF7L2 .................................. 37
Introduction ............................................................................................................. 37 Methodology ........................................................................................................... 40
INVEST Study Design and Study Population ................................................... 40 INVEST-GENES Study Design and Population ................................................ 41
TCF7L2 Sequencing ........................................................................................ 41 TCF7L2 Polymorphism Discovery and Visual Display ...................................... 42
In Silico Functional Prediction of TCF7L2 Polymorphisms ............................... 42 Race/Ethnicity and Linkage Disequilibrium Structure in Sequenced Samples . 43
Identification of T2D Predictor SNPs from Sequenced Samples ...................... 44 SNP Genotyping in the INVEST-GENES New Onset Diabetes Case Control .. 46
Baseline Characteristic and NOD Association Analysis in the INVEST-GENES NOD Case Control Cohort ............................................................... 47
Pharmacogenetic Analysis in the INVEST-GENES NOD Case Control Cohort ........................................................................................................... 48
Results .................................................................................................................... 49 Sequence and Genotype Data Quality Control in Sequenced Samples ........... 49
Characteristics of Sequenced TCF7L2 Variation .............................................. 49 In Silico Functional Prediction of Sequenced TCF7L2 Variants ....................... 50

6
LD Structure of Sequenced TCF7L2 Variants .................................................. 50 Baseline Characteristics and PCA of Sequenced Samples .............................. 51
Validation of Candidate T2D Predictor SNP Selection in White Sequenced Samples ........................................................................................................ 51
Candidate T2D Predictor SNP Identification in Hispanic Sequenced Samples ........................................................................................................ 52
Candidate T2D Predictor SNP Identification in Black Sequenced Samples ..... 52 Baseline Characteristics and PCA for the INVEST-GENES NOD Case
Control........................................................................................................... 53 NOD Association in White INVEST-GENES NOD Case Control Patients ........ 53
NOD Association in Hispanic INVEST-GENES NOD Case Control Patients ... 54 NOD Association in Black INVEST-GENES NOD Case Control Patients ........ 55
TCF7L2 SNP*HCTZ Treatment Pharmacogenetic Interactions ........................ 56 Discussion .............................................................................................................. 57
Summary and Significance ..................................................................................... 65
3 ASSOCIATION OF TAG SNPS IN KCNJ1, ADD1, ACE, AND AGTR1 WITH CHANGE IN FG AND NOD DURING THIAZIDE TREATMENT ............................. 80
Introduction ............................................................................................................. 80
Methods .................................................................................................................. 83 PEAR Study Design and Population ................................................................ 83
INVEST Study Design and Population ............................................................. 84 Genotyping and Quality Control ....................................................................... 85
Definition and Treatment of Race/Ethnicity ...................................................... 85 Statistical Analysis ............................................................................................ 86
PEAR ......................................................................................................... 86 INVEST ...................................................................................................... 87
Linkage Disequilibrium and Haplotype Design ................................................. 88 Results .................................................................................................................... 88
Baseline Characteristics and Clinical Predictor of Outcome Variables ............. 88 PEAR ......................................................................................................... 88
INVEST ...................................................................................................... 89 Hardy Weinberg Equilibrium for Candidate Gene SNPs................................... 90
KCNJ1 and Increased FG during HCTZ Treatment in PEAR ........................... 90 KCNJ1 and NOD Risk after HCTZ Treatment in INVEST................................. 92
ADD1 and Increased FG during HCTZ Treatment in PEAR ............................. 93 ADD1 NOD Risk after HCTZ Treatment in INVEST ......................................... 95
ACE and Increased FG during HCTZ Treatment in PEAR ............................... 96 ACE NOD Risk after HCTZ Treatment in INVEST ........................................... 97
AGTR1 and Increased FG during HCTZ Treatment in PEAR ........................... 97 AGTR1 NOD Risk after HCTZ Treatment in INVEST ....................................... 97
Discussion .............................................................................................................. 98 Summary and Significance ................................................................................... 106

7
4 LONG TERM ANTIHYPERTENSIVE EXPOSURE AND ADVERSE METABOLIC EFFECTS: PEAR FOLLOW-UP STUDY ......................................... 119
Introduction ........................................................................................................... 119 Methods ................................................................................................................ 122
PEAR and PEAR-2 Study Designs and Populations ...................................... 122 PEAR Follow-Up Study Design and Population ............................................. 123
Statistical Analysis .......................................................................................... 125 Results .................................................................................................................. 126
PEAR Follow-Up Study Population Characteristics at Baseline versus Follow-Up .................................................................................................... 126
Characteristics of PEAR Follow-Up Study Population at Follow-Up ............... 127 Change in FG during Short Term versus Long Term Thiazide Treatment ...... 128
Stepwise Linear Regression of Change in Lab Measures during Long Term Thiazide Treatment ..................................................................................... 129
Stepwise Linear Regression of Lab Measures at Follow-Up Visit after Long Term Thiazide Treatment ............................................................................ 130
Correlation of Change FG and Change in Serum Potassium during Follow-Up ............................................................................................................... 130
Evaluation of IFG, IGT, EGI, and T2D ............................................................ 130 Discussion ............................................................................................................ 131
Summary and Significance ................................................................................... 137
5 SUMMARY AND CONCLUSIONS ........................................................................ 153
APPENDIX
A ADDITIONAL ANALYSIS OF PHARMACOGENETIC PREDICTORS OF THIAZIDE-INCUDED DYSGLYCEMIA ................................................................. 159
B ADDITIONAL ANALYSIS OF PEAR FOLLOW-UP STUDY DATA ....................... 168
LIST OF REFERENCES ............................................................................................. 175
BIOGRAPHICAL SKETCH .......................................................................................... 192

8
LIST OF TABLES
Table page 1-1 Overview of genetic variants associated with type 2 diabetes ............................ 35
2-1 Study populations and study design for TCF7L2 SNP discovery, LD characterization, and statistical analyses ........................................................... 67
2-2 Strongest putative functional variants from TCF7L2 sequence data determined in silico ............................................................................................. 67
2-3 Characteristics of new onset diabetes cases and controls at baseline in INVEST sequenced samples .............................................................................. 68
2-4 Validation of candidate SNP method in INVEST sequenced whites ................... 69
2-5 Identification of candidate SNPs by race/ethnic groups in INVEST sequenced Hispanics and blacks .......................................................................................... 70
2-6 Characteristics of new onset diabetes cases and controls at baseline and during INVEST .................................................................................................... 71
2-7 Association of top candidate SNPs by race/ethnic groups in sequenced samples and INVEST-GENES new onset diabetes case control cohort ............. 72
3-1 Summary of candidate genes investigated as pharmacogenetic predictors ..... 108
3-2 Baseline characteristics of PEAR patients by randomized treatment arm ........ 109
3-3 Association of linear regression model covariates from primary analysis with change in fasting glucose in PEAR ................................................................... 110
3-4 Characteristics of new onset diabetes cases and controls at baseline and during INVEST .................................................................................................. 111
3-5 Association of logistic regression model covariates and new onset diabetes in INVEST ......................................................................................................... 112
3-6 Significant associations for candidate gene tag SNPs on change in fasting glucose in PEAR correction .............................................................................. 113
3-7 Odds ratios for KCNJ1 SNPs and haplotypes for new onset diabetes during HCTZ treatment by race/ethnicity in INVEST ................................................... 114
4-1 Characteristics of PEAR Follow-Up Study participants at baseline and at follow-up ........................................................................................................... 139

9
4-2 Characteristics of PEAR Follow-Up Study participants during follow-up period. .............................................................................................................. 140
4-3 Fasting glucose levels at baseline and at follow-up by drug treatment status .. 141
4-4 Variables associated with FG changes during long term thiazide treatment .... 141
4-5 Variables associated change in HOMA changes during long term thiazide treatment .......................................................................................................... 142
4-6 Variables associated change in insulin changes during long term thiazide treatment .......................................................................................................... 142
4-7 Variables associated with triglyceride changes during long term thiazide treatment .......................................................................................................... 143
4-8 Variables associated with uric acid changes during long term thiazide treatment .......................................................................................................... 143
4-9 Variables associated with FG at follow-up ........................................................ 144
4-10 Variables associated with two hour OGTT glucose at follow-up ....................... 145
4-11 Variables associated with HbA1c at follow-up .................................................. 145
4-12 Variables associated with OGTT AUC at follow-up .......................................... 146
4-13 Variables associated with one hour OGTT glucose at follow-up....................... 146
A-1 Candidate gene SNPs which deviated from Hardy Weinberg Equilibrium in at least one race/ethnic group in PEAR and INVEST ........................................... 159
A-2 SNP effects on change in fasting glucose in PEAR for SNPs previously associated with thiazide-induced dysglycemia ................................................. 161
A-3 INVEST NOD odds ratios for SNPs previously associated with thiazide-induced dysglycemia ........................................................................................ 162
A-4 Stepwise multivariate models for including genetic and pharmacogenetic predictor SNPs in PEAR ................................................................................... 163
A-5 Stepwise multivariate models for including genetic and pharmacogenetic predictor SNPs in INVEST ................................................................................ 163
B-1 Variables associated with LDL changes during long term thiazide treatment ... 168
B-2 Variables associated with HDL changes during long term thiazide treatment .. 169

10
B-3 Variables associated with total cholesterol changes during long term thiazide treatment .......................................................................................................... 170
B-4 Variables associated with serum potassium changes during long term thiazide treatment ............................................................................................. 171

11
LIST OF FIGURES
Figure page 1-1 Theoretical framework of dissertation research aims ........................................ 36
2-1 Summary of Chapter 2 methodology by patient population ................................ 74
2-2 Haploview-generated linkage disequilibrium (LD) plot of sequenced TCF7L2 SNPs in INVEST. ................................................................................................ 75
2-3 Venn diagrams for TCF7L2 polymorphisms by race/ethnicity in sequenced samples. ............................................................................................................. 77
2-4 Plot of principal components one and two in sequenced samples by self-reported race/ethnicity. ....................................................................................... 78
2-5 Odds ratios per copy of allele and 95% confidence intervals for TCF7L2 SNPs and new onset diabetes in INVEST patients by race/ethnicity.. ................ 79
3-1 Physiological role of candidate genes in development of hyperglycemia after thiazide diuretic administration. ........................................................................ 115
3-2 Assessment of fasting glucose in the PEAR study design. ............................... 116
3-3 Change in fasting glucose during hydrochlorothiazide treatment by KCNJ1 SNP rs17137967 genotype in black PEAR patients ......................................... 117
3-4 Odds ratios per copy of allele and 95% confidence intervals for KCNJ1 SNPs nominally associated (p<0.05) with new onset diabetes during hydrochlorothiazide treatment in INVEST patients by race/ethnicity ................ 118
4-1 Progression of subjects for PEAR Follow-Up Study enrollment and analysis ... 147
4-2 Change in fasting plasma glucose during short term versus long term thiazide diuretic treatment................................................................................. 148
4-3 Mean fasting plasma glucose at baseline, end of short term thiazide treatment, and end of long term thiazide treatment by antihypertensive therapy. ............................................................................................................ 149
4-4 Change in fasting plasma glucose during long term thiazide diuretic treatment versus duration of follow-up. ............................................................. 150
4-5 Change in fasting plasma glucose versus change in serum potassium during long term thiazide diuretic treatment.. ............................................................... 151
4-6 Venn diagram of participants with IFG, IGT, and/or EGI. ................................. 152

12
A-1 Haploview-generated linkage disequilibrium (LD) plot of KCNJ1 SNPs in INVEST whites. ................................................................................................ 164
A-2 Haploview-generated linkage disequilibrium (LD) plot of nominally significant ADD1 SNPs in PEAR non-blacks ..................................................................... 165
A-3 Haploview-generated linkage disequilibrium (LD) plot of ADD1 SNPs in INVEST whites. ................................................................................................ 166
A-4 Area under the receiver operating characteristic curve for INVEST HCTZ treated white patients.. ..................................................................................... 167
B-1 Mean fasting glucose after short term and long term thiazide treatment including patients treated with anti-diabetic medications. ................................. 172
B-2 Mean fasting glucose after short term and long term thiazide treatment by add-on antihypertensive treatment including patients treated with anti-diabetic medications. ........................................................................................ 173
B-3 Mean fasting glucose after short term and long term thiazide treatment by thiazide and statin therapy. ............................................................................... 174

13
LIST OF ABBREVIATIONS
-2logL negative two natural log of the likelihood function
95%CI 95% Confidence Interval
μIU/mL Micro-international units per milliliter
ACE Angiotensin I converting enzyme gene
ACE Angiotensin I converting enzyme
ACEI Angiotensin II converting enzyme inhibitor
ADA American Diabetes Association
ADD1 Alpha-adducin 1 gene
AGTR1 Angiotensin II type 1 receptor gene
AIM Ancestry informative marker
ALLHAT Antihypertensive and Lipid-Lowering Treatment to Prevent Heart Attack Trial
AME Adverse metabolic effect
ARB Angiotensin II type 1 receptor blocker
ARIC Atherosclerosis Risk In Communities
AUROC Area under the receiver operator characteristic
BMI Body mass index
BP Blood pressure
CAD Coronary artery disease
CCB Calcium channel blocker
CHF Congestive heart failure
CV Cardiovascular
dbSNP Database for single nucleotide polymorphisms
DNA Deoxyribonucleic acid
EGI Elevated glucose intolerance

14
ENaC Epithelial sodium channel
ESE Exonic splice enhancers
ESRD End stage renal disease
ESS Exonic splice site
FDR False discovery rate
GCRC General clinical research center
GenHAT Genetics of Hypertension-Associated Treatment
GERA Genetic Epidemiology of Responses to Antihypertensives
GLP1 Glucagon-like peptide 1
GNB3 guanine nucleotide-binding protein beta-polypeptide 3
GWAS Genome wide association study
HbA1c Percent glycated hemoglobin
HCTZ Hydrochlorothiazide
HDL High density lipoprotein
HOMA Homeostatic model assessment
HWE Hardy Weinberg Equilibrium
I/D Insertion/deletion
IBD Identity-by-descent
IDF International Diabetes Federation
IFG Impaired fasting glucose
IGT Impaired glucose tolerance
INVEST INternational Verapamil SR-Trandolapril STudy
INVEST-GENES INternational Verapamil SR-Trandolapril STudy GENEtic Substudy
IQR Interquartile range
IR Immediate release

15
JCVI J Craig Venter Institute
JNC6 Sixth report of the Joint National Committee on prevention, detection, evaluation, and treatment of high blood pressure
JNC7 Seventh report of the Joint National Committee on prevention, detection, evaluation, and treatment of high blood pressure
Kb Kilo (thousand) base pairs
KCNJ1 Potassium inwardly-rectifying channel, subfamily J, member 1 gene
LD Linkage disequilibrium
LDL Low density lipoprotein
LVH Left ventricular hypertrophy
MAF Minor allele frequency
mEq/L milliequivalents per liter
mg/dL Milligrams per deciliter
MI Myocardial infarction
mmHg Millimeters of mercury
mRNA Messenger ribonucleic acid
NCBI National Center for Biotechnology Information
NHLBI National Heart, Lung and Blood Institute
NIH National Institutes of Health
NOD New onset diabetes
OGTT Oral glucose tolerance test
OMB Office of Management and Budget
OR Odds ratio
PC Principal component
PCA Principal components analysis
PCR Polymerase chain reaction

16
PEAR Pharmacogenomic Evaluation of Antihypertensive Responses
PEAR-2 Pharmacogenomic Evaluation of Antihypertensive Responses 2
PHARMO-RLS Pharmaco-Morbidity Record Linkage System
QC Quality control
RAS Renin angiotensin system
ROMK1 Renal outer-medullary potassium channel 1
RS&G Resequencing and genotyping service
SD Standard deviation
SE Standard error
SNP Single nucleotide polymorphism
SR Sustained release
SSRI Selective serotonin reuptake inhibitor
T2D Type 2 diabetes
TCA Tricyclic antidepressant
TCF7L2 Transcription factor 7-like 2 gene
TFBS Transcription factor binding site
UCSC University of California at Santa Cruz
UF University of Florida
US United States
UTR Untranslated region
WGA Whole genome amplified

17
Abstract of Dissertation Presented to the Graduate School of the University of Florida in Partial Fulfillment of the Requirements for the Degree of Doctor of Philosophy
GENETIC, PHARMACOGENETIC, AND PHARMACOTHERAPEUTIC RISK FACTORS
FOR THIAZIDE-INDUCED DYSGLYCEMIA
By
Jason Hansen Karnes
August 2012
Chair: Rhonda M. Cooper-DeHoff Cochair: Julie A. Johnson Major: Pharmaceutical Sciences
Hypertension and type 2 diabetes (T2D) are major contributors of morbidity and
mortality. Thiazide diuretics are first line antihypertensive agents, but are associated
with T2D in some individuals. Little knowledge currently exists to identify individuals at
risk for thiazide-induced dysglycemia, defined as alterations in glucose homeostasis.
This research utilizes several phenotypes along a continuum of hyperglycemia to
determine genetic, pharmacogenetic, and pharmacotherapeutic risk factors for
hydrochlorothiazide (HCTZ)-induced dysglycemia.
First, we sought to identify genetic risk factors in the TCF7L2 gene for T2D in
African and Hispanic ethnic/race groups. After sequencing TCF7L2 in new onset
diabetes (NOD) cases and age, gender and race/ethnicity-matched controls from the
INternational VErapamil SR-Trandolapril STudy (INVEST), we identified 910 novel
variants and genotyped potential T2D predictors in a larger INVEST NOD case/control
cohort. We found no novel T2D risk predictor single nucleotide polymorphisms (SNPs)
in African or Hispanic race/ethnic groups. We found nine TCF7L2 SNPs with significant
pharmacogenetic effects on thiazide-induced NOD, with the strongest SNP*HCTZ

18
treatment interaction for rs7917983 (p=3.7x10⁻⁴, pFDR=0.02), suggesting that TCF7L2
SNPs influence NOD risk during HCTZ treatment.
We then investigated the candidate genes KCNJ1, ADD1, ACE, and AGTR1 to
determine pharmacogenetic risk factors for thiazide-induced dysglycemia in the
Pharmacogenomic Evaluation of Antihypertensive Responses (PEAR) study and
INVEST. In PEAR, we found a significant association between the KCNJ1 rs17137967
C allele (beta=8.47, p=0.0008 [pFDR=0.009]) and the ACE rs4303 A allele (beta= -6.39,
p=6.80x10⁻⁴ [pFDR=0.03]) with change in fasting glucose (FG) during thiazide treatment.
In INVEST, multiple significant SNP*HCTZ treatment interactions were found for KCNJ1
in each race/ethnic group. Pharmacogenetic risk factors remained significant after
adjustment for TCF7L2 SNPs from T2D genome wide association studies, suggesting
that pharmacogenetic effects of candidate gene variation were present regardless of an
individual’s baseline genetic risk for T2D.
Finally, we conducted an original clinical study to investigate thiazide treatment
duration as a risk factor for thiazide-induced dysglycemia. The PEAR Follow-Up Study
enrolled previous PEAR and Pharmacogenomic Evaluation of Antihypertensive
Responses 2 (PEAR-2) study participants continuously treated with HCTZ or
chlorthalidone for more than six months. We observed that increased thiazide
treatment duration (beta=0.34, p=0.008) and decreased baseline FG (beta=-0.46,
p=0.02) were associated with increased FG during long term thiazide treatment. Our
results suggest that thiazide-induced FG increases persist during long term treatment,
but are not predicted by short term changes in FG.

19
CHAPTER 1 INTRODUCTION AND BACKGROUND
Hypertension and Type 2 Diabetes
One third of adults in the United States (US) have hypertension, defined as a
systolic blood pressure (BP) greater than or equal to 140 millimeters of mercury
(mmHg) or diastolic BP ≥90 mmHg.1,2 For an individual who is normotensive at age 55
years, the lifetime probability of developing hypertension is 90%.3 Hypertension is a
major underlying cause of cardiovascular (CV) disease as a strong relationship exists
between BP and CV risk that is independent of other risk factors.2 Every 20 mmHg
incremental increase in systolic BP or 10 mmHg in diastolic BP doubles the risk of CV
death, including death due to stroke, ischemic heart disease, and other vascular
causes.4,5 Hypertension also has a major economic impact, as the estimated direct and
indirect cost for hypertension was $73.4 billion in 2009.1 Hypertensive patients are at a
two-fold greater risk of developing Type 2 Diabetes (T2D) compared to non-
hypertensive patients and the presence of both hypertension and T2D can increase CV
risk up to three fold.6,7
T2D constitutes a major health problem in the US and the rest of the world. T2D is
a leading cause of CV, eye, kidney, and neurological disease and the global healthcare
expenditure on diabetes is expected to total $490 billion in 2030.8 The World Health
Organization predicts that by the year 2030, 366 million individuals worldwide will have
diabetes9 and the International Diabetes Federation (IDF) estimate is much higher at
552 million.10 Worldwide, diabetes estimates represent up to a 69 percent increase in
adults with diabetes in developed countries between 2010 and 2030.11

20
T2D increases CV risk at any level of BP and has been designated as a CV
disease risk equivalent according to the National Cholesterol Education Program Adult
Treatment Panel III.7,12-14 Even pre-diabetes (impaired fasting glucose [IFG, fasting
glucose 100-125 mg/dL] or impaired glucose tolerance [IGT, 2 hour oral glucose
tolerance test (OGTT) 140-199 mg/dL]) increases the risk of CV disease and has a
prevalence of nearly 37 percent in the US.15-20 An increased CV risk with pre-diabetes
suggests that CV risks begin at a threshold of glucose that is lower than what is used to
diagnose diabetes. Individuals with IFG and IGT are also at an increased risk of
developing diabetes.21-25 Since T2D is a preventable condition in up to two thirds of
high risk cases,26,27 early identification of at risk patients has the potential to reduce or
delay progression to T2D and related CV and microvascular disease.28
Blood Pressure Reduction with Thiazide Diuretics
Lowering BP with antihypertensive medications is an important means of CV risk
reduction.2 A 10 year, 12 mmHg decrease in BP results in the prevention of 1 death for
every 11 patients treated.29 Antihypertensive therapy is associated with 35-40%
reduction in stroke, 20-25% decrease in myocardial infarction (MI), and greater than
50% reduction in congestive heart failure (CHF).30 The thiazide diuretic
hydrochlorothiazide (HCTZ) is one of the most commonly prescribed antihypertensives
in the US, with over 90 million HCTZ prescriptions in 2010, either as a single agent or in
combination formulations.31
Thiazide diuretics have been the gold standard of antihypertensive therapy in most
clinical trials and they remain a first line recommendation for treating uncomplicated
hypertension.2 The Antihypertensive and Lipid-Lowering Treatment to Prevent Heart
Attack Trial (ALLHAT) and a meta-analysis by Psaty et al. suggest the superiority of

21
thiazide diuretics over other agents in terms of adverse CV outcome reduction.32,33
However, the majority of clinical trial evidence shows that, in uncomplicated
hypertension, the benefit of antihypertensive agents with respect to overall CV
outcomes is driven by BP reduction rather than the drug class of the antihypertensive
agent.34-41 Several trials have observed that thiazide diuretics are inferior to other
antihypertensive drug classes in terms of CV risk reduction, whether used as first line
therapy or in combination with other agents.42,43 Evidence is available to support the
use of thiazide diuretics in many patient populations, in head to head comparisons with
other antihypertensives, and in combination with other antihypertensive agents. For
these reasons and because of low cost, clinical guidelines recommend thiazide diuretics
as initial therapy for most patients with uncomplicated hypertension.2,44
Thiazide-Induced Dysglycemia
Thiazides are first line agents in the treatment of hypertension, but this commonly
prescribed antihypertensive class is associated with adverse metabolic effects (AMEs)
such as dysglycemia. For the purposes of this dissertation, dysglycemia is defined as
disruption of glucose metabolism, including both hyperglycemia and T2D
development.45-51 Thiazide diuretics can adversely affect glucose homeostasis, which
has led to a reproducible association between thiazides and new onset diabetes (NOD)
in large scale clinical trials.50-53 Many large, prospective, clinical trials have shown
significant differences in the rates of NOD for those treated with thiazide and thiazide-
like diuretics compared with angiotensin I converting enzyme (ACE) inhibitors (ACEIs),
angiotensin II type 1 receptor blockers (ARBs), and calcium channel blockers
(CCBs).32,35,42,50 A meta-analysis by Elliott et al. observed that thiazide diuretics confer
the greatest risk of NOD compared to all other major antihypertensive classes.47
22
Several other meta-analyses have shown increased incidences of NOD with thiazide
diuretics compared to other antihypertensive classes.54-58
Differences in study design, follow-up period, sample size, patient populations,
drug dosage, and comparator agents make direct comparisons of thiazide-induced NOD
between trials and interpretation of results difficult. Antihypertensive trials also lack
consistency with respect to the diagnostic criteria of diabetes.33 Despite these
difficulties, prospective clinical trials, meta-analyses, and retrospective studies have
demonstrated a reproducible association for increases in NOD with thiazide diuretics.
In addition, major controversy exists with respect to the clinical implications of
thiazide-induced NOD. Some argue that T2D developed as a direct result of thiazide
diuretic treatment does not carry the same CV risk as T2D through other risk
factors,49,59,60 while others report non-significant trends of increased CV risk associated
with NOD.61,62 In addition, most studies suffer from insufficient follow-up periods since
they were not designed a priori to determine differences in T2D risk between
antihypertensive classes.53 The majority of studies of clinical implications of NOD have
observed significant increases in CV risk with antihypertensive-induced NOD.6,63-67
Currently, the prognostic impact of thiazide-induced NOD is not clear. The lack of direct
supporting evidence of a drug:NOD:CV outcome relationship may be due to a lack of a
priori study design and inadequate statistical power. However, there is little reason to
expect that T2D occurring during antihypertensive therapy carries any less CV risk than
T2D developed as a result of other factors, especially considering the wealth of
evidence supporting CV risk for T2D.

23
Mechanisms of Thiazide-Induced Dysglycemia
Although thiazides have the potential to raise fasting glucose (FG) levels, the
mechanisms by which they cause dysglycemia are not fully understood. Several
theories stipulate that thiazide-induced T2D is related to potassium, uric acid, skeletal
muscle and pancreatic perfusion, and/or the Renin Angiotensin System (RAS).46,68
Thiazide diuretics cause volume loss resulting in RAS stimulation, which has been
associated with impairment of glucose metabolism.69,70 The RAS is further implicated in
NOD by the fact that RAS blocking antihypertensive agents are associated with
decreased NOD incidence in clinical trials.48,50,51,71 Thiazide diuretics also interfere with
renal excretion of uric acid and an elevated level of uric acid has been associated with
obesity and T2D.72-74
Some evidence supports that thiazide-induced dysglycemia is mediated by
potassium.75,76 Thiazide diuretics may increase FG through increases in potassium
excretion, which may blunt insulin release or decrease glucose uptake into skeletal
muscle.46,77 An inverse relationship between serum potassium and FG levels was
observed in a meta-analysis of 59 clinical studies.76 A recent analysis from the
Atherosclerosis Risk In Communities (ARIC) Study observed a greater increase in NOD
risk in patients with low (< 4.0 mEq/L) and moderate (4.0-4.5 mEq/L) serum potassium
levels compared to high potassium levels (4.5 – 5.0 mEq/L).78 However, these studies
are secondary analyses of population averages rather than individual patient data. An
analysis of the Pharmacogenomic Evaluation of Antihypertensive Responses (PEAR)
study used individual patient data and found no correlation between FG increase and
serum potassium decrease.79

24
The association between thiazide diuretics and dysglycemia is strong considering
the reproducibility of this association from antihypertensive clinical trials, the physiologic
plausibility of proposed mechanisms, and the paucity of directly conflicting evidence.
Since thiazide diuretics are first line antihypertensives, their potential to induce T2D and
associated CV risk is concerning. Further knowledge regarding the mechanisms of
thiazide-induced NOD could help identify more effective predictors of thiazide-induced
NOD.
Genetics of Type 2 Diabetes
Although development of T2D is affected by a number of well described
environmental factors, T2D has strong genetic influences.80,81 Major differences in
disease prevalence among different racial/ethnic groups, including a disproportionately
high T2D prevalence in Hispanics and blacks,1 suggest a genetic component to T2D.
Genetic factors are further implicated by increased rates of T2D among persons who
have first degree relatives with the disease.82,83 Offspring of one parent with T2D have
a 40 percent lifetime risk of developing T2D, whereas offspring of two parents with T2D
have an almost 70% lifetime risk of developing T2D.84 In addition, concordance rates
for the presence of T2D are higher in monozygotic twins (up to 70%) than in dizygotic
twins (20-30%).85-90 T2D heritability is estimated to exceed 50 percent and sibling
relative risk (λs) is estimated at three.82,88
The large number of single nucleotide polymorphisms (SNPs) that have now been
associated with T2D also supports a genetic basis for T2D development. Since initial
T2D genome wide association studies (GWASs) in 2006 and 2007,91,92 a deluge of T2D
GWAS and large scale meta-analyses of GWAS data have been published to elucidate
SNPs that confer T2D susceptibility.80,91,93,94 Over 40 loci have been associated with

25
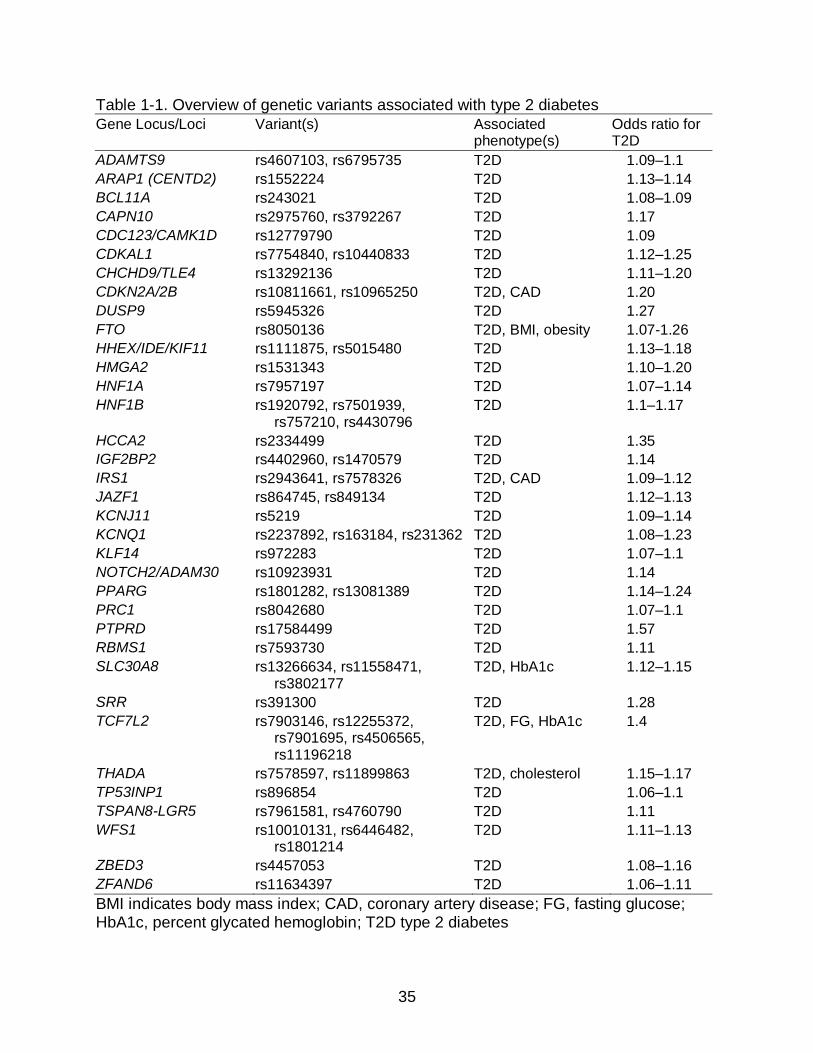
T2D with over 30 of these loci reproducibly associated with T2D.93 (Table 1-1) T2D-
associated SNPs are usually common in studied populations and have modest effect
sizes with most odds ratios ranging from 1.1-1.3. Many of these T2D risk alleles have
also been associated with T2D-related traits, such as percent glycated hemoglobin
(HbA1c), body mass index (BMI), and obesity. Although the involvement of a number of
the associated genes in the pathophysiology of T2D is unclear, many associated genes
play roles in insulin secretion, insulin resistance, and obesity that can be easily linked to
the T2D phenotype. Several T2D SNP associations were found in genes known to
cause monogenic forms of diabetes and in genes encoding direct targets of anti-diabetic
drugs (KCNJ11 and PPARG). Further knowledge of genes involved in T2D physiology
may prove useful in the identification of possible drug targets as well as the prediction of
individual drug response.
GWAS has contributed to our knowledge of the genetics and pathophysiology of
T2D, but our ability to translate GWAS results into clinical T2D prediction algorithms
suffers from several major limitations. While a considerable number of SNPs have been
reproducibly associated with T2D, SNPs from GWAS currently explain only 10-15% of
T2D heritability.95 T2D risk scores that include GWAS-associated SNPs have not been
shown to improve T2D risk prediction algorithms when family history of T2D is
known.96,97 In addition, T2D GWAS has been performed almost exclusively in
populations with European and Asian ancestry, leaving populations such as Hispanics
and blacks largely uninvestigated. Considering the strong genetic component of T2D
development, further study of genetic associations with T2D, especially in black and

26
Hispanic populations, may prove beneficial in identifying those at an increased risk for
developing the disease.
The Transcription Factor 7-Like 2 Gene (TCF7L2)
Of the SNPs associated with T2D in GWAS, variants in the Transcription Factor 7-
Like 2 gene (TCF7L2), specifically the SNP rs7903146, have been the strongest and
most reproducible signals yet identified.92,98-100 A recent meta-analysis in 42,542
individuals with T2D and 98,912 controls of European descent confirmed that
rs7903146 has the strongest association with T2D of any known genetic marker.95 The
relative risk of the rs7903146 T allele for T2D is approximately 1.46 (meta-analysis
p=1x10-140), making the TCF7L2 SNP rs7903146 the genetic risk factor most strongly
associated with T2D and conferring the greatest risk of T2D.101
Although GWAS have identified SNPs in TCF7L2 as consistent and reliable risk
factors for T2D in European populations, TCF7L2 SNPs identified in European
populations may not be genetic risk factors for T2D in African and Hispanic
populations.91,99,102 A robust association of TCF7L2 SNPs and T2D is observed from
GWAS in European populations,99,102 but studies conducted in groups with non-
European ancestry have not yielded similarly robust associations between TCF7L2
SNPs and T2D.98,103 The relatively small number of studies in populations with African
and Hispanic descent have inconsistently observed genetic associations.101,103-108
A recent study including sequencing of the rs7903146 region in African American
concluded that rs7903146 was the most highly associated TCF7L2 SNP.109 However,
other studies in populations of African descent have observed no association between
the rs7903146 T allele and T2D.99,103,104 A study by Waters et al. observed significant
associations with rs7903146 in Europeans (odds ratio [OR] 1.55 [1.29–1.87]), African

27
Americans (OR 1.32 [1.16–1.51]), and Hispanics (OR 1.31 [1.19–1.45]).110 Other
studies in Hispanic populations have yielded non-significant ORs for rs7903146 and
T2D, primarily in individuals of Mexican descent.106,107 Diversity and admixture among
Hispanic populations make interpretation of genetic associations especially difficult.
Difficulty in interpretation is exacerbated by the fact that few association studies have
been published and individuals of Mexican descent do not provide an adequate model
of genetic diversity for the Hispanic population.
In the US, the prevalence of diagnosed T2D in 2012 was estimated at 7.1% for
non-Hispanics whites, 11.8% for Hispanics, and 12.6% for non-Hispanic blacks.1
Despite the higher T2D prevalence in African and Hispanic Americans, studies in these
race/ethnic groups have attempted to replicate TCF7L2 associations from studies in
Europeans rather than perform GWAS or acquire complete coverage of the TCF7L2
gene in those populations. In stark contrast to data available in Europeans, few T2D
GWAS have been published in populations of African or Hispanic descent. The lack of
published GWAS suggests that alternate TCF7L2 SNPs could more accurately predict
T2D in African and Hispanic populations. GWAS data are particularly important in
African and Hispanic race/ethnic groups, who suffer from much higher rates of T2D.
The identification of genetic risk factors for T2D in African and Hispanic populations
forms the focus of Aim 1 of this dissertation, described in Chapter 2. (Figure 1-1)
Pharmacogenetics of Thiazide-Induced Dysglycemia
A priori identification of patients who will develop hyperglycemia during thiazide
treatment may identify patients who would benefit from treatment with alternate
antihypertensives. Consistent evidence from clinical trials supports that thiazides
increase glucose levels and risk for T2D, however this adverse metabolic effect does

28
not occur in all patients and clinical factors such as BMI and elevated BP are also
important predictors of NOD.49-51,111 Inter-individual variability in thiazide-induced
dysglycemia and strong genetic associations with T2D suggest that thiazide-induced
dysglycemia may also have pharmacogenetic influences. In addition to known clinical
predictors of NOD, identification of patient specific genetic risk factors for thiazide-
induced dysglycemia has the potential to delay or prevent T2D through preferential
prescription of alternative antihypertensive agents.46
Pharmacogenetic associations with thiazide-induced dysglycemia have been
observed, suggesting that pharmacogenetic risk factors could be used to predict
thiazide-induced glucose increases.112-114 Bozkurt et al. found significant associations
between the angiotensin II type 1 receptor gene (AGTR1) +A1166C, the ACE gene
(ACE) G4656C, and the guanine nucleotide-binding protein beta-polypeptide 3 (GNB3)
C825T polymorphisms and NOD in individuals treated with thiazides and thiazide-like
diuretics compared with those not treated with these agents.112 An investigation from
the Genetics of Hypertension-Associated Treatment (GenHAT) study observed that the
amiloride-sensitive epithelial sodium channel (SCNN1A) SNP rs2228576 A allele was
associated with increased FG in individuals treated with a CCB compared with those
treated with the thiazide-like diuretic chlorthalidone.113 Supporting the role of potassium
depletion in thiazide-induced changes in glucose metabolism, the non-synonymous
SNP rs59172778 (M338T) in the potassium inwardly rectifying channel subfamily J
member 1 (ROMK1) gene (KCNJ1) has been associated with decreased FG after four
weeks of HCTZ treatment.114

29
The three pharmacogenetic studies on thiazide-induced dysglycemia have left the
majority of genetic variability in candidate genes uninvestigated. Pharmacogenetic
studies on thiazide-induced dysglycemia have focused on a small number of putative
functional SNPs in genes involved in electrolyte homeostasis and the RAS. In addition,
despite racial/ethnic differences in T2D prevalence, in genetic associations with T2D,
and in linkage disequilibrium (LD) structure, the impact of race/ethnicity on genetic and
pharmacogenetic risk factors for thiazide-induced dysglycemia remains largely
uninvestigated.98,115 Further study of the influence of candidate genes with roles in
electrolyte homeostasis and the RAS on thiazide-induced dysglycemia, as well as
replication of previous pharmacogenetic associations, might help determine genetic
markers for identification of patients who will develop dysglycemia during thiazide
treatment. The identification of pharmacogenetic risk factors for dysglycemia using a
candidate gene approach forms the basis for Aim 2 of this dissertation research,
described in Chapter 3. (Figure 1-1)
Short and Long Term Thiazide-Induced Dysglycemia
The long term effects of antihypertensive medications on dysglycemia are well
studied, but randomized BP reduction trials consider antihypertensive-related AMEs as
a secondary outcome or in secondary analyses.53 The results of investigations into
antihypertensive-related AMEs are thereby subject to bias and have not provided
conclusive evidence. Clinical trials investigating thiazide diuretics for BP reduction
typically monitor FG every six months or every year, which may be adequate for clinical
monitoring but not for characterization of short term AMEs of these drug classes. To
date, only limited data are available comparing short term (1-2 months) and longer term

30
(between 6 months and five years) AMEs of antihypertensive therapy in the same
patient population.116
The PEAR study was designed to test patient BP response and AMEs after
administration of the thiazide diuretic HCTZ and/or the beta blocker atenolol.117 The
PEAR study quantified changes in BP, FG, insulin, serum potassium, and homeostatic
model assessment (HOMA) during 9-18 weeks of antihypertensive therapy with atenolol
100 mg, HCTZ 25 mg, and their combination. During HCTZ monotherapy and atenolol
plus HCTZ combination therapy in PEAR patients with abdominal obesity, the
proportion of patients with new onset IFG or triglycerides ≥ 150 mg/dL was significantly
increased and the proportion of participants with high density lipoprotein (HDL) ≤ 40
mg/dL was significantly increased compared to patients without abdominal obesity.118
The observation of increased AMEs during HCTZ treatment confirmed that AMEs of
thiazide diuretics could be observed in a short term period and supports the utility of
patient specific characteristics such as abdominal obesity in predicting AMEs of thiazide
diuretics.
However, the PEAR study duration (approximately 18 weeks) is insufficient to
characterize thiazide effects on glucose over a longer duration of time (between six
months and five years). Since hypertensive treatment typically requires lifetime therapy,
characterization of long term effects of antihypertensive medications on glucose and
lipid status is important. The relative severity of glucose alterations during short and
long-term antihypertensive therapy and characteristics that make patients more
susceptible to hyperglycemia during long term antihypertensive treatment warrants
further investigation.
31
Thiazide diuretic-induced changes in glucose metabolism are typically evaluated
using FG and T2D is not diagnosed until FG is ≥126 mg/dL.119 However, CV risk does
not begin when a patient’s FG becomes greater than 126 mg/dL. IFG carries an
adverse prognostic impact on CV outcomes, although evidence is inconclusive.15,17,120
In addition, several studies suggest that IGT or the two hour glucose measurement
during an OGTT, may be a better predictor of CV disease and mortality than FG.121-126
HbA1c has also been shown to better predict CV risk than FG.127 Despite the CV risk
associated with IFG, IGT, and increased HbA1c, analyses of dysglycemia in BP
reduction trials focus on T2D status determined by a FG ≥ 126 mg/dL.119
Additionally, identification of a patient in early stages of impaired beta cell function
or insulin sensitivity can be difficult. FG may not be a very sensitive measure for
metabolic abnormality since T2D prevalence determined using FG underestimates T2D
prevalence obtained using the two hour OGTT glucose as FG values often appear
normal in patients with IGT.119,126 In individuals with IGT, hyperglycemia may only
manifest when the individual is challenged by an OGTT, a procedure involving a 75
gram oral glucose load and plasma glucose measurements at baseline, one hour, and
two hour time points.128 Guidelines from the American Diabetes Association (ADA)
suggest a 2 hour post-load plasma glucose less than 140 mg/dL indicates normal
glucose tolerance, 140 to 199 mg/dL indicates IGT, and greater than 200 mg/dL
indicates a positive T2D diagnosis.119
The OGTT has not been adopted in clinical practice nor is OGTT utilized in
controlled trials primarily due to increased cost, time, and inconvenience of the
procedure. However, utilization of OGTT may be clinically valuable in patients who are

32
suspected of having metabolic abnormalities, especially considering the utility of the
OGTT for CV risk prediction. In contrast, HbA1c has several advantages over FG and
has been recommended by the ADA as a criterion for the diagnosis of T2D (HbA1c ≥
6.5%).119 The gold standard for in vivo studies of insulin sensitivity is the
hyperinsulinemic euglycemic clamp, however this method is not used clinically due to
an increased time and risk associated with the procedure.129 HOMA, defined as the
product of fasting insulin and FG divided by 405, is a convenient, noninvasive indicator
of insulin sensitivity that correlates well with insulin sensitivity determined by the
hyperinsulinemic euglycemic clamp.130 Despite the utility of HbA1c, the OGTT, and
HOMA in diagnosing metabolic abnormalities and predicting CV risk, the effects of
thiazide diuretics on HbA1c, OGTT, and HOMA are not well understood. The
identification of thiazide treatment duration as a risk factor for AMEs and the need to
acquire detailed glycemic characteristics of patients after long term thiazide treatment
forms the basis of Aim 3 of this dissertation research, described in Chapter 4. (Figure 1-
1)
Summary and Significance
Hypertension and T2D are major contributors of morbidity and mortality. Thiazide
diuretics are first line agents for the treatment of hypertension, but can induce T2D in
certain individuals. Increasing prevalence of T2D in the US makes T2D prevention a
global public health priority.131-133 Data are lacking to allow identification of individuals
at risk for thiazide-induced FG increases and T2D. The ability to identify at risk
individuals would enable physicians to avoid thiazides in these patients and
preferentially prescribe alternate antihypertensive drugs. A proactive approach to

33
identifying individuals at risk for T2D may allow early reduction of modifiable risk factors,
such as thiazide pharmacotherapy, and eventually lead to T2D prevention.53
The research outlined in this dissertation utilizes several phenotypes along the
diabetes continuum, including change in FG and NOD, which allows evaluation of both
a surrogate and a clinical endpoint for metabolic and CV risk. NOD carries greater
clinical significance but variability in this phenotype is more susceptible to environmental
effects, confounding genetic and pharmacogenetic associations. Change in FG is a
surrogate for eventual T2D but variability in this endpoint is more likely to be directly
related to gene products and thiazide therapy.
The research described under Aim 1 seeks to identify SNPs in TCF7L2 as risk
factors for T2D in under-represented ethnic/race groups and to investigate the impact of
race/ethnicity on SNP associations. Identification of these genetic risk factors in
TCF7L2 may help improve our risk assessment for T2D and increase our understanding
of T2D pathophysiology. Access to TCF7L2 sequencing data in genetically diverse
race/ethnic groups from the INternational VErapamil SR-Trandolapril STudy (INVEST)
represents a unique opportunity to study differences in LD structure and identify
alternate T2D predictor SNPs in African and Hispanic populations from the US and
Puerto Rico.
The research described under Aim 2 utilizes tag SNPs for candidate genes
involved in the RAS and electrolyte homeostasis, chosen based on their potential
impact on thiazide-induced changes in FG and NOD. Identification of pharmacogenetic
risk factors for thiazide-induced dysglycemia is aided by clinical and genetic data for two

34
large antihypertensive study populations which incorporate thiazide treatment, provide
adequate statistical power, and enable replication of genetic associations.
The research described under Aim 3 seeks to refine the role of thiazide treatment
duration as a pharmacotherapeutic risk factor for thiazide-induced dysglycemia, to
compare short and long term effects of thiazide pharmacotherapy on FG, and to acquire
detailed glycemic characteristics after long term thiazide treatment. Such an
investigation might implicate duration of thiazide treatment in T2D risk and support more
rigorous monitoring of FG during short term thiazide treatment to predict long term
changes in FG. The PEAR Follow-Up Study will enroll previous PEAR participants after
long term thiazide therapy, allowing a comparison of short and long term dysglycemia.
The PEAR Follow-Up Study is unique in assessment of FG and detailed glycemic
characteristics after long term thiazide therapy in a population for which FG response
data are currently available after short term thiazide treatment.
The aims of this research proposal are designed to determine genetic (Aim 1),
pharmacogenetic (Aim 2), and pharmacotherapeutic (Aim 3) risk factors for thiazide-
induced dysglycemia. (Figure 1-1) Identification of genetic, pharmacogenetic, and
pharmacotherapeutic risk factors may lead to a more comprehensive, accurate, and
effective assessment of individuals at risk for T2D during thiazide therapy. Improved
T2D risk assessments may contribute to a clinical paradigm shift away from reactive
long term FG monitoring during thiazide therapy and towards proactive prevention of
T2D through avoiding thiazides in patients at risk for NOD and rigorous FG monitoring.
Prevention of T2D has the potential to reduce the disease burden of T2D, including a
negative economic and public health impact.
35
Table 1-1. Overview of genetic variants associated with type 2 diabetes
Gene Locus/Loci Variant(s) Associated phenotype(s)
Odds ratio for T2D
ADAMTS9 rs4607103, rs6795735 T2D 1.09–1.1
ARAP1 (CENTD2) rs1552224 T2D 1.13–1.14
BCL11A rs243021 T2D 1.08–1.09
CAPN10 rs2975760, rs3792267 T2D 1.17
CDC123/CAMK1D rs12779790 T2D 1.09
CDKAL1 rs7754840, rs10440833 T2D 1.12–1.25
CHCHD9/TLE4 rs13292136 T2D 1.11–1.20
CDKN2A/2B rs10811661, rs10965250 T2D, CAD 1.20
DUSP9 rs5945326 T2D 1.27
FTO rs8050136 T2D, BMI, obesity 1.07-1.26
HHEX/IDE/KIF11 rs1111875, rs5015480 T2D 1.13–1.18
HMGA2 rs1531343 T2D 1.10–1.20
HNF1A rs7957197 T2D 1.07–1.14
HNF1B rs1920792, rs7501939, rs757210, rs4430796
T2D 1.1–1.17
HCCA2 rs2334499 T2D 1.35
IGF2BP2 rs4402960, rs1470579 T2D 1.14
IRS1 rs2943641, rs7578326 T2D, CAD 1.09–1.12
JAZF1 rs864745, rs849134 T2D 1.12–1.13
KCNJ11 rs5219 T2D 1.09–1.14
KCNQ1 rs2237892, rs163184, rs231362 T2D 1.08–1.23
KLF14 rs972283 T2D 1.07–1.1
NOTCH2/ADAM30 rs10923931 T2D 1.14
PPARG rs1801282, rs13081389 T2D 1.14–1.24
PRC1 rs8042680 T2D 1.07–1.1
PTPRD rs17584499 T2D 1.57
RBMS1 rs7593730 T2D 1.11
SLC30A8 rs13266634, rs11558471, rs3802177
T2D, HbA1c 1.12–1.15
SRR rs391300 T2D 1.28
TCF7L2 rs7903146, rs12255372, rs7901695, rs4506565, rs11196218
T2D, FG, HbA1c 1.4
THADA rs7578597, rs11899863 T2D, cholesterol 1.15–1.17
TP53INP1 rs896854 T2D 1.06–1.1
TSPAN8-LGR5 rs7961581, rs4760790 T2D 1.11
WFS1 rs10010131, rs6446482, rs1801214
T2D 1.11–1.13
ZBED3 rs4457053 T2D 1.08–1.16
ZFAND6 rs11634397 T2D 1.06–1.11
BMI indicates body mass index; CAD, coronary artery disease; FG, fasting glucose; HbA1c, percent glycated hemoglobin; T2D type 2 diabetes

36
Figure 1-1. Theoretical framework of dissertation research aims. Red arrows indicate
the modification of risk for dysglycemia by genetic, pharmacogenetic, and pharmacotherapeutic risk factors. Green arrows indicate the interaction of genetic risk factors and drug therapy to produce a pharmacogenetic interaction. TCF7L2 indicates Transcription factor 7-Like 2 gene; SNP, single nucleotide polymorphism.

37
CHAPTER 2 SEQUENCING, DETERMINATION OF LINKAGE DISEQUILIBRIUM STRUCTURE,
AND ASSOCIATION ANALYSIS IN TCF7L2
Introduction
Genetic influences on T2D are well established, primarily based on T2D GWAS,
performed mostly in individuals with European ancestry.81,82 SNPs in TCF7L2 have
been identified as robust predictors of T2D risk in European populations, but TCF7L2
SNPs inconsistently predict T2D in other race/ethnic groups.91,99,102 Despite a higher
prevalence of T2D in individuals of African or Hispanic descent, the association of
TCF7L2 SNPs and T2D in these populations remains unclear.98,99,101,103-108,110,134
Studies conducted in groups of African or Hispanic descent have not identified TCF7L2
SNPs consistently associated with T2D risk. Although some evidence suggests that the
TCF7L2 SNP rs7903146 is functional,135 a SNP that is functionally responsible for the
association between TCF7L2 and T2D has not yet been identified.
A relatively small number of studies in African and Hispanic populations have
observed significant associations between T2D with TCF7L2 SNPs and report variable
point estimates for TCF7L2 SNPs.101,103-108 A recent study including sequencing of the
rs7903146 region in African Americans concluded that rs7903146, which is the
strongest SNP in European populations,95 was the most highly associated TCF7L2 SNP
in the African Americans studied.109 However, other studies in populations of African
descent have observed no association between the rs7903146 T allele and T2D.99,103,104
Studies in Hispanic populations have yielded non-significant ORs, primarily in
individuals of Mexican descent.106,107 Diversity and admixture among Hispanic
populations make interpretation of genetic associations especially difficult.
Interpretation of findings in Hispanic populations is also confounded by the fact that few

38
association studies have been published and that individuals of Mexican descent do not
provide an adequate model of genetic diversity among other Hispanic populations.
Studies in populations of African or Hispanic descent have attempted to replicate
T2D associations with TCF7L2 SNPs from studies in Europeans rather than explore
TCF7L2 more broadly. In addition, few T2D GWAS are currently available in African or
Hispanic populations.102 A recently published GWAS in African Americans observed a
strong signal in a gene previously unassociated with T2D and only nominal significance
for the TCF7L2 SNP rs7903146.134 The nominally significant association of TCF7L2 in
African Americans contrasts with the reproducibly significant associations of rs7903146
and T2D observed in populations of European ancestry. In addition, the T2D phenotype
from the GWAS in African Americans was complicated by end stage renal disease
(ESRD). The presence of ESRD in all T2D cases in this study might explain the fact
that the strongest genetic signals observed in the discovery cohort were related to
diabetic nephropathy rather than T2D.134 Current GWAS chip genotyping methods are
inadequate to capture low frequency variation and population-specific variation in
individuals of African or Hispanic descent.102 Sequence data in African and Hispanic
populations may be useful in identifying novel T2D genetic signals and determining
causal variants for T2D in TCF7L2.
Currently available sequence data are limited in TCF7L2 in African and Hispanic
populations and catalogued variation in TCF7L2 is not comprehensive.109 Association
studies in ethnically diverse populations have investigated only a small portion of
TCF7L2 variation and alternate TCF7L2 SNPs may be better predictors of T2D in
African and Hispanic populations. Additional TCF7L2 sequence data in balcks or

39
Hispanics might aid in the identification of genetic risk factors in diverse race/ethnic
groups, where T2D prevalence is high, and may aid in determining baseline T2D risk.
More effective T2D predictors could be used to improve T2D risk assessments in
African or Hispanic populations and to account for underlying genetic T2D risk when
investigating pharmacogenetic risk factors for NOD.
In addition to genetic risk factors, many environmental factors are well known risk
factors for T2D.50,97,136 Consistent evidence supports that thiazide diuretics are an
environmental risk factor for T2D, as they have been associated with NOD in many
randomized clinical trials.47,53 Strong genetic influences on T2D and inter-individual
variability in NOD suggest pharmacogenetics might play a role in thiazide-induced T2D.
In addition, TCF7L2 SNPs might act as pharmacogenetic risk factors if the combination
of TCF7L2 risk alleles and thiazide treatment increased NOD risk in a synergistic
fashion. The strength of the association between TCF7L2 and T2D makes TCF7L2 a
candidate gene for the pharmacogenetics of thiazide-induced NOD. To our knowledge,
TCF7L2 has not been investigated with respect to pharmacogenetics of thiazide-
induced NOD.
The purpose of the research presented in this chapter is to identify new variation in
TCF7L2, define LD structure, and investigate TCF7L2 SNP associations with NOD in
African and Hispanic populations. We accomplished this using DNA samples from the
INternational Verapamil SR-Trandolapril STudy GENEtic Substudy (INVEST-GENES),
which compared CV outcomes and NOD following treatment with a CCB or beta
blocker-based antihypertensive treatment strategy in an ethnically diverse cohort of
patients with hypertension and coronary artery disease (CAD). In addition, we

40
investigated the impact of TCF7L2 polymorphisms on the development of NOD by
HCTZ treatment in INVEST-GENES.
Methodology
INVEST Study Design and Study Population
INVEST randomized patients to either atenolol or verapamil sustained release
(SR)-based antihypertensive treatment strategies and followed patients for adverse CV
outcomes and NOD. A total of 22,576 patients at least 50 years of age with
hypertension and CAD were enrolled between September 1997 and February 2003 at
862 sites in 14 countries. All patients enrolled in INVEST provided written informed
consent, and the institutional review boards of participating study centers approved the
study protocol. The design, primary outcome, and NOD results have been previously
published in detail.50,137,138 NOD was determined by site investigators from a review of
all available patient data, including use of diabetic medication and available laboratory
data.50
Briefly, the CCB-based strategy consisted of verapamil SR 240 mg daily (Step 1),
addition of trandolapril 2 mg daily (Step 2), dose titration to verapamil SR 240 mg /
trandolapril 2 mg twice daily (Step 3), and HCTZ 25 mg daily add-on treatment (Step 4)
to achieve Sixth Report of the Joint National Committee on Prevention, Detection,
Evaluation, and Treatment of High Blood Pressure (JNC VI) BP goals.139 The beta
blocker-based strategy consisted of atenolol 50 mg daily (Step 1), addition of HCTZ 25
mg daily (Step 2), titration to atenolol 50 mg / HCTZ 25 mg twice daily (Step 3), and
trandolapril 2 mg daily add-on treatment (Step 4) for BP control as necessary. Both
strategies were optimized to provide end organ protection with trandolapril in patients
with diabetes and/or renal insufficiency.

41
INVEST-GENES Study Design and Population
A total of 5,979 genomic DNA samples were collected from participants in INVEST
from June 2001 to February 2003 from 184 sites in the US and Puerto Rico. INVEST-
GENES participants provided additional informed consent for genomic studies. The
INVEST-GENES population is similar to the entire INVEST and includes an ethnically
diverse population with a large population of Hispanic individuals, mostly from Puerto
Rico. INVEST genomic DNA was collected using buccal cells from mouthwash samples
using commercially available kits (PureGene, Gentra Systems Incorporated,
Minneapolis, MN) as previously described.140
TCF7L2 Sequencing
A total of 150 INVEST-GENES samples were sequenced for TCF7L2, including 25
white, Hispanic, and black NOD cases and controls. Our sample size provided 99%
power to detect polymorphisms of >5% frequency in the overall population (n=150) and
95% power to detect such polymorphisms within each race/ethnic group (n=50).
Polymerase chain reaction (PCR) amplification, sequencing, and SNP discovery was
performed by the National Heart, Lung, and Blood Institute (NHLBI) Resequencing and
Genotyping (RS&G) service at the J Craig Venter Institute (JCVI) on whole genome
amplified (WGA) INVEST-GENES deoxyribonucleic acid (DNA).
The target sequence region included the entire TCF7L2 gene, including 2 kb
upstream and downstream of gene ends (219,874 base pairs total). Amplicons were
PCR amplified using Tm matched primers designed from a masked reference sequence
(Human Genome NCBI36 Assembly) to exclude problematic regions. Amplicons were
“tailed” with a universal M13 forward and reverse sequencing primer. Sanger Big Dye®
Terminator sequencing and detection with capillary-based sequencing machines was
42
used to determine DNA sequences on forward and reverse strands to provide double-
stranded coverage.
TCF7L2 Polymorphism Discovery and Visual Display
Sequences were base-called and assembled on the reference sequence.
Sequence data for each amplicon were used in SNP discovery only if amplicons were
successfully sequenced on both strands in ≥ 75% of samples. SNPs and small
insertion/deletion variants were computationally identified, confirmed on both forward
and reverse strands, and chromatograms were manually reviewed by specialized data
analysts at the JCVI. A batch inquiry of the region sequenced was performed using the
National Center for Biotechnology Information (NCBI) database for single nucleotide
polymorphisms (dbSNP [www.ncbi.nlm.nih.gov]) to determine previously identified
polymorphisms. TCF7L2 SNP data were uploaded into the publicly available dbSNP on
September 21, 2010 under Batch ID TCF7L2-R122_ISDP1-20100921 with population
data displayed under the population ID R122_ISDP1. Amplicons and polymorphisms
were visually displayed in the University of California at Santa Cruz (UCSC) genome
browser.141 Sequenced genotype data were also visually displayed using the Genome
Variation Server.142
In Silico Functional Prediction of TCF7L2 Polymorphisms
Polymorphisms were first tested for putative functional status. Polymorphisms
were considered to have putative functional consequences if located in exons, the
promoter region, the 5’ or 3’ untranslated region (UTR), transcription factor binding sites
(TFBS), predicted miRNA sites, regions of high mammalian conservation, or within
known structural variants. Exonic splice enhancers (ESE) and exonic splice silencers
(ESS) were also predicted. Functional consequences of TCF7L2 polymorphisms were

43
determined in silico using SNPNexus and Pupasuite.143,144 Functional effects of radical
amino acid changes were predicted for non-synonymous polymorphisms using SIFT.145
Race/Ethnicity and Linkage Disequilibrium Structure in Sequenced Samples
INVEST race/ethnic groups were determined by patient report with interaction by
the study investigator and confirmed through principal components analysis (PCA).
PCA was performed using JMP Genomics version 5.0 (SAS, Cary, NC) in which the
EIGENSTRAT method was implemented.146 PCA was performed on an LD-pruned
(r2>0.5) HumanCVD BeadChip dataset (n=2,214 INVEST-GENES participants and
n=32,235 SNPs). INVEST-GENES included primarily white, Hispanic, and black
race/ethnic groups. If self-reported race/ethnic category disagreed strongly with PCA
clustering results, patients were re-categorized to reflect PCA, which was considered to
better reflect genetic ancestry. PCA was also performed within each race/ethnic group
for principal components (PCs) adjustment in analyses performed by race/ethnicity.
PCA and race re-categorization was performed by the UF Center for
Pharmacogenomics.
In addition, 87 ancestry informative markers (AIMs) were genotyped on 149 (99%)
sequenced individuals. Greater than 65 loci were acquired in 135 (91%) sequenced
samples and self-reported and PCA-derived race/ethnic groups were also visually
confirmed with AIMs data using a ternary plot. To determine LD structure of TCF7L2 in
each race/ethnic group, LD plots of pairwise r2 for all sequenced SNPs were produced
by race/ethnicity in Haploview version 4.2.147 Haplotype blocks were defined using the
method proposed by Gabriel et al.148 Haplotype blocks were visually examined for
degree of LD and number of haplotype blocks within each race/ethnic group. In
addition, pairwise LD was determined for GWAS-associated TCF7L2 SNPs, individually

44
genotyped T2D predictor SNPs, and putative functional SNPs within each race/ethnic
group.
Identification of T2D Predictor SNPs from Sequenced Samples
TCF7L2 polymorphisms were selected as candidate T2D predictor for individual
SNP genotyping for Hispanic and black race/ethnic groups in a larger case control
cohort (described below). Candidate T2D predictor SNPs were identified in sequenced
whites and compared to previous GWAS results in Europeans to validate SNP selection
procedures for Hispanic and Black race/ethnic groups. No candidate SNPs in whites
were genotyped in the larger case control since T2D predictor SNPs are known from
GWAS in Europeans.
Selection of candidate SNPs was based on NOD association analysis described
below, SNP call rate, Hardy Weinberg Equilibrium (HWE), minor allele frequency (MAF),
putative functional consequences, and pairwise LD. SNPs were not considered
candidates for genotyping if they were in high LD (r2>0.8) with the GWAS index SNPs
rs7903146 or rs12255372 or any SNP on the HumanCVD Beadchip, since HumanCVD
Beadchip data had already been acquired. SNPs were also excluded as candidates if
SNPs had insufficient call rates or higher than expected departure from HWE and
heterozygosity. Variants were considered good candidates if they had a high frequency
(MAF>0.10) in black or Hispanic race/ethnic groups or they were newly identified by the
sequencing effort.
Selection of candidate T2D predictor SNPs for individual SNP genotyping was
based primarily on the strength of association (p value) and point estimate (odds ratio)
in an unadjusted logistic regression in a dominant model by race/ethnicity. The
dominant model was used in the original T2D GWAS91 and is appropriate considering

45
the limited power available within each race/ethnic group of sequenced samples to
detect allelic ORs. Additionally, several NOD association analyses were carried out by
race/ethnicity in sequenced samples using a variety of other statistical models, with the
intent to determine T2D predictors that were robust to changes in statistical models.
However, no correction for multiple comparisons was applied to SNP analyses in
sequenced samples since sufficient power to detect associations by race/ethnicity after
multiple comparisons adjustment was unlikely.
Consistency of associations in various statistical models was assessed, indicated
by the addition of the negative log of the p value for the four models described below to
create a –log(p) score. The validity of the unadjusted dominant model and the –log(p)
score to indicate candidate T2D predictor SNPs was confirmed in sequenced whites.
Sequenced samples were tested for association with NOD in logistic regressions using
both additive and dominant models, including 1) an unadjusted model, 2) a model
adjusted for PCs one, two, and three, 3) a model adjusted for AIMs, and 4) a model
adjusted for variables clinically associated with T2D.
Clinical variables for adjustment were chosen based on previous association with
NOD in INVEST50 and included age, BMI, gender, average on-treatment systolic BP, left
ventricular hypertrophy (LVH), hypercholesterolemia (defined as history of or currently
taking lipid-lowering medications), smoking history, antihypertensive treatment strategy,
and atenolol, HCTZ, and trandolapril treatment and duration. HCTZ, atenolol, and
trandolapril drug treatment and duration were used as covariates since they belong to
drug classes known to affect NOD incidence.47 Individual drug treatment was defined
as any prescription before diagnosis of NOD during INVEST. Deviations from HWE

46
were assessed using Fisher’s Exact Test in control samples by race/ethnicity. All
statistical analyses were performed using SAS version 9.2 and JMP Genomics version
5.0 (SAS, Cary, NC).
SNP Genotyping in the INVEST-GENES New Onset Diabetes Case Control
Candidate T2D predictor SNPs identified using criteria stated above were
individually genotyped in a larger case control cohort from INVEST-GENES. We
conducted a nested case control study in INVEST-GENES including cases that
developed NOD and age, race, and gender-matched controls, who remained free of
T2D over a mean 2.8 years follow-up. Patients taking anti-diabetic medication or with
diabetes history at baseline were excluded from the study.
Genomic DNA was normalized to 10 ng/μL for genotyping of individual SNPs
identified from sequenced samples. Genotyping in the NOD case control was
accomplished using the TaqMan® 7900HT real-time PCR system (Applied Biosystems,
Foster City, CA). The Taqman® allelic discrimination assay was performed using a
PCR reaction mix containing 2.5 μL Taqman Genotyping Master Mix (Applied
Biosystems) 0.0625 μL Taqman probe, 1.438 μL water, a 1-2 μL normalized genomic or
WGA’d DNA per sample in 384 well plates. PCR was performed in a thermal cycler
using the following conditions: 95° C for 10 minutes, followed by 45-50 cycles of 92° C
for 15 seconds and 58°- 62° C for one minute, followed by 4° C until fluorescent signal
detection.
A total of 101 additional TCF7L2 cosmopolitan tag SNPs, selected for r2>0.5 and
MAF>0.05, were genotyped using the HumanCVD BeadChip and Infinium II Assay
(Illumina, San Diego, CA) at the University of Florida (UF) Center for

47
Pharmacogenomics. The HumanCVD BeadChip contains approximately 50,000
cosmopolitan tag SNPs for 2,100 CV and metabolic-related genes.149 Genotype calling
was performed using GenomeStudio Software version 2011.1 and Genotyping Module
version 1.9 calling algorithm (Illumina, San Diego, CA). Genotyping of sequenced
samples and NOD case control samples using various platforms and related analyses
are summarized in Table 2-1.
For the HumanCVD BeadChip, individual patients were excluded if sample call
rates were below 95% and SNPs were excluded if genotype call rates were below 90%.
Genotype data quality was further ensured in PLINK using concordance rates for 87
blind duplicates, gender confirmation using X chromosome genotype data, cryptic
relatedness using pairwise identity-by-descent (IBD), and estimation of heterozygosity
using the inbreeding coefficient F.150 QC procedures involving HumanCVD BeadChip
data were performed by the UF Center for Pharmacogenomics. After QC, all variants
were included in association analyses regardless of departure from HWE, but variants
with low HWE p values were flagged and departure from HWE was considered in
identification of candidate T2D predictor SNPs and interpretation of results.
Baseline Characteristic and NOD Association Analysis in the INVEST-GENES NOD Case Control Cohort
Baseline differences in patient characteristics between cases and controls were
determined using t-tests and chi square tests as appropriate. In the full NOD case
control cohort, logistic regression was used to assess TCF7L2 SNP effects on NOD.
ORs and 95%CIs were calculated using allelic trend tests. NOD association in the NOD
case control cohort included candidate SNPs identified in sequenced samples and
TCF7L2 SNPs from the HumanCVD BeadChip. SNP association analyses for TCF7L2
48
SNPs were performed by race/ethnicity and adjusted for PCs one, two, and three to
minimize confounding by population stratification. PCs one, two and three provided
sufficient separation of ancestry clusters in the NOD case control and were chosen as
covariates in NOD case control analyses to adjust for ancestry. Logistic regressions
were also adjusted for clinical covariates as stated above. The false discovery rate
(FDR) method was used to correct for multiple comparisons in association tests in the
NOD case control. Assuming an OR of 1.7 and MAF of 0.3, the full NOD case control
cohort provided 87% power in Whites, 36% power in Blacks, and 87% power in
Hispanics to detect additive effects of TCF7L2 polymorphisms on T2D. Deviations from
HWE were assessed using Fisher’s Exact Test in control samples by race/ethnicity.
Pharmacogenetic Analysis in the INVEST-GENES NOD Case Control Cohort
We tested pharmacogenetic effects of TCF7L2 SNPs, including HumanCVD
BeadChip SNPs and the three TCF7L2 candidate SNPs, on thiazide-induced NOD. To
test for pharmacogenetic effects, we calculated ORs and 95%CIs for NOD in HCTZ
treated and non-HCTZ treated individuals and tested for HCTZ*SNP interactions on
NOD in logistic regression models. HCTZ treatment was defined as any HCTZ
prescription before new diagnosis of T2D. We also performed sensitivity analyses by
testing for pharmacogenetic interactions with alternative HCTZ treatment definitions,
including continuous HCTZ treatment for ≥ six months and daily dose of HCTZ ≥ 25mg.
ORs and 95%CIs in pharmacogenetic analyses were adjusted for variables clinically
associated with T2D as stated above and PCs one, two, and three. Interaction p values
in pharmacogenetic analyses were corrected for multiple comparisons using the FDR
method.151 All statistical analyses were performed using SAS version 9.2 and JMP
Genomics version 5.0 (SAS, Cary, NC).
49
Results
Sequence and Genotype Data Quality Control in Sequenced Samples
A total of 156,000 of 219,874 base pairs (70.95%) were successfully sequenced
by the JCVI on both forward and reverse strands in the target region in TCF7L2. A total
of 329 of 552 amplicons (60%) passed QC procedures, as they were successfully
sequenced on both strands in at least 75% of samples. Of successfully sequenced
amplicons, there was an average 92.8% double stranded success and a 97.7% PCR
success. Polymorphisms were not observed in seven of 329 (2%) reported amplicons.
When a double-stranded amplicon sequence success cutoff of 75% was implemented,
1,784 polymorphisms in the target TCF7L2 region were observed. When an amplicon
success cutoff of 80% was implemented, 1,764 polymorphisms were identified,
suggesting validity for the vast majority of polymorphic sites despite more stringent QC
cutoffs. Notable departures from HWE among sequenced SNPs included rs290490 in
Whites (p=4.6x10⁻⁷) and rs7919152 in Hispanics (p=2.6x10⁻⁸). Ninety percent of
sequenced samples (135/150) were successfully genotyped on the HumanCVD
BeadChip after QC.
Characteristics of Sequenced TCF7L2 Variation
We observed 1,784 variants in the target TCF7L2 region, including 1,701 SNPs
with overall MAFs ranging from 0.003-0.492. (Figure 2-1). A total of 666 variants were
identified in whites, 951 variants were identified in Hispanics, and 1,017 variants were
identified in blacks. Non-SNP variation included 26 deletions, 8 insertion-deletion
polymorphisms, and 12 mixed polymorphisms. Of the 1,784 polymorphic sites, 910
were private mutations, occurring as heterozygous in a single individual, and 1,110
polymorphisms were considered rare variants (MAF<0.01).

50
A total of 910 SNPs were considered novel at the time of SNP data upload in
dbSNP (September 21, 2010), including 765 novel SNPs in blacks, 683 in Hispanics,
and 420 in whites (dbSNP Population ID: R122_ISDP1; Batch ID: TCF7L2-
R122_ISDP1-20100921). A total of 197 polymorphisms had been previously identified
in dbSNP and were validated by our sequencing effort. A total of 733 polymorphisms
identified remain currently un-validated in dbSNP, identified solely by our sequencing
effort in the INVEST-GENES population. A total of 853 SNPs had been previously
validated by Hapmap and the 1000 Genomes project.100,152
In Silico Functional Prediction of Sequenced TCF7L2 Variants
Four polymorphisms were identified in the TCF7L2 promoter region. (Table 2-2)
Two novel synonymous SNPs were observed in exons 6 and 15 (rs146872546 and
rs142903496 respectively). Four non-synonymous SNPs (rs148523217, rs148050954,
rs147841431, and rs77673441) were observed in Exon 15 of TCF7L2. Two non-
synonymous SNPs, including one novel (rs148523217) and one previously identified
SNP (rs77673441) were predicted to be protein damaging mutations by the SIFT
program with a SIFT score less than 0.05.145 One previously identified SNP
(rs1056877) was also found in the 3’ UTR. Fifty two novel and nine previously identified
SNPs were found in conserved TFBSs predicted in silico. The remaining 1,767
sequenced mutations were identified in TCF7L2 introns and were not predicted in silico
to have functional consequences. TCF7L2 SNPs with putative functional consequences
were found primarily in black and Hispanic sequenced individuals.
LD Structure of Sequenced TCF7L2 Variants
TCF7L2 LD structure was similar among individuals of European and Hispanic
descent, in which the large LD block in intron 1 containing T2D associated SNPs from
51
GWAS, characteristic of European individuals, can be observed. (Figure 2-2) The
characteristic European LD block, which includes the GWAS associated variant
rs7903146, is not evident in sequenced individuals with African ancestry. The greater
number of identified SNPs in blacks and Hispanics indicated greater genetic diversity in
TCF7L2 among African and Hispanic populations. The distribution of polymorphisms
within and between race/ethnic groups is represented in Figure 2-3.
Baseline Characteristics and PCA of Sequenced Samples
Characteristics of cases and controls from sequenced samples are summarized in
Table 2-3. In sequenced samples, differences in baseline characteristics between
cases and controls included a higher mean diastolic BP (88 versus 84 mmHg, p=0.02)
and BMI (30.9 versus 28.9 kg/m2, p=0.01). PCA analysis indicated that patient-reported
race/ethnicity was consistent with PCA clustering in sequenced individuals. (Figure 2-4)
Two sequenced samples which had self-reported white race were re-categorized as
Hispanic based on PCA results for association analyses.
Validation of Candidate T2D Predictor SNP Selection in White Sequenced Samples
The rs7903146 SNP was most highly associated with NOD in white sequenced
samples using an unadjusted dominant model (OR 4.50 [1.17-17.37], p=0.03),
suggesting the validity of this model in determining T2D predictor SNPs from sequence
data. (Table 2-4) The rs7903146 SNP is the SNP most strongly and reproducibly
variant associated with T2D from GWAS.95 After ranking of candidate SNPs in whites
based on the –log(p) score from a dominant model, the rs7903146 SNP was the most
highly associated SNP in sequenced whites using multiple statistical models,
suggesting that the –log(p) score is also effective in identifying candidate T2D predictor

52
SNPs despite limited power in sequenced samples by race/ethnicity. In addition, the
top three SNPs identified in whites based on the –log(p) score have also been
associated with T2D in studies in Europeans.95,153 (Table 2-4)
Candidate T2D Predictor SNP Identification in Hispanic Sequenced Samples
In Hispanics, no novel SNPs had sufficient MAF in sequenced Hispanics to be
considered candidate SNPs for further genotyping in the INVEST-GENES NOD case
control. However, the SNPs rs7895307 and rs7901275 showed association with NOD
in sequenced Hispanics and were chosen as candidate SNPs. To our knowledge, the
SNPs rs7895307 and rs7901275 have not been previously associated with T2D risk.
The SNPs rs7895307 and rs7901275 showed association with NOD in Hispanic
sequenced samples in an unadjusted dominant model (rs7895307 OR 7.50 [95%CI
2.04-27.59], p=0.002 and rs7901275 OR 4.22 [95%CI 1.32-13.47], p=0.02). (Table 2-5)
In addition, rs7895307 and rs7901275 SNPs had high –log(p) scores in sequenced
Hispanics, indicating consistent associations across statistical models. The SNPs
rs7895307 and rs7901275 also had high MAFs, did not depart from HWE, had call rates
above 75%, and were not in high LD with T2D SNPs from GWAS or SNPs on the
HumanCVD BeadChip. (Table 2-5) Both SNPs are located upstream of the LD block
containing the GWAS index SNP rs7903146 in Hispanics.
Candidate T2D Predictor SNP Identification in Black Sequenced Samples
No novel SNPs with sufficient MAF showed association with NOD in sequenced
Blacks. In Blacks, rs74159629 was chosen as a candidate T2D predictor SNP. The
SNP rs74159629 was recently validated by the pilot phase of the 1000 Genomes and is
thereby unlikely to be represented on currently available GWAS genotyping arrays. The
SNP rs74159629 has not been previously associated with T2D risk. The rs74159629

53
SNP was associated with NOD in Blacks in an unadjusted dominant model (OR 0.09
[0.01-0.85], p=0.04) with a MAF of 0.14. (Table 2-5) Rs74159629 is located upstream
of rs7903146, but is not located in any haplotype blocks in sequenced Blacks.
Baseline Characteristics and PCA for the INVEST-GENES NOD Case Control
For the NOD case control, we identified 446 NOD cases in INVEST-GENES over
a mean 2.8 years. (Table 2-6) As in sequenced samples at baseline, NOD cases had
higher BMI (31 versus 29 kg/m2, p<0.0001) and higher diastolic BP (87 versus 86
mmHg, p=0.04) than controls in the full NOD case control cohort. A higher percentage
of LVH was also observed in cases compared to age, race/ethnicity, and gender-
matched controls (17% versus 13%, p=0.02). During follow-up, the proportion of
patients who were treated with HCTZ was higher in cases than in controls (74% versus
62%, p<0.0001). An association between HCTZ treatment and NOD was observed in
the NOD case control (OR 1.70 [95%CI 1.31-2.20], p<0.0001). Consistent associations
were observed for HCTZ and NOD in white patients (OR 1.97 [95%CI 1.32-2.95],
p=0.001), in black patients (OR 2.85 [95%CI 1.11-7.30], p=0.03), and trended towards
association in Hispanic patients (OR 1.37 [95%CI 0.96-1.95], p=0.08). The average
duration of HCTZ treatment was 87.1 (SD 73.6) weeks and the average dose was 28mg
daily in diabetic cases and 26mg daily in controls (p=0.17). A higher mean atenolol
dose was also observed in NOD cases (72 mg versus 67 mg, p=0.02) among patients
treated with atenolol.
NOD Association in White INVEST-GENES NOD Case Control Patients
All candidate T2D predictor SNPs genotyped with Taqman had SNP call rates
greater than 95% and no departure from HWE was observed in candidate SNP in any
race/ethnic group. Fourteen of the 101 TCF7L2 SNPs on the HumanCVD BeadChip

54
were out of HWE (p<0.05) in at least one race/ethnic group, but the SNPs deviating
from HWE were not significantly associated with NOD. Nine SNPs were observed to be
nominally associated with NOD in whites after analysis of HumanCVD BeadChip in the
NOD case control cohort, including eight SNPs that were nominally associated with an
increased NOD risk and one SNP associated with a decreased NOD risk. However,
none of these associations remained significant after multiple comparisons adjustment.
The strongest association observed in whites was rs3814572 (OR 1.74 [95%CI 1.15-
2.64], p=0.01), (Figure 2-5) although rs3814572 has not been previously associated in
T2D genetic association studies. Although we observed a strong association between
NOD and rs7903146 in sequenced samples, we observed showed no association in the
full NOD case control in whites (OR 1.00 [95%CI 0.71-1.40], p=0.97).
NOD Association in Hispanic INVEST-GENES NOD Case Control Patients
After individual genotyping of the candidate T2D predictor SNPs rs7895307 and
rs7901275 in the NOD case control cohort, neither SNP departed from HWE. The
candidate T2D predictor SNP rs7895307 was not associated with NOD in Hispanics in a
dominant or additive model, before or after covariate adjustment (OR 1.03 [95%CI 0.78-
1.35], p=0.85). (Table 2-7) The SNP rs7901275 also was not associated with NOD in
Hispanics (OR 1.01 [95%CI 0.76-1.34], p=0.94).
Five SNPs were observed to be associated with NOD using HumanCVD
BeadChip in the full NOD case control cohort, including two SNPs that were nominally
associated with an increased NOD risk and three SNPs associated with a decreased
NOD risk. (Figure 2-5) None of these associations remained significant after multiple
comparisons adjustment. The strongest associations observed in Hispanics were
rs7089262 (OR 0.32 [95%CI 0.15-0.70], p=0.02) and rs7899644 (OR 0.32 [95%CI 0.15-

55
0.70], p=0.02). Interestingly, the SNP rs11196213, which has been previously
associated with T2D in Europeans,154 showed an increased NOD risk in Hispanics (OR
1.32 [95%CI 1.01-1.72], p=0.04) and a decreased NOD risk in whites (OR 0.67 [95%CI
0.49-0.92], p=0.02). The GWAS SNP rs7903146 showed no association with NOD in
Hispanics (OR 0.95 [95%CI 0.71-1.27], p=0.75).
NOD Association in Black INVEST-GENES NOD Case Control Patients
After genotyping in the NOD case control, the candidate SNP rs74159629 did not
depart from HWE. (Table 2-7) Rs74159629 showed a nominally significant association
with decreased NOD risk in Blacks (OR 0.28 [95%CI 0.08-1.03], p=0.05) after covariate
adjustment, but was not associated in an unadjusted model (OR 0.63 [95%CI 0.24-
1.67], p=0.35). Interestingly, the rs74159629 SNP also showed a trend towards
association with NOD in Hispanics, although the direction of the point estimate in
Hispanics was opposite of that observed in Blacks (2.56 [0.96-6.84], p=0.06). The
candidate SNPs we identified for Hispanics showed no association with NOD in Blacks
(rs7895307 OR 1.47 [95%CI 0.77-2.82], p=0.25 and rs7901275OR 1.77 [95%CI 0.87-
3.59], p=0.12), although the direction of point estimates was similar. (Table 2-7)
Four SNPs were nominally associated with NOD using HumanCVD BeadChip in
blacks, including two SNPs (rs10885410 and rs6585202) that were associated with
increased NOD risk and two SNPs (rs7896091 and rs12573128) associated with a
decreased NOD risk. (Figure 2-5) The strongest association observed in blacks was
rs12573128 (OR 0.48 [95%CI 0.26-0.89], p=0.02) after adjustment for covariates. None
of these associations remained significant after multiple comparisons adjustment.
Interestingly, rs12573128, which was associated with an increased NOD risk in whites
(OR 1.55 [95%CI 1.00-2.39], p=0.04), was associated with a decreased NOD risk in

56
blacks (OR 0.5 [95%CI 0.27-0.91], p=0.02). The SNP rs12573128 has been previously
associated with insulin sensitivity and glucose tolerance during an OGTT.155 The
GWAS SNP rs7903146 showed no association with NOD in blacks (OR 0.91 [95%CI
0.48-1.72], p=0.74).
TCF7L2 SNP*HCTZ Treatment Pharmacogenetic Interactions
No SNPs with significant SNP*HCTZ interactions in pharmacogenetic analyses
deviating from HWE. In whites, nine out of 101 TCF7L2 SNPs showed a significant
pharmacogenetic interaction with hydrochlorothiazide treatment on NOD after FDR
correction. Seven of the SNPs with significant pharmacogenetic interactions showed an
increased risk of NOD in HCTZ treated patients and two showed a decreased risk of
NOD in non-HCTZ treated patients. (Table 2-8) The strongest interaction was observed
for the rs7917983 T allele (pinx=3.7x10⁻⁴, pFDR=0.02) with a significantly increased risk of
NOD in HCTZ treated patients (OR 1.50 [95%CI 1.00-2.25]) and a decreased risk of
NOD in non-HCTZ treated patients (OR 0.47 [95%CI 0.26-0.84]). To our knowledge, no
association between rs7917983 and T2D has been previously reported. An additional
15 TCF7L2 SNPs showed nominally significant pharmacogenetic interactions.
Interestingly, TCF7L2 SNPs that had been previously associated with T2D in
GWAS, including rs7901695 and rs4506565,92,153 showed significant pharmacogenetic
associations with an increased risk of NOD with HCTZ with T2D risk alleles and
decreasing NOD with T2D risk alleles in non-HCTZ treated individuals. The SNP
rs11196228, which has also been associated with T2D,154 also showed a significant
interaction with a decreased risk of NOD with HCTZ with the T2D risk allele and
increasing NOD with the T2D risk allele in non-HCTZ treated individuals. The strongest
GWAS SNP from the literature, rs7903146,95 showed similar trends although only

57
nominally significant (pinx=0.01, pFDR=0.09). The SNPs rs12243326 and rs11196213,
which have been previously associated with two hour post OGTT glucose and T2D
respectively,154,156 also showed nominally significant pharmacogenetic interactions.
Results were similar when HCTZ treatment was defined as ≥6 months and daily HCTZ
dose ≥25mg. No significant pharmacogenetic associations were observed in Hispanics
or blacks after FDR correction. In blacks, a trend toward a significant SNP*HCTZ
treatment interaction was observed for the rs290490 G allele (p inx=0.005 [pFDR=0.09]),
with an increased risk for NOD in HCTZ treated patients (OR 1.49 [95%CI 1.06-2.10],
p=0.02).
Discussion
In the present study, we observed a large amount of previously unreported
variation in TCF7L2 in our population, including 910 novel TCF7L2 variants and many
novel variants with potential functional significance. The present study adds to existing
literature by characterizing novel variation in TCF7L2 in populations of African and
Hispanic descent, who have high T2D prevalence.1 We observed several TCF7L2
SNPs that were nominally associated with NOD in each race/ethnic group, but were not
associated after correction for multiple comparisons. Nominally significant associations
with NOD indicated large differences in point estimates between race/ethnic groups and
support the need for further research in Hispanic and black race/ethnic groups.
Significant pharmacogenetic interactions between TCF7L2 SNPs and HCTZ treatment
on the development of NOD were observed in whites. Previously associated TCF7L2
SNPs from T2D GWAS were well represented among TCF7L2 pharmacogenetic
interactions from the present study. TCF7L2 pharmacogenetic predictors were
observed when HCTZ treatment was defined as any exposure or continuous treatment

58
for an extended duration. Our study implicates TCF7L2 in thiazide-associated NOD and
provides evidence for TCF7L2 as a candidate gene for the pharmacogenetics of
thiazide-induced NOD.
Since the initial T2D GWAS in 2006,91 many T2D GWAS have been published that
establish TCF7L2 SNPs as the strongest and most reproducible genetic risk factors for
T2D.92,95,99,101,103,153 Although GWAS have identified SNPs in TCF7L2 as consistent risk
factors for T2D in European populations, TCF7L2 SNPs are not as well studied in
African and Hispanic populations. In the present study, we sequenced an ethnically
diverse group of individuals in order to identify new variation, better define LD structure,
and identify SNPs in TCF7L2 associated with T2D risk in Hispanic and African
race/ethnic groups. The addition of novel TCF7L2 SNPs, including several predicted to
have functional consequences, to publicly available databases should improve our
understanding of LD structure of the gene in populations of Hispanic and African
descent and improve our ability to perform fine-mapping of GWAS signals in TCF7L2.
Our sequencing of TCF7L2 in individuals with European, Hispanic, and African
descent provides identification of detailed variant information on these populations,
which was not available in dbSNP or deep sequencing efforts in the 1000 Genomes
Project.100 Another benefit of our deep sequencing in a diverse population is the ability
to find causative alleles through examination of differences in LD and in associations
between race/ethnic groups. Due to insufficient frequency of functional SNPs and
insufficient sample size, establishment of causative alleles solely responsible for the
association between TCF7L2 SNPs and T2D was unlikely in the present study.

59
We were also unable to identify any novel polymorphisms as potential T2D
predictor SNPs in Hispanics and blacks. The lack of novel T2D predictor SNPs may be
partly due to the fact that the vast majority of novel variation observed was of insufficient
frequency to observe statistically significant associations with T2D. We observed strong
associations in sequenced samples for three SNPs, but these SNPs did not show
significant association in their respective race/ethnic groups in the larger NOD case
control cohort. Strong associations in sequenced samples by race/ethnic group may
have been due to false positive associations in the relatively small sequenced
population. Differences in observed associations between sequenced samples and the
full NOD case control might also be explained by differences in drug treatment in each
cohort. Whereas HCTZ was associated with NOD in the larger case control, no
difference in HCTZ treatment was observed between cases and controls in sequenced
samples. Differences in HCTZ treatment between cohorts may have affected TCF7L2
associations as significant SNP*HCTZ treatment pharmacogenetic interactions were
observed in our INVEST population.
The lack of association between rs7903146 and NOD could also be due to a
unique genetic architecture of the INVEST population. A distinct genetic architecture in
INVEST is supported by the fact that the LD block containing the GWAS associated
variant rs7903146, characteristic of individuals with European ancestry, was not evident
in sequenced individuals with African ancestry. The absence of the characteristic LD
block possibly explains the lack of association of rs7903146 in individuals with African
ancestry, but not in whites or Hispanics. However, the rs7903146 SNP was not
significantly associated with NOD in INVEST whites either. A possible explanation for
60
the lack of association is a confounding effect of CAD, which was present in all INVEST
patients and has been previously associated with T2D.157 The lack of significant
association in whites may be due to a modest sample size in this race/ethnic group
compared to previously published association studies, which typically investigate
rs7903146 associations in over 1,000 cases and controls.91,99,101,103,153 Such a limitation
contrasts with our ability to identify a strong rs7903146 association in sequenced
samples with only 23 NOD cases and 25 controls and supports the validity of our T2D
SNP predictor selection approach when limited sample sizes are available.
The implementation of an unadjusted dominant model and observation of
consistent associations in various statistical models using a –log(p) score did identify
the most reproducible TCF7L2 association from the literature despite a very limited
sample size in sequenced whites. Despite the apparent validity of this procedure, we
did not observe significant effects of identified T2D predictor SNPs in individuals of
Hispanic and African descent. Our lack of association is potentially explained by a
limited sample size of sequenced individuals within each race/ethnic group or limitations
of our statistical approach in Hispanics and blacks. The lack of association may also
reflect limitations of currently available statistical methods to determine causative alleles
for complex traits. The lack of association suggests limitations of the common disease
common variant hypothesis, which hypothesizes that the heritability of common
diseases can be explained by several common alleles with large effects sizes. The
common disease common variant hypothesis is being increasingly rejected in favor of
cumulative contribution of rare alleles to the heritability of complex disease.115 Analysis
involving rare variants is an alternative statistical approach that might yield meaningful

61
results, although currently available rare variant analysis techniques are subject to
similar limitations in populations with limited sample size. Further investigation of
potential T2D predictor SNPs is warranted in populations of African and Hispanic
descent.
Despite the lack of significant associations between TCF7L2 SNPs and NOD after
FDR correction, we identified many SNPs nominally associated with NOD, which were
observed to have striking differences between race/ethnic groups. The SNP
rs12573128, which has been previously associated with insulin sensitivity and glucose
tolerance during an OGTT,155 was nominally associated with an increased NOD risk in
whites and a decreased NOD risk in blacks. The SNP rs11196213, which has been
associated with T2D without genome-wide significance,154 was nominally associated
with decreased NOD risk in whites, but increased NOD risk in Hispanics. Differences in
NOD associations between whites, Hispanics, and blacks suggest that TCF7L2 SNPs
associated in European populations may not be appropriate for more diverse
racial/ethnic groups. Further investigation of TCF7L2 SNP associations with T2D is
warranted in sufficiently powered populations of African and Hispanics descent.
TCF7L2 is a transcription factor involved in the WNT signaling pathway. TCF7L2
has been implicated in incretin signaling pathways since it has been shown to regulate
transcription of the glucagon gene, which encodes glucagon-like peptide 1 (GLP1) in
the L cells of the gut.150 The rs7903146 T allele has been associated with increased
TCF7L2 expression and has been implicated as a functional variant, being mapped to
open chromatin sites in pancreatic islet cells.158,159 Whether rs7903146 is a functional
variant is unclear. Less robust associations in non-Europeans would imply that

62
rs7903146 is not functional and GWAS-associated TCF7L2 SNPs may be in LD with yet
undetermined functional variants that influence amino acid sequences, mRNA
expression, or mRNA stability. Functional impairment of TCF7L2 by SNPs could cause
changes in gene expression and influence T2D development. However, the results of
the present study suggest that rs7903146 is not functional, since a consistent
association with T2D was not seen across multiple race/ethnic groups.
Despite a lack of associations with T2D, we detected pharmacogenetic
interactions between TCF7L2 SNPs and HCTZ treatment on NOD risk. We found
significant pharmacogenetic associations in whites, which is the race group in which the
strongest and most reproducible TCF7L2 disease associations are found. Furthermore,
several of the TCF7L2 SNPs showing a pharmacogenetic interaction are significantly
associated with T2D in previous GWAS, including rs7901695 and rs4506565.92,153
However, the strongest TCF7L2 SNP from the literature, rs7903146,95 showed only a
nominal pharmacogenetic association, although the directions of point estimates by
HCTZ treatment groups were consistent with rs7901695 and rs4506565. A significant
pharmacogenetic interaction was observed for rs11196228, which was associated with
T2D, although this study was not a GWAS.154 Among the SNPs with nominally
significant pharmacogenetic interactions was rs12243326, which was previously
associated with two hour glucose after glucose challenge.156 The strongest
pharmacogenetic interaction observed was for rs7917983, which has not been
previously associated with T2D. To our knowledge, the present study is the first to
investigate TCF7L2 SNPs for pharmacogenetic influences on thiazide-induced NOD

63
and the first to observe significant pharmacogenetic interactions between TCF7L2
SNPs and HCTZ treatment on NOD risk.
Our results suggest that TCF7L2 variation affects the influence of HCTZ on the
incidence of NOD. HCTZ might affect expression of TCF7L2 or the ability of the
transcription factor to bind to promoters, further increasing an individual’s risk for T2D.
The majority of SNPs associated with NOD during HCTZ treatment were primarily
intronic with few predicted functional consequences. Furthermore, rs7903146 did not
show the strongest pharmacogenetic interaction, suggesting that other SNPs may be
responsible for the observed pharmacogenetic association. Differences in associations
between race/ethnic groups suggest differences in LD and the need to identify
functional variants. Such differences in LD between race/ethnic groups are observable
in the INVEST population in LD analyses.
Since the role TCF7L2 and its SNPs plays in T2D development remains unclear, it
is difficult to speculate on the physiology of a pharmacogenetic interaction. TCF7L2 is
primarily thought of as a T2D genetic risk factor with little or no role in the pharmacology
of HCTZ. However, HCTZ treatment may precipitate T2D in a patient who is otherwise
at risk for T2D development based on their TCF7L2 genotype. If T2D GWAS SNPs
from TCF7L2 could be considered pharmacogenetic risk factors, many of the T2D index
SNPs from GWAS (Table 1-1) may be pharmacogenetic risk factors as well. To our
knowledge, published research investigating the pharmacogenetic impact of SNPs from
T2D GWAS on thiazide-induced NOD is not currently available.
The primary strength of the presented research is the ethnic diversity of our
INVEST population. The diversity in INVEST enables us to investigate differing disease

64
genetic and pharmacogenetic associations among different race/ethnic groups, which
expands the generalizability of our results and increases our ability to discern functional
consequences of genetic variation. In addition, the availability of sequence data in the
entire TCF7L2 gene enables us to investigate variation and LD structure among
European, Hispanic, and African populations. We also have detailed clinic, outcomes,
and drug exposure data for each member of our NOD case control cohort, enabling us
to detect pharmacogenetic interactions, build multivariable logistic regressions, and
adjust for potentially confounding variables.
Our study has several limitations worthy of mention. One limitation is the small
number of NOD cases in our cohort when divided by race/ethnicity. Our sample size by
race/ethnicity is small relative to most disease genetics studies investigating T2D.
However, TCF7L2 is the strongest known T2D risk factor and has been observed in
smaller disease genetics studies. In light of our sample size, we must conclude that our
lack of observed associations may be due to limited sample size, especially in
sequenced samples.
Another limitation of the present study is the possibility of alpha error, which is
increased by the number of variants uncovered in the sequencing project. Alpha error
is unlikely to affect the present study’s results as no significant associations were found
with the exception of pharmacogenetic analyses. Significant pharmacogenetic
associations after an FDR correction and multiple pharmacogenetic TCF7L2 SNP
associations lend credence to the validity of pharmacogenetic findings. We do
recognize the potential for false positive results in pharmacogenetic analyses and our
observations need to be independently replicated.

65
In addition, antihypertensive therapy in INVEST may confound TCF7L2 SNP
associations with NOD. TCF7L2 polymorphisms were tested for associations with
NOD, which may have been affected by antihypertensive treatment or other
environmental factors. To minimize confounding by antihypertensive treatment, we
adjusted statistical models for treatment and duration of certain antihypertensive
medications. HCTZ, atenolol, and trandolapril have been shown to affect T2D risk and
were all used in INVEST antihypertensive treatment strategies.47,50,51 We adjusted for
atenolol and trandolapril treatment and duration in order to minimize confounding of
antihypertensive pharmacotherapy in pharmacogenetic analyses. Confounding due to
other environmental factors known to affect T2D incidence was also addressed through
statistical adjustment of clinical characteristics previously associated with NOD.
Summary and Significance
In summary, our results add previously unknown polymorphisms to available data
on TCF7L2 variation and further describe LD structure particularly in populations of
Hispanic and African descent. To our knowledge, the described sequencing project
represents the most comprehensive evaluation of TCF7L2 variation in black and
Hispanic (derived primarily from Puerto Rican) individuals that is currently available.
We observed several TCF7L2 SNPs that were nominally associated with NOD in each
race/ethnic group, but were not associated after correction for multiple comparisons.
Nominally significant associations with NOD indicated large differences in point
estimates between race/ethnic groups, which supports that TCF7L2 SNPs associated
with T2D in Europeans may differ in populations of African and Hispanic descent.
Further research of TCF7L2 SNP associations with T2D in individuals with African and
Hispanic descent is warranted in populations with sufficient samples sizes.
66
In addition, our results also suggest that genetic variation in TCF7L2, particularly
SNPs associated with T2D from GWAS, may influence the effect of HCTZ on NOD risk.
Our observation of significant SNP effects only in Whites suggests differences in LD or
that TCF7L2 SNPs have pharmacogenetic influences only in individuals with European
ancestry. Functional studies and replication of pharmacogenetic associations are
needed to confirm our observed association and define the potential role of TCF7L2
SNPs in predicting NOD during HCTZ treatment. TCF7L2 is a compelling candidate
gene in the pharmacogenetic study of thiazide-induced dysglycemia.

67
Table 2-1. Study populations and study design for TCF7L2 SNP discovery, LD characterization, and statistical analyses
INVEST-GENES Cohort
Platform for data acquisition
Analyses performed
Sequenced samples (n=150)
Sanger Sequencing (1,784 variants)
SNP discovery LD characterization Determination of T2D predictor SNPs
HumanCVD BeadChip (101 SNPs)
Comparison of PCA and self-reported race LD of novel SNPs and BeadChip SNPs
NOD Case Control (n=1,435)
Taqman (3 SNPs) T2D predictor SNP association with T2D HCTZ pharmacogenetic associations
HumanCVD BeadChip
(101 SNPs) Association with T2D HCTZ pharmacogenetic associations Principal components analysis
LD indicates linkage disequilibrium; NOD indicates new onset diabetes; SNP, single nucleotide polymorphism; T2D, type 2 diabetes
Table 2-2. Strongest putative functional variants from TCF7L2 sequence data determined in silico
rs number Novel* Position†
Region Alleles AA Change
MAF‡ Race/ethnic group(s)§
rs10885396 114701745 Promoter G/A - 0.344 B, H, W rs138659283 Yes 114701766 Promoter TCTC/- - 0.003 B rs140632597 Yes 114701867 Promoter A/G - 0.003 B rs10885397 114701873 Promoter G/A - 0.114 B, H, W rs138272435 Yes 114701897 Promoter G/A - 0.003 B rs146872546 Yes 114890959 Exon 6 C/T - 0.004 B rs148523217 Yes 114895779 Exon 15 C/A P247T** 0.004 H rs142903496 Yes 114902087 Exon 15 T/C - 0.004 W rs148050954 Yes 114910413 Exon 15 G/A R472Q 0.004 H rs77673441 114915359 Exon 15 C/A P477T** 0.014 W rs147841431 Yes 114915665 Exon 15 T/C S579P 0.010 B rs1056877 114915748 3’ UTR T/C - 0.213 B, H, W
AA indicates amino acid; MAF, minor allele frequency; B, blacks; H, Hispanics; W, whites; UTR, untranslated region * Polymorphism not described in dbSNP before submission of sequence data † Position on chromosome 10 in human genome Build 37 (GRCh37) ‡ Minor allele frequency in the overall population § Race/ethnic group in which the polymorphism was identified ** Predicted to be protein damaging amino acid substitutions by SIFT

68
Table 2-3. Characteristics of new onset diabetes cases and controls at baseline in INVEST sequenced samples
Characteristic* Diabetes Cases (n=73)
Controls (n=77)
p value†
At baseline Age (years) 64.0 (10) 64.1 (9) 0.96
Female, n (%) 39 (54%) 42 (55%) 0.89 BMI (mean) 30.9 (5) 28.9 (5) 0.01
Race/Ethnicity 0.74 Black, n (%) 22 (54%) 19 (46%) Hispanic, n (%) 28 (46%) 33 (54%)
White, n (%) 23 (48%) 25 (52%) Blood pressure (mmHg)
Systolic 151 (18) 147 (18) 0.14
Diastolic 88 (10) 84 (10) 0.02
Hypercholesterolemia‡, n (%) 35 (48%) 47 (61%) 0.11
History of LVH, n (%) 11 (15%) 9 (12%) 0.54 History of MI, n (%) 13 (18) 14 (9) 0.95 History of smoking, n (%) 27 (37 %) 35 (45%) 0.29
During INVEST
Verapamil SR strategy, n (%) 41 (56%) 43 (56%) 0.97
Atenolol treatment, n (%) 30 (41%) 33 (43 %) 0.83 HCTZ treatment, n (%) 51 (70 %) 53 (69%) 0.89
Trandolapril treatment, n (%) 45 (62 %) 52 (66%) 0.45
Verapamil SR treatment, n (%)
41 (56%) 43 (56%) 0.97
INVEST indicates INternational VErapamil SR and Trandolapril Study; BMI body mass index; mmHg, millimeters of mercury; LVH, left ventricular hypertrophy; SR, sustained release; HCTZ, hydrochlorothiazide * Values are mean ± standard deviation unless otherwise noted. † P value for t-test or chi square test where appropriate ‡ History of or currently taking lipid-lowering medications
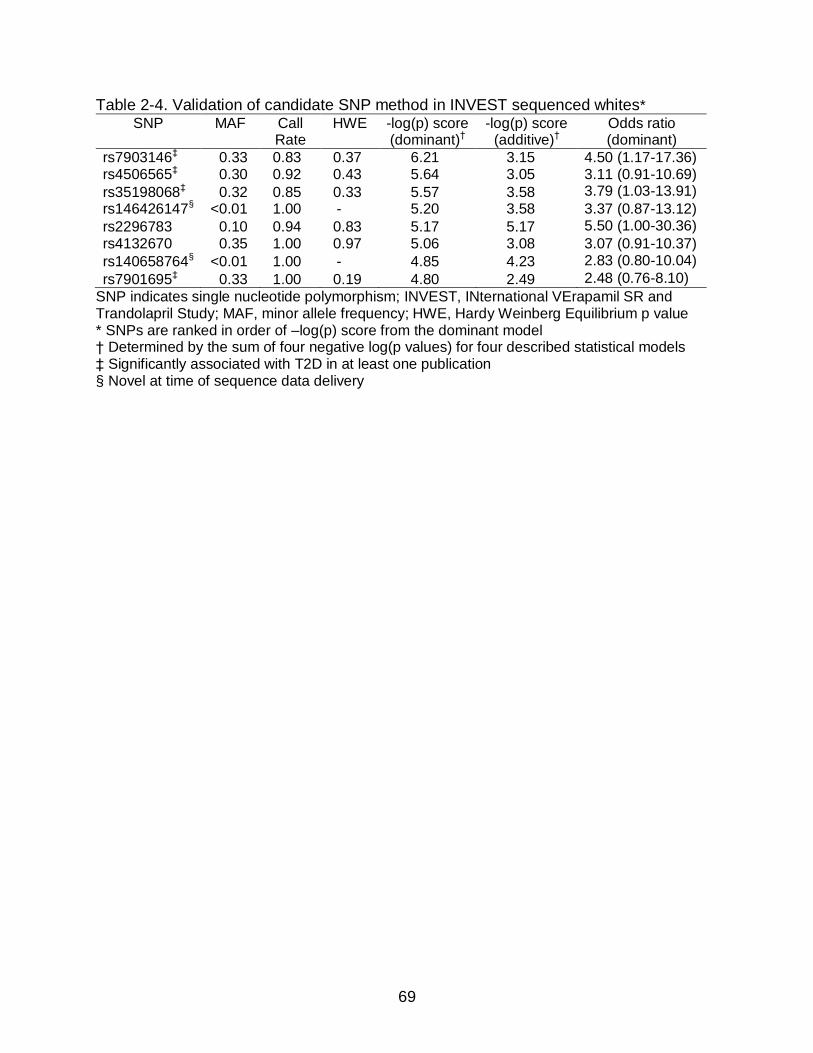
69
Table 2-4. Validation of candidate SNP method in INVEST sequenced whites* SNP MAF Call
Rate HWE -log(p) score
(dominant)† -log(p) score
(additive)† Odds ratio (dominant)
rs7903146‡ 0.33 0.83 0.37 6.21 3.15 4.50 (1.17-17.36) rs4506565‡ 0.30 0.92 0.43 5.64 3.05 3.11 (0.91-10.69)
rs35198068‡ 0.32 0.85 0.33 5.57 3.58 3.79 (1.03-13.91)
rs146426147§ <0.01 1.00 - 5.20 3.58 3.37 (0.87-13.12)
rs2296783 0.10 0.94 0.83 5.17 5.17 5.50 (1.00-30.36)
rs4132670 0.35 1.00 0.97 5.06 3.08 3.07 (0.91-10.37)
rs140658764§ <0.01 1.00 - 4.85 4.23 2.83 (0.80-10.04)
rs7901695‡ 0.33 1.00 0.19 4.80 2.49 2.48 (0.76-8.10)
SNP indicates single nucleotide polymorphism; INVEST, INternational VErapamil SR and Trandolapril Study; MAF, minor allele frequency; HWE, Hardy Weinberg Equilibrium p value * SNPs are ranked in order of –log(p) score from the dominant model † Determined by the sum of four negative log(p values) for four described statistical models ‡ Significantly associated with T2D in at least one publication § Novel at time of sequence data delivery
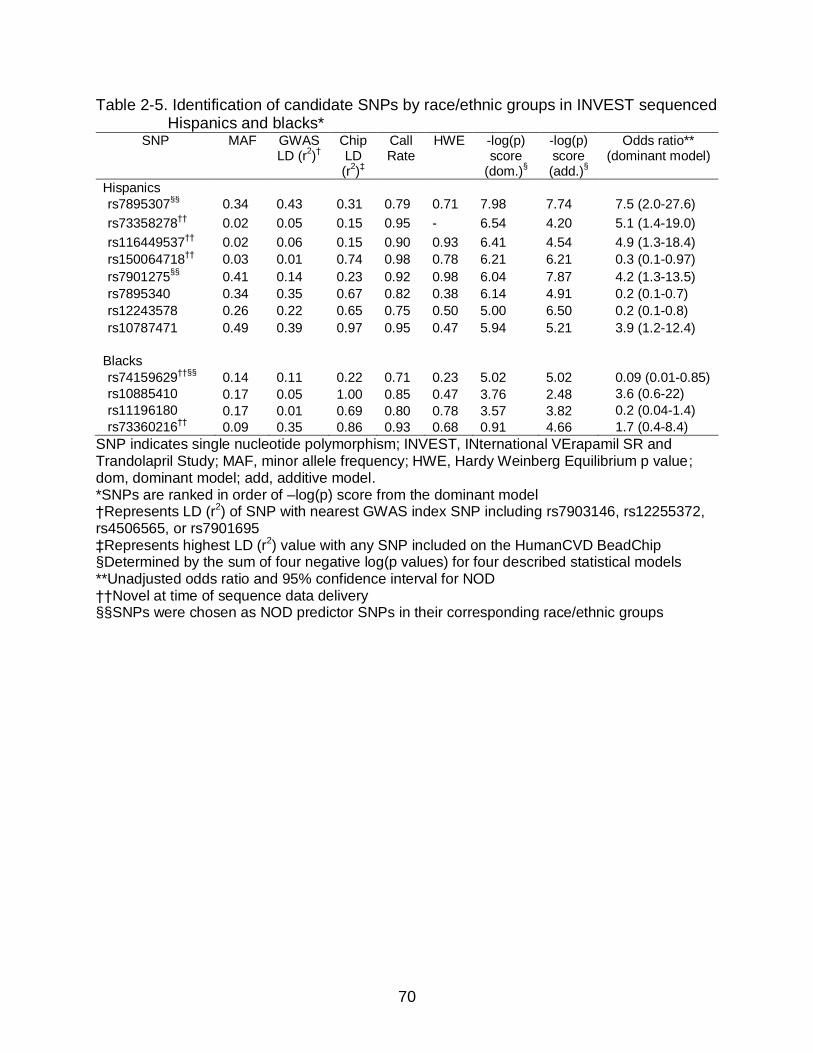
70
Table 2-5. Identification of candidate SNPs by race/ethnic groups in INVEST sequenced Hispanics and blacks*
SNP MAF GWAS LD (r
2)†
Chip LD (r
2)‡
Call Rate
HWE -log(p) score
(dom.)§
-log(p) score (add.)
§
Odds ratio** (dominant model)
Hispanics
rs7895307§§
0.34 0.43 0.31 0.79 0.71 7.98 7.74 7.5 (2.0-27.6)
rs73358278††
0.02 0.05 0.15 0.95 - 6.54 4.20 5.1 (1.4-19.0)
rs116449537††
0.02 0.06 0.15 0.90 0.93 6.41 4.54 4.9 (1.3-18.4)
rs150064718††
0.03 0.01 0.74 0.98 0.78 6.21 6.21 0.3 (0.1-0.97)
rs7901275§§
0.41 0.14 0.23 0.92 0.98 6.04 7.87 4.2 (1.3-13.5)
rs7895340 0.34 0.35 0.67 0.82 0.38 6.14 4.91 0.2 (0.1-0.7)
rs12243578 0.26 0.22 0.65 0.75 0.50 5.00 6.50 0.2 (0.1-0.8)
rs10787471 0.49 0.39 0.97 0.95 0.47 5.94 5.21 3.9 (1.2-12.4)
Blacks
rs74159629††§§
0.14 0.11 0.22 0.71 0.23 5.02 5.02 0.09 (0.01-0.85)
rs10885410 0.17 0.05 1.00 0.85 0.47 3.76 2.48 3.6 (0.6-22)
rs11196180 0.17 0.01 0.69 0.80 0.78 3.57 3.82 0.2 (0.04-1.4)
rs73360216††
0.09 0.35 0.86 0.93 0.68 0.91 4.66 1.7 (0.4-8.4)
SNP indicates single nucleotide polymorphism; INVEST, INternational VErapamil SR and Trandolapril Study; MAF, minor allele frequency; HWE, Hardy Weinberg Equilibrium p value; dom, dominant model; add, additive model. *SNPs are ranked in order of –log(p) score from the dominant model †Represents LD (r2) of SNP with nearest GWAS index SNP including rs7903146, rs12255372, rs4506565, or rs7901695 ‡Represents highest LD (r2) value with any SNP included on the HumanCVD BeadChip §Determined by the sum of four negative log(p values) for four described statistical models **Unadjusted odds ratio and 95% confidence interval for NOD ††Novel at time of sequence data delivery §§SNPs were chosen as NOD predictor SNPs in their corresponding race/ethnic groups

71
Table 2-6. Characteristics of new onset diabetes cases and controls at baseline and during INVEST
Characteristic* NOD Cases(n=446) Controls (n=1,025) p value†
At baseline Age (years) 65 (10) 65 (9) 0.73 Female, n (%) 250 (56) 573 (56) 0.96 BMI (kg/m2) 31 (6) 29 (5) <0.0001
Race/ethnicity, n (%) 0.66 White 176 (40) 409 (40) Black 51 (11) 121 (12)
Hispanic 217 (49) 492 (48) Blood pressure (mm Hg) Systolic 149 (19) 148 (18) 0.26
Diastolic 87 (10) 86 (10) 0.04 Hypercholesterolemia‡, n (%) 242 (54) 548 (54) 0.78 History of LVH, n (%) 77 (17) 128 (13) 0.02
History of MI, n (%) 99 (22) 194 (19) 0.15 History of smoking, n (%) 184 (41) 405 (40) 0.53 During INVEST
Verapamil SR strategy, n (%) 208 (47) 519 (51) 0.16 Blood pressure (mm Hg)§ Systolic 135 (11) 134 (11) 0.07
Diastolic 79 (6) 79 (6) 0.49 HCTZ treatment, n (%) 328 (74) 640 (62) <0.0001 HCTZ (≥ 6 months), n (%) 320 (72) 627 (61) <0.0001
HCTZ dose (mg) 28 (12) 26 (12) 0.17 Atenolol treatment, n (%) 229 (51) 479 (47) 0.10 Atenolol dose (mg) 72 (32) 67 (31) 0.02
Trandolapril treatment, n (%) 267 (60) 664 (65) 0.07 Trandolapril dose (mg) 3.3 (2.6) 3.4 (2.6) 0.49 Verapamil SR treatment, n (%) 208 (47) 519 (51) 0.16 Verapamil SR dose (mg) 234 (75) 238 (75) 0.71
INVEST indicates INternational VErapamil SR and Trandolapril Study; NOD, new onset diabetes; BMI body mass index; SR, sustained release; LVH, left ventricular hypertrophy; HCTZ, hydrochlorothiazide * Values are mean ± standard deviation unless otherwise noted. † P values represent t- ‡ History of or currently taking lipid-lowering medications § Average of clinic blood pressure measurements during study
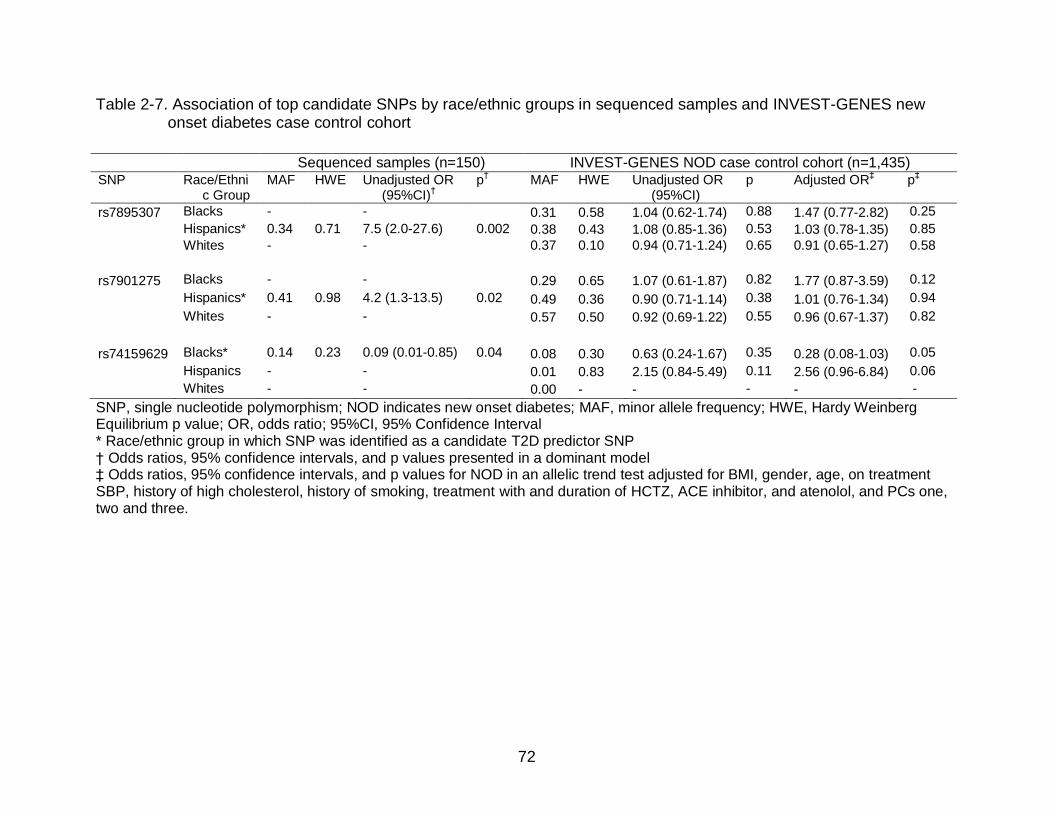
72
Table 2-7. Association of top candidate SNPs by race/ethnic groups in sequenced samples and INVEST-GENES new onset diabetes case control cohort
SNP, single nucleotide polymorphism; NOD indicates new onset diabetes; MAF, minor allele frequency; HWE, Hardy Weinberg Equilibrium p value; OR, odds ratio; 95%CI, 95% Confidence Interval * Race/ethnic group in which SNP was identified as a candidate T2D predictor SNP † Odds ratios, 95% confidence intervals, and p values presented in a dominant model ‡ Odds ratios, 95% confidence intervals, and p values for NOD in an allelic trend test adjusted for BMI, gender, age, on treatment SBP, history of high cholesterol, history of smoking, treatment with and duration of HCTZ, ACE inhibitor, and atenolol, and PCs one, two and three.
Sequenced samples (n=150) INVEST-GENES NOD case control cohort (n=1,435) SNP Race/Ethni
c Group MAF HWE Unadjusted OR
(95%CI)†
p† MAF HWE Unadjusted OR
(95%CI) p Adjusted OR
‡ p
‡
rs7895307 Blacks - - 0.31 0.58 1.04 (0.62-1.74) 0.88 1.47 (0.77-2.82) 0.25
Hispanics* 0.34 0.71 7.5 (2.0-27.6) 0.002 0.38 0.43 1.08 (0.85-1.36) 0.53 1.03 (0.78-1.35) 0.85
Whites - - 0.37 0.10 0.94 (0.71-1.24) 0.65 0.91 (0.65-1.27) 0.58
rs7901275 Blacks - - 0.29 0.65 1.07 (0.61-1.87) 0.82 1.77 (0.87-3.59) 0.12
Hispanics* 0.41 0.98 4.2 (1.3-13.5) 0.02 0.49 0.36 0.90 (0.71-1.14) 0.38 1.01 (0.76-1.34) 0.94
Whites - - 0.57 0.50 0.92 (0.69-1.22) 0.55 0.96 (0.67-1.37) 0.82
rs74159629 Blacks* 0.14 0.23 0.09 (0.01-0.85) 0.04 0.08 0.30 0.63 (0.24-1.67) 0.35 0.28 (0.08-1.03) 0.05
Hispanics - - 0.01 0.83 2.15 (0.84-5.49) 0.11 2.56 (0.96-6.84) 0.06
Whites - - 0.00 - - - - -
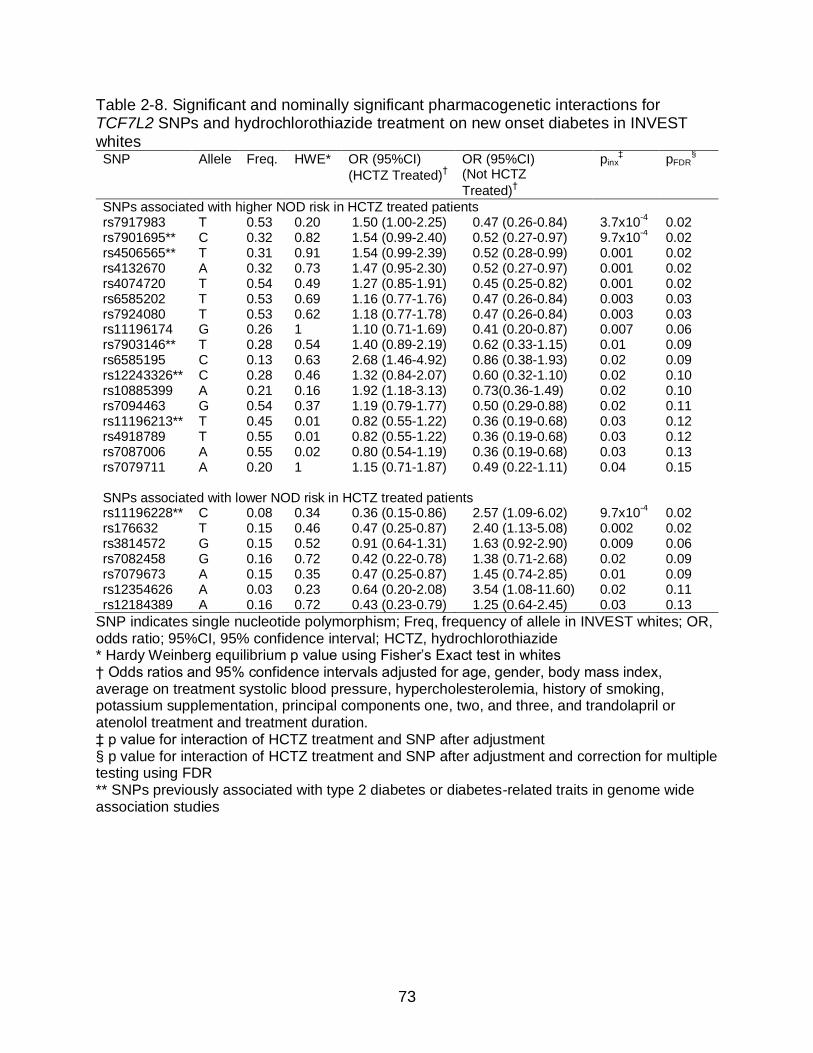
73
Table 2-8. Significant and nominally significant pharmacogenetic interactions for TCF7L2 SNPs and hydrochlorothiazide treatment on new onset diabetes in INVEST whites SNP Allele Freq. HWE* OR (95%CI)
(HCTZ Treated)†
OR (95%CI) (Not HCTZ
Treated)†
pinx‡ pFDR
§
SNPs associated with higher NOD risk in HCTZ treated patients rs7917983 T 0.53 0.20 1.50 (1.00-2.25) 0.47 (0.26-0.84) 3.7x10
-4 0.02
rs7901695** C 0.32 0.82 1.54 (0.99-2.40) 0.52 (0.27-0.97) 9.7x10⁻⁴ 0.02
rs4506565** T 0.31 0.91 1.54 (0.99-2.39) 0.52 (0.28-0.99) 0.001 0.02 rs4132670 A 0.32 0.73 1.47 (0.95-2.30) 0.52 (0.27-0.97) 0.001 0.02 rs4074720 T 0.54 0.49 1.27 (0.85-1.91) 0.45 (0.25-0.82) 0.001 0.02 rs6585202 T 0.53 0.69 1.16 (0.77-1.76) 0.47 (0.26-0.84) 0.003 0.03 rs7924080 T 0.53 0.62 1.18 (0.77-1.78) 0.47 (0.26-0.84) 0.003 0.03 rs11196174 G 0.26 1 1.10 (0.71-1.69) 0.41 (0.20-0.87) 0.007 0.06 rs7903146** T 0.28 0.54 1.40 (0.89-2.19) 0.62 (0.33-1.15) 0.01 0.09 rs6585195 C 0.13 0.63 2.68 (1.46-4.92) 0.86 (0.38-1.93) 0.02 0.09 rs12243326** C 0.28 0.46 1.32 (0.84-2.07) 0.60 (0.32-1.10) 0.02 0.10 rs10885399 A 0.21 0.16 1.92 (1.18-3.13) 0.73(0.36-1.49) 0.02 0.10 rs7094463 G 0.54 0.37 1.19 (0.79-1.77) 0.50 (0.29-0.88) 0.02 0.11 rs11196213** T 0.45 0.01 0.82 (0.55-1.22) 0.36 (0.19-0.68) 0.03 0.12 rs4918789 T 0.55 0.01 0.82 (0.55-1.22) 0.36 (0.19-0.68) 0.03 0.12 rs7087006 A 0.55 0.02 0.80 (0.54-1.19) 0.36 (0.19-0.68) 0.03 0.13 rs7079711 A 0.20 1 1.15 (0.71-1.87) 0.49 (0.22-1.11) 0.04 0.15 SNPs associated with lower NOD risk in HCTZ treated patients rs11196228** C 0.08 0.34 0.36 (0.15-0.86) 2.57 (1.09-6.02) 9.7x10
-4 0.02
rs176632 T 0.15 0.46 0.47 (0.25-0.87) 2.40 (1.13-5.08) 0.002 0.02 rs3814572 G 0.15 0.52 0.91 (0.64-1.31) 1.63 (0.92-2.90) 0.009 0.06 rs7082458 G 0.16 0.72 0.42 (0.22-0.78) 1.38 (0.71-2.68) 0.02 0.09 rs7079673 A 0.15 0.35 0.47 (0.25-0.87) 1.45 (0.74-2.85) 0.01 0.09 rs12354626 A 0.03 0.23 0.64 (0.20-2.08) 3.54 (1.08-11.60) 0.02 0.11 rs12184389 A 0.16 0.72 0.43 (0.23-0.79) 1.25 (0.64-2.45) 0.03 0.13
SNP indicates single nucleotide polymorphism; Freq, frequency of allele in INVEST whites; OR, odds ratio; 95%CI, 95% confidence interval; HCTZ, hydrochlorothiazide * Hardy Weinberg equilibrium p value using Fisher’s Exact test in whites † Odds ratios and 95% confidence intervals adjusted for age, gender, body mass index, average on treatment systolic blood pressure, hypercholesterolemia, history of smoking, potassium supplementation, principal components one, two, and three, and trandolapril or atenolol treatment and treatment duration. ‡ p value for interaction of HCTZ treatment and SNP after adjustment § p value for interaction of HCTZ treatment and SNP after adjustment and correction for multiple testing using FDR ** SNPs previously associated with type 2 diabetes or diabetes-related traits in genome wide association studies
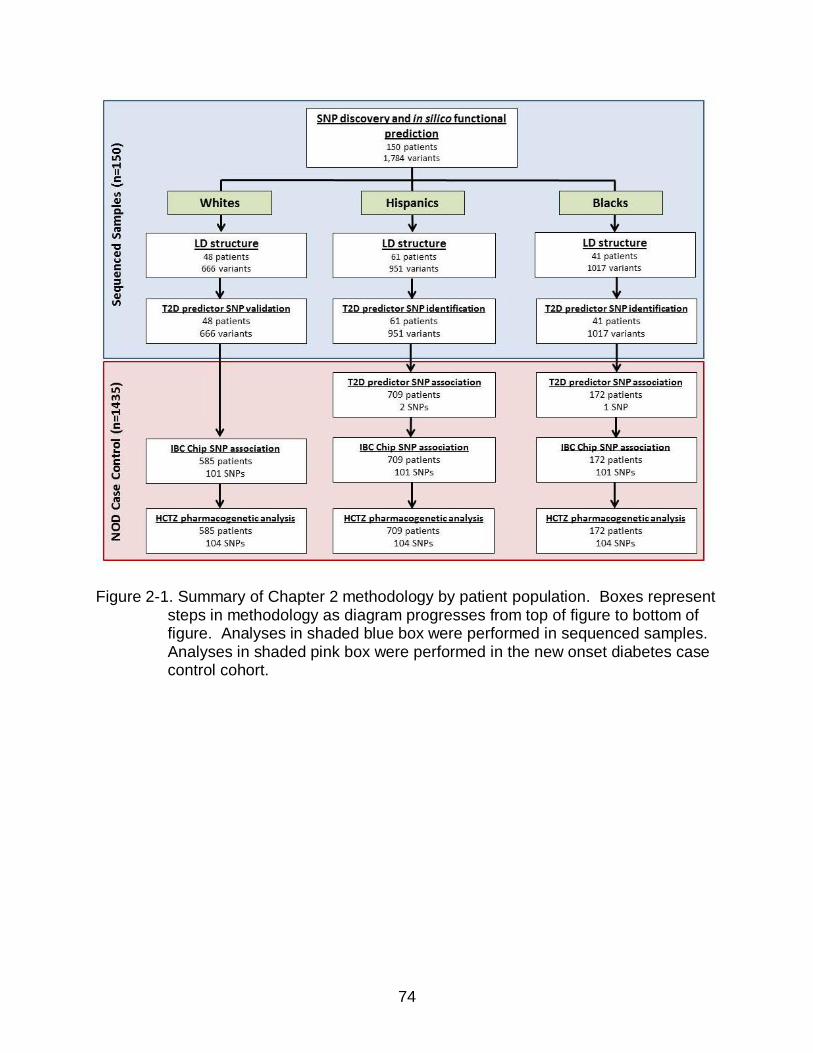
74
Figure 2-1. Summary of Chapter 2 methodology by patient population. Boxes represent
steps in methodology as diagram progresses from top of figure to bottom of figure. Analyses in shaded blue box were performed in sequenced samples. Analyses in shaded pink box were performed in the new onset diabetes case control cohort.
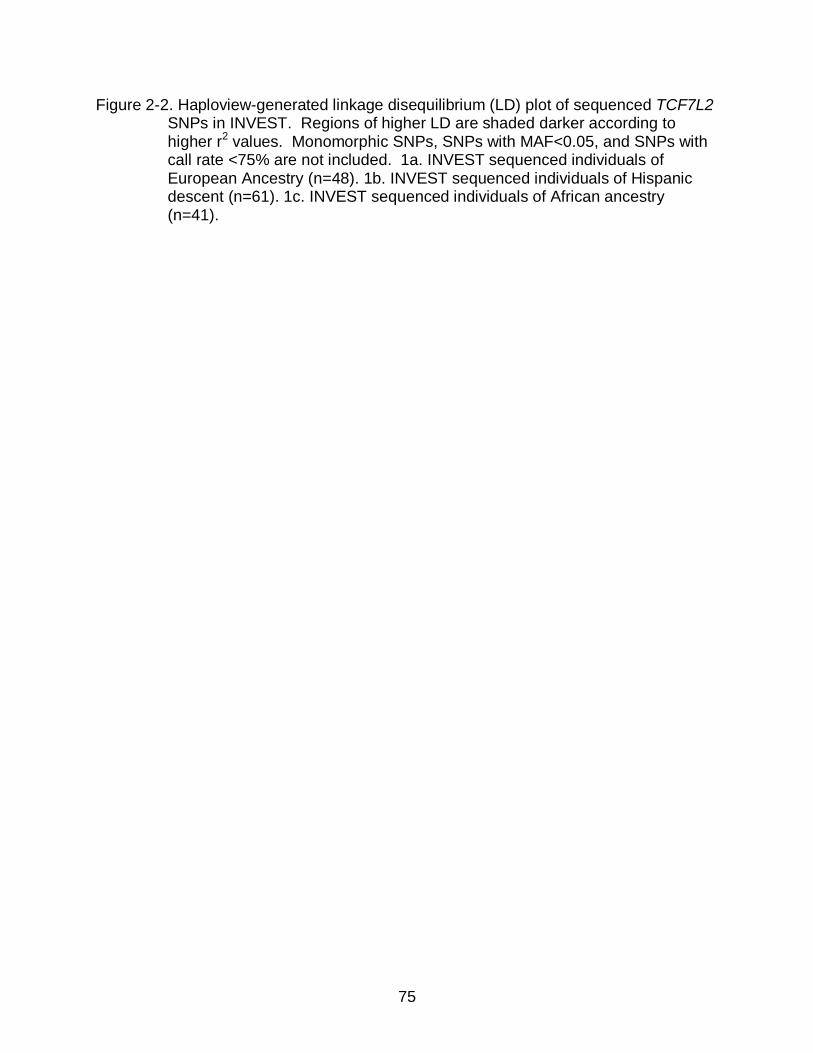
75
Figure 2-2. Haploview-generated linkage disequilibrium (LD) plot of sequenced TCF7L2 SNPs in INVEST. Regions of higher LD are shaded darker according to higher r2 values. Monomorphic SNPs, SNPs with MAF<0.05, and SNPs with call rate <75% are not included. 1a. INVEST sequenced individuals of European Ancestry (n=48). 1b. INVEST sequenced individuals of Hispanic descent (n=61). 1c. INVEST sequenced individuals of African ancestry (n=41).
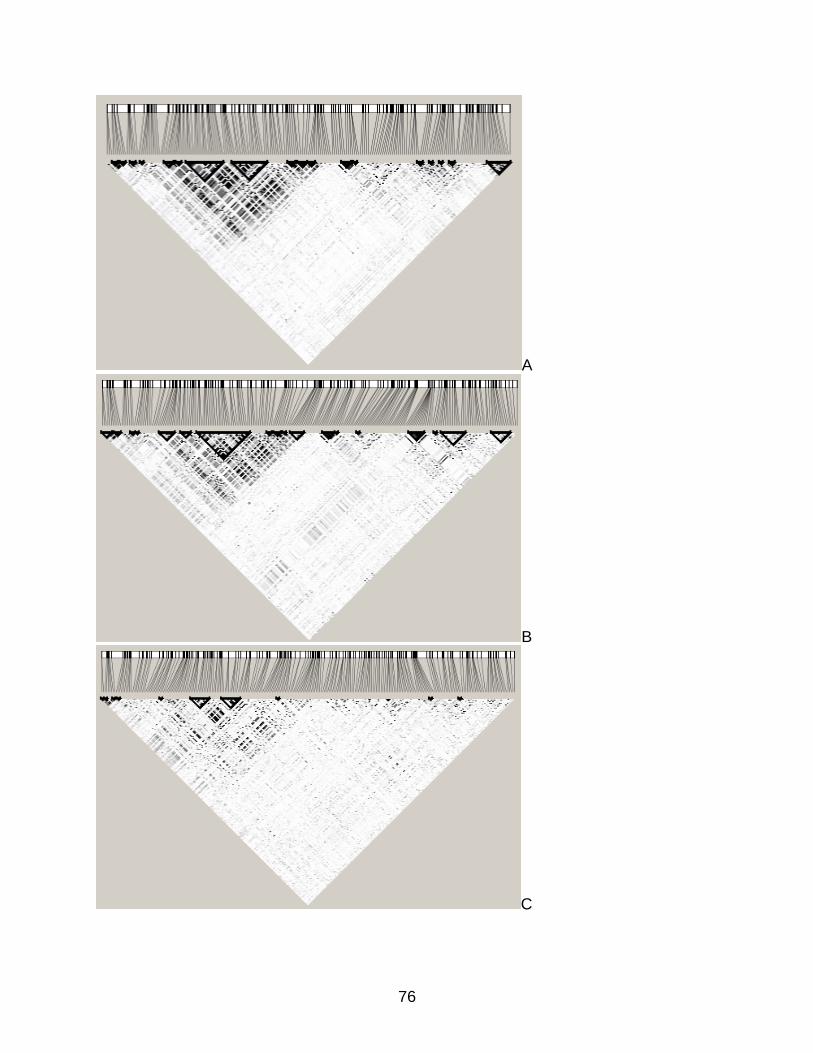
76
A
B
C

77
Figure 2-3. Venn diagrams for TCF7L2 polymorphisms by race/ethnicity in sequenced
samples.

78
Figure 2-4. Plot of principal components one and two in sequenced samples by self-
reported race/ethnicity. PCA was performed using HumanCVD BeadChip data in 2,305 INVEST-GENES participants. The two white individuals which cluster with Hispanics were re-categorized as Hispanic for association analysis.

79
Figure 2-5. Odds ratios per copy of allele and 95% confidence intervals for TCF7L2
SNPs and new onset diabetes in INVEST patients by race/ethnicity. Candidate diabetes predictor SNPs, nominally significant HumanCVD BeadChip SNPs, and rs7903146 are included. All odds ratios are adjusted for age, gender, body mass index, average on treatment systolic blood pressure, left ventricular hypertrophy, hypercholesterolemia, history of smoking, principal components one, two, and three, and treatment and duration of treatment with trandolapril, atenolol, and hydrochlorothiazide. SNP indicates single nucleotide polymorphism, NOD new onset diabetes.

80
CHAPTER 3 ASSOCIATION OF TAG SNPS IN KCNJ1, ADD1, ACE, AND AGTR1 WITH CHANGE
IN FG AND NOD DURING THIAZIDE TREATMENT
Introduction
The importance of identifying predictors of thiazide-induced dysglycemia was
emphasized by a working group from the NHLBI.46 A priori identification of patients who
will develop dysglycemia during thiazide treatment could guide thiazide prescribing to
reduce the risk of NOD. Strong genetic predictors of T2D development have been
observed in European populations91,95 and pharmacogenetic associations with thiazide-
induced dysglycemia have been observed,112-114 suggesting that pharmacogenetic risk
factors could be used to predict T2D and thiazide-induced dysglycemia. Despite the
potential utility of personalized medicine in reducing the potential for AMEs of thiazides,
few studies have identified important pharmacogenetic risk factors for thiazide-induced
hyperglycemia.
The few published studies that examine pharmacogenetic effects of SNPs
observed significant associations between SNPs and T2D or change in FG during
thiazide treatment, supporting SNP influences on thiazide-induced dysglycemia.112-114
However, the impact of the majority of genetic variation in candidate genes is
uninvestigated due to inadequate gene coverage in these studies. Despite racial/ethnic
differences in T2D prevalence,1 in genetic associations with T2D,98 and in LD
structure,115 the impact of race/ethnicity on genetic and pharmacogenetic risk factors for
T2D and thiazide-induced dysglycemia is also largely uninvestigated. Furthermore, the
phenotype studied varies between change in FG and NOD, making interpretation of
results problematic and resulting in an inability to draw conclusions regarding the
existence and implication of pharmacogenetic effects. The research presented in this

81
chapter seeks to identify SNPs as risk factors for T2D and thiazide-induced
hyperglycemia using a candidate gene approach and to investigate the impact of
race/ethnicity on SNP associations.
Whereas previous studies focus on a small number of well-studied, primarily
functional SNPs,112-114 the research outlined in Chapter 3 investigates the effect of
comprehensive variation within candidate genes on thiazide-induced dysglycemia.
Thiazides increase potassium excretion, which may blunt insulin release and contribute
to thiazide-induced hyperglycemia.76,79 Thiazides also cause RAS activation,112 which
contributes to hyperglycemia.70,160 Thereby, candidate genes investigated in this
research are involved in either electrolyte homeostasis or the RAS, which is consistent
with previous studies. (Figure 3-1) In each candidate gene studied, we attempted to
replicate findings for the SNP previously associated with thiazide-induced dysglycemia.
Although increased FG levels have been observed with thiazide and thiazide-like
diuretics, the mechanisms of thiazide-induced hyperglycemia are not fully understood.
Supporting the role of potassium depletion in thiazide-induced dysglycemia, the non-
synonymous SNP rs59172778 in the potassium inwardly-rectifying channel, subfamily J,
member 1 gene (KCNJ1) has been associated with change in FG during four weeks of
HCTZ treatment.114 Since the protein coded by KCNJ1, the renal outer medullary
potassium channel (ROMK1), plays an important role in potassium homeostasis161 and
a KCNJ1 SNP has been associated with change in FG after thiazide therapy,114 KCNJ1
was chosen as a candidate gene for this research.
Another candidate gene for the pharmacogenetics of thiazide-induced
dysglycemia is the alpha-adducin 1 gene (ADD1).162 Adducin is a ubiquitously-

82
expressed cytoskeletal protein that is involved in electrolyte homeostasis.163 Variants in
ADD1 have been associated with hypertension, decreased BP response to diuretics,
and increased CV outcomes with diuretic treatment.164-167 The ADD1 variant rs4961
(Gly460Trp), previously associated with BP response to diuretic therapy,165 has been
studied in investigations of pharmacogenetics of thiazide-induced dysglycemia with
inconsistent results.112-114 The physiological role of ADD1 and a previous association of
an ADD1 SNP with thiazide-induced NOD make ADD1 a compelling candidate gene for
this research.
Candidate genes of interest for this research also include key genes in the
RAS.53,68 Reduced blood volume caused by thiazides results in a reduced perfusion of
the juxtaglomerular apparatus, which subsequently releases renin. Renin activates the
RAS which has potentially unfavorable consequences including sympathetic activation
and inflammation, which may adversely affect glucose homeostasis.160 Stimulation of
the RAS also results in aldosterone release, causing potassium excretion which may
further contribute to dysglycemia. In addition, RAS-blocking agents, such as ACEIs and
ARBs, have been associated with reduced risk of NOD.47,50,53 The genes that encode
the two directly targeted proteins of ACEIs and ARBs are ACE and AGTR1 respectively
and were chosen as candidate genes for this research. While the ACE
insertion/deletion (I/D) polymorphism and the AGTR1 rs5186 SNP (+A1166C) have
been associated with thiazide-induced NOD,112 they have not been associated with
thiazide-induced FG changes to date.113,114
We investigated the association of KCNJ1, ADD1, ACE, and AGTR1 tag SNPs
with change in FG during short term HCTZ treatment in the PEAR study and NOD
83
during long term HCTZ treatment in INVEST. We first sought to replicate
pharmacogenetic associations with SNPs from previous studies and then investigated
tag SNPs within these candidate genes for pharmacogenetic effects. In addition,
multivariate models including TCF7L2 SNPs from Chapter 2 were created to test
robustness of pharmacogenetic associations when controlled for patients’ baseline
genetic risk for T2D.
Methods
All patients enrolled in both studies provided voluntary, written informed consent,
and the institutional review boards of participating study centers approved the study
protocols. PEAR and INVEST are registered at ClinicalTrials.gov (NCT00246519 and
NCT00133692 respectively).
PEAR Study Design and Population
PEAR is a prospective, randomized, open label, parallel group study to evaluate
the pharmacogenetic effects of the thiazide diuretic HCTZ, the beta-blocker atenolol,
and their combination on BP response and AMEs. Details of the PEAR study design
have been previously published.117 PEAR patients, aged 17 to 65, had mild to
moderate essential hypertension without a history of heart disease, secondary forms of
hypertension, renal disease, or diabetes (type 1 diabetes or T2D). After a 3-8 week
washout period, patients were randomized to receive HCTZ 12.5 mg or atenolol 50 mg
daily followed by dose titration to HCTZ 25 mg or atenolol 100 mg daily for 6-9 weeks.
(Figure 3-2) The other agent was then added, with similar dose titration for 6-9 weeks
of combination treatment.
FG, plasma insulin, total cholesterol, low density lipoprotein (LDL) cholesterol, high
density lipoprotein (HDL) cholesterol, triglycerides, serum potassium, uric acid, and

84
urinary potassium were also acquired at response assessment and safety check study
visits.117 Patients were asked to fast for at least eight hours before study visits that
included response assessments. Fasting serum levels of glucose, lipids, and uric acid
were determined using an Hitachi 911 Chemistry Analyzer (Roche Diagnostics,
Indianapolis, IN) at a central laboratory at the Mayo Clinic. BP and electrolytes were
regularly monitored, with determination of serum potassium every 3-4 weeks at a local
laboratory in patients taking HCTZ. Study physicians could elect to prescribe oral
potassium supplementation with a protocol mandated 40 mEq potassium chloride daily
by mouth if serum potassium was below 3.2 mEq/L.
INVEST Study Design and Population
INVEST and INVEST-GENES study designs are described in detail in the Methods
section of Chapter 2. Briefly, INVEST evaluated adverse CV outcomes and NOD
occurring during randomized treatment with either an atenolol-based or a verapamil SR-
based antihypertensive strategy in patients with hypertension and CAD who were ≥50
years of age. The design, exclusion criteria, primary outcome, and NOD results have
been previously published in detail.50,137,138,168 INVEST-GENES collected DNA samples
from 5,979 INVEST patients at 187 sites in the US and Puerto Rico, who provided
additional written informed consent for genetic studies. We conducted a nested case
control study including those who developed NOD during follow-up (cases) and age,
race, and gender-matched participants who remained diabetes-free over a mean 2.8
years follow-up (controls). NOD was determined by site investigators from a review of
all available patient data, including the use of anti-diabetic medication.50 Patients taking
anti-diabetic medication or with diabetes history at baseline were excluded from this
analysis.

85
Genotyping and Quality Control
In both PEAR and INVEST, genotyping for candidate gene tag SNPs was
accomplished using the HumanCVD BeadChip and Infinium II Assay (Illumina, San
Diego, CA). Genotyping and QC methods for the HumanCVD BeadChip are further
described in the Methods section of Chapter 2. Gene coverage for candidate genes
was based on priority, with all candidate genes from Chapter 3 being either priority one
(tag SNPs selected for r2>0.8 and MAF>0.02) or priority two (tag SNPs selected for
r2>0.5 and MAF>0.05) based on Hapmap and Seattle SNPs genotype data.142,152 (Table
3-1) Genotyping for the KCNJ1 SNP rs59172778 (hcv632615) was accomplished using
the TaqMan® 7900HT real-time PCR system using conditions specified in Chapter 2.169
Rs59172778 genotypes were confirmed in five percent of genotyped samples, including
all heterozygous individuals. Functional consequences of SNPs were determined in
silico as described in Chapter 2.
Definition and Treatment of Race/Ethnicity
PEAR race/ethnicity was self-described by study patient according to guidelines
set forth by the NIH Office of Management and Budget (OMB) minimum standards for
maintaining, collecting, and presenting data on race and ethnicity. Race/ethnicity was
confirmed by PCA performed using LD-pruned data from the HumanOmni1-Quad
BeadChip (Illumina, San Diego, CA). In PEAR, any patient that did not report black
ancestry during screening was considered non-black in statistical analyses. INVEST
race/ethnic groups were determined by methods described in Chapter 2, including
patient report with interaction by the study investigator and confirmation through PCA.
To minimize confounding by population stratification, pharmacogenetic analyses were
performed by race/ethnicity and adjusted for PCs one, two, and three. PCs one, two,

86
and three were generated separately for each race/ethnic group in both PEAR and
INVEST.
Statistical Analysis
We first sought to replicate pharmacogenetic associations with SNPs in candidate
genes from previous studies, which are summarized in Table 3-1. We then investigated
effects of other tag SNPs within candidate genes. For previously associated SNPs,
significance was determined at p<0.05. For other tag SNPs within candidate genes,
significance was determined using an FDR correction for all SNPs within each
candidate gene by race/ethnic group in each trial. Deviations from HWE were assessed
using Fisher’s Exact Test by race/ethnicity with alpha=0.05. SNPs departing from HWE
at p<0.05 were flagged, but included in statistical analyses. SNPs with significant
departures from HWE in several race/ethnic groups or with HWE p<1x10⁻³ were
excluded from pharmacogenetic analyses. All statistical analyses were performed using
SAS version 9.2 and JMP Genomics version 5.0 (SAS, Cary, NC).
PEAR
Differences in change in FG and serum potassium during HCTZ monotherapy
versus HCTZ add-on therapy were tested using Wilcoxon rank sum. Laboratory values
were tested for normality using Kolmogorov-Smirnov and variables were log-
transformed if non-normal. Linear regression was used to model SNP effects on
change in log(FG) during HCTZ using allelic trend tests in an additive model. P values
were determined using log-transformed data whereas betas were calculated using non-
transformed data to provide clinically interpretable genotype effects on change in FG.
Variables for adjustment were selected based on previously published studies118,170 and
for potential impact on FG and included log(FG) at start of HCTZ, age, gender, waist
87
circumference, potassium supplementation during the study, treatment arm, average
baseline systolic and diastolic BP measured at home, HCTZ dose, duration of HCTZ
treatment, and PCs one, two, and three. KCNJ1 SNP effects on change in serum
potassium during HCTZ treatment were tested.
We determined pharmacogenetic effects using a multivariate linear regression of
change in FG during HCTZ treatment using combined data from HCTZ monotherapy
and HCTZ add-on therapy. (Figure 3-2) Change in FG during HCTZ monotherapy was
defined as the difference in FG from the start of HCTZ monotherapy to the end of HCTZ
monotherapy. Change in FG during HCTZ add-on therapy was defined as the
difference in FG from the start of HCTZ to the end of the trial. An FDR adjustment was
used for all SNPs within each candidate gene by race/ethnicity. Consistency of SNP
effects was also assessed in each race/ethnic group and for HCTZ monotherapy and
HCTZ add-on therapy. Finally, for significantly associated SNPs, a pharmacogenetic
effects model was performed with adjustment for rs7903146 genotype in addition to
other covariates. Assuming a MAF of 0.06, we have 99% power in Blacks (n=304) and
Non-blacks (n=464) to detect an effect size of 0.5 (two sided, α=0.05).
INVEST
Baseline differences in patient characteristics between cases and controls were
determined using t-tests, Wilcoxon Rank Sum, and chi square tests as appropriate.
ORs per allele copy and 95% CIs were calculated using allelic trend tests. Multi-
variable logistic regression models were used to assess SNP effects on NOD risk in
patients treated with HCTZ as described in Chapter 2. Area under the receiver
operating characteristic curves (AUROCs) were also generated for clinical variables
used as covariates by race/ethnicity. SNP*HCTZ treatment interaction p values were

88
determined for significant SNPs. Significant SNPs were then tested for association with
NOD in HCTZ treated patients with adjustment for rs7903146 genotype in addition to
other covariates. In INVEST, assuming an OR of 1.7 and MAF of 0.15, we have 89%
power in Whites, 40% power in Blacks, and 94% power in Hispanics to identify a
SNP*HCTZ treatment interaction on NOD risk (two sided alpha=0.05).
Linkage Disequilibrium and Haplotype Design
LD analysis and pairwise LD (r2) were performed within race/ethnic groups using
Haploview.147 We used SAS (SAS, Cary, NC) to create phased haplotypes within
race/ethnic groups from SNPs reaching nominal significance (p<0.05) for candidate
genes with multiple nominally significant associations. Common haplotypes
(frequency>0.05) were tested for association with change in FG during HCTZ treatment
and NOD risk in previously described statistical models. If two nominally associated
SNPs were in very high LD (r2>0.9), one SNP was included in haplotypes.
Results
Baseline Characteristics and Clinical Predictor of Outcome Variables
PEAR
A total of 768 patients were included in PEAR analysis, including 382 who
received HCTZ monotherapy and 386 who received HCTZ add-on therapy. (Table 3-2)
The variables FG, serum potassium, urine potassium, and plasma insulin were
considered non-normal using the Kolmogorov-Smirnov test (all p<0.01) and were log-
transformed before linear regression modeling. The average duration of HCTZ
treatment was 9.3 (SD 1.9) weeks during HCTZ monotherapy and 9.6 (SD 1.9) weeks
during HCTZ add-on therapy (p=0.07).
89
Parameter estimates, SEs, and p values for model covariate effects on change in
FG are presented in Table 3-3. Strong predictors of increased FG were lower baseline
FG (beta= -0.39 [standard error (SE) 0.04], p<0.0001) and greater waist circumference
(beta=0.18 [SE 0.03], p<0.0001). Median increase in FG was 2.50 mg/dL (interquartile
range [IQR] -3.5-7.5) during HCTZ monotherapy and 2.00 mg/dL (IQR -4.0-8.0) during
HCTZ add-on therapy (p=0.69 for comparison between treatment arms). The model
containing clinical predictor variables explained 20.8% of the variability in the change in
FG endpoint in blacks and (R2=0.208) and 20.6% of the variability in the change in FG
endpoint in non-blacks (R2=0.206). Serum potassium decreased a median 0.27 mEq/L
(IQR 0.04-0.57) during HCTZ monotherapy and 0.31 mEq/L (IQR 0.03-0.59) during
HCTZ add-on therapy (p=0.60). These results support the similarity of distributions in
FG data from HCTZ monotherapy and HCTZ add-on therapy and support pooling
change in log(FG) data.
INVEST
Over a mean 2.8 years, 446 patients in the INVEST-GENES cohort developed
NOD, 410 of which were successfully genotyped on the HumanCVD BeadChip.
Differences in baseline characteristics between NOD cases and controls are described
in detail in Chapter 2. Briefly, NOD cases had higher baseline BMI (p<0.0001) and
diastolic BP (p=0.04), and a higher percentage of LVH (p=0.02) than age, race/ethnicity,
and gender-matched controls. (Table 3-4) During INVEST, the proportion of patients
who were treated with HCTZ was higher in cases than in controls (p<0.0001). Mean
atenolol dose was also higher in NOD cases than in controls (p=0.02) among patients
treated with atenolol. Interestingly, significantly more NOD cases than controls received
potassium supplementation during the study (p=0.0001).

90
Associations between model covariates and NOD are presented in Table 3-5. In a
multivariate logistic regression, NOD was predicted by BMI (OR 1.24 [95%CI 1.09-1.42]
per 5 kg/m2, p=0.002), history of LVH (OR 1.58 [95%CI 1.06-2.35], p=0.02), HCTZ
treatment duration (OR 1.13 [95%CI 1.07-2.35] per 6 months, p<0.0001), trandolapril
treatment (OR 0.68 [95%CI 0.53-0.88], p<0.0001), trandolapril treatment duration (OR
0.53 [95%CI 0.47-0.59] per 6 months, p<0.0001), and potassium supplementation
during the study (OR 2.19 95%CI [1.39-3.43], p=0.0007). (Table 3-5) The model
containing clinical predictor variables had an AUROC of 0.839 in INVEST whites treated
with HCTZ, 0.791 in INVEST Hispanics treated with HCTZ, and 0.855 in INVEST blacks
treated with HCTZ.
Hardy Weinberg Equilibrium for Candidate Gene SNPs
A total of 23 SNPs departed from HWE at p<0.05 in at least one race/ethnic group,
which is less than that expected by chance for the 201 SNPs tested in two race/ethnic
groups in PEAR and three race/ethnic groups in INVEST. However, several SNPs were
out of HWE in multiple race/ethnic groups or had HWE p<1x10⁻³. (Appendix A: Table A-
1). Seven SNPs were excluded from pharmacogenetic analyses based on HWE p
values, including the ADD1 SNPs rs1263347 and rs16843458, the ACE SNP
rs12709436, and the AGTR1 SNPs rs2640543, rs12721286, rs12695918, and rs5183.
KCNJ1 and Increased FG during HCTZ Treatment in PEAR
The previously reported missense KCNJ1 SNP rs59172778 which was associated
with a decrease in FG,114 occurred only in non-blacks (MAF=0.01), was not in LD with
any other SNP tested, and was not associated with change in FG during HCTZ
treatment (beta = 2.10 [SE 3.34], p=0.58). PEAR results for previously associated
SNPs from our candidate genes are reported in Appendix A. (Table A-2) We observed
91
a significant association between this SNP’s G allele and increased serum potassium
during HCTZ treatment in non-blacks, increasing an average 0.23 (SD 0.44) mEq/L in
six rs59172778 A/G heterozygotes and decreasing 0.34 (SD 0.23) mEq/L in 222 A/A
homozygotes (p=0.001 [pFDR=0.02]). Increased potassium with the G allele may be
consistent with the decreased FG during HCTZ treatment observed previously with this
allele.114 The nonsynonymous rs59172778 SNP, coding a methionine to threonine
substitution at amino acid 357, was predicted to be tolerated with a SIFT score of 0.37.
In PEAR blacks (n=304), the intronic KCNJ1 SNP rs17137967 (MAF 0.05) was
associated with an increased FG during HCTZ treatment after FDR correction
(beta=8.47 [SE 2.45], p=0.0008, pFDR=0.009). SNPs that were significantly associated
with change in FG after FDR correction in PEAR are presented in Table 3-7. FG
increased an average 2.0 (SD 13.9) mg/dL among 271 T/T homozygotes, 10.4 (SD
16.6) mg/dL in 25 T/C heterozygotes, and 15.8 (SD 15.8) mg/dL in two C/C
homozygotes. (Figure 3-3) The association remained significant after adjustment for
baseline and change in serum potassium (beta=7.94 [SE 2.46], p=0.002), urinary
potassium (beta=8.17 [SE 2.47], p=0.001), and plasma insulin (beta=4.96 [SE 1.79],
p=0.002). The KCNJ1 SNP rs17137967 association also remained significant
(beta=7.54 [SE 2.40], p=0.002) after adjustment for TCF7L2 rs7903146 genotype,
which was nominally associated with change in FG in PEAR blacks (beta=3.05 [SE
1.29], p=0.02).
A nominal (p<0.05) association with increased FG was also observed for the
rs2846680 A allele (beta=3.55 [SE 1.44], p=0.03, pFDR=0.13) in blacks. The two SNPs
rs17137967 and rs2846680 (r2=0.01) were used to create three common haplotypes for

92
black PEAR patients. Haplotype findings in blacks were driven by rs17137967 and
therefore were not considered further.
No SNPs in KCNJ1 were observed to have significant effects on change in FG
after FDR correction in non-blacks. The intronic SNP rs7933427 (MAF=0.04) was
nominally associated with increased FG (beta=3.46 [SE 1.55], p=0.02, pFDR=0.29),
although this SNP deviated from HWE in non-blacks (p=0.01). The SNP rs17137967
was monomorphic in PEAR non-blacks and so statistical analysis for change in FG
during HCTZ was not possible.
KCNJ1 and NOD Risk after HCTZ Treatment in INVEST
The KCNJ1 SNP rs59172778, which was previously reported to be associated
with changes in FG,114 was not associated with NOD in any race/ethnic group and
showed no SNP*HCTZ treatment interactions. INVEST results for previously
associated SNPs in our candidate genes are reported in Appendix A. (Table A-3)
In HCTZ-treated whites (n=371), two KCNJ1 SNPs (rs12795437 and
rs11600347) were significantly associated with a greater than two-fold increase in NOD
risk per variant allele (p=0.006 [pFDR=0.04] and p=0.008 [pFDR=0.04] respectively).
(Table 3-7) These two SNPs were also associated in HCTZ-treated Hispanics (n=464)
at nominal (p<0.05) significance. (Figure 3-4) One SNP (rs658903) was associated with
a more than 60% reduced risk of NOD (p=0.002 [pFDR=0.04]) in Hispanics. In HCTZ-
treated black patients (n=131), one SNP (rs675388) was associated with a 3.13-fold
increased NOD risk with each allele copy (p=0.004 [pFDR=0.03]). We found 10 other
SNPs associated with NOD in HCTZ-treated patients at nominal (p<0.05) significance in
at least one race/ethnic group. (Figure 3-4)

93
After LD analysis in whites, (Appendix A: Figure A-1) three SNPs (rs2238009,
rs12795437, and rs11600347) were used to construct three haplotypes with
frequency>0.05. The haplotype HapW1 (GCA) was associated with significantly
increased risk for NOD during HCTZ treatment (p=0.006 [pFDR=0.04]). (Table 3-7) In
Hispanics, haplotypes were inferred from five nominally associated SNPs (rs675388,
rs1148058, rs658903, rs12795437, and rs3016774), resulting in five haplotypes with
frequency>0.05. HapH1 (CATCT) was associated with an approximately two-fold
increased risk for NOD per haplotype copy (p=0.003 [pFDR=0.03]) and the opposite
haplotype HapH2 (TGAGC) was associated with a 57% reduction in NOD risk per
haplotype copy (p=0.007 [pFDR=0.04]). In blacks, two nominally associated SNPs
(rs675388 and rs1148059) were used to infer three haplotypes with frequency>0.05.
HapB1 (GC) was associated with a 72% decreased NOD risk during HCTZ treatment
(p=0.003 [pFDR=0.02]).
Consistent associations were observed for SNPs and haplotypes in all three ethnic
groups when HCTZ treatment was defined as ≥6 months or ≥25 mg/day. (Table 3-7)
Consistent associations were also observed for each SNP and haplotype after
adjustment for TCF7L2 rs7903146 genotype, although rs7903146 was not associated
with NOD in any race/ethnic group. Importantly, no KCNJ1 SNPs or haplotypes were
associated with NOD in patients not treated with HCTZ in any race/ethnic group. This
resulted in significant SNP*HCTZ treatment interactions for NOD.
ADD1 and Increased FG during HCTZ Treatment in PEAR
The ADD1 SNP rs4961 (MAF 0.21), which was associated with NOD during
thiazide treatment in a European population,112 was associated with change in FG in
PEAR non-blacks (beta = 1.99 [SE 0.81], p=0.015 [pFDR=0.10]). (Table 3-6) For rs4961,
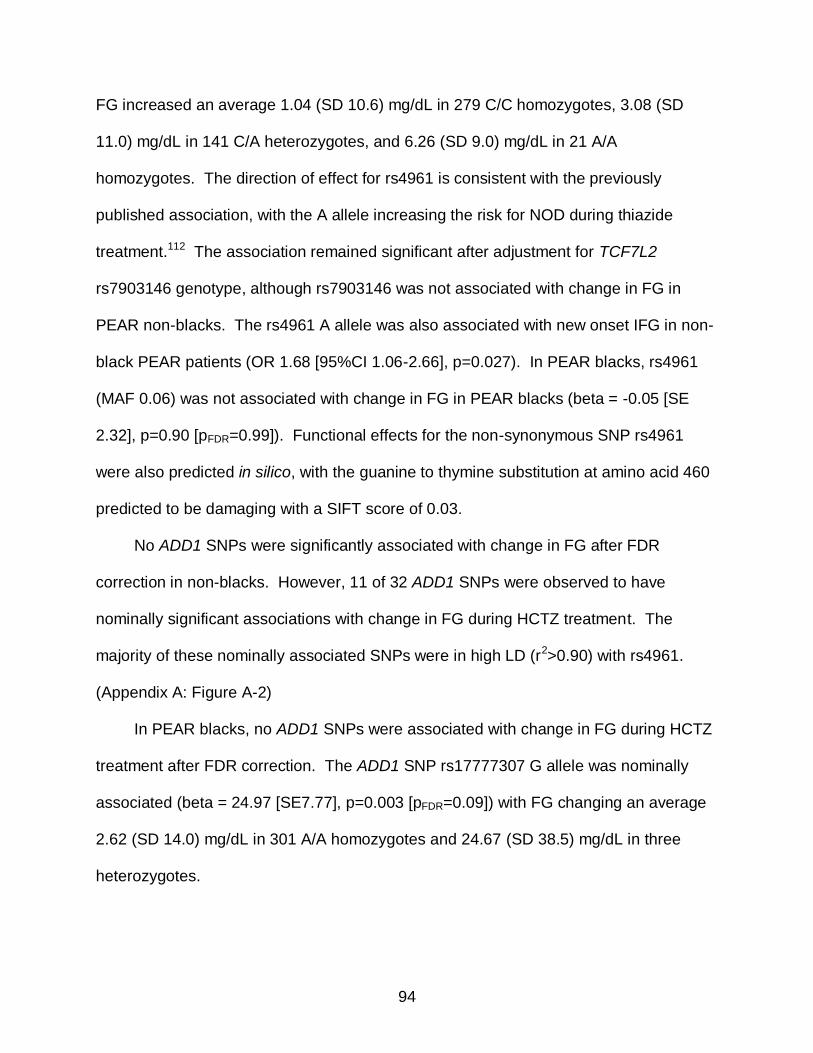
94
FG increased an average 1.04 (SD 10.6) mg/dL in 279 C/C homozygotes, 3.08 (SD
11.0) mg/dL in 141 C/A heterozygotes, and 6.26 (SD 9.0) mg/dL in 21 A/A
homozygotes. The direction of effect for rs4961 is consistent with the previously
published association, with the A allele increasing the risk for NOD during thiazide
treatment.112 The association remained significant after adjustment for TCF7L2
rs7903146 genotype, although rs7903146 was not associated with change in FG in
PEAR non-blacks. The rs4961 A allele was also associated with new onset IFG in non-
black PEAR patients (OR 1.68 [95%CI 1.06-2.66], p=0.027). In PEAR blacks, rs4961
(MAF 0.06) was not associated with change in FG in PEAR blacks (beta = -0.05 [SE
2.32], p=0.90 [pFDR=0.99]). Functional effects for the non-synonymous SNP rs4961
were also predicted in silico, with the guanine to thymine substitution at amino acid 460
predicted to be damaging with a SIFT score of 0.03.
No ADD1 SNPs were significantly associated with change in FG after FDR
correction in non-blacks. However, 11 of 32 ADD1 SNPs were observed to have
nominally significant associations with change in FG during HCTZ treatment. The
majority of these nominally associated SNPs were in high LD (r2>0.90) with rs4961.
(Appendix A: Figure A-2)
In PEAR blacks, no ADD1 SNPs were associated with change in FG during HCTZ
treatment after FDR correction. The ADD1 SNP rs17777307 G allele was nominally
associated (beta = 24.97 [SE7.77], p=0.003 [pFDR=0.09]) with FG changing an average
2.62 (SD 14.0) mg/dL in 301 A/A homozygotes and 24.67 (SD 38.5) mg/dL in three
heterozygotes.

95
ADD1 NOD Risk after HCTZ Treatment in INVEST
The previously associated ADD1 SNP rs4961 was not associated with NOD during
HCTZ treatment in any INVEST race/ethnic group. (Appendix A: Table A-3) No ADD1
SNPs showed significant associations with NOD after FDR correction or significant
SNP*HCTZ treatment interactions after FDR correction in any INVEST race/ethnic
group.
In INVEST whites, nominally significant SNP*HCTZ treatment interactions were
observed for rs12509447 (p=0.01 [pFDR=0.08]), rs12503220 (p=0.01 [pFDR=0.12]), and
rs3775067 (p=0.006 [pFDR=0.08]). These nominally significant interaction p values in
INVEST whites were driven by significantly increased ORs for NOD in the non-HCTZ
treated patients and non-significant ORs in HCTZ treated patients. The rs3775067 T
allele (MAF 0.39) was associated with increased NOD risk in patients not treated with
HCTZ (OR 2.40 [95%CI 1.35-4.24], p=0.003), but no association was observed in HCTZ
treated patients (OR 1.14 [95%CI 0.85-1.52], p=0.38). Similar effects were seen with
rs12509447 and rs12503220 in non-HCTZ treated patients (OR 2.52 [95%CI 1.35-4.70],
p=0.003 and OR 2.29 [95%CI 1.23-4.26], p=0.009 respectively) with no association
observed in HCTZ treated patients. The SNPs rs12509447 and rs12503220 were in
high LD (r2=0.92) and these SNPs were in moderate LD with rs3775067 (r2=0.33 and
0.36 respectively), (Appendix A: Figure A-3) but no haplotypes were generated since
these SNPs were not associated with NOD in HCTZ treated patients.
In INVEST Hispanics, the rs7689864 A allele (MAF 0.02) was associated with
increased NOD in HCTZ-treated patients (OR 3.63 [95%CI 1.24-10.56], p=0.018
[pFDR=0.57]). In INVEST blacks, the rs16843169 A allele (MAF 0.05) was associated
with increased NOD in HCTZ-treated patients (OR 4.25 [95%CI 1.04-17.35], p=0.04

96
[pFDR=0.78]). Although these ORs were consistent when high dose and long term
treatment definitions were used, no significant SNP*HCTZ interaction p values were
observed for these SNPs in either Hispanic or black patients.
ACE and Increased FG during HCTZ Treatment in PEAR
The ACE SNP rs4341, which was previously associated with NOD during thiazide
treatment, has been observed to be in LD with the ACE I/D polymorphism and the effect
of rs4341in the previous study was attributed to the effect of the ACE I/D
polymorphism.112 The SNP which most closely tags the I/D polymorphism on the
HumanCVD Beadchip is rs4343.171 The SNP rs4343 was not significantly associated
with change in FG in PEAR blacks or non-blacks. (Appendix A: Table A-2)
In PEAR blacks, the non-synonymous ACE SNP rs4303 A allele (MAF 0.10) was
associated with decreased FG during HCTZ therapy (beta=-6.39 [SE1.92], p=6.80x10⁻⁴
[pFDR=0.03]). (Table 3-6) FG decreased 37.3 (SD 54.8) mg/dL in two A/A homozygous
variants, decreased 1.4 (SD 13.5) mg/dL in 55 A/C heterozygotes, and increased 4.2
(SD 13.6) mg/dL in 234 C/C wild type homozygotes. The ACE rs4303 association
remained significant (beta=-5.88 [SE 1.92], p=0.003) after adjustment for TCF7L2
rs7903146 genotype, which was nominally associated with change in FG (beta=3.05
[SE 1.29], p=0.02) in PEAR blacks. The rs4303 SNP encodes an Alanine to Serine
substitution at amino acid 261, predicted to be damaging with a SIFT score of 0.08,
supporting a true effect of the SNP. The rs4303 A allele was monomorphic in PEAR
non-blacks and so this association could not be assessed.
In PEAR non-blacks, the intronic ACE rs12709436 A allele (MAF 0.002) was
significantly associated with increased FG (beta=34.51 [SE 6.71], p=1.08x10⁻⁶
[pFDR=4.22x10⁻⁵]). However, this polymorphism occurred in only two individuals with an
97
average FG increase of 40.3 (SD 8.1) mg/dL and the association was considered
spurious. No functional consequences of this intronic polymorphism were predicted in
silico.
ACE NOD Risk after HCTZ Treatment in INVEST
The tag SNP for the ACE I/D polymorphism (rs4343) was not associated with NOD
risk during HCTZ treatment and was not observed to have a significant SNP*HCTZ
treatment interaction in any INVEST race/ethnic group and. (Appendix A: Table A-3) No
SNPs showed significant associations with NOD after FDR correction or SNP*HCTZ
treatment interactions in any race/ethnic group in INVEST.
AGTR1 and Increased FG during HCTZ Treatment in PEAR
The promoter AGTR1 SNP rs5186 (+A1166C) C allele, which was previously
associated with decreased NOD incidence during thiazide treatment,112 was not
associated with change in FG in any race/ethnic group in PEAR. (Appendix A: Table A-
2) No AGTR1 SNPs showed significant associations with change in FG during HCTZ
treatment in either race/ethnic group. In PEAR blacks, the intronic rs12721280 G allele
(MAF 0.06) was nominally associated with increased FG during HCTZ treatment
(beta=10.82 [SE4.58], p=0.018 [pFDR=0.49]).
AGTR1 NOD Risk after HCTZ Treatment in INVEST
The AGTR1 rs5186 C allele, which was previously associated with decreased
NOD incidence during thiazide treatment in a European population,112 was not
associated with NOD during HCTZ treatment in any race/ethnic group, although a weak
trend towards significantly increased NOD risk was observed in HCTZ treated blacks
(OR 2.69 [0.72-10.12], p=0.14). (Appendix A: Table A-3) Rs5186 was not observed to

98
have any significant SNP*HCTZ treatment interactions in any INVEST race/ethnic
group.
In INVEST whites, the AGTR1 rs9682137 A allele (MAF=0.01) was nominally
associated with an increased risk of NOD in HCTZ treated patients (OR 31.26 [2.77-
352.12], p=0.005 [pFDR=0.31]), but did not show a significant SNP*HCTZ treatment
interaction. In INVEST blacks, the rs12695901 T allele (MAF=0.07) was nominally
associated with an increased risk of NOD in HCTZ treated patients (OR 14.82 [2.43-
90.23], p=0.002 [pFDR=0.29]), although a significant SNP*HCTZ treatment interaction
was not observed.
Discussion
In the research presented in Chapter 3, we examined the effects of tag SNPs in
four different candidate genes on two phenotypes across the continuum of T2D risk.
For candidate gene SNPs previously associated with thiazide-induced dysglycemia, the
nonsynonymous ADD1 SNP rs4961 was associated with increased FG in PEAR non-
blacks. Significant associations after FDR correction for candidate gene tag SNPs were
observed for KCNJ1 SNPs and haplotypes in every race/ethnic group in INVEST and in
PEAR blacks (rs17137967). A significant association was also observed for a
nonsynonymous ACE SNP (rs4303) in PEAR blacks. Alternate SNPs from both KCNJ1
and ACE have been previously associated with thiazide-induced dysglycemia,
suggesting the importance of these two genes in predicting thiazide-induced
hyperglycemia. Significant associations from KCNJ1, ADD1, and ACE remained
significant when adjusted for TCF7L2 rs7903146 genotype, suggesting that these
pharmacogenetic predictors are robust to adjustment for baseline genetic T2D risk.

99
In the present study, we observed a significant association between KCNJ1
variation and increased FG in blacks treated with short term HCTZ. We also observed
significant increases in serum potassium with a KCNJ1 SNP previously associated with
decreased glucose during HCTZ treatment. Our study also observed that KCNJ1
variation was associated with NOD in patients treated with long term HCTZ in all
race/ethnic groups. These associations remained significant in patients treated with
HCTZ for an extended duration and in patients taking higher daily doses of HCTZ. We
observed no associations achieving even nominal significance in non HCTZ-treated
patients, suggesting effects of KCNJ1 variation on dysglycemia are specific to HCTZ
treatment. KCNJ1 variation was associated with change in FG in PEAR and NOD in
INVEST, during both short and long term HCTZ treatment, and in most race/ethnic
groups studied, suggesting that variability in KCNJ1 affects HCTZ-induced dysglycemia.
Although KCNJ1 variation was associated with change in FG in PEAR and NOD
in INVEST, SNP associations with each endpoint differed between the two studies. In
addition, the ADD1 SNP rs4961 and ACE SNP rs4303, which were significantly
associated with change in FG in PEAR, were not associated with NOD in INVEST.
Disparate results in PEAR and INVEST suggest different pharmacogenetic markers for
FG in the short term versus NOD over the long term during HCTZ treatment. These
observations are consistent with literature from GWAS, which suggest that genetic
associations with T2D are distinct from genetic associations with FG.95,172
PEAR and INVEST also enrolled different study populations and used varied
durations of HCTZ treatment. These differences in study populations and study design
might have contributed to disparate genetic associations with the dysglycemia

100
phenotype of focus in each study. The majority of INVEST and PEAR patients were
treated with a 25 mg dose of HCTZ, suggesting that dose likely had a negligible effect
on differences in associations. The duration of HCTZ treatment was very different
between trials. Patients received HCTZ for an average 9.5 weeks in PEAR and 87.1
weeks in INVEST. The difference in HCTZ treatment duration may partly account for
conflicting results in PEAR and INVEST.
Disparate results in PEAR and INVEST might also be a reflection of racial/ethnic
diversity. Disparate associations between race/ethnic groups suggest differences in LD
and the need to identify functional variants in KCNJ1. Significantly associated variants
from KCNJ1 (rs17137967) and ACE (rs4303) in PEAR blacks were monomorphic in
non-blacks in PEAR, explaining the lack of association in non-blacks. The rs12795437
C allele, which increased NOD risk in INVEST whites and trended towards an increased
risk in Hispanics, was not associated with changes in FG in any PEAR race/ethnic
group. The lack of observation of an increased NOD risk with the rs12795437 C allele
in INVEST blacks is potentially explained by the limited sample size in this race/ethnic
group. Point estimates suggested an increased NOD risk in HCTZ treated patients with
the rs12795437 C allele in all INVEST race/ethnic groups.
The two KCNJ1 SNPs rs17137967 and rs12795437 were associated with different
glucose-related phenotypes within different race/ethnic groups in PEAR and INVEST.
The two SNPs rs17137967 and rs12795437 have been associated with mean 24-hour
systolic BP,173 hypertension,174 and rosiglitazone-induced edema,175 although they do
not necessarily represent the main findings of each paper. Although these associations
are only indirectly related to T2D and both KCNJ1 SNPs are intronic, the previous

101
association of both SNPs to phenotypes related to hypertension and electrolyte
homeostasis suggests a functional role for these SNPs and adds credence to our
pharmacogenetic findings.
This research adds to existing literature by attempting to replicate a previous
KCNJ1 SNP association and investigating the effect of additional KCNJ1 variation on
both FG changes and NOD. An analysis from the Genetic Epidemiology of Responses
to Antihypertensives (GERA) study observed decreased FG in rs59172778 (M338T) G
allele carriers (n=8, mean -4.6 mg/dL) and increased FG in A/A homozygotes (n=532,
mean 3.8 mg/dL) after four weeks of HCTZ treatment.114 Similar to PEAR, the GERA
study quantified changes in FG from baseline during over four weeks of HCTZ
monotherapy.117
In the present study, a significant association between the non-synonymous
KCNJ1 SNP rs59172778 was not observed for change in FG or NOD during HCTZ.
However, the rs59172778 G allele was associated with increased serum potassium
during HCTZ treatment in PEAR. This increase in serum potassium with the
rs59172778 G allele may be consistent with decreased FG association in GERA, since
potassium depletion during thiazide treatment has been implicated in hyperglycemia.76
However, the GERA study reported a lack of association between this SNP and change
in serum potassium.114 The rs59172778 SNP was predicted to be tolerated in silico, but
has a clear functional role being previously associated with Antenatal Bartter
Syndrome.176 Additional studies are necessary to refine the role of potassium depletion
and KCNJ1 variation in thiazide-induced dysglycemia.

102
The relationship between potassium and glucose is described in previous chapters
and decreased serum potassium has been implicated in thiazide-induced
dysglycemia.46 KCNJ1 encodes the renal outer medullary potassium channel (ROMK1,
Kir1.1) that is responsible for potassium excretion in exchange for sodium absorption
through the epithelial sodium channel (ENaC).161 This action occurs in the collecting
duct distal to the thiazide-sensitive sodium/chloride co-transporter, the direct target of
thiazide diuretics. SNPs may influence HCTZ’s effect on ROMK1 function, disrupting
potassium homeostasis and affecting glucose dependent insulin secretion from
pancreatic beta cells or glucose uptake into skeletal muscle.77,161 KCNJ1’s direct role in
potassium excretion and the previous association of a KCNJ1 SNP with thiazide-
induced dysglycemia make KCNJ1 a particularly compelling candidate gene for further
study of thiazide-induced dysglycemia pahrmacogenetics.
The present study observed a significant effect of the non-synonymous ADD1
SNPs rs4961 on FG in PEAR non-blacks, although no significant association was
observed in INVEST. The rs4961 association in PEAR is considered a
complementation of the previous rs4961 association with NOD, rather than a true
replication, since the association observed with the phenotype in the present study,
change in FG, was different from the NOD phenotype in the previous study.112 The
previous study implicating rs4961 in thiazide-induced dysglycemia was an observational
case control study from the Pharmaco-Morbidity Record Linkage System (PHARMO-
RLS) and observed a significant SNP*thiazide treatment interaction, with an increased
NOD risk in rs4961 T allele carriers who were thiazide treated (OR 1.88 [95%CI 1.36-
2.59]).112 This risk was increased in patients treated with higher daily doses of thiazides

103
(OR 2.36 [95%CI 1.64-3.39]). However, the GERA study did not observe a significant
association between rs4961 and increased FG during four weeks of HCTZ treatment.114
In addition, the GenHAT study observed no association of rs4961 in a repeated
measures, mixed models regression of FG levels during chlorthalidone treatment.113
Our results suggest that the ADD1 rs4961 T allele may predict increases in FG in
non-black patients but not in black patients. This contrasts with observations from
GenHAT and GERA, which investigated the effect of rs4961 and changes in FG during
thiazide treatment. This discrepancy may be due to the presence of large black
populations in both GERA and GenHAT. In addition, PHARMO-RLS, which observed
positive results, was conducted almost entirely in white individuals, consistent with our
significant findings in PEAR non-blacks. The effect of rs4961 may have been
confounded by black individuals, who tend to respond better to diuretic treatment
especially when it is added on to a beta blocker.177,178 Our results add to the present
body of evidence suggesting that rs4961 may be an important predictor of
hyperglycemia during thiazide administration in non-black individuals.
Adducin is a ubiquitously expressed, heterodimeric cytoskeleton protein that
promotes the binding of spectrin with actin and may be involved in such cell functions as
ion transport. The ADD1 variant rs4961 (Gly460Trp) has been associated with
hypertension164 and response to diuretic therapy.165 The potential physiologic role of
ADD1 in thiazide diuretic mechanism and the previous association of the ADD1 non-
synonymous SNP rs4961, a guanine to thymine non-synonymous SNP at nucleotide
614 in exon 10 of ADD1, with NOD during thiazide treatment make it a compelling
candidate gene for further study of thiazide-induced hyperglycemia.

104
For ACE, we observed a significant association between the non-synonymous
SNP rs4303 A allele and decreased FG which was consistent during both HCTZ
monotherapy and HCTZ add-on therapy. The rs4303 SNP was not associated with
NOD risk, further supporting that pharmacogenetic predictors of change in FG during
HCTZ are distinct from predictors of NOD risk during HCTZ therapy. Although
candidate SNPs within ACE have been tested in pharmacogenetic studies of thiazide-
induced dysglycemia,112-114 none of these studies include investigation of rs4303. This
SNP encodes an Alanine to Serine substitution at amino acid 261 and may inhibit
function or efficiency of ACE, leading to decreased sympathetic activation and
decreased FG levels.160 Considering the potential functional impact of this SNP on ACE
and the significant association in PEAR, further study of rs4303 and other ACE SNPs as
a predictor of thiazide-induced hyperglycemia is warranted.
Previous pharmacogenetic studies investigating ACE polymorphisms have
included the ACE I/D polymorphism or a tag SNP for this polymorphism. The GenHAT
study observed no effect of ACE I/D on FG during chlorthalidone treatment. The
PHARMO-RLS study observed an increased NOD risk in thiazide treated patients with
the rs4341 C allele (OR 2.25 [95%CI 1.53-3.29]), which the authors attributed to the
effect of the I/D polymorphism which they report to be in complete LD with rs4341.112
The functional SNP in this association remains unclear as rs4341 is itself a missense
SNP and the authors’ cited reference reported only limited LD (D’=0.91, r2 not reported)
between rs4341 and the ACE I/D polymorphism.179 The HumanCVD BeadChip does
not include rs4341, but includes the rs4343 SNP known to tag the ACE I/D
polymorphism.171 Our results suggest that the ACE I/D polymorphism does not

105
influence thiazide-induced hyperglycemia, observing no significant associations in either
PEAR or INVEST.
AGTR1 is been implicated in thiazide-induced hyperglycemia through its central
role in the RAS and the decreased incidence of NOD observed with administration of
ARBs.47,160 The GenHAT and GERA studies found no association of the AGTR1
rs5186 SNP (+A1166C) with FG changes during thiazide diuretic treatment.113,114 The
PHARMO-RLS study observed a decreased NOD risk in the rs5186 CC genotype group
who were treated with thiazide diuretics.112 We observed no association between
rs5186 or any other AGTR1 SNP and change in FG or NOD risk during HCTZ
treatment. Our results agree with several previous studies,113,114 suggesting that
AGTR1 polymorphisms do not influence FG levels during thiazide treatment.
Our study has several limitations worthy of mention. We recognize the potential
for false positive results in our analyses and our observations need to be independently
replicated. We attempted to reduce false positives by using an FDR correction for all p
values acquired in SNP analyses within each candidate gene and within each
race/ethnic group. We also sought to minimize false positive results by monitoring MAF
and confirming consistency of results in different treatment arms. Furthermore, our
candidate genes were all previously associated with glucose-related phenotypes and all
significantly associated SNPs had either putative functional consequences or published
associations with disease, lending credence to our results.
Another limitation is that important pharmacogenetic risk factors in candidate
genes may not have been identified due to low MAF or low r2 with genetic variation
genotyped on the HumanCVD BeadChip. This is particularly true in INVEST blacks, for

106
which we had the most limited power to detect pharmacogenetic associations. We
cannot conclude a lack of important pharmacogenetic predictor SNPs in these
candidate genes in any race/ethnic group, particularly in INVEST blacks. However, the
tag SNPs included on our array were designed for black and white populations and
likely provided good coverage of candidate genes in each race/ethnic group.
Furthermore, all candidate genes, except for KCNJ1, were priority one genes and
genetic variability was well covered on the HumanCVD BeadChip.
In addition, our analyses adjusting for TCF7L2 rs7903146 genotype must be
interpreted with caution, as rs7903146 was not observed to be associated with NOD in
any race/ethnic group in INVEST, and was only associated with change in FG in PEAR
blacks. Finally, change in FG in PEAR and NOD in INVEST may be confounded by the
use of other antihypertensive agents that affect FG levels, including atenolol and
trandolapril treatment, ongoing environmental factors, or potassium supplementation.
We attempted to reduce confounding in PEAR by controlling for metabolically important
variables, drug arm, HCTZ dose and duration, as well as potassium supplementation.
We also controlled for metabolically important variables, treatment strategy, HCTZ
treatment duration, atenolol or trandolapril treatment and treatment duration, and
potassium supplementation in INVEST.
Summary and Significance
In summary, our results add to available evidence suggesting that genetic
variation in the candidate genes KCNJ1, ADD1, and ACE influences effects of HCTZ on
glucose homeostasis. In addition, we complimented a previous association of rs4961
with NOD through observations in the present study in PEAR non-blacks. Our results
suggest that pharmacogenetic associations with change in FG during short term HCTZ

107
treatment are distinct from pharmacogenetic associations with NOD after long term
HCTZ treatment. Our observation of different SNP effects between race/ethnic groups
suggests differences in LD and highlights the need to identify functional SNPs.
Functional studies and replication of these associations are needed to better define the
potential role of KCNJ1, ADD1, and ACE SNPs in predicting AMEs of HCTZ.
Significant associations from KCNJ1, ADD1, and ACE remained significant when
adjusted for TCF7L2 rs7903146 genotype, suggesting that these pharmacogenetic
predictors are robust to adjustment for baseline genetic T2D risk. Whether these
findings are specific to HCTZ or can be generalized to all thiazide diuretics is also
unclear, but KCNJ1, ADD1, and ACE remain compelling candidate genes for further
study of pharmacogenetics of thiazide-induced dysglycemia.

108
Table 3-1. Summary of candidate genes investigated as pharmacogenetic predictors Candidate Gene
Protein Product Priority* SNPs† Candidate SNP(s)
Evidence for candidate SNP association with thiazide-induced dysglycemia
ACE Angiotensin I 1 n=54 rs4341‡ Associated with NOD during thiazide treatment112 converting enzyme rs4343‡ Not associated with ∆FG during thiazide treatment113
ADD1 Alpha adducin-1 1 n=32 rs4961 Associated with NOD during thiazide treatment;112 not
associated with ∆FG during thiazide treatment113,114 AGTR1 Angiotensin II type 1
receptor 1 n=90 rs5186 Associated with NOD during thiazide treatment;112 not
associated with ∆FG during thiazide treatment113,114 KCNJ1 Potassium inwardly
rectifying channel 2 n=25 rs59172778 Associated with ∆FG during thiazide treatment114
SNP indicates single nucleotide polymorphism; ∆FG, change in fasting glucose; NOD, new onset diabetes; *Priority of candidate genes on the HumanCVD BeadChip: Priority 1 selected for minor allele frequency >0.01 and r2>0.5; Priority 2 selected for minor allele frequency >0.05 and r2>0.5 † Number of SNPs investigated in the present study using HumanCVD BeadChip and Taqman ‡Tag SNPs for the ACE insertion/deletion polymorphism

109
Table 3-2. Baseline characteristics of PEAR patients by randomized treatment arm Characteristic* HCTZ (n=382) Atenolol (n=386)
Age (years) 49 (9) 49 (9) Female, n (%) 188 (49) 217 (56) BMI (kg/m2) 31 (5) 31 (6) Waist circumference (cm) 98 (13) 98 (13)
Race/ethnicity, n (%) Black 147 (38) 146 (38) White 219 (57) 221 (57)
Asian 3 (1) 5 (1) Other/multiracial 13 (3) 14 (4)
Race/ethnicity for analysis†, n (%)
Black 152 (40) 152 (39) Non-black 230 (60) 234 (61)
Current smoker 61 (16) 50 (13) Home blood pressure‡ (mmHg) Systolic 147 (11) 145 (10) Diastolic 94 (6) 93 (6)
Fasting glucose (mg/dL), median (IQR)
91 (85-98) 89 (84-96)
Serum potassium (mEq/L), median (IQR)
4.2 (4.0-4.5) 4.2 (4.0-4.5)
Urine potassium (mEq/L), median (IQR)
53.8 (31.4-73.7) 55.0 (34.3-83.7)
Plasma insulin (μU/mL), median (IQR)
7.2 (4.7-10.9) 6.8 (4.5-11.0
Serum Creatinine (mg/dL) 0.87 (0.2) 0.87 (0.2)
Triglycerides (mg/dL) 132 (106) 139 (100) HDL (mg/dL) 48 (14) 47 (14) Uric Acid (mg/dL) 5.72 (1.5) 5.76 (1.3)
HCTZ indicates hydrochlorothiazide; BMI, body mass index; HDL, high density lipoprotein; IQR, interquartile range; mg/dL, milligrams per deciliter; mEq/L, milliequivalents per liter. *Values are mean ± standard deviation unless otherwise noted. †Race/ethnicity based on principal components analysis. ‡Average of home blood pressure values.

110
Table 3-3. Association of linear regression model covariates from primary analysis with change in fasting glucose in PEAR
Covariate Parameter Estimate* (standard error)
p value*
Baseline fasting glucose (mg/dL) -0.39 (0.04) <0.0001
Age (years) 0.09 (0.05) 0.09
Gender (male) -0.28 (0.93) 0.76
Waist circumference (cm) 0.18 (0.03) <0.0001
Potassium supplementation 0.37 (1.48) 0.80
Randomized drug arm (HCTZ) -0.44 (1.01) 0.67
Systolic blood pressure (mmHg)† 0.03 (0.05) 0.62
Diastolic blood pressure (mmHg)† -0.06 (0.09) 0.52
Time of HCTZ treatment (days) -0.07 (0.03) 0.05
Race/ethnicity (Black) -0.62 (5.97) 0.92
Principal component 1 26.73 (80.37) 0.74
Principal component 2 3.02 (11.98) 0.80
Principal component 3 -7.74 (13.00) 0.55
HCTZ indicates hydrochlorothiazide; mg/dL, milligrams per deciliter. *Generated using linear regression of change in fasting glucose for all PEAR patients. †Represents average of home blood pressure values.

111
Table 3-4. Characteristics of new onset diabetes cases and controls at baseline and during INVEST
Characteristic* NOD Cases (n=446)
Controls (n=1,025)
p value†
Baseline Age 65 (10) 65 (9) 0.73
Female, n (%) 250 (56) 573 (56) 0.96
BMI (kg/m2) 31 (6) 29 (5) <0.0001
Race/ethnicity, n (%) 0.66
White 176 (40) 409 (40)
Black 51 (11) 121 (12)
Hispanic 217 (49) 492 (48)
Blood pressure (mm Hg)
Systolic 149 (19) 148 (18) 0.26
Diastolic 87 (10) 86 (10) 0.04
Verapamil SR strategy, n (%) 208 (47) 519 (51) 0.16
Hypercholesterolemia, n (%)‡ 242 (54) 548 (54) 0.78
History of LVH, n (%) 77 (17) 128 (13) 0.02
History of prior MI, n (%) 99 (22) 194 (19) 0.15
History of smoking, n (%) 184 (41) 405 (40) 0.53 During INVEST
Blood pressure (mm Hg)**
Systolic 135 (11) 134 (11) 0.07
Diastolic 79 (6) 79 (6) 0.49
HCTZ treatment, n (%) 328 (74) 640 (62) <0.0001
HCTZ (≥ 6 months), n (%) 320 (72) 627 (61) <0.0001
HCTZ dose (mg) 28 (12) 26 (12) 0.17
Atenolol treatment, n (%) 229 (51) 479 (47) 0.10
Atenolol dose (mg) 72 (32) 67 (31) 0.02
Trandolapril treatment, n (%) 267 (60) 664 (65) 0.07
Trandolapril dose (mg) 3.3 (2.6) 3.4 (2.6) 0.49
Verapamil SR treatment, n (%) 208 (47) 519 (51) 0.16
Verapamil SR dose (mg) 234 (75) 238 (75) 0.71
Potassium supplementation, n (%) 75 (17) 100 (10) 0.0001
BMI indicates body mass index; HCTZ, hydrochlorothiazide; INVEST, INternational VErapamil SR and Trandolapril Study; LVH, left ventricular hypertrophy; MI, myocardial infarction; NOD, new onset diabetes; SR, sustained release. *Values are mean ± standard deviation unless otherwise noted. †P values represent t-tests and chi square tests where appropriate. ‡History of or currently taking lipid-lowering medications. **Average of clinic blood pressure measurements during study.

112
Table 3-5. Association of logistic regression model covariates and new onset diabetes in INVEST
Characteristic Odds ratio (95% Confidence Interval)
p value
Baseline
Age (per 5 years) 0.99 (0.92-1.08) 0.88
Gender (female) 1.02 (0.75-1.40) 0.88
BMI (per 5 kg/m2) 1.24 (1.09-1.42) 0.002
Hypercholesterolemia* 1.06 (0.78-1.42) 0.72
History of smoking 1.17 (0.86-1.61) 0.32
History of LVH 1.58 (1.06-2.35) 0.02
Principal component 1 172.85 (0.14->999.99) 0.16
Principal component 2 0.09 (<0.001-456.31) 0.28
Principal component 3 <0.001 (<0.001-844.87) 0.22
During INVEST
Systolic blood pressure (mmHg)† 1.06 (0.99-1.13) 0.10
HCTZ treatment duration (per 6 months) 1.13 (1.07-2.35) <0.0001
Atenolol treatment 0.63 (0.26-1.53) 0.31
Atenolol treatment duration (per 6 months) 1.04 (0.90-1.21) 0.57
Trandolapril treatment 0.68 (0.53-0.88) <0.0001
Trandolapril treatment duration (per 6 months) 0.53 (0.47-0.59) <0.0001
Potassium supplementation 2.19 (1.39-3.43) 0.0007
INVEST indicates INternational VErapamil SR and Trandolapril Study; BMI, body mass index; kg/m2, kilograms per meter squared; LVH, left ventricular hypertrophy; MI, myocardial infarction; mmHg, millimeters of mercury. *History of or currently taking lipid-lowering medications. †Average of clinic blood pressure measurements during study.
113
Table 3-6. Significant associations for candidate gene tag SNPs on change in fasting glucose in PEAR correction* SNP
Race/ethnic group
Allele (frequency)
Beta (SE) HCTZ monotherapy
p value† Beta (SE) HCTZ add-on
p value† Beta (SE) combined
p value†
KCNJ1 rs17137967 Blacks T (0.05) 7.06 (3.49) 0.04 10.97 (3.49) 0.002 8.47 (2.45) 0.0008
§
Non-blacks T (0.00) - - - - - -
ADD1
rs4961‡ Blacks A (0.06) -1.17 (2.66) 0.59 2.32 (4.62) 0.57 -0.05 (2.32) 0.90
Non-blacks A (0.21) 2.24 (1.28) 0.06 1.74 (1.06) 0.13 1.99 (0.81) 0.02††
ACE rs4303 Blacks A (0.10) -2.40 (2.62) 0.18 -7.70 (3.03) 0.02 -6.39 (1.92) 0.0007
§
Non-blacks A (0.00) - - - - - -
SNP indicates single nucleotide polymorphism; HCTZ, hydrochlorothiazide; SE, standard error. *All parameter estimates (betas) and p values represent change in FG per copy of allele adjusted prespecified covariates. †p values determined using change in log(FG) in linear regressions ‡Previously associated with change in fasting glucose during thiazide treatment §p value significant after FDR correction for all SNP associations within race/ethnic group ††p value significant at alpha=0.05 representing complementation of previous association

114
Table 3-7. Odds ratios for KCNJ1 SNPs and haplotypes for new onset diabetes during HCTZ treatment by race/ethnicity in INVEST*
SNP or Haplotype
Allele(s) (frequency)
OR (95%CI) HCTZ treated
OR (95%CI) HCTZ treated (≥25 mg/day)
OR (95%CI) HCTZ treated (≥6 months)
OR (95%CI) Not HCTZ treated
Interaction p value†
Whites rs12795437 C
(0.07) 2.36 (1.28-4.37)
p=0.006†† 2.43 (1.11-5.34)
p = 0.03 2.41 (1.30-4.47)
p = 0.005†† 0.40 (0.13-1.27)
p = 0.12 p = 0.002††
rs11600347 A (0.07)
2.29 (1.24-4.21) p = 0.008††
2.31 (1.06-5.02) p = 0.03
2.33 (1.26-4.30) p = 0.007††
0.54 (0.19-1.50) p = 0.23
p = 0.003††
HapW1‡
GCA (0.08)
2.35 (1.27-4.34) p = 0.006††
3.09 (1.49-6.41) p = 0.002††
2.39 (1.29-4.44) p=0.006††
0.42 (0.13-1.32) p = 0.14
p = 0.002††
Hispanics
rs658903 A (0.12)
0.38 (0.21-0.69) p = 0.002††
0.31 (0.15-0.62) p = 0.0009††
0.41 (0.22-0.74) p = 0.003††
1.17 (0.55-2.50) p = 0.69
p = 0.03
HapH1§ CATCT (0.09)
2.14 (1.31-3.53) p = 0.003††
2.06 (1.23-3.45) p = 0.006††
2.06 (1.24-3.41) p = 0.005††
0.86 (0.35-2.11) p = 0.74
p = 0.07
HapH2§
TGAGC (0.10)
0.43 (0.24-0.79) p = 0.007††
0.39 (0.20–0.76) p = 0.005††
0.48 (0.26-0.86) p = 0.01
0.94 (0.42-2.10) p = 0.69
p = 0.18
Blacks rs675388 T
(0.18) 3.13 (1.45-6.75)
p = 0.004†† 4.16 (1.72-10.03)
p = 0.002†† 3.06 (1.42-6.60)
p = 0.004†† NE
p = 0.63 p = 0.06
HapB1**
GG (0.70)
0.28 (0.12-0.66) p = 0.003††
0.25 (0.11-0.60) p = 0.002††
0.29 (0.13-0.67) p = 0.004††
NE p = 0.73
p = 0.10
95%CI indicates 95% confidence interval; HCTZ, hydrochlorothiazide; NE, odds ratio not estimable due to sample size; OR, odds ratio; SNP, single nucleotide polymorphism. *All point estimates and p values represent increased risk of NOD per copy of allele and are adjusted for age, gender, body mass index, average on treatment systolic blood pressure, history of smoking and hypercholesterolemia, principal components one, two, and three, and treatment with trandolapril, atenolol, or potassium supplementation. †Interaction p values for allele*HCTZ treatment. ‡Haplotype HapW1 for INVEST whites inferred from SNPs rs2238009, rs12795437, and rs11600347. §Haplotypes HapH1 and HapH2 inferred from SNPs rs675388, rs1148058, rs658903, rs12795437, and rs3016774. **Haplotypes inferred from SNPs rs675388 and rs1148059. ††p value significant after FDR correction for all SNP and haplotype associations within race/ethnic group
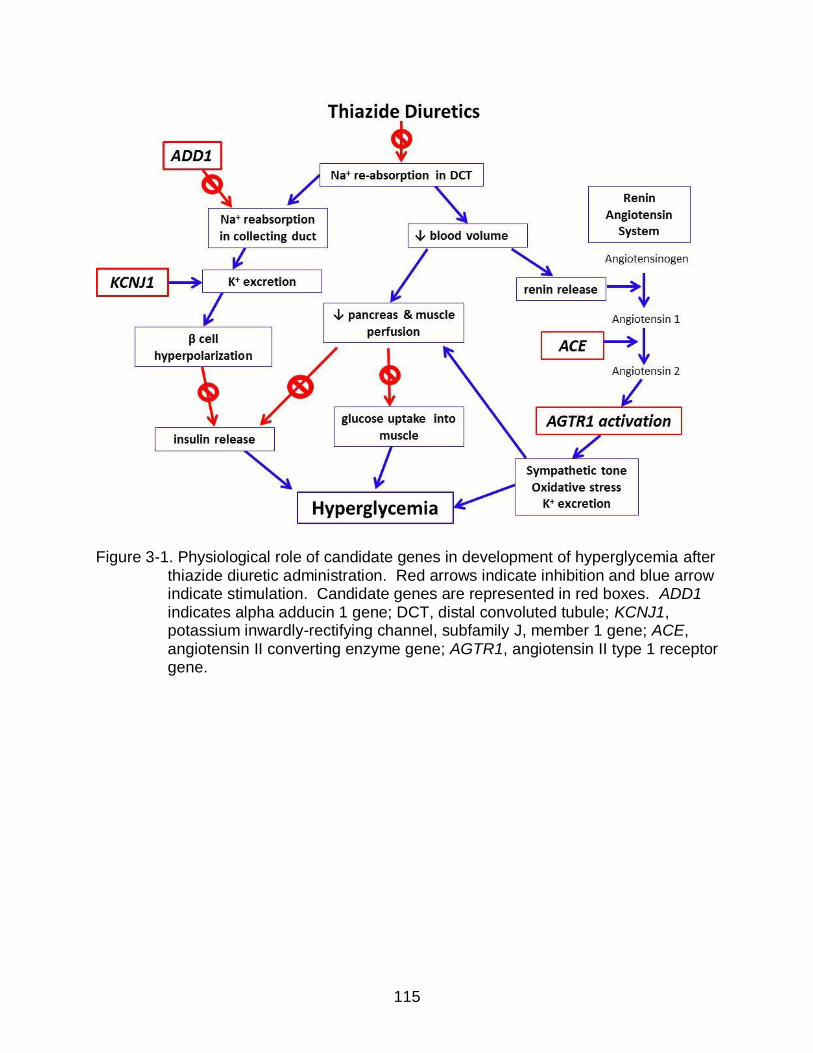
115
Figure 3-1. Physiological role of candidate genes in development of hyperglycemia after thiazide diuretic administration. Red arrows indicate inhibition and blue arrow indicate stimulation. Candidate genes are represented in red boxes. ADD1 indicates alpha adducin 1 gene; DCT, distal convoluted tubule; KCNJ1, potassium inwardly-rectifying channel, subfamily J, member 1 gene; ACE, angiotensin II converting enzyme gene; AGTR1, angiotensin II type 1 receptor gene.

116
Figure 3-2. Assessment of fasting glucose in the PEAR study design. ∆FG1 indicates
change in fasting glucose during HCTZ monotherapy; ∆FG2, change in fasting glucose during HCTZ add-on therapy to atenolol; FG, fasting glucose; HCTZ, hydrochlorothiazide

117
Figure 3-3. Change in fasting glucose during hydrochlorothiazide treatment by KCNJ1
SNP rs17137967 genotype in black PEAR patients. Bars represent medians and ptrend indicates p value for change in log(fasting glucose) during hydrochlorothiazide using an allelic trend test adjusted for log(fasting glucose) at start of hydrochlorothiazide, age, gender, waist circumference, potassium supplementation, drug arm, average home systolic and diastolic blood pressure, duration of HCTZ treatment, and principal components one, two, and three. PFDR indicates ptrend FDR-corrected for all SNPs in PEAR blacks. HCTZ indicates hydrochlorothiazide; mg/dL, milligrams per deciliter; SE, standard error.

118
Figure 3-4. Odds ratios per copy of allele and 95% confidence intervals for KCNJ1 SNPs nominally associated (p<0.05) with new onset diabetes during hydrochlorothiazide treatment in INVEST patients by race/ethnicity. All odds ratios are adjusted for age, gender, body mass index, average on treatment systolic blood pressure, hypercholesterolemia, history of smoking, potassium supplementation, principal components one, two, and three, and trandolapril or atenolol treatment. NOD indicates new onset diabetes; SNP, single nucleotide polymorphism.
119
CHAPTER 4 LONG TERM ANTIHYPERTENSIVE EXPOSURE AND ADVERSE METABOLIC
EFFECTS: PEAR FOLLOW-UP STUDY
Introduction
T2D is a major cause of mortality and morbidity and the IDF predicts that 552
million individuals worldwide will have T2D by the year 2030.10 Furthermore, a patient
with both T2D and hypertension is at a two to three fold risk of an adverse CV outcome
compared to a patient with hypertension alone.1,61 Hypertension is also positively
associated with hyperlipidemia180,181 and increases in serum cholesterol increases a
hypertensive patient’s risk of CV disease.182-184 Hypertension, dyslipidemia, and IFG
are components of the metabolic syndrome, which is estimated to affect 34% of US
adults ≥ 20 years of age.1 The presence of metabolic syndrome further increases risk
for CV disease compared to patients without metabolic syndrome.185
BP control is an important means of CV risk reduction.2 Strong evidence from
randomized clinical trials, as summarized in meta-analyses and literature reviews,
shows that thiazide diuretics contribute to hyperglycemia and
hypertriglyceridemia.47,53,186 In addition, thiazide diuretics have been associated with
increases in serum uric acid, which has been associated with T2D,74 the metabolic
syndrome,187 and CV risk.72,73,188,189 Since thiazide diuretics contribute to
hyperglycemia, hypertriglyceridemia, and hyperuricemia, their benefit in a hypertensive
patient, including CV risk reduction, could be offset by AMEs.
The long term effects of thiazide diuretics on measures of glucose and lipid
metabolism are well studied, but randomized BP reduction trials consider thiazide-
induced AMEs only as a secondary outcome or in secondary analyses.51,53,190 Clinical
trials investigating thiazide diuretics for BP reduction typically do not monitor FG or

120
cholesterol or only monitor FG and cholesterol biannually or annually, which may be
adequate for clinical monitoring but not for characterization of the short term AMEs of
thiazides. Existing studies have investigated short term effects over a matter of weeks,
but their study durations are not sufficient to describe AMEs during long term thiazide
treatment.114,118
Characterization of AMEs in the short term (after 1-2 months) might be useful in
predicting AMEs during long term (greater than six months) thiazide treatment. Only
limited data are available comparing short and long term AMEs specifically for thiazide
diuretic therapy in the same patient population190 and one such study utilized HCTZ
doses up to 200mg, which are no longer clinically appropriate.116 Comparison of AMEs
during short and long term thiazide therapy could also clarify whether duration of
thiazide treatment is a risk factor for AMEs. In addition, data are lacking for examination
of the effect of concomitant pharmacotherapy on AMEs during long term thiazide
administration in an observational setting.
The dysglycemic effects of thiazide diuretics are typically evaluated using FG
and/or T2D diagnosis. However, CV risk may not begin when a patient becomes
diabetic. IFG may carry an adverse prognostic impact191,192 and several studies have
shown that IGT is a better predictor of CV disease193 and mortality125 than FG. EGI has
also been observed to be a better T2D predictor than IFG and IGT194,195 and HbA1c has
been observed to better predict CV risk than FG.127 In addition, HOMA is a convenient,
noninvasive indicator of insulin sensitivity that correlates well with insulin sensitivity
determined by the hyperinsulinemic euglycemic clamp, the gold standard for in vivo
studies of insulin sensitivity.129,130 Despite the potential predictive power for T2D and

121
CV risk with IFG, IGT, EGI, HOMA, and HbA1c, analyses of AMEs in BP reduction trials
focus on T2D status determined by FG ≥126 mg/dL.
In addition, the diagnosis of impaired glucose metabolism or pre-diabetes is often
difficult. FG may not be a very sensitive measure for metabolic abnormality since
values often appear normal in patients with IGT.119 In individuals with IGT,
hyperglycemia may only manifest when the individual is challenged by an OGTT.128
The OGTT has not been adopted in clinical practice and many randomized controlled
trials because of increased cost, time, and inconvenience of the procedure. However,
utilization of OGTT may be clinically valuable in patients who are suspected to have
metabolic abnormalities, especially considering the utility of the OGTT for CV risk
prediction.196 In contrast, HbA1c has several advantages over FG and has been
recommended by the ADA as a criterion for the diagnosis of T2D.119 Despite clinical
advantages of HbA1c and the OGTT in diagnosing metabolic abnormalities and
predicting CV risk, the effects of thiazide diuretics on HbA1c and OGTT values are not
well studied.
We designed the PEAR Follow-Up Study enrolling previous PEAR and PEAR-2
participants who completed either study over six months ago and were continuously
treated with a thiazide diuretic during follow-up. The PEAR Follow-Up Study was
designed to determine the effect of duration of thiazide treatment and concomitant
antihypertensive pharmacotherapy on AMEs during long term thiazide administration in
an observational setting. We were also able to test association of AMEs during short
term versus long term thiazide treatment. The PEAR Follow-Up Study also gathered
detailed glycemic characteristics of patients after long term thiazide treatment, allowing

122
a comparison of glycemic characteristics obtained in the fasting state and those
obtained after OGTT. In addition, we tested the correlation of change in FG and change
in serum potassium during long term thiazide treatment.
Methods
PEAR and PEAR-2 Study Designs and Populations
Details of the PEAR study, which investigated genetic influences of HCTZ,
atenolol, and their combination on BP and AMEs are previously published and have
been described in detail in Chapter 3.117 Briefly, participants age 17 through 65 years
were are randomized to either atenolol or HCTZ, with one dose titration step, followed
by assessment of response to therapy after approximately nine weeks on the target
dose. The second agent was then added followed by similar dose titration and
response assessment procedures for a total study duration of approximately 18 weeks.
Biological samples were collected in the fasting state at baseline, at a response
assessment after monotherapy, and at a response assessment after combination
therapy. The PEAR study design allowed evaluation of change in FG, triglycerides, uric
acid, insulin, and HOMA during nine weeks of initial HCTZ administration. Changes in
FG and other lab measures after nine weeks of HCTZ treatment were determined
during PEAR following both HCTZ monotherapy and HCTZ add-on therapy. Change in
FG during HCTZ monotherapy was defined as the difference in FG from the baseline
visit, prior to the start of HCTZ monotherapy, to the end of HCTZ monotherapy. Change
in FG during HCTZ add-on therapy was defined as the difference in FG from the start of
HCTZ to the end of the trial.
PEAR-2 similarly investigated genetic influences on BP and AMEs after
administration of the thiazide-like diuretic chlorthalidone and the beta blocker
123
metoprolol. PEAR-2 included no randomization and all participants underwent a 3-4
week washout of antihypertensive medication. Patients were then given metoprolol 50
mg immediate release (IR) twice daily for two weeks, with dose titration to metoprolol IR
100 mg twice daily (if BP was greater than 120/70) for at least six weeks. Participants
then underwent a 3-4 week washout period, followed by chlorthalidone 15 mg once
daily monotherapy for two weeks with similar dose titration to chlorthalidone 25 mg once
daily for at least six weeks. Inclusion and exclusion criteria were similar to PEAR. The
PEAR-2 study design allowed evaluation of change in FG, triglycerides, uric acid,
insulin, and HOMA during approximately eight weeks of chlorthalidone administration.
Change in FG and other lab measures after approximately eight weeks of chlorthalidone
was defined as the difference in FG from the baseline visit, at start of chlorthalidone
monotherapy, to the end of the trial. Neither PEAR nor PEAR-2 incorporated an OGTT
or HbA1c, so these data were not available for any PEAR Follow-Up Study participants
from their original PEAR or PEAR-2 study period.
PEAR Follow-Up Study Design and Population
The PEAR Follow-Up Study is an observational, non-randomized, open label,
follow-up study of the PEAR and PEAR-2 trials. Previous PEAR and PEAR-2
participants were contacted for willingness to participate in the PEAR Follow-Up Study if
they agreed to be contacted for future research studies in the original PEAR or PEAR-2
informed consents or during subsequent correspondence regarding future research
studies. Patients were eligible for PEAR Follow-Up Study participation if they 1)
previously participated in PEAR or PEAR-2 during which HCTZ or chlorthalidone
response data was collected, 2) participated in their final PEAR or PEAR-2 study visit at
least six months prior to the follow-up study visit, and 3) were treated with a thiazide or

124
thiazide-like diuretic continuously during the follow-up period. Figure 4-1 displays the
progression of previous PEAR and PEAR-2 subjects to PEAR Follow-Up Study
enrollment. Participants were eligible if they were between 17 and 75 years of age and
pregnancy was an exclusion. All study interventions were approved by the UF IRB and
all participants provided written informed consent for study procedures. The PEAR
Follow-Up Study is registered on clinicaltrials.gov (NCT01409434).
The PEAR Follow-Up Study consisted of a single study visit, for which participants
were asked to be in the fasting state, not having consumed food or beverages other
than water within eight hours prior to the visit. The study visit included collection of a
medical history and detailed medication history, designed to assess the dose and
duration of therapy of thiazide diuretics and other antihypertensive medications that
might alter metabolic status. The interview also included an adherence assessment for
antihypertensive treatment. Data were collected for other medications that alter
metabolic status, including statins or other lipid-lowering agents, alpha adrenergic
agonists, tricyclic antidepressants, corticosteroids, anti-diabetic and glucose-lowering
medications, birth control, and potassium supplementation. A social history including
weekly alcohol consumption and cigarette smoking status was obtained.
Anthropomorphic measurements acquired during the visit included height, weight,
and waist and hip circumference. Three BP measurements were acquired using an
automated sphygmomanometer and averaged for follow-up SBP and DBP values. A
baseline blood draw was obtained to acquire whole blood FG, plasma insulin, HbA1c, a
lipid panel, uric acid, and serum potassium. Each participant then drank a 75 gram
glucose solution (Azer Scientific, Morgantown, PA) and whole blood glucose

125
measurements were acquired at one hour and two hour time points after ingestion of
the solution. PEAR Follow-Up Study visits were performed at the UF general clinical
research center (GCRC) or UF Department of Community Health and Family Medicine
Clinics. Whole blood glucose measurements were analyzed using an YSI 2300 STAT
Plus (YSI, Yellow Springs, OH).
Statistical Analysis
Patient characteristics at baseline, defined as start of thiazide treatment, and at
the follow-up visit were compared using McNemar’s tests and paired t-tests as
appropriate. Whole blood glucose measurements from the PEAR Follow-Up Study
were converted to plasma adjusted glucose measurements using multiplication by a
factor of 1.11,119 for comparison to fasting plasma glucose measurements acquired
during PEAR and PEAR-2. Long term change in FG was defined as difference between
FG at start of thiazide treatment (during PEAR or PEAR-2) and FG at the follow-up visit.
Linear regression was used to determine variables associated with change in FG,
triglycerides, uric acid, insulin, and HOMA during long term thiazide treatment in
univariate analyses.
Laboratory measures included in univariate models for each phenotype were
baseline and short term changes in FG, LDL, HDL, and total cholesterol, triglycerides,
HOMA, plasma insulin, serum uric acid, and serum potassium. Independent variables
for univariate regressions also included BMI, age, gender, race, baseline systolic and
diastolic BP, heart rate, smoking status at follow-up, alcohol consumption at follow-up,
waist circumference, abdominal obesity (defined as waist circumference ≥35 inches for
females or ≥40 inches for males), previous CV disease, family history of T2D (in a first
degree relative), treatment with beta blockers, ACEIs, ARBs, statins, other lipid-lowering

126
agents, alpha adrenergic agonists, selective serotonin reuptake inhibitors (SSRIs),
tricyclic antidepressants (TCAs), corticosteroids, anti-diabetic medications, birth control,
and potassium supplementation, and duration of thiazide diuretic therapy. Variables
associated with each phenotype in univariate analyses were utilized in stepwise
regressions if p≤0.20. In stepwise regressions, variables entered the model at p=0.20
and were retained in the model at p≤0.05. Patients treated with anti-diabetic medication
were excluded from analyses in order to eliminate confounding of anti-diabetic
treatment and T2D on AME phenotypes.
Similar stepwise linear regressions were used to test association of independent
variables with HbA1c, one and two hour OGTT glucose, and OGTT area under the
curve (AUC) at follow-up. Similar stepwise logistic regressions following univariate
regressions were used to model dichotomous variables at follow-up, including IFG, IGT,
EGI, and T2D. Spearman’s rho partial correlations were used to test correlation of long
term change in FG versus duration of thiazide treatment, adjusted for baseline FG.
Spearman partial correlations were also used to determine correlation of short term
versus long term change in FG, adjusted for baseline FG, and to determine long term
change in FG versus long term change in serum potassium, adjusted for baseline FG,
serum potassium, and potassium supplementation. All statistical analyses were
performed using SAS software (SAS, Cary, NC) and all data was collected and stored
using REDCap software.197
Results
PEAR Follow-Up Study Population Characteristics at Baseline versus Follow-Up
A total of 44 patients participated in PEAR Follow-Up Study interventions, four of
which were excluded from analysis due to treatment with anti-diabetic medication.

127
(Figure 4-1) A total of 40 participants were included in analysis, including 29 patients
(73%) who participated in PEAR and 11 patients (27%) who participated in PEAR-2.
(Table 4-1) For those that previously participated in PEAR, 16 (55%) were originally
randomized to the atenolol strategy and 13 (45%) were randomized to the HCTZ
strategy. The PEAR Follow-Up Study population, who were an average 51 years of age
at follow-up, included 24 (60%) females and 29 (73%) non-black individuals.
Compared to baseline values, participants at follow-up had increased age
(p<0.0001), waist circumference (p=0.002), HDL cholesterol (p<0.0001), uric acid
(p<0.0001), consumed more alcoholic beverages per week in participants who
consumed alcoholic beverages (p=0.04), and had a greater percentage of patients with
abdominal obesity (p=0.03). (Table 4-1) At follow-up, patients had decreased systolic
BP (p=0.003), diastolic BP (p=0.02), and serum potassium (p=0.003). Non-significant
increases were observed in FG (p=0.16) and triglycerides (p=0.59) compared with
baseline.
Characteristics of PEAR Follow-Up Study Population at Follow-Up
The mean duration of follow-up was 29 (SD 19) months, ranging from 8 to 72
months of thiazide diuretic treatment, which included thiazide treatment during PEAR or
PEAR-2 in addition to the follow-up period. (Table 4-2) All patients were treated with a
thiazide or thiazide-like diuretic, with ten participants (25%) treated with chlorthalidone
and 30 (75%) treated with HCTZ during the observational follow-up period. The median
dose of both HCTZ and chlorthalidone was 25 mg. Ten participants (25%) were taking
thiazide monotherapy with either HCTZ or chlorthalidone, 12 (30%) were also taking a
beta blocker, 13 (33%) were also taking an ACEI, and 5 (13%) were also taking a beta
blocker and an ACEI. Two participants (5%) were taking a CCB at follow-up.

128
With regard to other pharmacotherapy, 5 participants (13%) were treated with
potassium supplementation during follow-up. (Table 4-2) Nine participants (25%) were
taking a statin and one participant was treated with a fibrate. Three participants (8%)
were taking an SSRI, two (5%) were taking a TCA, and one (3%) was taking long term
corticosteroid treatment. Following OGTT, the mean one hour plasma adjusted glucose
was 157 (SD 47) mg/dL and the mean two hour plasma adjusted glucose was 132 (SD
51) mg/dL. (Table 4-2) Sixteen participants (40%) had IGT and 18 participants had EGI
(40%). Mean HbA1c was 5.68 (SD 0.44) % in PEAR Follow-Up Study participants.
Change in FG during Short Term versus Long Term Thiazide Treatment
Mean FG increased from 91 (SD 12) mg/dL to 97 (SD 16) mg/dL during short term
thiazide treatment in PEAR and PEAR-2, constituting a significant 6.5 (SD 13.0) mg/dL
FG increase (p=0.005). PEAR Follow-Up Study participants had a mean 91 [SD 12]
mg/dL at baseline and 94 [SD 13] mg/dL at follow-up, representing a non-significant
increase in FG (3.6 [SD 15.3] mg/dL, p=0.16) during long term thiazide treatment on
average. No significant correlation was observed between short term change in FG
and long term change in FG (r=0.16, p=0.38). (Figure 4-2)
When PEAR Follow-Up Study participants were divided according to
antihypertensive drug treatment status, a significant 8.8 (SD (14.8) mg/dL increase in
FG was observed during follow-up in beta blocker treated patients (p=0.02). The long
term change in FG in beta blocker treated participants was also significantly different
from the change in FG in participants not treated with a beta blocker (p=0.05). (Table 4-
3) No significant change was observed in FG in participants treated with ACEIs. Long
term change in FG was not significantly different by type of thiazide treatment (p=0.29),
ACEI treatment status (p=0.18), or statin treatment status (p=0.30).

129
Change in FG during the observational follow-up period is displayed by
concomitant antihypertensive treatment in Figure 4-3. Figure 4-3 indicates that, after
short term treatment with thiazides, patients treated with a thiazide plus a beta blocker
displayed an increased mean FG compared to patients treated with a thiazide alone, a
thiazide plus an ACEI, or triple therapy with a thiazide, beta blocker, and ACEI.
Stepwise Linear Regression of Change in Lab Measures during Long Term Thiazide Treatment
Univariate associations of change in FG during long term thiazide treatment are
listed in Table 4-4. Stepwise linear regression modeling of long term FG changes
indicated a significantly increased FG with longer duration of thiazide treatment
(p=0.008) and lower baseline FG (p=0.02). (Table 4-4) The full model R2 for change in
FG during long term thiazide treatment was 0.45. Change in FG was positively
correlated with duration of thiazide treatment (r=0.47, p=0.004), which is consistent with
a positive parameter estimate in stepwise regression. (Figure 4-4)
Increased HOMA during long term thiazide treatment was associated with longer
duration of thiazide diuretic treatment (p=0.009) with model R2=0.19. (Table 4-5)
Increased insulin was associated with lower baseline insulin (p<0.0001) and white race
(p=0.01) with model R2=0.59. (Table 4-6) Increased triglycerides during long term
thiazide treatment was associated with decreased baseline triglycerides (p<0.0001) with
model R2=0.67. (Table 4-7) After stepwise regression, no significant associations were
found for change in uric acid during long term thiazide treatment. (Table 4-8) No
patients were treated with uric acid lowering medications such as allopurinol during the
follow-up period. Stepwise regressions of change in serum potassium, LDL, HDL, total

130
cholesterol, and serum potassium during long term thiazide treatment are presented in
the Appendix B. (Table B-1, Table B-2, Table B-3, and Table B-4 respectively)
Stepwise Linear Regression of Lab Measures at Follow-Up Visit after Long Term Thiazide Treatment
Variables associated with higher adjusted plasma adjusted FG at follow-up were
family history of T2D in a first degree relative (p=0.03) and chlorthalidone treatment
(p=0.05) with full model R2=0.22. (Table 4-9) Increased two hour OGTT plasma
adjusted glucose at follow-up was associated with increased DBP during short term
thiazide treatment (p=0.004), older age (p=0.02), and concomitant beta blocker
treatment (p=0.03) with R2=0.34. (Table 4-10). Beta blocker treatment was associated
with a 33 mg/dL increase in two hour OGTT plasma adjusted glucose compared to
participants without beta blocker treatment. No significant associations were identified
for HbA1c (Table 4-11), OGTT AUC (Table 4-12), or one hour OGTT glucose (Table 4-
13) at follow-up.
Correlation of Change FG and Change in Serum Potassium during Follow-Up
A trend towards a significant inverse correlation between change in FG and
change in serum potassium was observed after controlling for baseline FG, baseline
serum potassium, and potassium supplementation (r=-0.33, p=0.06). (Figure 4-5) Non-
significant negative correlations were also observed by potassium supplementation
status, chlorthalidone and HCTZ treatment, and by ACEI treatment status.
Evaluation of IFG, IGT, EGI, and T2D
At follow-up, IFG was present in 11 participants (28%). (Table 4-1) Five of 11 also
had IFG at baseline and six had newly developed IFG. (Table 4-2) IGT was present in
16 participants (40%) and 18 participants had EGI (40%). Agreement between IFG and

131
IGT was 73%, agreement between IFG and EGI was 73%, and agreement between IGT
and EGI, which both use post load glucose measurements rather than FG, was 85%.
Seven PEAR Follow-Up Study participants were observed to have only one of the three
classifications and eight were observed to have comorbid IFG, IGT, and EGI. (Figure 4-
6) After stepwise logistic regression modeling, no significant associations were
identified for IFG, IGT, EGI, or T2D.
Discussion
In the PEAR Follow-Up Study, longer duration of thiazide treatment and lower
baseline FG were associated with increased FG after long term thiazide treatment.
Change in FG during short term thiazide treatment was not associated or correlated
with change in FG during long term thiazide treatment. Beta blocker treated patients
had larger mean FG increases during follow-up and increased two hour glucose
following OGTT. A significant increase in uric acid was observed after long term
thiazide treatment, however no associations with increased uric acid were observed.
We also observed no significant increase in triglycerides after long term thiazide
treatment. Few associations were observed for OGTT values and agreement between
IGT and EGI was higher than between IFG and IGT or IFG and EGI, suggesting that
values acquired after glucose challenge are distinct from those acquired in the fasting
state. In addition, change in FG was not significantly correlated with change in serum
potassium during long term thiazide treatment.
The strong association and significant correlation between longer thiazide
treatment duration and long term change in FG during long term thiazide treatment
suggests that longer treatment duration with a thiazide results in increasing FG levels.
Our observations occurred over a large range of follow-up periods ranging from eight to

132
72 months. PEAR Follow-Up Study data suggest that longer treatment is a risk factor
for increased FG in an observational setting. An increasing FG with longer thiazide
treatment is consistent with previous literature, in which increasing FG is observed
during thiazide treatment.49,51 The impact of duration of thiazide treatment is further
supported by the association of duration of thiazide treatment with increased HOMA,
indicating worsening insulin sensitivity with longer thiazide treatment.
In the PEAR Follow-Up Study, increased FG during long term thiazide treatment
was strongly associated with lower baseline FG. A similar negative parameter estimate
was observed for change in FG and baseline FG after four weeks of HCTZ treatment in
GERA (n=585).114 In GERA, similar stepwise linear regression models were used to
determine associations with change in FG during four weeks of HCTZ. The inverse
relationship between baseline FG and change in FG has now been observed in analysis
of both short and long term thiazide treatment. An inverse relationship was observed in
both GERA and the PEAR Follow-Up Study between baseline triglycerides and change
in triglycerides during thiazide treatment.
In the GERA study, stepwise models explained relatively small amounts of
variability in FG during thiazide treatment (R2=0.11).114 The PEAR Follow-Up Study
model had a higher R2 (0.45) despite a smaller sample size. Similarly high model R2
values were observed for changes in triglycerides in the PEAR Follow-Up Study versus
GERA.114 The main difference in study design is the greater duration of thiazide
treatment in the PEAR Follow-Up Study versus GERA. Since thiazide treatment
duration was a significant predictor of FG changes, our results suggest that a greater
amount of variability in FG can be explained over long term thiazide therapy, but must

133
be interpreted with caution considering the relatively small sample size of the PEAR
Follow-Up Study population.
In the PEAR Follow-Up Study, short term changes in FG during thiazide treatment
were not associated with or correlated with long term changes in FG during thiazide
treatment. The lack of association suggests that short term monitoring of FG during
initial thiazide administration are insufficient to determine whether long term thiazide-
induced dysglycemia will develop. Baseline FG and duration of thiazide therapy may be
more important determinants of AMEs than short term monitoring during thiazide
treatment. PEAR Follow-Up Study data suggest that acquiring a FG level
approximately nine weeks after start of thiazide treatment would not be clinically
informative or determine severity of long term changes in FG.
The PEAR Follow-Up Study observed a 6.5 (SD 13.0) mg/dL FG increase during
nine weeks of HCTZ treatment and a 3.6 mg/dL FG increase after long term (average
29 months) HCTZ treatment. The observation of a large FG increase during short term
HCTZ treatment compared to a FG increase that is disproportionate in terms of
treatment duration is consistent with previous literature. One previous study observed a
4.0 mg/dL FG after 10 weeks of HCTZ treatment and a 4.7 mg/dL increase after one
year of HCTZ treatment, although this study utilized up to 200mg daily doses of
HCTZ.116 Another study observed a 0.59 mmol/L (10.6 mg/dL) FG increase after 4-6
months of HCTZ treatment and a 0.46 mmol/L (8.3 mg/dL) FG increase after 24 months
of HCTZ treatment.190 These data suggest that an exaggerated change in FG occurs
during short term thiazide treatment. Despite exaggerated FG increases in the short
term, HCTZ treatment duration was associated with long term FG increases in the

134
PEAR Follow-Up Study. However, our results suggest that patients with large FG
increases during short term HCTZ treatment will not necessarily experience large FG
increases during long term HCTZ treatment.
PEAR Follow-Up Study results support an effect of concomitant antihypertensive
pharmacotherapy on AMEs. Participants treated with thiazides and beta blockers had
greater long term increases in FG. Beta blocker treatment was also associated with
increased two hour OGTT glucose. Beta blocker treatment has been previously
associated with T2D47 and may impair insulin release through its action on the beta 1
receptor,68 causing increases in fasting and post prandial glucose. In addition,
chlorthalidone was associated with higher FG at follow-up, suggesting that
chlorthalidone treatment may be associated with greater FG increases than the much
more commonly prescribed HCTZ. The potency of chlorthalidone versus HCTZ has not
been well studied in terms of AMEs, but chlorthalidone treatment has been associated
with new onset diabetes49 and recent evidence suggests that chlorthalidone is more
potent than HCTZ regarding BP and CV event reduction, hypokalemia, and
hyperuricemia.198,199
Although two hour glucose following an OGTT was associated with older age, beta
blocker treatment, and increased diastolic BP, no significant associations were found for
OGTT AUC or one hour OGTT glucose, suggesting that available baseline data in
PEAR and PEAR-2 do not model these phenotypes after long term thiazide treatment.
The paucity of associations for OGTT-related measures might have been due to the fact
that no OGTT data was acquired at baseline in PEAR or PEAR-2. The lack of
associations with OGTT values from baseline data supports the notion that

135
measurements obtained during glucose challenge are distinct from glucose
measurements in the fasting state.122,125 The limitation of fasting measurements is
clinically concerning considering evidence suggesting improvement in T2D prediction
and CV risk using glucose challenge measurements.123,125,196 A greater sensitivity of
glucose challenge measurements is also suggested by the greater percentage of PEAR
Follow-Up Study patients that EGI and IGT versus IFG.
The PEAR Follow-Up Study observed a lack of correlation between FG changes
and potassium changes during long term thiazide treatment. The relationship between
potassium and glucose is well described and has been discussed at length in previous
chapters.46,75 While some evidence suggests that potassium depletion is associated
with increased FG during thiazide treatment,76,78 an analysis from the PEAR study
observed no correlation between change FG and change in serum potassium during
short term thiazide treatment, using individual patient data rather than aggregate pooled
data.79 While further research is required, data from PEAR during both short and long
term thiazide treatment suggest a lack of correlation between serum potassium and FG.
The lack of correlation calls into question the idea that thiazide-induced hyperglycemia
is directly related to potassium depletion and suggests that the pathophysiology of
thiazide-induced dysglycemia is more complex than a simple inverse relationship
between potassium and glucose.
The strengths of this study are the inclusion of thiazide response data, including
glucose, lipid, and electrolyte-related measurements, after both short term and long
term thiazide treatment in a contemporary hypertensive cohort. The PEAR Follow-Up
Study also included detailed information regarding concomitant drug therapy, including
136
antihypertensive, anti-diabetic, statin therapy, and other medications known to affect
glucose homeostasis. Detailed pharmacotherapy data allowed evaluation of
concomitant drug treatment effects on AMEs during long term thiazide treatment in an
observational setting. The majority of studies of thiazide-induced AMEs come from
large scale hypertension treatment trial data. Our analysis of data during non-
randomized treatment outside of a clinical trial may better reflect actual participant
practices and be more generalizable to a broader patient population. We were also
able to evaluate patients using an OGTT to evaluate detailed glycemic characteristics of
PEAR Follow-Up Study participants after long term thiazide treatment.
Our study has several limitations worthy of mention. The limited sample size may
have contributed to a lack of significant differences in FG and lipid measures during
long term thiazide treatment and may also have resulted in inflated model R2 values in
stepwise regressions. Although our R2 values were high, predictors of long term FG
and triglycerides were consistent with previously published models in a much larger
patient population.114 Sample size may also have affected our ability to detect
associations with dichotomous outcome variables such as IFG, EGI, and IGT.
Furthermore, sample size limited our ability to determine effects of all classes of
medications known to affect glucose homeostasis. However, we were able to detect
effects of beta blocker and chlorthalidone treatment on two hour OGTT glucose and FG
at follow-up respectively.
Whole blood FG values at follow-up were also adjusted to reflect plasma FG
measurements at follow-up, which might contribute to variability in the change in FG
phenotype. However, the utilized 11% plasma adjusted value corresponds well with

137
plasma measurements and is endorsed by the ADA.119 No OGTT data was available
from PEAR and PEAR-2 which prevented analysis comparing short and long term
effects of thiazides on glucose tolerance. In addition, compliance to drug therapy during
follow-up was assessed via interview, which may not reflect actual compliance with
chronic medications. However, changes in several objective parameters strongly
suggest a compliant population in terms of thiazide treatment and other
antihypertensive therapies, including a significant reduction in systolic and diastolic BP,
decrease in serum potassium, and increase in serum uric acid. Finally, detailed data
regarding diet and exercise was not collected for PEAR Follow-Up Study patients.
Therefore, we were not able to detect potential effects of changing habits in diet and
exercise on glucose and lipid-related measurements in our population. Increases in
participant weight and BMI, which might indicate worsening diet and exercise habits,
were observed although not significantly different over the follow-up period.
Summary and Significance
In the PEAR Follow-Up Study, we observed a strong association and correlation
between duration of thiazide therapy and increasing FG during long term thiazide
treatment. The association of duration of treatment with increasing FG and HOMA may
have clinical implications since antihypertensive therapy with thiazide diuretics is
typically lifelong. Concomitant antihypertensive treatment with beta blockers was
associated with larger mean FG increases during follow-up and increased two hour
OGTT glucose at follow-up, suggesting that the antihypertensive combination of
thiazides and beta blockers should be avoided for patients in whom glucose levels are
of concern.

138
PEAR Follow-Up Study data suggest that change in FG during short term thiazide
treatment is not associated nor correlated with change in FG during long term thiazide
treatment. The lack of association suggests that acquiring a FG level approximately
nine weeks after start of thiazide treatment may not be as clinically informative as
monitoring glucose consistently throughout therapy. The PEAR Follow-Up Study results
also supported the distinction between measures of glucose tolerance versus measures
of fasting glucose and the lack of correlation between change in FG and change in
serum potassium during long term thiazide treatment.

139
Table 4-1. Characteristics of PEAR Follow-Up Study participants at baseline and at follow-up
Characteristic* Baseline† (n=40)
Follow-up (n=40)
P value‡
PEAR participants 29 (73%) - -
PEAR-2 participants 11 (27%) - - Gender (female) 24 (60%) - -
Race (Nonblack) 29 (73%) - -
Age (years) , mean (SD) 49 (10) 51 (10) <0.0001 Weight (kg), mean (SD) 89.8 (17.7) 91.7 (17.3) 0.09 Body mass index (kg/m2) , mean (SD) 31.1 (5.6) 31.8 (5.4) 0.09 Waist circumference (cm) , mean (SD) 98 (14) 102 (16) 0.002 Abdominal Obesity§ 22 (55%) 27 (68%) 0.03
SBP, mean (SD)** 142 (16) 131 (14) 0.003 DBP, mean (SD)** 89 (9) 83 (10) 0.02
Consumes alcoholic beverages 18 (45%) 22 (55%) 0.18
Drinks per week 5 (7) 8 (10) 0.04
Current smoker 10 (23%) 7 (16%) 0.08
Statin treatment 4 (9%) 9 (23%) 0.06
Fasting Glucose (mg/dL)†† 91 (12) 94 (13) 0.16
Total cholesterol (mg/dL) 198 (40) 200 (40) 0.63
LDL cholesterol (mg/dL) 122 (36) 117 (36) 0.35
HDL cholesterol (mg/dL) 45 (14) 52 (17) <0.0001
Triglycerides (mg/dL) 154 (121) 157 (89) 0.59
Serum potassium (mEq/L) 4.49 (0.48) 4.18 (0.49) 0.003
Uric acid (mg/dL) 5.9 (1.5) 6.6 (1.6) <0.0001 Insulin (μU/mL) 15.8 (12.6) 15.2 (10.2) 0.85
HOMA 2.73 (1.79) 3.32 (2.58) 0.15
Impaired fasting glucose†† 11 (28%) 11 (28%) 0.99
SD indicates standard deviation; kg, kilograms; kg/m2, kilograms per meter squared; cm, centimeters, SBP, systolic blood pressure; DBP, diastolic blood pressure; mg/dL, milligrams per deciliter; LDL, low density lipoprotein; HDL, high density lipoprotein; mEq/L, milliequivalents per liter; microunits per milliliter, μU/mL; HOMA, homeostatic model assessment. *Values indicate n (%) unless otherwise stated. †Baseline is defined as start of thiazide diuretic treatment during PEAR or PEAR-2. ‡P value indicates paired t-tests or McNemar’s tests for difference between baseline and follow up. §Abdominal obesity defined as waist circumference ≥35 inches for females or ≥40 inches for males. **Average of home BP measurements for baseline and three clinic BP measurements for follow-up study visit. ††Impaired fasting glucose defined as fasting glucose ≥ 100 mg/dL.
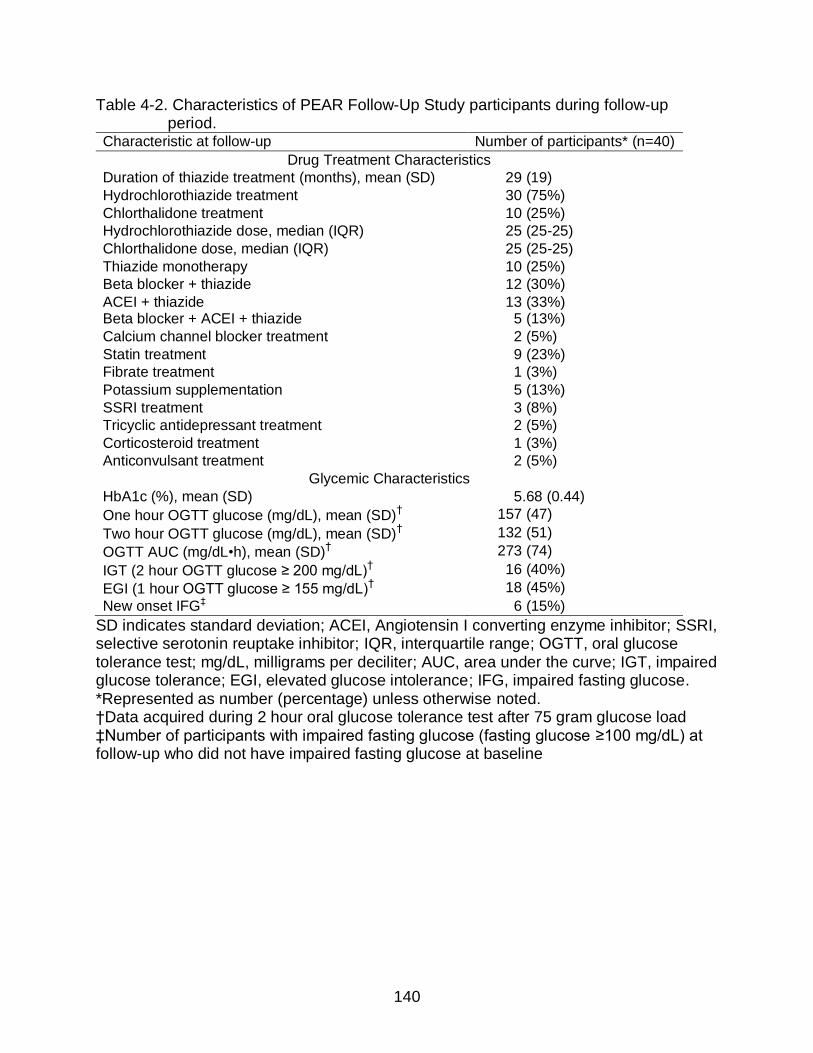
140
Table 4-2. Characteristics of PEAR Follow-Up Study participants during follow-up period.
Characteristic at follow-up Number of participants* (n=40)
Drug Treatment Characteristics
Duration of thiazide treatment (months), mean (SD) 29 (19)
Hydrochlorothiazide treatment 30 (75%)
Chlorthalidone treatment 10 (25%)
Hydrochlorothiazide dose, median (IQR) 25 (25-25)
Chlorthalidone dose, median (IQR) 25 (25-25)
Thiazide monotherapy 10 (25%)
Beta blocker + thiazide 12 (30%)
ACEI + thiazide 13 (33%) Beta blocker + ACEI + thiazide 5 (13%)
Calcium channel blocker treatment 2 (5%)
Statin treatment 9 (23%)
Fibrate treatment 1 (3%)
Potassium supplementation 5 (13%)
SSRI treatment 3 (8%)
Tricyclic antidepressant treatment 2 (5%)
Corticosteroid treatment 1 (3%)
Anticonvulsant treatment 2 (5%)
Glycemic Characteristics
HbA1c (%), mean (SD) 5.68 (0.44)
One hour OGTT glucose (mg/dL), mean (SD)† 157 (47)
Two hour OGTT glucose (mg/dL), mean (SD)† 132 (51)
OGTT AUC (mg/dL•h), mean (SD)† 273 (74)
IGT (2 hour OGTT glucose ≥ 200 mg/dL)† 16 (40%)
EGI (1 hour OGTT glucose ≥ 155 mg/dL)† 18 (45%)
New onset IFG‡ 6 (15%)
SD indicates standard deviation; ACEI, Angiotensin I converting enzyme inhibitor; SSRI, selective serotonin reuptake inhibitor; IQR, interquartile range; OGTT, oral glucose tolerance test; mg/dL, milligrams per deciliter; AUC, area under the curve; IGT, impaired glucose tolerance; EGI, elevated glucose intolerance; IFG, impaired fasting glucose. *Represented as number (percentage) unless otherwise noted. †Data acquired during 2 hour oral glucose tolerance test after 75 gram glucose load ‡Number of participants with impaired fasting glucose (fasting glucose ≥100 mg/dL) at follow-up who did not have impaired fasting glucose at baseline

141
Table 4-3. Fasting glucose levels at baseline and at follow-up by drug treatment status Drug treatment* FG at baseline FG at follow-up p value†
Type of thiazide
HCTZ (n=30) 90 (12) 92 (12) 0.29
Chlorthalidone (n=10) 93(12) 100 (14)
Beta blocker
Beta blocker treated (n=17) 90 (13) 98 (12) 0.05
No beta blocker (n=23) 92 (12) 91 (13)
ACEI
ACEI treated (n=18) 90 (14) 90 (10) 0.18
No ACEI (n=22) 92 (10) 97 (15)
Statin
Statin treated (n=9) 87 (17) 95 (13) 0.30
No statin (n=31) 92 (11) 94 (13)
FG indicates fasting glucose; HCTZ, hydrochlorothiazide; ACEI, angiotensin I converting enzyme inhibitor. *Excludes individuals treated with anti-diabetic drugs with the exception of the anti-diabetic drug heading †p value for paired t-test for difference between groups in change in FG between baseline and follow-up Table 4-4. Variables associated with FG changes during long term thiazide treatment Independent variable Parameter
estimate (β) p value*
Univariate associations (p<0.20)
Baseline FG, mg/dL -0.70 0.003
Change in FG during short term thiazide treatment, mg/dL
0.28 0.16
Gender (female) -6.56 0.20
Duration of thiazide treatment, months 0.48 0.0002
Beta blocker treatment 9.76 0.05
ACEI treatment -6.74 0.18
Current smoker -9.37 0.15
Family history of T2D† 8.11 0.11
Baseline SBP, mmHg 0.23 0.17
Stepwise Results (R2=0.45)
Duration of thiazide treatment, months 0.34 0.008
Baseline FG, mg/dL -0.46 0.02
FG indicates fasting glucose; mg/dL, milligrams per deciliter; ACEI, angiotensin I converting enzyme inhibitor; T2D, type 2 diabetes; SBP, systolic blood pressure. *p values determined using linear regression excluding patients with anti-diabetic treatment. †Family history of type 2 diabetes in a first degree relative

142
Table 4-5. Variables associated change in HOMA changes during long term thiazide treatment
Independent variable Parameter estimate (β)
p value*
Univariate associations (p<0.20)
Race (white) -1.51 0.08
Duration of thiazide treatment, months 0.06 0.009
Current smoker -1.90 0.07
Baseline Insulin, µU/mL -0.07 0.04
Stepwise Results (R2=0.19)
Duration of thiazide treatment, months 0.06 0.009
HOMA indicates homeostatic model assessment; µU/mL, microunits per milliliter. *p values determined using linear regression excluding patients with anti-diabetic treatment. Table 4-6. Variables associated change in insulin changes during long term thiazide
treatment Independent variable Parameter
estimate (β) p value*
Univariate associations (p<0.20)
Race (white) -8.18 0.06
Duration of thiazide treatment, months 0.37 0.001
Beta blocker treatment 5.89 0.17
Chlorthalidone treatment -6.70 0.18
Current smoker -8.82 0.11
Statin treatment -12.28 0.01
Change in potassium during short term thiazide treatment, mEq/L
6.62 0.06
Baseline uric acid, mg/dL -2.51 0.08
Baseline insulin, µU/mL -0.72 <0.0001
Change in insulin during short term thiazide treatment, µU/mL
-0.66 0.009
Stepwise Results (R2=0.59)
Baseline insulin, µU/mL -0.73 <0.0001
Race (white) -8.42 0.01
HOMA indicates homeostatic model assessment; µU/mL, microunits per milliliter. *p values determined using linear regression excluding patients with anti-diabetic treatment.

143
Table 4-7. Variables associated with triglyceride changes during long term thiazide treatment
Independent variable Parameter estimate (β)
p value*
Univariate associations (p<0.20)
Beta blocker treatment 38.59 0.16
Abdominal obesity -48.22 0.08
Change in LDL during short term thiazide treatment, mg/dL -0.89 0.17
Baseline HDL, mg/dL 1.63 0.10
Change in HDL during short term thiazide treatment, mg/dL -4.18 0.13
Change in uric acid during short term thiazide treatment, mg/dL
27.87 0.05
Baseline triglycerides, mg/dL -0.46 <0.0001
Change in triglycerides during short term thiazide therapy, mg/dL
0.45 0.002
Stepwise Results (R2=0.45)
Baseline triglycerides, mg/dL -0.46 <0.0001
LDL indicates low density lipoprotein; mg/dL, milligrams per deciliter; T2D, type 2 diabetes; OGTT, oral glucose tolerance test; AUC, area under the curve; BP, blood pressure; µU/mL, microunits per milliliter. *p values determined using linear regression excluding patients with anti-diabetic treatment. Table 4-8. Variables associated with uric acid changes during long term thiazide
treatment Independent variable Parameter
estimate (β) p value*
Univariate associations (p<0.20)
Baseline triglycerides, mg/dL 0.002 0.19
Stepwise Results: no significant associations
Mg/dL indicates milligrams per deciliter. *p values determined using linear regression excluding patients with anti-diabetic treatment.

144
Table 4-9. Variables associated with FG at follow-up Independent variable Parameter
estimate (β) p value*
Univariate associations (p<0.20)
Baseline FG, mg/dL 0.30 0.09
Duration of thiazide treatment, months 0.18 0.12
Beta blocker treatment 7.78 0.06
ACEI treatment -7.30 0.08
Chlorthalidone treatment 7.73 0.10
Family history of T2D† 7.43 0.07
BMI, kg/m2 0.48 0.20
Baseline HDL, mg/dL -0.22 0.17
Baseline DBP, mmHg 0.37 0.12
Stepwise Results (R2=0.22)
Family history of T2D† 9.31 0.03
Chlorthalidone treatment 9.59 0.05
FG indicates fasting glucose; mg/dL, milligrams per deciliter; ACEI, angiotensin I converting enzyme inhibitor; T2D, type 2 diabetes; BMI, body mass index; HDL, high density lipoprotein; DBP, diastolic blood pressure. *p values determined using linear regression excluding patients with anti-diabetic treatment. †History of type 2 diabetes in a first degree relative

145
Table 4-10. Variables associated with two hour OGTT glucose at follow-up Independent variable Parameter estimate
(β) p value*
Univariate associations (p<0.20)
Age, years 1.24 0.13
Duration of thiazide treatment, months 0.74 0.10
Beta blocker treatment 27.93 0.09
Abdominal obesity† -22.22 0.17
Baseline potassium, mEq/L 31.53 0.08
Baseline LDL, mg/dL 0.36 0.13
Baseline total cholesterol, mg/dL 0.39 0.06
Change in SBP during short term thiazide treatment, mmHg
1.22 0.09
Change in DBP during short term thiazide treatment, mmHg
2.16 0.10
Stepwise Results (R2=0.34)
Change in DBP during short term thiazide treatment, mmHg
4.64 0.004
Age, years 1.90 0.02
Beta blocker treatment 33.10 0.03
OGTT indicates oral glucose tolerance test; mEq/L, milliequivalents per liter; LDL, low density lipoprotein; mg/dL, milligrams per deciliter; mmHg, millimeters of mercury. *p values determined using linear regression excluding patients with anti-diabetic treatment. †Abdominal obesity defined as waist circumference ≥35 inches for females or ≥40 inches for males. Table 4-11. Variables associated with HbA1c at follow-up Independent variable Parameter
estimate (β) p value*
Univariate associations (p<0.20)
Beta blocker treatment 0.22 0.12
Family history of T2D† 0.19 0.18
Statin treatment 0.23 0.18
Baseline LDL, mg/dL 0.003 0.16
Baseline total cholesterol, mg/dL 0.003 0.13
Baseline DBP, mmHg 0.01 0.15
Stepwise Results: no significant associations
T2D indicates type 2 diabetes; LDL, low density lipoprotein; mg/dL, milligrams per deciliter; DBP, diastolic blood pressure . *p values determined using linear regression excluding patients with anti-diabetic treatment. †History of T2D for a first degree relative

146
Table 4-12. Variables associated with OGTT AUC at follow-up Independent variable Parameter
estimate (β) p value*
Univariate associations (p<0.20)
Baseline FG, mg/dL 1.39 0.18
Age, years 1.72 0.14
Duration of thiazide treatment, months 1.26 0.06
Beta blocker treatment 42.70 0.07
Baseline potassium, mEq/L 36.13 0.17
Stepwise Results: no significant associations
OGTT indicates oral glucose tolerance test; FG, fasting glucose; mg/dL, milligrams per deciliter; mEq/L, milliequivalents per liter. *p values determined using linear regression excluding patients with anti-diabetic treatment. Table 4-13. Variables associated with one hour OGTT glucose at follow-up Independent variable Parameter
estimate (β) p value*
Univariate associations (p<0.20)
Baseline FG, mg/dL 1.00 0.13
Age, years 1.05 0.16
Duration of thiazide treatment, months 0.77 0.07
Beta blocker treatment 25.28 0.10
Chlorthalidone treatment 27.45 0.11
Baseline potassium, mEq/L 22.96 0.18
Change in potassium during short term thiazide treatment, mEq/L
-18.83 0.14
Stepwise Results: no significant associations
OGTT indicates oral glucose tolerance test; FG, fasting glucose; mg/dL, milligrams per deciliter; mEq/L, milliequivalents per liter. *p values determined using linear regression excluding patients with anti-diabetic treatment.

147
Figure 4-1. Progression of subjects for PEAR Follow-Up Study enrollment and analysis.
UF indicates University of Florida; PCOS, polycystic ovary syndrome.*Less than six months of follow-up time prior to PEAR Follow-Up Study enrollment

148
Figure 4-2. Change in fasting plasma glucose during short term versus long term thiazide diuretic treatment. P value and r calculated using Spearman partial correlation adjusted for baseline fasting glucose.

149
Figure 4-3. Mean fasting plasma glucose at baseline, end of short term thiazide treatment, and end of long term thiazide treatment by antihypertensive therapy. Error bars represent standard deviations. ACEI indicates angiotensin I converting enzyme inhibitor.

150
Figure 4-4. Change in fasting plasma glucose during long term thiazide diuretic
treatment versus duration of follow-up. P value and r calculated using Spearman partial correlation adjusted for baseline fasting glucose.

151
Figure 4-5. Change in fasting plasma glucose versus change in serum potassium during
long term thiazide diuretic treatment. P value and r calculated using Spearman partial correlation adjusted for baseline fasting glucose, baseline serum potassium, and treatment with potassium supplementation.

152
Figure 4-6. Venn diagram of participants with IFG, IGT, and/or EGI. IFG indicates
impaired fasting glucose, IGT indicates impaired glucose tolerance, EGI indicates elevated glucose intolerance.

153
CHAPTER 5 SUMMARY AND CONCLUSIONS
Thiazide diuretics are first line agents for the treatment of hypertension, but are
associated with T2D and hyperglycemia. Little knowledge currently exists to identify
individuals at risk for thiazide-induced dysglycemia. This research utilized several
phenotypes along a continuum of dysglycemia, including change in FG and NOD, as
well as multiple methodological approaches to identify risk factors for thiazide-induced
dysglycemia. For this research, we focused on the identification of genetic risk factors
from TCF7L2, pharmacogenetic risk factors from the candidate genes KCNJ1, ADD1,
ACE, and AGTR1, and pharmacotherapeutic risk factors, including duration of thiazide
treatment.
In the research described in Chapter 2, we sought to identify SNPs in TCF7L2 as
genetic risk factors for T2D in African and Hispanic ethnic/race groups and to
investigate the impact of race/ethnicity on SNP associations with T2D. Genetic risk
factors for T2D are well studied from GWAS in European populations, but studies
continue to be limited in individuals of African and Hispanic descent. We attempted to
identify T2D predictor SNPs using TCF7L2 sequence data for NOD cases and age,
gender, and race/ethnicity-matched controls from INVEST-GENES. After performing
association analysis in sequenced individuals and genotyping potential predictor SNPs
in a larger case/control cohort, we found no novel T2D risk predictor SNPs in black or
Hispanic individuals. We also did not confirm associations between NOD and existing
T2D predictor SNPs from European populations, regardless of race/ethnicity in INVEST-
GENES.

154
Our results do not preclude the existence of yet unknown T2D predictor SNPs
from TCF7L2 in black and Hispanic populations, since our ability to confidently identify
true associations is limited by the small number of sequenced samples among each
race/ethnic group. However, our results do add previously unknown polymorphisms to
available data on TCF7L2 variation and further described LD structure particularly in
Hispanic and blacks. To our knowledge, the described sequencing project represents
the most comprehensive evaluation of TCF7L2 variation in black and Hispanic (primarily
Puerto Rican) individuals that is currently available. Considering the large number of
variants identified and the low MAF of novel variants, type 2 error may have prevented
identification of T2D predictor SNPs. Further research, including deep sequencing in
diverse populations with larger sample sizes and investigation of cumulative contribution
of rare variants, is needed to elucidate potentially important genetic risk factors in such
race/ethnic groups.
Pharmacogenetic analysis of TCF7L2 variants and thiazide-induced NOD
produced strong evidence that genetic variation in TCF7L2, particularly SNPs
associated with T2D from GWAS, influence the effect of HCTZ on NOD risk. Previous
evidence suggests that TCF7L2 SNPs from T2D GWAS increase T2D risk95 and also
that thiazide diuretic administration increases T2D risk.47 Our research supports the
interaction of these two factors, suggesting that individuals with TCF7L2 T2D risk SNPs
are at a high risk of T2D when treated with HCTZ and at a relatively low risk when not
treated with HCTZ. To our knowledge, the research from Chapter 2 represents the only
investigation of TCF7L2 SNPs in the pharmacogenetics of thiazide-induced
dysglycemia. Functional studies and replication of pharmacogenetic associations are

155
necessary to confirm this pharmacogenetic effect and define the potential role of
TCF7L2 SNPs in predicting NOD during HCTZ treatment.
The research described in Chapter 3 utilized a candidate gene approach to
determine pharmacogenetic risk factors for thiazide-induced dysglycemia. Previous
studies investigating the pharmacogenetics of thiazide-induced dysglycemia do not
utilize a tag SNP approach and investigate different phenotypes, making interpretation
of SNP effects difficult.112-114 In the present research, tag SNPs in the candidate genes
KCNJ1, ADD1, ACE, and AGTR1, were investigated in the two hypertensive cohorts
PEAR and INVEST-GENES, which both collected clinical and genetic data and included
HCTZ as a study treatment. Inclusion of both PEAR and INVEST allowed a comparison
of pharmacogenetic effects on two phenotypes, including change in FG and NOD.
The results of research described in Chapter 3 suggest that genetic variation in
selected candidate genes, especially KCNJ1, influences the effect of HCTZ on both
NOD risk and hyperglycemia. Our results add to available evidence suggesting that
genetic variation in KCNJ1 influences the dysglycemic effect of HCTZ.114 Our
observation of different KCNJ1 SNP effects between race/ethnic groups suggests
differences in LD and highlights the need to identify functional SNPs. We also observed
associations between change in FG and non-synonymous ACE and ADD1 SNPs,
adding to existing evidence of a pharmacogenetic role of ACE and ADD1
polymorphisms in thiazide-induced dysglycemia.112 Furthermore, our results suggest
that pharmacogenetic predictors for change in FG during short term HCTZ treatment
are distinct from pharmacogenetic predictors for NOD during long term HCTZ treatment.

156
Functional studies and replication of pharmacogenetic associations are needed to
better define the potential role of KCNJ1, ACE, and ADD1 SNPs in predicting the
dysglycemic effect of HCTZ. After further study and replication, SNPs from these
candidate genes might be used to provide genotype-guided thiazide prescribing to avoid
NOD in patients with risk genotypes. Whether these findings are specific to HCTZ or
can be generalized to all thiazide diuretics is also unclear, but KCNJ1, ACE, and ADD1
remain compelling candidate genes in the pharmacogenetic study of thiazide-induced
dysglycemia. Pharmacogenetic associations remained significant for both change in
FG and NOD after adjustment for the T2D GWAS SNP rs7903146 from TCF7L2,
suggesting that pharmacogenetic predictors are present regardless of a patient’s
baseline genetic risk. However, our results must be interpreted with caution as these
TCF7L2 SNPs were associated with change in FG only in PEAR blacks and not
associated with NOD in any race/ethnic group in INVEST.
Research presented in Chapter 4 sought to refine the role of thiazide treatment
duration and concomitant antihypertensive treatment as pharmacotherapeutic risk
factors for thiazide-induced dysglycemia. We conducted an original clinical study of
previous PEAR and PEAR-2 patients treated continuously with HCTZ or chlorthalidone
for more than six months, which included an OGTT for detailed glycemic
characterization of patients after long term thiazide treatment. Few clinical trials have
assessed OGTT response data after thiazide administration.116,200,201 Furthermore,
limited data are available comparing short term (1-2 months) and long term (greater
than 6 months) effects of thiazide treatment on FG changes in the same population.116
The PEAR Follow-Up Study allowed evaluation of effects of long term thiazide treatment

157
on OGTT response data in an observational setting as well as comparison of short and
long term effects of thiazide pharmacotherapy on FG.
In the PEAR Follow-Up Study, we observed a strong association and correlation
between duration of thiazide therapy and increasing FG during long term thiazide
treatment. Baseline FG and baseline triglycerides strongly predicted long term change
in FG and triglycerides respectively. Concomitant antihypertensive treatment with beta
blockers was associated with larger mean FG increases during follow-up and increased
two hour OGTT glucose at follow-up. The association of duration of treatment with
increasing FG may have clinical implications since antihypertensive therapy with
thiazide diuretics is typically lifelong.
PEAR Follow-Up Study results suggest that change in FG during short term
thiazide treatment is not associated with or correlated with change in FG during long
term thiazide treatment. The lack of association suggests that acquiring a FG level
approximately nine weeks after start of thiazide treatment would not be clinically
informative or determine severity of long term changes in FG. Although non-significant
increases in FG and triglycerides were observed during long term thiazide treatment in
the PEAR Follow-Up Study, the effect of thiazide diuretics on AMEs was likely more
subtle than our sample size was able to detect. However, the strength of associations
from linear regressions, existence of previous studies identifying similar predictors of
change in FG and triglycerides,114 and physiological plausibility of associations lend
credence to reported results. Future research is necessary to confirm the predictive
power of baseline FG and duration of thiazide treatment, which may provide insight into
those patients who are most likely to develop AMEs.

158
The evaluation of genetic, pharmacogenetic, and pharmacotherapeutic risk factors
for thiazide-induced dysglycemia presented in this dissertation may eventually
contribute to better determination of T2D risk. Our observations might be used in future
studies which utilize genotyping and clinical laboratory and drug data to predict
increases in FG and NOD. Such studies may lead to eventual individualization of
antihypertensive treatment to avoid thiazide-induced AMEs, allowing early reduction of
modifiable risk factors and, potentially, T2D prevention. After further research, a clinical
risk assessment incorporating TCF7L2, KCNJ1, and ADD1 polymorphisms, duration of
thiazide therapy, and baseline FG values might encourage a proactive approach to
identification of individuals at risk for dysglycemia. Improved T2D risk assessments
may contribute to a clinical paradigm shift away from reactive FG monitoring during
thiazide therapy and towards proactive prevention of T2D through personalized thiazide
prescribing. Effective prevention of T2D has the potential to reduce the disease burden
of T2D, including a negative economic and public health impact.
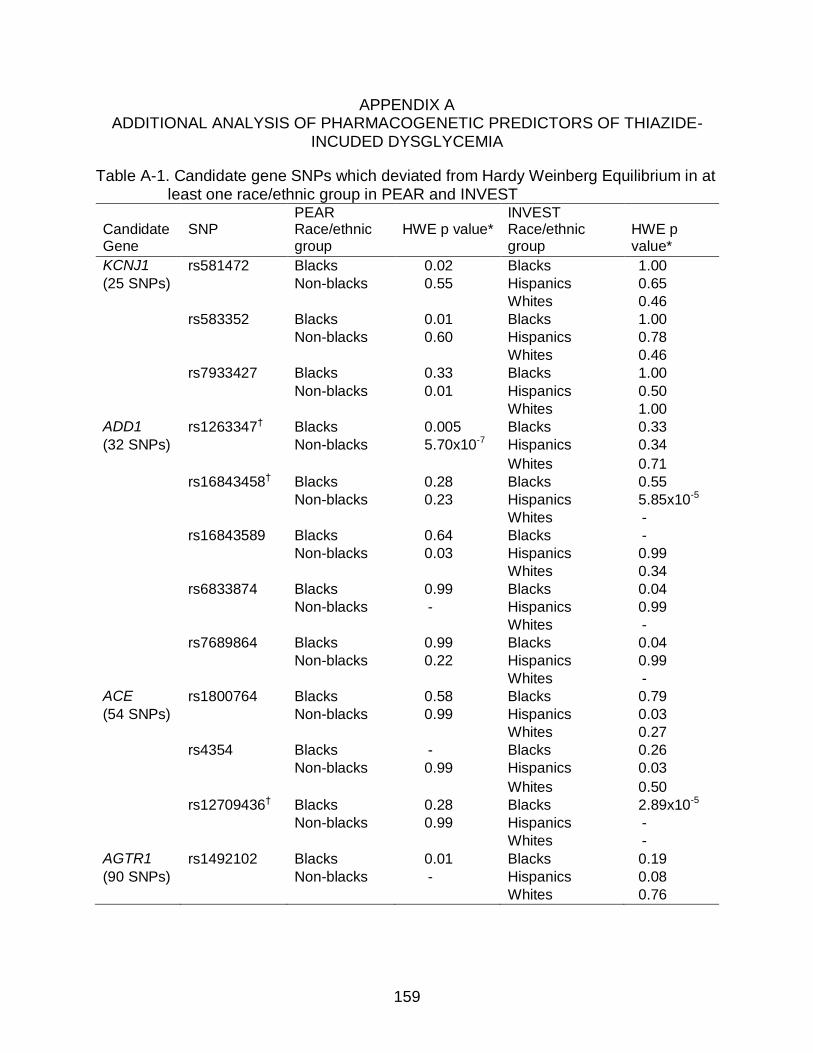
159
APPENDIX A ADDITIONAL ANALYSIS OF PHARMACOGENETIC PREDICTORS OF THIAZIDE-
INCUDED DYSGLYCEMIA
Table A-1. Candidate gene SNPs which deviated from Hardy Weinberg Equilibrium in at least one race/ethnic group in PEAR and INVEST
PEAR INVEST Candidate Gene
SNP Race/ethnic group
HWE p value* Race/ethnic group
HWE p value*
KCNJ1 rs581472 Blacks 0.02 Blacks 1.00
(25 SNPs) Non-blacks 0.55 Hispanics 0.65
Whites 0.46
rs583352 Blacks 0.01 Blacks 1.00
Non-blacks 0.60 Hispanics 0.78
Whites 0.46
rs7933427 Blacks 0.33 Blacks 1.00
Non-blacks 0.01 Hispanics 0.50
Whites 1.00
ADD1 rs1263347† Blacks 0.005 Blacks 0.33
(32 SNPs) Non-blacks 5.70x10⁻⁷ Hispanics 0.34
Whites 0.71
rs16843458† Blacks 0.28 Blacks 0.55
Non-blacks 0.23 Hispanics 5.85x10⁻⁵
Whites -
rs16843589 Blacks 0.64 Blacks -
Non-blacks 0.03 Hispanics 0.99
Whites 0.34
rs6833874 Blacks 0.99 Blacks 0.04
Non-blacks - Hispanics 0.99
Whites -
rs7689864 Blacks 0.99 Blacks 0.04
Non-blacks 0.22 Hispanics 0.99
Whites -
ACE rs1800764 Blacks 0.58 Blacks 0.79
(54 SNPs) Non-blacks 0.99 Hispanics 0.03
Whites 0.27
rs4354 Blacks - Blacks 0.26
Non-blacks 0.99 Hispanics 0.03
Whites 0.50
rs12709436† Blacks 0.28 Blacks 2.89x10⁻⁵
Non-blacks 0.99 Hispanics -
Whites -
AGTR1 rs1492102 Blacks 0.01 Blacks 0.19
(90 SNPs) Non-blacks - Hispanics 0.08
Whites 0.76

160
Table A-1. Continued PEAR INVEST Candidate Gene
SNP Race/ethnic group
HWE p value*
Race/ethnic group
HWE p value*
AGTR1 rs12721286† Blacks - Blacks 0.62 (continued) Non-blacks 0.001 Hispanics 0.57 Whites - rs12721221 Blacks 0.29 Blacks 0.99 Non-blacks - Hispanics 0.03 Whites 0.99 rs275649 Blacks 0.65 Blacks 0.05 Non-blacks 1.00 Hispanics 0.17 Whites 0.04 rs2640543† Blacks 0.45 Blacks 0.008 Non-blacks 0.29 Hispanics 0.01 Whites 1.00 rs1492099 Blacks 0.32 Blacks 1.00 Non-blacks 0.32 Hispanics 0.003 Whites 0.85 rs12721280 Blacks 0.99 Blacks 0.006 Non-blacks 1.00 Hispanics 0.99 Whites - rs12721211 Blacks 1.00 Blacks 0.04 Non-blacks 1.00 Hispanics 0.99 Whites - rs9682137 Blacks 1.00 Blacks 0.04 Non-blacks 0.50 Hispanics Whites rs12721232 Blacks 0.33 Blacks 0.02 Non-blacks - Hispanics 0.85 Whites 0.23 rs12695918† Blacks 0.34 Blacks 1.22x10⁻⁵ Non-blacks 0.87 Hispanics 0.52 Whites 1.00 rs5183† Blacks 0.99 Blacks 3.73x10⁻⁴ Non-blacks 1.00 Hispanics 0.64 Whites 0.25 rs389566 Blacks 1.00 Blacks 0.49 Non-blacks - Hispanics 0.10 Whites 0.03
PEAR indicates Pharmacogenomics Evaluation of Antihypertensive Responses; INVEST, INternational VErapamil SR-Trandolapril STudy; SNP, single nucleotide polymorphism; HWE, Hardy Weinberg Equilibrium. P values less than 0.05 are in bold. *Hardy Weinberg Equilibrium p values generated using Fisher’s Exact test †Assay for SNP considered failed due to HWE p<0.001 or deviations from HWE in multiple
race/ethnic groupspage..

161
Table A-2. SNP effects on change in fasting glucose in PEAR for SNPs previously associated with thiazide-induced dysglycemia*
SNP
Race/ethnic group
Allele (frequency)
Beta (SE) HCTZ monotherapy
p value† Beta (SE) HCTZ add-on
p value† Beta (SE) combined
p value†
KCNJ1 rs59172778 Blacks G (0.00) - - - - - -
Non-blacks G (0.01) 3.15 (4.49) 0.48 -1.91 (5.60) 0.73 2.10 (3.34) 0.58 ADD1 rs4961
§ Blacks A (0.06) -1.17 (2.66) 0.59 2.32 (4.62) 0.57 -0.05 (2.32) 0.90
Non-blacks A (0.21) 2.24 (1.28) 0.06 1.74 (1.06) 0.13 1.99 (0.81) 0.02††
ACE rs4343 Blacks G (0.24) 1.13 (1.92) 0.45 -1.25 (2.23) 0.72 1.07 (1.43) 0.41 Non-blacks G (0.53) 0.52 (0.99) 0.63 -0.03 (0.88) 0.89 0.17 (0.66) 0.81 AGTR1 rs5186 Blacks C (0.05) 2.22 (3.38) 0.51 0.77 (3.83 0.84 1.77 (2.54) 0.46 Non-blacks C (0.29) 0.64 (1.14) 0.58 0.22 (0.89) 0.80 0.48 (0.71) 0.50
SNP indicates single nucleotide polymorphism; HCTZ, hydrochlorothiazide; SE, standard error. *All parameter estimates (betas) and p values represent change in FG per copy of allele adjusted for FG at start of HCTZ, age, gender, waist circumference, potassium supplementation during the study, drug arm, average home systolic and diastolic BP, HCTZ dose, duration of HCTZ treatment, and PCs one, two, and three. †p values determined using change in log(FG) in linear regressions §SNP considered to complement previous association with thiazide-induced dysglycemia

162
Table A-3. INVEST NOD odds ratios for SNPs previously associated with thiazide-induced dysglycemia*
Gene SNP
Race/ethnic group
Allele (frequency)
OR (95%CI) HCTZ treated
OR (95%CI) HCTZ treated (≥6 months)
OR (95%CI) Not HCTZ treated
Interaction p value
†
KCNJ1 rs59172778 White G (0.01) 1.54 (0.22-10.68) p=0.66 1.68 (0.23-12.26) p=0.61 0.77 (0.07-8.47) p=0.83 p=0.80
Hispanic G (0.003) 2.31 (0.44-12.3) p=0.32 2.51 (0.47-13.37) p=0.28 NE p=0.95 p=0.87
Black G (0.01) NE - NE - NE - - ADD1 rs4961 White A (0.20) 0.91 (0.59-1.39) p=0.66 0.90 (0.58-1.37) p=0.61 0.93 (0.48-1.82) p=0.83 p=0.88 Hispanic A (0.15) 0.99 (0.66-1.49) p=0.97 0.97 (0.64-1.47) p=0.90 1.11 (0.59-2.09) p=0.74 p=0.98 Black A (0.07) 0.50 (0.14-1.56) p=0.21 NE p=0.25 NE p=0.50 p=0.19 ACE rs4343 White G (0.55) 1.31 (0.93-1.85) p=0.13 1.29 (0.91-1.82) p=0.15 0.76 (0.46-1.27) p=0.30 p=0.07
Hispanic G (0.45) 1.22 (0.90-1.65) p=0.20 1.23 (0.91-1.82) p=0.19 1.42 (0.93-2.19) p=0.11 p=0.71
Black G (0.22) 0.96 (0.48-1.90) p=0.91 0.99 (0.50-1.96) p=0.97 NE p=0.69 p=0.25
AGTR1 rs5186 White C (0.30) 0.96 (0.63-1.46) p= 0.85 0.96 (0.63-1.46) p=0.84 0.84 (0.47-1.51) p=0.56 p=0.25 Hispanic C (0.23) 0.87 (0.59-1.29) p=0.93 0.82 (0.54-1.24) p=0.34 0.89 (0.50-1.60) p=0.70 p=0.59 Black C (0.07) 2.69 (0.72-10.12) p=0.14 2.65 (0.71-9.97) p=0.15 NE p=0.92 p=0.94
95%CI indicates 95% confidence interval; HCTZ, hydrochlorothiazide; NE, odds ratio not estimable due to sample size; OR, odds ratio; SNP, single nucleotide polymorphism. *All point estimates and p values represent increased risk of NOD per copy of allele and are adjusted for age, gender, body mass index, average on treatment systolic blood pressure, left ventricular hypertrophy, history of smoking and hypercholesterolemia, principal components one, two, and three, and treatment with trandolapril, atenolol, or potassium supplementation. †Interaction p values for SNP*HCTZ treatment adjusted for prespecified covariates.

163
Table A-4. Stepwise multivariate models for including genetic and pharmacogenetic predictor SNPs in PEAR
SNP Gene Parameter Estimate* (standard error)
p value* R2 -2logL
Blacks 0.255 2169†
rs17137967 KCNJ1 7.54 (2.40) 0.002
rs4303 ACE -5.88 (1.92) 0.003
rs7903146 TCF7L2 3.05 (1.29) 0.02
Non-Blacks 0.224 3040†
rs4961 ADD1 1.97 (0.84) 0.02
rs7903146 TCF7L2 0.39 (0.73) 0.59
PEAR indicates Pharmacogenomic Evaluation of Antihypertensive Responses; SNP, single nucleotide polymorphism; -2logL, negative two log likelihood. * Generated using linear regression of change in fasting glucose during hydrochlorothiazide for all PEAR patients with adjustment for covariates used in previous models. † Indicates significant improvement of model over clinical variables alone.
Table A-5. Stepwise multivariate models for including genetic and pharmacogenetic predictor SNPs in INVEST
SNP Gene OR (95%CI)* p value* AUROC p value†
Blacks 0.853 0.25
rs7903146 TCF7L2 0.95 (0.45-2.03) 0.89
Hispanics 0.804 0.23
rs12795437 KCNJ1 1.87 (1.15-3.05) 0.01
rs7903146 TCF7L2 1.03 (0.72-1.48) 0.88
Whites 0.849 0.18
rs12795437 KCNJ1 2.44 (1.18-5.03) 0.02
rs11196228 TCF7L2 0.35 (0.14-0.59) 0.02
rs7903146 TCF7L2 1.29 (0.81-2.05) 0.29
OR indicates odds ratio; 95%CI, 95% confidence interval; AUROC, area under the receiver operating characteristic curve. * Generated using logistic regression of new onset diabetes for HCTZ treated INVEST patients by race/ethnicity with adjustment for covariates used in previous models. † p value for improvement in area under the receiver operating characteristic curve with genetic and pharmacogenetic predictors over model with clinical covariates alone

164
Figure A-1. Haploview-generated linkage disequilibrium (LD) plot of KCNJ1 SNPs in
INVEST whites. Regions of higher LD are shaded darker according to higher r2 values. The number within each box indicates the r2 value. Monomorphic SNPs are not included.

165
Figure A-2. Haploview-generated linkage disequilibrium (LD) plot of nominally significant ADD1 SNPs in PEAR non-blacks. Regions of higher LD are shaded darker according to higher r2 values. The number within each box indicates the r2 value. Monomorphic SNPs are not included.

166
Figure A-3. Haploview-generated linkage disequilibrium (LD) plot of ADD1 SNPs in INVEST whites. Regions of higher LD are shaded darker according to higher r2 values. The number within each box indicates the r2 value. Monomorphic SNPs are not included.
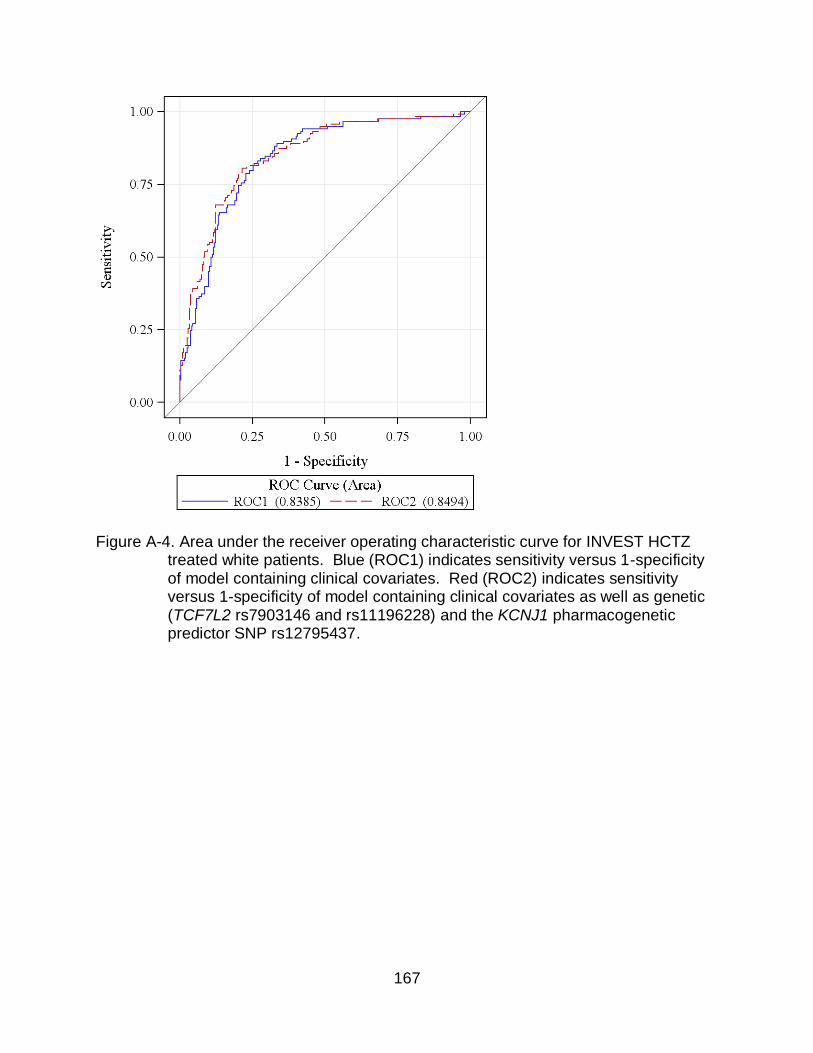
167
Figure A-4. Area under the receiver operating characteristic curve for INVEST HCTZ
treated white patients. Blue (ROC1) indicates sensitivity versus 1-specificity of model containing clinical covariates. Red (ROC2) indicates sensitivity versus 1-specificity of model containing clinical covariates as well as genetic (TCF7L2 rs7903146 and rs11196228) and the KCNJ1 pharmacogenetic predictor SNP rs12795437.

168
APPENDIX B ADDITIONAL ANALYSIS OF PEAR FOLLOW-UP STUDY DATA
Table B-1. Variables associated with LDL changes during long term thiazide treatment Independent variable Parameter
estimate (β) p value
Univariate associations (p<0.20)
Baseline FG, mg/dL 0.58 0.15
Race (white) -20.38 0.11
Waist circumference, cm 0.58 0.19
Duration of thiazide treatment, months -0.46 0.16
Statin treatment -25.30 0.07
Baseline potassium, mEq/L -21.64 0.09
Baseline LDL, mg/dL -0.52 0.002
Baseline total cholesterol, mg/dL -0.33 0.03
Baseline SBP, mmHg 0.64 0.10
Change in SBP during short term thiazide treatment, mmHg
-0.92 0.12
Baseline DBP, mmHg 1.45 0.03
Change in DBP during short term thiazide treatment, mmHg
-2.30 0.03
Stepwise Results (R2=0.31)
Baseline LDL, mg/dL -0.47 0.003
Baseline DBP, mmHg 1.23 0.04
FG indicates fasting glucose; mg/dL, milligrams per deciliter; cm, centimeters; mEq/L, milliequivalents per liter; LDL, low density lipoprotein; SBP, systolic blood pressure; mmHg, millimeters of mercury; DBP, diastolic blood pressure.

169
Table B-2. Variables associated with HDL changes during long term thiazide treatment Independent variable Parameter
estimate (β) p value
Univariate associations (p<0.20)
Beta blocker treatment -7.11 0.01
Potassium supplementation 5.78 0.20
ACEI treatment 3.95 0.18
Family history of T2D* -5.85 0.05
Statin treatment 5.86 0.08
Baseline HDL, mg/dL -0.19 0.03
Change in HDL during short term thiazide therapy, mg/dL
0.52 0.07
Baseline SBP, mmHg -0.16 0.09
Baseline DBP, mmHg -0.40 0.01
Change in DBP during short term thiazide therapy, mmHg
0.61 0.02
Stepwise Results (R2=0.79)
Beta blocker treatment -6.40 0.0001
Change in HDL during short term thiazide therapy, mg/dL
0.58 0.0003
ACEI indicates angiotensin I converting enzyme inhibitor; T2D, type 2 diabetes; HDL, high density lipoprotein; mg/dL, milligrams per deciliter; SBP, systolic blood pressure; mmHg, millimeters of mercury; DBP, diastolic blood pressure. * History of T2D for a first degree relative

170
Table B-3. Variables associated with total cholesterol changes during long term thiazide treatment
Independent variable Parameter estimate (β)
p value
Univariate associations (p<0.20)
Baseline FG, mg/dL 0.48 0.17
Race (white) -17.82 0.11
Waist circumference, cm 0.60 0.12
Duration of thiazide treatment, months -0.49 0.09
Potassium supplementation 22.60 0.16
Statin treatment -18.79 0.13
Baseline serum potassium, mEq/L -16.81 0.14
Baseline LDL, mg/dL -0.37 0.01
Baseline total cholesterol, mg/dL -0.34 0.01
Baseline SBP, mmHg 0.51 0.15
Change in SBP during short term thiazide therapy, mmHg
-0.98 0.06
Baseline DBP, mmHg 1.16 0.05
Change in DBP during short term thiazide therapy, mmHg
-2.10 0.03
Stepwise Results (R2=0.19)
Baseline total cholesterol, mg/dL -0.39 0.005
FG indicates fasting glucose; mg/dL, milligrams per deciliter; cm, centimeters; mEq/L, milliequivalents per liter; mmHg, millimeters of mercury; SBP, systolic blood pressure; DBP, diastolic blood pressure.

171
Table B-4. Variables associated with serum potassium changes during long term thiazide treatment
Independent variable Parameter estimate (β)
p value
Univariate associations (p<0.20)
Gender (female) -0.29 0.15
Age, years -0.02 0.11
Race (white) -0.61 0.002
Abdominal obesity 0.34 0.08
Current smoker 0.35 0.18
Statin treatment -0.31 0.17
Baseline serum potassium, mEq/L -0.78 <0.0001
Change in serum potassium during short term thiazide therapy, mEq/L
0.23 0.16
Baseline LDL, mg/dL -0.006 0.04
Baseline HDL, mg/dL 0.01 0.11
Baseline uric acid, mg/dL -0.09 0.17
Baseline total cholesterol, mg/dL -0.004 0.08
Baseline DBP, mmHg 0.02 0.06
Change in DBP during short term thiazide therapy, mmHg -0.04 0.04
Stepwise results (R2=0.51)
Baseline serum potassium, mEq/L -0.77 <0.0001
Current smoker 0.57 0.008
Baseline HDL, mg/dL 0.01 0.03
mEq/L indicates milliequivalents per liter; LDL, low density lipoprotein; mg/dL, milligrams per deciliter; HDL, high density lipoprotein; DBP, diastolic blood pressure.

172
Figure B-1. Mean fasting glucose after short term and long term thiazide treatment
including patients treated with anti-diabetic medications. Error bars indicate standard deviations.

173
A
B
Figure B-2. Mean fasting glucose after short term and long term thiazide treatment by add-on antihypertensive treatment including patients treated with anti-diabetic medications. A) Mean fasting glucose in beta blocker and no beta blocker treated patients. B) Mean fasting glucose in ACE inhibitor and no ACE inhibitor treated patients. Error bars indicate standard deviations.

174
A
B Figure B-3. Mean fasting glucose after short term and long term thiazide treatment by
thiazide and statin therapy. A) Mean fasting glucose in chlorthalidone versus HCTZ treated patients. B) Mean fasting glucose in statin and no statin treated patients. Error bars indicate standard deviations.

175
LIST OF REFERENCES
1. Roger VL, Go AS, Lloyd-Jones DM, et al. Executive Summary: Heart Disease and Stroke Statistics--2012 Update: A Report From the American Heart Association. Circulation 2012;125:188-97.
2. Chobanian AV, Bakris GL, Black HR, et al. The Seventh Report of the Joint National Committee on Prevention, Detection, Evaluation, and Treatment of High Blood Pressure: the JNC 7 report. JAMA 2003;289:2560-72.
3. Vasan RS, Beiser A, Seshadri S, et al. Residual lifetime risk for developing hypertension in middle-aged women and men: The Framingham Heart Study. JAMA 2002;287:1003-10.
4. Lewington S, Clarke R, Qizilbash N, Peto R, Collins R. Age-specific relevance of usual blood pressure to vascular mortality: a meta-analysis of individual data for one million adults in 61 prospective studies. Lancet 2002;360:1903-13.
5. Psaty BM, Furberg CD, Kuller LH, et al. Isolated systolic hypertension and subclinical cardiovascular disease in the elderly. Initial findings from the Cardiovascular Health Study. JAMA 1992;268:1287-91.
6. Verdecchia P, Reboldi G, Angeli F, et al. Adverse prognostic significance of new diabetes in treated hypertensive subjects. Hypertension 2004;43:963-9.
7. Vaccaro O, Eberly LE, Neaton JD, Yang L, Riccardi G, Stamler J. Impact of diabetes and previous myocardial infarction on long-term survival: 25-year mortality follow-up of primary screenees of the Multiple Risk Factor Intervention Trial. Arch Intern Med 2004;164:1438-43.
8. Zhang P, Zhang X, Brown J, et al. Global healthcare expenditure on diabetes for 2010 and 2030. Diabetes Res Clin Pract 2010;87:293-301.
9. Wild S, Roglic G, Green A, Sicree R, King H. Global prevalence of diabetes: estimates for the year 2000 and projections for 2030. Diabetes Care 2004;27:1047-53.
10. Whiting DR, Guariguata L, Weil C, Shaw J. IDF Diabetes Atlas: Global estimates of the prevalence of diabetes for 2011 and 2030. Diabetes Res Clin Pract 2011;94:311-21.
11. Shaw JE, Sicree RA, Zimmet PZ. Global estimates of the prevalence of diabetes for 2010 and 2030. Diabetes Res Clin Pract 2010;87:4-14.
12. Intensive blood-glucose control with sulphonylureas or insulin compared with conventional treatment and risk of complications in patients with type 2 diabetes (UKPDS 33). UK Prospective Diabetes Study (UKPDS) Group. Lancet 1998;352:837-53.

176
13. Effects of ramipril on cardiovascular and microvascular outcomes in people with diabetes mellitus: results of the HOPE study and MICRO-HOPE substudy. Heart Outcomes Prevention Evaluation Study Investigators. Lancet 2000;355:253-9.
14. Third Report of the National Cholesterol Education Program (NCEP) Expert Panel on Detection, Evaluation, and Treatment of High Blood Cholesterol in Adults (Adult Treatment Panel III) final report. Circulation 2002;106:3143-421.
15. Sourij H, Saely CH, Schmid F, et al. Post-challenge hyperglycaemia is strongly associated with future macrovascular events and total mortality in angiographied coronary patients. Eur Heart J 2010;31:1583-90.
16. Liu J, Grundy SM, Wang W, et al. Ten-year risk of cardiovascular incidence related to diabetes, prediabetes, and the metabolic syndrome. Am Heart J 2007;153:552-8.
17. Mozaffarian D, Kamineni A, Prineas RJ, Siscovick DS. Metabolic syndrome and mortality in older adults: the Cardiovascular Health Study. Arch Intern Med 2008;168:969-78.
18. Barr EL, Boyko EJ, Zimmet PZ, Wolfe R, Tonkin AM, Shaw JE. Continuous relationships between non-diabetic hyperglycaemia and both cardiovascular disease and all-cause mortality: the Australian Diabetes, Obesity, and Lifestyle (AusDiab) study. Diabetologia 2009;52:415-24.
19. Hyvarinen M, Qiao Q, Tuomilehto J, et al. Hyperglycemia and stroke mortality: comparison between fasting and 2-h glucose criteria. Diabetes Care 2009;32:348-54.
20. Rijkelijkhuizen JM, Nijpels G, Heine RJ, Bouter LM, Stehouwer CD, Dekker JM. High risk of cardiovascular mortality in individuals with impaired fasting glucose is explained by conversion to diabetes: the Hoorn study. Diabetes Care 2007;30:332-6.
21. Nichols GA, Hillier TA, Brown JB. Progression from newly acquired impaired fasting glusose to type 2 diabetes. Diabetes Care 2007;30:228-33.
22. Haffner SM, Mykkanen L, Festa A, Burke JP, Stern MP. Insulin-resistant prediabetic subjects have more atherogenic risk factors than insulin-sensitive prediabetic subjects: implications for preventing coronary heart disease during the prediabetic state. Circulation 2000;101:975-80.
23. Tai ES, Goh SY, Lee JJ, et al. Lowering the criterion for impaired fasting glucose: impact on disease prevalence and associated risk of diabetes and ischemic heart disease. Diabetes Care 2004;27:1728-34.

177
24. Ferrannini E, Nannipieri M, Williams K, Gonzales C, Haffner SM, Stern MP. Mode of onset of type 2 diabetes from normal or impaired glucose tolerance. Diabetes 2004;53:160-5.
25. Gerstein HC, Santaguida P, Raina P, et al. Annual incidence and relative risk of diabetes in people with various categories of dysglycemia: a systematic overview and meta-analysis of prospective studies. Diabetes Res Clin Pract 2007;78:305-12.
26. Knowler WC, Barrett-Connor E, Fowler SE, et al. Reduction in the incidence of type 2 diabetes with lifestyle intervention or metformin. N Engl J Med 2002;346:393-403.
27. Tuomilehto J, Lindstrom J, Eriksson JG, et al. Prevention of type 2 diabetes mellitus by changes in lifestyle among subjects with impaired glucose tolerance. N Engl J Med 2001;344:1343-50.
28. Garber AJ, Handelsman Y, Einhorn D, et al. Diagnosis and management of prediabetes in the continuum of hyperglycemia: when do the risks of diabetes begin? A consensus statement from the American College of Endocrinology and the American Association of Clinical Endocrinologists. Endocr Pract 2008;14:933-46.
29. Ogden LG, He J, Lydick E, Whelton PK. Long-term absolute benefit of lowering blood pressure in hypertensive patients according to the JNC VI risk stratification. Hypertension 2000;35:539-43.
30. Neal B, MacMahon S, Chapman N. Effects of ACE inhibitors, calcium antagonists, and other blood-pressure-lowering drugs: results of prospectively designed overviews of randomised trials. Blood Pressure Lowering Treatment Trialists' Collaboration. Lancet 2000;356:1955-64.
31. 2010 Top 200 generic drugs by total prescriptions. Drug Topics, 2011. (Accessed July 2, 2012, at http://drugtopics.modernmedicine.com/drugtopics/data/ articlestandard//drugtopics/252011/727243/article.pdf.)
32. Major outcomes in high-risk hypertensive patients randomized to angiotensin-converting enzyme inhibitor or calcium channel blocker vs diuretic: The Antihypertensive and Lipid-Lowering Treatment to Prevent Heart Attack Trial (ALLHAT). JAMA 2002;288:2981-97.
33. Psaty BM, Smith NL, Siscovick DS, et al. Health outcomes associated with antihypertensive therapies used as first-line agents. A systematic review and meta-analysis. JAMA 1997;277:739-45.

178
34. Hansson L, Lindholm LH, Niskanen L, et al. Effect of angiotensin-converting-enzyme inhibition compared with conventional therapy on cardiovascular morbidity and mortality in hypertension: the Captopril Prevention Project (CAPPP) randomised trial. Lancet 1999;353:611-6.
35. Brown MJ, Palmer CR, Castaigne A, et al. Morbidity and mortality in patients randomised to double-blind treatment with a long-acting calcium-channel blocker or diuretic in the International Nifedipine GITS study: Intervention as a Goal in Hypertension Treatment (INSIGHT). Lancet 2000;356:366-72.
36. Hansson L, Hedner T, Lund-Johansen P, et al. Randomised trial of effects of calcium antagonists compared with diuretics and beta-blockers on cardiovascular morbidity and mortality in hypertension: the Nordic Diltiazem (NORDIL) study. Lancet 2000;356:359-65.
37. Hansson L, Lindholm LH, Ekbom T, et al. Randomised trial of old and new antihypertensive drugs in elderly patients: cardiovascular mortality and morbidity the Swedish Trial in Old Patients with Hypertension-2 study. Lancet 1999;354:1751-6.
38. Malacco E, Mancia G, Rappelli A, Menotti A, Zuccaro MS, Coppini A. Treatment of isolated systolic hypertension: the SHELL study results. Blood Press 2003;12:160-7.
39. Zanchetti A, Rosei EA, Dal Palu C, Leonetti G, Magnani B, Pessina A. The Verapamil in Hypertension and Atherosclerosis Study (VHAS): results of long-term randomized treatment with either verapamil or chlorthalidone on carotid intima-media thickness. J Hypertens 1998;16:1667-76.
40. Thompson AM, Hu T, Eshelbrenner CL, Reynolds K, He J, Bazzano LA. Antihypertensive treatment and secondary prevention of cardiovascular disease events among persons without hypertension: a meta-analysis. JAMA 2011;305:913-22.
41. Turnbull F. Effects of different blood-pressure-lowering regimens on major cardiovascular events: results of prospectively-designed overviews of randomised trials. Lancet 2003;362:1527-35.
42. Wing LM, Reid CM, Ryan P, et al. A comparison of outcomes with angiotensin-converting--enzyme inhibitors and diuretics for hypertension in the elderly. N Engl J Med 2003;348:583-92.
43. Jamerson K, Weber MA, Bakris GL, et al. Benazepril plus amlodipine or hydrochlorothiazide for hypertension in high-risk patients. N Engl J Med 2008;359:2417-28.

179
44. Mancia G, De Backer G, Dominiczak A, et al. 2007 Guidelines for the management of arterial hypertension: The Task Force for the Management of Arterial Hypertension of the European Society of Hypertension (ESH) and of the European Society of Cardiology (ESC). Eur Heart J 2007;28:1462-536.
45. Rosendorff C, Black HR, Cannon CP, et al. Treatment of hypertension in the prevention and management of ischemic heart disease: a scientific statement from the American Heart Association Council for High Blood Pressure Research and the Councils on Clinical Cardiology and Epidemiology and Prevention. Circulation 2007;115:2761-88.
46. Carter BL, Einhorn PT, Brands M, et al. Thiazide-induced dysglycemia: call for research from a working group from the national heart, lung, and blood institute. Hypertension 2008;52:30-6.
47. Elliott WJ, Meyer PM. Incident diabetes in clinical trials of antihypertensive drugs: a network meta-analysis. Lancet 2007;369:201-7.
48. Aksnes TA, Kjeldsen SE, Rostrup M, Storset O, Hua TA, Julius S. Predictors of new-onset diabetes mellitus in hypertensive patients: the VALUE trial. J Hum Hypertens 2008;22:520-7.
49. Barzilay JI, Davis BR, Cutler JA, et al. Fasting glucose levels and incident diabetes mellitus in older nondiabetic adults randomized to receive 3 different classes of antihypertensive treatment: a report from the Antihypertensive and Lipid-Lowering Treatment to Prevent Heart Attack Trial (ALLHAT). Arch Intern Med 2006;166:2191-201.
50. Cooper-Dehoff R, Cohen JD, Bakris GL, et al. Predictors of development of diabetes mellitus in patients with coronary artery disease taking antihypertensive medications (findings from the INternational VErapamil SR-Trandolapril STudy [INVEST]). Am J Cardiol 2006;98:890-4.
51. Gupta AK, Dahlof B, Dobson J, Sever PS, Wedel H, Poulter NR. Determinants of new-onset diabetes among 19,257 hypertensive patients randomized in the Anglo-Scandinavian Cardiac Outcomes Trial--Blood Pressure Lowering Arm and the relative influence of antihypertensive medication. Diabetes Care 2008;31:982-8.
52. Pepine CJ, Cooper-Dehoff RM. Cardiovascular therapies and risk for development of diabetes. J Am Coll Cardiol 2004;44:509-12.
53. Karnes JH, Cooper-DeHoff RM. Antihypertensive medications: benefits of blood pressure lowering and hazards of metabolic effects. Expert Rev Cardiovasc Ther 2009;7:689-702.
54. Bangalore S, Parkar S, Grossman E, Messerli FH. A meta-analysis of 94,492 patients with hypertension treated with beta blockers to determine the risk of new-onset diabetes mellitus. Am J Cardiol 2007;100:1254-62.

180
55. Abuissa H, Jones PG, Marso SP, O'Keefe JH, Jr. Angiotensin-converting enzyme inhibitors or angiotensin receptor blockers for prevention of type 2 diabetes: a meta-analysis of randomized clinical trials. J Am Coll Cardiol 2005;46:821-6.
56. Gillespie EL, White CM, Kardas M, Lindberg M, Coleman CI. The impact of ACE inhibitors or angiotensin II type 1 receptor blockers on the development of new-onset type 2 diabetes. Diabetes Care 2005;28:2261-6.
57. Opie LH, Schall R. Old antihypertensives and new diabetes. J Hypertens 2004;22:1453-8.
58. Scheen AJ. Renin-angiotensin system inhibition prevents type 2 diabetes mellitus. Part 1. A meta-analysis of randomised clinical trials. Diabetes Metab 2004;30:487-96.
59. Moser M. Is new-onset diabetes of clinical significance in treated hypertensive patients?--Con. J Clin Hypertens (Greenwich) 2006;8:126-32.
60. Alderman MH. New onset diabetes during antihypertensive therapy. Am J Hypertens 2008;21:493-9.
61. Alderman MH, Cohen H, Madhavan S. Diabetes and cardiovascular events in hypertensive patients. Hypertension 1999;33:1130-4.
62. Samuelsson O, Pennert K, Andersson O, et al. Diabetes mellitus and raised serum triglyceride concentration in treated hypertension--are they of prognostic importance? Observational study. BMJ 1996;313:660-3.
63. Aksnes TA, Kjeldsen SE, Rostrup M, Omvik P, Hua TA, Julius S. Impact of new-onset diabetes mellitus on cardiac outcomes in the Valsartan Antihypertensive Long-term Use Evaluation (VALUE) trial population. Hypertension 2007;50:467-73.
64. Almgren T, Wilhelmsen L, Samuelsson O, Himmelmann A, Rosengren A, Andersson OK. Diabetes in treated hypertension is common and carries a high cardiovascular risk: results from a 28-year follow-up. J Hypertens 2007;25:1311-7.
65. Dunder K, Lind L, Zethelius B, Berglund L, Lithell H. Increase in blood glucose concentration during antihypertensive treatment as a predictor of myocardial infarction: population based cohort study. BMJ 2003;326:681.
66. Eberly LE, Cohen JD, Prineas R, Yang L. Impact of incident diabetes and incident nonfatal cardiovascular disease on 18-year mortality: the multiple risk factor intervention trial experience. Diabetes Care 2003;26:848-54.
67. Kostis JB, Wilson AC, Freudenberger RS, Cosgrove NM, Pressel SL, Davis BR. Long-term effect of diuretic-based therapy on fatal outcomes in subjects with isolated systolic hypertension with and without diabetes. Am J Cardiol 2005;95:29-35.

181
68. Duarte JD, Cooper-DeHoff RM. Mechanisms for blood pressure lowering and metabolic effects of thiazide and thiazide-like diuretics. Expert Rev Cardiovasc Ther 2010;8:793-802.
69. Conway J, Lauwers P. Hemodynamic and hypotensive effects of long-term therapy with chlorothiazide. Circulation 1960;21:21-7.
70. Kurtz TW, Pravenec M. Antidiabetic mechanisms of angiotensin-converting enzyme inhibitors and angiotensin II receptor antagonists: beyond the renin-angiotensin system. J Hypertens 2004;22:2253-61.
71. Lindholm LH, Ibsen H, Borch-Johnsen K, et al. Risk of new-onset diabetes in the Losartan Intervention For Endpoint reduction in hypertension study. J Hypertens 2002;20:1879-86.
72. Masuo K, Kawaguchi H, Mikami H, Ogihara T, Tuck ML. Serum uric acid and plasma norepinephrine concentrations predict subsequent weight gain and blood pressure elevation. Hypertension 2003;42:474-80.
73. Nakanishi N, Okamoto M, Yoshida H, Matsuo Y, Suzuki K, Tatara K. Serum uric acid and risk for development of hypertension and impaired fasting glucose or Type II diabetes in Japanese male office workers. Eur J Epidemiol 2003;18:523-30.
74. Dehghan A, van Hoek M, Sijbrands EJ, Hofman A, Witteman JC. High serum uric acid as a novel risk factor for type 2 diabetes. Diabetes Care 2008;31:361-2.
75. Shafi T, Appel LJ, Miller ER, 3rd, Klag MJ, Parekh RS. Changes in serum potassium mediate thiazide-induced diabetes. Hypertension 2008;52:1022-9.
76. Zillich AJ, Garg J, Basu S, Bakris GL, Carter BL. Thiazide diuretics, potassium, and the development of diabetes: a quantitative review. Hypertension 2006;48:219-24.
77. Braun M, Ramracheya R, Bengtsson M, et al. Voltage-gated ion channels in human pancreatic beta-cells: electrophysiological characterization and role in insulin secretion. Diabetes 2008;57:1618-28.
78. Chatterjee R, Yeh HC, Shafi T, et al. Serum and dietary potassium and risk of incident type 2 diabetes mellitus: The Atherosclerosis Risk in Communities (ARIC) study. Arch Intern Med 2010;170:1745-51.
79. Smith SM, Anderson SD, Wen S, et al. Lack of correlation between thiazide-induced hyperglycemia and hypokalemia: subgroup analysis of results from the pharmacogenomic evaluation of antihypertensive responses (PEAR) study. Pharmacotherapy 2009;29:1157-65.

182
80. Herder C, Roden M. Genetics of type 2 diabetes: pathophysiologic and clinical relevance. Eur J Clin Invest 2011;41:679-92.
81. Barroso I. Genetics of Type 2 diabetes. Diabet Med 2005;22:517-35.
82. Meigs JB, Cupples LA, Wilson PW. Parental transmission of type 2 diabetes: the Framingham Offspring Study. Diabetes 2000;49:2201-7.
83. Pierce M, Keen H, Bradley C. Risk of diabetes in offspring of parents with non-insulin-dependent diabetes. Diabet Med 1995;12:6-13.
84. Groop L, Forsblom C, Lehtovirta M, et al. Metabolic consequences of a family history of NIDDM (the Botnia study): evidence for sex-specific parental effects. Diabetes 1996;45:1585-93.
85. Poulsen P, Kyvik KO, Vaag A, Beck-Nielsen H. Heritability of type II (non-insulin-dependent) diabetes mellitus and abnormal glucose tolerance--a population-based twin study. Diabetologia 1999;42:139-45.
86. Poulsen P, Grunnet LG, Pilgaard K, et al. Increased risk of type 2 diabetes in elderly twins. Diabetes 2009;58:1350-5.
87. Medici F, Hawa M, Ianari A, Pyke DA, Leslie RD. Concordance rate for type II diabetes mellitus in monozygotic twins: actuarial analysis. Diabetologia 1999;42:146-50.
88. Lyssenko V, Almgren P, Anevski D, et al. Predictors of and longitudinal changes in insulin sensitivity and secretion preceding onset of type 2 diabetes. Diabetes 2005;54:166-74.
89. Kaprio J, Tuomilehto J, Koskenvuo M, et al. Concordance for type 1 (insulin-dependent) and type 2 (non-insulin-dependent) diabetes mellitus in a population-based cohort of twins in Finland. Diabetologia 1992;35:1060-7.
90. Newman B, Selby JV, King MC, Slemenda C, Fabsitz R, Friedman GD. Concordance for type 2 (non-insulin-dependent) diabetes mellitus in male twins. Diabetologia 1987;30:763-8.
91. Grant SF, Thorleifsson G, Reynisdottir I, et al. Variant of transcription factor 7-like 2 (TCF7L2) gene confers risk of type 2 diabetes. Nat Genet 2006;38:320-3.
92. Genome-wide association study of 14,000 cases of seven common diseases and 3,000 shared controls. Nature 2007;447:661-78.
93. Ahlqvist E, Ahluwalia TS, Groop L. Genetics of type 2 diabetes. Clin Chem 2011;57:241-54.

183
94. Sladek R, Rocheleau G, Rung J, et al. A genome-wide association study identifies novel risk loci for type 2 diabetes. Nature 2007;445:881-5.
95. Voight BF, Scott LJ, Steinthorsdottir V, et al. Twelve type 2 diabetes susceptibility loci identified through large-scale association analysis. Nat Genet 2010;42:579-89.
96. van Hoek M, Dehghan A, Witteman JC, et al. Predicting type 2 diabetes based on polymorphisms from genome-wide association studies: a population-based study. Diabetes 2008;57:3122-8.
97. Talmud PJ, Hingorani AD, Cooper JA, et al. Utility of genetic and non-genetic risk factors in prediction of type 2 diabetes: Whitehall II prospective cohort study. BMJ 2010;340:b4838.
98. Tong Y, Lin Y, Zhang Y, Yang J, Liu H, Zhang B. Association between TCF7L2 gene polymorphisms and susceptibility to type 2 diabetes mellitus: a large Human Genome Epidemiology (HuGE) review and meta-analysis. BMC Med Genet 2009;10:15.
99. Florez JC, Jablonski KA, Bayley N, et al. TCF7L2 polymorphisms and progression to diabetes in the Diabetes Prevention Program. N Engl J Med 2006;355:241-50.
100. Helgason A, Palsson S, Thorleifsson G, et al. Refining the impact of TCF7L2 gene variants on type 2 diabetes and adaptive evolution. Nat Genet 2007;39:218-25.
101. Cauchi S, El Achhab Y, Choquet H, et al. TCF7L2 is reproducibly associated with type 2 diabetes in various ethnic groups: a global meta-analysis. J Mol Med 2007;85:777-82.
102. Rosenberg NA, Huang L, Jewett EM, Szpiech ZA, Jankovic I, Boehnke M. Genome-wide association studies in diverse populations. Nat Rev Genet 2010;11:356-66.
103. Humphries SE, Gable D, Cooper JA, et al. Common variants in the TCF7L2 gene and predisposition to type 2 diabetes in UK European Whites, Indian Asians and Afro-Caribbean men and women. J Mol Med 2006;84:1005-14.
104. Elbein SC, Chu WS, Das SK, et al. Transcription factor 7-like 2 polymorphisms and type 2 diabetes, glucose homeostasis traits and gene expression in US participants of European and African descent. Diabetologia 2007;50:1621-30.
105. Yan Y, North KE, Heiss G, et al. Transcription factor 7-like 2 (TCF7L2) polymorphism and context-specific risk of impaired fasting glucose in African American and Caucasian adults: the atherosclerosis risk in communities (ARIC) study. Diabetes Metab Res Rev 2010;26:371-7.
106. Parra EJ, Cameron E, Simmonds L, et al. Association of TCF7L2 polymorphisms with type 2 diabetes in Mexico City. Clin Genet 2007;71:359-66.

184
107. Lehman DM, Hunt KJ, Leach RJ, et al. Haplotypes of transcription factor 7-like 2 (TCF7L2) gene and its upstream region are associated with type 2 diabetes and age of onset in Mexican Americans. Diabetes 2007;56:389-93.
108. Sale MM, Smith SG, Mychaleckyj JC, et al. Variants of the transcription factor 7-like 2 (TCF7L2) gene are associated with type 2 diabetes in an African-American population enriched for nephropathy. Diabetes 2007;56:2638-42.
109. Palmer ND, Hester JM, An SS, et al. Resequencing and analysis of variation in the TCF7L2 gene in African Americans suggests that SNP rs7903146 is the causal diabetes susceptibility variant. Diabetes 2011;60:662-8.
110. Waters KM, Stram DO, Hassanein MT, et al. Consistent association of type 2 diabetes risk variants found in europeans in diverse racial and ethnic groups. PLoS Genet 2010;6.
111. Davey Smith G, Bracha Y, Svendsen KH, Neaton JD, Haffner SM, Kuller LH. Incidence of type 2 diabetes in the randomized multiple risk factor intervention trial. Ann Intern Med 2005;142:313-22.
112. Bozkurt O, de Boer A, Grobbee DE, et al. Variation in Renin-Angiotensin system and salt-sensitivity genes and the risk of diabetes mellitus associated with the use of thiazide diuretics. Am J Hypertens 2009;22:545-51.
113. Irvin MR, Lynch AI, Kabagambe EK, et al. Pharmacogenetic association of hypertension candidate genes with fasting glucose in the GenHAT Study. J Hypertens 2010;28:2076-83.
114. Maitland-van der Zee AH, Turner ST, Schwartz GL, Chapman AB, Klungel OH, Boerwinkle E. Demographic, environmental, and genetic predictors of metabolic side effects of hydrochlorothiazide treatment in hypertensive subjects. Am J Hypertens 2005;18:1077-83.
115. Altshuler DM, Gibbs RA, Peltonen L, et al. Integrating common and rare genetic variation in diverse human populations. Nature 2010;467:52-8.
116. Propranolol or hydrochlorothiazide alone for the initial treatment of hypertension. IV. Effect on plasma glucose and glucose tolerance. Veterans Administration Cooperative Study Group on Antihypertensive Agents. Hypertension 1985;7:1008-16.
117. Johnson JA, Boerwinkle E, Zineh I, et al. Pharmacogenomics of antihypertensive drugs: rationale and design of the Pharmacogenomic Evaluation of Antihypertensive Responses (PEAR) study. Am Heart J 2009;157:442-9.
118. Cooper-DeHoff RM, Wen S, Beitelshees AL, et al. Impact of abdominal obesity on incidence of adverse metabolic effects associated with antihypertensive medications. Hypertension 2010;55:61-8.

185
119. Diagnosis and classification of diabetes mellitus. Diabetes Care 2012;35 Suppl 1:S64-71.
120. Hu FB, Stampfer MJ, Haffner SM, Solomon CG, Willett WC, Manson JE. Elevated risk of cardiovascular disease prior to clinical diagnosis of type 2 diabetes. Diabetes Care 2002;25:1129-34.
121. Meigs JB, Nathan DM, D'Agostino RB, Sr., Wilson PW. Fasting and postchallenge glycemia and cardiovascular disease risk: the Framingham Offspring Study. Diabetes Care 2002;25:1845-50.
122. Tominaga M, Eguchi H, Manaka H, Igarashi K, Kato T, Sekikawa A. Impaired glucose tolerance is a risk factor for cardiovascular disease, but not impaired fasting glucose. The Funagata Diabetes Study. Diabetes Care 1999;22:920-4.
123. Glucose tolerance and mortality: comparison of WHO and American Diabetes Association diagnostic criteria. The DECODE study group. European Diabetes Epidemiology Group. Diabetes Epidemiology: Collaborative analysis Of Diagnostic criteria in Europe. Lancet 1999;354:617-21.
124. Glucose tolerance and cardiovascular mortality: comparison of fasting and 2-hour diagnostic criteria. Arch Intern Med 2001;161:397-405.
125. Qiao Q, Pyorala K, Pyorala M, et al. Two-hour glucose is a better risk predictor for incident coronary heart disease and cardiovascular mortality than fasting glucose. Eur Heart J 2002;23:1267-75.
126. Will new diagnostic criteria for diabetes mellitus change phenotype of patients with diabetes? Reanalysis of European epidemiological data. DECODE Study Group on behalf of the European Diabetes Epidemiology Study Group. BMJ 1998;317:371-5.
127. Selvin E, Steffes MW, Zhu H, et al. Glycated hemoglobin, diabetes, and cardiovascular risk in nondiabetic adults. N Engl J Med 2010;362:800-11.
128. Abdul-Ghani MA, Tripathy D, DeFronzo RA. Contributions of beta-cell dysfunction and insulin resistance to the pathogenesis of impaired glucose tolerance and impaired fasting glucose. Diabetes Care 2006;29:1130-9.
129. Matsuda M, DeFronzo RA. Insulin sensitivity indices obtained from oral glucose tolerance testing: comparison with the euglycemic insulin clamp. Diabetes Care 1999;22:1462-70.
130. Matthews DR, Hosker JP, Rudenski AS, Naylor BA, Treacher DF, Turner RC. Homeostasis model assessment: insulin resistance and beta-cell function from fasting plasma glucose and insulin concentrations in man. Diabetologia 1985;28:412-9.
186
131. Sherwin RS, Anderson RM, Buse JB, et al. Prevention or delay of type 2 diabetes. Diabetes Care 2004;27 Suppl 1:S47-54.
132. Weber MB, Narayan KM. Diabetes prevention should be a public-health priority. Lancet 2008;371:473-4.
133. Wilson PW, Meigs JB, Sullivan L, Fox CS, Nathan DM, D'Agostino RB, Sr. Prediction of incident diabetes mellitus in middle-aged adults: the Framingham Offspring Study. Arch Intern Med 2007;167:1068-74.
134. Palmer ND, McDonough CW, Hicks PJ, et al. A genome-wide association search for type 2 diabetes genes in African Americans. PLoS One 2012;7:e29202.
135. Gaulton KJ, Nammo T, Pasquali L, et al. A map of open chromatin in human pancreatic islets. Nat Genet 2010;42:255-9.
136. de Miguel-Yanes JM, Shrader P, Pencina MJ, et al. Genetic risk reclassification for type 2 diabetes by age below or above 50 years using 40 type 2 diabetes risk single nucleotide polymorphisms. Diabetes Care 2011;34:121-5.
137. Pepine CJ, Handberg-Thurmond E, Marks RG, et al. Rationale and design of the International Verapamil SR/Trandolapril Study (INVEST): an Internet-based randomized trial in coronary artery disease patients with hypertension. J Am Coll Cardiol 1998;32:1228-37.
138. Pepine CJ, Handberg EM, Cooper-DeHoff RM, et al. A calcium antagonist vs a non-calcium antagonist hypertension treatment strategy for patients with coronary artery disease. The International Verapamil-Trandolapril Study (INVEST): a randomized controlled trial. JAMA 2003;290:2805-16.
139. The sixth report of the Joint National Committee on prevention, detection, evaluation, and treatment of high blood pressure. Arch Intern Med 1997;157:2413-46.
140. Andrisin TE, Humma LM, Johnson JA. Collection of genomic DNA by the noninvasive mouthwash method for use in pharmacogenetic studies. Pharmacotherapy 2002;22:954-60.
141. Dreszer TR, Karolchik D, Zweig AS, et al. The UCSC Genome Browser database: extensions and updates 2011. Nucleic Acids Res 2012;40:D918-23.
142. Howie BN, Carlson CS, Rieder MJ, Nickerson DA. Efficient selection of tagging single-nucleotide polymorphisms in multiple populations. Hum Genet 2006;120:58-68.
143. Conde L, Vaquerizas JM, Dopazo H, et al. PupaSuite: finding functional single nucleotide polymorphisms for large-scale genotyping purposes. Nucleic Acids Res 2006;34:W621-5.

187
144. Chelala C, Khan A, Lemoine NR. SNPnexus: a web database for functional annotation of newly discovered and public domain single nucleotide polymorphisms. Bioinformatics 2009;25:655-61.
145. Kumar P, Henikoff S, Ng PC. Predicting the effects of coding non-synonymous variants on protein function using the SIFT algorithm. Nat Protoc 2009;4:1073-81.
146. Price AL, Patterson NJ, Plenge RM, Weinblatt ME, Shadick NA, Reich D. Principal components analysis corrects for stratification in genome-wide association studies. Nat Genet 2006;38:904-9.
147. Barrett JC, Fry B, Maller J, Daly MJ. Haploview: analysis and visualization of LD and haplotype maps. Bioinformatics 2005;21:263-5.
148. Gabriel SB, Schaffner SF, Nguyen H, et al. The structure of haplotype blocks in the human genome. Science 2002;296:2225-9.
149. Keating BJ, Tischfield S, Murray SS, et al. Concept, design and implementation of a cardiovascular gene-centric 50 k SNP array for large-scale genomic association studies. PLoS One 2008;3:e3583.
150. Purcell S, Neale B, Todd-Brown K, et al. PLINK: a tool set for whole-genome association and population-based linkage analyses. Am J Hum Genet 2007;81:559-75.
151. Hochberg Y, Benjamini Y. More powerful procedures for multiple significance testing. Stat Med 1990;9:811-8.
152. The International HapMap Project. Nature 2003;426:789-96.
153. Zeggini E, Weedon MN, Lindgren CM, et al. Replication of genome-wide association signals in UK samples reveals risk loci for type 2 diabetes. Science 2007;316:1336-41.
154. Scott LJ, Bonnycastle LL, Willer CJ, et al. Association of transcription factor 7-like 2 (TCF7L2) variants with type 2 diabetes in a Finnish sample. Diabetes 2006;55:2649-53.
155. Ruchat SM, Elks CE, Loos RJ, et al. Evidence of interaction between type 2 diabetes susceptibility genes and dietary fat intake for adiposity and glucose homeostasis-related phenotypes. J Nutrigenet Nutrigenomics 2009;2:225-34.
156. Saxena R, Hivert MF, Langenberg C, et al. Genetic variation in GIPR influences the glucose and insulin responses to an oral glucose challenge. Nat Genet 2010;42:142-8.
188
157. Sousa AG, Marquezine GF, Lemos PA, et al. TCF7L2 polymorphism rs7903146 is associated with coronary artery disease severity and mortality. PLoS One 2009;4:e7697.
158. Cowie CC, Rust KF, Ford ES, et al. Full accounting of diabetes and pre-diabetes in the U.S. population in 1988-1994 and 2005-2006. Diabetes Care 2009;32:287-94.
159. Muendlein A, Saely CH, Geller-Rhomberg S, et al. Single nucleotide polymorphisms of TCF7L2 are linked to diabetic coronary atherosclerosis. PLoS One 2011;6:e17978.
160. Macfarlane DP, Paterson KR, Fisher M. Cardiovascular drugs as antidiabetic agents: evidence for the prevention of type 2 diabetes. Diabetes Obes Metab 2008;10:533-44.
161. Welling PA, Ho K. A comprehensive guide to the ROMK potassium channel: form and function in health and disease. Am J Physiol Renal Physiol 2009;297:F849-63.
162. Lanzani C, Citterio L, Jankaricova M, et al. Role of the adducin family genes in human essential hypertension. J Hypertens 2005;23:543-9.
163. Matsuoka Y, Li X, Bennett V. Adducin: structure, function and regulation. Cell Mol Life Sci 2000;57:884-95.
164. Barlassina C, Schork NJ, Manunta P, et al. Synergistic effect of alpha-adducin and ACE genes causes blood pressure changes with body sodium and volume expansion. Kidney Int 2000;57:1083-90.
165. Psaty BM, Smith NL, Heckbert SR, et al. Diuretic therapy, the alpha-adducin gene variant, and the risk of myocardial infarction or stroke in persons with treated hypertension. JAMA 2002;287:1680-9.
166. Davis BR, Arnett DK, Boerwinkle E, et al. Antihypertensive therapy, the alpha-adducin polymorphism, and cardiovascular disease in high-risk hypertensive persons: the Genetics of Hypertension-Associated Treatment Study. Pharmacogenomics J 2007;7:112-22.
167. Gerhard T, Gong Y, Beitelshees AL, et al. Alpha-adducin polymorphism associated with increased risk of adverse cardiovascular outcomes: results from GENEtic Substudy of the INternational VErapamil SR-trandolapril STudy (INVEST-GENES). Am Heart J 2008;156:397-404.
168. Cooper-DeHoff RM, Handberg EM, Mancia G, et al. INVEST revisited: review of findings from the International Verapamil SR-Trandolapril Study. Expert Rev Cardiovasc Ther 2009;7:1329-40.

189
169. De la Vega FM, Lazaruk KD, Rhodes MD, Wenz MH. Assessment of two flexible and compatible SNP genotyping platforms: TaqMan SNP Genotyping Assays and the SNPlex Genotyping System. Mutat Res 2005;573:111-35.
170. Chapman AB, Schwartz GL, Boerwinkle E, Turner ST. Predictors of antihypertensive response to a standard dose of hydrochlorothiazide for essential hypertension. Kidney Int 2002;61:1047-55.
171. Glenn KL, Du ZQ, Eisenmann JC, Rothschild MF. An alternative method for genotyping of the ACE I/D polymorphism. Mol Biol Rep 2009;36:1305-10.
172. Dupuis J, Langenberg C, Prokopenko I, et al. New genetic loci implicated in fasting glucose homeostasis and their impact on type 2 diabetes risk. Nat Genet 2010;42:105-16.
173. Tobin MD, Tomaszewski M, Braund PS, et al. Common variants in genes underlying monogenic hypertension and hypotension and blood pressure in the general population. Hypertension 2008;51:1658-64.
174. Ji W, Foo JN, O'Roak BJ, et al. Rare independent mutations in renal salt handling genes contribute to blood pressure variation. Nat Genet 2008;40:592-9.
175. Bailey SD, Xie C, Do R, et al. Variation at the NFATC2 locus increases the risk of thiazolidinedione-induced edema in the Diabetes REduction Assessment with ramipril and rosiglitazone Medication (DREAM) study. Diabetes Care 2010;33:2250-3.
176. Simon DB, Karet FE, Rodriguez-Soriano J, et al. Genetic heterogeneity of Bartter's syndrome revealed by mutations in the K+ channel, ROMK. Nat Genet 1996;14:152-6.
177. Gupta AK, Poulter NR, Dobson J, et al. Ethnic differences in blood pressure response to first and second-line antihypertensive therapies in patients randomized in the ASCOT Trial. Am J Hypertens 2010;23:1023-30.
178. Johnson JA, Gong Y, Bailey KR, et al. Hydrochlorothiazide and atenolol combination antihypertensive therapy: effects of drug initiation order. Clin Pharmacol Ther 2009;86:533-9.
179. Villard E, Tiret L, Visvikis S, Rakotovao R, Cambien F, Soubrier F. Identification of new polymorphisms of the angiotensin I-converting enzyme (ACE) gene, and study of their relationship to plasma ACE levels by two-QTL segregation-linkage analysis. Am J Hum Genet 1996;58:1268-78.
180. Lloyd-Jones DM, Evans JC, Larson MG, O'Donnell CJ, Wilson PW, Levy D. Cross-classification of JNC VI blood pressure stages and risk groups in the Framingham Heart Study. Arch Intern Med 1999;159:2206-12.

190
181. MacMahon SW, Macdonald GJ, Blacket RB. Plasma lipoprotein levels in treated and untreated hypertensive men and women. The National Heart Foundation of Australia Risk Factor Prevalence Study. Arteriosclerosis 1985;5:391-6.
182. Executive Summary of The Third Report of The National Cholesterol Education Program (NCEP) Expert Panel on Detection, Evaluation, And Treatment of High Blood Cholesterol In Adults (Adult Treatment Panel III). JAMA 2001;285:2486-97.
183. McMahan CA, Gidding SS, Fayad ZA, et al. Risk scores predict atherosclerotic lesions in young people. Arch Intern Med 2005;165:883-90.
184. Rajala U, Qiao Q, Laakso M, Keinanen-Kiukaanniemi S. Antihypertensive drugs as predictors of type 2 diabetes among subjects with impaired glucose tolerance. Diabetes Res Clin Pract 2000;50:231-9.
185. Gami AS, Witt BJ, Howard DE, et al. Metabolic syndrome and risk of incident cardiovascular events and death: a systematic review and meta-analysis of longitudinal studies. J Am Coll Cardiol 2007;49:403-14.
186. Nandeesha H, Pavithran P, Madanmohan T. Effect of antihypertensive therapy on serum lipids in newly diagnosed essential hypertensive men. Angiology 2009;60:217-20.
187. Lee JM, Kim HC, Cho HM, Oh SM, Choi DP, Suh I. Association between serum uric Acid level and metabolic syndrome. J Prev Med Public Health 2012;45:181-7.
188. Chuang HH, Li WC, Sheu BF, et al. Correlation between body composition and risk factors for cardiovascular disease and metabolic syndrome. Biofactors 2012.
189. Niskanen LK, Laaksonen DE, Nyyssonen K, et al. Uric acid level as a risk factor for cardiovascular and all-cause mortality in middle-aged men: a prospective cohort study. Arch Intern Med 2004;164:1546-51.
190. Lind L, Pollare T, Berne C, Lithell H. Long-term metabolic effects of antihypertensive drugs. Am Heart J 1994;128:1177-83.
191. Yeboah J, Bertoni AG, Herrington DM, Post WS, Burke GL. Impaired fasting glucose and the risk of incident diabetes mellitus and cardiovascular events in an adult population: MESA (Multi-Ethnic Study of Atherosclerosis). J Am Coll Cardiol 2011;58:140-6.
192. DeFronzo RA, Abdul-Ghani M. Assessment and treatment of cardiovascular risk in prediabetes: impaired glucose tolerance and impaired fasting glucose. Am J Cardiol 2011;108:3B-24B.
193. Tamita K, Katayama M, Takagi T, et al. Newly diagnosed glucose intolerance and prognosis after acute myocardial infarction: comparison of post-challenge versus fasting glucose concentrations. Heart 2012;98:848-54.

191
194. Abdul-Ghani MA, Abdul-Ghani T, Ali N, Defronzo RA. One-hour plasma glucose concentration and the metabolic syndrome identify subjects at high risk for future type 2 diabetes. Diabetes Care 2008;31:1650-5.
195. Strandberg TE, Pienimaki T, Strandberg AY, et al. One-hour glucose, mortality, and risk of diabetes: a 44-year prospective study in men. Arch Intern Med 2011;171:941-3.
196. Sainaghi PP, Castello L, Limoncini AM, Bergamasco L, Bartoli E, Schianca GP. Poor specificity of fasting plasma glucose cut-off values in ruling out glucose intolerance: the complementary usefulness of OGTT. Exp Clin Endocrinol Diabetes 2007;115:112-7.
197. Harris PA, Taylor R, Thielke R, Payne J, Gonzalez N, Conde JG. Research electronic data capture (REDCap)--a metadata-driven methodology and workflow process for providing translational research informatics support. J Biomed Inform 2009;42:377-81.
198. Peterzan MA, Hardy R, Chaturvedi N, Hughes AD. Meta-analysis of dose-response relationships for hydrochlorothiazide, chlorthalidone, and bendroflumethiazide on blood pressure, serum potassium, and urate. Hypertension 2012;59:1104-9.
199. Roush GC, Holford TR, Guddati AK. Chlorthalidone compared with hydrochlorothiazide in reducing cardiovascular events: systematic review and network meta-analyses. Hypertension 2012;59:1110-7.
200. Bakris G, Molitch M, Zhou Q, et al. Reversal of diuretic-associated impaired glucose tolerance and new-onset diabetes: results of the STAR-LET study. J Cardiometab Syndr 2008;3:18-25.
201. Stears AJ, Woods SH, Watts MM, et al. A double-blind, placebo-controlled, crossover trial comparing the effects of amiloride and hydrochlorothiazide on glucose tolerance in patients with essential hypertension. Hypertension 2012;59:934-42.

192
BIOGRAPHICAL SKETCH
Jason Hansen Karnes was born in Gainesville, Florida and grew up in Richmond,
VA. He graduated from the Maggie Walker Governor’s School for Government and
International Studies in 2000. He then attended the College of William and Mary in
Williamsburg, Virginia and graduated with a Bachelor of Arts degree in ancient Greek
language and literature in 2004. Jason then returned to Gainesville to study clinical
pharmacotherapy at the University of Florida and graduated with a Doctor of Pharmacy
degree cum laude in 2008. Jason has authored multiple peer-reviewed manuscripts
and presented research at multiple national meetings. After defending his dissertation,
Jason plans to move to Nashville, Tennessee in 2012 to complete a postdoctoral
fellowship with the Vanderbilt University School of Medicine at the Division of Clinical
Pharmacology. Jason plans to pursue an academic career in clinical and translational
pharmacogenomics.