updating the study of pharmacogenetic polymorphisms in the portuguese … · updating the study of...
TRANSCRIPT

Updating the study of pharmacogenetic polymorphisms in the Portuguese Roma
Joel Fernando Reis Pedrosa
Mestrado em Genética Forense Departamento de Biologia 2016
Orientador Professora Doutora Maria João Prata Martins Ribeiro, Professora Associada com Agregação na Faculdade de Ciências da Universidade do Porto e Investigadora no Instituto de Investigação e Inovação da Universidade do Porto


FCUP 3 Updating the study of pharmacogenetic polymorphisms in the Portuguese Roma
Acknowledgments
First of all, I would like to express my gratitude to my thesis advisor Professor
Maria João Prata, Associate Professor with aggregation at the Department of Biology of
Faculty of Sciences of University of Porto and senior researcher at the Population
Genetics group at i3S. The door to Professor Prata’s office was always open whenever
I ended up in a dead end or had any query regarding my research or writing. She also
consistently allowed this work to be my own, only providing some guidance whenever
she though I needed it.
I would also like to thank Professor António Amorim, group leader of the
Population Genetics and Evolution group at i3S, for allowing me the opportunity to
develop this thesis in his group, as well all the Population Genetics and Evolution group
for all the support I have received.
Also, I would like to thank Luís Álvarez, Sofia Marques and Sofia Quental for their
invaluable help throughout the development of this study.
Family is one of the most important parts in a person’s life so I couldn’t pass the
opportunity to express my profound gratitude to my parents, for providing me with
unfailing support and continuous encouragement throughout the years of study, which
allowed me to reach this moment.
Last but not least, my girlfriend, Rita. We both met each other during the course
of the Master’s Degree and since then she has become a pillar that has supported me
and helped me in the best and, above all, the worst moments. I can only hope that you
continue to be there always by my side, day after day, loving and supporting me
unconditionally, as I promise to do the same.
To all of you, thank you.
FCUP 4 Updating the study of pharmacogenetic polymorphisms in the Portuguese Roma
Resumo
Polimorfismos em genes que codificam enzimas metabolizadoras de fármacos
(EMFs) são os maiores influenciadores da variabilidade interindividual no que diz
respeito à resposta a fármacos. Dentro das EMFs, o citocromo P450, família 2,
subfamília D, polipéptido 6, CYP2D6, é uma das mais importantes pois é responsável
pela metabolização de 25 a 30% de todos os fármacos prescritos, incluindo
antidepressivos, antipsicóticos, antiarrítmicos, bloqueadores β, anti-tumorais, entre
outros. A atividade enzimática do CYP2D6 varia bastante entre indivíduos,
principalmente devido a variações genéticas no gene codificante, resultando em
consequências clínicas significativas para o metabolismo de fármacos e também riscos
individualizados no que toca a efeitos adversos ou alterações na resposta pretendida.
Apesar de várias populações já terem sido estudadas relativamente ao CYP2D6, ainda
existem algumas que foram escassamente analisadas, como o caso dos ciganos
europeus.
Os ciganos são um caso de estudo populacional interessante que ainda está
pouco estudado em vários aspetos. Durante o seu período migratório, era normal
ocorrer a fragmentação em grupos mais pequenos, mantendo na mesma as suas
práticas endógamas. Do ponto de vista genético, isto leva a elevados efeitos de deriva
genética, diversidade genética reduzida, elevado linkage disequilibrium e fluxo genético
limitado entre grupos.
Assim, e atendendo à escassez de estudos farmacogenéticos nos ciganos, neste
estudo pretendemos caracterizar a população de ciganos portugueses, através do
estudo de Single Nucleotide Polymorphisms (SNPs) com interesse farmacogenético, e
para avaliar se estes apresentam diferenças no que toca à resposta a fármacos,
comparativamente à restante população portuguesa. Nesse sentido, 56 amostras de
ciganos portugueses foram analisadas por reação de SNaPshotTM, desenhado e
otimizado para detetar 11 SNPs dentro do gene CYP2D6, que estão associados a
alterações na resposta a fármacos. Para comparação de resultados, foram usados
dados anteriormente publicados para a restante população portuguesa, bem como
dados de outras populações de todo o mundo, para inserir os nossos resultados num
contexto mundial.
Das variações estudadas, apenas uma não se encontrava de acordo com o
equilíbrio de Hardy – Weinberg, mesmo após a correção de Bonferroni, que foi a posição

FCUP 5 Updating the study of pharmacogenetic polymorphisms in the Portuguese Roma
4180 G>C. Comparativamente à restante população portuguesa, os ciganos
apresentam uma frequência mais elevada do CYP2D6*4, um dos alelos que apresenta
atividade nula. Relativamente aos perfis metabólicos teoricamente definidos, foram
encontradas diferenças entre os ciganos e os restantes portugueses, principalmente nos
perfis Poor Metabolizers (PM), Intermediate Metabolizers (IM) e Extensive Metabolizers
(EM).
Contudo, apesar de ter sido aplicada uma técnica de considerável resolução, em
termos de SNPs, estudos futuros são necessários para aprofundar os resultados
obtidos, preferencialmente com análise conjunta bioquímica da atividade enzimática.
Para além de caracterizar melhor a população cigana portuguesa, será também
importante ter dados de outras populações ciganas europeias, para que o conhecimento
sobre os ciganos europeus permita extrair mais inferências relevantes do ponto de vista
da farmacogenética.
Com o desenvolvimento deste estudo, contribuímos para um aprofundamento da
caraterização da população cigana, ajudando a promover o conhecimento do ponto de
vista farmacogenético, relativo ao CYP2D6, bem como a realçar a importância da
farmacogenética no cenário clínico.
Palavras – Chave: Farmacogenética, Enzimas Metabolizadora de Fármacos, CYP2D6,
SNP, População Cigana

FCUP 6 Updating the study of pharmacogenetic polymorphisms in the Portuguese Roma
Abstract
Polymorphisms in genes coding for drug-metabolizing enzymes (DME) are major
players in interindividual variability in drug response. Among DME, cytochrome P450
family 2, subfamily D, polypeptide 6, CYP2D6, is one of the most important, because it
is involved in metabolism of 25% to 30% of all prescribed drugs, including
antidepressants, antipsychotics, anti-arrhythmics, β-blockers, cancer
chemotherapeutics, among others. The enzymatic activity of CYP2D6 varies widely
among individuals, mainly due to functional genetic variations at the encoding gene,
resulting in significant clinical consequences for drug metabolism and individual risk of
adverse events or drug efficacy. Although many populations have been studied
regarding the CYP2D6, there are still populations scarcely studied, such as the Roma
from Europe.
The Roma represent an interesting population case study that is still understudied
in many aspects. During the Gypsy diaspora, it was normal the occurrence of group
fragmentation into smaller communities, but still maintaining endogamous practices.
From a genetic point of view, this leads to high genetic drift effects, reduced genetic
diversity, high linkage disequilibrium and limited gene flow between these groups.
Therefore, due to these traits and to the scarcity of Pharmacogenetic studies in
this population, in this present study, we intended to characterize the Portuguese Roma
for Single Nucleotide Polymorphisms (SNPs), relevant from the Pharmacogenetics point
of view, to evaluate if the Roma show any peculiarity regarding drug response, in
comparison with the host population. In that sense, 56 samples from Portuguese Roma
were analysed by SNaPshotTM reaction, designed and optimized to detect 11 SNPs
located within the CYP2D6 gene, known to influence drug response. For comparative
analysis, data from previous studies in the Portuguese host population was used, as well
from several populations around the world, to put the data obtained in a worldwide
context.
For the variations studied, only one SNP revealed significant deviation from the
Hardy – Weinberg expectation, even after the Bonferroni correction, which was the 4180
G>C. Comparatively to the Portuguese host population, the Roma showed some
differences, especially an increased frequency of the CYP2D6*4, an allele implying null
enzymatic activity. Regarding the theoretical metabolic profiles, differences were found,
especially the IM and PM profiles.

FCUP 7 Updating the study of pharmacogenetic polymorphisms in the Portuguese Roma
Even though we studied a set of SNPs considered to be of high resolution, further
studies are needed to deepen the results here obtained, preferably with the joint analysis
of biochemical assessment of enzymatic activity. Also, new studies are needed, not only
in the Portuguese host population, but also in other European populations, with a larger
number of SNPs, so that the knowledge regarding these populations and further
comparative analysis can allow to extract more inferences relevant from the perspective
of Pharmacogenetics.
With the development of the present study, we have contributed to deepening the
characterization of Roma populations, helping to further the knowledge from the
pharmacogenetic point of view regarding the CYP2D6, as well as to enhance the
importance of Pharmacogenetics in the clinical setting.
Keywords: Pharmacogenetics, Drug-Metabolizing Enzymes, CYP2D6, SNP, Roma
Population

FCUP 8 Updating the study of pharmacogenetic polymorphisms in the Portuguese Roma
Table of Contents
Acknowledgments ……………………………………………………………………… ..3
Resumo …………………………………………………………………………………....4
Abstract …………………………………………………………………………………....6
Table of Contents ………………………………………………………………………...8
Table Index ………………………………………………………………………………10
Figure Index …………………………………………………………………………….. 11
Abbreviations …………………………………………………………………………… 12
I. INTRODUCTION ……………………………………………………………… 15
1. Pharmacogenetics ……………………………………………………. 15
1.1. Pharmacogenetic Applications …………………………………. 16
1.2. Pharmacogenetic Challenges …………………………………...17
2. Drug Metabolism ……………………………………………………… 18
2.1. Phase I of Drug Metabolism ……………………………………. 20
2.1.1. Cytochrome P450 system …………………………… 20
2.1.1.1 Cytochrome P450 2D6 – CYP2D6 ……….. 22
2.1.1.2 Worldwide Genetic Distribution …………….25
3. Portuguese Roma ……………………………………………………..26
II. AIMS ……………………………………………………………………………. 27
III. MATERIALS AND METHODS ……………………………………………….. 27
1. Samples and DNA extraction ……………………………………….. 27
2. PCR Design …………………………………………………………… 28
2.1. Electrophoresis …………………………………………………...30
3. SNP Genotyping ……………………………………………………….30
4. Sanger Sequencing ………………………………………………...…32

FCUP 9 Updating the study of pharmacogenetic polymorphisms in the Portuguese Roma
5. Data Analysis …………………………………………………………..33
IV. RESULTS AND DISCUSSION ……………………………………………….33
1. CYP2D6 Genotyping…………………………………………………..33
2. Inference of CYP2D6 diplotypes ……………………………………. 36
3. Metabolic Profiles ……………………………………………………...39
4. Comparison with other populations…………………………………..42
V. FINAL REMARKS ...…….……………………………………………………...47
VI. BIBLIOGRAPHY ………………………………………………………………..49

FCUP 10 Updating the study of pharmacogenetic polymorphisms in the Portuguese Roma
Table Index
Pages
Table 1 - Drugs metabolized by the CYP2D6 gene. 22
Table 2 - Primers used in the PCR amplifications. 29
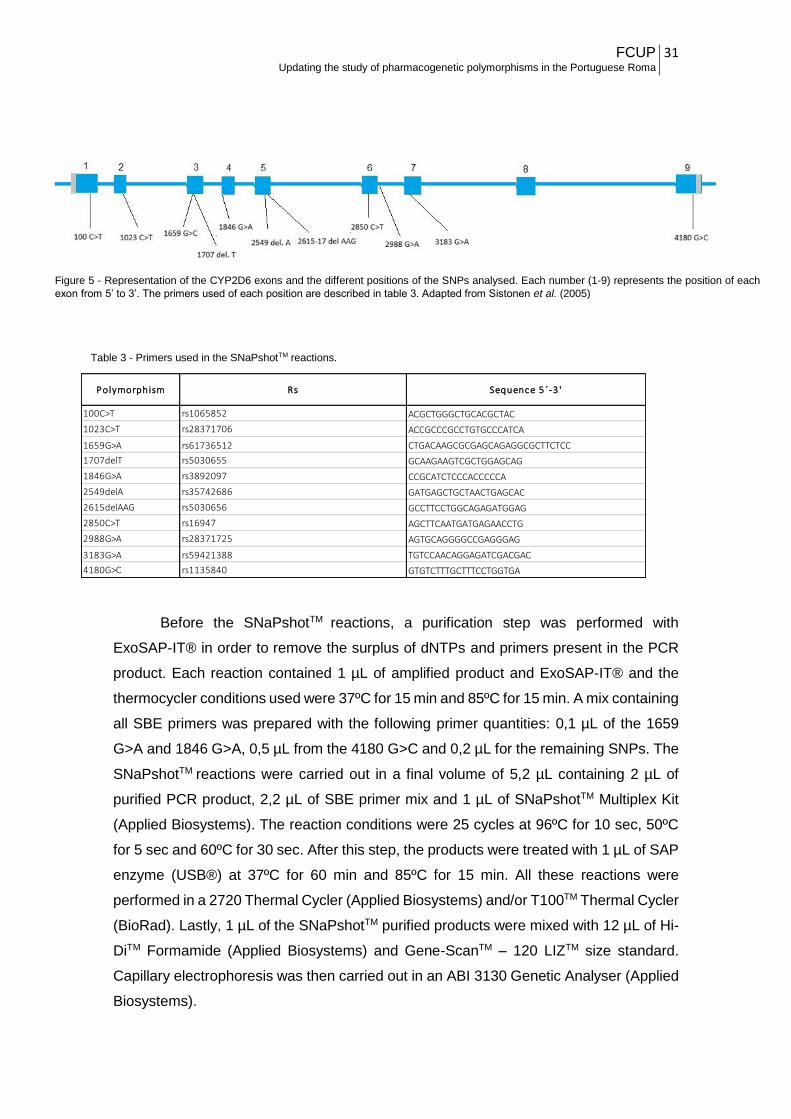
Table 3 - Primers used in the SNaPshotTM reactions. 31
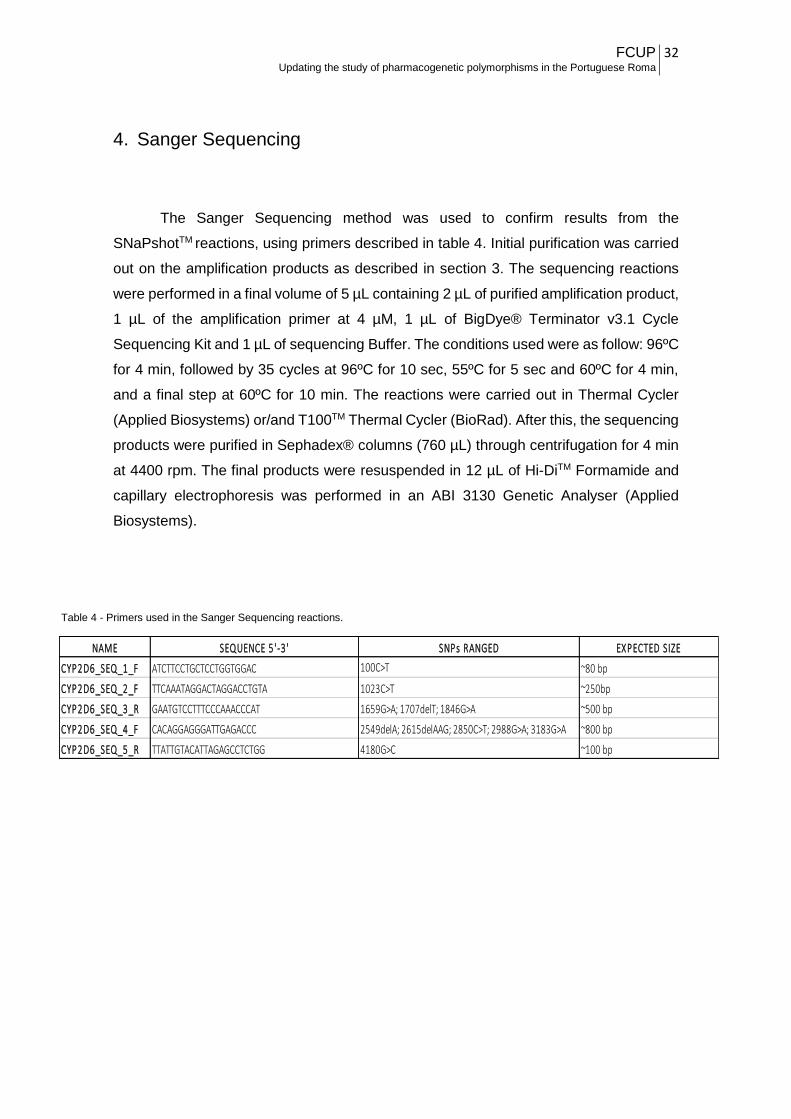
Table 4 - Primers used in the Sanger Sequencing reactions. 32
Table 5 – Results from the Hardy – Weinberg equilibrium test obtained for the 11
positions. 36
Table 6 – Results of Linkage Disequilibrium (L.D.) obtained for the 11 positions. 37
Table 7 - Haplotypes defining different CYP2D6 alleles, corresponding effects in
enzyme activity and frequencies in the Portuguese Roma. 37
Table 8 - Frequencies of CYP2D6 genotypes in the Portuguese Roma population. 40
Table 9 – Frequencies of CYP2D6 variant alleles in different populations. 43
FCUP 11 Updating the study of pharmacogenetic polymorphisms in the Portuguese Roma
Figure Index
Page
Figure 1 - Schematic representation of drug metabolism in the human body. 19
Figure 2 - Representation of the different phenotypes in a population. 21
Figure 3 - Schematic representation of the CYP2D6 gene cluster. 23
Figure 4 – Schematic representation of different CYP2D6 gene arrangements 29
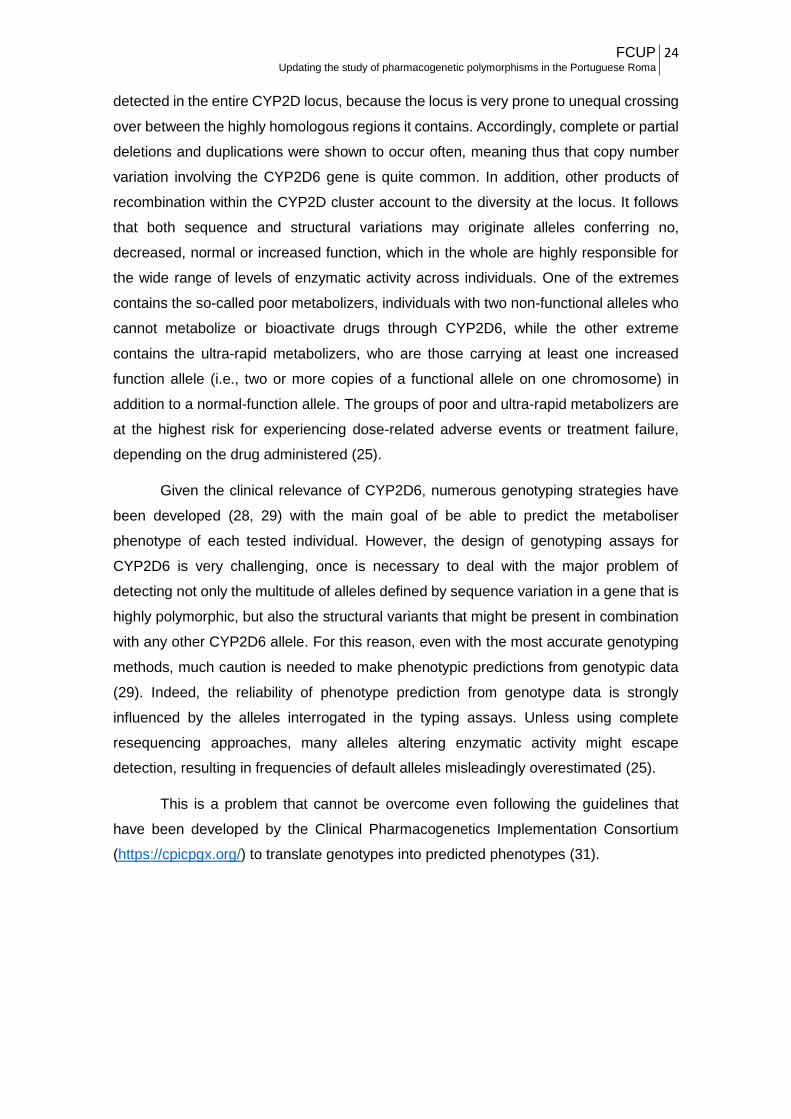
Figure 5 - Representation of the CYP2D6 exons and the different positions of the SNPs
analysed 31
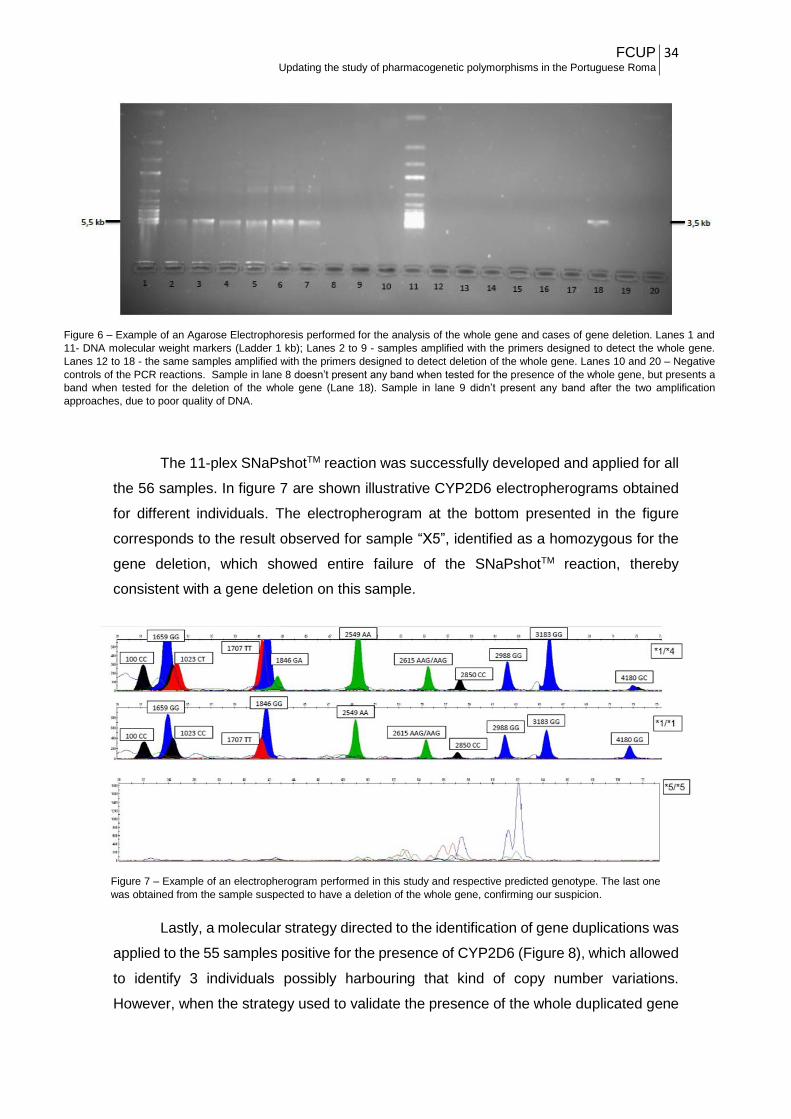
Figure 6 – Example of an Agarose Electrophoresis performed for the analysis of the
whole gene and cases of gene deletion 34
Figure 7 – Example of an electropherogram performed in this study and respective
predicted genotype 34
Figure 8 – Example of an agarose electrophoresis performed to determine the
presence or not of duplication events 35
Figure 9 - Example of an agarose electrophoresis performed to determine the presence
of the whole duplicated gene 35
Figure 10 - SNaPshotTM reaction performed to confirm the results of the whole
duplicated gene approach 36
Figure 11 - Frequencies of theoretical metabolic profiles in the Portuguese Roma
population 41
Figure 12 - Frequencies of theoretical metabolic profiles 47

FCUP 12 Updating the study of pharmacogenetic polymorphisms in the Portuguese Roma
Abbreviations
µL Microlitre
µM Micromolar
5th fifth
10th tenth
15th fifteenth
AS Activity Score
A Adenine
β Beta
B.C. Before Christ
BLAT Blast – like Alignment Tool
C – O Carbon – Oxygen
C Cytosine
ºC Degree Celsius
CEPH Centre Étude Polymorphism Humain
CNV Copy Number Variation
CPIC Clinical Pharmacogenetics Implementation Consortium
CYP/CYP450 Cytochrome P450
CYP1A2 Cytochrome P450 1A2
CYP2A6 Cytochrome P450 2A6
CYP2B6 Cytochrome P450 2B6
CYP2D6 Cytochrome P450 2D6
CYP2D7 Cytochrome P450 2D7
CYP2D8P Cytochrome P450 2D8 Pseudogene
CYP2C19 Cytochrome P450 2C19

FCUP 13 Updating the study of pharmacogenetic polymorphisms in the Portuguese Roma
CYP3A4 Cytochrome P450 3A4
del. Deletion
DNA Deoxyribonucleic Acid
dNTP Deoxynucleotide Triphosphate
DMEs Drug Metabolizing Enzymes
EM Extensive Metaboliser
et al. et alli
Exo – SAP Exonuclease I and Shrimp Alkaline Phosphatase
G Guanine
GSH Glutathione
H Hydrogen
HGDP Human Genome Database Panel
i.e. in example
IM Intermediate Metaboliser
In/Dels Insertions/Deletions
kb Kilobase
L.D. Linkage Disequilibrium
min. minute
mRNA messenger Ribonucleic Acid
n Sample Size
OH Hydroxide
OligoCalc Oligonucleotide Properties Calculator
PCR Polymerase Chain Reaction
PM Poor Metaboliser
REP Repetitive Segment
® Registered

FCUP 14 Updating the study of pharmacogenetic polymorphisms in the Portuguese Roma
Ref Reference
SBE Single Base Extension primers
s. d. standard deviation
sec. second
SNP Single Nucleotide Polymorphism
T Thymine
TM Trademark
UCSC University of California, Santa Cruz
UM Ultrarapid Metaboliser
v. version
WGS Whole – Genome Sequencing
XMEs Xenobiotic Metabolizing Enzymes

FCUP 15 Updating the study of pharmacogenetic polymorphisms in the Portuguese Roma
I. INTRODUCTION
1. Pharmacogenetics
The term pharmacogenetics is often used to describe a relatively new field of
genetics that covers the study of how different gene variants affect drug response or, by
other words, the study of the effect of heredity in human’s drug response. Nowadays,
pharmacogenetics is largely contributing to the emergence of personalised medicine,
also called individualized or precision medicine that aims, in its narrow sense, to
customize health care, with decisions and treatments tailored to each patient (1).
Primordial observations in this field go back to 510 B.C., when Pythagoras
described that some individuals, after ingesting fava beans, showed dangerous
reactions, when the rest of them did not (2).
In the 1950s, the introduction of therapeutic drug monitoring, generally defined
as the clinical practice of measuring specific parameters at regular intervals that, with
appropriate interpretation, directly influence drug prescribing procedures (3),
represented the first systematic approach to individualize the treatment of patients that
still has significant value in assessing drug therapy, particularly in psychiatry and severe
infections (4, 5). With the unravelling of the structure of DNA and subsequent
development of molecular biology, a new era was open to study the genetic bases of
phenotypes associated with variability in drug response. Since then, it became
increasingly well documented that genetic variations was an important determinant of
interindividual variability in drug response (6).
The grand majority of genetic variations influencing drug response belong to the
class of Single Nucleotide Polymorphisms (SNPs), which are variations in single
nucleotides of the DNA sequence characterized by the occurrence in at least 1% of the
population. SNPs are the most common polymorphisms in the human genome,
accounting to more than 90% of the human genetic variations. Although most SNPs do
not present effect on gene function, some have profound impact on the function of
associated genes, whether the SNPs occur in the coding regions or at a significant
distance from the transcription starting site of the gene (6). When such kind of variations
are encountered in genes that encode enzymes responsible for absorption, distribution,
metabolism or excretion of drugs, enzyme activity can be disturbed, leading to
undesirable response to drugs which can be potentially fatal. Therefore, it is important to

FCUP 16 Updating the study of pharmacogenetic polymorphisms in the Portuguese Roma
study these polymorphisms, not only on a pharmacological perspective (which can, in a
near future, lead to individualized treatments), but also on a forensic viewpoint, where it
can be applied, together with Toxicology, to solve cases where the cause of death is
inconclusive (7, 8).
1.1. Pharmacogenetics applications
With the development of health care and the rise of its costs, there has never
been a greater need to reduce waste. In this context, ineffective treatments and adverse
drug effects must urgently be minimized. Nowadays, the path to maximizing benefit and
reduce negative effects seems to reside in stratifying patient populations into subgroups
taking into account the patient individuality in response to a certain treatment since it is
well known that an individual’s response to a drug is affected by personal factors such
as age, gender and genetics. Before a drug can be used in the clinical practice it must
be subjected to clinical trials conducted to collect data demonstrating its safety and
efficacy. Typically, however, clinical trials only give information regarding the “average
patient”, not taking into account that every individual has different backgrounds which
can lead to a wide variability in drug response. It is now widely considered that
pharmacogenetics must have a critical role in the clinical trials, specifically in the early
stages of the treatment, by assisting to define the number of patients to analyse, to
predict the efficiency of the therapy and to identify subgroups in which a distinct treatment
is needed. Besides the contribution to the success of clinical trials, pharmacogenetics is
also crucial in the clinical setting, where the use of genetic tests can give a prediction of
drug response regarding a certain person before the treatment is started, allowing thus
saving in expensive therapeutics that would probably not work and at the same time
preventing levels of toxicity that sometimes cannot be measured by traditional methods.
This happens, for instance, in oncological treatments, where the use of genetic tests can
lead to the identification of various mutations in driver oncogenes that reduce the binding
capacity of the drug and consequently low therapeutic success and/or resistance (5, 9-
11).
Although pharmacogenetics has been preponderantly associated with the
advantages it can provide in terms of clinical applications, it is also gaining ground in
forensic sciences. Forensic pharmacogenetics is a relatively new and growing area of
research. It is being increasingly applied in post-mortem cases, as an adjunct in the
determination of the cause of death, namely through the analysis of certain genetic

FCUP 17 Updating the study of pharmacogenetic polymorphisms in the Portuguese Roma
variants in specific genes that encode proteins involved in drug metabolism.
Pharmacogenetic approaches might help to infer if high levels of a specific drug detected
in a corpse can be the cause of death due to overdose or due to inefficient metabolism
caused by the presence of a certain genetic variation. As a matter of fact, acute drug
intoxication is a major cause of unnatural deaths in occidental countries, usually requiring
a forensic investigation to determine the reasons of the intoxication and consequently
the likely explanation for the death. Among the most common drugs found in intoxication
cases are psychiatric drugs and analgesics such for instance tramadol, an opioid
analgesic commonly prescribed in the treatment of postoperative, dental, cancer,
neuropathic and acute musculoskeletal pain. Since the enzyme CYP2D6 plays a
predominant role in tramadol metabolism, and given that null variants in the encoding
gene associated with enzyme inactivation can cause acute intoxication in patients
administrated with inaccurate doses of the drug, CYP2D6 is being one of the most widely
studied genes in forensic pharmacogenetics (7, 12).
1.2. Pharmacogenetics Challenges
Despite being well recognised the importance of pharmacogenetics, which
continues to grow, particularly in the clinical practice and in the pipeline of drug
development, pharmacogenetics also faces some setbacks. For instance, the evaluation
of the clinical cost – effectiveness of a genetic test is critical. Even though there are
studies evidencing the advantages of pharmacogenetic testing, in order to obtain valid,
accurate and relevant cost-effectiveness estimates, reliable economic studies are
required and this proves to be a challenge because often there is no hard clinical
evidence regarding the effects of the test on the clinical utility (4). Furthermore, the
information is not available for every genetic variant of pharmacogenetic relevance.
Differences in costs can be substantial between countries, or even laboratories, and thus
it is important to take this into account in scenario analysis, as well as the sensitivity and
specificity of pharmacogenetics tests, which also represent another challenge since they
can vary in function of the different ethnicities studied or genetic variations analysed (4).
To perform economic evaluations of pharmacogenetic tests is necessary to rely
in relevant clinical data, which are often difficult to obtain. Until recently, evidence has
been mainly provided by means of conventional clinical trials, but there is now a
movement toward using observational studies instead of randomized trials. The Clinical
FCUP 18 Updating the study of pharmacogenetic polymorphisms in the Portuguese Roma
Pharmacogenetics Implementation Consortium (CPIC), based in the United States,
promotes reviewed guidelines on how to use pharmacogenetics tests results to improve
treatments based on evidence according to patients’ medical records (13). Though the
development of CPIC guidelines was a good step toward the implementation of
pharmacogenetics tests in routine clinical practice, some fear that the assessment of
pharmacogenetics might be obstructed because these guidelines “bypass traditional
data requirements needed to support the use of a new intervention and move straight to
producing recommendations for its use in clinical practice” (13). In other words, some
people claim that the production of guidelines without information about, for instance, its
effectiveness in a certain population, such as the one we can obtain through randomized
trials, may still give insufficient information regarding cost effectiveness, not allowing
policy makers to make reimbursement decisions easier. Therefore, there is the need to
boost the development of a strong evidence - base for pharmacogenetics by alternative
means that can satisfy the requirements of health care payers (4, 9, 13).
2. Drug Metabolism
Xenobiotics are foreign chemical substances which are not normally produced or
expected to be within an organism. When these substances enter the human body, they
pass through several biochemical transformations in order to be transformed in other
metabolites, less harmful, minimizing thus aggression to the organism. The process by
which these biochemical transformations occur is commonly known as xenobiotic or drug
metabolism. One of the most important end results of the biochemical reactions that
transform the foreign elements in products easier to be eliminated, is to avoid
accumulation in the organism, thus preventing possible toxic reactions. Although drug
metabolism typically inactivates drugs, they can also convert an inactive drug (called
prodrug) into an active one, an active drug into an active or toxic metabolite, or an
unexcretable drug into an excretable form (14, 15).
To process these foreign substances, many biochemical transformations occur
that require the machinery of several enzymes, known as drug metabolizing enzymes or
xenobiotic enzymes (DMEs or XMEs), responsible by different steps in the metabolic
pathways. While DMEs can be synthetized in many organs, the most active one is the
liver, where the grand majority of these enzymes are produced. Accordingly, it is also in
the liver that many drugs begin to undergo extensive biotransformation. Its effectiveness

FCUP 19 Updating the study of pharmacogenetic polymorphisms in the Portuguese Roma
in the liver might be very high, so that only a small portion of the drug reaches the blood
stream. This process - known as first pass effect or presystemic metabolism – whereby
the concentration of a drug is greatly reduced before it reaches the systemic circulation,
greatly influences the bioavailability of a drug (16, 17).
Drug metabolism is divided in three phases: phase I, in which DMEs introduce
reactive or polar groups into xenobiotics, mainly by oxidation, hydroxylation and
hydrolysis (Figure 1, PHASE 1); phase II, where these modified compounds are then
conjugated into polar compounds, such as glutathione (GSH) and glucuronic acid (Figure
1, PHASE 2); and phase III, when the xenobiotic conjugates are further metabolized and
excreted (Figure 1, PHASE 3). Although these phases can occur separately, they
normally take place in succession. Whatever the process and phase of drug metabolism,
the rate of biotransformation reactions is not the same for every individual, since
differences in genetic profiles and environmental factors, such as age, gender, drinking
and smoking habits, can account to wide intra-individual variability (17-19).
Figure 1 - Schematic representation of drug metabolism in the human body. The
Drug Metabolism is divided in 3 Phases: Phase 1, where occurs the
biotransformation of the xenobiotics; Phase 2, where occurs the synthesis of these
xenobiotics; Phase 3, where occurs the excretion of the metabolites resultant from
the biodegradation of the xenobiotics through the different pathways.

FCUP 20 Updating the study of pharmacogenetic polymorphisms in the Portuguese Roma
2.1. Phase I of Drug Metabolism
Drug Metabolizing Enzymes (DMEs) play central roles in the metabolism,
elimination and/or detoxification of xenobiotics or exogenous compounds introduced into
the body (17). In the phase I of Drug Metabolism, a variety of enzymes act to introduce
reactive and polar groups into their substrates. Phase I reactions may occur by oxidation,
reduction, hydrolysis, cyclization and decyclization, all occurring predominantly in the
liver. For instance, through phase I oxidation, which involves the conversion of a C-H
bond to a C-OH, a pharmacologically inactive product (prodrug) can be converted into a
pharmacologically active compound, or also a nontoxic molecule can be transformed in
a toxic one as illustrated by phase I metabolism of acetonitrile to glycolonitrile, which
rapidly dissociates into formaldehyde and hydrogen cyanide, both of which are toxic (14,
17, 20). Most of the enzymes involved in phase I reactions belong to the large family of
cytochrome P450 (CYP450) enzymes, including the CYP2D6.
2.1.1. Cytochrome P450 system
Cytochrome P450 (CYP450) is the generic name given to a large family of highly
versatile enzymes involved in drug metabolism and response (15). Besides the
preponderant role in xenobiotic metabolism, they also have important functions in other
processes, including steroid and cholesterol biosynthesis, fatty acid metabolism and the
maintenance of calcium homeostasis. CYP450 enzymes can be found abundantly in the
endoplasmic reticulum of liver cells, but also in the gastrointestinal tract, lung and kidney,
though showing lower levels of expression (17, 21).
There are 57 active CYP genes in the human genome, which are divided into 18
families, accordingly with their amino acid sequence similarities. The first three families
(CYP 1-3) are mainly responsible by the metabolism of exogenous substances, such as
drugs, whereas the CYP families with higher numbers are usually more involved in the
metabolism of endogenous substances. CYP enzymes participate in 75-80% of all
phase I – dependent metabolism and for 65-70% of the clearance of clinically used drugs
(22). The CYP isoenzymes are named according to specific standards, which can be
exemplified using the CYP2D6: CYP is the abbreviation for cytochrome P450, the
FCUP 21 Updating the study of pharmacogenetic polymorphisms in the Portuguese Roma
number “2” designates the family, the letter “D” stands for the subfamily and the number
“6” represents a specific gene (23).
From all the active elements of the CYP family, CYP3A4 is responsible for about
50% of all CYP-dependent drug metabolism. In the encoding gene, more than 20
common genetic variants have been identified, most of them resulting in decreased
enzymatic activity, which substantially contribute to the high variability among individuals
regarding CYP3A4 – mediated drug metabolism, although other factors concur for such
variability. On the other hand, nearly 40% of the metabolism of all clinical used drugs is
carried out by CYP2C19 and CYP2D6 enzymes, whose genes are as well highly
polymorphic. Other members, like CYP1A2, CYP2A6 and CYP2B6, that contribute
greatly to xenobiotic metabolism, are also encoded by highly polymorphic genes (22).
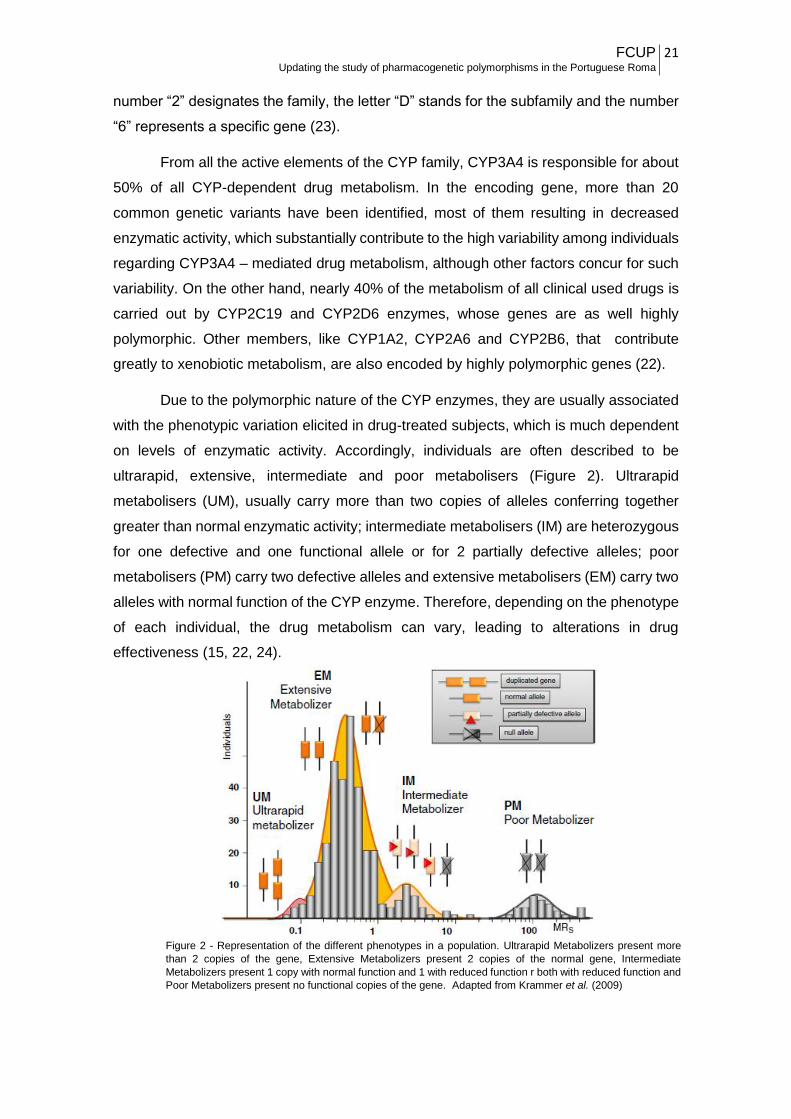
Due to the polymorphic nature of the CYP enzymes, they are usually associated
with the phenotypic variation elicited in drug-treated subjects, which is much dependent
on levels of enzymatic activity. Accordingly, individuals are often described to be
ultrarapid, extensive, intermediate and poor metabolisers (Figure 2). Ultrarapid
metabolisers (UM), usually carry more than two copies of alleles conferring together
greater than normal enzymatic activity; intermediate metabolisers (IM) are heterozygous
for one defective and one functional allele or for 2 partially defective alleles; poor
metabolisers (PM) carry two defective alleles and extensive metabolisers (EM) carry two
alleles with normal function of the CYP enzyme. Therefore, depending on the phenotype
of each individual, the drug metabolism can vary, leading to alterations in drug
effectiveness (15, 22, 24).
Figure 2 - Representation of the different phenotypes in a population. Ultrarapid Metabolizers present more
than 2 copies of the gene, Extensive Metabolizers present 2 copies of the normal gene, Intermediate
Metabolizers present 1 copy with normal function and 1 with reduced function r both with reduced function and
Poor Metabolizers present no functional copies of the gene. Adapted from Krammer et al. (2009)

FCUP 22 Updating the study of pharmacogenetic polymorphisms in the Portuguese Roma
2.1.1.1. Cytochrome P450 2D6 – CYP2D6
So far, CYPD26 has been one of the most studied pharmacogenes, because it
presents the greatest impact of genetic polymorphism among all major CYP enzymes,
due to its wide spectrum of genetic variants (from null alleles to several-fold gene
amplification), comparably little influence by environmental and non - genetic factors,
and its extraordinarily broad substrate selectivity (15).
CYP2D6 contributes to the metabolism of up to 25% of all clinically used drugs
from virtually all therapeutic classes (25). It is involved in the Phase I of the drug
metabolism, working through the various reactions described in point 2.1. According to
He et al. (26), CYP2D6 acts on more than 160 drugs, including tricyclic antidepressants,
serotonin-selective reuptake inhibitors, opioids, and antiemetics, but also antiarrythmics,
β-blockers, antihistamines, and antiviral agents. In Table 1 are listed the most common
clinically used drugs metabolized by CYP2D6, as well as some known drugs that may
function as inhibitors of CYP2D6 activity.
Table 1 – Drugs metabolized by the CYP2D6 gene. Adapted from Department of Medicine, Indiana University’s website
(27)
Beta-Blockers Antidepressants Antipsychotics Others
Carvedidol Amitriptyline Haloperidol Aripiprazole
S - metopropol Clomipramine Risperidone Atomoxetine
Propafenone Desipramine Thioridazine Codeine
Timolol Duloxetine Dextromethorphan
Fluoxetine Doxepine
Imipramine Flecainide
Paroxetine Mexiletine
Ondansetron
Oxycodone
Tamoxifen
Tramadol
Venlafaxine
Diphenhydramine
SUBSTRATESINHIBITORS
Bupropion
Fluoxetine
Paroxetine
Quinidine
Duloxetine
Amiodarone
Cimetidine
Aripiprazole
Terbinafine
Chlorpheniramine
Clomipramine
Doxepin
Haloperidol
Methadone
Ritonavir

FCUP 23 Updating the study of pharmacogenetic polymorphisms in the Portuguese Roma
The CYP2D6 gene is located on chromosome 22q13.1, in a region containing the
entire CYP2D gene cluster, which besides CYP2D6 also harbours 2 pseudogenes,
CYP2D7 and CYP2D8P (Figure 3). The pseudogene CYP2D7 is expressed as mRNA in
the liver, but due to an insertion in the first exon disrupting the reading frame, protein
production is null. In the case of the CYP2D8P, it’s a true pseudogene which has
accumulated several gene-disrupting mutations (15). The expression of CYP2D6 is
mostly confined to the liver, although low levels of protein have been shown in
extrahepatic tissues like the gastrointestinal tract and in the human brain.
CYP2D6 gene contains 9 exons spanning ~4,4 kb, and encodes a protein with
497 amino acids, although other alternatively spliced transcripts resulting in different
isoforms have been reported
(http://grch37.ensembl.org/Homo_sapiens/Gene/Summary?db=core;g=ENSG0000010
0197;r=22:42522501-42526908). There are currently more than 100 distinct alleles and
a grand number of rare variants described in the Human Cytochrome P450 (CYP) Allele
Nomenclature Database - (http://www.cypalleles.ki.se/cyp2d6.htm). Many result in
absent or non – functional protein (i.e. CYP2D6*3, *4, *5, *6), in decreased (i.e.
CYP2D6*9, *10, *17, *41) or increased (i.e. CYP2D6*1XN, *2XN) expression. Other
alleles present normal function (i.e. CYP2D6*1 or Wild type and CYP2D6*2) (15, 28-30).
The majority of these alleles result from sequence variations like SNPs and small
In/Dels within the CYP2D6 gene. However, structural variants are also commonly
Figure 3 - Schematic representation of the CYP2D6 gene cluster. In dark green, purple and light green, we have the representation of the
CYP2D8, CYP2D7 and CYP2D6, respectively. The CYP2D7 spacer is located between a common 0,6 kb repeat (marked as red) and the 2,8
kb REP 7 sequence, a repetitive segment specific of the CYP2D7 pseudogene (marked as grey). The 0,6 kb repeat is found downstream of
all genes. The 2,8 kb REP 6 sequence, a repetitive segment specific of the CYP2D6 gene, is marked as a blue. Adapted from Krammer et al.
(2009) and Gaedigk et al. (2007)
FCUP 24 Updating the study of pharmacogenetic polymorphisms in the Portuguese Roma
detected in the entire CYP2D locus, because the locus is very prone to unequal crossing
over between the highly homologous regions it contains. Accordingly, complete or partial
deletions and duplications were shown to occur often, meaning thus that copy number
variation involving the CYP2D6 gene is quite common. In addition, other products of
recombination within the CYP2D cluster account to the diversity at the locus. It follows
that both sequence and structural variations may originate alleles conferring no,
decreased, normal or increased function, which in the whole are highly responsible for
the wide range of levels of enzymatic activity across individuals. One of the extremes
contains the so-called poor metabolizers, individuals with two non-functional alleles who
cannot metabolize or bioactivate drugs through CYP2D6, while the other extreme
contains the ultra-rapid metabolizers, who are those carrying at least one increased
function allele (i.e., two or more copies of a functional allele on one chromosome) in
addition to a normal-function allele. The groups of poor and ultra-rapid metabolizers are
at the highest risk for experiencing dose-related adverse events or treatment failure,
depending on the drug administered (25).
Given the clinical relevance of CYP2D6, numerous genotyping strategies have
been developed (28, 29) with the main goal of be able to predict the metaboliser
phenotype of each tested individual. However, the design of genotyping assays for
CYP2D6 is very challenging, once is necessary to deal with the major problem of
detecting not only the multitude of alleles defined by sequence variation in a gene that is
highly polymorphic, but also the structural variants that might be present in combination
with any other CYP2D6 allele. For this reason, even with the most accurate genotyping
methods, much caution is needed to make phenotypic predictions from genotypic data
(29). Indeed, the reliability of phenotype prediction from genotype data is strongly
influenced by the alleles interrogated in the typing assays. Unless using complete
resequencing approaches, many alleles altering enzymatic activity might escape
detection, resulting in frequencies of default alleles misleadingly overestimated (25).
This is a problem that cannot be overcome even following the guidelines that
have been developed by the Clinical Pharmacogenetics Implementation Consortium
(https://cpicpgx.org/) to translate genotypes into predicted phenotypes (31).

FCUP 25 Updating the study of pharmacogenetic polymorphisms in the Portuguese Roma
2.1.1.2. Worldwide Genetic Distribution
It is well documented that most genetic polymorphisms in drug metabolizing
enzymes reveal substantial differences in allele frequencies across major human
populations. CYP2D6 is no exception, and shows allele frequencies highly varying in
world populations, which consequently implies extensive variation in the distribution of
the phenotypic response to drugs metabolized by CYP2D6 among worldwide
populations.
Previous genetic studies revealed that CYP2D6 diversity was far greater within
populations than between groups of populations and that null or low-activity variants
occurred at considerably high frequencies in various regions of the world, although
specific allelic variants are present at very distinct frequencies among world populations,
whereas other are restricted to certain population groups (25).
Furthermore, the macrogeographical spatial patterns of diversity at CYP2D6
revealed to be clinal, and very similar to those shown by neutral markers, indicating that
CYP2D6 diversity was modelled by the same factors that randomly affected neutral
genomic variation (32). It is known that geography was the main factor influencing
genetic differentiation among humans. Both physical distances and geographic barriers
limits human communication and interaction, which has led to a global genetic
substructure that largely follows geographic clines.
However, populations may be genetically structured, when composed by more
than one subpopulation that tend to maintain endogamous practices. These
subdivisions, often corresponding to ethnic groups, are not mainly influenced by
geography, but instead by social factors, including religion, culture, language, and other
sources of group identification, thus leading to varying degrees of genetic structure,
depending on the extent of reproductive isolation and endogamy.
From the genetic point of view, the Portuguese represent a homogeneous
population that is very well integrated in the context of populations from Western Europe.
This scenario does not take into account the Portuguese Roma, who were demonstrated
to contribute to some level of population structure in Portugal (33).

FCUP 26 Updating the study of pharmacogenetic polymorphisms in the Portuguese Roma
3. Portuguese Roma
The Roma, also referred to as Romani and widely known as “Gypsies” among
English-speaking people, are a transnational ethnic group, often reputed for their
nomadic tradition, that nowadays is mostly spread throughout Europe, Near East,
Caucasus and the Americans.
The social structure of the Roma groups is heavily influenced by the traditional
endogamy, which is the trend to marry individuals within the same subgroup, since
marriages between non-Roma or between Roma from different groups are avoided.
Although their history was largely lost, important insights on the issue have come
from scarce historical records documenting the presence in countries where they have
lived, from linguistics, and more recently from genetics (34).
Most studies performed so far suggested that the original homeland of the Roma
was India, from where they departed around the 5th and 10th century, travelling to Europe,
reaching first the Balkans region and later migrating into multiple locations throughout
the whole continent in such way that by the 15th century they were already present in
Spain and Portugal (34, 35). Genetic and linguistic studies pinpointed affinities between
Roma population and various Indian groups. Comparative linguistics studies suggested
that North-western Indian languages, such as Punjabi or Kashmiri or Central Indian
languages like Hindi are the most related to Romani (35, 36). Genetic studies in groups
of European Roma, showed that all groups share high frequency of Y – chromosome
lineages, such H1a-M82 and mitochondrial haplogroups like M5a1, M18 and M35b,
which are usually absent in European populations, while being rather common in South
Asian Populations, especially from Northern India (36, 37). Nevertheless, the ancestral
group/geographic region of India from which the Roma groups have originated is still
unclear, given the contradictory evidence provided by a recent study that they might
descend from southern Indian groups (34, 37).
The Roma populations represent an interesting case of study, especially from a
genetic point of view, because due to their endogamous practices, limited gene flow
between groups and past history of successive group fragmentations that occurred
during their migration into and within Europe, they present signatures of strong genetic
drift effects, such as reduced genetic diversity and high linkage disequilibrium (36).
Besides, from a pharmacogenetic point of view, the Roma population is still
understudied. Although a previous study addressing genes that influence drug response

FCUP 27 Updating the study of pharmacogenetic polymorphisms in the Portuguese Roma
has already been conducted in the Portuguese Roma Population (38), they still remain
very poorly characterized in regard to a fraction of diversity that can have high clinical
relevance.
II. AIMS
In the present study we intended to assess, in the Portuguese Roma, genetic
diversity in the CYP2D6, a gene very important from a Pharmacogenetic point of view,
to evaluate whether this population group show any peculiarity regarding drug response,
in comparison with the remaining Portuguese population. In order to achieve this goal,
the following partial aims were established:
Search and selection of SNPs and CNVs with pharmacological relevance
and development of PCR and minisequencing multiplex reactions
(SNaPshotTM);
Genotyping of a sample of Portuguese Roma population;
Comparison of the results in the Portuguese Roma with those previously
available for the Portuguese host population and other populations, to put
the data obtained in a worldwide context.
III. MATERIALS AND METHODS
1. Samples and DNA extraction
In this study, 56 samples from self-identified Portuguese Gypsies were analysed. All
samples have been extracted for previous works by the Chelex®-100TM (BioRad)
method described in Laureau et al. (39).

FCUP 28 Updating the study of pharmacogenetic polymorphisms in the Portuguese Roma
2. PCR design
We first performed a thorough literature search in order to select SNPs in the
CYP2D6 with pharmacogenetic interest. At the end, the following eleven SNPs were
chosen: 100 C>T (rs1065852); 1023 C>T (rs28371706); 1659 G>A (rs61736512); 1707
del. T (rs5030655); 1846 G>A (rs3892097); 2549 del. A (rs35742686); 2615 del. AAG
(rs5030656); 2850 C>T (rs16947); 2988 G>A (rs28371725); 3183 G>A (rs59421388);
4180 G>C (rs1135840). This set of SNPs allows the identification of the CYP2D6
haplotypes that are widely represented in different human populations. For the sake of
simplicity, the CYPD2D6 haplotypes are conventionally referred to as CYPD2D6 alleles
(http://www.cypalleles.ki.se/cyp2d6.htm), among which are included some that do not
affect enzyme function (i.e. CYP2D6*1, *2, *34, *39), and others that are associated to
low or null metabolic activity (i.e. CYP2D6 *3, *4, *5, *6, *9, *10, *17, *41) (23, 25). To
obtain genotype data for these SNPs, a SNaPshotTM strategy was applied, as will be
described in the next point.
Viewing the detection of cases where CYP2D6 is deleted and the whole gene,
primers were designed based on previous studies involving the CYP2D6 gene. For
amplification of the whole gene, a pair of primers were designed as described in Sistonen
et al. (2005) (28) with the exception of the forward primer, which was designed by us
since the previous one was located in a highly polymorphic region, resulting in fragment
A (Figure 4.c). In order to detect the presence or not of the gene deletion, a pair of
primers described in Krammer et al. (2009) (40) was selected, resulting in the fragment
C (Figure 4.b). Also, a PCR reaction was performed to detect cases where CYP2D6 was
duplicated, using a pair of primers identical to the one described in Gaedigk et al. (2007)
(29), resulting in fragment B (Figure 4.c). Also, in order to access whether there was a
gene duplication or not, a control sample from the Human Genome Database Panel –
Centre Étude Polymorphism Humain (HGDP-CEPH) was used. Lastly, an approach to
amplify the whole duplicated gene in samples positive for the previous approach
described was developed, using a set of primers identical to those described in Gaedigk
et al. (2007) (29), resulting in fragment D (Figure 4.c). Detection of possible non-specific
annealing was tested in BLAT (UCSC) (htts://genome.ucsc.edu/cgi-
bin/hgBlat?command=start) selecting only the human genome. In order to find out if the
primers could form primer-dimer structures and/or hairpins, the Oligocalc program was

FCUP 29 Updating the study of pharmacogenetic polymorphisms in the Portuguese Roma
used (http://biotools.nubic.northwestern.edu/OligoCalc.html). After the in silico
evaluation, each pair of primers was tested in individual amplifications in order to assess
their functionality. Each one of the primers was used at a final concentration of 4 µM.
The PCR reactions were performed in a final volume of 10 µL, containing 4,5 µL
of deionized water, 1 µL of 10x Advantage® Genomic LA Buffer (Clontech), 0,4 µL of
Expand Long Range dNTP Pack (Roche Diagnostics GmbH), 1,2 µL of each primer, 0,1
µL of Advantage® Genomic LA Polymerase Mix (Clontech) and 1,6 µL of DNA. The
amplification conditions were as follow: 94ºC for 3 minutes, proceeded by 5 cycles at
98ºC for 15 sec, 63ºC for 1.30 min and 68ºC for 8 min, and another 30 cycles at 98ºC for
15 sec, 62ºC for 1.30 min and 68ºC for 8 min and a final extension at 72ºC for 10 min. In
the case of the specific region approach and the whole gene duplication approach, the
Table 2 - Primers used in the PCR amplifications
Figure 4 – Schematic representation of different CYP2D6 gene arrangements. a) Normal representation of the CYP2D6 gene cluster; b) Representation of
a CYP2D6 gene deletion. As we can notice, comparing with a), the CYP2D6 gene is deleted and a hybrid between the CYP2D6 specific replicated region
REP 6 and the specific replicated region of CYP2D7, REP 7, is formed, and using the primers CYP2D7_Seq B1 and CYP2D6_Rep 7R3 (Table 2), we
obtain fragment C, indicative of a CYP2D6 gene deletion; c) Representation of duplicated event. Fragment A results from the use of primers CYP2D6_F
and CYP2D6_R (Table 2), which were used to assess the presence of the CYP2D6 gene. Fragment B results from the use of primers CYP2D6_DUP_Fw
and CYP2D7_DUP_Rv (Table 2), which amplifies a specific replicated region of the duplicated gene, nominated REP-DUP, which is an indicative of a
duplication of the CYP2D6 gene. Fragment D is the result of primers CYP2D7_Fw_DUP_TOTAL and CYP2D7_DUP_Rv, amplifying the whole CYP2D6
duplicated gene from samples positive for Fragment B. Adapted from Krammer et al. (2009)
NAME Sequence 5' - 3 ' SIZE (Kb)
CYP2D6_F TCAGGAGCTTGGAGTGGGGAGA
CYP2D6_R ACTGAGCCCTGGGAGGTAGGTA
CYP2D7__Seq B1 GTCCCACACCAGGCACCTGTACT
CYP2D6_Rep 7R3 GAATTAGTGGTGGTGGGTGTTTG
CYP2D6_DUP_Fw CCATGGAAGCCCAGGACTGAGC
CYP2D7_DUP_Rv CGGCAGTGGTCAGCTAATGAC
CYP2D6_Fw_DUP_TOTAL CCAGAAGGCTTTGCAGGCTTCAG
CYP2D7_DUP_Rv CGGCAGTGGTCAGCTAATGAC8,6
5,5
3,5
3,5

FCUP 30 Updating the study of pharmacogenetic polymorphisms in the Portuguese Roma
PCR reactions were performed in a final volume of 10 µL, containing 3,5 µL of deionized
water, 1 µL of 10x Advantage® Genomic LA Buffer (Clontech), 0.4 µL of Expand Long
Range dNTP Pack (Roche Diagnostics GmbH), 1.2 µL of each primer, 0.1 µL of
Advantage® Genomic LA Polymerase Mix (Clontech), 1 µL of Q-solution (Quiagen ®),
in order to stabilize the PCR reaction and minimize non-specific amplification, and 1.6
µL of DNA. The amplification conditions for the specific region approach were as follow:
94 ºC for 3 minutes, proceeded by 2 cycles at 98 ºC for 15 sec, 68ºC for 6 min, another
3 cycles at 98 ºC for 15 sec and 66 ºC for 6 min and another 30 cycles at 98 ºC for 15
sec and 64 ºC for 6 min and a final extension at 72 ºC for 10 min. For the whole gene
duplication were as follow: 94 ºC for 3 minutes, proceeded by 2 cycles at 98 ºC for 15
sec, 68ºC for 8 min, another 3 cycles at 98 ºC for 15 sec and 66 ºC for 8 min and another
30 cycles at 98 ºC for 15 sec and 64 ºC for 8 min and a final extension at 72 ºC for 10
min.
The amplification reactions were conducted in 2720 Thermal Cycler (Applied
Biosystems) or/and T100TM Thermal Cycler (BioRad).
2.1. Electrophoresis
All PCR products were run in agarose electrophoresis (1.5%) in order to assess
the success of the amplification reactions and the presence of possible contaminations.
Images of the DNA bands in the agarose gel were acquired using the ChemidocTM XRS+
System, with the aid of Quantity One 1-D Analysis Software.
3. SNP Genotyping
To obtain the genotyping data for SNPs (Figure 5), SNaPshotTM reactions were
performed. 11 single base extension (SBE) primers were designed in a similar way for
the amplification primers, only excepting that these end right before the target SNPs
(Table 3). Primer sequences were identical to those described in Sistonen et al. (2005)
(28). To promote differences in electrophoretic mobility, a non-annealing tail with different
sizes was added to the SBE primers.
FCUP 31 Updating the study of pharmacogenetic polymorphisms in the Portuguese Roma
Before the SNaPshotTM reactions, a purification step was performed with
ExoSAP-IT® in order to remove the surplus of dNTPs and primers present in the PCR
product. Each reaction contained 1 µL of amplified product and ExoSAP-IT® and the
thermocycler conditions used were 37ºC for 15 min and 85ºC for 15 min. A mix containing
all SBE primers was prepared with the following primer quantities: 0,1 µL of the 1659
G>A and 1846 G>A, 0,5 µL from the 4180 G>C and 0,2 µL for the remaining SNPs. The
SNaPshotTM reactions were carried out in a final volume of 5,2 µL containing 2 µL of
purified PCR product, 2,2 µL of SBE primer mix and 1 µL of SNaPshotTM Multiplex Kit
(Applied Biosystems). The reaction conditions were 25 cycles at 96ºC for 10 sec, 50ºC
for 5 sec and 60ºC for 30 sec. After this step, the products were treated with 1 µL of SAP
enzyme (USB®) at 37ºC for 60 min and 85ºC for 15 min. All these reactions were
performed in a 2720 Thermal Cycler (Applied Biosystems) and/or T100TM Thermal Cycler
(BioRad). Lastly, 1 µL of the SNaPshotTM purified products were mixed with 12 µL of Hi-
DiTM Formamide (Applied Biosystems) and Gene-ScanTM – 120 LIZTM size standard.
Capillary electrophoresis was then carried out in an ABI 3130 Genetic Analyser (Applied
Biosystems).
Table 3 - Primers used in the SNaPshotTM reactions.
Figure 5 - Representation of the CYP2D6 exons and the different positions of the SNPs analysed. Each number (1-9) represents the position of each
exon from 5’ to 3’. The primers used of each position are described in table 3. Adapted from Sistonen et al. (2005)
100C>T rs1065852 ACGCTGGGCTGCACGCTAC
1023C>T rs28371706 ACCGCCCGCCTGTGCCCATCA
1659G>A rs61736512 CTGACAAGCGCGAGCAGAGGCGCTTCTCC
1707delT rs5030655 GCAAGAAGTCGCTGGAGCAG
1846G>A rs3892097 CCGCATCTCCCACCCCCA
2549delA rs35742686 GATGAGCTGCTAACTGAGCAC
2615delAAG rs5030656 GCCTTCCTGGCAGAGATGGAG
2850C>T rs16947 AGCTTCAATGATGAGAACCTG
2988G>A rs28371725 AGTGCAGGGGCCGAGGGAG
3183G>A rs59421388 TGTCCAACAGGAGATCGACGAC
4180G>C rs1135840 GTGTCTTTGCTTTCCTGGTGA
Polymorphism Rs Sequence 5´-3 '
FCUP 32 Updating the study of pharmacogenetic polymorphisms in the Portuguese Roma
4. Sanger Sequencing
The Sanger Sequencing method was used to confirm results from the
SNaPshotTM reactions, using primers described in table 4. Initial purification was carried
out on the amplification products as described in section 3. The sequencing reactions
were performed in a final volume of 5 µL containing 2 µL of purified amplification product,
1 µL of the amplification primer at 4 µM, 1 µL of BigDye® Terminator v3.1 Cycle
Sequencing Kit and 1 µL of sequencing Buffer. The conditions used were as follow: 96ºC
for 4 min, followed by 35 cycles at 96ºC for 10 sec, 55ºC for 5 sec and 60ºC for 4 min,
and a final step at 60ºC for 10 min. The reactions were carried out in Thermal Cycler
(Applied Biosystems) or/and T100TM Thermal Cycler (BioRad). After this, the sequencing
products were purified in Sephadex® columns (760 µL) through centrifugation for 4 min
at 4400 rpm. The final products were resuspended in 12 µL of Hi-DiTM Formamide and
capillary electrophoresis was performed in an ABI 3130 Genetic Analyser (Applied
Biosystems).
NAME SEQUENCE 5 '-3 ' SNPs RANGED EXPECTED SIZE
CYP2D6_SEQ_1_F ATCTTCCTGCTCCTGGTGGAC 100C>T ~80 bp
CYP2D6_SEQ_2_F TTCAAATAGGACTAGGACCTGTA 1023C>T ~250bp
CYP2D6_SEQ_3_R GAATGTCCTTTCCCAAACCCAT 1659G>A; 1707delT; 1846G>A ~500 bp
CYP2D6_SEQ_4_F CACAGGAGGGATTGAGACCC 2549delA; 2615delAAG; 2850C>T; 2988G>A; 3183G>A ~800 bp
CYP2D6_SEQ_5_R TTATTGTACATTAGAGCCTCTGG 4180G>C ~100 bp
Table 4 - Primers used in the Sanger Sequencing reactions.

FCUP 33 Updating the study of pharmacogenetic polymorphisms in the Portuguese Roma
5. Data Analysis
The results obtained in the SNaPshotTM reactions were analysed using the
GeneMapper® v4.0 software and the sequencing data was analysed with Geneious Pro
5.5.8. The Arlequin Software v3.5 was used to test for Linkage Disequilibrium (L.D.),
estimate haplotype frequencies and to test deviations from the Hardy-Weinberg
Equilibrium.
In order to perform comparative analysis, data from previous works published
was used (25, 30, 41).
To evaluate the significance of the difference between the two proportions, the z-
ratio was calculated in the web site http://vassarstats.net/.
IV. RESULTS AND DISCUSSION
1. CYP2D6 Genotyping
After applying the strategy to detect the presence of the entire CYP2D6 gene,
positive results were observed in 55 of the 56 individuals tested. In the remaining subject,
the suspicion of being homozygous for the deletion was confirmed through the strategy
used to identify the deletion of the entire CYP2D6 gene, which was applied for all the
samples in this study. In figure 6 is depicted an example of an agarose electrophoresis
of different PCR products. As is illustrated, samples positive for the presence of the gene
presented a band corresponding to the whole gene (marked arbitrarily as “G”). That band
was absent in a unique individual (“X5” in Figure 6), who was also the unique presenting
the band expected when submitted to the approach undertaken to test the gene deletion
(marked as “X5 D”).
FCUP 34 Updating the study of pharmacogenetic polymorphisms in the Portuguese Roma
The 11-plex SNaPshotTM reaction was successfully developed and applied for all
the 56 samples. In figure 7 are shown illustrative CYP2D6 electropherograms obtained
for different individuals. The electropherogram at the bottom presented in the figure
corresponds to the result observed for sample “X5”, identified as a homozygous for the
gene deletion, which showed entire failure of the SNaPshotTM reaction, thereby
consistent with a gene deletion on this sample.
Lastly, a molecular strategy directed to the identification of gene duplications was
applied to the 55 samples positive for the presence of CYP2D6 (Figure 8), which allowed
to identify 3 individuals possibly harbouring that kind of copy number variations.
However, when the strategy used to validate the presence of the whole duplicated gene
Figure 7 – Example of an electropherogram performed in this study and respective predicted genotype. The last one
was obtained from the sample suspected to have a deletion of the whole gene, confirming our suspicion.
Figure 6 – Example of an Agarose Electrophoresis performed for the analysis of the whole gene and cases of gene deletion. Lanes 1 and
11- DNA molecular weight markers (Ladder 1 kb); Lanes 2 to 9 - samples amplified with the primers designed to detect the whole gene.
Lanes 12 to 18 - the same samples amplified with the primers designed to detect deletion of the whole gene. Lanes 10 and 20 – Negative
controls of the PCR reactions. Sample in lane 8 doesn’t present any band when tested for the presence of the whole gene, but presents a
band when tested for the deletion of the whole gene (Lane 18). Sample in lane 9 didn’t present any band after the two amplification
approaches, due to poor quality of DNA.

FCUP 35 Updating the study of pharmacogenetic polymorphisms in the Portuguese Roma
was applied to these 3 individuals (Figure 9), only in one of them was observed a positive
result, which was further confirmed after using the SNaPshotTM technique (Figure 10).
Thus, a gene duplication was detected in a unique individual from the studied Roma
sample.
Figure 8 – Example of an agarose electrophoresis performed to determine the presence or not of
duplication events. A control sample from the HGDP-CEPH (lane 1) was used as a positive control of the
amplification. Sample in lane 10 presents a band identical to the positive control, indicating the presence
of a duplication event. The bands presented in the remaining lanes (2-9) are due to non-specific
amplification.
Figure 9 – Example of an agarose electrophoresis performed to determine the presence of
the whole duplicated gene. A control sample from the HGDP-CEPH (Lane 2) was used again
as a positive control. In lane 1 is the negative control for the amplification. The 3 samples
tested (lane 3-5) were those identified through a previous approach as suspected to have a
gene duplication. Only one of them (lane 4) presented a positive result in the PCR assay
specific for the detection of the whole duplicated gene.

FCUP 36 Updating the study of pharmacogenetic polymorphisms in the Portuguese Roma
2. Inference of CYP2D6 diplotypes
Out of the 11 polymorphic positions screened in our sample, no variation was
detected at 1023C>T, 1659 G>A, 1707 del, 2615 delAAG and 3183 G>A. For the
remaining 6 polymorphisms, tests for Hardy-Weinberg equilibrium were performed
Table 5 – Results from the Hardy – Weinberg equilibrium test obtained for the 11 positions
Position n p - value s. d.
100 C>T 56 0.53450 0.00049
1023 C>T
1659 G>A
1707 delT
1846 G>A 56 1 0
2549 delA 56 1 0
2615 delAAG
2850 C>T 56 0.34462 0.00048
2988 G>A 56 1 0
3183 G>A
4180 G>C 56 0.00448 0.00007
Observable Heterozygosity Expected Heterozygosity
0.48214 0.43356
0.40851
0.13611
0.48440
Monomorphic
Monomorphic
Monomorphic
Monomorphic
Monomorphic
0.29091
0.14545
0.05354
0.41635
0.41818
0.05455
0.36364
Figure 10 – SNaPshotTM reaction performed to confirm the results of the whole duplicated gene approach. a) Control
Sample HGDP00531; b) Sample with duplication identified in the present study. In the electropherogram of the control
HGDP00531, known to have the genotype *2/*4N, the position 1846 is altered, presenting an A instead of a G, therefore
indicative of the duplication event in the allele *4. In our sample, the electropherogram did not reveal alterations in the
position 1846, as well as the remaining positions, therefore indicating that the duplicated gene harbors allele *1.

FCUP 37 Updating the study of pharmacogenetic polymorphisms in the Portuguese Roma
(Table 5), which uniquely revealed a significant departure between observed and
expected genotypic distributions at 4180 G>C due to an excess of homozygotes
(observed heterozygosity: 29,1%; expected: 48,4%), even after the Bonferroni correction
for multiple tests was applied.
As expected, significant Linkage Disequilibrium (L.D.) was detected between the
intergenic variations examined (Table 6). Accordingly, from the unphased genotypic
data, diplotypes were reconstructed for each individual using the EM algorithm
implemented in Arlequin, which was also used to estimate frequencies for the inferred
haplotypes.
The program has inferred 13 distinct haplotypes in our sample, all of which
corresponding to allelic variants or sub-variant already defined in the CYP Allele
Nomenclature Database.
Positions 100 C>T 1023 C>T 1659 G>A 1707 delT 1846 G>A 2549 delA 2615 delAAG 2850 C>T 2988 G>A 3183 G>A 4180 G>C
100 C>T * - - - + - - - - - +
1023 C>T - * - - - - - - - - -
1659 G>A - - * - - - - - - - -
1707 delT - - - * - - - - - - -
1846 G>A + - - - * + - + + - +
2549 delA - - - - + * - + + - +
2615 delAAG - - - - - - * - - - -
2850 C>T - - - - + + - * + - +
2988 G>A - - - - + + - + * - +
3183 G>A - - - - - - - - - * -
4180 G>C + - - - + + - + + - *
Table 6 – Results of Linkage Disequilibrium (L.D.) obtained for the 11 positions. Presence of L.D. (+); Absence of L.D. (-)
Table 7 - Haplotypes defining different CYP2D6 alleles, corresponding effects in enzyme activity and frequencies in the Portuguese Roma. Note:
Haplotype ID corresponds to the identifier provided by Arlequin, while the CYP2D6 allele designations and effects in enzyme activity were assigned
according to the CYP Allele Nomenclature Database.
1 T C G T A A AAG C G G C *4 None 0,238444 ± 0,0433
2 C C G T G A AAG C G G C *39 Normal 0,035977 ± 0,018525
3 T C G T A A AAG C G G G *4J None 0,009322 ± 0,009732
4 C C G T G A AAG C G G G *1 Normal 0,317943 ± 0,048101
5 T C G T G A AAG C G G C *10 Decreased 0,046051 ± 0,019395
6 C C G T G A AAG T G G C *2 Normal 0,179935 ± 0,040293
7 C C G T G G AAG C G G G *3 None 0,026786 ± 0,016723
8 C C G T G A AAG T A G C *41 Decreased 0,059859 ± 0,025156
9 C C G T G A AAG C A G G *41v Decreased 0,01157 ± 0,010385
10 C C G T G A AAG T G G G *34 Normal 0,027237 ± 0,018843
11 C C G T A A AAG C G G C *4M None 0,010337 ± 0,009338
12 T C G T A A AAG T G G C *4K None 0,018683 ± 0,01566
13 - - - - - - - - - - - *5 None 0,017857 ± 0,012943
Haplotype I.D 100 C>T 1023 C>T 1659 G>A 1707 del. T 1846 G>A 2549 del. A 2615 del. AAG 2850 C>T 2988 G>A 3183 G>A 4180 G>C CYP2D6 allele Enzyme Activity Frequency

FCUP 38 Updating the study of pharmacogenetic polymorphisms in the Portuguese Roma
In table 7 are presented the detected alleles, their frequencies in the sample of
Portuguese Roma and the effect of each allele in enzyme function. Allele CYP2D6*5,
which refers to the deletion of the gene and consequently to a non-functional allele, was
present in homozygosity in one individual. No heterozygous for the deletion were found,
although carriers could be identified with the methodological strategy used to detect this
kind of copy number variation. Given that the frequency of CYP2D6*5 was 1,8%, the
number of expected heterozygous in a sample of 56 individuals was 1,96, which is a
considerably low value, likely explaining that by chance heterozygous were missing in
the studied sample of Portuguese Roma.
Four other alleles were detected in the Roma that were associated to absence of
enzymatic activity: CYP2D6*4 and its subtypes *4J, *4M and *4K, all bearing the splice
site mutation 1846 G>A responsible for loss of activity, and CYP2D6*3, defined by 2549
del.A, which is a frameshift mutation also responsible for a non-functional product. Taken
together the alleles conferring none activity summed up 29,8 % in the sample. Two
partially functioning variants were identified, CYP2D6*10 and CYP2D6*41, both leading
to decreased enzymatic activity, that together were present at 11,7%. The remaining
detected alleles were normal function variants, including CYP2D6*1, which was the
commonest allele (30,4%), CYP2D6*2, *34 and *39. In total, the normal alleles reached
53.7% in the sample.
As mentioned, the analysis of copy number variation revealed the presence of
gene duplications in 1 individual, whose inferred genotype based on the SNaPshotTM
results was *1/*4. The approach used to amplify the whole gene duplication also
permitted to conclude that the duplicated gene involved the allele *1 of the genotype
*1/*4. Nevertheless, the approach does not allow to infer the number of gene copies
present in the individual.

FCUP 39 Updating the study of pharmacogenetic polymorphisms in the Portuguese Roma
3. Metabolic Profiles
In order to predict the theoretical metabolic profiles from the CYP2D6 genotypes,
we followed the strategy previously described by Gaedigk et al. (25, 31). It is referred to
as “Activity Score” System, according to which genotypes are categorized by the
‘‘number of active genes’’, alleles are grouped based on their assumed functionality,
active scores (AS) are assigned to each genotype and then ASs are translated into a
phenotype prediction that include the traditional classification as PM, IM, EM, and UM.
To calculate the AS, a value of 1 is assigned to normal alleles (i.e. *1, *2, *34, *39), 0.5
for reduced – activity alleles (i.e. *10, *17), 0 for null variant alleles (i.e. *3, *3xN, *4, *4K,
*3xN, *4xN, *5) and 2 for multiplications alleles like *1xN or 2*xN. Therefore, genotypes
with AS=0, were considered PM, with AS = 0,5 were considered IM, with AS = 1-2 were
considered EM and with AS≥2 were considered UM.
In Table 8 are presented the frequencies of the CYP2D6 genotypes in the
Portuguese Roma and their ascribed AS. For the three subjects known to harbour gene
duplications, only one presented a real duplicated event, which was the individual with
the genotype *1/*4, and the duplication event was in allele *1, but we still cannot infer
the extent of the duplication. Because he had at least two active gene, it is possible to
deduce that the active score is two or greater than two. In terms of predicted metabolic
profiles, the categories poor and intermediate metabolizers can be excluded, but he
might fall either in the group of extensive or ultra metabolizers, depending on the extent
of the duplicated allele.
FCUP 40 Updating the study of pharmacogenetic polymorphisms in the Portuguese Roma
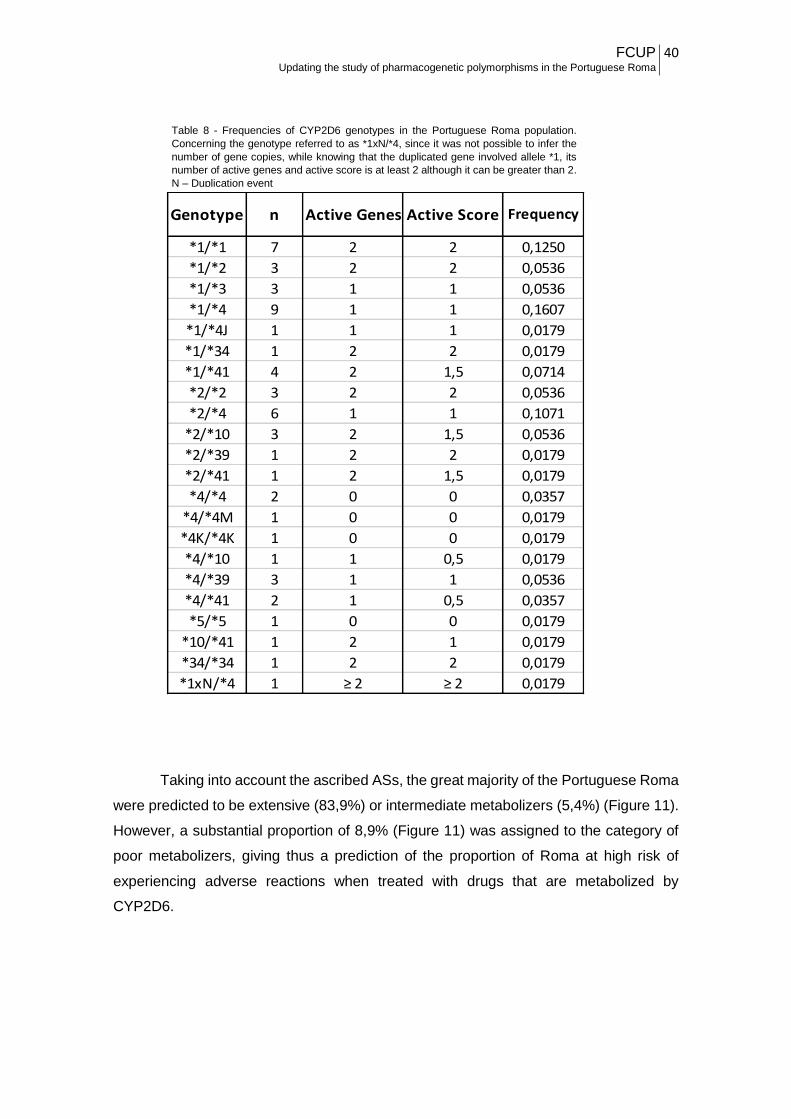
Taking into account the ascribed ASs, the great majority of the Portuguese Roma
were predicted to be extensive (83,9%) or intermediate metabolizers (5,4%) (Figure 11).
However, a substantial proportion of 8,9% (Figure 11) was assigned to the category of
poor metabolizers, giving thus a prediction of the proportion of Roma at high risk of
experiencing adverse reactions when treated with drugs that are metabolized by
CYP2D6.
Table 8 - Frequencies of CYP2D6 genotypes in the Portuguese Roma population.
Concerning the genotype referred to as *1xN/*4, since it was not possible to infer the
number of gene copies, while knowing that the duplicated gene involved allele *1, its
number of active genes and active score is at least 2 although it can be greater than 2.
N – Duplication event
*1/*1 7 2 2 0,1250
*1/*2 3 2 2 0,0536
*1/*3 3 1 1 0,0536
*1/*4 9 1 1 0,1607
*1/*4J 1 1 1 0,0179
*1/*34 1 2 2 0,0179
*1/*41 4 2 1,5 0,0714
*2/*2 3 2 2 0,0536
*2/*4 6 1 1 0,1071
*2/*10 3 2 1,5 0,0536
*2/*39 1 2 2 0,0179
*2/*41 1 2 1,5 0,0179
*4/*4 2 0 0 0,0357
*4/*4M 1 0 0 0,0179
*4K/*4K 1 0 0 0,0179
*4/*10 1 1 0,5 0,0179
*4/*39 3 1 1 0,0536
*4/*41 2 1 0,5 0,0357
*5/*5 1 0 0 0,0179
*10/*41 1 2 1 0,0179
*34/*34 1 2 2 0,0179
*1xN/*4 1 ≥ 2 ≥ 2 0,0179
Genotype n Active Genes Active Score Frequency

FCUP 41 Updating the study of pharmacogenetic polymorphisms in the Portuguese Roma
As stated before, while we could infer that only one individual presented a
duplication, it was not possible to deduce the extent of the duplication event, which is the
total of gene copies contained in the chromosome with the duplication. This individual
has a minimum number of two CYP2D6 genes but in fact can have more than two copies,
and so he is the unique candidate in the Roma sample that theoretically can be ultrarapid
metabolizer. As follows, we can only anticipate that this metabolic category in the
Portuguese Roma might range from 0 and the maximum frequency of 1,8%. Depending
on that, the frequency of extensive metabolisers can also vary between the minimum
estimate at 83.9% and a maximum of 85.7%, with the latter value registered if the
individual is not ultra metabolizer.
Figure 11 - Frequencies of theoretical metabolic profiles in the Portuguese Roma
population. EM – Extensive Metabolizers; IM – Intermediate Metabolizers; PM – Poor
Metabolizers; UM – Ultrarapid Metabolizers.
FCUP 42 Updating the study of pharmacogenetic polymorphisms in the Portuguese Roma
4. Comparison with other populations
To put the data here obtained for the Portuguese Roma in a broad population
context, we took advantage on a recently study that constitutes the most comprehensive
work up to now performed summarizing CYP2D6 allele frequencies, diplotypes and
predicted phenotype across major populations (25). The study was based on an
exhaustive data compilation from the literature, which ended up with hundred entries for
multiple ethnic groups and populations from different geographical regions, including two
about the Portuguese previously studied for CYP2D6 (30, 41).
Among the many population entries in the work of Gaedigk et al. (2016), we
selected a few to illustrate the distribution of CYP2D6 alleles in European and Asian
populations, which are presented in Table 9, where are also included the results from
the present study.
As we can notice, there are many alleles without information for most of the
populations listed in Table 9. This is not a consequence of any bias arising from our
selection criteria, but only the reflex of the variety of genotyping strategies used in
different studies. Owing to the major contribution to the metabolism and
biotransformation of numerous drugs, CYP2D6 is one of the pharmacogenes most
extensively analysed, although based in genotyping assays that greatly varied between
studies. Many examined a small number of variations within the gene, usually coinciding
with the allelic variants most common and with a widespread distribution, and
consequently several variants certainly escaped detection. This causes a problematic
skewed distribution, falsely overestimating the frequency of the default allele, that is the
allelic category in which are included all those alleles not bearing any of the variations
examined.

FCUP 43 Updating the study of pharmacogenetic polymorphisms in the Portuguese Roma
Ta
ble
9 –
Fre
quencie
s o
f C
YP
2D
6 v
aria
nt
alle
les in d
iffe
rent
popula
tions.
Regard
ing t
he r
esults o
f C
orr
eia
et
al. (
2009),
sin
ce t
hey d
on’t indic
ate
the f
requency o
f norm
al alle
les,
for
com
para
tive a
naly
sis
, w
e d
ecid
ed to a
ttrib
ute
the r
em
ain
ing f
requency le
ft (
0,7
45)
as n
orm
al alle
les n
– P
opula
tio
n S
ize; S
um
– S
um
mato
ry o
f fr
equencie
s o
f each c
ate
gory
*1
*2*3
4*3
9Ot
hers
Sum
*3*4
*5*6
Othe
rsSu
m*9
*10
*17
*41
Sum
Portu
gues
e Ro
ma
560,
318
0,18
00,
027
0,03
6-
0,56
10,
027
0,27
70,
018
0,00
0-
0,32
10,
000
0,04
60,
000
0,06
00,
106
Portu
gues
e10
0-
--
-0,
745
0,74
50,
014
0,13
30,
028
0,01
9-
0,19
4-
--
-0,
000
Portu
gues
e30
00,
377
0,33
3-
--
0,71
00,
005
0,18
20,
025
0,00
2-
0,21
4-
0,03
50,
01-
0,04
5
Span
ish10
50,
320
0,40
5-
--
0,72
50,
010
0,13
80,
033
0,00
95-
0,19
00,
0238
0,01
9-
-0,
043
Mac
edon
ians
184
0,18
50,
108
0,05
40,
146
0,11
90,
612
0,00
80,
187
0,09
10
-0,
286
0,01
60,
027
-0,
043
Hung
aria
ns11
20,
404
0,15
1-
-0,
085
0,64
00,
018
0,20
40,
018
0,00
40,
004
0,24
80,
014
--
0,08
0,09
4
Hung
aria
n Ro
ma
426
0,58
0-
--
-0,
580
-0,
204
--
-0,
204
-0,
216
--
0,21
6
Turk
ish40
40,
371
0,35
3-
--
0,72
40
0,11
30,
015
0,00
70,
005
0,14
00,
006
0,06
10,
011
-0,
078
Russ
ian
1230
0,35
10,
357
--
-0,
708
0,01
30,
177
0,01
60,
010,
004
0,22
0-
--
0,07
60,
076
Aust
rians
930,
362
0,27
3-
--
0,63
50,
005
0,14
0,01
60,
005
-0,
166
0,01
60,
043
00,
124
0,18
3
Germ
ans
589
0,36
40,
324
--
-0,
688
0,02
0,20
70,
020
0,00
90,
008
0,26
40,
018
0,01
5-
-0,
033
Dani
sh24
40,
386
0,18
4-
--
0,57
00,
016
0,19
70,
053
0,01
3-
0,27
90,
029
0,01
60
0,09
80,
143
Swed
ish28
10,
374
0,32
4-
--
0,69
80,
014
0,24
40,
043
0,00
09-
0,30
2-
--
-0,
000
Finn
ish86
0,36
0,38
4-
--
0,74
40,
017
0,08
10,
035
0,01
2-
0,14
50
0,01
20
0,05
80,
070
North
Indi
ans
125
0,39
60,
336
--
-0,
732
-0,
1-
--
0,10
0-
0,16
8-
-0,
168
Sout
hern
Indi
ans
447
0,45
80,
348
--
-0,
806
00,
073
0,01
9-
-0,
092
-0,
102
0-
0,10
2
Wes
t Ind
ians
160
0,43
50,
231
--
-0,
666
0,00
30,
103
0,01
90
-0,
125
00,
059
00,
125
0,18
4
Irani
ans
100
0,43
50,
32-
--
0,75
5-
0,12
50,
03-
-0,
155
-0,
090
-0,
090
Bedo
uins
500,
490,
09-
--
0,58
00
0,04
0,03
--
0,07
0-
0,02
0,02
0,29
0,33
0
0,01
8
- 0,02-
0,04
1
- -
0,02
5
0,05
8
-
0,01
6
0,01
9
0,00
8
0,01
8
Popu
latio
nn
0,03
2
0,04
3
0,06
1
-
Norm
al A
llele
sDe
fect
ive
Alle
les
Mul
tiplic
atio
nsRe
duce
d - A
ctiv
ity A
llele
s
0,05
9
FCUP 44 Updating the study of pharmacogenetic polymorphisms in the Portuguese Roma
The default allele is usually assumed to be CYP2D6*1 also referred to as the
“wild-type” allele, which might then encompass the “non-normal” alleles that could not be
detected with the screened positions. In this work we used a CYP2D6 genotyping
technique that allows the detection of 11 of the most relevant polymorphic positions in
the gene covering the majority of the clinically important mutations (28). However, most
of those positions were not included in previous conventional typing methods, not
including those more recently developed or obviously those relying in high-throughput
assays that are still very scarce (42, 43). This represented a setback regarding
comparative statistical analysis. For instance, allele *41, which is a reduced - activity
allele, is characterized by the presence of A instead of a G in position 2988, but also
presents a T instead of a C in position 2850 and a C instead of a G in position 4180.
Allele *2 is characterized by the presence of a T instead of a C in position 2850 and a C
instead of a G in position 4180. If the SNP 2988 G>A is not analysed, we can misidentify
an individual as *2/*2, when he could be *2/*41 or *41/*41.
Another issue in the comparative analysis was the difficulty to deal with
multiplications. Although we developed a strategy to identify the allele duplicated, we
could not infer the number of copies present with this approach. Therefore, and for the
sake of simplicity, we have agglomerated the distinct types of multiplications reported in
the populations considered in Table 9 in one single group, named “Multiplications”.
Regarding the set of normal alleles as a whole, including *1, *2, *34, *39 and
“Others”, we can see that the Portuguese Roma present one of the lowest frequencies
among Eurasian populations. For instance, comparatively to the host population, normal
alleles summed up 71%, whereas the frequency in the Roma was substantially lower
(56,1%), with the difference being statistically significant (P= 0,001 in the z-ratio for the
significance of the difference between the two proportions). In compensation, the total
frequency of defective alleles in the Portuguese Roma (32,1%) lies in the limit of the
upper range of values until now reported. Focusing again in the comparison with the
Portuguese host population, all defective alleles present in the Roma (*3, *4 and *5) are
also present in the Portuguese host population. However, it is remarkable the increased
frequency of the null allele CYP2D6*4 in the Roma (27,7%), comparatively to other
Portuguese, among whom the frequency is considered below 20%.
FCUP 45 Updating the study of pharmacogenetic polymorphisms in the Portuguese Roma
As for reduced – activity alleles, two variants are present in the Portuguese
Roma: CYP2D6*10, with a frequency of 4,6% and CYP2D6*41, with a frequency of 7,1%.
The first was also found in the Portuguese host population, while the second one was
not screened up to now in other Portuguese. Both CYP2D6*10 and *41 are encountered
in most other European populations, with a typical frequency range in which fall the
values observed in the Portuguese Roma. Interestingly, CYP2D6*10 is very well
represented in Indian populations, particularly from the North where it reaches 16.8%,
as well is CYP2D6*41, at least in West India (12,5%), once it was not yet screened in
other Indian populations. Actually, the distribution of latter allele is still very scarcely
known because often it was not included in the CYP2D6 typing methods. The highest
frequency up to now reported in Europe was among Austrians, attaining 12.4%, thus a
value similar to the reported for Western Indians.
Data for CYP2D6 was available for a Roma group from Hungary (Table 9),
although based on a panel of variations with low resolution, and so only allowed to
identify the alleles CYP2D6*4 and *10, two variants we found in the Portuguese Roma,
but also widespread in other populations. However, a finding that deserves attention is
the high frequency of CYP2D6*4 in the Hungarian Roma (22,5%), though lower than
among the Portuguese Roma (27,7%) as well as the very high proportion of CYP2D6*10
(26.6%). In non-Roma European populations, very rarely CYP2D6*4 exceeds 20% (two
unique reports in the Swedish, 24.4%, and, suggestively, in the Hungarian non-Roma,
20.4%), while the values of CYP2D6*10 in Europe are usually lower than 5%. The
atypically increased frequencies of some CYP2D6 alleles in the Portuguese and
Hungarian Roma, is fully consistent with what is known about the demographic history
of Roma groups, which along time was always accompanied by remarkable founder
events.
In respect to the multiplications, we can see that the frequency of 1.8% in the
Portuguese fits well the values reported for other populations. Notably, the distribution of
multiplications across populations is quite uniform.

FCUP 46 Updating the study of pharmacogenetic polymorphisms in the Portuguese Roma
In terms of metabolic profiles, we recall that the inferred theoretical categorization
in the Portuguese Roma was 83.9% for EM, 5.4% for IM, 8.9% for PM and 1.8% still
partially unknown, which can only fall in EM or UM, but for the sake of comparative
analysis, we decided to consider it UM. In order to compare this profile with that from
the Portuguese non-Roma, we applied the same criteria to the raw data presented by
Albuquerque et al, which has yielded the following proportions: 88.7% for EM, 0.7% for
IM, 6.3% for PMs and 4.3% for UM. Figure 12 shows the profiles of the Portuguese Roma
and non-Roma, which despite not differing too much, reveal that the proportion of PMs
in the Roma is slightly higher than in non-Roma, but the difference is not statistically
significant (P=0.228), and that the proportion of IM in the Roma is also higher than in
non-Roma, but in this category difference reaches statistical significance (P=0.006). This
is due to elevated frequency of null variant alleles detected in the Portuguese Roma,
namely alleles *4 and *10, which have contributed to diminish the frequency of EMs at
the cost of increased frequency of PMs plus IMs individuals.
Figure 12 - Frequencies of theoretical metabolic profiles. a) Portuguese Roma (current study); b) Portuguese host (Albuquerque et al. 2013).
EM – Extensive Metabolizers; IM – Intermediate Metabolizers; PM – Poor Metabolizers; UM – Ultrarapid Metabolizers;

FCUP 47 Updating the study of pharmacogenetic polymorphisms in the Portuguese Roma
V. FINAL REMARKS
In this study we have applied a high resolution SNaPshotTM methodology to
characterize CYP2D6 in a sample of Portuguese Roma.
The results obtained led to conclude that when Portuguese Roma are submitted
to treatments with drugs in which CYP2D6 acts in the biotransformation, they likely will
be more susceptible to adverse drug reactions than other Portuguese, because they
have higher frequencies of null CYP2D6 alleles. And this is where, like it has been
discussed throughout the years, pharmacogenetic will have a preponderant role in
clinical practice. With the improvement and introduction of genetic test in the clinical
setting, there will be the possibility of developing the so called “Personalized Medicine”,
which will give the physician the tools needed to not only prescribe the right dose of the
drug necessary, but also monitor the response of the patient throughout the treatment.
Expectation are growing with the raise of high-throughput genomic approaches.
Respecting CYP2D6 micro-chip/array analysis is already often applied, it has some
disadvantages because this methodology cannot discriminate accurately the number of
active genes, which is critical in cases of UM individuals (30). Next generation
sequencing is a powerful tool, but was also demonstrated to be problematic in the
analyses of CYP genes. Therefore, there is an imperative need to develop a more
reliable, efficient and cost – effective method, in order to be more commonly used in
clinical practice. There has been some works developed in that way, mainly through the
use of WGS (Whole – Genome Sequencing). This method has been successfully applied
to the molecular diagnosis of genetic diseases, particularly in a clinical paediatric context,
in cases of neurodevelopment disorders, to diagnose suspected underlying genetic
diseases (43). Although we are still far of recommending WGS as the platform for routine
pharmacogenetic testing, a study was already published by Twist et al. (42), reporting
the development of a “computational method for automated derivation of diploid
functional haplotypes from unphased WGS” for the CYP2D6 gene, designated as
“Constellation”, which allows to detect all gene variants, including gene conversions and
rearrangements. Nevertheless, the method encountered some setbacks as, for instance,
it cannot consistently detect some rare variants like CYP2D6*68+*4, a tandem
arrangement featuring a hybrid CYP2D6 / CYP2D7 gene upstream of a nonfunctional
FCUP 48 Updating the study of pharmacogenetic polymorphisms in the Portuguese Roma
CYP2D6*4. Despite the many works and efforts towards the implementation of
pharmacogenetics in clinical practice, its application is still somehow new.
Another issue that needs further investigation is the correlation between the
predicted metabolic profiles and levels of enzymatic activity assessed through
biochemical assays. Although strong correlations have been reported mainly for
European populations, given the complexity of the variations in CYP2D6, more studies
are still needed to validate inferences based on genotypic data and avoid thus
misidentification of metabolic categories. For instance, an individual predicted to be EM,
might have an unsuspected and so unscreened null variant allele causing decrease of
enzyme activity, which would escape detection by conventional genotypic analysis.
With the development of this study, even though our primary goal was to explore
the knowledge regarding allelic frequencies and theoretical metabolic profiles at the
CYP2D6 gene in the Portuguese Roma, we also intend to aware to the impact that
pharmacogenetics can have in clinical practice and that there is a great need to improve
on this field. The implementation of Pharmacogenetics in the clinical setting cannot
exempt the individualization of genetic tests. However, the knowledge of the specificities
of groups like the Roma might alert for the need to rethink dedicated measures in terms
of health care.

FCUP 49 Updating the study of pharmacogenetic polymorphisms in the Portuguese Roma
VI. BIBLIOGRAPHY
1. Abrahams E. Letter from the Executive Director: Latest News & Updates from the Personalized Medicine Coalition. Personalized Medicine. 2009;6:245. 2. Nebert DW. Pharmacogenetics and pharmacogenomics: why is this relevant to the clinical geneticist? Clinical Genetics. 1999;56:247-258. 3. Touw DJ, Neef C, Thomson AH, Vinks AA. Cost-effectiveness of therapeutic drug monitoring: a systematic review. Therapeutic Drug Monitoring. 2005;27:10-17. 4. Berm EJ, Looff M, Wilffert B, Boersma C, Annemans L, Vegter S, et al. Economic Evaluations of Pharmacogenetic and Pharmacogenomic Screening Tests: A Systematic Review. Second Update of the Literature. PloS one. 2016;11:e0146262. 5. Cascorbi I, Bruhn O, Werk AN. Challenges in pharmacogenetics. European Journal of Clinical Pharmacology. 2013;69:17-23. 6. Ma Q, Lu AYH. Pharmacogenetics, Pharmacogenomics, and Individualized Medicine. Pharmacological Reviews. 2011;63:437-459. 7. Fonseca S, Amorim A, Costa HA, Franco J, Porto MJ, Santos JC, et al. Sequencing CYP2D6 for the detection of poor-metabolizers in post-mortem blood samples with tramadol. Forensic Science International. 2016;265:153-159. 8. Musshoff F, Stamer UM, Madea B. Pharmacogenetics and forensic toxicology. Forensic Science International 2010;203:53-62. 9. Gladding PA. Clinical applications of pharmacogenetics: present and near future. Cleveland Clinical Journal of Medicine. 2013;80:477-482. 10. Johnson JA, Burkley BM, Langaee TY, Clare-Salzler MJ, Klein TE, Altman RB. Implementing Personalized Medicine: Development of a Cost-Effective Customized Pharmacogenetics Genotyping Array. Clinical Pharmacology & Therapeutics. 2012;92:437-439. 11. Ross S, Anand SS, Joseph P, Paré G. Promises and challenges of pharmacogenetics: an overview of study design, methodological and statistical issues. JRSM Cardiovascular Disease. 2012;1. 12. Kupiec TC, Raj V, Vu N. Pharmacogenomics for the Forensic Toxicologist. Journal of Analytical Toxicology. 2006;30:65-72. 13. Shabaruddin FH, Fleeman ND, Payne K. Economic evaluations of personalized medicine: existing challenges and current developments. Pharmacogenomics and Personalized Medicine. 2015;8:115-126. 14. Timbrell JA, Marrs TC. Biotransformation of Xenobiotics. General, Applied and Systems Toxicology: John Wiley & Sons, Ltd; 2009.

FCUP 50 Updating the study of pharmacogenetic polymorphisms in the Portuguese Roma
15. Zanger UM, Schwab M. Cytochrome P450 enzymes in drug metabolism: Regulation of gene expression, enzyme activities, and impact of genetic variation. Pharmacology & Therapeutics. 2013;138:103-141. 16. Wang H, LeCluyse EL. Role of Orphan Nuclear Receptors in the Regulation of Drug-Metabolising Enzymes. Clinical Pharmacokinetics. 2003;42:1331-1357. 17. Xu C, Li CY-T, Kong A-NT. Induction of phase I, II and III drug metabolism/transport by xenobiotics. Archives of Pharmacal Research. 2005;28:249-268. 18. Jakoby WB, Ziegler DM. The enzymes of detoxication. Journal of Biological Chemistry. 1990;265:20715-20718. 19. Pilgrim JL, Gerostamoulos D, Drummer OH. Review: Pharmacogenetic aspects of the effect of cytochrome P450 polymorphisms on serotonergic drug metabolism, response, interactions, and adverse effects. Forensic Science, Medicine, and Pathology. 2011;7:162-184. 20. Guengerich FP. Cytochrome P450s and other enzymes in drug metabolism and toxicity. The AAPS Journal. 2006;8:E101-E11. 21. McKinnon RA. Cytochrome P450 1. Multiplicity and Function. The Australian Journal of Hospital Pharmacy. 2000;30:54-56. 22. Sim SC, Ingelman-Sundberg M. The Human Cytochrome P450 (CYP) Allele Nomenclature website: a peer-reviewed database of CYP variants and their associated effects. Human Genomics. 2010;4:278-281. 23. Sim SC, Miller WL, Zhong XB, Arlt W, Ogata T, Ding X, et al. Nomenclature for alleles of the cytochrome P450 oxidoreductase gene. Pharmacogenetics and Genomics. 2009;19:565-566. 24. Ingelman-Sundberg M. Pharmacogenetics of cytochrome P450 and its applications in drug therapy: the past, present and future. Trends in Pharmacological Sciences. 2004;25:193-200. 25. Gaedigk A, Sangkuhl K, Whirl-Carrillo M, Klein T, Leeder JS. Prediction of CYP2D6 phenotype from genotype across world populations. Genetics in Medicine. 2016. 26. He Z-X, Chen X-W, Zhou Z-W, Zhou S-F. Impact of physiological, pathological and environmental factors on the expression and activity of human cytochrome P450 2D6 and implications in precision medicine. Drug Metabolism Reviews. 2015;47:470-519. 27. Indiana, University. P450 Drug Interactions Abbreviated "Clinically Relevant" Table Department of Medicine - Indiana University, USA2016 [cited 2016]. Available from: http://medicine.iupui.edu/clinpharm/ddis/clinical-table.
28. Sistonen J, Fuselli S, Levo A, Sajantila A. CYP2D6 genotyping by a multiplex primer extension reaction. Clinical Chemistry. 2005;51:1291-1295. 29. Gaedigk A, Ndjountche L, Divakaran K, Dianne Bradford L, Zineh I, Oberlander TF, et al. Cytochrome P4502D6 (CYP2D6) gene locus heterogeneity: characterization of gene duplication events. Clinical Pharmacology and Therapeutics. 2007;81:242-251.
FCUP 51 Updating the study of pharmacogenetic polymorphisms in the Portuguese Roma
30. Albuquerque J, Ribeiro C, Naranjo MEG, Llerena A, Grazina M. Characterization of CYP2D6 genotypes and metabolic profiles in the Portuguese population: pharmacogenetic implications. Personalized Medicine. 2013;10:709-18. 31. Gaedigk A, Simon SD, Pearce RE, Bradford LD, Kennedy MJ, Leeder JS. The CYP2D6 Activity Score: Translating Genotype Information into a Qualitative Measure of Phenotype. Clinical Pharmacology & Therapeutics. 2008;83:234-242. 32. Sistonen J, Sajantila A, Lao O, Corander J, Barbujani G, Fuselli S. CYP2D6 worldwide genetic variation shows high frequency of altered activity variants and no continental structure. Pharmacogenet Genomics. 2007;17:93-101. 33. Burchard EG, Ziv E, Coyle N, Gomez SL, Tang H, Karter AJ, et al. The importance of race and ethnic background in biomedical research and clinical practice. The New England Journal of Medicine. 2003;348:1170-1175. 34. Moorjani P, Patterson N, Loh P-R, Lipson M, Kisfali P, Melegh BI, et al. Reconstructing Roma History from Genome-Wide Data. PLoS ONE. 2013;8:e58633. 35. IovitĂ RP, Schurr TG. Reconstructing the Origins and Migrations of Diasporic Populations: The Case of the European Gypsies. American Anthropologist. 2004;106:267-281. 36. Mendizabal I, Valente C, Gusmao A, Alves C, Gomes V, Goios A, et al. Reconstructing the Indian origin and dispersal of the European Roma: a maternal genetic perspective. PloS one. 2011;6:e15988. 37. Regueiro M, Rivera L, Chennakrishnaiah S, Popovic B, Andjus S, Milasin J, et al. Ancestral modal Y-STR haplotype shared among Romani and South Indian populations. Gene. 2012;504:296-302. 38. Teixeira J, Amorim A, J. Prata M, Quental S. Pharmacogenetic Polymorphisms in a Portuguese Gypsy Population. Current Pharmacogenomics and Personalized Medicine. 2015;13:36-40. 39. Lareu MV, Phillips CP, Carracedo A, Lincoln PJ, Syndercombe Court D, Thomson JA. Investigation of the STR locus HUMTH01 using PCR and two electrophoresis formats: UK and Galician Caucasian population surveys and usefulness in paternity investigations. Forensic Science International. 1994;66:41-52. 40. Kramer WE, Walker DL, O'Kane DJ, Mrazek DA, Fisher PK, Dukek BA, et al. CYP2D6: novel genomic structures and alleles. Pharmacogenetics and Genomics. 2009;19:813-822. 41. Correia C, Santos P, Coutinho AM, Vicente AM. Characterization of pharmacogenetically relevant CYP2D6 and ABCB1 gene polymorphisms in a Portuguese population sample. Cell Biochemistry and Function. 2009;27:251-255. 42. Twist GP, Gaedigk A, Miller NA, Farrow EG, Willig LK, Dinwiddie DL, et al. Constellation: a tool for rapid, automated phenotype assignment of a highly polymorphic pharmacogene, CYP2D6, from whole-genome sequences. Npj Genomic Medicine. 2016;1:15007.

FCUP 52 Updating the study of pharmacogenetic polymorphisms in the Portuguese Roma
43. Bainbridge MN, Wiszniewski W, Murdock DR, Friedman J, Gonzaga-Jauregui C, Newsham I, et al. Whole-Genome Sequencing for Optimized Patient Management. Science Translational Medicine. 2011;3:87re3-re3.