pharmacogenetic testing for patients being treated with ... health & science university 3030 sw...
TRANSCRIPT

Pharmacogenetic testing for patients being
treated with oral anticoagulants
Draft evidence report
March 6, 2018
Health Technology Assessment Program (HTA)
Washington State Health Care Authority
PO Box 42712
Olympia, WA 98504-2712
(360) 725-5126
www.hca.wa.gov/about-hca/health-technology-assessment

Pharmacogenetic Testing for Patients Being
Treated with Oral Anticoagulants
Draft Evidence Report
March 6, 2018
Prepared by:
Center for Evidence-based Policy
Oregon Health & Science University
3030 SW Moody, Suite 250
Portland, OR 97201
Phone: 503.494.2182
Fax: 503.494.3807
http://centerforevidencebasedpolicy.org/
Authors:
Valerie King, MD, MPH, Craig Mosbaek, MPH, Allison Leof, PhD, Curtis Harrod, PhD, MPH
The authors would like to acknowledge the contributions of the following:
Galen Gamble, BA, Andrew Hamilton, MLS, MS, Joan Holup, MA, Anitra Ingham, MA, MFA,
Heather Katcher, PhD, RD, Chris Kelleher, BA, and the independent peer reviewers of this report

This health technology assessment report is based on research conducted by the Center for
Evidence-based Policy (Center) under contract to the Washington State Health Care Authority
(HCA). This report is an independent assessment of the technology question(s) described based
on accepted methodological principles. The findings and conclusions contained herein are those
of the authors, who are responsible for the content. These findings and conclusions do not
necessarily represent the views of the Washington HCA and thus, no statement in this report
shall be construed as an official position or policy of the HCA.
The information in this assessment is intended to assist health care decision makers, clinicians,
patients, and policy makers in making evidence-based decisions that may improve the quality
and cost-effectiveness of health care services. Information in this report is not a substitute for
sound clinical judgment. Those making decisions regarding the provision of health care services
should consider this report in a manner similar to any other medical reference, integrating the
information with all other pertinent information to make decisions within the context of
individual patient circumstances and resource availability.
About the Center for Evidence-based Policy
The Center is recognized as a national leader in evidence-based decision making and policy
design. The Center understands the needs of policymakers and supports public organizations by
providing reliable information to guide decisions, maximize existing resources, improve health
outcomes, and reduce unnecessary costs. The Center specializes in ensuring that diverse and
relevant perspectives are considered and appropriate resources are leveraged to strategically
address complex policy issues with high-quality evidence and collaboration. The Center is based
at Oregon Health & Science University in Portland, Oregon.
Conflict of Interest Disclosures: No authors have conflicts of interest to disclose. All authors have
completed and submitted the Oregon Health & Science University form for Disclosure of
Potential Conflicts of Interest, and none were reported.

WA – Health Technology Assessment March 6, 2018
Pharmacogenetic testing for patients treated with anticoagulants: Draft evidence report i
Table of Contents
List of Tables ..................................................................................................................................................................... ii
List of Figures ................................................................................................................................................................... iii
List of Abbreviations ..................................................................................................................................................... iv
Executive Summary ........................................................................................................................................................ 1
Structured Abstract .................................................................................................................................................... 1
Background ................................................................................................................................................................... 4
Methods ......................................................................................................................................................................... 5
Results ............................................................................................................................................................................. 7
Clinical Practice Guidelines .................................................................................................................................. 18
Selected Payer Coverage Determinations ...................................................................................................... 19
Conclusions ................................................................................................................................................................ 19
Technical Report ........................................................................................................................................................... 23
Background ................................................................................................................................................................ 23
Policy Context ........................................................................................................................................................... 25
Washington State Utilization and Cost Data................................................................................................. 25
Methods ...................................................................................................................................................................... 30
Evidence Summary .................................................................................................................................................. 38
Clinical Practice Guidelines .................................................................................................................................. 71
Selected Payer Coverage Determinations ...................................................................................................... 72
Conclusions ................................................................................................................................................................ 73
References....................................................................................................................................................................... 76
Appendix A. Search Strategy ................................................................................................................................... 84
Appendix B. Additional Methods ........................................................................................................................... 87
Appendix C. Evidence Tables ................................................................................................................................... 92
Appendix D. Risk of Bias Assessments ............................................................................................................... 119
Appendix E. Additional Meta-analysis Figures ................................................................................................ 126
Appendix F. GRADE Quality of Evidence ........................................................................................................... 133
Appendix G. Studies Registered at ClinicalTrials.gov ................................................................................... 136
Appendix H. Detailed Payer Policies ................................................................................................................... 141
Appendix I. See Attachment for Excluded Studies ........................................................................................ 143

WA – Health Technology Assessment March 6, 2018
Pharmacogenetic testing for patients treated with anticoagulants: Draft evidence report ii
List of Tables
Table 1. Study Inclusion and Exclusion Criteria ................................................................................................ 31
Table 2. Cost-Effectiveness Estimates of Cost/QALY for Pharmacogenetic Warfarin Dosing ......... 67
Table 3. GRADE Summary of Evidence ................................................................................................................ 69
Table 4. Study Characteristics .................................................................................................................................. 93
Table 5. Participant Demographic Characteristics ........................................................................................... 96
Table 6. Participant Characteristics by Indication ............................................................................................ 97
Table 7. Evidence Table for Outcomes Used in Meta-analysis ................................................................... 98
Table 8. Evidence Table for Additional Outcomes (not included in meta-analysis) ......................... 107
Table 9. Evidence Table for Economic Outcomes .......................................................................................... 115
Table 10. Risk of Bias: Randomized Controlled Trials ................................................................................... 119
Table 11. Risk of Bias: Economic Studies ........................................................................................................... 123
Table 12. Risk of Bias: Guidelines ......................................................................................................................... 125
WA – Health Technology Assessment March 6, 2018
Pharmacogenetic testing for patients treated with anticoagulants: Draft evidence report iii
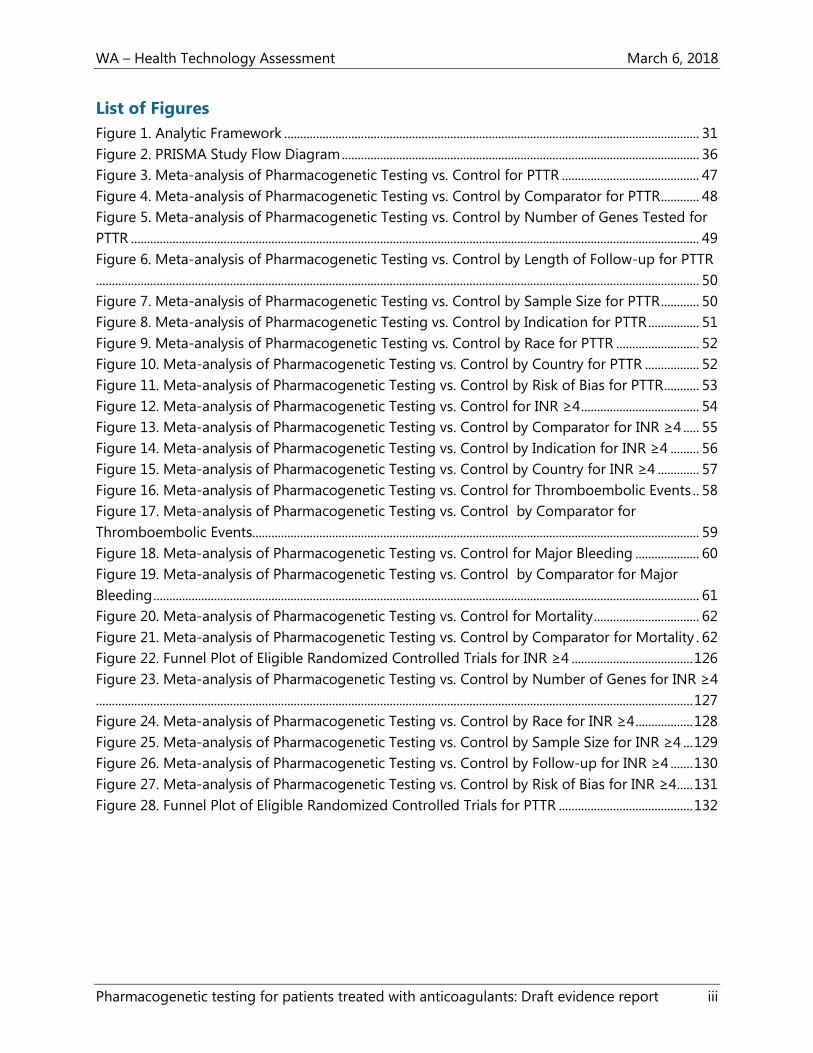
List of Figures
Figure 1. Analytic Framework .................................................................................................................................. 31
Figure 2. PRISMA Study Flow Diagram ................................................................................................................ 36
Figure 3. Meta-analysis of Pharmacogenetic Testing vs. Control for PTTR ........................................... 47
Figure 4. Meta-analysis of Pharmacogenetic Testing vs. Control by Comparator for PTTR ............ 48
Figure 5. Meta-analysis of Pharmacogenetic Testing vs. Control by Number of Genes Tested for
PTTR .................................................................................................................................................................................. 49
Figure 6. Meta-analysis of Pharmacogenetic Testing vs. Control by Length of Follow-up for PTTR
............................................................................................................................................................................................. 50
Figure 7. Meta-analysis of Pharmacogenetic Testing vs. Control by Sample Size for PTTR ............ 50
Figure 8. Meta-analysis of Pharmacogenetic Testing vs. Control by Indication for PTTR ................ 51
Figure 9. Meta-analysis of Pharmacogenetic Testing vs. Control by Race for PTTR .......................... 52
Figure 10. Meta-analysis of Pharmacogenetic Testing vs. Control by Country for PTTR ................. 52
Figure 11. Meta-analysis of Pharmacogenetic Testing vs. Control by Risk of Bias for PTTR ........... 53
Figure 12. Meta-analysis of Pharmacogenetic Testing vs. Control for INR ≥4 ..................................... 54
Figure 13. Meta-analysis of Pharmacogenetic Testing vs. Control by Comparator for INR ≥4 ..... 55
Figure 14. Meta-analysis of Pharmacogenetic Testing vs. Control by Indication for INR ≥4 ......... 56
Figure 15. Meta-analysis of Pharmacogenetic Testing vs. Control by Country for INR ≥4 ............. 57
Figure 16. Meta-analysis of Pharmacogenetic Testing vs. Control for Thromboembolic Events .. 58
Figure 17. Meta-analysis of Pharmacogenetic Testing vs. Control by Comparator for
Thromboembolic Events ............................................................................................................................................ 59
Figure 18. Meta-analysis of Pharmacogenetic Testing vs. Control for Major Bleeding .................... 60
Figure 19. Meta-analysis of Pharmacogenetic Testing vs. Control by Comparator for Major
Bleeding ........................................................................................................................................................................... 61
Figure 20. Meta-analysis of Pharmacogenetic Testing vs. Control for Mortality ................................. 62
Figure 21. Meta-analysis of Pharmacogenetic Testing vs. Control by Comparator for Mortality . 62
Figure 22. Funnel Plot of Eligible Randomized Controlled Trials for INR ≥4 ...................................... 126
Figure 23. Meta-analysis of Pharmacogenetic Testing vs. Control by Number of Genes for INR ≥4
........................................................................................................................................................................................... 127
Figure 24. Meta-analysis of Pharmacogenetic Testing vs. Control by Race for INR ≥4 .................. 128
Figure 25. Meta-analysis of Pharmacogenetic Testing vs. Control by Sample Size for INR ≥4 ... 129
Figure 26. Meta-analysis of Pharmacogenetic Testing vs. Control by Follow-up for INR ≥4 ....... 130
Figure 27. Meta-analysis of Pharmacogenetic Testing vs. Control by Risk of Bias for INR ≥4 ..... 131
Figure 28. Funnel Plot of Eligible Randomized Controlled Trials for PTTR .......................................... 132

WA – Health Technology Assessment March 6, 2018
Pharmacogenetic testing for patients treated with anticoagulants: Draft evidence report iv
List of Abbreviations
ACC American College of Cardiology
AFib atrial fibrillation
AHA American Heart Association
CI confidence interval
CMS Centers for Medicare & Medicaid Services
DVT deep vein thrombosis
FDA U.S. Food and Drug Administration
HR hazard ratio
HTA health technology assessment
INR international normalized ratio
NR not reported
OR odds ratio
RCT randomized controlled trial
RR risk ratio
VTE venous thromboembolism

WA – Health Technology Assessment March 6, 2018
Pharmacogenetic testing for patients treated with anticoagulants: Draft evidence report 1
Executive Summary
Structured Abstract
Purpose
The purpose of this evidence report is to review the clinical utility and cost-effectiveness of
pharmacogenetic testing to inform medication dosing for patients beginning treatment with
oral anticoagulants.
Key Questions
The following main key questions guided this review:
1. Effectiveness: What is the clinical utility of genetic testing to inform treatment decisions
for patients being treated with anticoagulants?
2. Harms: What direct harms are associated with conducting genetic testing when it is used
to inform the selection or dosage of oral anticoagulant medication?
3. Special populations: Compared with usual care without genetic testing, do important
patient outcomes or harms after genetic testing vary by patient characteristics and
clinical history?
4. What are the cost-effectiveness and other economic outcomes of genetic testing used to
inform the selection or dosage of oral anticoagulant medication?
Data Sources
Center researchers conducted searches of Ovid MEDLINE, the Cochrane Database of Systematic
Reviews, and the Cochrane Central Register of Controlled Trials for English-language studies
published from each database’s inception to January 3, 2018. Additional sources for health
technology assessments (HTA) and evidence reviews were consulted and studies from reference
lists were examined. Evidence sources and the AHRQ National Guideline Clearinghouse were
searched for clinical practice guidelines. Center researchers searched the Centers for Medicare &
Medicaid Services (CMS) website for the Medicare Coverage Database for National and Local
Coverage Determinations (NCDs and LCDs) and the website of private payers for relevant
coverage policies.
Study Selection
Two Center researchers screened all titles and abstracts for potential inclusion based on
prespecified inclusion and exclusion criteria and performed dual full-text review for inclusion.
Data Extraction
Using standardized and piloted processes and forms, one Center researcher extracted data and
a second researcher checked the extraction for accuracy. Two researchers independently
assessed the risk of bias of included studies and methodological quality of clinical practice
guidelines based on adherence to recommended methods and potential for internal and
external validity biases.

WA – Health Technology Assessment March 6, 2018
Pharmacogenetic testing for patients treated with anticoagulants: Draft evidence report 2
Data Synthesis
The search strategy yielded 1,007 unduplicated citations. A total of 18 studies met inclusion
criteria: 13 randomized controlled trials (RCTs) for clinical utility and 5 economic studies. Center
researchers applied the Grading of Recommendations, Assessment, Development, and
Evaluation Working Group (GRADE) system to rate the overall quality of evidence on key clinical
utility and economic outcomes.
Results
Three outcomes that were meta-analyzed by Center researchers represent patient-important
outcomes: mortality, thromboembolic events, and major bleeding. In meta-analyses involving
risk of death and thromboembolic events, there were no statistically significant differences
between the pharmacogenetic testing group and controls. Center researchers found low quality
of evidence for risk of death and moderate quality of evidence for thromboembolic events. An
additional meta-analysis showed a 57% reduction for risk of major bleeding in the
pharmacogenetic testing group compared to controls (risk ratio [RR], 0.43; 95% CI, 0.22 to 0.84;
p = .01, I2 = 0%). However, studies varied in their definitions of major bleeding and the time
periods during which they assessed this outcome. Center researchers rated the quality of the
body of evidence for major bleeding as low.
Two outcomes that were meta-analyzed by Center researchers are intermediate outcomes: PTTR
and overanticoagulation. These two outcomes were more robustly reported across RCTs, and
therefore more amenable to subgroup analyses. The risk of overanticoagulation was 10% lower
and PTTR was 3.11 percentage points higher in the pharmacogenetic testing intervention group
compared to controls. However, neither estimate was statistically significantly different, and
Center researchers found low quality of evidence for both outcomes. The PTTR finding could
also be explained with a subgroup analysis examining the comparators that were used in the
studies. A benefit was only observed when comparing the pharmacogenetic testing group to the
fixed-dose warfarin group. No benefit was observed when comparing the pharmacogenetic
testing group to who received clinical algorithm dosing of warfarin.
All of the identified economic studies had limitations, and the overall quality of evidence for
cost-effectiveness was very low. Three studies used a U.S. perspective and all assumed a higher
PTTR than the meta-analysis found. Despite this, the authors of these 3 studies did not find the
pharmacogenetic intervention cost-effective in 2007 U.S. dollars at a conventional threshold of
$50,000.
Center researchers identified 8 relevant clinical practice guidelines. Three recommend against
the use of pharmacogenetic testing to initiate warfarin therapy, 2 recommend its use, and 3 had
no recommendation. Neither the Medicare NCD nor the Noridian LCD provide coverage for
pharmacogenetic testing except for enrollees who are participating in an RCT of warfarin
treatment.

WA – Health Technology Assessment March 6, 2018
Pharmacogenetic testing for patients treated with anticoagulants: Draft evidence report 3
Limitations
Limitations of this systematic review and meta-analysis were differences among studies in the
populations, underlying medical conditions and indications for treatment, comparators, study
outcome definitions and assessment, and the overall conduct of the study and system in which
it is conducted. These study differences should be carefully considered when interpreting the
conclusions of this systematic review and meta-analysis.
Conclusions
The available evidence is somewhat conflicting in terms of balancing the benefits and harms
from pharmacogenetic testing for polymorphisms to guide warfarin initiation. Pharmacogenetic
testing was associated with a slight increase in the risk of mortality, but the finding was not
statistically significantly different. Further, there were observed decreases in risk of
thromboembolic events and overanticoagulation, as well as a slight increase in PTTR, from
receiving the pharmacogenetic test, but again, the findings were not statistically significant. A
reduction in major bleeding among participants who received the pharmacogenetic test was the
only clinical utility outcome that was statistically significantly different. Nevertheless, these
clinical utility outcomes were rated as having low to moderate quality of evidence, suggesting
that additional research will have an important effect on the observed findings. Based on the
findings from this systematic review and meta-analysis, it seems prudent that, at a minimum, all
patients on warfarin should be carefully managed with a systematic approach to initiation and
maintenance of therapy.

WA – Health Technology Assessment March 6, 2018
Pharmacogenetic testing for patients treated with anticoagulants: Draft evidence report 4
Background
Anticoagulant drugs, commonly known as blood thinners, are used for patients with conditions
such as atrial fibrillation (Afib), deep venous thrombosis (DVT), pulmonary embolism, or other
complications from having a blood clot, or after surgery to prevent stroke.1 Warfarin
(Coumadin), approved for use in the U.S. by the Food and Drug Administration (FDA) in 1954, is
the most commonly prescribed oral anticoagulant, although use of direct oral anticoagulants
(DOACs) is increasing.2 When prescribing anticoagulants, the risk of thrombosis from the
underlying condition needs to be weighed against the risk of bleeding from anticoagulation.3
Clinical decisions about which of these agents to use depend on the underlying indication for
anticoagulation and other considerations such as the patient’s creatinine clearance (a measure
of renal function), other medications used, and history of serious bleeding.4 Achieving effective
anticoagulation can require time, laboratory testing, and dose adjustments, particularly for
warfarin.4
Factors including patient diet, comorbidities, and drug interactions with other medications, can
lead to wide variation in warfarin dose requirements.4 The effect of warfarin must be monitored
carefully with blood testing that measures the time it takes for blood to clot using the
prothrombin time test, which is reported as the International Normalized Ratio (INR). In the
beginning stages, INR testing might need to occur frequently, even daily. After initial adjustment
of dosing, a patient is usually tested monthly.5,6
Protocols for initial dosing of warfarin can call for a standard dose for most patients, or a dose
based on a clinical algorithm that uses a patient’s individual characteristics such as a patient’s
age, sex, ethnicity, weight, body surface area, comorbidities, and indication for warfarin use.
Genotype testing can be included in the calculation of initial warfarin dose to create a
pharmacogenetic algorithm.
Technology Description
The most frequent genotypes included in pharmacogenetic algorithms for warfarin dosing are
cytochrome P450 2C9 (CYP2C9), vitamin K epoxide reductase (VKORC1), and cytochrome P450
4F2 (CYP4F2). The CYP2C9 enzyme metabolizes warfarin, and polymorphisms in CYP2C9 reduce
enzymatic activity, which can lead to significantly lower therapeutic doses of warfarin in
patients.7 Warfarin blocks VKORC1 enzyme activity, and genetic variants in VKORC1 result in the
therapeutic dose of warfarin being reduced by approximately 25% per variant allele.7 The
CYP4F2 enzyme cleaves the phytal side chain of vitamin K, leading to inactive metabolites, and
the genetic polymorphism in CYP4F2 can increase the warfarin therapeutic dose by up to 12%
per allele.7
Common variants in CYP2C9, VKORC1, and CYP4F2 account for up to 18%, 30%, and 11%,
respectively, of the variance in stable warfarin dose among populations of European ancestry.8
Variants of these 3 genes explain less of the dose variability among patients of other ancestries
because of differing allele frequencies across populations.8 For example, CYP2C9*2 is almost
WA – Health Technology Assessment March 6, 2018
Pharmacogenetic testing for patients treated with anticoagulants: Draft evidence report 5
absent in Asian populations.8 Other CYP2C9 alleles (e.g., *5, *6, *8, *11) occur almost exclusively
in persons of African ancestry and contribute to dose variability in these populations.8
Policy Context
There are a growing number of genetic tests and panels of genetic tests designed to inform
decisions on the selection and dosage of oral anticoagulant medications. Potential benefits of
these tests are more appropriate treatment decisions and better patient outcomes, including
avoiding treatment-related side effects. This topic was selected for a health technology
assessment by the Washington Health Authority because of low concerns for the safety of these
tests, high concerns for efficacy, and medium/high concerns for cost.
This evidence review will help to inform Washington’s independent Health Technology Clinical
Committee as the committee members determine coverage regarding selected genetic tests for
patients with an indication for use of oral anticoagulant medications.
Methods
This evidence review is based on the final key questions published on January 26, 2018.
Population: Adults and children initiating or changing dosage of oral anticoagulant medications
Interventions: Genetic testing to inform the selection or dosage of oral anticoagulant
medications
Comparators: Usual care without genetic testing
Outcomes:
Patient-oriented clinical outcomes (e.g., death, stroke, time in therapeutic range [TTR],
overanticoagulation, bleeding, quality of life as measured by validated instruments)
Consequences of treatment decisions (including decisions by prescribers or patients to
use, not use, or continue use of specific medications) on response to treatment and
adverse effects as a result of treatment
Direct harms, such as consequences of inaccurate test results
Cost-effectiveness and other economic outcomes
Time period for MEDLINE and Cochrane Library searches: Database inception to January 3,
2018
Key Questions
1. Effectiveness: What is the clinical utility of genetic testing to inform treatment decisions
for patients being treated with anticoagulants?
a. Do treatment decisions guided by genetic testing result in clinically meaningful
improvements in important patient outcomes (e.g., death and stroke) or
reductions in adverse events (e.g., bleeding) compared with usual care without
genetic testing?
WA – Health Technology Assessment March 6, 2018
Pharmacogenetic testing for patients treated with anticoagulants: Draft evidence report 6
b. Does genetic testing to inform the selection or dose of medications change the
drug or dosage selected by prescribers or patients compared with usual care
without genetic testing?
2. Harms: What direct harms are associated with conducting genetic testing when it is used
to inform the selection or dosage of oral anticoagulant medication?
3. Special populations: Compared with usual care without genetic testing, do important
patient outcomes or harms after genetic testing vary by:
a. Patient characteristics (e.g., age, sex, race/ethnicity)?
b. Clinical history (e.g., medical comorbidities, underlying condition requiring
anticoagulation, severity of illness, concurrent medication use, whether treatment
decision is initial or subsequent)?
4. What are the cost-effectiveness and other economic outcomes of genetic testing used to
inform the selection or dosage of oral anticoagulant medication?
Data Sources and Searches
Center researchers conducted a search of the peer-reviewed published literature using multiple
online databases, including Ovid MEDLINE, the Cochrane Library Database of Systematic
Reviews and Cochrane Central Registry of Controlled Trials. RCTs and systematic reviews (with
and without meta-analysis) and health technology assessments of RCTs that assessed clinical
utility were considered for Key Questions 1, 2, and 3. Cost-effectiveness studies and other
comparative economic evaluations, along with systematic reviews (with and without meta-
analysis) reporting economic outcomes, were considered for Key Question 4. The Ovid MEDLINE
search strategy is in Appendix A. Additional sources, including the Agency for Healthcare
Research and Quality (AHRQ), the National Institute for Health and Care Excellence (NICE), and
the Veterans Administration Evidence-based Synthesis Program, were searched for relevant
systematic reviews, technology assessments, and clinical practice guidelines. Center researchers
also screened reference lists of included RCTs and systematic reviews.. In addition, searches of
the AHRQ’s National Guideline Clearinghouse (guidelines.gov) and websites of relevant
professional organizations for guidelines were conducted for clinical practice guidelines.
Center researchers conducted a search of PharmGKB, Stanford University’s online resource for
information about genetic variation on drug responses.9 A general Internet search for
appropriate published studies and relevant gray literature was also conducted. In addition,
Center researchers searched the Centers for Medicare & Medicaid Services (CMS) website for
the Medicare Coverage Database for National Coverage Determinations (NCDs) and Local
Coverage Determinations (LCDs) applying to the state of Washington. The Aetna, Cigna, and
Regence websites were searched for coverage policies for these private payers.
To identify relevant ongoing clinical trials, Center researchers searched the online database of
clinical trials (ClinicalTrials.gov) maintained by the National Library of Medicine at the National
Institutes of Health. This search included terms related to oral anticoagulants (e.g., medication
names) and pharmacogenetics.

WA – Health Technology Assessment March 6, 2018
Pharmacogenetic testing for patients treated with anticoagulants: Draft evidence report 7
Results
The search strategy located 1,007 unduplicated citations. After excluding 965 citations by dual
assessment of title and abstract, 42 full-text articles were independently reviewed by 2
researchers; 24 of these did not meet predetermined inclusion criteria. A list of the excluded
studies and reasons for exclusion are in Appendix I. All eligible RCTs and systematic reviews of
RCTs assessed the clinical utility of pharmacogenetic testing for the dosing of warfarin.
After full-text review, 11 systematic reviews of RCTs were identified.1,10-19 Among the studies
included in these systematic reviews, 10 eligible RCTs were identified.7,20-28 Three additional
eligible RCTs were identified that were published after the most recent systematic review.29-31
One of these more recent RCTs, published by Gage et al. in 2017, has the largest sample size (n
= 1,650) of all the identified RCTs. Thus, Center researchers decided to conduct a systematic
review and meta-analysis of the 13 eligible RCTs and to not include the systematic reviews as
primary sources. One of the included RCTs25 did not report any of the outcomes included in the
meta-analysis. The 5 eligible economic studies focused on pharmacogenetic testing for the
dosing of warfarin in the setting of atrial fibrillation.32-34
Center researchers conducted meta-analyses for 5 outcomes:
Percentage of time in therapeutic range (PTTR) (continuous, as a percentage of follow-up
time)
INR greater than or equal to 4 (binary, unique event)
Thromboembolic events (binary, unique event)
Mortality (binary, unique event)
Major bleeding (binary, unique event)
Using RevMan 5.3, Center researchers estimated pooled and subgroup mean differences and
risk ratios and their 95% confidence intervals for continuous and binary outcomes, respectively,
using the inverse variance statistical technique and random effects models for all outcomes.
When there were sufficient numbers of studies and data, prespecified subgroup analyses
included an assessment of multiple factors:
Different comparators (i.e., clinical algorithm-guided based dosing compared to fixed
dosing)
Risk of bias (i.e., high compared to moderate compared to low)
Sample size (i.e., greater than or equal to 400 total participants or less than 400 total
participants)
Number of genes tested in the pharmacogenetics test (i.e., 3 genes, 2 genes, or 1 gene)
Country where the study was conducted (i.e., U.S. compared to other countries)
Clinical indication (i.e., atrial fibrillation, valve replacement, post-orthopedic surgery, or
other indications)
Race (i.e., 90% or more total participants were White, 90% or more total participants
were Asian, or a combination of races)
Follow-up period (i.e., greater than 30 days or 30 days or less)

WA – Health Technology Assessment March 6, 2018
Pharmacogenetic testing for patients treated with anticoagulants: Draft evidence report 8
A description of each included RCT and data abstracted from each is included in the main report
and summarized in Appendix C, Tables 4 through 8. Appendix C, Table 9 includes data regarding
included economic modeling studies.
KQ1: Clinical Utility
Main Outcomes
Center researchers performed meta-analysis for prespecified primary outcomes (mortality, major
bleeding, thromboembolic event, INR > 4, and the PTTR for anticoagulation) and conducted
prespecified subgroup analyses detailed in the Methods section. The meta-analysis results are
presented for each major outcome, with relevant subgroups for each of those 5 outcomes.
Percentage of Time in Therapeutic Range (PTTR)
All but 121,24-26,29,30 of the RCTs reported PTTR. Center researchers accepted any PTTR as defined
by the study for meta-analysis. Five trials defined the therapeutic range as an INR of 2 to 3.
Three trials20,22,27 used an INR range of 1.8 to 3.2, and 128 used 1.8 to 3. Burmester et al. (2011)
allowed an INR range of 2 to 3.5 and Hillman et al. (2005) did not report the range used. The
PTTR was also reported at different time intervals across studies. In general, these timeframes
corresponded to the general study follow-up periods (see Table 4 and Table 7), and ranged from
14 to 90 days.
In the overall analysis (Figure ES-1), the pharmacogenetically guided group had 3.1 percentage
points more time in follow-up in the therapeutic range (mean difference, 3.11%; 95% CI, -0.28 to
6.50; p = .07), although the difference was not statistically significant and the analysis had
significant heterogeneity (I2 = 78%; Chi2 = 50.86; p < .0001). The overall quality of evidence for
this outcome was rated as low.
A prespecified set of subgroup analyses were conducted to explore sources of heterogeneity. A
subgroup analysis by comparator (Figure ES-2) found that there was no significant difference in
the PTTR among studies using a clinical algorithm compared to a pharmacogenetically guided
one (mean difference, 0.54%; 95% CI, -2.44 to 3.52; p = .72), whereas there was a marginally
significant difference favoring the pharmacogenetically guided group when it was compared to
the fixed-dose comparators (mean difference, 4.97%; 95% CI, -0.50 to 10.45; p = .07). Although
the difference between these subgroups was not statistically significant, it is likely to be clinically
meaningful given the 10-fold difference between the point estimates. Additionally, there was
only moderate statistical heterogeneity in the clinical algorithm group, indicating that some of
the statistical heterogeneity in the overall analysis was explained by the difference in
comparators (i.e., clinical algorithm and fixed dosing). The fixed-dosing subgroup included all
trials that were rated by Center researchers as having high risk of bias, which could account for
some of the observed benefit of the pharmacogenetic testing group.
The subgroup analysis according to the number of genes tested found a small inverse dose-
response relationship. All of the estimates favored the pharmacogenetically guided intervention,
although none of the estimates were statistically significant. There was no meaningful difference

WA – Health Technology Assessment March 6, 2018
Pharmacogenetic testing for patients treated with anticoagulants: Draft evidence report 9
seen in the subgroup analysis by length of follow-up reporting for the PTTR outcome, with the
point estimates for ≤ 30 days and > 30 days not statistically significant, but favoring the genetic
intervention and similar to the main effect estimate. Studies with larger sample size (≥ 400
participants) had similar point estimates to studies with fewer participants, and both estimates
were similar to the main effect estimate.
The subgroup analysis by indication for anticoagulation found higher PTTR with
pharmacogenetically guided dosing for patients who had orthopedic surgery in 1 trial31 and
valve replacement in another trial,28 although there was no significant difference for atrial
fibrillation or trials with a mix of indications. A subgroup analysis by race found a similar effect
for the White and Asian subgroups compared to the overall analysis, but a wider CI and higher
degree of statistical heterogeneity for studies with 90% or greater Asian population,28,29
indicating that race could have some contribution to the statistical heterogeneity found in the
main analysis. A subgroup analysis to evaluate whether studies conducted inside or outside of
the U.S. did not find statistically significant differences, but the point estimate for studies outside
the U.S. was about 5 times higher than for studies conducted in the U.S. This might in part
reflect heterogeneity stemming from racial composition of the population, but might indicate
some additional effect from the grouping of 3 studies24,28,29 with high risk of bias and 226,30 with
moderate risk of bias among studies conducted outside the U.S.
RCTs with a high risk of bias, all of which used a fixed-dosing approach in the control group,
were more likely to favor the pharmacogenetically guided intervention compared to those with
a low or moderate risk of bias. Although none of these subgroups were statistically significantly
different, the groups with low and moderate risk of bias appear to be different, with estimates
closer to the null (i.e., 0.00), compared to the high risk of bias group. These differences might
account for some of the heterogeneity in the main analysis.
Figure ES-1. Meta-analysis of Pharmacogenetic Testing vs. Control for PTTR

WA – Health Technology Assessment March 6, 2018
Pharmacogenetic testing for patients treated with anticoagulants: Draft evidence report 10
Figure ES-2. Meta-analysis of Pharmacogenetic Testing vs. Control by Comparator for PTTR
Overanticoagulation (INR ≥ 4)
Nine trials reported an INR measurement of 4 or more (INR ≥4) and 1 trial reported and INR of
3.5 or more (INR >3.5) and were included in the meta-analysis for this outcome. Trials reported
INR in different time periods: 4 trials20,21,23,31 reported whether the outcome had occurred by 1
month (ranging from 28 to 30 days) and 3 trials22,26,29 reported occurrence by 3 months. Given
that the trials had different lengths of follow-up, the opportunity for individuals to experience
overanticoagulation varied. In the overall meta-analysis that included 10 trials, 340 events
occurred among 2,095 participants in the pharmacogenetically guided group (16.2%) and 354
events occurred among 1,961 participants in the control group (18.1%). As shown in Figure ES-3,
Center researchers observed a 9% improvement in favor of the pharmacogenetically guided
intervention, but the difference was not statistically significant (RR, 0.91; 95% CI, 0.80 to 1.04; p =
.16, I2 = 0%). The anticipated absolute effect (Table ES-1) was 18.2 fewer people per 1,000 who
experienced overanticoagulation with pharmacogenetic testing (95% CI, 5 more people to 41.5
fewer people per 1,000). Center researchers rated the overall quality of evidence for this
outcome as low.
Several prespecified subgroup analyses were also performed. In the subgroup analysis by
comparator, the pharmacogenetically guided intervention performed similarly to the clinically
guided group (RR, 0.95; 95% CI, 0.78 to 1.15; p = .58). The estimate for the fixed-dose
comparator group was also not statistically significant, but was lower than the main analysis (RR,
0.83; 95% CI, 0.67 to 1.04; p = 0.11). No significant difference was found between these 2
subgroups (p = .39). The subgroup analysis conducted by indication for anticoagulation found a
statistically significant effect in favor of the intervention among patients who had orthopedic
surgery (RR, 0.71; 95% CI, 0.51 to 0.99; p = .04). Gage et al. (2017) was the only study to

WA – Health Technology Assessment March 6, 2018
Pharmacogenetic testing for patients treated with anticoagulants: Draft evidence report 11
contribute to this outcome. No statistically significant differences were found for atrial
fibrillation, valve replacement, or other indications.
No meaningful difference in INR was found in the U.S. trials, but there was a marginally
statistically significant reduction of 21% in the pharmacogenetically guided group compared to
controls in other countries (RR, 0.79; 95% CI, 0.62 to 1.00; p = .05). However, the Chi2 test for
differences in subgroups was not statistically significant (p = .17).
Figure ES-3. Meta-analysis of Pharmacogenetic Testing vs. Control for INR ≥4
Thromboembolic Events
A total of 11 trials7,20-24,26,28-31 reported thromboembolic events (generally DVT or pulmonary
embolism), although 5 of these trials20,24,28-30 reported no events in either the intervention or
control groups. The analysis was heavily weighted by the Gage et al. (2017) RCT in the meta-
analysis. Gage et al. (2017) conducted a bilateral lower extremity duplex ultrasound study on all
asymptomatic patients at 1-month post-surgery. The RCT included 33 total VTE events among
808 patients (4.1%) in the pharmacogenetically guided group and 38 events among 789 patients
(4.8%) in the clinically guided group between days 1 and 60 after surgery (RR, 0.85; 95% CI, 0.54
to 1.34). However, most of the identified VTEs were ascertained among asymptomatic patients
by duplex ultrasound at 1-month post-surgery, with 23 VTE events of 33 among intervention
group participants, and 13 of 38 among control participants being asymptomatic DVTs found by
ultrasound. All other trials reported only symptomatic VTE events. Thus, Gage et al. (2017)
reported a relatively high proportion of events, and because of the large size of the study, the
overall meta-analytic result (RR, 0.85; 95% CI, 0.56 to 1.28; p = .44, I2 = 0%) for thromboembolic
events is heavily influenced by the Gage et al. (2017) trial (see Figure ES-4). A subgroup analysis
by comparator was also performed. Neither of the trials with clinical algorithm control groups
nor the fixed-dose control groups were statistically significant and were not meaningfully
different compared to the overall estimate. The anticipated absolute effect (Table ES-1) was 5.1
fewer thromboembolic events per 1,000 people with pharmacogenetic testing (95% CI, 3.6 more

WA – Health Technology Assessment March 6, 2018
Pharmacogenetic testing for patients treated with anticoagulants: Draft evidence report 12
to 13.8 fewer per 1,000 people). Center researchers rated the overall quality of evidence for this
outcome as moderate.
Figure ES-4. Meta-analysis of Pharmacogenetic Testing vs.
Control for Thromboembolic Events
Major Bleeding
Eleven RCTs included major bleeding as an outcome.7,20-24,26,28-31 For purposes of the meta-
analysis, Center researchers used the RCT authors’ definition of major bleeding, which generally
included bleeding that necessitated hospitalization or required interventions such as blood
transfusion. Four trials did not report any major bleeding in either group.20,26,28,30 The total
number of events was small: 12 events among 2,187 participants in the intervention group
(0.55%) and 29 events among 2,054 in the control group (1.4%). Participants enrolled in the
intervention group were 57% less likely to experience major bleeding than those in the control
group (RR, 0.43; 95% CI, 0.22 to 0.84; p = .01, I2 = 0%) (see Figure ES-5). The anticipated absolute
effect (Table ES-1) was 8.6 fewer major bleeding events per 1,000 people with pharmacogenetic
testing (95% CI, 2.7 to 14.4 fewer major bleeding episodes per 1,000 people). Center researchers
rated the overall quality of evidence for this outcome as moderate.
A subgroup analysis by comparator was conducted and major bleeding remained lower in the
pharmacologically guided dosing group compared to the clinical algorithm group, with a 61%
reduced risk of major bleeding. The risk of major bleeding was also 30% lower in the
pharmacologically guided dosing group compared to the fixed-dosing group (RR, 0.70; 95% CI,
0.14 to 3.53; p = .38), but the difference was not statistically significant. Overall, the subgroup
analysis indicates that the major bleeding benefit of pharmacogenetically guided warfarin
dosing seen in the main analysis cannot be explained by whether the control group was dosed
according to a clinical algorithm or with a fixed-dose approach. However, the caveat remains
that very few events were reported overall, and that even when statistically significant, the
confidence intervals were relatively wide.

WA – Health Technology Assessment March 6, 2018
Pharmacogenetic testing for patients treated with anticoagulants: Draft evidence report 13
Figure ES-5. Meta-analysis of Pharmacogenetic Testing vs. Control for Major Bleeding
Mortality
Seven trials7,20-22,28,31 reported mortality as an outcome and 320,28,31 of these reported no deaths
in either arm of the trial. In total, there were 9 deaths reported among 1,786 (0.50%) participants
in the intervention groups and 8 among 1,754 (0.46%) in the control groups, for a risk ratio of
1.17 (95% CI, 0.43 to 3.22) and I2 = 0% in favor of the control group (see Figure ES-6). However,
the risk ratio was not statistically significant and the confidence interval is wide. One subgroup
analysis was performed, examining the possible effect of the control group using a clinical
dosing algorithm or fixed-dose warfarin initiation. Neither subgroup had a statistically significant
estimate, and confidence intervals were wide and overlapping. It should be noted that given the
low number of deaths reported, the meta-analysis is fairly unstable, and any additional mortality
events occurring in either group could modify the estimate of effect. Furthermore, follow-up was
never more than 6 months, and so there is no information regarding the longer-term overall
mortality risk from these interventions. The anticipated absolute effect (Table ES-1) was 0.48
more deaths per 1,000 people with pharmacogenetic testing (95% CI, 4.1 more to 5.0 fewer
deaths per 1,000 people). Center researchers rated the overall quality of evidence for the
outcome of mortality as low.

WA – Health Technology Assessment March 6, 2018
Pharmacogenetic testing for patients treated with anticoagulants: Draft evidence report 14
Figure ES-6. Meta-analysis of Pharmacogenetic Testing vs. Control for Mortality
KQ2: Harms
Harms outcomes are reflected in several items described under Key Question 1. Mortality, major
bleeding, and VTE all represent adverse outcomes, although they occur with
pharmacogenetically guided warfarin dosing and all comparators, including clinically guided and
fixed-dose warfarin initiation. Major bleeding, VTE events, overanticoagulation, and PTTR all had
point estimates indicating benefit for pharmacogenetic dosing. However, none of these
differences was statistically significant, with the exception of major bleeding. There was a 57%
lower risk of bleeding in the pharmacogenetically guided groups overall, although the total
number of events was small.
KQ3: Special Populations
Two subgroup analyses, by clinical indication and by race, for the PTTR and overanticoagulation
outcomes are relevant to this question. These subgroup analyses were not performed for the
other 3 outcomes because of the number of studies and outcome events were more limited.
There were no statistically significant subgroup differences by race (White vs. Asian vs. racially
and ethnically mixed study populations) for either PTTR or overanticoagulation. However, for
both outcomes, the point estimates favored the pharmacogenetic intervention for subjects who
were White (PTTR: mean difference 2.3%, 95% CI, -0.46 to 5.23, I2 = 51%, and INR ≥ 4; RR 0.84,
95% CI, 0.68 to 1.04, I2 = 21%). The subgroup analyses of PTTR according to the indication for
anticoagulation (atrial fibrillation, orthopedic surgery for hip or knee replacement, heart valve
replacement, and mixed other indications) demonstrated a benefit for the pharmacogenetic
intervention for both orthopedic surgery (mean difference, 3.4%; 95% CI, 1.00 to 5.80) and valve
replacement (mean difference, 12.40; 95% CI, 5.49 to 19.31). However, for the orthopedic
surgery subgroup, the 95% CI touched 1.0, and was very similar to the overall point estimate
from the main analysis. The point estimate for the valve replacement subgroup was about 3
times higher than the main effect estimate, which might indicate a true effect in that clinical
setting, but could also be due in part to some differences from the comparator employed,
country of study, age and race of subjects, and length of follow up. Both estimates were based
on only 1 study each, Gage et al. (2017) for orthopedic surgery (rated as having a low risk of
bias) and Huang et al. (2009) for valve replacement (rated as having a high risk of bias). In the

WA – Health Technology Assessment March 6, 2018
Pharmacogenetic testing for patients treated with anticoagulants: Draft evidence report 15
subgroup analyses of overanticoagulation, a difference in favor of the pharmacological
intervention was noted for the orthopedic surgery subgroup, but for no other subgroups (RR
0.71, 95% CI, 0.51 to 0.99); only Gage et al. (2017) contributed data to this subgroup. Because of
reporting of race by the various RCTs, a subgroup meta-analysis of any outcome for Black
patients could not be performed. However, Gage et al. (2017) did report the PTTR for Black
patients compared to all other races enrolled in the RCT and found a statistically significant
effect only for the group of patients of other races (91% of the study subjects were White and
6.4% were Black). For participants of other races, the mean difference for PTTR was 3.7%, 95% CI
1.2 to 6/1, p = .003), and for Black participants there was no difference from the
pharmacological intervention (mean difference 0.2%, 95% CI, -8.9 to 9.4, p = .96). This finding
might reflect the lack of penetration of CYP2C9 alleles *2 and *3 among African-American
populations. The study by Kimmel et al. (2013), conducted among patients largely with
indications of atrial fibrillation and VTE, reported that clinically guided dosing resulted in
improved PTTR among Black patients compared to the pharmacogenetic intervention.
KQ4: Cost-Effectiveness and Other Economic Outcomes
Five economic modeling studies, published between 2009 and 2017, were identified.32-36 Two
studies34,36 were rated by Center researchers as having a high risk of bias and 332,33,35 a moderate
risk of bias. All 5 studies assumed a hypothetical population of patients initiating warfarin
therapy for atrial fibrillation.32-36 Three studies33,34,36 assumed a U.S. perspective (either societal or
third-party payer), 132 assumed a UK health service perspective, and 135 was conducted with
estimates for the UK and Swedish health system perspectives. All 5 studies reported costs per
quality-adjusted life year (QALY). Cost/QALY ranged from $60,725 to $171,800 in 2007 U.S.
dollars. There were no more recent estimates applicable to the U.S. setting. Cost/QALY
pertaining to the UK NHS ranged from £6,702 (2014 £) to £13,266 (2011 £). When the modeling
study stated specific assumptions about incorporating PTTR, it was generally higher and more in
favor of pharmacogenetically guiding dosing than in the meta-analysis in this report, which
found a mean difference of 3.11% (95% CI, -0.28 to 6.50). The overall quality of evidence based
on these economic modeling studies was rated as very low.
Summary
Thirteen RCTs and 5 economic modeling studies contributed data to this summary of the clinical
and economic impact of pharmacogenetic testing compared to other dosing strategies for the
initiation of warfarin anticoagulation. Table ES-1 presents a summary of the quantity of data,
quality of evidence, and relative and anticipated absolute effects of pharmacogenetic dosing
initiation of warfarin compared to alternative dosing methods.
All studies had some limitations, and the overall quality of evidence rating was low for 3 clinical
outcomes (i.e., PTTR, mortality, and INR ≥4) and moderate for 2 others (i.e., major bleeding and
thromboembolic events). The 2 outcomes (PTTR and overanticoagulation) that were reported
most robustly across studies are intermediate outcomes. There was a small, not statistically
significant difference in favor of pharmacogenetic testing for the outcome of thromboembolic

WA – Health Technology Assessment March 6, 2018
Pharmacogenetic testing for patients treated with anticoagulants: Draft evidence report 16
events. Conversely, there was a small, not statistically significant difference in favor of other
dosing initiation strategies for overall mortality. Major bleeding was the only clinical outcome
with a statistically significant difference.
It is possible that there is value for pharmacogenetic testing among certain subgroups, including
patients undergoing scheduled hip or knee replacement or heart valve replacement. Particular
racial subgroups might derive more or less benefit from testing based on the prevalence of
particular genetic variants in that racial subgroup. It does not appear that currently there is
demonstrated benefit for Black patients.
These conclusions should also be evaluated in light of several limitations. The single outcome
with the most data was PTTR. Although there was a statically significant difference of 3.11% in
the mean difference of time in the therapeutic INR range favoring pharmacogenetic testing, this
finding was statistically heterogeneous. The finding is also of questionable clinical significance,
and nearly all of the observed benefit could be explained when studies were analyzed by the
type of comparator used. When a clinical algorithm was used, there was essentially no difference
compared to use of a pharmacogenetic algorithm. A similar trend was seen with the outcome of
overanticoagulation, although the effect was not as pronounced. Other limitations include the
differences in outcome definitions across studies, the follow-up period for each outcome, and
the variety of clinical indications and population and health system characteristics under which
studies were conducted.
Cost-effectiveness analyses were also limited by methods, and the overall quality of evidence
was rated as very low. Because of their publication dates, the 3 modeling studies that were U.S.
based in 2007 dollars could not have incorporated the growing body of literature about
pharmacogenetic testing for warfarin therapy initiation. None of these older U.S. studies found
pharmacogenetic testing to be cost-effective at widely accepted thresholds.
Table ES-1. GRADE Summary of Evidence
Outcome Number of
Participants
(Studies)
Quality of
Evidence
Estimated
Effect Size
(95% CI)
Anticipated Absolute Effects
Risk with and
without
Pharmacogenetic
Testing and 95%
CI (per 1,000
people)
Risk Difference
and 95% CI (per
1,000 people)
Clinical utility—
Mortality
n = 3,540
k = 7
Low
●●◌◌
RR 1.17, (95%
CI, 0.43 to
3.22)
5.0 (2.5 to 9.7)
4.6 (2.1 to 9.1)
0.48 (-4.1 to 5.0)
fewer deaths
without
pharmacogenetic
testing
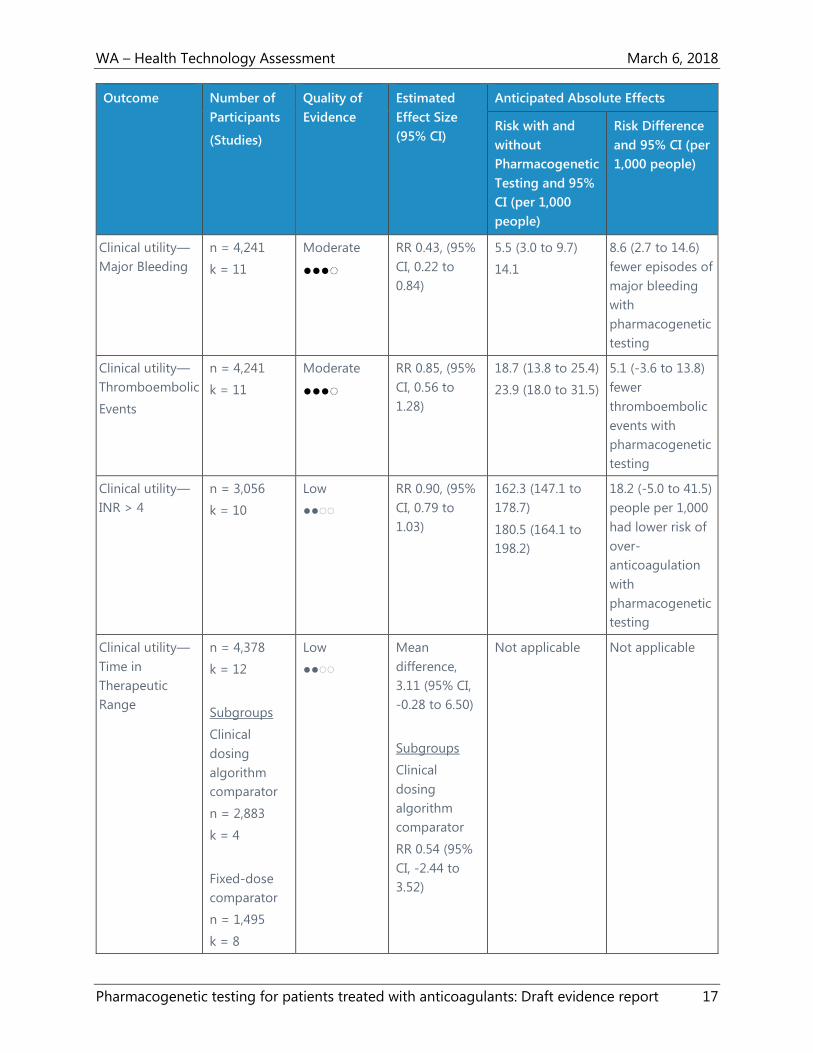
WA – Health Technology Assessment March 6, 2018
Pharmacogenetic testing for patients treated with anticoagulants: Draft evidence report 17
Outcome Number of
Participants
(Studies)
Quality of
Evidence
Estimated
Effect Size
(95% CI)
Anticipated Absolute Effects
Risk with and
without
Pharmacogenetic
Testing and 95%
CI (per 1,000
people)
Risk Difference
and 95% CI (per
1,000 people)
Clinical utility—
Major Bleeding
n = 4,241
k = 11
Moderate
●●●◌
RR 0.43, (95%
CI, 0.22 to
0.84)
5.5 (3.0 to 9.7)
14.1
8.6 (2.7 to 14.6)
fewer episodes of
major bleeding
with
pharmacogenetic
testing
Clinical utility—
Thromboembolic
Events
n = 4,241
k = 11
Moderate
●●●◌
RR 0.85, (95%
CI, 0.56 to
1.28)
18.7 (13.8 to 25.4)
23.9 (18.0 to 31.5)
5.1 (-3.6 to 13.8)
fewer
thromboembolic
events with
pharmacogenetic
testing
Clinical utility—
INR > 4
n = 3,056
k = 10
Low
●●◌◌
RR 0.90, (95%
CI, 0.79 to
1.03)
162.3 (147.1 to
178.7)
180.5 (164.1 to
198.2)
18.2 (-5.0 to 41.5)
people per 1,000
had lower risk of
over-
anticoagulation
with
pharmacogenetic
testing
Clinical utility—
Time in
Therapeutic
Range
n = 4,378
k = 12
Subgroups
Clinical
dosing
algorithm
comparator
n = 2,883
k = 4
Fixed-dose
comparator
n = 1,495
k = 8
Low
●●◌◌
Mean
difference,
3.11 (95% CI,
-0.28 to 6.50)
Subgroups
Clinical
dosing
algorithm
comparator
RR 0.54 (95%
CI, -2.44 to
3.52)
Not applicable Not applicable

WA – Health Technology Assessment March 6, 2018
Pharmacogenetic testing for patients treated with anticoagulants: Draft evidence report 18
Outcome Number of
Participants
(Studies)
Quality of
Evidence
Estimated
Effect Size
(95% CI)
Anticipated Absolute Effects
Risk with and
without
Pharmacogenetic
Testing and 95%
CI (per 1,000
people)
Risk Difference
and 95% CI (per
1,000 people)
Fixed-dose
comparator
RR 4.97 (95%
CI, -0.50 to
6.50)
Clinical Practice Guidelines
Center researchers identified 8 clinical practice guidelines that have been published since 2012.
Three of the identified guidelines include recommendations against the use of pharmacogenetic
testing for anticoagulant therapy. Three guidelines did not contain any recommendation about
pharmacogenetic tests.37-39 The American College of Chest Physicians 2012 guideline Evidence-
Based Management of Anticoagulant Therapy, rated as having good methodological quality,
includes a strong recommendation against the routine use of pharmacogenetic testing for use
of warfarin.40 The 2013 guidelines on antithrombotics indications and management from the
Scottish Intercollegiate Guidelines Network (SIGN), also rated as having good methodological
quality, include a Grade A recommendation against pharmacogenetic testing before the
initiation of therapy.41 The Australasian Society of Thrombosis and Haemostasis’s 2013 update
guideline, rated as having poor methodological quality, provides a strong recommendation that
pharmacogenetic testing to guide warfarin dosing is not necessary.42
Two guidelines include recommendations for the use of pharmacogenetic testing for warfarin
dosing. The Clinical Pharmacogenetics Implementation Consortium (CPIC) 2017 update
guideline, rated as having poor methodological quality, recommends that warfarin maintenance
dosage for adults be based on genetic information.8 These guidelines recommend that
pharmacogenetically guided dosing use a validated published algorithm (e.g., algorithms by
IWPC,43 Gage et al.,44 EU-PACT,26 and Lenzini et al.45).
The Canadian Pharmacogenomics Network for Drug Safety published a guideline on genetic
testing of CYP2C9 and VKORC1 for warfarin therapy in 2015.46 This guideline, also rated as
having poor methodological quality, has a moderate-strength recommendation that testing of
all warfarin-naive patients for VKORC1 (21639G.A), CYP2C9*2, and CYP2C9*3 should be
considered before initiation of therapy and within the first 2 weeks of therapy.46 In addition, such
pharmacogenetic testing should be considered for all patients who are at increased risk of
bleeding complications, who consistently show out-of-range INRs, or who experience adverse
events while receiving warfarin.46

WA – Health Technology Assessment March 6, 2018
Pharmacogenetic testing for patients treated with anticoagulants: Draft evidence report 19
Of the 8 identified guidelines, 3 of them40-42 include recommendations on the initial dose of
warfarin when not using pharmacogenetic testing. The American College of Chest Physicians
guideline Evidence-Based Management of Anticoagulant Therapy suggests initiating warfarin at
10 mg daily for the first 2 days for relatively healthy outpatients.40 Another guideline by the
American College of Chest Physicians, on Oral Anticoagulant Therapy, discusses flexibility in
determining the starting dose of warfarin.47 These guidelines suggest that initial doses between
5 and 10 mg are effective, with appropriate dosing varying by inpatient or outpatient status,
age, concomitant treatments, and comorbidities.47
The SIGN guidelines state that the initial treatment dose for acute thromboembolism is
generally 10 mg warfarin, but includes recommendations to vary the initial dose based on age,
body weight, comorbidities, and other factors.41 The Australasian Society of Thrombosis and
Haemostasis guidelines recommend avoiding high loading doses of warfarin, starting at 5 mg
daily, or even lower in elderly patients.42
Selected Payer Coverage Determinations
Medicare
The one Medicare NCD identified does not provide coverage for pharmacogenetic testing,
unless the beneficiary is enrolled in an RCT of anticoagulation therapy with warfarin.48 The
beneficiaries enrolled in such a study must have not been previously tested for CYP2C9 or
VKORC1 alleles and must have received fewer than 5 days of warfarin in the anticoagulation
regimen for which the testing is ordered.48 This NCD includes a statement that it has been or is
currently being reviewed under the NCD process.48 Center researchers identified one Medicare
LCD by Noridian that applies to Washington.49 This LCD includes the same coverage
determination as the one identified NCD 48
Private Payers
The Aetna policy on pharmacogenetic and pharmacodynamic testing considers genotyping for
CYP2C9 or VKORC1 polymorphisms to inform warfarin dosing to be experimental and
investigational.50 The Regence policy on CYP450 genotyping states that CYP2C9 and VKORC1
genotyping for the purpose of warfarin dose management is considered investigational.51 The
Cigna policy on pharmacogenetic testing does not cover genotyping for CYP2C9 or VKORC1.52
Conclusions
The goal of anticoagulant therapy is to prevent thromboembolism while minimizing the risk of
bleeding.53 Warfarin management is complex because of its narrow therapeutic range and the
large number of variables that can influence anticoagulation.53 Among these variables are age,
height, weight, comorbidities, diet, drug interactions, and genetic variation.53 This systematic
review and meta-analysis was conducted to inform policy decisions in the state of Washington
regarding whether pharmacogenetic testing for the initiation of warfarin therapy has clinical
utility and cost-effectiveness compared to other management strategies.

WA – Health Technology Assessment March 6, 2018
Pharmacogenetic testing for patients treated with anticoagulants: Draft evidence report 20
Three meta-analytic outcomes represent end outcomes of importance to patients: mortality,
thromboembolic events, and major bleeding. This meta-analysis found a 17% lower risk of death
when conventional dosing strategies were employed, although the difference was not
statistically significant, and the overall confidence in this finding is based on low quality of
evidence. There were 15% fewer thromboembolic events in the pharmacogenetic testing group
meta-analysis, although this was also not statistically significant; confidence in this finding was
moderate based on the quality of evidence. Major bleeding was 57% less likely with the
pharmacogenetic intervention, and this finding was statistically significant and had a moderate
quality of evidence.
None of the studies reported the number of deaths directly related to the pharmacogenetic or
comparator dosing method, but nearly all studies reported these deaths as “all-cause” mortality
or unrelated to the intervention. The small number of events overall make this outcome
somewhat unstable. The meta-analysis for thromboembolic events was heavily influence by the
Gage et al. (2017) RCT, which included an additional outcome assessment for asymptomatic
lower extremity DVT with the use of duplex ultrasound approximately 1 month after surgery.31
No other study screened for asymptomatic cases of thromboembolism and the size of the trial31
meant that this RCT was heavily weighted in the meta-analysis, such that the meta-analysis likely
overstates any advantage of pharmacogenetic testing.
Major bleeding was the one outcome that favored pharmacogenetic testing, but there are
caveats to this finding as well. Four of the 11 RCTs had no major bleeding events in either study
group and two additional RCTs had only 1 event each. The addition of these RCTs to the meta-
analysis is recommended to improve the overall precision of results, but also creates a situation
in which outlier studies might have more influence, particularly with a small overall number of
events. These studies all had slightly different definitions of major bleeding and different lengths
of follow-up during which the outcome could be detected. The study by Kimmel et al. (2013),21
which accounted for one-third of the weight in the meta-analysis, had a broad definition of
major bleeding and a 4-week follow up period. The Gage et al. (2017)31 RCT, accounting for
about 19% of the meta-analytic weight for this outcome, had a more narrow definition of major
bleeding and collected outcomes in the first month of treatment, but was conducted only
among patients having lower extremity arthroplasty surgery for which bleeding might
reasonably be expected to be more likely overall. The much smaller RCT by Burmester et al.
(2011)7 contributed nearly 21% of the meta-analytic weight to the outcome of major bleeding.
Burmester et al. (2011) collected outcomes in the first 14 days of therapy and reported major
bleeding in several ways: events adjudicated by the study’s Data Safety Monitoring Board or
events defined as either “significant” or “life-threatening.” Center researchers used the
adjudicated events for the meta-analysis, but noted that the other two definitions had more
bleeding episodes within the pharmacogenetically tested group.
Two meta-analytic outcomes are intermediate outcomes: PTTR and overanticoagulation. These
two outcomes were more robustly reported across RCTs, and therefore more amenable to

WA – Health Technology Assessment March 6, 2018
Pharmacogenetic testing for patients treated with anticoagulants: Draft evidence report 21
subgroup analyses. The risk of overanticoagulation was 10% lower and the PTTR 3.11% higher in
the pharmacogenetic testing intervention groups. Neither of these estimates was statistically
significant, and Center researchers had low confidence in both findings based on the quality of
evidence.
Overanticoagulation puts the patient at risk of bleeding.53 There are likely to be “overshoots”
during initiation of warfarin therapy, but with close monitoring, risks can be minimized.53 A
supratherapeutic INR that is less than 5.0 generally requires no action more aggressive than
holding a dose or checking the INR again. Therefore, the clinical significance of the meta-
analytic finding, even if it was statistically significant, is not clear. A PTTR of greater than 60%,
and preferably 75%, is associated with improved outcomes for patients, including mortality,
major bleeding, stroke, and heart attack.54 However, many factors influence the PTTR, from
individual patient characteristics to the frequency of INR measurement and the organization and
effectiveness of anticoagulation services.55 Center researchers were unable to ascertain a
minimal clinically significant level for differences in PTTR and noted that 87,21-23,28-31 of 12 RCTs in
this meta-analysis did not have PTTR results in either group that met the 60% threshold. It is,
therefore, difficult to gauge the significance of the 3.11% difference in PTTR found in this meta-
analysis. The pharmacogenetically guided algorithms used in the RCTs in this systematic review
all included clinical factors in addition to genetic variant data. Subgroup meta-analysis
determined that the PTTR advantage seen in the pharmacogenetic testing groups could be
explained by the use of fixed-dose warfarin initiation rather than a clinical algorithm in the
comparator group. When the RCT used a clinical algorithm, there was no longer any advantage
to the addition of pharmacogenetic testing.
There were 532-36 modeling studies to contribute to evaluating the cost-effectiveness of
pharmacogenetic testing for warfarin therapy in the setting of atrial fibrillation. All of these
studies had limitations, and the overall quality of evidence was very low. Only 3 of the studies
were conducted using a U.S. perspective. All 3 assumed a higher PTTR than was found in our
meta-analysis, and despite this did not find the intervention cost-effective in 2007 U.S. dollars at
a conventional threshold of $50,000.
Center researchers identified 8 relevant clinical practice guidelines.8,37-42,46 Of these, 3 guidelines,
including the American College of Chest Physicians 2012 guideline Evidence-Based Management
of Anticoagulant Therapy,40 recommend against the use of pharmacogenetic testing to initiate
warfarin therapy, 2 guidelines recommend its use,8,46 and 3 have no recommendation.37-39
Neither the Medicare NCD nor the Noridian LCD provide coverage for pharmacogenetic testing
except for enrollees participating in RCTs of warfarin treatment, and no relevant private payers
cover the testing. In summary, the evidence on pharmacogenetic testing for warfarin therapy is
limited, with only some evidence that it might decrease episodes of major bleeding. However,
neither good-quality practice guidelines nor payer coverage policies support its use.
Finally, Center researchers did not identify studies involving oral anticoagulants other than
warfarin that were eligible for inclusion. However, the trials registry site www.ClinicalTrials.gov
WA – Health Technology Assessment March 6, 2018
Pharmacogenetic testing for patients treated with anticoagulants: Draft evidence report 22
identified ongoing studies that involve pharmacogenetic testing and direct-acting oral
anticoagulants (see Appendix G).

WA – Health Technology Assessment March 6, 2018
Pharmacogenetic testing for patients treated with anticoagulants: Draft evidence report 23
Technical Report
Background
Anticoagulant drugs, commonly known as blood thinners, are used for patients with conditions
such as atrial fibrillation (Afib), deep venous thrombosis (DVT), pulmonary embolism, or other
complications from having a blood clot, or after surgery to prevent stroke.1 Warfarin
(Coumadin), approved for use in the U.S. by the Food and Drug Administration (FDA) in 1954, is
the most commonly prescribed oral anticoagulant, although use of direct oral anticoagulants
(DOACs) is increasing.2 When prescribing anticoagulants, the risk of thrombosis from the
underlying condition needs to be weighed against the risk of bleeding from anticoagulation.3
Excessive bleeding from using anticoagulants can occur in any area of the body, and the most
serious bleeding is usually gastrointestinal or intracerebral.5 Warfarin use is the most common
cause of medication-related emergency department visits in the U.S.56
Clinical decisions about which of these agents to use depend on the underlying indication for
anticoagulation and other considerations such as the patient’s creatinine clearance (a measure
of renal function), other medications used, and history of serious bleeding.4 Achieving effective
anticoagulation can require time, laboratory testing, and dose adjustments, particularly for
warfarin.4 The newer DOACs do not require such close monitoring, have more predictable
dosing profiles, fewer interactions with other drugs, and more rapid onset and offset of action
compared to warfarin.57 DOACs include factor II inhibitors (e.g., dabigatran) and factor Xa
inhibitors (e.g., apixaban, betrixaban, edoxaban, and rivaroxaban).57 Potential limitations of
DOACs include class-specific or drug-specific cautions and contraindications, reduced
adherence with lack of regular monitoring, and higher costs than warfarin.57
The formation of a clot in the body is a complex process that involves multiple substances called
clotting factors. Warfarin decreases the body’s ability to form blood clots by blocking the
formation of vitamin K-dependent clotting factors.5 Individual patient characteristics can affect
warfarin’s anticoagulation effect on the body, including diet, comorbidities, and interactions with
other medications, which can lead to wide variation in warfarin dose requirements.4 Thus, the
effect of warfarin must be monitored carefully with blood testing that measures the time it takes
for blood to clot using the prothrombin time test, which is reported as the International
Normalized Ratio (INR). In the beginning stages, INR testing might need to occur frequently,
even daily. After initial adjustment of dosing, a patient is usually tested every 2 to 4 weeks, and
the daily dose of warfarin can be adjusted to keep the INR within the target range, which varies
by clinical condition, but is typically between 2.0 and 3.0.5,6
Protocols for initial dosing of warfarin can call for a standard dose for most patients, or a dose
based on a clinical algorithm that uses a patient’s individual characteristics. The use of different
initial warfarin dose strategies is somewhat controversial and varies in different regions of the
world, based on experience and local standards.8 The clinical algorithms can include a patient’s
age, sex, ethnicity, weight, body surface area, comorbidities, and indication for warfarin use.

WA – Health Technology Assessment March 6, 2018
Pharmacogenetic testing for patients treated with anticoagulants: Draft evidence report 24
Genotype testing can be included in the calculation of initial warfarin dose to create a
pharmacogenetic algorithm.
Technology Description
The most frequent genotypes included in pharmacogenetic algorithms for warfarin dosing are
cytochrome P450 2C9 (CYP2C9), vitamin K epoxide reductase (VKORC1), and cytochrome P450
4F2 (CYP4F2). The CYP2C9 enzyme metabolizes warfarin, and polymorphisms in CYP2C9 reduce
enzymatic activity, which can lead to significantly lower therapeutic doses of warfarin in
patients.7 Warfarin blocks VKORC1 enzyme activity, which catalyzes the reduction of vitamin K1
and its epoxide.7 The reduced form of these compounds serves as a cofactor for the gamma
glutamyl carboxylase that generates the active form of clotting factors II, V, VII, and IX.7 Genetic
variants in VKORC1 result in the therapeutic dose of warfarin being reduced by approximately
25% per variant allele.7 The CYP4F2 enzyme cleaves the phytal side chain of vitamin K, leading to
inactive metabolites, and the genetic polymorphism in CYP4F2 can increase the warfarin
therapeutic dose by up to 12% per allele.7
Common variants in CYP2C9, VKORC1, and CYP4F2 account for up to 18%, 30%, and 11%,
respectively, of the variance in stable warfarin dose among populations of European ancestry.8
Variants of these 3 genes explain less of the dose variability among patients of other ancestries
because of differing allele frequencies across populations.8 For example, CYP2C9*2 is almost
absent in Asian populations.8 Other CYP2C9 alleles (e.g., *5, *6, *8, *11) occur almost exclusively
in persons of African ancestry and contribute to dose variability for patients with African
ancestry.8
FDA Medication Guide
The FDA Medication Guide for warfarin includes a warning that use of warfarin can cause major
or fatal bleeding.58 The FDA Medication Guide states that the dosage and administration of
warfarin must be individualized for each patient, and regular monitoring of INR is needed in all
treated patients.58 The appropriate initial dosing of warfarin varies widely for different patients;
known factors that influence warfarin dose variability include age, race, body weight, sex,
concomitant medications, comorbidities, and CYP2C9 and VKORC1 genotypes.58
The FDA Medication Guide provides dosing recommendations with genotype testing, as shown
in the following table, which displays 3 ranges of expected maintenance warfarin doses for
patient subgroups with different combinations of CYP2C9 and VKORC1 gene variants. The FDA
Medication Guide states, “If the patient’s CYP2C9 and/or VKORC1 genotype are known, consider
these ranges in choosing the initial dose. Patients with CYP2C9 *1/*3, *2/*2, *2/*3, and *3/*3
may require more prolonged time (2 to 4 weeks) to achieve maximum INR effect for a given
dosage regimen than patients without these CYP variants.” 58(p. 6)

WA – Health Technology Assessment March 6, 2018
Pharmacogenetic testing for patients treated with anticoagulants: Draft evidence report 25
Three Ranges of Expected Maintenance Warfarin Daily Doses
Based on CYP2C9 and VKORC1 Genotypes
VKORC1 CYP2C9
*1/*1 *1/*2 *1/*3 *2/*2 *2/*3 *3/*3
GG 5-7 mg 5-7 mg 3-4 mg 3-4 mg 3-4 mg 0.5-2 mg
AG 5-7 mg 3-4 mg 3-4 mg 3-4 mg 0.5-2 mg 0.5-2 mg
AA 3-4 mg 3-4 mg 0.5-2 mg 0.5-2 mg 0.5-2 mg 0.5-2 mg
Note. Ranges are derived from multiple published clinical studies. VKORC1−1639G>A (rs9923231) variant is
used in this table. Other co-inherited VKORC1 variants may also be important determinants of warfarin
dose.58(p. 6)Source. Table adapted from FDA 58(p. 6).
Policy Context
There are a growing number of genetic tests and panels of genetic tests designed to inform
decisions on the selection and dosage of oral anticoagulant medications. Potential benefits of
these tests are more appropriate treatment decisions and better patient outcomes, including
avoiding treatment-related side effects. This topic was selected by the Washington Health
Authority for a health technology assessment because of low concerns for the safety of these
tests, high concerns for efficacy, and medium/high concerns for cost.
This evidence review will help to inform Washington’s independent Health Technology Clinical
Committee as the committee members determine coverage regarding selected genetic tests for
patients with an indication for use of oral anticoagulant medications.
Washington State Utilization and Cost Data
Populations
The Pharmacogenetic testing for patients being treated with oral anticoagulants analysis
includes member utilization and cost data from the following agencies: PEBB/UMP (Public
Employees Benefit Board Uniform Medical Plan); PEBB Medicare; and the HCA Medicaid (Fee-
for-Service) and the MCO Medicaid (Managed Care) programs. The Department of Labor and
Industries (LNI) Workers’ Compensation Plan had no claims that matched the parameters of this
study.
The analysis period was three calendar years, 2015-2017. Primary study inclusion criteria
included having experiencing at least one of the CPT/HCPCS codes from Table A and, finally, a
diagnosis related to hypertension.
Methods
Anticoagulant testing counts were based on an individual experiencing a paid, provider-patient
face-to-face meeting, on a specific date, including at least one of the CPT codes from Table A

WA – Health Technology Assessment March 6, 2018
Pharmacogenetic testing for patients treated with anticoagulants: Draft evidence report 26
and having a cardiac/hypertension condition. Additional analysis included reviewing utilization
data by member; and by treatment modality (Table A, Modality).
Table A
Procedure (CPT/HCPCS) descriptions
CPT/
HCPCS Description
81227 CYP2C9 (cytochrome P450, family 2, subfamily C, polypeptide 9) (e.g., drug
metabolism), gene analysis, common variants (e.g., *2, *3, *5, *6)
81355 VKORC1 (vitamin K epoxide reductase complex, subunit 1) (e.g., warfarin
metabolism), gene analysis, common variant(s) (e.g., -1639G>A, c.173+1000C>T)
Table B
Definitions for utilization and cost tables
Allowed dollars by total treatments w/diagnosis - Annual paid dollars for all treatments
Average allowed dollars/test dollars - Total paid dollars for one service on a specific date.
Unique patients - Non-duplicated patient by year, reported by agency
Total treatments with diagnosis and allowed dollars - Treatment defined as a single patient-
provider face-to-face on a specific date and includes a hypertension related diagnosis
on the claim.
Demographics
The following graphs depict the fluctuations in the study populations, PEBB and Medicaid (HCA and
Managed Care). Each agency population is analyzed over a four (4) year period.
1,300,000
1,400,000
1,500,000
1,600,000
1,700,000
1,800,000
2014 2015 2016 2017
Mem
ber
s
Chart 1 2014 - 2017 Medicaid Population Growth

WA – Health Technology Assessment March 6, 2018
Pharmacogenetic testing for patients treated with anticoagulants: Draft evidence report 27
Chart 3
Table C
2015–2017 Utilization Allowed Dollars: Pharmacogenomic testing
for patients being treated with anticoagulants
Medicaid MCO and Medicaid HCA (Fee-for-service), PEBB/UMP and Medicare/PEBBˆˆ
2015 2016 2017ˆ
Unique Patients 36 61 26
Total Treatments with Diagnosis and Allowed Dollars 36 61 26
Dollars Allowed by Total Treatments w/Diagnosis $3,662 $2,723 $877
ˆ 2017 lacks 90 days of claims run-out.
215,000
220,000
225,000
230,000
235,000
240,000
245,000
250,000
2014 2015 2016 2017
Mem
ber
sChart 2
2014 - 2017 PEBB/UMP Population Growth

WA – Health Technology Assessment March 6, 2018
Pharmacogenetic testing for patients treated with anticoagulants: Draft evidence report 28
ˆˆ Due to low number, utilization and costs information from participating agencies are shown in
aggregate

WA – Health Technology Assessment March 6, 2018
Pharmacogenetic testing for patients treated with anticoagulants: Draft evidence report 29
Table D
2015–2017 Average Allowed Dollars/Test
Pharmacogenomic testing for patients being treated with anticoagulants
Medicaid MCO and Medicaid HCA (Fee-for-service), PEBB/UMP and Medicare/PEBB
81227 and 81355
CPT 81227 CPT 81355
PEBB/UMP $142 $0#
PEBB/Medicare $156 $63
Medicaid HCA/MCO $143 $80
# Cannot be determined from claim.
Table E
2015–2017 Distribution of Top Diagnosis by Count—Line-Level, Paid and Unpaid Claims
PEBB/UMP, PEBB Medicare, Medicaid HCA and MCO for Anticoagulant Testing
Dx: Line Level Descriptions Sum
Essential (primary) hypertension 25
Obesity (morbid and other) 24
Hypothyroidism, unspecified 21
Pure hypercholesterolemia 15
TYPE 2 Diabetes Mellitus 5
Mixed hyperlipidemia 4
Angina pectoris, unspecified 3
Benign hypertension 3
Other forms of acute ischemic heart disease 3
Secondary hypertension, unspecified 2

WA – Health Technology Assessment March 6, 2018
Pharmacogenetic testing for patients treated with anticoagulants: Draft evidence report 30
Methods
This evidence review is based on the final key questions published on January 26, 2018.
Population: Adults and children initiating or changing dosage of oral anticoagulant medications
Interventions: Genetic testing to inform the selection or dosage of oral anticoagulant
medications
Comparators: Usual care without genetic testing
Outcomes:
Patient-oriented clinical outcomes (e.g., death, stroke, time in therapeutic range [TTR],
overanticoagulation, bleeding, quality of life as measured by validated instruments)
Consequences of treatment decisions (including decisions by prescribers or patients to
use, not use, or continue use of specific medications) on response to treatment and
adverse effects as a result of treatment
Direct harms, such as consequences of inaccurate test results
Cost-effectiveness and other economic outcomes
Time period for MEDLINE and Cochrane Library searches: Database inception to January 3,
2018
Key Questions
1. Effectiveness: What is the clinical utility of genetic testing to inform treatment decisions
for patients being treated with anticoagulants?
a. Do treatment decisions guided by genetic testing result in clinically meaningful
improvements in important patient outcomes (e.g., death and stroke) or
reductions in adverse events (e.g., bleeding) compared with usual care without
genetic testing?
b. Does genetic testing to inform the selection or dose of medications change the
drug or dosage selected by prescribers or patients compared with usual care
without genetic testing?
2. Harms: What direct harms are associated with conducting genetic testing when it is used
to inform the selection or dosage of oral anticoagulant medication?
3. Special populations: Compared with usual care without genetic testing, do important
patient outcomes or harms after genetic testing vary by:
c. Patient characteristics (e.g., age, sex, race/ethnicity)?
d. Clinical history (e.g., medical comorbidities, underlying condition requiring
anticoagulation, severity of illness, concurrent medication use, whether treatment
decision is initial or subsequent)?
4. What are the cost-effectiveness and other economic outcomes of genetic testing used to
inform the selection or dosage of oral anticoagulant medication?

WA – Health Technology Assessment March 6, 2018
Pharmacogenetic testing for patients treated with anticoagulants: Draft evidence report 31
Analytic Framework
The analytic framework shown in Figure 1 guided the selection, synthesis, and interpretation of
available evidence.
Figure 1. Analytic Framework
Eligible Studies
Table 1 summarizes the study inclusion and exclusion criteria.
Table 1. Study Inclusion and Exclusion Criteria
For clinical utility studies (KQ 1, 2, and 3), include
study if all of the following criteria are met:
Rationale
Study population is composed of adults and/or
children with an indication for oral anticoagulant
therapy.
The clinical population of interest for whom the
test may be employed.
The interventions are genetic tests that are used to
guide dosing of oral anticoagulant medications.
These tests were of interest to the requester and
are available and being used in the U.S.
Comparator included usual care without genetic
testing to guide dosing of oral anticoagulant
medications.
Without a comparison group, a study is not able
to measure the effect of the intervention test on
the outcomes of interest.
At least one outcome is a measure of direct clinical
utility, including patient management decision (by
care provider and/or patient); clinical outcomes
Outcomes of interest are defined to inform the
requestor’s decision-making needs. Patient-
oriented end outcomes rather than surrogate or
KQ 4
KQ 4
KQ 1 and 3
KQ 2 and 3
Patients Adults or children using anticoagulants
Outcomes Key patient-oriented clinical
outcomes
Prescriber or patient treatment
decisions
Direct harms
Cost-effectiveness and other
economic outcomes
Subgroups
Patient characteristics
Clinical history
KQ 3
Intervention Pharmacogenetic testing to inform treatment decisions
Cost-effectiveness Harms

WA – Health Technology Assessment March 6, 2018
Pharmacogenetic testing for patients treated with anticoagulants: Draft evidence report 32
For clinical utility studies (KQ 1, 2, and 3), include
study if all of the following criteria are met:
Rationale
such as mortality, morbidity, or quality of life
measures resulting from patient management
decisions resulting from the test; harms such as
inaccurate test results influencing patient
management decisions; and (for KQ4 only) cost-
effectiveness or other economic outcomes
resulting from use of the test.
intermediate outcomes are required to inform
this decision. Studies that assess only analytic or
clinical validity are excluded because they do not
yield information about their usefulness to
patients and clinicians in practice.
Settings for data collection included clinical
facilities (inpatient or outpatient) in any country
with substantial applicability to the U.S. setting.
The clinical utility of a genetic test could be
expected to vary based on the underlying health
system and care within that system, and so only
settings with direct applicability to the U.S. will
be included.
Study designs include systematic reviews (with and
without meta-analysis) and health technology
assessments that meet inclusion criteria for this
review, and randomized controlled trials.
Systematic reviews, meta-analyses, and health
technology assessments must be of low or
moderate risk of bias.
Study designs are selected to minimize bias.
Randomized controlled trials and systematic
reviews and meta-analyses of them generally
offer the lowest risk of bias because they are
designed to minimize the effects of confounding
factors on the outcomes.
Other criteria:
Publication in English
Publication date 2007 or later
Publication available for full-text review
Data from study publication is extractable
Report authors and users of report use English
language.
Scoping indicated that studies of gene
expression profile tests likely to be eligible were
not published before 2007 or were captured in
systematic reviews published after that date.
Studies must be available for review.
Data included in publication must be reported in
a way that can be used and analyzed in the
report.
Data Sources and Searches
Center researchers conducted a search of the peer-reviewed published literature using multiple
online databases. RCTs and systematic reviews (with and without meta-analysis) and health
technology assessments of RCTs that assessed clinical utility were considered for Key Questions
1, 2, and 3. Cost-effectiveness studies and other comparative economic evaluations, along with
systematic reviews (with and without meta-analysis) reporting economic outcomes, were
considered for Key Question 4. The following electronic databases were searched to identify
relevant peer-reviewed studies:
Ovid MEDLINE and In-Process & Other Non-Indexed Citations
Cochrane Database of Systematic Reviews

WA – Health Technology Assessment March 6, 2018
Pharmacogenetic testing for patients treated with anticoagulants: Draft evidence report 33
Cochrane Central Register of Controlled Trials
The Ovid MEDLINE search strategy is in Appendix A. Center researchers also screened reference
lists of relevant studies and used lateral search functions such as related articles and cited by.
These additional sources were also searched:
Agency for Healthcare Research and Quality (AHRQ)
National Institute for Health and Care Excellence (NICE)—Evidence
Veterans Administration Evidence-based Synthesis Program
Center researchers searched these sources for systematic reviews and clinical practice guidelines,
using the same search terms outlined for the evidence search In addition, searches of the
AHRQ’s National Guideline Clearinghouse (guidelines.gov) and websites of relevant professional
organizations for guidelines were conducted. These searches included terms related to oral
anticoagulants (e.g., medication names) and pharmacogenetics. Guidelines published in the past
5 years were considered for inclusion.
Center researchers conducted a search of PharmGKB, Stanford University’s online resource for
information about genetic variation on drug responses.9 A general Internet search for
appropriate published studies and relevant gray literature was also conducted. In addition,
Center researchers searched the Centers for Medicare & Medicaid Services (CMS) website for
the Medicare Coverage Database for National Coverage Determinations (NCDs) and Local
Coverage Determinations (LCDs) applying to the state of Washington. The Aetna, Cigna, and
Regence websites were searched for coverage policies for these private payers.
To identify relevant ongoing clinical trials, Center researchers searched the online database of
clinical trials (ClinicalTrials.gov) maintained by the National Library of Medicine at the National
Institutes of Health. This search included terms related to oral anticoagulants (e.g., medication
names) and pharmacogenetics. Information in this database is provided by the sponsor or
principal investigator of clinical studies. Studies are generally registered in the database when
they begin, with information updated as the study progresses.
Screening
Two Center researchers screened titles and abstracts and had discussions to reach agreement on
exclusion. For studies that the 2 researchers could not agree on whether to exclude by title and
abstract screening, a full-text review for inclusion criteria was performed. The 2 researchers had
discussions to reach agreement on inclusion after the full-text review, and any remaining
disagreement among these assessments was settled by a third researcher.
Data Abstraction and Quality Assessment
One Center researcher used standardized procedures to extract relevant data from each of the
included trials, and at least one other investigator cross-checked the data for accuracy.
Two independent Center researchers evaluated trials for methodological risk of bias. The 2
researchers had discussions to reach agreement on the risk-of-bias assessments, and any

WA – Health Technology Assessment March 6, 2018
Pharmacogenetic testing for patients treated with anticoagulants: Draft evidence report 34
remaining disagreement among these assessments was settled by a third independent
researcher. Each trial was assessed using Center instruments adapted from national and
international standards and assessments for methodological quality.59-64 A rating of high,
moderate, or low risk of bias was assigned to each included study, based on adherence to
recommended methods and potential for bias affecting internal and external biases. The risk-of-
bias criteria for all of the study types are in Appendix B.
Center researchers assigned each outcome a summary judgment for the overall quality of
evidence based on the system developed by the Grading of Recommendations, Assessment,
Development, and Evaluation Working Group (GRADE).65,66 The GRADE system defines the
overall quality of a body of evidence for an outcome in the following manner:
High: Raters are very confident that the estimate of the effect of the intervention on the
outcome lies close to the true effect. Typical sets of studies are RCTs with few or no
limitations, and the estimate of effect is likely stable.
Moderate: Raters are moderately confident in the estimate of the effect of the
intervention on the outcome. The true effect is likely to be close to the estimate of the
effect, but there is a possibility that it is different. Typical sets of studies are RCTs with
some limitations or well-performed nonrandomized studies with additional strengths
that guard against potential bias and have large estimates of effects.
Low: Raters have little confidence in the estimate of the effect of the intervention on the
outcome. The true effect may be substantially different from the estimate of the effect.
Typical sets of studies are RCTs with serious limitations or nonrandomized studies
without special strengths.
Very low: Raters have no confidence in the estimate of the effect of the intervention on
the outcome. The true effect is likely to be substantially different from the estimate of
effect. Typical sets of studies are nonrandomized studies with serious limitations or
inconsistent results across studies.
Not applicable: Researchers did not identify any eligible articles.
Two independent Center researchers evaluated the methodological quality of eligible clinical
practice guidelines. The 2 researchers had discussions to reach agreement on the quality
assessments, and any remaining disagreement among these assessments was settled by a third
independent researcher. The methodological quality of clinical practice guidelines was rated as
good, fair, or poor. The assessment criteria for the methodological quality of clinical practice
guidelines are in Appendix B.
Search Results
The search strategy located 1,007 unduplicated citations. After excluding 965 citations by dual
assessment of title and abstract, 42 full-text articles were independently reviewed by 2
researchers; 24 of these did not meet predetermined inclusion criteria. Table 1 is a detailed list
of criteria and their rationale. The search results are summarized in a Preferred Reporting Items

WA – Health Technology Assessment March 6, 2018
Pharmacogenetic testing for patients treated with anticoagulants: Draft evidence report 35
for Systematic Reviews and Meta-Analyses (PRISMA) study flow diagram in Figure 2. A list of the
excluded studies and reasons for exclusion are in Appendix I.
All eligible RCTs and systematic reviews of RCTs assessed the clinical utility of pharmacogenetic
testing for the dosing of warfarin.
After full-text review, 11 systematic reviews of RCTs were identified.1,10-19 Among the studies
included in these systematic reviews, 10 eligible RCTs were identified.7,20-28 Three additional
eligible RCTs were identified that were published after the most recent systematic review.29-31
One of these more recent RCTs, published by Gage et al. in 2017, has the largest sample size
(n = 1,650) of all the identified RCTs. Thus, Center researchers decided to conduct a systematic
review and meta-analysis of the 13 eligible RCTs and to not include the systematic reviews as
primary sources. One of the included RCTs25 did not report any of the outcomes included in the
meta-analysis.
The 5 eligible economic studies focused on pharmacogenetic testing for the dosing of warfarin
in the setting of atrial fibrillation.32-34

WA – Health Technology Assessment March 6, 2018
Pharmacogenetic testing for patients treated with anticoagulants: Draft evidence report 36
Figure 2. PRISMA Study Flow Diagram
Statistical Analysis
Center researchers conducted meta-analyses for 5 outcomes, which are displayed below with
their data type:
Percentage of time in therapeutic range (PTTR) (continuous, as a percentage of follow-up
time)
Records identified through
database searching
(n = 1,214)
Additional records identified
through other sources
(n = 10)
Total records
(n = 1,224)
Records after duplicates removed
(n = 1,007)
Records excluded by title/abstract
(n = 965)
Not intervention of interest: 161
No outcome of interest: 21
Publication type: 608
Not appropriate setting: 2
Not most recent systematic review: 4 Prior to 2007: 131
Not English: 38
Full-text articles assessed
for eligibility
(n = 42)
Full-text articles excluded (n = 24)
Not intervention of interest: 2 No outcome of interest: 5
Publication type: 2 No comparator: 2
Not most recent systematic review: 2 Individual studies from systematic review
are included: 11
Studies included in
qualitative synthesis
(n = 18)
13 randomized control trials
5 economic studies

WA – Health Technology Assessment March 6, 2018
Pharmacogenetic testing for patients treated with anticoagulants: Draft evidence report 37
INR greater than or equal to 4 (binary, unique event)
Thromboembolic events (binary, unique event)
Mortality (binary, unique event)
Major bleeding (binary, unique event)
Using RevMan 5.3, Center researchers estimated pooled and subgroup mean differences and
risk ratios and their 95% confidence intervals for continuous and binary outcomes, respectively.
Center researchers used the inverse variance statistical technique and random effects models for
all outcomes. Center researchers took the longest period of follow-up that was identified in
published documents for all outcomes. Subgroup analyses included an assessment of multiple
factors:
Different comparators (i.e., clinical algorithm-guided based dosing compared to fixed
dosing)
Risk of bias (i.e., high compared to moderate compared to low)
Sample size (i.e., greater than or equal to 400 total participants or less than 400 total
participants)
Number of genes tested in the pharmacogenetics test (i.e., 3 genes, 2 genes, or 1 gene)
Country where the study was conducted (i.e., U.S. compared to other countries)
Clinical indication (i.e., atrial fibrillation, valve replacement, post-orthopedic surgery, or
other indications)
Race (i.e., 90% or more total participants were White, 90% or more total participants
were Asian, or a combination of races)
Follow-up period (i.e., greater than 30 days or 30 days or less)
All subgroup analyses were conducted for PTTR and INR greater than or equal to 4. Only
exploratory analyses of different comparators were conducted for thromboembolic events,
mortality, and major bleeding. Center researchers conducted sensitivity analyses assessing
different periods of follow-up in Wen 201729 and inclusion of Huang 200928 within meta-
analyses of INR. Huang 200928 had available data only on INR greater than or equal to 3.5
instead of INR greater than or equal to 4.
Using RevMan 5.3, Center researchers created forest plots to graphically display the findings for
the overall and subgroup meta-analyses. Funnel plots were also created using RevMan 5.3 to
qualitatively assess publication bias for PTTR and INR greater than or equal to 4. Center
researchers entered data into the meta-analyses when zero events for a particular outcome in
both the pharmacogenetic testing group and control group occurred. Although these data
contribute to the total participants in each group and are displayed within the forest plots,
RevMan 5.3 does not account for these findings in the pooled estimate (Cochrane Support
Team, email, February 26, 2018). Including zero total events trials in the meta-analysis moves the
pooled effect estimate closer to the null, but also narrows the confidence interval and results in
decreased heterogeneity.67 Biostatisticians recommend inclusion of zero event trials because of
these factors.67 Nevertheless, Center researchers calculated the incidence for each binary

WA – Health Technology Assessment March 6, 2018
Pharmacogenetic testing for patients treated with anticoagulants: Draft evidence report 38
outcome by group and the risk difference between the 2 groups for these outcomes. These
measures take into consideration zero event data. The findings are displayed in Table 3.
For PTTR, if a mean difference was greater than zero, then the pharmacogenetic test was
favorable compared to the control. If the mean difference was less than zero, then the control
was favorable compared to the pharmacogenetic test. If the mean difference was zero, then
there was no difference between the pharmacogenetic test and control. For all other outcomes,
if a risk ratio was below 1.00, then the pharmacogenetic test was favorable to the control. If a
risk ratio was above 1.00, then the control was favorable to the pharmacogenetic test. If the risk
ratio was 1.00, then there was no difference between the pharmacogenetic test and control.
Center researchers used an alpha level of .05 to determine statistical significance for all overall
meta-analyses. Center researchers assessed all overall and subgroup meta-analyses for statistical
and clinical heterogeneity. Statistical heterogeneity was considered present if an I2 statistic was
greater than or equal to 50% with a Chi-square test that had a p value of less than or equal to
.10.
When trials had more than 2 groups, Center researchers calculated weighted means for
comparable groups (e.g., same intervention, same comparator) and pooled standard deviations.
When relevant statistics to conduct a meta-analysis were missing, Center researchers attempted
to calculate the statistics using available data (e.g., 95% confidence interval, sample size, number
of events reported in 1 group), and we contacted study authors for the data. For the GRADE
summary of evidence table (Table 3), Center researchers calculated the anticipated risks and
95% confidence intervals in the intervention and control groups and the risk differences and
95% confidence intervals between these two groups using OpenEpi software.68
Evidence Summary
The section below summarizes the study characteristics and study participant characteristics for
each of the included RCTs.
RCT Descriptions
Anderson et al., 2007
Anderson et al. (2007) conducted an RCT comparing pharmacogenetic dosing to standard
empiric dosing using the Kovacs 10 mg initiation nomogram.27 The target INR was 2 to 3.
Exclusion criteria included pregnancy, lactation, rifampin use, and comorbidities (e.g., renal or
hepatic insufficiency) that would preclude standard dosing.27 Group assignment was masked to
all except for a research assistant and the pharmacist.27 Over half of the 200 patients enrolled
had an orthopedic procedure as the indication for anticoagulation, and the study also included
patients with DVT or pulmonary embolism, Afib, or other diagnoses.27 Nearly all patients were
White.27 Patients were generally initiated on warfarin therapy while hospitalized.27 Participants in
the pharmacogenetic study arm were statistically significantly older, had any CYP2C9 genetic
variant, and a higher proportion had hypertension.27 Following study initiation, the standard
dose arm received 10 mg of warfarin on days 1 and 2 and 5 mg on days 3 and 4.27 Doses were

WA – Health Technology Assessment March 6, 2018
Pharmacogenetic testing for patients treated with anticoagulants: Draft evidence report 39
then adjusted based on the day 5 INR.27 The pharmacogenetic study arm was dosed according
to a regression equation that included CYP2C9 and VKORC1 genotype, age, weight, and sex.27
Regression scores were converted to 14-dose increments between 1 and 8 mg.27 Twice the
predicted dose was given on days 1 and 2, and subsequent doses were modified based on the
measured INR, using the standard arm predicted dose multiplied by the regression coefficient.27
Outcomes were collected for 3 months or until warfarin therapy ended (usually at 1 month for
those with an orthopedic indication).27 The primary outcome was the proportion of out of range
INR values (defined as <1.8 or >3.2).27 Center researchers assessed this trial as having a
moderate risk of bias because of inadequate allocation concealment, unclear masking of
outcome assessment, and an unclear description of the statistical analysis.
Borgman et al., 2012
Borgman et al. (2012) conducted a pilot RCT of 26 patients to test the feasibility of a genotype-
guided warfarin dosing tool (PerMIT) that incorporated CYP2C9 and VKORC1 polymorphism
information compared to standard care by the University of Utah thrombosis service, employing
the Kovacs algorithm.20 Exclusion criteria included pregnancy and significant comorbidities such
as hepatic or renal insufficiency.20 Enrolled patients had a mix of indications for anticoagulation,
were warfarin naïve, and had a projected length of treatment of at least 12 weeks.20 The 2 teams
responsible for anticoagulation in each study arm were aware of patient allocation.20 The
standard care arm was generally started at 5 mg per day, but clinician discretion was allowed.20
Patients in the PerMIT group were also generally started on 5 mg on day 1, but were dosed
according to the PerMIT algorithm thereafter unless the patient’s clinician objected.20 The target
INR range was 2 to 3 and values of 1.8 to 3.2 were considered acceptable.20 INRs were routinely
measured in the first week on days zero, 3, and 5; twice in the second week; once in weeks 3 and
4 of therapy; and monthly thereafter.20 No primary endpoint was designated, but the study
measured outcomes such as TTR and time to stable therapeutic dose.20 Center researchers
assessed this trial as having a high risk of bias because of factors including unclear
randomization, inadequate allocation concealment, lack of masking, inadequate statistical
analysis, and some authors with an equity interest in the test provider.
Burmester et al., 2011
Burmester et al. (2011) conducted an RCT at the Marshfield Clinic in Wisconsin, comparing
pharmacogenetically guided warfarin initiation, using an algorithm that incorporated CYP2C9,
VKORC1, and CYP4F2 polymorphisms.7 The comparator group’s dosing was determined by the
standard Marshfield Clinic clinical algorithm.7 Most of the 230 randomized patients (80%) were
hospitalized at the initiation of anticoagulation; the indications for anticoagulation included
atrial fibrillation for 49% of the intervention group and 43% of the control group.7 Other
indications included thromboembolic disease and heart valve surgery.7 All patients identified as
White.7 Target INRs ranged from 2 to 3.5, depending on the clinical indication.7 Participants
received initial dosing on days 1 and 2, based on the predicted dose from either the
pharmacogenetic algorithm or the clinical algorithm.7 Subsequent dose adjustments were based
on guidelines from the American College of Cardiology (ACC) and American Heart Association

WA – Health Technology Assessment March 6, 2018
Pharmacogenetic testing for patients treated with anticoagulants: Draft evidence report 40
(AHA).7 The primary study outcomes were prediction error and TTR during the first 14 days of
therapy.7 Patients were followed for 60 days after randomization.7 Center researchers assessed
this trial as having a moderate risk of bias because of inadequate statistical analysis description,
partial funding from a test manufacturer, and authors who were patent holders for the
technology involved in the genomic test.
Caraco et al., 2008
Caraco et al. (2008) conducted an RCT that allocated patients based on whether the identity
number was odd or even (a method of pseudo-randomization).24 This study was conducted in
Israel and enrolled 283 patients, although 92 were excluded, leaving 185 in the analysis
(65.4%).24 The racial composition of participants was not reported.24 Approximately two-thirds of
enrollees had a VTE indication and the remainder were anticoagulated because of atrial
fibrillation.24 The locally developed intervention-dosing algorithm contained information about
the CYP2C9 genotype, although details about the other factors considered by that algorithm
were not specified except that all doses were lowered by 25% for patients who were
concurrently taking amniodarone.24 The authors noted that the comparator dosing algorithm
was a computer-generated system developed by Ageno et al. (2000),69 but no details were
provided. The primary outcomes were the time required to reach a therapeutic INR (INR > 2)
and the time required to reach stable anticoagulation.24 Patients were followed until a stable
dose of warfarin was achieved, which was generally about a month, but could vary.24 Center
researchers assessed this trial as having a high risk of bias because of the study authors’ use of
pseudo-randomization, inadequate allocation concealment and statistical analysis description,
and lack of outcome assessor masking.
Gage et al., 2017
Gage et al. (2017) conducted a U.S. multicenter RCT named GIFT (Genetic Informatics Trial of
Warfarin to Prevent DVT) that randomized 1,650 patients and analyzed 1,597 patients (96.8%)
who were initiating warfarin therapy to prevent postsurgical DVT after having elective hip or
knee arthroplasty.31 The trial included only patients over age 65 and excluded patients for
factors such as previously known genotype status or warfarin dose, baseline INR greater than
1.35, bleeding disorder or serious non-traumatic bleeding event in the previous 2 years, or
another indication for warfarin therapy (e.g., atrial fibrillation).31 The mean age of patients was
over 70 years and more than 90% were White.31
Patients were randomized to warfarin dosing based on a genotype-guided algorithm compared
to a clinically based algorithm on days 1 through 11 post-surgery.31 Randomization was
stratified by race, given that the prevalence of CYP2C9 *2 and *3 polymorphisms varies by race.31
The genotype-guided group received warfarin dosing in the first 11 days of the study as guided
by a web application (WarfarinDosing.org) that incorporated information on all genetic
variants.31 The pharmacogenetic algorithm incorporated information about the patient’s
CYP2C9, VKORC1, and CYP4F2 genotypes.31 Patients in the control group were dosed according
to the web-based clinical algorithm without addition of genetic information.31 Warfarin dosing

WA – Health Technology Assessment March 6, 2018
Pharmacogenetic testing for patients treated with anticoagulants: Draft evidence report 41
was open-label; however, investigators, clinicians, and patients were masked to group
assignment.31 Clinicians could deviate from the algorithm-predicted daily dose, although dose
deviations of ≥ 1 mg per day for doses >3 mg or ≥ 0.5 mg per day for doses ≤ 3 mg per day
were recorded as outcomes.31 The primary outcome was a composite of major bleeding, INR
greater or equal to 4, VTE, or death.31 All patients without a symptomatic DVT underwent a
lower extremity duplex ultrasound study for screening at approximately 1 month after surgery to
detect asymptomatic DVT.31 Patients were followed for 90 days post-surgery.31 Center
researchers assessed this trial as having a low risk of bias. Center researchers noted only minor
biases: the GenMarkDx company had loaned the genotyping platform to the central laboratory
involved in the study, and several authors disclosed commercial research funding and other
income.
Hillman et al., 2005
Hillman et al. (2005) conducted a feasibility RCT of 38 patients with a mix of indications for oral
anticoagulation from the Marshfield Clinic in Wisconsin.23 The study authors compared
intervention dosing based on a multivariable model that included age, body surface area,
diabetes and other comorbidities, the clinical indication, and the CYP2C9 genotype to a
standard initiation warfarin dosing regimen of 5 mg per day on the first day, with subsequent
doses adjusted according to the INR.23 Exclusion criteria included previous use of warfarin,
antiphospholipid antibodies, liver or renal disease, non-White race, and age under 40 years.23
These exclusions were employed because the algorithm was developed on patients without
these characteristics.23 A primary outcome was not designated because the study was done
primarily to assess the feasibility of the pharmacogenetically guided algorithm in practice, but
the authors did report PTTR and INR >4 for the first 28 days after initiation.23 Center researchers
assessed this trial as having a high risk of bias because of unclear randomization and allocation
concealment, lack of masking, and mid-study protocol changes.
Huang et al., 2009
Huang et al. (2009) conducted an RCT of a pharmacogenetically guided warfarin dosing
algorithm compared to a standard initiation protocol of 2.5 mg per day for the first 3 days of
therapy.28 Subsequent dose adjustments were based on INR values.28 The genetic protocol
involved testing for CYP2C9 and VKORC1 genotypes, but details about how genetic
polymorphisms were incorporated into the dosing algorithm were not provided.28 The authors
randomized 142 participants and 121 (85.2%) were analyzed.28 The study was conducted in
China, all patients were ethnically Chinese, and all had an indication of heart valve
replacement.28 The patient group was relatively young, with a mean age in the early 40s.28 The
primary outcome was the time required to reach a stable maintenance dose of warfarin, and
patients were followed for 50 days post-randomization.28 Center researchers assessed this trial
as having a high risk of bias because of unclear randomization and allocation concealment,
inadequate detail about the genetic dosing protocol, lack of masking, and lack of detail about
potential author conflicts of interest.
WA – Health Technology Assessment March 6, 2018
Pharmacogenetic testing for patients treated with anticoagulants: Draft evidence report 42
Jonas et al., 2013
Jonas et al. (2013) randomized 109 patients in North Carolina to initial anticoagulation according
to the Washington University School of Medicine (WUSOM) algorithm with CYP2C9 and
VKORC1 genotype information compared to the WUSOM algorithm without the addition of
genotype data.22 Allowed warfarin doses ranged from 0.5 to 10 mg per day.22 Subsequent
dosing was determined for both groups based on consensus guidelines from the ACC/AHA.22
Patients with a prior history of warfarin use and a known dose requirement, those who received
more than 3 doses prior to confirming enrollment, and pregnant women were excluded.22 The
study population was 27% Black and 73% White, with indications for anticoagulation including
Afib, DVT or pulmonary embolism, and a small minority with heart valve replacement or other
indications.22 The primary outcomes were the number of anticoagulation visits required and
PTTR; patients were followed for 90 days.22 Center researchers assessed this trial as having a low
risk of bias, without any significant limitations.
Kimmel et al., 2013
Kimmel et al. (2013) conducted a U.S. multicenter RCT named COAG (Clarification of Optimal
Anticoagulation through Genetics) that randomized 1,015 patients and analyzed 955 patients
(94.1%).21 Inpatients and outpatients were initiated on warfarin; approximately 60% had DVT or
pulmonary embolism as the primary indication for anticoagulation, and 22% had atrial
fibrillation or a flutter.21 Exclusion criteria included a variety of factors that would be likely to
limit adherence (e.g., dementia, alcohol or substance misuse), previously known warfarin dose or
relevant genotype, abnormal baseline INR, and contraindication to warfarin therapy for at least 3
months.21 Patients were assigned in a 1:1 ratio, stratified by whether race was self-reported as
Black or non-Black (27% were black), to a dosing algorithm that incorporated CYP2C9 and
VKORC1 genotype information or to a clinical dosing algorithm.21 In each study arm, patients
received the algorithm-determined dose for each of the first 3 days of therapy, and a dose
determined by a dose-revision algorithm that incorporated genotypes in the intervention group
and did not for the control group for days 4 or 5, or both.21 After day 5, doses were adjusted
based on the algorithm-predicted dose adjusted for INR measurement.21 Patients and clinicians
were masked to the actual dose in the first month of therapy because the drug was
encapsulated.21 The primary study outcome was PTTR from day 4 or 5 through 28 days of
therapy, and patients were followed for 6 months after initiation of therapy.21 Center researchers
assessed this study as having a low risk of bias, although several authors had research grants,
consulting contracts, or equity interests with commercial entities.
Pengo et al., 2015
Pengo et al. (2015) conducted an RCT in Italy that randomized 200 patients with AFib and
analyzed 180 (90%).30 The authors compared the locally developed pharmacogenetic algorithm
developed by Zambon et al. (2011)70 that incorporated CYP2C9, VKORC1, and CYP4F2
genotyping to standard fixed dosing. In the intervention arm, patients received a loading dose
on the first day and maintenance doses on days 2 through 6 based on the genetic algorithm.30
Patients in the control group were initiated with 5 mg per day for 4 days.30 On days 5 and 6,

WA – Health Technology Assessment March 6, 2018
Pharmacogenetic testing for patients treated with anticoagulants: Draft evidence report 43
doses were based on a clinical prediction model using the day 5 INR result.30 From day 7, the
dose in both groups was determined by the attending clinician with the assistance of PARMA
software.30 The PARMA algorithm was derived from mathematical models based on data of
dosage recommendations from expert medical teams.71 Patients were given a daily dose of the
low molecular weight heparin enoxaparin from the day of enrollment until warfarin initiation as
genotyping was performed only once per week.30 Patients who were concurrently taking
amniodarone or CYP-450-inducing drugs such as rifampin or carbamazepine, had a baseline INR
> 1.2, or could become pregnant were excluded from the study.30 All of the study participants
identified as White and had an anticoagulation indication of AFib.30 The primary outcome
measures, evaluated in the first 19 days of the study, were the number of out-of-range INR
values (INR < 2 or INR > 3) and the PTTR.30 Center researchers assessed this study as having a
moderate risk of bias because of unclear allocation concealment and lack of masking of data
collectors.
Pirmohamed et al., 2013
Pirmohamed et al. (2013) conducted an RCT in 2 centers in Sweden and 3 centers in the UK
(mostly university/academic hospitals and their outpatient facilities) that was named EU-PACT
(European Pharmacogenetics of Anticoagulant Therapy).26 The authors randomized 455 patients
and analyzed 427 (93.8%).26 Randomization blocks were stratified by center and indication for
anticoagulation.26 Nearly all participants identified as White, and 72% had AFib or fibrillation and
27% had VTE as indications for anticoagulation.26 Exclusion criteria included presence of a
mechanical heart valve, previously known CYP2C9 or VKORC1 genotype, previous treatment
with a coumarin anticoagulant, severe cognitive impairment, pregnancy, or lactation.26 The
warfarin initiation loading dose for days 1 through 3 was determined by an algorithm that
incorporated CYP2C9 and VKORC1 genotype variants and was a slightly modified version of the
IWPC algorithm.26 In the intervention group, dosing on days 4 and 5 was determined by a dose-
revision algorithm that incorporated the INR from day 4.26 Within the control group, patients 75
years of age and younger received a daily warfarin loading dose of 10 mg for the first day and 5
mg on days 2 and 3.26 For patients older than 75 years of age, the fixed loading dose was 5 mg
per day for the first 3 days.26 Subsequent dose adjustments for both groups were based on
usual clinical practice, which was not detailed in the paper or supplementary materials.26 The
primary outcome was PTTR during the first 12 weeks of therapy.26 Center researchers assessed
this study as having a moderate risk of bias because of unclear allocation concealment and lack
of masking of data collectors.
Wang et al., 2012
Wang et al.25 (2012) conducted an RCT of a pharmacogenetic algorithm developed by Huang et
al.28 The study enrolled 106 and analyzed 101 Han Chinese patients (95.3%) who were having a
single or double mechanical heart valve replacement.25 Warfarin dosing began 3 days
postoperatively.25 Pharmacogenetically guided doses were limited to 3.5 mg per day for the first
3 days of therapy and subsequent dose adjustments were based on the measured INR.25
Patients in the control group initiated therapy with a fixed dose of 2.5 mg per day and the dose

WA – Health Technology Assessment March 6, 2018
Pharmacogenetic testing for patients treated with anticoagulants: Draft evidence report 44
was then adjusted based on the subsequent INR.25 The investigators excluded patients who were
deemed inappropriate for the study including patients with an out-of-range baseline INR (<0.8
or >1.2); women who could become pregnant; and individuals with chronic liver, kidney or
hematological disease.25 The primary outcome was the time required to reach a stable
maintenance dose, and patients were followed up for 50 days after initiation of warfarin
therapy.25 Center researchers assessed this study as having a high risk of bias because of unclear
allocation concealment, lack of masking of patients and data collectors, and lack of detail about
the funding source.
Wen et al., 2017
Wen et al. (2017) conducted an RCT comparing 2 pharmacogenetic warfarin dosing algorithms
with a fixed dose initiation protocol.29 A total of 320 Han Chinese patients over age 20 with a
mix of AFib, VTE, and other indications for anticoagulation were randomized in a 1:1:1 ratio to
the 3 groups, and 318 were analyzed (99.4%).29 The exclusion criteria included previous warfarin
treatment, vitamin K deficiency, pregnancy, and hemorrhagic tendencies or hemorrhagic
diseases.29 The IWPC algorithm and the Taiwan algorithm incorporated information about the
patient’s CYP2C9 and VKORC1 genotypes in the formulas.29 In the pharmacogenetic arms,
patients were initiated on therapy with a loading dose of 1.5 times the calculated dose.29 The
control arm received a fixed loading dose of 5 mg per day for the first 3 days of therapy.29
Subsequent dose adjustments after the fourth day were based on the measured INR.29 The
primary study outcome was PTTR during the 3 months after warfarin initiation.29 Center
researchers assessed this study as having a high risk of bias because of unclear allocation
concealment, inadequate detail about the genetic dosing protocol, lack of masking, and 1
author holding the European patent for a VKORC1 gene test.
Key Question 1: Effectiveness
Thirteen RCTs met final inclusion criteria and were published between 2007 and 2017. All
included RCTs used warfarin as the oral anticoagulant and no studies were identified that used
pharmacogenetic testing for non-vitamin K antagonist anticoagulants. Seven RCTs were
conducted in the U.S.,7,20-23,27,31 2 in China,25,28 and 1 each in Taiwan,29 Israel,24 and Italy,30 with a
multicenter trial in the UK and Sweden.26 One study included only patients who were
undergoing hip or knee arthroplasty,31 2 included only patients having heart valve
replacement,25,28 and 1 was performed in a population with atrial fibrillation or flutter30 as the
sole indication for anticoagulation. In the remaining RCTs, there were a mix of reasons for
anticoagulation, but most patients had atrial fibrillation or flutter or VTE (either DVT or
pulmonary embolism).7,20-24,26,27,29 The age of most participants was from their late 50s to early
70s, although participants in the 2 heart valve replacement trials25,28 were in their early 40s. The
trials by Huang et al., Wang et al., and Wen et al. were conducted in exclusively Asian
populations. In 8 trials7,20,23,26,27,30,31 the population was more than 90% White, and the racial
composition was more mixed in the other 2 trials.21,22 Most trials had relatively small sample
sizes; only 3 randomized more than 400 participants.21,26,31 These 3 RCTs, the GIFT31, COAG,21 and

WA – Health Technology Assessment March 6, 2018
Pharmacogenetic testing for patients treated with anticoagulants: Draft evidence report 45
EU-PACT26 trials, accounted for approximately two-thirds of all participants across the 13 trials.
Two trials were pilot or feasibility trials and enrolled fewer than 40 participants each.20,23
The pharmacogenetic intervention included analysis of 1 gene (CYP2C9) in 2 studies,23,24 2 genes
(CYP2C9 and VKORC1) in 7 trials,20-22,25-29 and 3 genes (CYP2C9, VKORC1, and CYP4F2) in 3
trials.7,30,31 Four trials7,21,22,31 employed a clinically-based algorithm to guide warfarin dosing in
the control group, and the others used a variety of fixed-dose regimens for initiation of
anticoagulation. Follow-up periods ranged from 1 to 6 months. Five trials reported outcomes
with at least 30 days of follow-up.20,22,26,28,29 Center researchers conducted dual, independent
risk-of bias-assessments using common criteria for RCTs (see Appendix B for risk-of-bias
assessment instrument details and Appendix D for ratings, by domain, for each trial). Three
trials21,22,31 were judged to be at a low risk of bias, 47,26,27,30 were at a moderate risk of bias, and
620,23-25,28,29 were at a high risk of bias.
Main Outcomes
Center researchers performed meta-analysis for prespecified primary outcomes (mortality, major
bleeding, thromboembolic event, INR > 4, and the PTTR for anticoagulation) and conducted
prespecified subgroup analyses detailed in the Methods section. The Wang et al. (2017) RCT did
not report any of the major outcomes included in the meta-analysis, but did report other
outcomes that are narratively summarized in the section on additional outcomes reported. The
meta-analysis results are presented for each major outcome, with relevant subgroups for each of
those 5 outcomes.
Percentage of Time in Therapeutic Range (PTTR)
All but 121,24-26,29,30 of the RCTs reported PTTR. Center researchers accepted any PTTR as defined
by the study for meta-analysis. Five trials defined the therapeutic range as an INR of 2 to 3. Gage
et al. (2017) also used a 2 x 2 factorial for a target INR of 1.8 or 2.5 and used therapeutic ranges
for this outcome of 1.5 to 2.1 and 2 to 3, respectively. Three trials20,22,27 used an INR range of 1.8
to 3.2, and 128 used 1.8 to 3. Burmester et al. (2011) allowed an INR range of 2 to 3.5 and
Hillman et al. (2005) did not report the range used. The PTTR was also reported at different time
intervals across studies. In general, these timeframes corresponded to the general study follow-
up periods (see Table 4 and Table 7), and ranged from 14 to 90 days. Wen et al. (2017) reported
PTTR separately for week 1 and week 2; and weeks 3 to 4, 5 to 9, and 10 to 12, but not an overall
PTTR for the entire 12 weeks. For purposes of the meta-analysis, the PTTR for weeks 5 to 9 was
included because it was the longest period of time for which the outcome was reported.
Because the INR is generally more variable at the beginning of warfarin anticoagulation
(generally within the first month of therapy), it would be reasonable to expect that trials that
measured the PTTR over a longer period of time might find a higher proportion of in-range
INRs. A subgroup analysis examining follow-up outcome reporting periods of ≤ 30 days or > 30
days was planned to evaluate the possible contribution of time-of-outcome reporting to the
overall effect.

WA – Health Technology Assessment March 6, 2018
Pharmacogenetic testing for patients treated with anticoagulants: Draft evidence report 46
In the overall analysis shown in Figure 3, the pharmacogenetically guided group had 3.1
percentage points more time in follow-up in the therapeutic range (mean difference, 3.11%; 95%
CI, -0.28 to 6.50; p = .07), although the difference was not statistically significant and the analysis
had significant heterogeneity (I2 = 78%; Chi2 = 50.86; p < .0001). The overall quality of evidence
for this outcome was rated as low.
A prespecified set of subgroup analyses were conducted to explore sources of heterogeneity. A
subgroup analysis by comparator (Figure 4) found that there was no significant difference in the
PTTR among studies using a clinical algorithm compared to a pharmacogenetically guided one
(mean difference, 0.54%; 95% CI, -2.44 to 3.52; p = .72), whereas there was a marginally
significant difference favoring the pharmacogenetically guided group compared to the fixed-
dose comparators (mean difference, 4.97%; 95% CI, -0.50 to 10.45; p = .07). Although the
difference between these subgroups was not statistically significant (Chi2 = 1.94; p = .16), it is
likely to be clinically meaningful given the 10-fold difference between the point estimates.
Additionally, there was only moderate statistical heterogeneity in the clinical algorithm group (I2
= 54%; Chi2 = 6.49; p = .09), indicating that some of the statistical heterogeneity in the overall
analysis was explained by the difference in comparators (i.e., clinical algorithm and fixed dosing).
The fixed-dosing subgroup included all trials that were rated by Center researchers as having
high risk of bias, which could account for some of the observed benefit of the pharmacogenetic
testing group.
The subgroup analysis according to the number of genes tested (Figure 5) found a small inverse
dose-response relationship. All of the estimates favored the pharmacogenetically guided
intervention, although none of the estimates were statistically significant. However, with 1, 2,
and 3 genes tested, the mean differences were 0.65%, 2.62%, and 10.3%, respectively. There was
no meaningful difference seen in the subgroup analysis by length of follow-up reporting for the
PTTR outcome (Figure 6), with the point estimates for ≤ 30 days and > 30 days not statistically
significant, but favoring the genetic intervention and similar to the main effect estimate. Studies
with larger sample size (≥ 400 participants) had similar point estimates to studies with fewer
participants, and both estimates were similar to the main effect estimate (Figure 7).
As shown in Figure 8, the subgroup analysis by indication for anticoagulation found higher PTTR
with pharmacogenetically guided dosing for patients who had orthopedic surgery in 1 trial31
(mean difference, 3.40%; 95% CI, 1.00 to 5.80; p = .005) and valve replacement in another trial28
(mean difference, 12.40; 95% CI, 5.49 to 19.31; p = .0004), although there was no significant
difference for atrial fibrillation (mean difference, -1.30%; 95% CI, -6.75 to 4.15; p = .64) or trials
with a mix of indications (mean difference, 2.49%; 95% CI, -2.19 to 7.17; p = .30,. A subgroup
analysis by race (Figure 9) found a similar effect for the White and Asian subgroups compared to
the overall analysis, but a wider CI and higher degree of statistical heterogeneity for studies with
90% or greater Asian population,28,29 indicating that race could have some contribution to the
statistical heterogeneity found in the main analysis. A subgroup analysis to evaluate whether
studies conducted inside or outside of the U.S. (Figure 10) did not find statistically significant

WA – Health Technology Assessment March 6, 2018
Pharmacogenetic testing for patients treated with anticoagulants: Draft evidence report 47
differences, but the point estimate for studies outside the U.S. was about 5 times higher than for
studies conducted in the U.S. (mean difference, 5.82%; 95% CI, -1.59 to 13.22; p = 0.12 vs. 1.12%;
95% CI, -1.02 to 3.26; p = .31). This might in part reflect heterogeneity stemming from the racial
composition of the population, but might indicate some additional effect from the grouping of
3 studies24,28,29 with high risk of bias and 226,30 with moderate risk of bias among studies
conducted outside the U.S.
As shown in Figure 11, RCTs with a high risk of bias, all of which used a fixed-dosing approach in
the control group, were more likely to favor the pharmacogenetically guided intervention (mean
difference, 6.57%; 95% CI, -2.94 to 16.07; p = .18) compared to those with a low risk of bias
(mean difference, 1.24%; 95% CI, -2.15 to 4.64; p = .47) or a moderate risk of bias (mean
difference, 1.49%; 95% CI, -3.25 to 6.23; p = .54). Although none of these subgroups were
statistically significantly different, the groups with low and moderate risk of bias appear to be
different, with estimates closer to the null (i.e., 0.00), compared to the high risk of bias group.
These differences might account for some of the heterogeneity in the main analysis in that the
lowest level of statistical heterogeneity is in the low risk of bias trials (I2 = 53%; Chi2 = 4.30; p =
.12).
Figure 3. Meta-analysis of Pharmacogenetic Testing vs. Control for PTTR

WA – Health Technology Assessment March 6, 2018
Pharmacogenetic testing for patients treated with anticoagulants: Draft evidence report 48
Figure 4. Meta-analysis of Pharmacogenetic Testing vs. Control by Comparator for PTTR
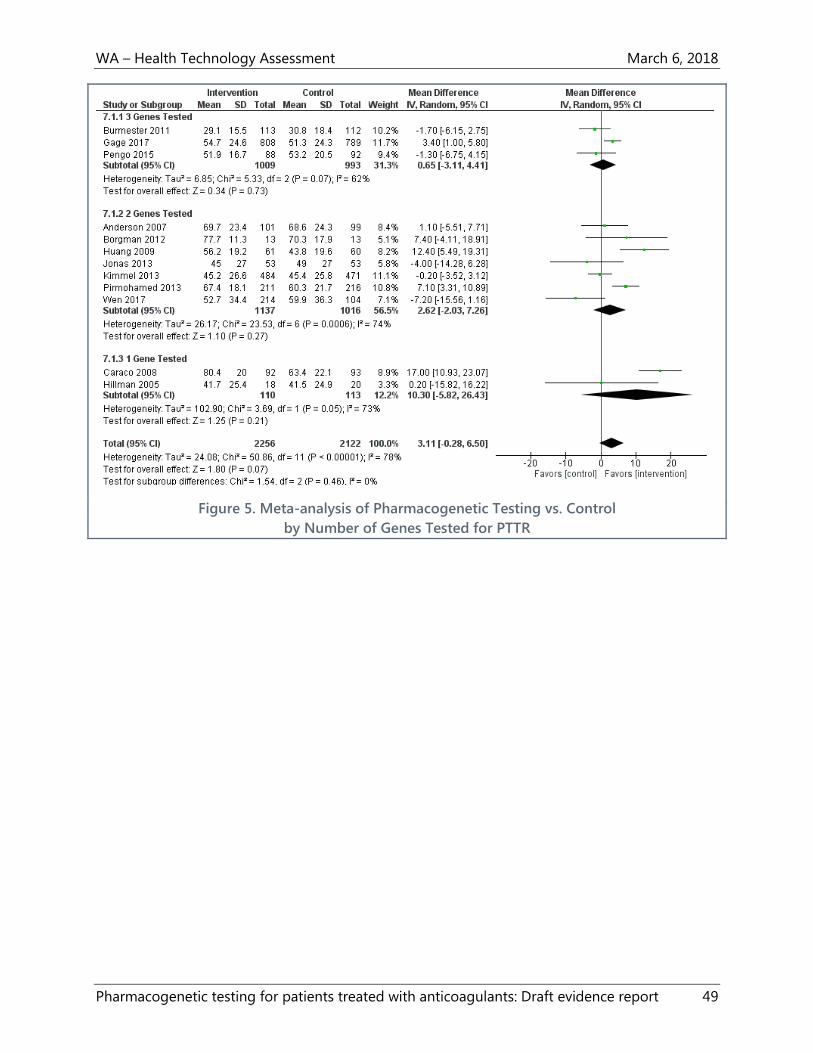
WA – Health Technology Assessment March 6, 2018
Pharmacogenetic testing for patients treated with anticoagulants: Draft evidence report 49
Figure 5. Meta-analysis of Pharmacogenetic Testing vs. Control
by Number of Genes Tested for PTTR
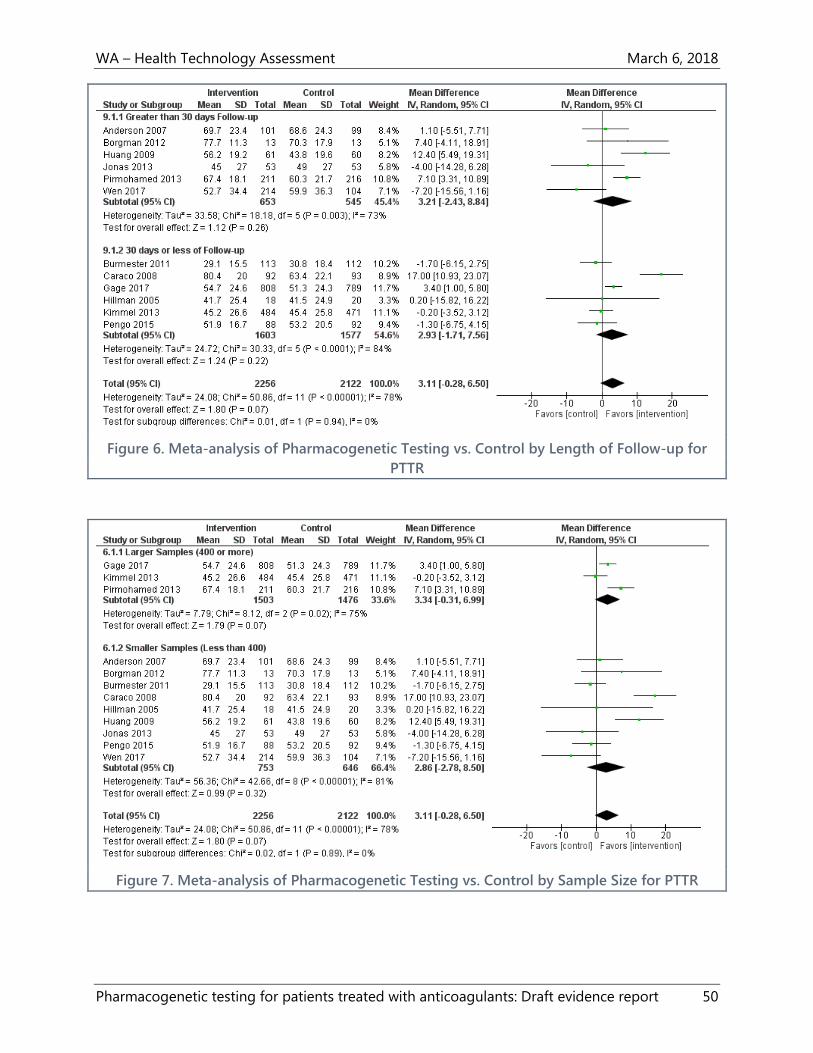
WA – Health Technology Assessment March 6, 2018
Pharmacogenetic testing for patients treated with anticoagulants: Draft evidence report 50
Figure 6. Meta-analysis of Pharmacogenetic Testing vs. Control by Length of Follow-up for
PTTR
Figure 7. Meta-analysis of Pharmacogenetic Testing vs. Control by Sample Size for PTTR

WA – Health Technology Assessment March 6, 2018
Pharmacogenetic testing for patients treated with anticoagulants: Draft evidence report 51
Figure 8. Meta-analysis of Pharmacogenetic Testing vs. Control by Indication for PTTR

WA – Health Technology Assessment March 6, 2018
Pharmacogenetic testing for patients treated with anticoagulants: Draft evidence report 52
Figure 9. Meta-analysis of Pharmacogenetic Testing vs. Control by Race for PTTR
Figure 10. Meta-analysis of Pharmacogenetic Testing vs. Control by Country for PTTR

WA – Health Technology Assessment March 6, 2018
Pharmacogenetic testing for patients treated with anticoagulants: Draft evidence report 53
Figure 11. Meta-analysis of Pharmacogenetic Testing vs. Control by Risk of Bias for PTTR
Overanticoagulation (INR ≥ 4)
Nine trials reported an INR measurement of 4 or more (INR ≥4) and 1 trial reported and INR of
3.5 or more (INR >3.5) and were included in the meta-analysis for this outcome. Trials reported
INR over different time periods. For example, 4 trials20,21,23,31 reported whether the outcome had
occurred by 1 month (ranging from 28 to 30 days), and 3 trials22,26,29 reported occurrence of the
outcome by 3 months (ranging from 84 to 90 days). Given that the trials had different lengths of
follow-up, the opportunity for individuals to experience overanticoagulation varied somewhat
among trials. When Huang et al. (2009) was grouped with the other 9 trials, there was not a
meaningful difference in the estimated effect for the main analysis or any of the subgroup
analyses. The effect sizes and the confidence intervals did not change or changed by a very
small amount (e.g., 0.01) with or without this trial. In the overall meta-analysis that included 10
trials, 340 events occurred among 2,095 participants in the pharmacogenetically guided group
(16.2%) and 354 events occurred among 1,961 participants in the control group (18.1%). As
shown in Figure 12, Center researchers observed a 9% improvement in favor of the
pharmacogenetically guided intervention, but the difference was not statistically significant (RR,
0.91; 95% CI, 0.80 to 1.04; p = .16). No statistical heterogeneity was detected in this analysis (I2 =
0%). The anticipated absolute effect (Table 3) was 18.2 fewer people per 1,000 who experienced

WA – Health Technology Assessment March 6, 2018
Pharmacogenetic testing for patients treated with anticoagulants: Draft evidence report 54
overanticoagulation with pharmacogenetic testing (95% CI, 5 more people to 41.5 fewer people
per 1,000). The overall quality of evidence for this outcome was rated as low.
Several prespecified subgroup analyses were also performed. In the subgroup analysis by
comparator (see Figure 13), the pharmacogenetically guided intervention performed more
similarly to the clinically guided group (RR, 0.95; 95% CI, 0.78 to 1.15; p = .58). The estimate for
the fixed-dose comparator group was also not statistically significant, but was lower than the
main analysis (RR, 0.83; 95% CI, 0.67 to 1.04; p = 0.11). No significant difference was found
between these 2 subgroups (p = .39). The subgroup analysis conducted by indication for
anticoagulation (see Figure 14) found a statistically significant effect in favor of the intervention
among patients who had orthopedic surgery (RR, 0.71; 95% CI, 0.51 to 0.99; p = .04). Gage et al.
(2017) was the only study to contribute to this outcome. No statistically significant differences
were found for atrial fibrillation, valve replacement, and other indications.
In another subgroup analysis, Center researchers combined trials that occurred in the U.S. and
trials that occurred outside the U.S. (see Figure 15). No meaningful difference in INR was found
in the U.S. trials, but there was a marginally statistically significant reduction of 21% in the
pharmacogenetically guided group compared to controls in other countries (RR, 0.79; 95% CI,
0.62 to 1.00; p = .05). However, the Chi2 test for differences in subgroups was not statistically
significant (p = .17). The forest plots for additional analyses are in Appendix E. None of these
other subgroup analyses yielded findings that helped to explain the main effect: number of
genes tested (Figure 23), race (Figure 24), sample size (Figure 25), length of follow-up (Figure
26), or risk of bias (Figure 27).
Figure 12. Meta-analysis of Pharmacogenetic Testing vs. Control for INR ≥4
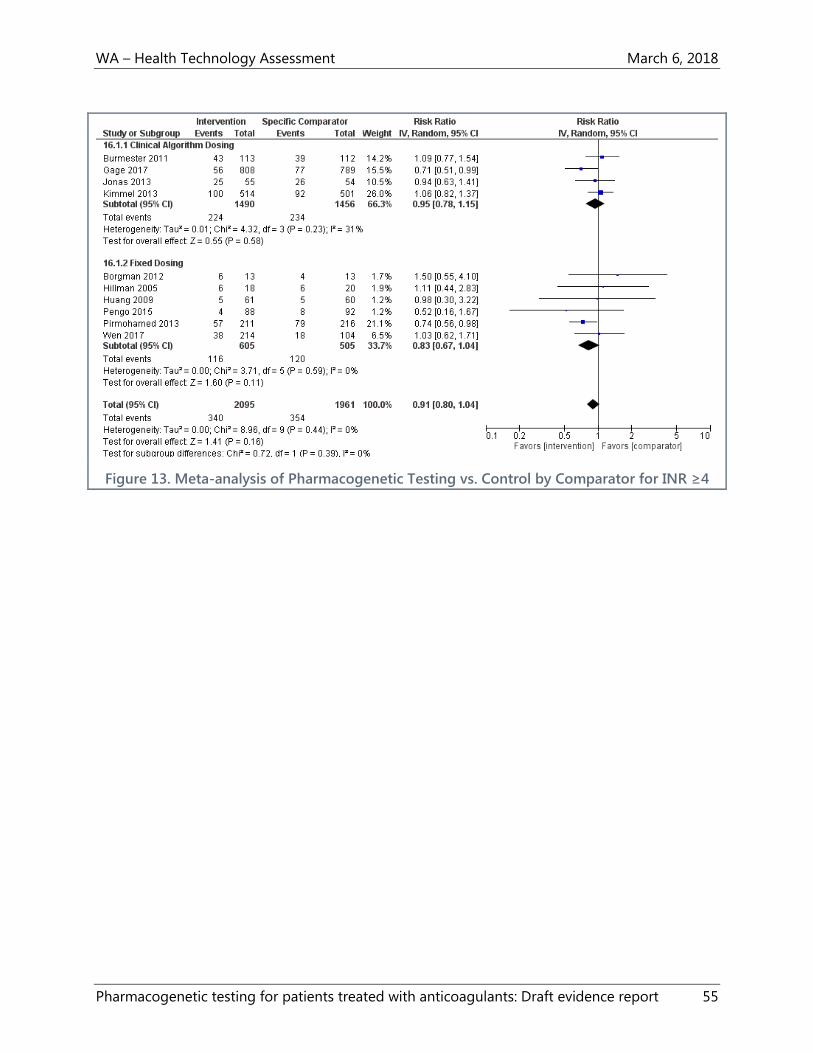
WA – Health Technology Assessment March 6, 2018
Pharmacogenetic testing for patients treated with anticoagulants: Draft evidence report 55
Figure 13. Meta-analysis of Pharmacogenetic Testing vs. Control by Comparator for INR ≥4

WA – Health Technology Assessment March 6, 2018
Pharmacogenetic testing for patients treated with anticoagulants: Draft evidence report 56
Figure 14. Meta-analysis of Pharmacogenetic Testing vs. Control by Indication for INR ≥4

WA – Health Technology Assessment March 6, 2018
Pharmacogenetic testing for patients treated with anticoagulants: Draft evidence report 57
Figure 15. Meta-analysis of Pharmacogenetic Testing vs. Control by Country for INR ≥4
Thromboembolic Events
A total of 11 trials7,20-24,26,28-31 reported thromboembolic events (generally DVT or pulmonary
embolism), although 5 of these trials20,24,28-30 reported no events in either the intervention or
control group. The analysis was heavily weighted by the Gage et al. (2017) RCT with 81.3% of the
total weight in the meta-analysis. Gage et al. (2017) conducted a bilateral lower extremity duplex
ultrasound study on all asymptomatic patients at 1-month post-surgery. The RCT included 33
total VTE events among 808 patients (4.1%) in the pharmacogenetically guided group and 38
events among 789 patients (4.8%) in the clinically guided group between days 1 and 60 after
surgery (RR, 0.85; 95% CI, 0.54 to 1.34). However, most of the VTE events were ascertained
among asymptomatic patients by duplex ultrasound at 1-month post-surgery, with 10 (1.2%)
symptomatic DVT or pulmonary embolism events in the intervention group and 15 (1.9%) in the
control group. Thus, 23 VTE events of 33 among intervention group participants, and 13 of 38
among control participants were asymptomatic DVTs found by ultrasound. All other trials
reported only symptomatic VTE events. Using a different type of outcome ascertainment, Gage
et al. (2017) reported a relatively high proportion of events, and because of the large size of the
study, the overall meta-analytic result (RR, 0.85; 95% CI, 0.56 to 1.28; p = .44) for
thromboembolic events is heavily influenced by the Gage et al. (2017) trial (see Figure 16). No
statistical heterogeneity was detected in the analysis (I2 = 0%).
A subgroup analysis by comparator was also performed, as shown in Figure 17. Neither the trials
with clinical algorithm control groups (RR, 0.89; 95% CI, 0.58 to 1.35) nor the trials with fixed-

WA – Health Technology Assessment March 6, 2018
Pharmacogenetic testing for patients treated with anticoagulants: Draft evidence report 58
dose control groups (RR, 0.27; 95% CI, 0.03 to 2.38) showed a statistically significant difference
between groups. The anticipated absolute effect (Table 3) was 5.1 fewer thromboembolic events
per 1,000 people with pharmacogenetic testing (95% CI, 3.6 more to 13.8 fewer per 1,000
people). The overall quality of evidence for this outcome was rated as moderate.
Figure 16. Meta-analysis of Pharmacogenetic Testing vs. Control for Thromboembolic Events

WA – Health Technology Assessment March 6, 2018
Pharmacogenetic testing for patients treated with anticoagulants: Draft evidence report 59
Figure 17. Meta-analysis of Pharmacogenetic Testing vs. Control
by Comparator for Thromboembolic Events
Major Bleeding
Eleven RCTs included major bleeding as an outcome.7,20-24,26,28-31 For purposes of the meta-
analysis, Center researchers used the RCT authors’ definition of major bleeding, which generally
included bleeding that necessitated hospitalization or required interventions. Burmester et al.
(2011) reported major bleeding in several ways, and Center researchers selected their primary
method of bleeding events reporting adjudicated by the trial’s Data Safety Monitoring Board.7
Trials typically included intracranial and gastrointestinal bleeding or bleeding resulting in a
transfusion, surgery, or hospitalization in the definition of major bleeding. Four trials did not
report major bleeding in either group.20,26,28,30 The total number of events was small: 12 events
among 2,187 participants in the intervention group (0.55%) and 29 events among 2,054 in the
control group (1.4%). As shown in Figure 18, Participants enrolled in the intervention group were
57% less likely to experience major bleeding than those in the control group (RR, 0.43; 95% CI,
0.22 to 0.84; p = .01). No statistical heterogeneity was identified in the analysis (I2 = 0% and Chi2
= 3.64; p = .72). The anticipated absolute effect (Table 3) was 8.6 fewer major bleeding events
per 1,000 people with pharmacogenetic testing (95% CI, 2.7 to 14.4 fewer major bleeding
episodes per 1,000 people). The overall quality of evidence for this outcome was rated as
moderate.
As shown in Figure 19, a subgroup analysis by comparator was conducted. Major bleeding
remained lower in the pharmacologically guided dosing group compared to the clinical
algorithm group, with a 61% reduced risk of major bleeding (RR, 0.39; 95% CI, 0.19 to 0.81;

WA – Health Technology Assessment March 6, 2018
Pharmacogenetic testing for patients treated with anticoagulants: Draft evidence report 60
p = .01). The risk of major bleeding was also 30% lower in the pharmacologically guided dosing
group compared to the fixed-dosing group (RR, 0.70; 95% CI, 0.14 to 3.53; p = .38), but the
difference was not statistically significant. The test for differences between subgroups was also
not statistically significant (p = .52). Overall, the subgroup analysis indicates that the major
bleeding benefit of pharmacogenetically guided warfarin dosing seen in the main analysis
cannot be explained by whether the control group was dosed according to a clinical algorithm
or with a fixed-dose approach. However, the caveat remains that very few events were reported
overall, and that even when statistically significant, the confidence intervals were relatively wide.
Figure 18. Meta-analysis of Pharmacogenetic Testing vs. Control for Major Bleeding

WA – Health Technology Assessment March 6, 2018
Pharmacogenetic testing for patients treated with anticoagulants: Draft evidence report 61
Figure 19. Meta-analysis of Pharmacogenetic Testing vs. Control
by Comparator for Major Bleeding
Mortality
Seven trials7,20-22,28,31 reported mortality as an outcome and 320,28,31 of these reported no deaths
in either arm of the trials. Deaths reported were either classed as all-cause or specifically not
related to the study in most of these trials, but the nature of the deaths was not specified in the
trials by Jonas et al. (2013).22 and Kimmel et al. (2013).21 In total, there were 9 deaths reported
among 1,786 (0.50%) participants in the intervention groups and 8 among 1,754 (0.46%) in the
control groups, for a risk ratio of 1.17 (95% CI, 0.43 to 3.22) in favor of the control group (see
Figure 20). However, the risk ratio was not statistically significant and the confidence interval is
wide. Center researchers did not detect any statistical heterogeneity in the analysis (I2 = 0% and
Chi2 = 2.79; p = .43). One subgroup analysis was performed, examining the possible effect of the
control group using a clinical dosing algorithm or fixed-dose warfarin initiation (see Figure 21).
Neither subgroup had a statistically significant estimate, and confidence intervals were wide and
overlapping. Nevertheless, compared to pharmacogenetically guided therapy, the risk ratio for
clinical algorithm-based trials had an estimate that was slightly in favor of the intervention (RR,
0.72; 95% CI, 0.20 to 2.62), and for trials using a fixed-dose, the risk ratio was slightly in favor of
the control (RR, 2.53; 95% CI, 0.50 to 12.92). Despite these observed differences, the Chi2 test for
subgroups was not statistically significantly different (p = .24). It should be noted that given the
low number of deaths reported, the meta-analysis is fairly unstable and any additional mortality
events occurring in either group could modify the estimate of effect. Furthermore, follow-up was
never more than 6 months, and so there is no information regarding the longer-term overall
mortality risk from these interventions. The anticipated absolute effect (Table 3) was 0.48 more
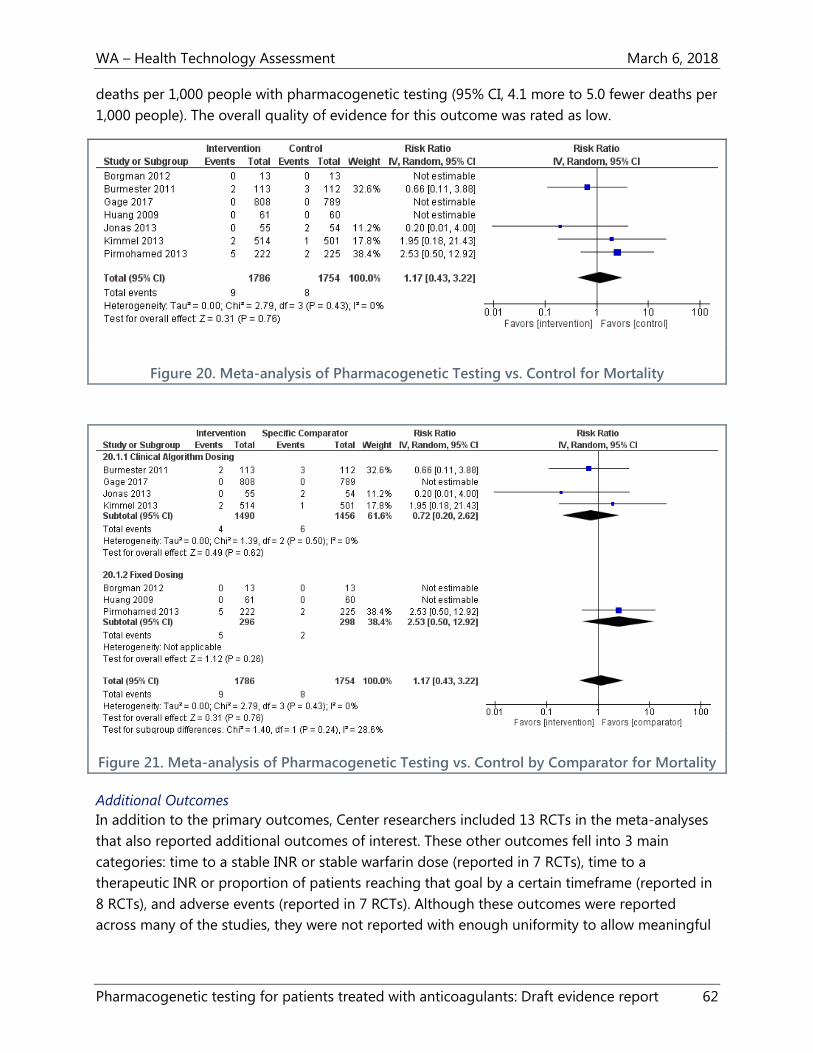
WA – Health Technology Assessment March 6, 2018
Pharmacogenetic testing for patients treated with anticoagulants: Draft evidence report 62
deaths per 1,000 people with pharmacogenetic testing (95% CI, 4.1 more to 5.0 fewer deaths per
1,000 people). The overall quality of evidence for this outcome was rated as low.
Figure 20. Meta-analysis of Pharmacogenetic Testing vs. Control for Mortality
Figure 21. Meta-analysis of Pharmacogenetic Testing vs. Control by Comparator for Mortality
Additional Outcomes
In addition to the primary outcomes, Center researchers included 13 RCTs in the meta-analyses
that also reported additional outcomes of interest. These other outcomes fell into 3 main
categories: time to a stable INR or stable warfarin dose (reported in 7 RCTs), time to a
therapeutic INR or proportion of patients reaching that goal by a certain timeframe (reported in
8 RCTs), and adverse events (reported in 7 RCTs). Although these outcomes were reported
across many of the studies, they were not reported with enough uniformity to allow meaningful

WA – Health Technology Assessment March 6, 2018
Pharmacogenetic testing for patients treated with anticoagulants: Draft evidence report 63
meta-analyses. Table 8 contains detailed information about the results of each study for these
additional outcomes.
Time to stable INR or stable warfarin dose
Seven studies reported some measure of time to a stable INR or stable warfarin dose.20,24-26,28-30
Studies reported time in days, although studies reported either mean 25,30 or median26,28,29 days
and 2 studies20,24 did not specify which measure was used. The definition of “stable” also varied
among studies and included having an INR of 1.8 to 3.2 for a minimum of 4 consecutive days;20
the first of 3 INRs within a therapeutic range;30 the first of 2 INR values within the therapeutic
range, with INRs measured at least a week apart;26,29 and the dose that led to an INR in the
therapeutic range INR in at least 7 days.25 Other studies did not specify the definition of stability.
The number of days to reach these measures varied widely. For example, Pengo et al. (2015)
reported that the pharmacogenetic group achieved a stable INR in a mean of 5.9 days (95% CI,
5.00 to 9.93) compared to 5.05 days (95% CI, 4.24 to 5.86; p = .28) in the fixed-dose comparator
group.30 Pirmohamed et al. (2013) reported that the median days to a stable warfarin dose was
44 in the pharmacogenetic group versus 59 in the fixed dose comparator group (HR, 1.40; 95%
CI, 1.12 to 1.74; p = .003).26 In summary, the pharmacogenetically guided groups generally had
shorter times to attaining a stable INR, but no differences were statistically significant and
comparison is limited due to different interventions, comparators, outcome measures and
timeframe of measurement.
Time to a therapeutic INR
Similar to the outcome of time to a stable INR or stable warfarin dose, studies reported a variety
of measures for the time to a therapeutic dose of warfarin. Although these 3 categories of
outcomes are similar and obviously related, they differ in that the time to a therapeutic INR can
be defined based on one measure only and the time to stability is usually longer. Two studies20,27
defined the time to a therapeutic INR as the proportion of patients with a therapeutic INR on
day 5, and also reported that proportion on day 8. Anderson et al. (2007) reported that 69.7% in
the pharmacogenetic group had a therapeutic INR on day 5 and 68.8% did on day 8, compared
to 68.3% at day 5 and 63.0% at day 8 in the fixed dose comparison group.27 At neither time
period was the difference statistically significant. The substantially smaller pilot study by
Borgman et al. (2012) that also used a fixed-dose comparator reported day 5 proportions of
69.2% versus 38.5% (p = .12) and day 8 proportions of 100% vs. 61.5% (p = .01). Jonas et al.
(2013) reported the proportions with a therapeutic INR by day 30 (11% vs. 15%) and by day 90
(21% vs. 26%), for the pharmacogenetic and clinical algorithm groups, respectively.22 At neither
time period were the differences between the pharmacogenetic and clinical algorithm groups
statistically significant.22 Kimmel et al. (2013) reported that there were similar proportions of
patients achieving a therapeutic INR by day 14 of 81% for the pharmacogenetic group versus
85% for the clinical algorithm group (HR, 0.94; 95% CI, 0.82 to 1.1).21 Pengo et al. (2015) also did
not find a statistical difference in the proportions by day 19: 68.2% in the pharmacogenetic
group versus 65.2% in the fixed-dose comparison group (p = .67).30 Three studies reported the
number of days to a therapeutic INR. These ranged from less than a week in the study by Caraco

WA – Health Technology Assessment March 6, 2018
Pharmacogenetic testing for patients treated with anticoagulants: Draft evidence report 64
et al. (2008)24 (4.8 ± 1.46 days in the pharmacogenetic group vs. 7.5 ± 3.06 days in the clinical
algorithm group; p < .001) to over 3 weeks in the study by Pirmohamed et al. (2013) (21 days vs.
29 days; HR, 1.43; 95% CI, 1.17 to 1.76). In summary, the results for the outcome of time to a
therapeutic INR were more mixed than the time to a stable INR; studies found no difference or
some benefit to the pharmacogenetic dosing interventions. However, comparison was also
limited by differences in interventions, comparators, outcomes measures, and timeframes of
measurement.
Adverse events
The outcomes of major bleeding and thromboembolic events were explored in the meta-
analysis. Several studies reported additional or more detailed adverse events. Six21,25-28,31 of the 7
studies that reported additional adverse events reported composites that included events such
as major bleeding, VTE, and mortality that were analyzed independently in the meta-analysis. All
adverse events reported across studies were secondary outcomes, and the trials were likely
underpowered to detect meaningful differences, so interpretation of any finding should be
cautious. As with the definitions of other additional outcomes, the definitions of serious adverse
events varied across studies.
In addition to the composite measures they reported, Gage et al. (2017) reported cardiovascular
events of 3 types: myocardial infarction, stroke, and atrial fibrillation. There were a small number
of events overall and no statistical differences between the pharmacogenetically and clinically-
guided dosing groups. There were also no statistically significant differences between groups in
either the incidence or location of infections. Subgroup analyses for the PTTR outcome by Gage
et al. (2017) did find statistically significant differences based on the INR target (1.8 vs 2.5), a 1
mg or greater difference in the predicted warfarin dose based on the 2 algorithms and race. The
PTTR was statistically different for the INR target of 2.5, but not for 1.8 (mean PTTR difference,
5.8; 95% CI, 2.5 to 9.1; p = .001), but was not for the INR target of 1.8 (mean PTTR difference 1.1,
95% CI, -2.2 to 4.5). If the 2 algorithms predicted a 1 mg or greater difference in warfarin dose,
there was a difference in PTTR between the groups (mean PTTR difference, 7.0; 95% CI, 3.4 to
10.6; p < .001), but there was no difference for a discrepancy of < 1 mg (mean PTTR difference,
0.9; 95% CI, -2.2 to 4.0; p = .57). There was no difference in the 2 dosing algorithms for Black
patients (mean PTTR difference, 0.2; 95% CI, -8.9 to 9.4; p = .96), but a difference was apparent
for non-Black patients (mean PTTR difference, 3.7; 95% CI, 1.2 to 6.1; p = .003).
Key Question 2: Harms
Harms outcomes are reflected in several items described under Key Question 1. Mortality, major
bleeding, and VTE all represent adverse outcomes, although they occur with both
pharmacogenetically guided warfarin dosing and all comparators, including both clinically
guided and fixed-dose warfarin initiation. Other adverse events reported are also described in
the additional outcomes subsection under Key Question 1. Major bleeding, VTE events,
overanticoagulation, and PTTR all had point estimates indicating benefit for pharmacogenetic
dosing. However, none of these differences was statistically significant, with the exception of

WA – Health Technology Assessment March 6, 2018
Pharmacogenetic testing for patients treated with anticoagulants: Draft evidence report 65
major bleeding. There was a 57% lower risk of bleeding in the pharmacogenetically guided
groups overall, although the total number of events is small (29 of 2,054 in the control groups
vs. 12 of 2,187 in the pharmacogenetic groups) and not reflected in. The quality of evidence for
this outcome was moderate, indicating that although there is moderate confidence in the
outcome, future research might change this conclusion. The variation in definitions of major
bleeding across studies and relative paucity of events overall could make this more likely.
Key Question 3: Subpopulations
Two subgroup analyses, by clinical indication and by race, for the PTTR and overanticoagulation
outcomes are relevant to this question. These subgroup analyses were not performed for the
other 3 outcomes because of more limited numbers of studies and outcome events. There were
no statistically significant subgroup differences by race (White vs. Asian vs. mixed study
populations) for either PTTR or overanticoagulation. However, for both outcomes the point
estimates favored the pharmacogenetic intervention for subjects who were White (PTTR: mean
difference 2.3%, 95% CI, -0.46 to 5.23, I2 = 51%, and INR ≥ 4; RR 0.84, 95% CI, 0.68 to 1.04, I2 =
21%). The subgroup analyses of PTTR according to the indication for anticoagulation (atrial
fibrillation, orthopedic surgery for hip or knee replacement, heart valve replacement, and mixed
other indications) demonstrated a benefit for the pharmacogenetic intervention for both
orthopedic surgery (mean difference, 3.4%; 95% CI, 1.00 to 5.80) and valve replacement (mean
difference, 12.40; 95% CI, 5.49 to 19.31). However, for the orthopedic surgery subgroup, the 95%
CI touched 1.0, and was very similar to the overall point estimate from the main analysis. The
point estimate for the valve replacement subgroup was about 3 times higher than the main
effect estimate, which might indicate a true effect in that clinical setting, but could also be due
in part to some differences from the comparator employed, country of study, age and race of
subjects, and length of follow up. Both estimates were based on only 1 study each, Gage et al.
(2017) for orthopedic surgery and Huang et al. (2009) for valve replacement. Although the study
by Gage et al. (2017) was rated as having a low risk of bias and was adequately powered, the
study by Huang et al. (2009) was small and rated as having a high risk of bias. In the subgroup
analyses of overanticoagulation, a difference in favor of the pharmacological intervention was
noted for the orthopedic surgery subgroup, but for no other subgroups (RR 0.71, 95% CI, 0.51 to
0.99). Again, only Gage et al. (2017) contributed data to this subgroup. Because of reporting of
race by the various RCTs, a subgroup meta-analyses of any outcome for Black patients could not
be performed. However, Gage et al. (2017) did report the PTTR for Black patients compared to
all other races enrolled in the RCT. They found a statistically significant effect only for the group
of patients of other races (91% of the study subjects were White and 6.4% were Black). For other
race participants, the mean difference for PTTR was 3.7%, 95% CI 1.2 to 6/1, p = .003), and for
Black participants there was no difference from the pharmacological intervention (mean
difference 0.2%, 95% CI, -8.9 to 9.4, p = .96). This finding might reflect the lack of penetration of
CYP2C9 alleles *2 and *3 among African-American populations. The study by Kimmel et al.
(2013), conducted among patients largely with indications of atrial fibrillation and VTE, reported
that clinically guided dosing resulted in improved PTTR among Black patients compared to the
pharmacogenetic intervention.

WA – Health Technology Assessment March 6, 2018
Pharmacogenetic testing for patients treated with anticoagulants: Draft evidence report 66
Key Question 4: Cost and Cost-Effectiveness
Five economic modeling studies, published between 2009 and 2017, were identified by the
search.32-36 Two studies34,36 were rated by Center researchers as having a high risk of bias, and
332,33,35 a moderate risk of bias. All 5 studies assumed a hypothetical population of patients
initiating warfarin therapy for atrial fibrillation.32-36 The mean ages of these populations ranged
from 65 to 72.5, and 1 study limited the population to males. Three studies33,34,36 assumed a U.S.
perspective (either societal or third-party payer), 132 assumed a UK health service perspective,
and 135 was conducted with estimates for the UK and Swedish health system perspectives. All 5
studies reported costs per quality-adjusted life year (QALY), and some studies reported other
economic outcomes as well. The full details about these 5 studies are presented in Table 9. The
cost/QALY estimate and the key assumptions for each study are presented below in Table 2.
Cost/QALY ranged from $60,725 to $171,800 in 2007 U.S. dollars. There were no more recent
estimates applicable to the U.S. setting. Cost/QALY pertaining to the UK NHS ranged from
£6,702 (2014 £) to £13,266 (2011 £). Given dates of publication, no economic study could make
use of more recently published RCTs, and most studies derived clinical outcome base-case
assumptions from 1 to 3 RCTs, as listed in Table 2. When the modeling study stated specific
assumptions about incorporating PTTR, it was generally higher and more in favor of
pharmacogenetically guiding dosing than in the meta-analysis in this report, which found a
mean difference of 3.11% (95% CI, -0.28 to 6.50).
In sensitivity analyses, these economic modeling studies also explored the ranges of various
model parameters, including time in or out of therapeutic range and clinical outcomes such as
the risk of stroke or bleeding. Eckman et al. (2009) concluded that pharmacogenetically guided
dosing was only cost-effective at a conventional threshold of $50,000/QALY if it was restricted to
patients at high risk for hemorrhage, prevented more than a third of major bleeding events, and
cost less than $200.34 Meckley et al. (2010) estimated that the pharmacogenetic approach would
result in a cost/QALY of less than $50,000 in only 46% of simulations.36 Only when the
pharmacogenetic algorithm resulted in a mean PTTR difference compared to standard care of
9% or greater was the intervention judged by Patrick et al. (2009) to be cost-effective at the
$50,000 threshold.33 Assuming based on meta-analysis in this report that pharmacogenetically
guided dosing resulted in a 3.11% increase in time, the cost/QALY found by Meckley et al.
(2010) would be approximately $190,000.36 In sensitivity analysis, Pink et al. (2013) estimated
that the cost/QALY decreased to £10,946.32 Verhoef et al. (2016) reported that model results
were sensitive to estimates of PTTR, stroke risk, and cost of the test.35 In multiple Monte Carlo
simulations, Verhoef et al. (2016) reported that the cost/QALY was below a £20,000 threshold
93% of the time and below a SEK500,000 threshold 67% of the time.35

WA – Health Technology Assessment March 6, 2018
Pharmacogenetic testing for patients treated with anticoagulants: Draft evidence report 67
Table 2. Cost-Effectiveness Estimates of Cost/QALY for Pharmacogenetic Warfarin Dosing
Citation
Study Risk of Bias
Cost/QALY Key Assumptions
Eckman et al.
200934
High
$171,800
2007 U.S. dollars, societal perspective, lifetime horizon,
3%/year discount rate, 69-year-old men with AFib, test cost
$400, PTTR assumption not stated, but assumed percentage
time below therapeutic range 7.5% in standard fixed-dose
arm and 4.8% in pharmacogenetic arm using Hillman et al.
2005,23 Anderson et al. 2007,27 and Caraco et al. 200824 RCTs
to populate effectiveness and outcomes base-case
assumptions
Meckley et al.
201036
High
$60,725 2007 U.S. dollars, U.S. third-party payer perspective, lifetime
horizon, 3%/year discount rate, 69-year-old men with AFib,
test cost $175, assumed time below/in/over therapeutic
range based on Anderson et al. 200727 study (PTTR mean
difference 1.10%, but reanalyzed by Meckley et al. 2010
authors by genotype and modeled to include time above
and below therapeutic range as well) and used assumptions
from Caraco et al. 200824 (PTTR mean difference 17%) in
sensitivity analysis
Patrick et al. 200933
Moderate
>$100,000 2007 U.S. dollars, societal perspective, lifetime horizon,
3%/year discount rate, 70-year-olds with AFib, test cost
$475, model varied cost/QALY based on how testing
changed the percentage time spent in therapeutic range
from 0% to 30%, base case PTTR based on Anderson et al.
200727 and Caraco et al. 2008,24 cost/QALY listed is for
increase of PTTR of <5%, although was modeled for 9% as
well with cost/QALY of <$50,000
Pink et al. 201332
Moderate
£13,266 2011 GBP (£), UK NHS perspective, lifetime horizon,
3.5%/year discount rate, population with average profile of
people in the UK with AFib (mean age 72.5 years), test cost,
simulation assumed that PTTR would increase with
pharmacogenetic testing by about 11-12% in months 1 and
2, with assumptions based on results of Anderson et al.
201272 (excluded from this review because was a comparison
of two pharmacogenetic algorithms and did not include a
non-pharmacogenetic comparator)
Verhoef et al.
201635
Moderate
£6,702
SEK 253,848
2014 GBP (£) and Swedish krona (SEK), lifetime horizon,
3.5%/year discount rate for UK, 3%/year for Sweden, mean
age 70.9 years for UK and 72.5 for Sweden, test cost £35.03
for UK and SEK440, used clinical assumptions from the EU-
PACT study,26 which set base-case PTTR at 7%

WA – Health Technology Assessment March 6, 2018
Pharmacogenetic testing for patients treated with anticoagulants: Draft evidence report 68
Summary
Thirteen RCTs and 5 economic modeling studies contributed data to this summary of the clinical
and economic impact of pharmacogenetic testing compared to other dosing strategies for the
initiation of warfarin anticoagulation. Table 3 presents a summary of the quantity of data, quality
of evidence, and relative and anticipated absolute effects of pharmacogenetic dosing initiation
of warfarin compared to alternative dosing methods.
Nearly all studies had some limitations, and the overall quality of evidence rating was low for 3
clinical outcomes (i.e., PTTR, mortality, and INR ≥4) and moderate for 2 others (i.e., major
bleeding and thromboembolic events). The 2 outcomes (PTTR and overanticoagulation) that
were reported most robustly across studies are intermediate outcomes. There was a small, not
statistically significant difference in favor of pharmacogenetic testing for the outcome of
thromboembolic events. Conversely, there was a small, not statistically significant, difference in
favor of other dosing initiation strategies for overall mortality. The only clinical outcome with a
statistically significant difference was for the outcome of major bleeding. The anticipated effect
of pharmacogenetically guided warfarin initiation is 8.6 fewer episodes of major bleeding per
1,000 people.
It is possible that there is more value for pharmacogenetic testing among certain subgroups,
including patients undergoing scheduled hip or knee replacement or heart valve replacement.
Particular racial subgroups might derive more or less benefit from testing based on the
prevalence of particular genetic variants in that racial subgroup.
These conclusions should be evaluated in light of several limitations. The outcome with the most
data was PTTR. Although there was a statically significant difference of 3.11% in the mean
difference of time in the therapeutic INR range favoring pharmacogenetic testing, this finding
was statistically heterogeneous. The finding is also of questionable clinical significance, and
nearly all of the observed benefit could be explained when studies were analyzed by the type of
comparator used. When a clinical algorithm was used, there was essentially no difference
compared to use of a pharmacogenetic algorithm. A similar trend was seen with the outcome of
overanticoagulation, although the effect was not as pronounced. Other limitations are the
differences in outcome definitions across studies and the follow-up period for each outcome, in
addition to the variety of clinical indications and population and health system characteristics
under which studies were conducted.
Cost-effectiveness analyses were limited by their methods, and Center researchers rated the
overall quality of evidence as very low. The 3 modeling studies that were U.S. based are 8 to 9
years old, and therefore could not have incorporated the growing body of literature about
pharmacogenetic testing for warfarin therapy initiation. None of these older U.S. studies found
pharmacogenetic testing to be cost-effective at widely accepted thresholds. Newer European
studies had more favorable estimates of cost-effectiveness, but these models were still using
clinical effectiveness estimates based on single studies and were conducted with very different
health systems.

WA – Health Technology Assessment March 6, 2018
Pharmacogenetic testing for patients treated with anticoagulants: Draft evidence report 69
Table 3. GRADE Summary of Evidence
Outcome Number of
Participants
(Studies)
Quality of
Evidence
Estimated
Effect Size
(95% CI)
Anticipated Absolute Effects
Risk with and
without
Pharmacogenetic
Testing and 95%
CI (per 1,000
people)
Risk Difference
and 95% CI (per
1,000 people)
Clinical utility—
Mortality
n = 3,540
k = 7
Low
●●◌◌
RR 1.17, (95%
CI, 0.43 to
3.22)
5.0 (2.5 to 9.7)
4.6 (2.1 to 9.1)
0.48 (-4.1 to 5.0)
fewer deaths
without
pharmacogenetic
testing
Clinical utility—
Major Bleeding
n = 4,241
k = 11
Moderate
●●●◌
RR 0.43, (95%
CI, 0.22 to
0.84)
5.5 (3.0 to 9.7)
14.1
8.6 (2.7 to 14.6)
fewer episodes of
major bleeding
with
pharmacogenetic
testing
Clinical utility—
Thromboembolic
Events
n = 4,241
k = 11
Moderate
●●●◌
RR 0.85, (95%
CI, 0.56 to
1.28)
18.7 (13.8 to 25.4)
23.9 (18.0 to 31.5)
5.1 (-3.6 to 13.8)
fewer
thromboembolic
events with
pharmacogenetic
testing
Clinical utility—
INR > 4
n = 3,056
k = 10
Low
●●◌◌
RR 0.90, (95%
CI, 0.79 to
1.03)
162.3 (147.1 to
178.7)
180.5 (164.1 to
198.2)
18.2 (-5.0 to 41.5)
people per 1,000
had lower risk of
over-
anticoagulation
with
pharmacogenetic
testing
Clinical utility—
Time in
Therapeutic
Range
n = 4,378
k = 12
Subgroups
Clinical
dosing
algorithm
comparator
n = 2,883
Low
●●◌◌
Mean
difference,
3.11 (95% CI,
-0.28 to 6.50)
Subgroups
Clinical
dosing
Not applicable Not applicable

WA – Health Technology Assessment March 6, 2018
Pharmacogenetic testing for patients treated with anticoagulants: Draft evidence report 70
Outcome Number of
Participants
(Studies)
Quality of
Evidence
Estimated
Effect Size
(95% CI)
Anticipated Absolute Effects
Risk with and
without
Pharmacogenetic
Testing and 95%
CI (per 1,000
people)
Risk Difference
and 95% CI (per
1,000 people)
k = 4
Fixed-dose
comparator
n = 1,495
k = 8
algorithm
comparator
RR 0.54 (95%
CI, -2.44 to
3.52)
Fixed-dose
comparator
RR 4.97 (95%
CI, -0.50 to
6.50)

WA – Health Technology Assessment March 6, 2018
Pharmacogenetic testing for patients treated with anticoagulants: Draft evidence report 71
Clinical Practice Guidelines
Center researchers identified 8 clinical practice guidelines that have been published since 2012.
The American Society of Hematology anticipates publishing guidelines on the optimal
management of anticoagulation therapy in 2018.73 Three of the identified guidelines include
recommendations against the use of pharmacogenetic testing for anticoagulant therapy. The
American College of Chest Physicians 2012 guideline Evidence-Based Management of
Anticoagulant Therapy includes a strong recommendation against the routine use of
pharmacogenetic testing for guiding doses of vitamin K antagonist therapy, such as warfarin.40
The 2013 guidelines on antithrombotics indications and management from the Scottish
Intercollegiate Guidelines Network (SIGN) include a Grade A recommendation against
pharmacogenetic testing before the initiation of therapy with a vitamin K antagonist, such as
warfarin.41 The Australasian Society of Thrombosis and Haemostasis’s 2013 update to the
guidelines for warfarin reversal conclude that pharmacogenetic testing to guide warfarin dosing
is not necessary.42 This is a strong recommendation, with moderate-quality evidence.42 Center
researchers assessed the SIGN guidelines and the guidelines from the American College of
Chest Physicians as having good methodological quality, and The Australasian Society of
Thrombosis and Haemostasis as having poor methodological quality.
Two guidelines include recommendations for the use of pharmacogenetic testing for warfarin
dosing. The Clinical Pharmacogenetics Implementation Consortium (CPIC) 2017 update to the
guidelines on pharmacogenetics-guided warfarin dosing recommend that warfarin maintenance
dosage for adults be based on genetic information.8 These guidelines recommend that
pharmacogenetically guided dosing use a validated published algorithm (e.g., algorithms by
IWPC,43 Gage et al.,44 EU-PACT,26 and Lenzini et al.45). The recommendations for pediatric
patients state that there is strong evidence for the use of CYP2C9*2 and *3 and VKORC1-
1639G>A genotype testing to guide warfarin dosing in children of European ancestry using a
validated published pediatric pharmacogenetic algorithm (e.g., algorithms by Hamberg et al.74
and Biss et al.75). The guidelines conclude that studies in Japanese pediatric individuals are
conflicting, and for other ethnicities, there is no evidence documenting that VKORC1 and
CYP2C9 are important.8 Center researchers assessed the CPIC guidelines as having poor
methodological quality.
The Canadian Pharmacogenomics Network for Drug Safety published guidelines on genetic
testing of CYP2C9 and VKORC1 for warfarin therapy in 2015.46 These guidelines have a
moderate-strength recommendation that testing of all warfarin-naive patients (children and
adults) for VKORC1 (21639G.A), CYP2C9*2, and CYP2C9*3 should be considered before initiation
of therapy and within the first 2 weeks of therapy.46 In addition, such pharmacogenetic testing
should be considered for all patients who are at increased risk of bleeding complications, who
consistently show out-of-range INRs, or who suffer adverse events while receiving warfarin.46
Genetic testing for CYP2C9*5, *6, *8, or *11 and CYP4F2 V433M is not recommended.46 Center
researchers assessed these guidelines as having poor methodological quality.

WA – Health Technology Assessment March 6, 2018
Pharmacogenetic testing for patients treated with anticoagulants: Draft evidence report 72
Three of the identified guidelines do not mention pharmacogenetic testing:
American College of Cardiology, American Heart Association Task Force on Practice
Guidelines, and the Heart Rhythm Society 2014 guidelines on atrial fibrillation38
American College of Cardiology and American Heart Association Task Force on Clinical
Practice Guidelines 2017 update to the guidelines on valvular heart disease39
Canadian Agency for Drugs and Technologies in Health (CADTH) 2012 guidelines on
antithrombotic agents for patients with atrial fibrillation37
Center researchers assessed the CADTH guidelines as having good methodological quality and
the other 2 guidelines as having poor methodological quality.
Among the 8 identified guidelines, 340-42 of them include recommendations on the initial dose of
warfarin when not using pharmacogenetic testing. The American College of Chest Physicians
guideline Evidence-Based Management of Anticoagulant Therapy suggests initiating warfarin at
10 mg daily for the first 2 days for patients sufficiently healthy to be treated as outpatients.40
Another guideline by the American College of Chest Physicians, Oral Anticoagulant Therapy,
discusses flexibility in determining the starting dose of warfarin.47 These guidelines suggest that
initial doses between 5 and 10 mg are effective, with appropriate dosing varying by inpatient or
outpatient status, age, concomitant treatments, and comorbidities.47 An initial dose of 2 to 3 mg
may be appropriate for patients who have undergone heart valve replacement.47
The SIGN guidelines state that the initial treatment dose for acute thromboembolism is
generally 10 mg warfarin, but includes recommendations to vary the initial dose based on age,
body weight, comorbidities and other factors.41 The Australasian Society of Thrombosis and
Haemostasis guidelines recommend avoiding high loading doses of warfarin, starting at 5 mg
daily, or even lower in elderly patients.42
Selected Payer Coverage Determinations
Medicare
One Medicare NCD was identified for pharmacogenetic testing of patients using oral
anticoaglulants.48 This NCD does not provide coverage for pharmacogenetic testing, unless the
beneficiary is enrolled in an RCT of anticoagulation therapy with warfarin.48 The beneficiaries
enrolled in such a study must have not been previously tested for CYP2C9 or VKORC1 alleles
and must have received fewer than 5 days of warfarin in the anticoagulation regimen for which
the testing is ordered.48 Additional requirements from the NCD for a qualifying RCT are listed in
Appendix H. This NCD includes a statement that it has been or is currently being reviewed under
the NCD process.48
Center researchers identified one Medicare LCD by Noridian that applies to Washington on
pharmacogenetic testing of patients using oral anticoaglulants.49 This LCD includes the same
coverage determination as the NCD above48 for testing of the CYP2C9 or VKORC1 alleles.49 The
LCD states that all other coverage for genetic testing for the CYP2C9 and VKORC1 is considered
investigational at this time.49

WA – Health Technology Assessment March 6, 2018
Pharmacogenetic testing for patients treated with anticoagulants: Draft evidence report 73
Private Payers
The Aetna policy on pharmacogenetic and pharmacodynamic testing, last reviewed on
9/22/2017, considers genotyping for CYP2C9 to inform dosing of coumarin derivatives to be
experimental and investigational.50 This policy considers genotyping for VKORC1 polymorphism
to test for reduced or enhanced effects or severe side effects of drugs metabolized by the
vitamin K epoxide reductase complex subunit (including warfarin) to be experimental and
investigational.50
The Cigna policy on pharmacogenetic testing, effective 1/15/2017, does not cover genotyping
for CYP2C9 or VKORC1.52
The Regence policy on CYP450 genotyping states that CYP2C9 and VKORC1 genotyping for the
purpose of warfarin dose management is considered investigational.51
Conclusions
The goal of anticoagulant therapy is to prevent thromboembolism while minimizing the risk of
bleeding. Warfarin management is complex because of its narrow therapeutic range and the
large number of variables that can influence anticoagulation. Among these variables are age,
height, weight, comorbidities, diet, drug interactions, and genetic variation. This systematic
review and meta-analysis was conducted to inform policy decisions in the state of Washington
regarding whether pharmacogenetic testing for the initiation of warfarin therapy has clinical
utility and cost-effectiveness compared to other management strategies.
Three meta-analytic outcomes represent end outcomes of importance to patients: mortality,
thromboembolic events, and major bleeding. This meta-analysis found a 17% lower risk of death
when conventional dosing strategies were employed, although the difference was not
statistically significant and the overall confidence in this finding is based on low quality of
evidence. There were 15% fewer thromboembolic events in the pharmacogenetic testing group
meta-analysis, although this was also not statistically significant; confidence in this finding was
moderate based on the quality of evidence. Major bleeding was 57% less likely with the
pharmacogenetic intervention, and this finding was statistically significant and had a moderate
quality of evidence.
None of the studies reported deaths directly related to the pharmacogenetic or comparator
dosing method; most studies reported all-cause mortality and did not attribute deaths to the
intervention. The small number of events overall make this outcome somewhat unstable. The
meta-analysis for thromboembolic events was heavily influenced by the Gage et al. (2017) RCT,31
which included an additional outcome assessment for asymptomatic lower extremity DVT with
the use of duplex ultrasound approximately 1 month after surgery. No other study screened for
asymptomatic cases of thromboembolism, and the size of the trial31 meant that this RCT was
heavily weighted in the meta-analysis, such that the meta-analysis likely overstates any
advantage of pharmacogenetic testing.

WA – Health Technology Assessment March 6, 2018
Pharmacogenetic testing for patients treated with anticoagulants: Draft evidence report 74
Major bleeding was the one outcome that favored pharmacogenetic testing, but there are
caveats to this finding as well. Four of the 11 RCTs had no major bleeding events in either study
group, and two additional RCTs had only 1 event each. The addition of these RCTs to the meta-
analysis is recommended to improve the overall precision of results, but also creates a situation
in which outlier studies might have more influence, particularly with a small overall number of
events. These studies all had slightly different definitions of major bleeding and different lengths
of follow-up during which the outcome could be detected. The study by Kimmel et al. (2013),
which accounted for one-third of the weight in the meta-analysis, had a broad definition of
major bleeding and a 4-week follow-up period.21 The Gage et al. (2017) RCT, accounting for
about 19% of the meta-analytic weight for this outcome, had a more narrow definition of major
bleeding and collected outcomes in the first month of treatment, but was conducted only
among patients having lower extremity arthroplasty surgery for which bleeding might
reasonably be expected to be more likely overall.31 The much smaller RCT by Burmester et al.
(2011)7 contributed nearly 21% of the meta-analytic weight to the outcome of major bleeding.
Burmester et al. (2011) collected outcomes in the first 14 days of therapy and reported major
bleeding in several ways: events adjudicated by the study’s Data Safety Monitoring Board or
events defined as either “significant” or “life-threatening.”7 Center researchers used the
adjudicated events for the meta-analysis, but noted that the other two definitions had more
bleeding episodes within the pharmacogenetically tested group.
Two meta-analytic outcomes are intermediate outcomes: PTTR and overanticoagulation. These
two outcomes were more robustly reported across RCTs, and therefore more amenable to
subgroup analyses. The risk of overanticoagulation was 10% lower and the PTTR 3.11% higher in
the pharmacogenetic testing intervention groups. Neither of these estimates was statistically
significant, and Center researchers had low confidence in both findings based on the quality of
evidence.
Overanticoagulation puts the patient at risk of bleeding.53 There are likely to be “overshoots”
during initiation of warfarin therapy, but with close monitoring, risks can be minimized.53 A
supratherapeutic INR that is less than 5.0 generally requires no action more aggressive than
holding a dose or checking the INR again. Therefore, the clinical significance of the meta-
analytic finding, even if it was statistically significant, is not clear. A PTTR of greater than 60%,
and preferably 75%, is associated with improved outcomes for patients, including mortality,
major bleeding, stroke, and heart attack.54 However, many factors influence the PTTR, from
individual patient characteristics to the frequency of INR measurement and the organization and
effectiveness of anticoagulation services.55 Center researchers were unable to ascertain a
minimal clinically significant level for differences in PTTR and noted that 87,21-23,28-31 of 12 RCTs in
this meta-analysis did not have PTTR results in either group that met the 60% threshold. It is,
therefore, difficult to gauge the significance of the 3.11 percentage point difference in PTTR
found in this meta-analysis. The pharmacogenetically guided algorithms used in the RCTs in this
systematic review all included clinical factors in addition to genetic variant data. Subgroup meta-
analysis determined that the PTTR advantage seen in the pharmacogenetic testing groups could

WA – Health Technology Assessment March 6, 2018
Pharmacogenetic testing for patients treated with anticoagulants: Draft evidence report 75
be explained by the use of fixed-dose warfarin initiation rather than a clinical algorithm in the
comparator group. When the RCT used a clinical algorithm, there was no longer any advantage
to the addition of pharmacogenetic testing.
There were 532-36 modeling studies to contribute to evaluating the cost-effectiveness of
pharmacogenetic testing for warfarin therapy in the setting of atrial fibrillation. All of these
studies had limitations, and the overall quality of evidence was very low. Only 3 of the studies
were conducted using a U.S. perspective. All 3 assumed a higher PTTR than was found in our
meta-analysis, and despite this did not find the intervention cost-effective in 2007 U.S. dollars at
a conventional threshold of $50,000.
Center researchers identified 8 relevant clinical practice guidelines.8,37-42,46 Of these, 3 guidelines,
including the American College of Chest Physicians 2012 guideline Evidence-Based Management
of Anticoagulant Therapy,40 recommend against the use of pharmacogenetic testing to initiate
warfarin therapy, 2 guidelines recommend its use,8,46 and 3 have no recommendation.37-39
Neither the Medicare NCD nor the Noridian LCD provide coverage for pharmacogenetic testing
except for enrollees participating in RCTs of warfarin treatment, and no relevant private payers
cover the testing. In summary, the evidence on pharmacogenetic testing for warfarin therapy is
limited, with only some evidence that it might decrease episodes of major bleeding. However,
neither good-quality practice guidelines nor payer coverage policies support its use.
Finally, Center researchers did not identify studies involving oral anticoagulants other than
warfarin that were eligible for inclusion. However, the trials registry site www.ClinicalTrials.gov
identified ongoing studies that involve pharmacogenetic testing and direct-acting oral
anticoagulants (see Appendix G).

WA – Health Technology Assessment March 6, 2018
Pharmacogenetic testing for patients treated with anticoagulants: Draft evidence report 76
References
1. Shi C, Yan W, Wang G, Wang F, Li Q, Lin N. Pharmacogenetics-based versus conventional
dosing of warfarin: a meta-analysis of randomized controlled trials. PLoS ONE [Electronic
Resource]. 2015;10(12):e0144511.
2. Harter K, Levine M, Henderson SO. Anticoagulation drug therapy: a review. West J Emerg
Med. 2015;16(1):11-17.
3. Michigan Anticoagulation Quality Improvement Initiative. Anticoagulation toolkit. 2017;
http://anticoagulationtoolkit.org/sites/default/files/toolkit_pdfs/toolkitfull.pdf.
4. Emery JD. Pharmacogenomic testing and warfarin: what evidence has the GIFT trial
provided? JAMA. 2017;318(12):1110-1112.
5. American Heart Association. A patient's guide to taking warfarin. 2017;
http://www.heart.org/HEARTORG/Conditions/Arrhythmia/PreventionTreatmentofArrhyth
mia/A-Patients-Guide-to-Taking-Warfarin_UCM_444996_Article.jsp#.Woz9a66nGUk.
6. Hull RD, Garcia DA, Vazquez SR. Patient education: warfarin (Coumadin) (beyond the
basics). 2018; https://www.uptodate.com/contents/warfarin-coumadin-beyond-the-
basics.
7. Burmester JK, Berg RL, Yale SH, et al. A randomized controlled trial of genotype-based
Coumadin initiation. Genet in Med. 2011;13(6):509-518.
8. Johnson JA, Caudle KE, Gong L, et al. Clinical Pharmacogenetics Implementation
Consortium (CPIC) guideline for pharmacogenetics-guided warfarin dosing: 2017 update.
Clin Pharmacol Ther. 2017;102(3):397-404.
9. Stanford University. PharmGKB. 2018; https://www.pharmgkb.org/.
10. Tang HL, Shi WL, Li XG, Zhang T, Zhai SD, Xie HG. Limited clinical utility of genotype-
guided warfarin initiation dosing algorithms versus standard therapy: a meta-analysis
and trial sequential analysis of 11 randomized controlled trials. Pharmacogenomics J.
2015;15(6):496-504.
11. Stergiopoulos K, Brown DL. Genotype-guided vs clinical dosing of warfarin and its
analogues: meta-analysis of randomized clinical trials. JAMA Intern Med.
2014;174(8):1330-1338.

WA – Health Technology Assessment March 6, 2018
Pharmacogenetic testing for patients treated with anticoagulants: Draft evidence report 77
12. Dahal K, Sharma SP, Fung E, et al. Meta-analysis of randomized controlled trials of
genotype-guided vs standard dosing of warfarin. Chest. 2015;148(3):701-710.
13. Wang ZQ, Zhang R, Zhang PP, et al. Pharmacogenetics-based warfarin dosing algorithm
decreases time to stable anticoagulation and the risk of major hemorrhage: an updated
meta-analysis of randomized controlled trials. J Cardiovasc Pharm. 2015;65(4):364-370.
14. Tang T, Liu J, Zuo K, et al. Genotype-guided dosing of coumarin anticoagulants: a meta-
analysis of randomized controlled trials. J Cardiovasc Pharm T. 2015;20(4):387-394.
15. Liao Z, Feng S, Ling P, Zhang G. Meta-analysis of randomized controlled trials reveals an
improved clinical outcome of using genotype plus clinical algorithm for warfarin dosing.
J Thromb Thrombolys. 2015;39(2):228-234.
16. Li X, Yang J, Wang X, Xu Q, Zhang Y, Yin T. Clinical benefits of pharmacogenetic
algorithm-based warfarin dosing: meta-analysis of randomized controlled trials. Thromb
Res. 2015;135(4):621-629.
17. Goulding R, Dawes D, Price M, Wilkie S, Dawes M. Genotype-guided drug prescribing: a
systematic review and meta-analysis of randomized control trials. Brit J Clin Pharmaco.
2015;80(4):868-877.
18. Franchini M, Mengoli C, Cruciani M, Bonfanti C, Mannucci PM. Effects on bleeding
complications of pharmacogenetic testing for initial dosing of vitamin K antagonists: a
systematic review and meta-analysis. J Thromb Haemost. 2014;12(9):1480-1487.
19. Belley-Cote EP, Hanif H, D'Aragon F, et al. Genotype-guided versus standard vitamin K
antagonist dosing algorithms in patients initiating anticoagulation: a systematic review
and meta-analysis. Thromb Haemost. 2015;114(4):768-777.
20. Borgman MP, Pendleton RC, McMillin GA, et al. Prospective pilot trial of PerMIT versus
standard anticoagulation service management of patients initiating oral anticoagulation.
Thromb Haemost. 2012;108(3):561-569.
21. Kimmel SE, French B, Kasner SE, et al. A pharmacogenetic versus a clinical algorithm for
warfarin dosing. N Engl J Med. 2013;369(24):2283-2293.
22. Jonas DE, Evans JP, McLeod HL, et al. Impact of genotype-guided dosing on
anticoagulation visits for adults starting warfarin: a randomized controlled trial.
Pharmacogenomics. 2013;14(13):1593-1603.

WA – Health Technology Assessment March 6, 2018
Pharmacogenetic testing for patients treated with anticoagulants: Draft evidence report 78
23. Hillman MA, Wilke RA, Yale SH, et al. A prospective, randomized pilot trial of model-
based warfarin dose initiation using CYP2C9 genotype and clinical data. Clinic Med Res.
2005;3(3):137-145.
24. Caraco Y, Blotnick S, Muszkat M. CYP2C9 genotype-guided warfarin prescribing
enhances the efficacy and safety of anticoagulation: a prospective randomized controlled
study. Clin Pharmacol Ther. 2008;83(3):460-470.
25. Wang M, Lang X, Cui S, et al. Clinical application of pharmacogenetic-based warfarin-
dosing algorithm in patients of Han nationality after rheumatic valve replacement: a
randomized and controlled trial. Int J Med Sci. 2012;9(6):472-479.
26. Pirmohamed M, Burnside G, Eriksson N, et al. A randomized trial of genotype-guided
dosing of warfarin. N Engl J Med. 2013;369(24):2294-2303.
27. Anderson JL, Horne BD, Stevens SM, et al. Randomized trial of genotype-guided versus
standard warfarin dosing in patients initiating oral anticoagulation. Circulation.
2007;116(22):2563-2570.
28. Huang SW, Chen HS, Wang XQ, et al. Validation of VKORC1 and CYP2C9 genotypes on
interindividual warfarin maintenance dose: a prospective study in Chinese patients.
Pharmacogenet Genom. 2009;19(3):226-234.
29. Wen MS, Chang KC, Lee TH, et al. Pharmacogenetic dosing of warfarin in the Han-
Chinese population: a randomized trial. Pharmacogenomics. 2017;18(3):245-253.
30. Pengo V, Zambon CF, Fogar P, et al. A randomized trial of pharmacogenetic warfarin
dosing in naive patients with non-valvular atrial fibrillation. PLoS ONE [Electronic
Resource]. 2015;10(12):e0145318.
31. Gage BF, Bass AR, Lin H, et al. Effect of genotype-guided warfarin dosing on clinical
events and anticoagulation control among patients undergoing hip or knee arthroplasty:
the GIFT randomized clinical trial. JAMA. 2017;318(12):1115-1124.
32. Pink J, Pirmohamed M, Lane S, Hughes DA. Cost-effectiveness of pharmacogenetics-
guided warfarin therapy vs. alternative anticoagulation in atrial fibrillation. Clin
Pharmacol Ther. 2014;95(2):199-207.
33. Patrick AR, Avorn J, Choudhry NK. Cost-effectiveness of genotype-guided warfarin
dosing for patients with atrial fibrillation. Circ-Cardiovasc Qual. 2009;2(5):429-436.

WA – Health Technology Assessment March 6, 2018
Pharmacogenetic testing for patients treated with anticoagulants: Draft evidence report 79
34. Eckman MH, Rosand J, Greenberg SM, Gage BF. Cost-effectiveness of using
pharmacogenetic information in warfarin dosing for patients with nonvalvular atrial
fibrillation. Ann Intern Med. 2009;150(2):73-83.
35. Verhoef TI, Redekop WK, Langenskiold S, et al. Cost-effectiveness of pharmacogenetic-
guided dosing of warfarin in the United Kingdom and Sweden. Pharmacogenomics J.
2016;16(5):478-484.
36. Meckley LM, Gudgeon JM, Anderson JL, Williams MS, Veenstra DL. A policy model to
evaluate the benefits, risks and costs of warfarin pharmacogenomic testing.
Pharmacoeconomics. 2010;28(1):61-74.
37. CADTH therapeutic reviews. In: Recommendations for antithrombotic agents for the
prevention of stroke and systemic embolism in patients with atrial fibrillation. Ottawa
(ON): Canadian Agency for Drugs and Technologies in Health; 2013.
38. January CT, Wann LS, Alpert JS, et al. 2014 AHA/ACC/HRS guideline for the management
of patients with atrial fibrillation: a report of the American College of
Cardiology/American Heart Association Task Force on Practice Guidelines and the Heart
Rhythm Society. J Am Coll Cardiol. 2014;64(21):e1-76.
39. Nishimura RA, Otto CM, Bonow RO, et al. 2017 AHA/ACC focused update of the 2014
AHA/ACC guideline for the management of patients with valvular heart disease: a report
of the American College of Cardiology/American Heart Association Task Force on Clinical
Practice Guidelines. J Am Coll Cardiol. 2017;70(2):252-289.
40. Holbrook A, Schulman S, Witt DM, et al. Evidence-based management of anticoagulant
therapy: antithrombotic therapy and prevention of thrombosis, 9th ed: American College
of Chest Physicians evidence-based clinical practice guidelines. Chest. 2012;141(2
Suppl):e152S-184S.
41. Scottish Intercollegiate Guidelines Network. Antithrombotics: indications and
management. 2013; http://www.sign.ac.uk/assets/sign129.pdf.
42. Tran HA, Chunilal SD, Harper PL, Tran H, Wood EM, Gallus AS. An update of consensus
guidelines for warfarin reversal. Med J Aust. 2013;198(4):198-199.
43. Klein TE, Altman RB, Eriksson N, et al. Estimation of the warfarin dose with clinical and
pharmacogenetic data. N Engl J Med. 2009;360(8):753-764.

WA – Health Technology Assessment March 6, 2018
Pharmacogenetic testing for patients treated with anticoagulants: Draft evidence report 80
44. Gage BF, Eby C, Johnson JA, et al. Use of pharmacogenetic and clinical factors to predict
the therapeutic dose of warfarin. Clin Pharmacol Ther. 2008;84(3):326-331.
45. Lenzini P, Wadelius M, Kimmel S, et al. Integration of genetic, clinical, and INR data to
refine warfarin dosing. Clin Pharmacol Ther. 2010;87(5):572-578.
46. Shaw K, Amstutz U, Kim RB, et al. Clinical practice recommendations on genetic testing
of CYP2C9 and VKORC1 variants in warfarin therapy. Ther Drug Monit. 2015;37(4):428-
436.
47. Ageno W, Gallus AS, Wittkowsky A, Crowther M, Hylek EM, Palareti G. Oral anticoagulant
therapy: antithrombotic therapy and prevention of thrombosis, 9th ed: American College
of Chest Physicians evidence-based clinical practice guidelines. Chest. 2012;141(2
Suppl):e44S-e88S.
48. Centers for Medicare and Medicaid Services. National Coverage Determination (NCD) for
pharmacogenomic testing for warfarin response (90.1). 2009;
https://www.cms.gov/medicare-coverage-database/details/ncd-
details.aspx?NCDId=333&ncdver=1&CoverageSelection=Both&ArticleType=All&PolicyT
ype=Final&s=All&KeyWord=Pharmacogenomic&KeyWordLookUp=Title&KeyWordSearc
hType=And&articleId=52974&ver=3&ContrId=370&ContrVer=1&bc=gAAAACAAAAAA
&.
49. Centers for Medicare and Medicaid Services. Local Coverage Determination (LCD):
MolDX: CYP2C19, CYP2D6, CYP2C9, and VKORC1 genetic testing (L36312). 2015;
https://www.cms.gov/medicare-coverage-database/details/lcd-
details.aspx?LCDId=36312&ver=15&CoverageSelection=Both&ArticleType=All&PolicyTy
pe=Final&s=All&KeyWord=cyp2c9&KeyWordLookUp=Title&KeyWordSearchType=And
&articleId=52974&bc=gAAAACAAAAAA&.
50. Aetna. Pharmacogenetic and pharmacodynamic testing. 2017;
http://www.aetna.com/cpb/medical/data/700_799/0715.html.
51. Regence. Cytochrome p450 genotyping. 2018;
http://blue.regence.com/trgmedpol/geneticTesting/gt10.pdf.
52. Cigna. Pharmacogenetic testing. 2017;
https://cignaforhcp.cigna.com/public/content/pdf/coveragePolicies/medical/mm_0500_c
overagepositioncriteria_pharmacogenetic_testing.pdf.

WA – Health Technology Assessment March 6, 2018
Pharmacogenetic testing for patients treated with anticoagulants: Draft evidence report 81
53. Phillips KW, Ansell J. Outpatient management of oral vitamin K antagonist therapy:
defining and measuring high-quality management. Expert Rev Cardiovasc Ther.
2008;6(1):57-70.
54. White HD, Gruber M, Feyzi J, et al. Comparison of outcomes among patients randomized
to warfarin therapy according to anticoagulant control: results from SPORTIF III and V.
Arch Intern Med. 2007;167(3):239-245.
55. Dolan G, Smith LA, Collins S, Plumb JM. Effect of setting, monitoring intensity and patient
experience on anticoagulation control: a systematic review and meta-analysis of the
literature. Curr Med Res Opin. 2008;24(5):1459-1472.
56. Shehab N, Lovegrove MC, Geller AI, Rose KO, Weidle NJ, Budnitz DS. US emergency
department visits for outpatient adverse drug events, 2013-2014. JAMA.
2016;316(20):2115-2125.
57. Lopez-Lopez JA, Sterne JAC, Thom HHZ, et al. Oral anticoagulants for prevention of
stroke in atrial fibrillation: systematic review, network meta-analysis, and cost
effectiveness analysis. BMJ. 2017;359:j5058.
58. U.S. Food and Drug Administration. Warfarin medication guide. 2017;
https://www.accessdata.fda.gov/drugsatfda_docs/label/2017/009218s017lbl.pdf.
59. Brouwers MC, Kho ME, Browman GP, et al. AGREE II: Advancing guideline development,
reporting and evaluation in health care. Can Med Assoc J. 2010;182(18):E839-E842.
60. Canadian Agency for Drugs and Technologies in Health. Guidelines for the economic
evaluation of health technologies: Canada. 2017; https://www.cadth.ca/about-
cadth/how-we-do-it/methods-and-guidelines/guidelines-for-the-economic-evaluation-
of-health-technologies-canada.
61. Higgins JPT, Green S, eds. Cochrane handbook for systematic reviews of interventions.
http://handbook.cochrane.org/2017.
62. Scottish Intercollegiate Guidelines Network. Methodology checklist 1: Systematic reviews
and meta-analyses. 2015; http://www.sign.ac.uk/checklists-and-notes.html.
63. Scottish Intercollegiate Guidelines Network. Methodology checklist 2: Randomised
controlled trials. 2015; http://www.sign.ac.uk/checklists-and-notes.html.

WA – Health Technology Assessment March 6, 2018
Pharmacogenetic testing for patients treated with anticoagulants: Draft evidence report 82
64. Scottish Intercollegiate Guidelines Network. Methodology checklist 5: Diagnostic studies.
2015; http://www.sign.ac.uk/checklists-and-notes.html.
65. Guyatt GH, Oxman AD, Vist GE, et al. GRADE: an emerging consensus on rating quality of
evidence and strength of recommendations. BMJ. 2008;336(7650):924-926.
66. Schünemann H, Brozek J, Guyatt G, Oxman A. GRADE handbook for grading quality of
evidence and strength of recommendations. Updated October 2013. The GRADE
Working Group, 2013. 2014;
http://gdt.guidelinedevelopment.org/app/handbook/handbook.html.
67. Friedrich JO, Adhikari NK, Beyene J. Inclusion of zero total event trials in meta-analyses
maintains analytic consistency and incorporates all available data. BMC Med Res
Methodol. 2007;7:5.
68. Dean AG, Sullivan KM, Soe MM. OpenEpi: open source epidemiologic statistics for public
health. 2018; www.OpenEpi.com. Accessed February 9, 2018.
69. Ageno W, Johnson J, Nowacki B, Turpie AG. A computer generated induction system for
hospitalized patients starting on oral anticoagulant therapy. Thromb Haemost.
2000;83(6):849-852.
70. Zambon CF, Pengo V, Padrini R, et al. VKORC1, CYP2C9 and CYP4F2 genetic-based
algorithm for warfarin dosing: an Italian retrospective study. Pharmacogenomics.
2011;12(1):15-25.
71. Manotti C, Moia M, Palareti G, Pengo V, Ria L, Dettori AG. Effect of computer-aided
management on the quality of treatment in anticoagulated patients: a prospective,
randomized, multicenter trial of APROAT (Automated PRogram for Oral Anticoagulant
Treatment). Haematologica. 2001;86(10):1060-1070.
72. Anderson JL, Horne BD, Stevens SM, et al. A randomized and clinical effectiveness trial
comparing two pharmacogenetic algorithms and standard care for individualizing
warfarin dosing (CoumaGen-II). Circulation. 2012;125(16):1997-2005.
73. American Society of Hematology. ASH clinical practice guidelines. 2018;
http://www.hematology.org/Clinicians/Guidelines-Quality/Guidelines.aspx#a2.
74. Hamberg AK, Wadelius M, Friberg LE, Biss TT, Kamali F, Jonsson EN. Characterizing
variability in warfarin dose requirements in children using modelling and simulation. Brit
J Clin Pharmaco. 2014;78(1):158-169.

WA – Health Technology Assessment March 6, 2018
Pharmacogenetic testing for patients treated with anticoagulants: Draft evidence report 83
75. Biss TT, Avery PJ, Brandao LR, et al. VKORC1 and CYP2C9 genotype and patient
characteristics explain a large proportion of the variability in warfarin dose requirement
among children. Blood. 2012;119(3):868-873.
76. McMillin GA, Melis R, Wilson A, et al. Gene-based warfarin dosing compared with
standard of care practices in an orthopedic surgery population: a prospective, parallel
cohort study. Ther Drug Monit. 2010;32(3):338-345.
77. Epstein RS, Moyer TP, Aubert RE, et al. Warfarin genotyping reduces hospitalization rates
results from the MM-WES (Medco-Mayo Warfarin Effectiveness study). J Am Coll Cardiol.
2010;55(25):2804-2812.
78. Kadian-Dodov DL, van der Zee SA, Scott SA, et al. Warfarin pharmacogenetics: a
controlled dose-response study in healthy subjects. Vascular Medicine. 2013;18(5):290-
297.
79. Verhoef TI, Ragia G, de Boer A, et al. A randomized trial of genotype-guided dosing of
acenocoumarol and phenprocoumon. N Engl J Med. 2013;369(24):2304-2312.
80. Baranova EV, Verhoef TI, Ragia G, et al. Dosing algorithms for vitamin K antagonists
across VKORC1 and CYP2C9 genotypes. J Thromb Haemost. 2017;15(3):465-472.
81. Liu Y, Yang J, Xu Q, et al. Comparative performance of warfarin pharmacogenetic
algorithms in Chinese patients. Thromb Res. 2012;130(3):435-440.

WA – Health Technology Assessment March 6, 2018
Pharmacogenetic testing for patients treated with anticoagulants: Draft evidence report 84
Appendix A. Search Strategy
Databases:
Ovid MEDLINE <1946 to December Week 4 2017>
Ovid MEDLINE In-Process & Other Non-Indexed Citations <January 3, 2018>
EBM Reviews—Cochrane Central Register of Controlled Trials <November 2017>
EBM Reviews—Cochrane Database of Systematic Reviews <2005 to December 28, 2017>
1 (Warfarin or Coumadin or Jantoven or dabigatran or pradaxa or Rivaroxaban or Xarelto or
Apixaban or Eliquis or Edoxaban or Savaysa or Betrixaban or Bevyxxa or Otamixaban or (oral*
adj2 (anticoagul* or anti-coagul*))).mp. [mp=ti, ab, ot, nm, hw, kf, px, rx, ui, sy, sh, kw, tx, ct]
2 exp Anticoagulants/ad, ae, ct, tu, to [Administration & Dosage, Adverse Effects,
Contraindications, Therapeutic Use, Toxicity]
3 exp Administration, Oral/
4 2 and 3
5 1 or 4
6 exp Prothrombin/ai [Antagonists & Inhibitors]
7 exp Factor Xa Inhibitors/
8 exp Vitamin K/ai [Antagonists & Inhibitors]
9 6 or 7 or 8
10 (((factor adj (II or xa)) or vitamin k or prothrombin) adj3 (antagon* or inhibit* or block* or
interfer*)).mp. [mp=ti, ab, ot, nm, hw, kf, px, rx, ui, sy, sh, kw, tx, ct]
11 5 or 9 or 10
12 exp Pharmacogenetics/ or pharmacogene*.mp. or pharmacogenom*.mp. [mp=ti, ab, ot,
nm, hw, kf, px, rx, ui, sy, sh, kw, tx, ct]
13 11 and 12
14 exp Genetic Variation/
15 exp Metabolism/
16 14 and 15
17 11 and 16
18 exp Pharmacogenomic Variants/

WA – Health Technology Assessment March 6, 2018
Pharmacogenetic testing for patients treated with anticoagulants: Draft evidence report 85
19 11 and 18
20 exp Precision Medicine/
21 11 and 20
22 (pharmacogenet* or pharmacogenom*).mp. [mp=ti, ab, ot, nm, hw, kf, px, rx, ui, sy, sh, kw,
tx, ct]
23 11 and 22
24 exp genetic testing/ or genetic test*.mp.
25 11 and 24
26 13 or 17 or 19 or 21 or 23 or 25
27 limit 26 to humans [Limit not valid in CCTR,CDSR; records were retained]
28 remove duplicates from 27
29 limit 28 to (meta analysis or systematic reviews) [Limit not valid in CCTR,CDSR; records
were retained]
30 limit 28 to randomized controlled trial [Limit not valid in CDSR; records were retained]
31 limit 28 to controlled clinical trial [Limit not valid in CDSR; records were retained]
32 limit 28 to pragmatic clinical trial [Limit not valid in CCTR,CDSR; records were retained]
33 limit 28 to clinical trial, all [Limit not valid in CCTR,CDSR; records were retained]
34 limit 28 to comparative study [Limit not valid in CDSR; records were retained]
35 30 not 29
36 31 not (29 or 30)
37 32 not (29 or 30 or 31)
38 33 not (29 or 30 or 31 or 32)
39 34 not (29 or 30 or 31 or 32 or 33)
40 29 or 30 or 31 or 32 or 33 or 34
41 exp epidemiologic studies/
42 28 and 41

WA – Health Technology Assessment March 6, 2018
Pharmacogenetic testing for patients treated with anticoagulants: Draft evidence report 86
43 42 not 40
44 28 not (40 or 42)
45 exp Economics/
46 ec.fs.
47 (cost or costs or econom* or financ* or dollar*).ti.
48 45 or 46 or 47
49 28 and 48

WA – Health Technology Assessment March 6, 2018
Pharmacogenetic testing for patients treated with anticoagulants: Draft evidence report 87
Appendix B. Additional Methods
Risk of Bias Assessment: Randomized Controlled Trials
Domain Domain Elements
The elements included in each domain are assessed and rated as Yes, No,
Unclear, or Not Applicable based on performance and documentation of
the individual elements in each domain. The overall risk of bias for the
study is Assessed as High, Moderate, or Low based on assessment of how
well the overall study methods and processes were performed to limit bias
and ensure validity.
Randomization An appropriate method of randomization is used to allocate participants or
clusters to groups, such as a computer random number generator
Baseline characteristics between groups or clusters are similar
Allocation
Concealment
An adequate concealment method is used to prevent investigators and
participants from influencing enrollment or intervention allocation
Intervention Intervention and comparator intervention applied equally to groups
Co-interventions appropriate and applied equally to groups
Control selected is an appropriate intervention
Outcomes Outcomes are measured using valid and reliable measures
Investigators use single outcome measures and do not rely on composite
outcomes, or the outcome of interest can be calculated from the
composite outcome
The trial has an appropriate length of follow-up and groups are assessed at
the same time points
Outcome reporting of entire group or subgroups is not selective
Masking (Blinding) of
Investigators and
Participants
Investigators and participants are unaware (masked or blinded) of
intervention status
Masking (Blinding) of
Outcome Assessors Outcome assessors are unaware (masked or blinded) of intervention status
Intention to Treat
Analysis
Participants are analyzed based on random assignment (intention-to-treat
analysis)
Statistical Analysis Participants lost to follow-up unlikely to significantly bias the results (i.e.,
complete follow-up of ≥ 80% of the participants overall and non-
differential, ≤ 10% difference between groups)
The most appropriate summary estimate (e.g., risk ratio, hazard ratio) is
used
Paired or conditional analysis used for crossover RCT
Clustering appropriately accounted for in a cluster-randomized trial (e.g.,
use of an intraclass correlation coefficient)
Other Biases (as
appropriate)
List others in table footnote and describe, such as:
Sample size adequacy

WA – Health Technology Assessment March 6, 2018
Pharmacogenetic testing for patients treated with anticoagulants: Draft evidence report 88
Domain Domain Elements
The elements included in each domain are assessed and rated as Yes, No,
Unclear, or Not Applicable based on performance and documentation of
the individual elements in each domain. The overall risk of bias for the
study is Assessed as High, Moderate, or Low based on assessment of how
well the overall study methods and processes were performed to limit bias
and ensure validity.
Interim analysis or early stopping
Recruitment bias, including run-in period used inappropriately
Use of unsuitable crossover intervention in a crossover RCT
Interest Disclosure Disclosures of interest are provided for authors/funders/commissioners of
the study
Interests are unlikely to significantly affect study validity
Funding There is a description of source(s) of funding
Funding source is unlikely to have a significant impact on study validity

WA – Health Technology Assessment March 6, 2018
Pharmacogenetic testing for patients treated with anticoagulants: Draft evidence report 89
Risk of Bias Assessment: Economic Studies
Domain Domain Elements
The elements included in each domain are assessed and rated as Yes, No,
Unclear, or Not Applicable based on performance and documentation of
the individual elements in each domain. The overall risk of bias for the
study is assessed as High, Moderate, or Low based on assessment of how
well the overall study methods and processes were performed to limit bias
and ensure validity.
Target Population Target population and care setting described
Describe and justify basis for any target population stratification, identify
any a priori identifiable subgroups
If no subgroup analyses were performed, justify why they were not required
Perspective State and justify the analytic perspective (e.g., societal, payer, etc.)
Time Horizon Describe and justify the time horizon(s) used in the analysis
Discount Rate State and justify the discount rate used for costs and outcomes
Comparators Describe and justify selected comparators
Competing alternatives appropriate and clearly described
Modelling Model structure (e.g., scope, assumptions made) is described and justified
Model diagram provided, if appropriate
Model validation is described (may involve validation of different aspects
such as structure, data, assumptions, and coding and different validation
models such as comparison with other models)
Data sources listed and assumptions for use justified
Statistical analyses are described
Effectiveness Estimates of efficacy/effectiveness of interventions are described and
justified
The factors that are likely to have an impact on effectiveness (e.g.,
adherence, diagnostic accuracy, values, and preferences) are described and
an explanation of how they were factored into the analysis is included
The quality of evidence for the relationship between the intervention and
outcomes, and any necessary links, is described
Outcomes All relevant outcomes are identified, measured, and valued appropriately
(including harms/adverse events) for each intervention, and the justification
for information/assumptions is given
Any quality of life measures used in modelling are described and their use
justified
Any other outcomes that were considered, but rejected, are described with
the rationale for rejection
Ethical and equity-related outcomes are considered and included when
appropriate

WA – Health Technology Assessment March 6, 2018
Pharmacogenetic testing for patients treated with anticoagulants: Draft evidence report 90
Domain Domain Elements
The elements included in each domain are assessed and rated as Yes, No,
Unclear, or Not Applicable based on performance and documentation of
the individual elements in each domain. The overall risk of bias for the
study is assessed as High, Moderate, or Low based on assessment of how
well the overall study methods and processes were performed to limit bias
and ensure validity.
Resource Use/Costs All resources used are identified, valued appropriately, and included in the
analyses
Methods for costing are reporting (e.g., patient level)
Resource quantities and unit costs are both reported
Methods for costing time (e.g., lost time, productivity losses) are
appropriate and a justification is provided if time costs are not considered
Uncertainty Sources of uncertainty in the analyses are identified and justification for
probability distributions used in probabilistic analyses are given
For scenario analyses, the values and assumptions tested are provided and
justified
Results All results are presented in a disaggregated fashion, by component, in
addition to an aggregated manner
All results are presented with undiscounted totals prior to discounting and
aggregation
Natural units are presented along with alternative units (e.g., QALYs)
The components of the incremental cost-effectiveness ratio (ICER) are
shown (e.g., mean costs of each intervention in numerator and mean
outcomes of each intervention in denominator)
Results of scenario analyses, including variability in factors such as practice
patterns and costs, are reported and described in relation to the reference
(base) case
Interest Disclosure Disclosures of interest are provided for authors/funders/commissioners of
the study
Interests are unlikely to significantly affect study validity
Funding Source There is a description of source(s) of funding
Funding source is unlikely to have a significant impact on study validity

WA – Health Technology Assessment March 6, 2018
Pharmacogenetic testing for patients treated with anticoagulants: Draft evidence report 91
Risk of Bias Assessment: Clinical Practice Guidelines
Domain Domain Elements
Assessment indicates how well the guideline methodology and
development process were performed to limit bias and ensure validity for
elements in domain (each domain rated as Good, Fair, or Poor overall
based on performance and documentation of elements)
Scope and Purpose Objectives specifically described
Health question(s) specifically described
Population (patients, public, etc.) specified
Rigor of Evidence
Development
Systematic literature search
Study selection criteria clearly described
Strengths and limitations of individual studies and overall quality of the
body of evidence assessed
Rigor of
Recommendations
Development
Methods for developing recommendations clearly described
Explicit link between recommendations and supporting evidence and
includes strengths/limitations
Balance of benefits and harms (side effects, risks) considered
External review conducted
Updating procedure specified
Stakeholder
Involvement
Relevant professional groups are represented
Views and preferences of target population sought
Target users defined
Clarity and
Presentation
Recommendations specific, unambiguous
Different management options clearly presented
Key recommendations easily identifiable
Applicability and
Implementation
Provides advice and/or tools on how the recommendations can be put
into practice
Description of facilitators and barriers to application
Potential resource implications considered
Monitoring/audit/review criteria presented
Editorial Independence Views of funding body have not influenced the content of the guideline
Competing interests of members have been recorded, monitored, and
addressed appropriately

WA – Health Technology Assessment March 6, 2018
Pharmacogenetic testing for patients treated with anticoagulants: Draft evidence report 92
Appendix C. Evidence Tables
Abbreviations Used in Evidence Tables
ACC: American College of Cardiology
Afib: atrial fibrillation
AHA: American Heart Association
aOR: adjusted odds ratio
BSA: body surface area
CI: confidence interval
HR: hazard ratio
INR: international normalized ratio
MD: mean difference
NR: not reported
OR: odds ratio
QALY: quality-adjusted life years
RR: risk ratio
SD: standard deviation
UK: United Kingdom
U.S.: United States

WA – Health Technology Assessment March 6, 2018
Pharmacogenetic testing for patients treated with anticoagulants: Draft evidence report 93
Table 4. Study Characteristics
Citation Country Total
randomized
Total
analyzed
Treatment
analyzed
Control
analyzed
Genotypes
tested
Duration Treatment dosing Control dosing
Anderson
200727
U.S. 206 200 101 99 CYP2C9*2/*3,
VKORC1
3 months Regression equation
based on authors'
previous study with twice
the predicted dose given
on days 1 and 2; then
doses adjusted based on
INR
10 mg of warfarin on days
1 and 2; 5 mg on days 3
and 4; then doses adjusted
based on the day 5 INR
Borgman
201220
U.S. 34 26 13 13 CYP2C9*2/*3,
VKORC1
12 weeks Generally 5 mg on day 1;
then doses according to
PerMIT algorithm
Generally started at 5 mg
per day, but clinician
discretion allowed; dose
adjustments based on
warfarin induction
algorithm during first
week; then doses adjusted
based on INR
Burmester
20117
U.S. 230 225 113 112 CYP2C9*2/*3,
VKORC1,
CYP4F2
60 days Marshfield
pharmacogenetic model
on days 1 and 2; then
adjustments based on
guidelines from ACC and
AHA
Marshfield pharmacologic
model on days 1 and 2;
then adjustments based
on guidelines from ACC
and AHA
Caraco
200824
Israel 283 185 92 93 CYP2C9*2/*3 1 month
/variable
Algorithm designed by
authors for first 8 days;
then adjustments based
on guidelines from ACC
and AHA
Algorithm by Ageno et
al.69 for first 8 days; then
adjustments based on
guidelines from ACC and
AHA
Gage 201731 U.S. 1,650 1,597 808 789 CYP2C9*2/*3,
VKORC1,
CYP4F2
90 days Pharmacogenetic
algorithm at
Clinical dosing algorithm
at WarfarinDosing.org for
first 11 days

WA – Health Technology Assessment March 6, 2018
Pharmacogenetic testing for patients treated with anticoagulants: Draft evidence report 94
Citation Country Total
randomized
Total
analyzed
Treatment
analyzed
Control
analyzed
Genotypes
tested
Duration Treatment dosing Control dosing
WarfarinDosing.org for
first 11 days
Hillman
200523
U.S. 38 38 18 20 CYP2C9*2/*3 4 weeks Multivariable model by
authors
5 mg on the first day; then
doses adjusted based on
INR
Huang
200928
China 142 121 61 60 CYP2C9*2/*3,
VKORC1
50 days Algorithm designed by
authors; then doses
adjusted based on INR
2.5 mg/day for the first 3
days; then doses adjusted
based on INR
Jonas 201322 U.S. 109 109 55 54 CYP2C9*2/*3,
VKORC1
90 days Washington University
School of Medicine
algorithm with clinical
variables and genotype;
then adjustments based
on guidelines from ACC
and AHA
Washington University
School of Medicine
algorithm with only clinical
variables; then
adjustments based on
guidelines from ACC and
AHA
Kimmel
201321
U.S. 1,015 955 514 501 CYP2C9*2/*3,
VKORC1
6 months Pharmacogenetic
algorithm for first 3 days;
dose revision algorithm
(included genotype) for
days 4 or 5; then
algorithm-predicted dose
adjustments based on INR
Clinical algorithm for first
3 days; dose revision
algorithm for days 4 or 5;
then algorithm-predicted
dose adjustments based
on INR
Pengo 201530 Italy 200 180 88 92 CYP2C9*2/*3,
VKORC1,
CYP4F2
30 days Pharmacogenetic
algorithm by Zambon et
al. for first 6 days; then
clinician determined doses
using PARMA software
5 mg/day for 4 days;
clinical prediction model
using day 5 INR for days 5
and 6; then clinician
determined doses using
PARMA software

WA – Health Technology Assessment March 6, 2018
Pharmacogenetic testing for patients treated with anticoagulants: Draft evidence report 95
Citation Country Total
randomized
Total
analyzed
Treatment
analyzed
Control
analyzed
Genotypes
tested
Duration Treatment dosing Control dosing
Pirmohamed
201326
UK,
Sweden
455 427 211 216 CYP2C9*2/*3,
VKORC1
12 weeks Slightly modified version
of IWPC algorithm for first
3 days; algorithm using
day 4 INR for days 4 and 5;
then doses adjusted based
on INR
Dose based on age for
first 3 days (over 75 years:
5 mg per day; 75 years
and younger: 10 mg, 5 mg,
5 mg for days 1, 2, and 3,
respectively); then doses
adjusted based on INR
Wang 201225 China 106 101 50 51 CYP2C9*2/*3,
VKORC1
50 days Algorithm by Huang et al.
for first 3 days; then dose
adjustments based on INR
2.5 mg/day for first 3 days;
then dose adjustments
based on INR
Wen 201729
Taiwan
algorithm
IWPC
algorithm
Taiwan 320 318 107
107
104 CYP2C9*3,
VKORC1
CYP2C9*2/*3,
VKORC1
90 days Taiwan algorithm for first
3 days; then dose
adjustments based on INR
International Warfarin
Pharmacogenetic
Consortium algorithm for
first 3 days; then dose
adjustments based on INR
5 mg per day for first 3
days; then dose
adjustments based on INR

WA – Health Technology Assessment March 6, 2018
Pharmacogenetic testing for patients treated with anticoagulants: Draft evidence report 96
Table 5. Participant Demographic Characteristics
Age (years) Men (%) White (%) Black (%) Asian (%) Smoking (%) BSA (m2)
Citation Treat Control Treat Control Treat Control Treat Control Treat Control Treat Control Treat Control
Anderson
200727
63.2 58.9 49.5 56.6 94.1 94.9 NR NR NR NR 6.9 5.1 NR NR
Borgman
201220
59 45 54 54 100 85 NR NR NR NR NR NR NR NR
Burmester
20117
67.4 69.2 57 61 100 100 0 0 0 0 NR NR 1.96 1.98
Caraco
200824
57.6 59.7 48.4 43.8 NR NR NR NR NR NR 22 20 NR NR
Gage 201731 72.2 72 35.4 37.1 91 91.1 6.4 6.3 2 1.6 2.6 4.2 1.92 1.92
Hillman
200523
68.8 70.5 44 45 100 100 0 0 0 0 17 15 2 2
Huang
200928
41.6 43 32.7 30 0 0 0 0 100 100 NR NR 1.45 1.45
Jonas 201322 59 55.3 43.6 50 80 64.8 20 35.2 0 0 9.1 13 1.98 2.04
Kimmel
201321
59 57 53 49 NR NR 27 27 11 11 15 14 2.01 2.03
Pengo
201530
71 75 65.9 65.2 100 100 0 0 0 0 9.1 10.8 1.97 1.88
Pirmohamed
201326
67.6 67.3 65.4 58.8 98.6 98.6 0.9 0.9 0.5 0.5 9.5 12.6 NR NR
Wang
201225
41.9 42.8 30 31.3 0 0 0 0 100 100 NR NR 1.57 1.59
Wen 201729 67; 67 66 55; 54 61 0; 0 0 0; 0 0 100;
100
100 17; 14 16 1.76;
1.69
1.78
Note. Treat: Treatment group; NR: Not reported

WA – Health Technology Assessment March 6, 2018
Pharmacogenetic testing for patients treated with anticoagulants: Draft evidence report 97
Table 6. Participant Characteristics by Indication
Indications
Afib/Flutter (%) Venous
thromboembolism (%)
Post-orthopedic
surgery (%)
Valve (%) Other (%)
Citation Treatment Control Treatment Control Treatment Control Treatment Control Treatment Control
Anderson 200727 13 15 19 28 65 55 NR NR 3 2
Borgman 201220 38 31 54 38 NR NR NR NR NR NR
Burmester 20117 43 49 38 38 0 0 21 17 0 0
Caraco 200824 37 31 63 69 0 0 0 0 0 0
Gage 201731 0 0 0 0 100 100 0 0 0 0
Hillman 200523 17 45 33 15 17 15 22 20 11 5
Huang 200928 0 0 0 0 0 0 100 100 0 0
Jonas 201322 42 26 47 57 NR NR 4 0 7 17
Kimmel 201321 23 21 59 63 NR NR NR NR 21* 19*
Pengo 201530 100 100 0 0 0 0 0 0 0 0
Pirmohamed 201326 72 73 28 27 0 0 0 0 0 0
Wang 201225 0 0 0 0 0 0 100 100 0 0
Wen 201729 58; 66 64 36; 26 26 NR NR NR NR 6; 8 10
Note. NR: Not reported
*Figures include multiple indications and other indications
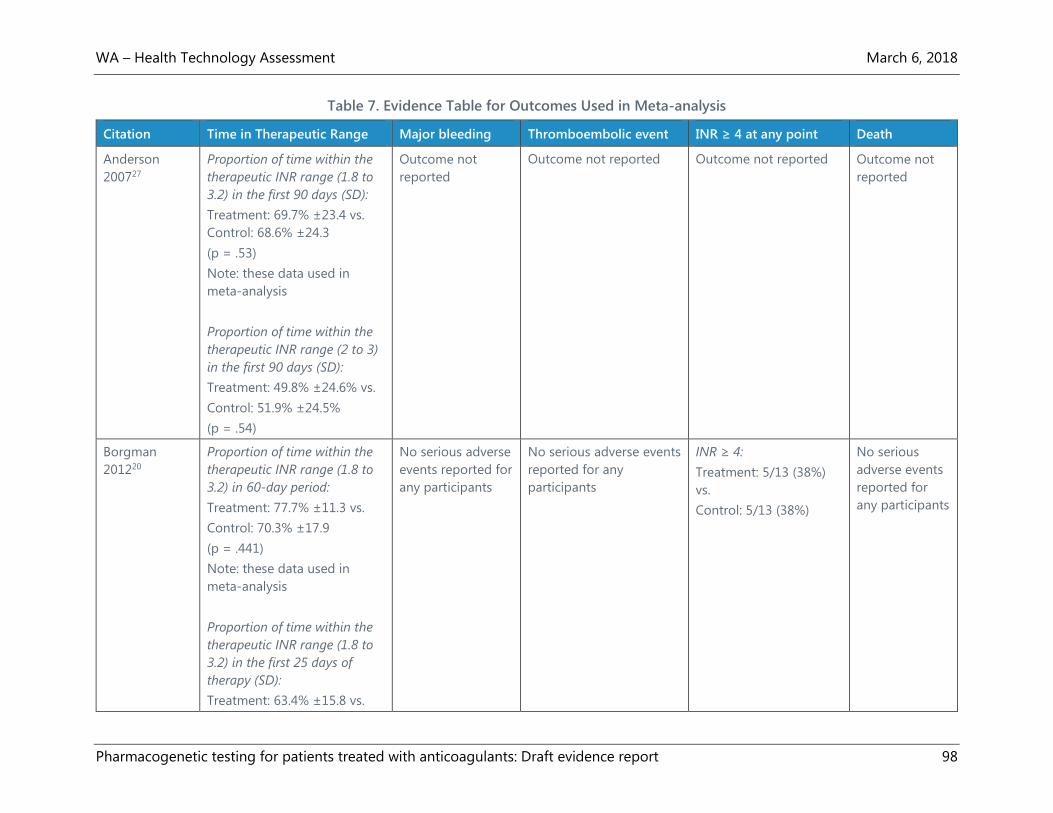
WA – Health Technology Assessment March 6, 2018
Pharmacogenetic testing for patients treated with anticoagulants: Draft evidence report 98
Table 7. Evidence Table for Outcomes Used in Meta-analysis
Citation Time in Therapeutic Range Major bleeding Thromboembolic event INR ≥ 4 at any point Death
Anderson
200727
Proportion of time within the
therapeutic INR range (1.8 to
3.2) in the first 90 days (SD):
Treatment: 69.7% ±23.4 vs.
Control: 68.6% ±24.3
(p = .53)
Note: these data used in
meta-analysis
Proportion of time within the
therapeutic INR range (2 to 3)
in the first 90 days (SD):
Treatment: 49.8% ±24.6% vs.
Control: 51.9% ±24.5%
(p = .54)
Outcome not
reported
Outcome not reported Outcome not reported Outcome not
reported
Borgman
201220
Proportion of time within the
therapeutic INR range (1.8 to
3.2) in 60-day period:
Treatment: 77.7% ±11.3 vs.
Control: 70.3% ±17.9
(p = .441)
Note: these data used in
meta-analysis
Proportion of time within the
therapeutic INR range (1.8 to
3.2) in the first 25 days of
therapy (SD):
Treatment: 63.4% ±15.8 vs.
No serious adverse
events reported for
any participants
No serious adverse events
reported for any
participants
INR ≥ 4:
Treatment: 5/13 (38%)
vs.
Control: 5/13 (38%)
No serious
adverse events
reported for
any participants

WA – Health Technology Assessment March 6, 2018
Pharmacogenetic testing for patients treated with anticoagulants: Draft evidence report 99
Citation Time in Therapeutic Range Major bleeding Thromboembolic event INR ≥ 4 at any point Death
Control: 55.3% ±16.6
(p = .1805)
Burmester
20117
Proportion of time within the
therapeutic INR range (2 to
3.5) during the first 14 days
(SD):
Treatment: 29.1% ±15.5 vs.
Control: 30.8% ±18.4
(p = .564)
Bleeding that met
Data Safety
Monitoring Board
criteria (serious
events and other
unanticipated
health events):
Treatment: 3/113
(2.7%) vs.
Control: 4/112
(3.5%)
Thromboembolic event
that met Data Safety
Monitoring Board criteria
(serious events and other
unanticipated health
events):
Treatment: 3/113 (2.7%)
vs. Control: 1/112 (0.9%)
INR exceeded 4.0:
Treatment: 43/113 (38%)
vs. Control: 39/112
(35%)
Deaths from
any cause:
Treatment:
2/113 (1.8%) vs.
Control:
3/112(2.7%)
Caraco 200824 Proportion of time within the
therapeutic INR range from
initiation through stable
anticoagulation (SD):
Treatment: 80.4 ±20.0 vs.
Control: 63.4 ±22.1
(p < .001)
Note: these data used in
meta-analysis
Proportion of time within the
therapeutic INR range (2 to 3)
during initiation period of the
first 8 days (SD):
Treatment: 45.4% ±17.2 vs.
Control: 24.5 ±16.9
(p < .001)
Major bleeding
(drop in
hemoglobin
requiring
hospitalization and
transfusion of
blood):
Treatment: 0/92
(0%) vs. Control
1/93 (1.1%)
New thromboembolic
event:
0/92(0%) vs. 0/93 (0%)
Outcome not reported Outcome not
reported

WA – Health Technology Assessment March 6, 2018
Pharmacogenetic testing for patients treated with anticoagulants: Draft evidence report 100
Gage 201731 Proportion of time within the
therapeutic INR range (2.0 to
3.0 for patients with target INR
of 2.5 and 1.5 to 2.1 for
patients with a target INR of
1.8) during first 30 days:
Treatment: 54.7% (95% CI,
53.0% to 56.4%) vs.
Control: 51.3% (95% CI, 49.6%
to 53.0%)
(MD, 3.4%, 95% CI, 1.1% to
5.8%; p = .004)
SD back-calculated from CIs:
24.6 (intervention); 24.3
(control)
Among Black patients:
Treatment: 50.9% (95% CI,
44.8% to 57.0%) vs.
Control: 50.7% (95% CI, 44.1%
to 57.4%) (p = .96)
Among non-Black patients:
Treatment: 55.0% (95% CI,
53.3% to 56.7%) vs.
Control: 51.3% (95% CI, 49.6%
to 53.0%)
(p = .003)
Major bleeding in
first 30 days:
Treatment: 2/808
(0.2%) vs.
Control: 8/789
(1.0%)
(RR, 0.24; 95% CI,
0.05 to 1.15;
p = .06)
Major bleeding
included (1)
bleeding into a
critical area
(intracranial,
epidural,
intraocular,
pericardial, or
retroperitoneal), (2)
overt bleeding that
resulted in death,
(3) a hematoma
requiring a return
to the operating
room, (4) a
decrease in
hemoglobin level
of 2 g/dL or
greater, (5) a
transfusion of 2 or
more units of
blood, or (6)
hemodynamic
changes requiring
Symptomatic or
asymptomatic venous
thromboembolism
confirmed by objective
testing in first 60 days:
Treatment: 33/808 (4.1%)
vs.
Control: 38/789 (4.8%)
(RR, 0.85; 95% CI, 0.54 to
1.34; p = .48)
INR ≥ 4 in first 30 days:
Treatment: 56/808
(6.9%) vs.
Control: 77/789 (9.8%)
(RR, 0.71; 95% CI, 0.51 to
0.99; p = .04)
Death from any
cause in first 30
days:
Treatment:
0/808 (0%) vs.
Control: 0/789
(0%)

WA – Health Technology Assessment March 6, 2018
Pharmacogenetic testing for patients treated with anticoagulants: Draft evidence report 101
Citation Time in Therapeutic Range Major bleeding Thromboembolic event INR ≥ 4 at any point Death
a transfusion of 1
or more units of
blood.
Hillman 200523 Proportion of time within the
therapeutic INR range (not
reported) during first 4 weeks
(SD):
Treatment: 41.7% ±25.4% vs.
Control: 41.5% ±24.9%
Major or minor
hemorrhagic
adverse event:
Treatment: 2/18
(11.1%) vs. Control:
4/20 (20%)
For meta-analysis,
major bleeding
defined as
gastrointestinal
bleeding:
Treatment: 2/18
(11%) vs. Control:
1/20 (5%)
Thromboembolic event
(deep venous thrombosis
or pulmonary embolism)
Treatment: 0/18 (0%) vs.
Control: 2/20 (10%)
INR > 4.0:
Treatment: 6/18 (33.0%)
vs. Control: 6/20 (30.0%)
Outcome not
reported
Huang 200928 Days within the therapeutic
INR range (1.8 to 3.0) during
first 50 days (SD):
Treatment: 28.1 ±9.3 vs.
Control: 22.1 ±9.8;
(p = .003)
Calculated as proportion of
time in therapeutic range for
meta-analysis:
Treatment: 56.2% ±19.2 vs.
Control: 43.8% ±19.6%
No major adverse
events reported for
any participants
No major adverse events
reported for any
participants
INR > 3.5:
Treatment: 5/61 (8.2%)
vs. Control: 5/60 (8.3%)
No major
adverse events
reported for
any participants

WA – Health Technology Assessment March 6, 2018
Pharmacogenetic testing for patients treated with anticoagulants: Draft evidence report 102
Citation Time in Therapeutic Range Major bleeding Thromboembolic event INR ≥ 4 at any point Death
Jonas 201322 Proportion of time within the
therapeutic INR range (1.8 to
3.2 for patients with target
range of 2 to 3 and 2.3 to 3.7
for patients with target range
of 2.5-3.5) during first 90 days:
Treatment: 45% ±27% vs.
Control: 49% ±27%
(p = .59)
In this analysis, n = 53 for
treatment and n= 53 for
control
Major hemorrhagic
events (bleeding
requiring
hospitalization or
transfusion):
Treatment: 1/55
(1.8%) vs.
Control: 4/54
(7.4%)
(p = .17)
Thrombotic events (DVT,
pulmonary emboli, or
thromboembolic strokes
that developed or
progressed after warfarin
initiation):
Treatment: 0/55 (0.0%) vs.
Control: 3/54 (5.6%)
(p = .08)
INR > 4:
Treatment: 25/55
(44.6%) vs.
Control: 26/54 (49.1%)
(p = .65)
Deaths from
any cause:
Treatment: 0/55
(0.0%) vs.
Control: 2/54
(3.7%)
(p = .15)
Kimmel 201321 Proportion of time within the
therapeutic INR range (2 to 3)
during first 4 weeks (SD):
Treatment: 45.2% ±26.6 vs.
Control: 45.4% ±25.8
(AMD, −0.2; 95% CI, −3.4 to
3.1; p = .91)
In this analysis, n = 484 for
treatment and n = 471 for
control
Among Black patients:
Treatment: 35.2% vs.
Control: 43.5%
(AMD, −8.3%; p = .01).
Among non-Black patients:
Treatment: 48.8% vs.
Control: 46.1%
Major bleeding in
first 4 weeks:
Treatment: 4/514
(0.8%) vs. Control:
10/501 (2.0%)
(HR, 0.41; 95% CI,
0.13 to 1.31;
p = .013)
HR adjusted for
race and clinical
center
Major bleeding:
fatal hemorrhage,
intracranial
bleeding, or
symptomatic
bleeding requiring
overnight
Thromboembolism (DVT,
pulmonary embolism, or
embolic stroke) in first 4
weeks:,
Treatment: 5/514 (1.0%)
vs. Control: 4/501 (0.8%)
(HR, 1.27; 95% CI, 0.34 to
4.73; p = .72)
HR adjusted for race and
clinical center
INR ≥ 4 in first 4 weeks:
Treatment: 100/514
(19.5%) vs. Control:
92/501 (18.4%)
(HR, 1.08; 95% CI, 0.81 to
1.44; p = .59)
HR adjusted for race and
clinical center
Death from any
cause in first 4
weeks:
Treatment:
2/514 (0.4%) vs.
Control: 1/501
(0.2%)
(HR, 2.09;
95% CI, 0.19 to
23.22; p = .55)
HR adjusted for
race and clinical
center

WA – Health Technology Assessment March 6, 2018
Pharmacogenetic testing for patients treated with anticoagulants: Draft evidence report 103
Citation Time in Therapeutic Range Major bleeding Thromboembolic event INR ≥ 4 at any point Death
(AMD, 2.8%; p = .15)
From day 4 or 5 to day 14
(SD):
Treatment: 40.3 ±28.3 vs.
Control: 40.3 ±27.3
(MD, 0.1; 95% CI, −3.4 to 3.6;
p = .96)
From day 15 to day 28 (SD):
Treatment: 59.9 ±36.6 vs.
Control: 59.9 ±36.3
(MD, 0.0; 95% CI, -4.8 to 4.7;
p = .99)
hospitalization or
major therapeutic
intervention
Pengo 201530 Proportion of time within the
therapeutic INR range (2 to 3)
during first 19 days:
Treatment: 51.9% (95% CI,
48.4% to 55.5%) vs. Control:
53.2% (95% CI, 48.9% to
57.4%)
(p = .71)
SD back-calculated from CIs:
16.7 (intervention); 20.5
(control)
No major/minor
bleeding
complications
occurred
No major/minor
thromboembolic
complications occurred
INR > 4:
Treatment: 4/88 (4.5%;
95% CI, 1.3 % to 11.2%)
vs. Control: 8/92
(8.7%; 95% CI, 3.8% to
16.4%)
(p = NR)
Outcome not
reported
Pirmohamed
201326
Proportion of time within the
therapeutic INR range (2.0 to
3.0) during first 12 weeks (SD):
Treatment: 67.4% ±18.1% vs.
Control: 60.3% ±21.7%
Major bleeding:
Treatment: 0/211
(0.0%) vs. Control:
0/216 (0.0%)
Thromboembolic event
(indicating therapeutic
failure):
Treatment: 0/211 (0%) vs.
Control: 1/216 (0.5%)
INR ≥ 4:
Treatment: 57/211
(27.0%) vs. Control:
79/216 (36.6%)
(OR, 0.63; 95% CI, .41 to
0.97; p = .03)
Death from any
cause:
Treatment:
5/222 (2.3%) vs.
Control: 2/225
(0.9%)

WA – Health Technology Assessment March 6, 2018
Pharmacogenetic testing for patients treated with anticoagulants: Draft evidence report 104
Citation Time in Therapeutic Range Major bleeding Thromboembolic event INR ≥ 4 at any point Death
(adjusted difference, 7.0%;
95% CI, 3.3 to 10.6; p < .001)
Difference adjusted for center
and indication (atrial
fibrillation or venous
thromboembolism)
Note: these data used in
meta-analysis
Proportion of time within the
therapeutic INR range (2.0 to
3.0) during first 4 weeks (SD):
Treatment: 54.6% ±23.0% vs.
Control: 45.7% ±24.3%
(adjusted difference, 8.8%;
95% CI, 4.4 to 13.1; p < .001)
Major bleeding:
•Clinically overt
bleeding
associated with a
drop in
haemoglobin of
≥20g/l (≥2g/dl)
•Clinically overt
blood loss needing
transfusion of ≥2
units of whole
blood or
erythrocytes
•Bleeding involving
critical anatomical
sites: intracranial,
intraspinal,
intramuscular with
compartment
syndrome,
intraocular,
retroperitoneal,
pericardial, and
atraumatic intra-
articular bleeding
•Fatal bleeding
Wang 201225 Outcome not reported Outcome not
reported
Outcome not reported Outcome not reported Outcome not
reported
Wen 201729 Proportion of time within the
therapeutic INR range (2.0 to
3.0) during weeks 5 to 9 (SD):
Major bleeding:
Treatment (Taiwan
algorithm): 0/107
Thromboembolism:
Treatment (Taiwan
algorithm): 0/107 (0%) vs.
INR ≥ 4:
Treatment (Taiwan
algorithm): 20/107
Outcome not
reported

WA – Health Technology Assessment March 6, 2018
Pharmacogenetic testing for patients treated with anticoagulants: Draft evidence report 105
Citation Time in Therapeutic Range Major bleeding Thromboembolic event INR ≥ 4 at any point Death
Treatment (Taiwan algorithm):
53.0% ±33.8% vs.
Treatment (IWPC algorithm):
52.4% ±35.0% vs.
Control: 59.9% ±36.3%
(p = .24)
(0%) vs. Treatment
(IWPC algorithm):
0/107 (0%) vs.
Control: 1/104 (1%)
(p = .33)
Major bleeding
defined as
• Clinically overt
bleeding
associated with a
drop in
haemoglobin of
≥20g/l
• Clinically overt
blood loss needing
transfusion of ≥2
units of whole
blood or
erythrocytes
• Bleeding
involving critical
anatomical sites:
intracranial,
intraspinal,
intramuscular with
compartment
syndrome,
intraocular,
retroperitoneal,
pericardial, and
Treatment (IWPC
algorithm): 0/107 (0%) vs.
Control: 0/104 (0%)
(18.7%) vs. Treatment
(IWPC algorithm):
18/107 (16.8%) vs.
Control: 18/104 (17.3%)
(p = .93)

WA – Health Technology Assessment March 6, 2018
Pharmacogenetic testing for patients treated with anticoagulants: Draft evidence report 106
Citation Time in Therapeutic Range Major bleeding Thromboembolic event INR ≥ 4 at any point Death
atraumatic intra-
articular bleeding
• Fatal bleeding

WA – Health Technology Assessment March 6, 2018
Pharmacogenetic testing for patients treated with anticoagulants: Draft evidence report 107
Table 8. Evidence Table for Additional Outcomes (not included in meta-analysis)
Citation Adverse Events Days to Stable INR or Dose Days to Therapeutic INR or
Dose
Other Outcomes
Anderson
200727
Serious adverse clinical events:
Treatment: 4/101 (4.0%) vs.
Control: 5/99 (5.1%)
(OR, 0.78; 95% CI, 0.20 to 2.98;
p = .71)
Serious adverse clinical events
or INR ≥ 4:
Treatment: 34/101 (34.7%) vs.
Control: 42/99 (42.4%)
(OR, 0.72; 95% CI, 0.41 to 1.28;
p = .26)
Serious adverse clinical events
included use of vitamin K,
major bleeding events (after
the Thrombolysis in
Myocardial Infarction and
Columbus Investigators),
thromboembolic events,
stroke (all cause), myocardial
infarction, and death (all
cause).
Not reported Percentage of patients reaching
therapeutic INR on day 5:
Treatment: 69.7% vs. Control:
68.3% (OR, 1.07; 95% CI, 0.56 to
2.04; p = .85)
Percentage of patients reaching
therapeutic INR on day 8:
Treatment: 68.8% vs. Control:
63.0% (OR, 1.29; 95% CI, 0.71 to
2.36; p = .41)
Not reported

WA – Health Technology Assessment March 6, 2018
Pharmacogenetic testing for patients treated with anticoagulants: Draft evidence report 108
Citation Adverse Events Days to Stable INR or Dose Days to Therapeutic INR or
Dose
Other Outcomes
Borgman
201220
Not reported Days to first stable therapeutic
INR (INR remains within
acceptable range (INR 1.8 to 3.2)
for a minimum of 4 consecutive
days:
Treatment: 4.7 (95% CI, 3.5 to 8)
vs. Control: 8.3 (95% CI, 3.5 to
17.5; p = .0152)
Percentage of patients reaching
therapeutic INR by day 5:
Treatment: 69.2% vs.
Control: 38.5% (p = .1156)
Percentage of patients reaching
therapeutic INR by day 8:
Treatment: 100% vs.
Control: 61.5%
(p = .0128)
Not reported
Burmester
20117
Not reported Median days to stable dose in
therapeutic range:
Treatment: 29 (95% CI, 23 to 36)
vs. Control: 31 (95% CI, 24 to 36)
(p = .90)
Not reported Proportion of time within
the therapeutic INR
range during the first 14
days, interpolated INR
between two consecutive
tests and weighted
proportionately by how
close the INR was to
target (SD):
Treatment: 1.21 ±0.12 vs.
Control: 1.20 ±0.15
(p = .891)
Caraco
200824
Not reported Mean days required to reach
stable anticoagulation:
Treatment: 22.1 ±6.9 vs.
Control: 40.2 ±21.1
(HR, 4.23; 95% CI, 2.95 to 6.07; p
< .001)
Mean days required to reach the
therapeutic INR range (i.e., first
INR > 2) (SD):
Treatment: 4.80 ±1.46 vs.
Control: 7.53 ±3.06
(p < .001)
Not reported

WA – Health Technology Assessment March 6, 2018
Pharmacogenetic testing for patients treated with anticoagulants: Draft evidence report 109
Gage 201731 Composite outcome--Major
bleeding, INR ≥ 4, venous
thromboembolism, or death
within 30 days:
Treatment: 87/808 (10.8%) vs.
Control: 116/789 (14.7%)
(absolute difference, 3.9%;
95% CI, 0.7% to 7.2%; p = .02;
RR, 0.73; 95% CI, 0.56 to 0.95)
In the high-risk subgroup
(n = 658; 41.2% of
participants):
Treatment: 11.5% vs.
Control: 15.2%
(absolute difference of 3.76%
(95% CI, –9.0% to 1.5%;
p = .16)
No significant interaction in
any of the subgroups
examined on the composite
outcome:
High-risk subgroup-patients
whose clinically guided vs
genotype-predicted warfarin
doses differed by 1.0mg/d or
greater (p = .88)
Black race (p = .74)
CYP2C9 genotype (p = .16)
Target INR of 1.8 vs. 2.5 (p =
.70)
Not reported Not reported Not reported

WA – Health Technology Assessment March 6, 2018
Pharmacogenetic testing for patients treated with anticoagulants: Draft evidence report 110
Citation Adverse Events Days to Stable INR or Dose Days to Therapeutic INR or
Dose
Other Outcomes
Hip vs. knee arthroplasty (p =
.36)
Composite outcome--Major
bleeding, INR ≥ 4, venous
thromboembolism, or death
within 90 days:
Treatment: 90/808 (11.1%) vs.
Control: 119/789 (14.1%)
(absolute difference, 3.9%;
95% CI, 0.6% to 7.3%; p = .02)
Risk of an INR exceeding
target INR by 1.5 or greater:
(HR, 0.78; 95% CI, 0.59 to 1.03;
log-rank test p = .08)
Cardiovascular event
(Myocardial infarction, stroke,
atrial fibrillation):
Treatment: 10/808 (1.2%) vs.
Control: 13/789 (1.6%)
(p = .49)
Serious infection:
Treatment: 15/808 (1.9%) vs.
Control: 12/789 (1.5%)
(p = .93)

WA – Health Technology Assessment March 6, 2018
Pharmacogenetic testing for patients treated with anticoagulants: Draft evidence report 111
Citation Adverse Events Days to Stable INR or Dose Days to Therapeutic INR or
Dose
Other Outcomes
Hillman
200523
Not reported Not reported Not reported Not reported
Huang
200928
Adverse outcome (INR > 3.5,
bleeding, or venous
thrombosis):
Treatment: 7/61 (11.5%) vs.
Control: 8/60 (13.3%)
(p = .757)
Median days to reach stable
warfarin dose:
Treatment: 24 vs.
Control: 35 (p = .001)
Not reported Not reported
Jonas 201322 Not reported Not reported Proportion of patients reaching
therapeutic INR by day 30 (SD):
Treatment: 11% ±20.0% vs.
Control: 15% ±27.8%
(p = .34)
Proportion of patients reaching
therapeutic INR by day 90 (SD):
Treatment: 21% ±38.2 vs.
Control: 26% ±48.2%
(p = .3)
Mean days to therapeutic dose
(SD):
Treatment: 34.7 ±24.8 vs.
Control: 35.9 ±28.1
(p = .87)
Not reported
Kimmel
201321
INR ≥ 4, major bleeding, or
thromboembolism in the first 4
weeks:
Not reported Proportion of patients to first
therapeutic INR within 14 days:
Not reported

WA – Health Technology Assessment March 6, 2018
Pharmacogenetic testing for patients treated with anticoagulants: Draft evidence report 112
Citation Adverse Events Days to Stable INR or Dose Days to Therapeutic INR or
Dose
Other Outcomes
Treatment: 154/514 (30%) vs.
Control: 170/501 (34%)
(HR, 0.91; 95% CI, 0.73 to 1.1;
p = .42)
Treatment: 0.81 (95% CI, 0.77 to
0.84) vs.
Control: 0.85 (95% CI, 0.81 to
0.88)
(HR, 0.94; 95% CI, 0.82 to 1.1; p =
.36)
Pengo
201530
Proportion of time spent at
INR > 4.0:
Treatment: 0.7% vs.
Control: 1.8%
(p = .02)
Proportion of out-of-range
INRs (<2.0 or >3.0) in first 19
days:
Treatment: 45.1% (95% CI,
40.4% to 49.7%) vs.
Control: 43.6% (95% CI, 38.7%
to 48.6%)
(p = .79)
Mean days to stable
anticoagulation (first INR in a
series of 3 INR within the
therapeutic range):
Treatment: 5.96 (95% CI, 5.00 to
9.93) vs.
Control: 5.05 (95% CI, 4.24 to
5.86)
(p = .28)
Proportion of patients reaching
therapeutic INR by day 19:
Treatment: 60/88 (68.2%) vs.
Control: 60/92 (65.2%)
(p = .67)
Not reported
Pirmohamed
201326
Any serious adverse event:
Treatment: 15/222 (6.8%) vs.
Control: 23/225 (10.2%)
Median days to stable dose:
Treatment: 44 vs.
Control: 59 (HR, 1.40; 95% CI,
1.12 to 1.74; p = .003)
Median days to reach therapeutic
INR:
Treatment: 21 vs.
Control: 29 (HR, 1.43 95% CI,
1.17 to 1.76; p < .001)
Proportion of time within
the therapeutic INR
range (2.0 to 3.0) during
weeks 9 to 12 (SD):
Treatment: 74.5%
±25.2% vs. Control:
72.9% ±29.8% (adjusted
difference, 1.4%; 95% CI,
–3.8 to 6.6; p = .61)

WA – Health Technology Assessment March 6, 2018
Pharmacogenetic testing for patients treated with anticoagulants: Draft evidence report 113
Citation Adverse Events Days to Stable INR or Dose Days to Therapeutic INR or
Dose
Other Outcomes
Wang
201225
Adverse events (bleeding,
venous thrombosis, or INR
over 3.5) during 50-day of
follow-up:
Treatment: 10.0% vs.
Control: 15.7% (p = .55)
Mean days to stable warfarin
maintenance dose (dose that led
to the patient’s INR values within
the therapeutic range measured
at least 7 days) (SD):
Treatment: 27.5 ±1.8 vs.
Control: 34.7 ±1.8
(p < .001)
Median days to stable warfarin
maintenance dose:
Treatment: 24.0 ±1.7 vs.
Control: 33.0 ±4.5
(p < .001)
Not reported Not reported
Wen 201729 Not reported Median days to stable
therapeutic dose (days to first of
two consecutive INRs in the
therapeutic range without dose
adjustment, measured at least 1
week apart):
Treatment (Taiwan algorithm):14
vs.
Treatment (IWPC algorithm): 14
vs.
Control: 11
(p = .03); significant difference
between the International
Warfarin Pharmacogenetic
Median days to reach therapeutic
INR (days to reach first of two INR
value ranges that were measured
at least 1 week apart within the
target range):
Treatment (Taiwan algorithm): 17
vs.
Treatment (IWPC algorithm): 17
vs.
Control: 11
(p = .35)
Not reported

WA – Health Technology Assessment March 6, 2018
Pharmacogenetic testing for patients treated with anticoagulants: Draft evidence report 114
Citation Adverse Events Days to Stable INR or Dose Days to Therapeutic INR or
Dose
Other Outcomes
Consortium group and the
standard dose group

WA – Health Technology Assessment March 6, 2018
Pharmacogenetic testing for patients treated with anticoagulants: Draft evidence report 115
Table 9. Evidence Table for Economic Outcomes
Citation
Test
Design
Comparators
Population
Analytic Assumptions
Main Findings
Eckman 200934
CYP2C9*2,
CYP2C9*3,
and/or
VKORC1
Design:
Cost-
effectiveness
analysis using
Markov state
transition
decision model
Comparator:
Standard
induction of
warfarin therapy
Population:
Men age 69 years with newly diagnosed nonvalvular
AFib requiring initiation of warfarin therapy and
having no contraindications to warfarin therapy
Analytic assumptions:
Societal perspective
Lifetime time horizon
Costs in 2007 U.S. dollars
Annual discount rate 3%
RR for major bleeding in pharmacogenetic group
0.68 compared to standard dosing group, only
during the first month of warfarin induction
Patients in pharmacogenetic group reached
therapeutic INR an average of 2.7 days earlier (4.8
days vs. 7.5 days)
Cost of testing $400
3-day delay in initiating warfarin after
pharmacogenetic testing
Medical costs from average Medicare
reimbursement for the corresponding CPT or DRG
Incremental cost-effectiveness ratio of
pharmacogenetic testing:
$171,800 per QALY
10% chance that genotype-guided dosing is
likely to be cost-effective (< $50,000 per QALY)
Marginal cost-effectiveness ratio of
pharmacogenetic testing decreases to $116,000
per QALY if no delay in initiating treatment,
compared to the assumption of a 3-day delay
For genetic testing to cost less than $50,000 per
QALY, it would have to be either restricted to
patients at high risk for hemorrhage, or testing
must prevent greater than 32% of major bleeding
events, be available within 24 hours, and cost less
than $200
Meckley
201036
Design:
Decision-analytic
Markov model
using Tree-Age
software
Comparator:
Population:
65-year-old AFib patients newly initiated on long-
term warfarin therapy
Analytic assumptions:
US third-party payer perspective
Lifetime time horizon
Incremental cost-effectiveness ratio of
pharmacogenetic testing:
$60,725 per QALY
In sensitivity analysis, cost per QALY ranged from
testing dominating to standard care dominating,
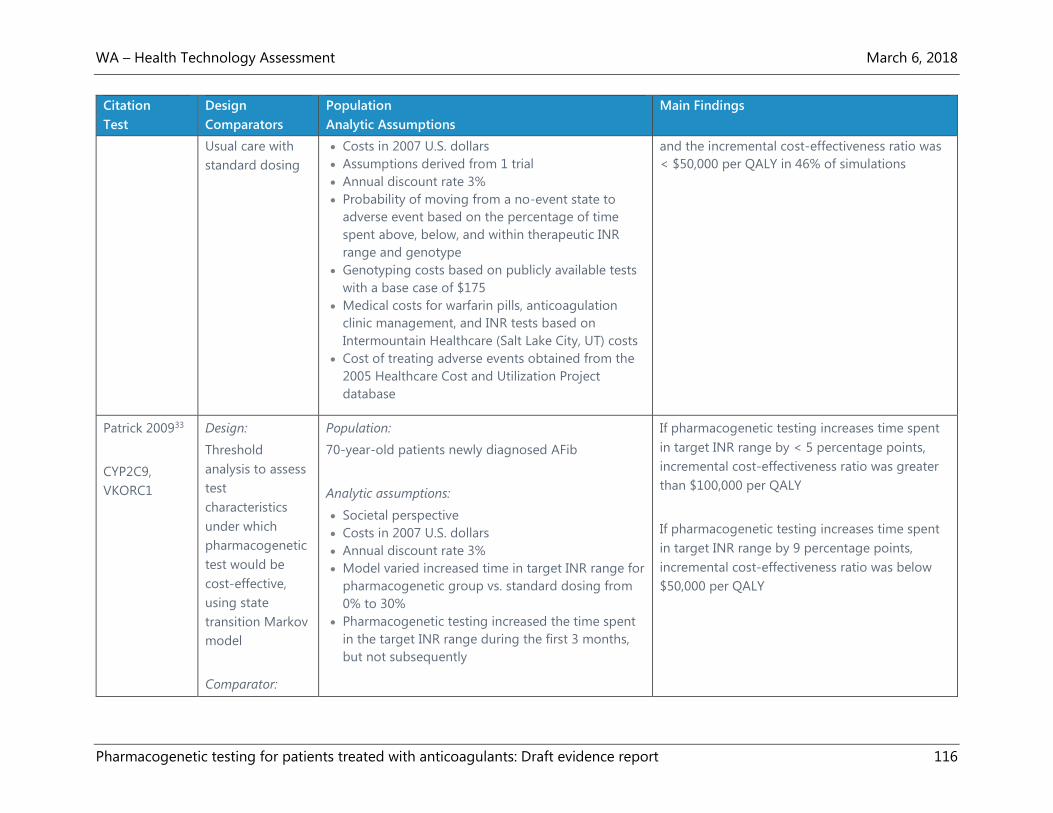
WA – Health Technology Assessment March 6, 2018
Pharmacogenetic testing for patients treated with anticoagulants: Draft evidence report 116
Citation
Test
Design
Comparators
Population
Analytic Assumptions
Main Findings
Usual care with
standard dosing
Costs in 2007 U.S. dollars
Assumptions derived from 1 trial
Annual discount rate 3%
Probability of moving from a no-event state to
adverse event based on the percentage of time
spent above, below, and within therapeutic INR
range and genotype
Genotyping costs based on publicly available tests
with a base case of $175
Medical costs for warfarin pills, anticoagulation
clinic management, and INR tests based on
Intermountain Healthcare (Salt Lake City, UT) costs
Cost of treating adverse events obtained from the
2005 Healthcare Cost and Utilization Project
database
and the incremental cost-effectiveness ratio was
< $50,000 per QALY in 46% of simulations
Patrick 200933
CYP2C9,
VKORC1
Design:
Threshold
analysis to assess
test
characteristics
under which
pharmacogenetic
test would be
cost-effective,
using state
transition Markov
model
Comparator:
Population:
70-year-old patients newly diagnosed AFib
Analytic assumptions:
Societal perspective
Costs in 2007 U.S. dollars
Annual discount rate 3%
Model varied increased time in target INR range for
pharmacogenetic group vs. standard dosing from
0% to 30%
Pharmacogenetic testing increased the time spent
in the target INR range during the first 3 months,
but not subsequently
If pharmacogenetic testing increases time spent
in target INR range by < 5 percentage points,
incremental cost-effectiveness ratio was greater
than $100,000 per QALY
If pharmacogenetic testing increases time spent
in target INR range by 9 percentage points,
incremental cost-effectiveness ratio was below
$50,000 per QALY

WA – Health Technology Assessment March 6, 2018
Pharmacogenetic testing for patients treated with anticoagulants: Draft evidence report 117
Citation
Test
Design
Comparators
Population
Analytic Assumptions
Main Findings
Usual care with
standard dosing
Patients assumed to have major bleeding events at
rates predicted by their INRs, based on previous
studies
Cost of testing $475, plus $100 for phlebotomy and
record-keeping
Hospitalization costs calculated from the
Nationwide Inpatient Sample; physician service
costs were estimated from payment rates from the
Medicare Physician Fee Schedule
Pink 200332 Design:
Cost-
effectiveness
analysis from a
discrete-event
simulation model
Comparator:
Standard clinical
algorithms
Population:
Patients with nonvalvular Afib; baseline characteristics
assumed to follow the average profile of the UK Afib
population
Analytic assumptions:
Perspective of UK National Health Service
Lifetime time horizon
Costs in 2011 Great Britain Pound
Annual discount rate 3.5%
Pharmacogenetic testing increased the time spent
in the target INR range during the first 3 months,
but not subsequently
Costs based on National Health Service reference
costs
Incremental cost-effectiveness ratio for
pharmacogenetic testing:
£13,226 per QALY
Incremental cost-effectiveness ratios most
sensitive to changes in stroke rates, vascular
death rates, and the duration of treatment
benefits
Verhoef
201635
Design:
Cost-
effectiveness
analysis using
Markov model
Population:
Hypothetical cohort of patients with AFib initiating
warfarin treatment with mean age 70.9 years for UK
and 72.5 for Sweden
Incremental cost-effectiveness ratio of
pharmacogenetic testing:
£6,702 per QALY and 253,848 SEK per QALY

WA – Health Technology Assessment March 6, 2018
Pharmacogenetic testing for patients treated with anticoagulants: Draft evidence report 118
Citation
Test
Design
Comparators
Population
Analytic Assumptions
Main Findings
using Microsoft
Excel
Comparator:
Usual care with
standard dosing
Analytic assumptions:
Perspectives of the National Health Service in the
UK and health-care sector in Sweden
Coasts in 2014 GBP (£) and Swedish krona (SEK)
Lifetime time horizon
Annual discount rate 3.5% for UK and 3% for
Sweden (in accordance with national guidelines)
Test cost £35.03 for UK and SEK440 for Sweden
Clinical assumptions from the EU-PACT study26
which set base case PTTR at 7%
Incremental cost-effectiveness ratio was below
the willingness-to-pay threshold of £20,000 per
QALY gained in 93% of the simulations in UK and
below 500,000 SEK per QALY in 67% of the
simulations in Sweden

WA – Health Technology Assessment March 6, 2018
Pharmacogenetic testing for patients treated with anticoagulants: Draft evidence report 119
Appendix D. Risk of Bias Assessments
Table 10. Risk of Bias: Randomized Controlled Trials
Citation Randomization Allocation
Concealment
Intervention Outcomes Masking of
Investigators
&
Participants
Masking
of
Outcome
Assessors
Intention
to Treat
Analysis
Statistical
Analysis
Other
Biases
Interest
Disclosure
Funding
Source
Overall Risk of Bias
Assessment
Comments
Anderson
200727
Y N Y Y Y Unclear Y Unclear -- Y Y Moderate
Inadequate allocation
concealment
Unclear masking of outcome
assessment
Unclear description of the
statistical analysis.
Borgman
201220
Unclear N Y Y N Unclear Unclear N N* N Y High
Some authors with equity
interest in the test provider
Unclear randomization
Inadequate allocation
concealment
Lack of masking
Inadequate statistical analysis
Burmester
20117
Y Y Y Y Y Y Y N -- N Unclear Moderate
Partial funding from a test
manufacturer
Authors were patent holders
for technology involved in
the genomic test

WA – Health Technology Assessment March 6, 2018
Pharmacogenetic testing for patients treated with anticoagulants: Draft evidence report 120
Citation Randomization Allocation
Concealment
Intervention Outcomes Masking of
Investigators
&
Participants
Masking
of
Outcome
Assessors
Intention
to Treat
Analysis
Statistical
Analysis
Other
Biases
Interest
Disclosure
Funding
Source
Overall Risk of Bias
Assessment
Comments
Inadequate statistical analysis
description
Caraco
200824
N N Unclear Y Y N Unclear N -- Y Y High
Using pseudo-randomization
Inadequate allocation
concealment and statistical
analysis description
Lack of outcome assessor
masking
Gage
201731
Y Y Y Y Y Y Y Y -- N Y Low
Several authors had
commercial research funding
and other income
GenMarkDx loaned
genotyping platform to the
central laboratory involved in
the study
Hillman
200523
Unclear Unclear Y Y N N N Y N* Unclear Y High
No interests disclosure
Unclear randomization and
allocation concealment
Lack of masking
Mid-study protocol changes

WA – Health Technology Assessment March 6, 2018
Pharmacogenetic testing for patients treated with anticoagulants: Draft evidence report 121
Citation Randomization Allocation
Concealment
Intervention Outcomes Masking of
Investigators
&
Participants
Masking
of
Outcome
Assessors
Intention
to Treat
Analysis
Statistical
Analysis
Other
Biases
Interest
Disclosure
Funding
Source
Overall Risk of Bias
Assessment
Comments
Huang
200928
Unclear Unclear Unclear Y N N N Y -- Unclear Y High
No interests disclosure
Unclear randomization and
allocation concealment
Inadequate detail about the
genetic dosing protocol
Lack of masking
Jonas
201322
Y Y Y Y Y Y Y Y -- Y Y Low
Kimmel
201321
Y Y Y Y Y Y Y Y -- N Y Low
Several authors had research
grants, consulting contracts
or equity interests with
commercial entities
Pengo
201530
Y Unclear Y Y N N Y Y -- Y Y Moderate
Unclear allocation
concealment
Lack of masking
Pirmohamed
201326
Y Unclear Y Y N N Y Y -- ? Y Moderate
Unclear allocation
concealment
Lack of masking

WA – Health Technology Assessment March 6, 2018
Pharmacogenetic testing for patients treated with anticoagulants: Draft evidence report 122
Citation Randomization Allocation
Concealment
Intervention Outcomes Masking of
Investigators
&
Participants
Masking
of
Outcome
Assessors
Intention
to Treat
Analysis
Statistical
Analysis
Other
Biases
Interest
Disclosure
Funding
Source
Overall Risk of Bias
Assessment
Comments
Wang
201225
Y Unclear Y Y N N Y Y -- Y Unclear High
No interests disclosure
Unclear allocation
concealment
Lack of masking
Wen
201729
Y Unclear Y Y N N Y Y -- N Y High
One author holds European
patent for a VKORC1 gene
test
Unclear allocation
concealment
Inadequate detail about the
genetic dosing protocol
Lack of masking

WA – Health Technology Assessment March 6, 2018
Pharmacogenetic testing for patients treated with anticoagulants: Draft evidence report 123
Table 11. Risk of Bias: Economic Studies
Part 1
Citation Target
Population
Perspective Time Horizon Discount Rate Comparators Modeling Effectiveness
Eckman 200934 N Y Y Y Y Y Unclear
Meckley 201036 N Y Y Y Y Y Unclear
Patrick 200933 N Y Y Y Y Y Unclear
Pink 201332 Y Y Y Y Y Y Unclear
Verhoef 201635 Y Y Y Y Y Unclear Unclear
Part 2
Citation Outcomes Resource
Use/Costs
Uncertainty Results Interest
Disclosure
Funding
Source
Overall Risk of Bias Assessment
Comments
Eckman
2009
N N Y N Y Y High
One author had consultancy with Bristol-Myers Squibb
Inadequate evidence base for model assumptions
Model used base case of 69-year-old man with newly
diagnosed AFib
Meckley
2010
Unclear Y Y Unclear Y Y High
Inadequate evidence base for model assumptions
Model used base case of 65-year-old man with newly
initiated warfarin therapy

WA – Health Technology Assessment March 6, 2018
Pharmacogenetic testing for patients treated with anticoagulants: Draft evidence report 124
Citation Outcomes Resource
Use/Costs
Uncertainty Results Interest
Disclosure
Funding
Source
Overall Risk of Bias Assessment
Comments
Patrick
2009
Unclear Y Y Unclear Y Y Moderate
Inadequate evidence base for model assumptions
Model used base case of 70-year-old man with newly
diagnosed AFib
Pink
2013
Y Unclear Y N Y Y Moderate
Inadequate evidence base for model assumptions
Costing was performed from the perspective of the UK
National Health Service
Verhoef
2016
Unclear Unclear Y Unclear Y Y Moderate
Inadequate evidence base for model assumptions

WA – Health Technology Assessment March 6, 2018
Pharmacogenetic testing for patients treated with anticoagulants: Draft evidence report 125
Table 12. Risk of Bias: Guidelines
Citation Scope
&
Purpose
Rigor of
Evidence
Development
Rigor of
Recommendations
Development
Stakeholder
Involvement
Clarity &
Presentation
Applicability &
Implementation
Editorial
Independence
Overall
Assessment
Comments
CADTH
201337
Good Good Good Fair Good Good Good Good
Holbrook
201240
Good Good Good Fair Good Good Fair Good
January
201438
Fair Poor Poor Fair Fair Good Fair Poor
Johnson
20178
Fair Poor Poor Poor Fair Fair Poor Poor
Nishimura
201739
Fair Poor Fair Fair Fair Fair Fair Poor
SIGN
201341
Good Good Good Good Good Good Fair Good
Shaw
201546
Good Fair Poor Good Fair Fair Good Poor
Tran
201442
Good Poor Poor Fair Fair Fair Poor Poor

WA – Health Technology Assessment March 6, 2018
Pharmacogenetic testing for patients treated with anticoagulants: Draft evidence report 126
Appendix E. Additional Meta-analysis Figures
Figure 22. Funnel Plot of Eligible Randomized Controlled Trials for INR ≥4
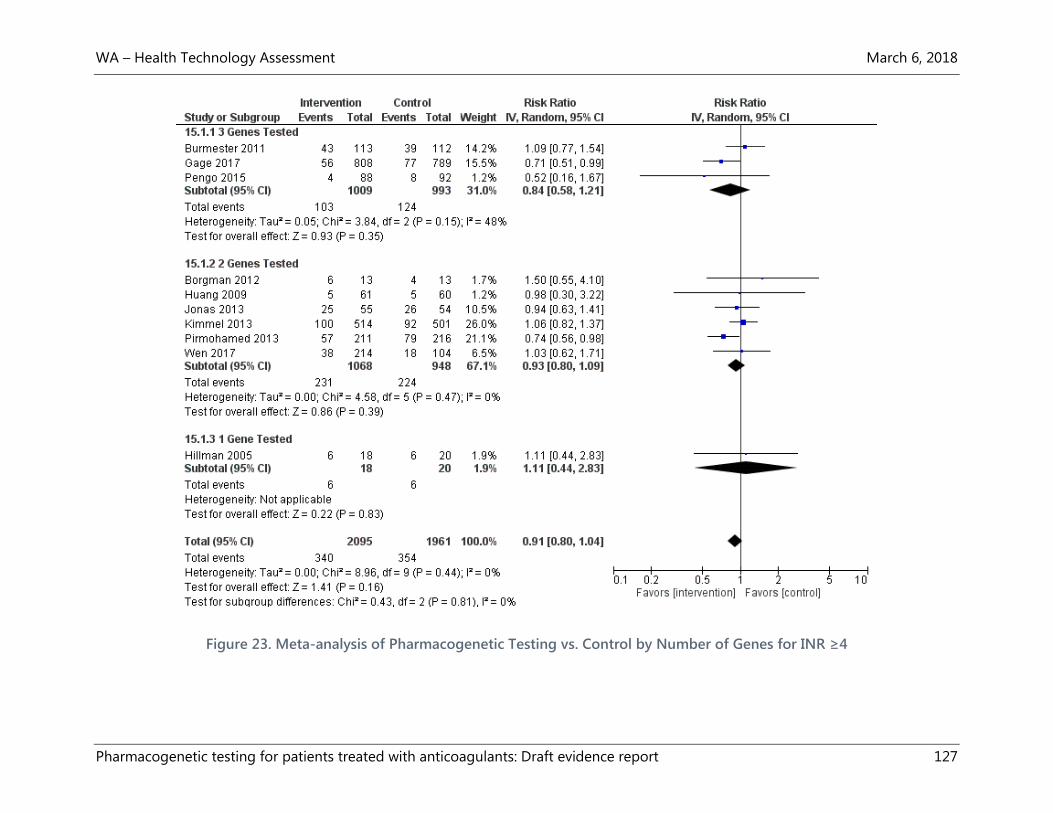
WA – Health Technology Assessment March 6, 2018
Pharmacogenetic testing for patients treated with anticoagulants: Draft evidence report 127
Figure 23. Meta-analysis of Pharmacogenetic Testing vs. Control by Number of Genes for INR ≥4

WA – Health Technology Assessment March 6, 2018
Pharmacogenetic testing for patients treated with anticoagulants: Draft evidence report 128
Figure 24. Meta-analysis of Pharmacogenetic Testing vs. Control by Race for INR ≥4

WA – Health Technology Assessment March 6, 2018
Pharmacogenetic testing for patients treated with anticoagulants: Draft evidence report 129
Figure 25. Meta-analysis of Pharmacogenetic Testing vs. Control by Sample Size for INR ≥4

WA – Health Technology Assessment March 6, 2018
Pharmacogenetic testing for patients treated with anticoagulants: Draft evidence report 130
Figure 26. Meta-analysis of Pharmacogenetic Testing vs. Control by Follow-up for INR ≥4

WA – Health Technology Assessment March 6, 2018
Pharmacogenetic testing for patients treated with anticoagulants: Draft evidence report 131
Figure 27. Meta-analysis of Pharmacogenetic Testing vs. Control by Risk of Bias for INR ≥4

WA – Health Technology Assessment March 6, 2018
Pharmacogenetic testing for patients treated with anticoagulants: Draft evidence report 132
Figure 28. Funnel Plot of Eligible Randomized Controlled Trials for PTTR

WA – Health Technology Assessment March 6, 2018
Pharmacogenetic testing for patients treated with anticoagulants: Draft evidence report 133
Appendix F. GRADE Quality of Evidence
Number of Studies Risk of Bias Inconsistency Indirectness Imprecision Publication
Bias
Comments Overall Quality
of Evidence
Rating
Outcome: Clinical Utility—Mortality
7 RCTs (4 with
events)
Low
-1 0 -1 0 Overall analysis has
wide CI that includes
effect and no effect;
subgroup analysis by
comparator has
opposite effects
indicating clinical
heterogeneity
Low
●●◌◌
Outcome: Clinical Utility—Major Bleeding
11 RCTs (7 with
events)
Low 0 0 -1 0 Subgroup analysis by
comparator indicates
either
pharmacogenetically
guided- or clinical
algorithm-guided
dosing, but that
pharmacogenetically
guided dosing results
in 61% fewer bleeding
events compared to
clinical algorithm
Moderate
●●●◌
Outcome: Clinical Utility—Thromboembolic Events
11 RCTs (6 with
events)
Low 0 -1 0 0 ROB low due to large
weight of Gage et al.
(81%) for pooled
estimate; indirectness
because of
Moderate
●●●◌

WA – Health Technology Assessment March 6, 2018
Pharmacogenetic testing for patients treated with anticoagulants: Draft evidence report 134
Number of Studies Risk of Bias Inconsistency Indirectness Imprecision Publication
Bias
Comments Overall Quality
of Evidence
Rating
heterogeneity in
outcome assessment
Outcome: Clinical Utility—INR ≥4
10 RCTs Low 0 -2 0 0 Outcome is indirect
measure of harm and
differing definitions
and differing follow-up
time periods
Low
●●◌◌
Outcome: Clinical Utility—Time in Therapeutic Range
12 RCTs
Low -1 -1 0 0 Outcome is indirect
measure of harm;
imprecision of
individual trial
estimates and clinical
heterogeneity because
of different
comparators and
varying lengths of
follow-up
Low
●●◌◌
Outcome: Cost-Effectiveness and Economic Outcomes
5 modeling studies Moderate -1 -2 0 0 Cost/QALY estimates
are both above and
below generally
accepted thresholds
with U.S.- and non-
U.S.-based models
differing in results;
models do not include
estimates of efficacy
Very low
●◌◌◌

WA – Health Technology Assessment March 6, 2018
Pharmacogenetic testing for patients treated with anticoagulants: Draft evidence report 135
Number of Studies Risk of Bias Inconsistency Indirectness Imprecision Publication
Bias
Comments Overall Quality
of Evidence
Rating
from recent RCTs;
older U.S.-based
studies lack
applicability to present
day costs of inputs and
outcomes

WA – Health Technology Assessment March 6, 2018
Pharmacogenetic testing for patients treated with anticoagulants: Draft evidence report 136
Appendix G. Studies Registered at ClinicalTrials.gov
Registered
Clinical Trial
Number
Title of Study Study Completion
Date (from
https://clinical
trials.gov/
Status of
publications and
whether study
eligible for possible
inclusion in
systematic review
NCT00247702
(Taiwan)
The Association of Warfarin Dosage and
Plasma Enantiomer Concentration With
the Gene Polymorphisms of CYP and
VKOR
June 2006 No published study;
no outcome of
interest and no
comparator
NCT00377143
(U.S.)
PRospective Evaluation Comparing
Initiation of Warfarin StrategiEs
(PRECISE): Pharmacogenetic-guided
Versus Usual Care
August 2006
Withdrawn (due to
similar large study
planned by NHLBI)
NCT00334464
(U.S.)
A Pharmacogenetic Study of Warfarin
Dosing, "The COUMA-GEN Study" November 2007 Published study
included in review27
NCT00484640
(U.S.)
Modeling Genotype and Other
Factors to Enhance the Safety of
Coumadin Prescribing
May 2008 Published study
included in review7
NCT00634907
(U.S.)
Prospective Genotyping For Total Hip or
Knee Replacement Patients Receiving
Warfarin (Coumadin)
October 2008 Published study
excluded from
review due to not
being an RCT76
NCT00511173
(U.S.)
Comparison of Warfarin Dosing Using
Decision Model Versus Pharmacogenetic
Algorithm
November 2008 No published study;
RCT would likely be
included in review
NCT00830570
(U.S.)
The Clinical and Economic Impact of
Pharmacogenomic Testing of Warfarin
Therapy in Typical Community Practice
Settings (MHSMayoWarf1)
January 2010 Published study
excluded from
review due to not
pertaining to an
intervention of
interest77
NCT01178502
(South Korea)
PGx Study to Develop and Validate the
Predictive Warfarin Dosing Algorithm for
Personalized Warfarin Pharmacotherapy
April 2010 No published study;
not an RCT

WA – Health Technology Assessment March 6, 2018
Pharmacogenetic testing for patients treated with anticoagulants: Draft evidence report 137
Registered
Clinical Trial
Number
Title of Study Study Completion
Date (from
https://clinical
trials.gov/
Status of
publications and
whether study
eligible for possible
inclusion in
systematic review
NCT00993200
(U.S.)
PerMIT: Warfarin : A Prospective
Randomized Controlled Trial Comparing
Usual Care Warfarin Initiation to PerMIT
Pharmacogenetic Guided Warfarin
Therapy
December 2010 Published study
included in review20
NCT01520402
(U.S.)
Genetic Response to Warfarin in Healthy
Subjects
May 2011 Published study
excluded from
review due to not
including an
intervention of
interest78
NCT00927862
(U.S.)
Applying Pharmacogenetic Algorithms to
Individualize Dosing of Warfarin
(Coumagen-II)
June 2011 Published study
excluded from
review due to lack of
comparator72
NCT00654823
(Israel)
Pharmacogenetic Study of Warfarin
Dose-Response: a Prospective Trial
(PGxWarfarin)
June 2011 No published study;
not an RCT and no
outcome of interest
NCT00904293
(U.S.)
Genotype-Guided Warfarin Therapy Trial
(WARFPGX)
January 2012 Published study
included in review22
NCT01178034
(Italy)
Early Identification of Warfarin
Maintenance Dosage
October 2012 Published study
included in review30
NCT00970892
(Turkey)
VKORC1 and CYP2C9 Gene
Polymorphisms and Warfarin
Management
December 2012 No published study;
not an RCT
NCT00839657
(U.S.)
Clarification of Optimal
Anticoagulation Through Genetics
(COAG)
April 2013 Published study
included in review21
NCT01119274
(Germany)
EUropean Pharmacogenetics of
AntiCoagulant Therapy -
Phenprocoumon (EU-PACT)
April 2013 Published studies
excluded from
review due to no
intervention of
interest79,80

WA – Health Technology Assessment March 6, 2018
Pharmacogenetic testing for patients treated with anticoagulants: Draft evidence report 138
Registered
Clinical Trial
Number
Title of Study Study Completion
Date (from
https://clinical
trials.gov/
Status of
publications and
whether study
eligible for possible
inclusion in
systematic review
NCT01447511
(U.S.)
Pharmacogenetics of Warfarin Induction
and Inhibition
June 2013 No published study;
not an RCT and no
comparator
NCT01119261
(Germany)
EUropean Pharmacogenetics of
AntiCoagulant Therapy - Acenocoumarol
(EU-PACT)
June 2013 Two published
studies excluded
from review because
drug not approved
for use in the
U.S.79,80
NCT01119300
(Germany)
EUropean Pharmacogenetics of
AntiCoagulant Therapy - Warfarin (EU-
PACT)
October 2013 Published study
included in review26
NCT03015025
(Bolivia)
Creation and Validation of a
Pharmacogenetic Dosage Algorithm for
Acenocoumarol in Patients With Venous
Thromboembolic Disease, Atrial
Fibrillation and/or Mechanical Valvular
Heart Prosthesis
October 2013 No published study;
pharmacologic
testing for a drug
not approved for
use in the U.S. and
not an RCT
NCT02065388
(Taiwan)
Pharmacogenetic Dosing of Warfarin December 2013 Published study
included in review29
NCT01855737
(China)
The Study of Warfarin Maintenance Dose
in Chinese Patients (WADCH)
January 2014 No published study;
no outcome of
interest
NCT01318057
(Puerto Rico)
Pharmacogenetics of Warfarin in Puerto
Ricans.
July 2014 No published study;
not an RCT
NCT01610141
(China)
Applying Pharmacogenetics to Warfarin
Dosing in Chinese Patients
June 2015 Published study
excluded from
review due to no
outcome of
interest81

WA – Health Technology Assessment March 6, 2018
Pharmacogenetic testing for patients treated with anticoagulants: Draft evidence report 139
Registered
Clinical Trial
Number
Title of Study Study Completion
Date (from
https://clinical
trials.gov/
Status of
publications and
whether study
eligible for possible
inclusion in
systematic review
NCT01305148
(U.S.)
Warfarin Adverse Event Reduction For
Adults Receiving Genetic Testing at
Therapy INitiation (WARFARIN)
(WARFARIN)
December 2015
Suspended
(Sponsor is raising
funds for the
remainder of the
study)
No published study;
RCT would likely be
included in review
NCT02710747
(China)
The Pharmacogenetics of Optimal
Warfarin Therapy in Chinese Patients
After Heart Valve Replacement. (POWAT)
July 2016 No published study;
RCT would likely be
included in review
NCT01633957
(China)
A Trial of Genotype-based Warfarin
Initiation in Patients With Mechanical
Prosthetic Heart Valve (SYSU-WARFA)
August 2016 No published study;
RCT would likely be
included in review
NCT01006733
(U.S.)
Genetics Informatics Trial (GIFT) of
Warfarin to Prevent DVT (GIFT) November 2016 Published study
included in review31
NCT02211326
(China)
Genotype-guided Warfarin Individualized
Treatment May 2017 No published study;
RCT would likely be
included in review
NCT00700895
(Singapore)
Assessing the Clinical Benefits of a
Pharmacogenetics-Guided Dosing
Regimen for Calculating Warfarin
Maintenance Dose
August 2017 No published study;
no outcome of
interest
NCT02297126
(U.S.)
A Prospective Trial to Assess Cost and
Clinical Outcomes of a Clinical
Pharmacogenomic Program (INGenious)
June 2018 No published study;
RCT and economic
study might be
eligible for inclusion
in review
NCT02069132
(Italy)
Validation of International Warfarin
Pharmacogenetics Consortium (IWPC)
Algorithm in Elderly Patients With
Comorbidity (VIALE)
June 2018 No published study;
not an RCT

WA – Health Technology Assessment March 6, 2018
Pharmacogenetic testing for patients treated with anticoagulants: Draft evidence report 140
Registered
Clinical Trial
Number
Title of Study Study Completion
Date (from
https://clinical
trials.gov/
Status of
publications and
whether study
eligible for possible
inclusion in
systematic review
NCT03161496
(China)
A Research in Pharmacogenomics and
Accurate Medication of Novel Oral
Anticoagulants
December 2018 No study published;
no comparator, and
not an RCT
NCT03112525
(Switzerland)
DAPHNE Study: Real-Life Observational
Study to Evaluate the Impact of the
CYP3A4/5/7 and P-gp Pharmacogenetics
and Phenotypic Activity on the
Pharmacokinetic Profile of the Direct Oral
Anticoagulants Rivaroxaban and
Apixaban in Hospitalised Patients
April 2019 No study published;
not an RCT
NCT02345356
(Puerto Rico)
A Genomic Approach to Warfarin Dose
Prescription in Admixed Caribbean
Hispanics
July 2019 No published study;
not an RCT
NCT02972385
(U.S.)
Pharmacogenomics of Warfarin in
Hispanics and Latinos
September 2019 No published study;
no outcome of
interest
NCT02592980
(Brazil)
Evaluation of a Pharmacogenetic-based
Warfarin Dosing Algorithm in Patients December 2019 No published study;
RCT would likely be
included in review
NCT03225820
(U.S.)
Implementation of Point-of-Care
Pharmacogenomic Decision Support
Accounting for Minority Disparities
September 2020 No published study;
RCT would likely be
included in review

WA – Health Technology Assessment March 6, 2018
Pharmacogenetic testing for patients treated with anticoagulants: Draft evidence report 141
Appendix H. Detailed Payer Policies
Excerpt from the Medicare National Coverage Determination on Pharmacogenomic
Testing for Warfarin Response48
Effective August 3, 2009, the Centers for Medicare & Medicaid Services (CMS) believes that the
available evidence supports that coverage with evidence development (CED) under
§1862(a)(1)(E) of the Social Security Act (the Act) is appropriate for pharmacogenomic testing of
CYP2C9 or VKORC1 alleles to predict warfarin responsiveness by any method, and is therefore
covered only when provided to Medicare beneficiaries who are candidates for anticoagulation
therapy with warfarin who:
1. Have not been previously tested for CYP2C9 or VKORC1 alleles; and
2. Have received fewer than five days of warfarin in the anticoagulation regimen for which
the testing is ordered; and
3. Are enrolled in a prospective, randomized, controlled clinical study when that study
meets the following standards.
A clinical study seeking Medicare payment for pharmacogenomic testing of CYP2C9 or VKORC1
alleles to predict warfarin responsiveness provided to the Medicare beneficiary who is a
candidate for anticoagulation therapy with warfarin pursuant to CED must address one or more
aspects of the following question:
Prospectively, in Medicare-aged subjects whose warfarin therapy management includes
pharmacogenomic testing of CYP2C9 or VKORC1 alleles to predict warfarin response, what is the
frequency and severity of the following outcomes, compared to subjects whose warfarin therapy
management does not include pharmacogenomic testing?
Major hemorrhage
Minor hemorrhage
Thromboembolism related to the primary indication for anticoagulation
Other thromboembolic event
Mortality
The study must adhere to the following standards of scientific integrity and relevance to the
Medicare population:
a. The principal purpose of the research study is to test whether a particular intervention
potentially improves the participants’ health outcomes.
b. The research study is well-supported by available scientific and medical information or it
is intended to clarify or establish the health outcomes of interventions already in
common clinical use.
c. The research study does not unjustifiably duplicate existing studies.
d. The research study design is appropriate to answer the research question being asked in
the study.
WA – Health Technology Assessment March 6, 2018
Pharmacogenetic testing for patients treated with anticoagulants: Draft evidence report 142
e. The research study is sponsored by an organization or individual capable of executing
the proposed study successfully.
f. The research study is in compliance with all applicable Federal regulations concerning
the protection of human subjects found in the Code of Federal Regulations (CFR) at 45
CFR Part 46. If a study is regulated by the FDA, it also must be in compliance with 21 CFR
Parts 50 and 56.
g. All aspects of the research study are conducted according to the appropriate standards
of scientific integrity.
h. The research study has a written protocol that clearly addresses, or incorporates by
reference, the Medicare standards.
i. The clinical research study is not designed to exclusively test toxicity or disease
pathophysiology in healthy individuals. Trials of all medical technologies measuring
therapeutic outcomes as one of the objectives meet this standard only if the disease or
condition being studied is life-threatening as defined in 21 CFR § 312.81(a) and the
patient has no other viable treatment options.
j. The clinical research study is registered on the www.ClinicalTrials.gov website by the
principal sponsor/investigator prior to the enrollment of the first study subject.
k. The research study protocol specifies the method and timing of public release of all pre-
specified outcomes to be measured including release of outcomes if outcomes are
negative or study is terminated early. The results must be made public within 24 months
of the end of data collection. If a report is planned to be published in a peer-reviewed
journal, then that initial release may be an abstract that meets the requirements of the
International Committee of Medical Journal Editors. However, a full report of the
outcomes must be made public no later than 3 years after the end of data collection.
l. The research study protocol must explicitly discuss subpopulations affected by the
treatment under investigation, particularly traditionally underrepresented groups in
clinical studies, how the inclusion and exclusion criteria affect enrollment of these
populations, and a plan for the retention and reporting of said populations on the trial. If
the inclusion and exclusion criteria are expected to have a negative effect on the
recruitment or retention of underrepresented populations, the protocol must discuss
why these criteria are necessary.
m. The research study protocol explicitly discusses how the results are or are not expected
to be generalizable to the Medicare population to infer whether Medicare patients may
benefit from the intervention. Separate discussions in the protocol may be necessary for
populations eligible for Medicare due to age, disability or Medicaid eligibility.
Consistent with section 1142 of the Act, the Agency for Healthcare Research and Quality (AHRQ)
supports clinical research studies that CMS determines meet the above-listed standards and
address the above-listed research questions.

WA – Health Technology Assessment March 6, 2018
Pharmacogenetic testing for patients treated with anticoagulants: Draft evidence report 143
Appendix I. See Attachment for Excluded Studies