team up for poug - soocs
TRANSCRIPT

07.09.19 Page 1
Double Feature & Extended Cut: Oracle's kernel debug, diagnostics & tracing
infrastructure
TEAM UP FOR POUG
Stefan Koehler
Hatem Mahmoud

About me
Stefan Koehler• Independent Oracle performance consultant and researcher• 17+ years using Oracle RDBMS - Independent since 2011• Oracle performance and internals geek• Main interests: Cost based optimizer and Oracle RDBMS internals
Services: “All about performance & troubleshooting” • Oracle performance tuning (e.g. Application, CBO, Database, Design, SQL)• Oracle core internals researching (e.g. DTrace, GDB, Perf, etc.)• Troubleshooting nontrivial Oracle RDBMS issues (e.g. Heap dumps, System state
dumps, etc.)• Services are mainly based on short-term contracting
www.soocs.de [email protected] @OracleSK07.09.19 Page 2

Agenda
• Introduction into Oracle events• Oracle's kernel debug, diagnostics & tracing infrastructure APIs
• Numeric Events (ks*/dbkd*)• Events++ / Generic Debug API (dbgd*)• Kernel Server Trace (KST) Diagnostics Framework • UTS (Unified Tracing Service) / Generic Trace API (dbgt*)
• How to list and disable set events• Event propagation
Page 3
Disclaimer: Almost everything is based on research and testing. Test it yourself -with your release and operating system - always! Do not trust anybody! J07.09.19

Introduction into Oracle events
• Events are built into Oracle‘s low-level kernel debug, diagnostics & tracing infrastructure
• Oracle reengineered its low-level kernel debug, diagnostics & tracing infrastructure with 11g - major kernel components were instrumented with 3 APIs (ks*/dbkd*, dbgd*, dbgt*)
• In general events have 3 different main purposes• Create additional diagnostic data (on specific errors/actions or immediately)• Change Oracle behavior or workaround a specific problem• Enable hidden or undocumented features
• Oracle’s diagnostic and error numbers have the same number range (0 to 65535) and may have an associated default action (e.g. ORA-00600 triggers an errorstack trace)
07.09.19 Page 4

Oracle's kernel debug, diagnostics & tracing APIs - Numeric Events (ks*/dbkd*)• Event syntax is based on KSD (KSD = Kernel Service Debug)• Oracle no longer adds new numeric trace events - going forward
new trace events use the UTS (Unified Tracing Service)• Some numeric events (e.g. 10046) are mapped (under the
hood) to an Event++ (e.g. sql_trace[])• Some numeric events also have text aliases (e.g. ORA-00060 à
deadlock, ORA-10035 à parse_sql_statement)
07.09.19 Page 5
alter … set events '<EVENT_NUMBER> trace name context forever, level <X>'
When… should actiontake place
Type of action… “trace” is used for tracing, altering behavior and dumps
Name… always used in context with “trace”
Action… context specific trace or “oradebugdumplist”
Options… about duration andcontext specifictrace info
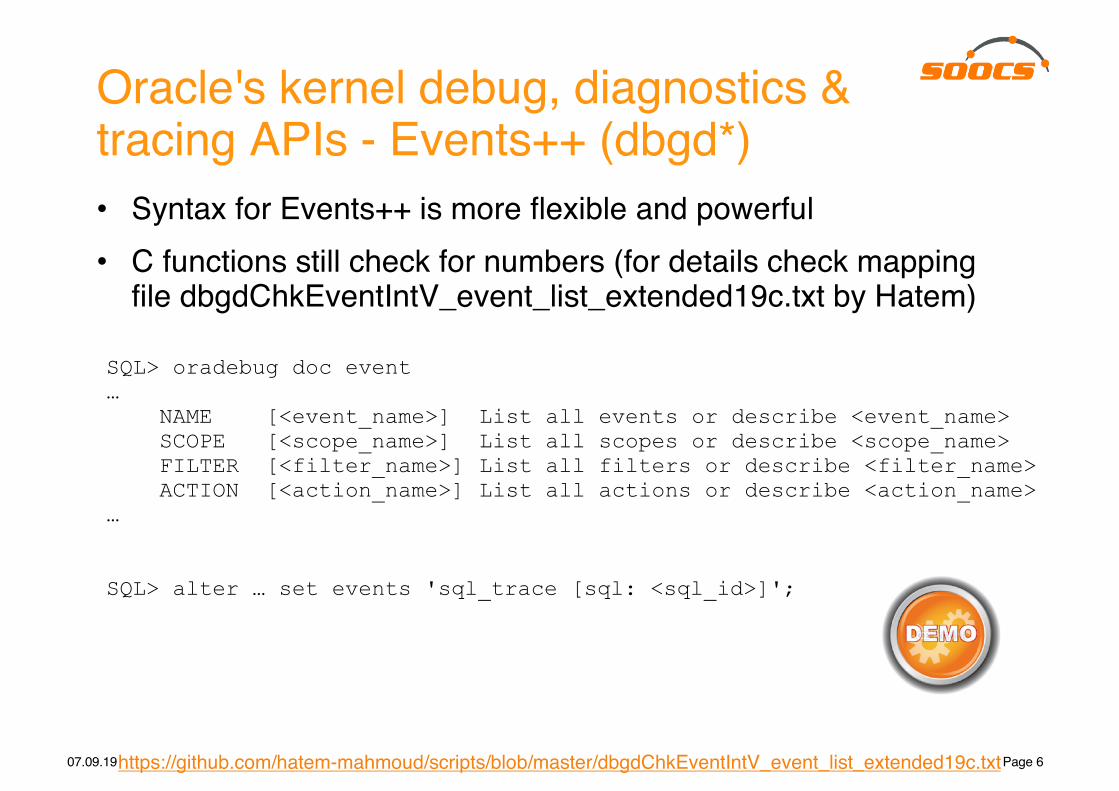
• Syntax for Events++ is more flexible and powerful• C functions still check for numbers (for details check mapping
file dbgdChkEventIntV_event_list_extended19c.txt by Hatem)
Oracle's kernel debug, diagnostics & tracing APIs - Events++ (dbgd*)
07.09.19 Page 6
SQL> oradebug doc event…
NAME [<event_name>] List all events or describe <event_name>SCOPE [<scope_name>] List all scopes or describe <scope_name>FILTER [<filter_name>] List all filters or describe <filter_name>ACTION [<action_name>] List all actions or describe <action_name>
…
SQL> alter … set events 'sql_trace [sql: <sql_id>]';
https://github.com/hatem-mahmoud/scripts/blob/master/dbgdChkEventIntV_event_list_extended19c.txt

Oracle's kernel debug, diagnostics & tracing APIs - Kernel Server Trace (KST)• Generate enough diagnostic data for first pass analysis• An always enabled in-memory ring buffer tracing• Dumped by errorstack trace (ORA-600/ORA-7445) or DIAG
process dumps KST buckets globally upon RAC instance failure• Event based and controllable (e.g. on process level)
07.09.19 Page 7

Oracle's kernel debug, diagnostics & tracing APIs - UTS (dbgt*)• Tracing components can be found in ORADEBUG DOC
COMPONENT• Memory makes tracing info available in circular memory buffer
(X$TRACE) and stack traces (e.g. ORA-00600), if instrumented
07.09.19 Page 8
SQL> oradebug doc event name tracetrace: Main event to control UTS tracing
Usage-------trace [ component <string>[0] ]disk < default | lowest | low | medium | high | highest | disable >,memory < default | lowest | low | medium | high | highest | disable >,get_time < disable | default | seq | highres | seq_highres >,get_stack < disable | default | force >,operation <string>[32],function <string>[32],file <string>[32],line <ub4>,conuid <ub4>
https://github.com/hatem-mahmoud/scripts/blob/master/dbgdChkEventIntV_event_list_extended19c.txt

How to list and disable set events
• Events can be listed with dbms_system.read_ev() or ORADEBUG but ORADEBUG is more convenient
07.09.19 Page 9
SQL> oradebug doc event action eventdump
eventdump- list events that are set in the group
Usage-------eventdump( group < system | process | session >)
system - Dump system group's event settingsprocess - Dump process group's event settings session - Dump session group's event settings

Event propagation
• Event information is copied from PGA to SGA (shared pool) when event is set (on system level)
• Event propagation is happening on session creation or next database call by copying event information from SGA to PGA
• Can be controlled via “_evt_system_event_propagation“ (since Oracle 11g)
• Event propagation is broken in Oracle 12.2 (bug #25989066 & #25994378) and fixed in Oracle 18c
07.09.19 Page 10

OK, this was high-level but how does it work under the hood?
07.09.19 Page 11
Let’s ask for some help from Weed Man …

References• https://oraclue.files.wordpress.com/2011/03/oracle_diagnostic_events_in_11g1.pdf
• https://blog.tanelpoder.com/2009/03/03/the-full-power-of-oracles-diagnostic-events-part-1-syntax-for-ksd-debug-event-handling/
• https://blog.tanelpoder.com/2010/06/23/the-full-power-of-oracles-diagnostic-events-part-2-oradebug-doc-and-11g-improvements/
• https://mahmoudhatem.wordpress.com/2018/10/12/oracle-trace-events-hunting-dbgdchkeventintv/
• https://mahmoudhatem.wordpress.com/2018/10/18/oracle-trace-events-hunting-undocumented-events-filling-the-gaps/
• https://mahmoudhatem.wordpress.com/2018/10/25/oracle-trace-events-hunting-kst-tracing-xtrace/
• https://nenadnoveljic.com/blog/event-propagation-in-oracle-12-2/
• https://www.youtube.com/watch?v=mkmvZv58W6w
• https://www.slideshare.net/tanelp/oracle-xtrace-exotic-wait-event-types-and-background-process-communication
07.09.19 Page 12