technical analysis workshop series session one trend ... · dmi and adx • rates the directional...
TRANSCRIPT

Technical Analysis Workshop Series
Session One
Trend Indicators
DISCLOSURES & DISCLAIMERS
This research material has been prepared by NUS Invest.
NUS Invest specifically prohibits the redistribution of this material in whole or in part without the
written permission of NUS Invest.
The research officer(s) primarily responsible for the content of this research material, in whole or
in part, certifies that their views are accurately expressed and they will not receive direct or
indirect compensation in exchange for expressing specific recommendations or views in this
research material.
Q & AINTRODUCTIONPARABOLIC
SARBOLLINGER
BANDS

DISCLOSURES & DISCLAIMERS
Nothing in this research material constitutes a representation that any investment strategy or
recommendation contained herein is suitable or appropriate to a recipient’s individual
circumstances or otherwise constitutes a personal recommendation. It is published solely for
information purposes, it does not constitute an advertisement and is not to be construed as a
solicitation or an offer to buy or sell any securities or related financial instruments.
No representation or warranty, either expressed or implied, is provided in relation to the
accuracy, completeness or reliability of the information contained herein. The research material
should not be regarded by recipients as a substitute for the exercise of their own judgement. Any
opinions expressed in this research material are subject to change without notice.
Q & AINTRODUCTIONPARABOLIC
SARBOLLINGER
BANDS
Agenda
• Introduction to Trend Indicators
• Recap of Moving Averages
• Bollinger Bands
• Using Bollinger Bands as Targets
• Parabolic SAR
• Q&A
Q & AINTRODUCTIONPARABOLIC
SARBOLLINGER
BANDS

Introduction to Trend Indicators
PIVOT
POINTS
S
Q & AINTRODUCTIONPARABOLIC
SARBOLLINGER
BANDS

Trend indicators attempt to give an objective direction of trend.
Bar chart signals often conflict and it is difficult to separate the
trend from the surrounding 'noise'.
Price data is smoothed and the trend is represented by a single
line, as in the case of a moving average.
Because of the smoothing process, the indicators tend to lag
price changes and are often called trend following indicators.
What are trend indicators?
Q & AINTRODUCTIONPARABOLIC
SARBOLLINGER
BANDS

• Most trend indicators lose money during a ranging market as
fluctuations in a narrow price band tend to whipsaw traders in
and out of their positions.
• It is important to identify whether the market is trending or
ranging and to employ indicators suited to the purpose: trend
indicators for trending markets and the faster momentum
indicators for ranging markets.
Q & AINTRODUCTIONPARABOLIC
SARBOLLINGER
BANDS

Examples of Trend Indicators
• Examples of trend-following indicators:
• Moving Average (exponential, simple, weighted, variable)
• Moving Average Envelope
• Parabolic SAR
• Bollinger Bands
• Directional Movement
• ADX
• Aroon
• MACD / MACD Histogram
Q & AINTRODUCTIONPARABOLIC
SARBOLLINGER
BANDS

Recap of Moving Averages
Q & AINTRODUCTIONPARABOLIC
SARBOLLINGER
BANDS

Moving Average
A moving average is the average price of
securities at a given time.
Simple Moving Average (SMA) =
Sum( Price )n / N
* N = Time Period
Q & AINTRODUCTIONPARABOLIC
SARBOLLINGER
BANDS

Types of Moving Averages
• Simple Moving Averages
• Weighted Moving Averages
• Exponential Moving Averages
Q & AINTRODUCTIONPARABOLIC
SARBOLLINGER
BANDS

20 SMA
Q & AINTRODUCTIONPARABOLIC
SARBOLLINGER
BANDS

Moving Average Envelopes
• Envelopes are placed at fixed percentages above and below the moving average
• Tells us when prices have strayed too far from the moving average line– Market overextended in either direction
• MA is the center of the trend and the envelope consists of points of maximum and minimum divergence from it
Q & AINTRODUCTIONPARABOLIC
SARBOLLINGER
BANDS
Moving Average Envelopes
• Short term analysis
– 3% envelope around a simple 21 day SMA
• Long term analysis
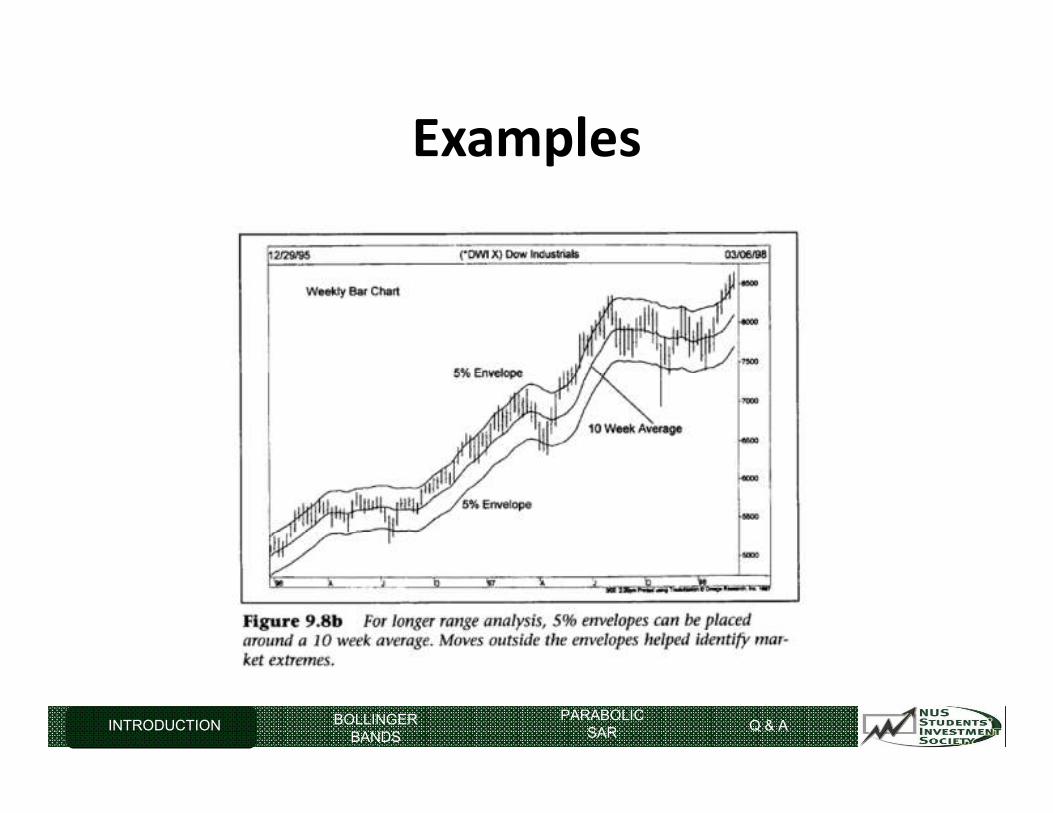
– 5% envelope around a 10 week SMA
– 10% envelope around a 20 week SMA
Q & AINTRODUCTIONPARABOLIC
SARBOLLINGER
BANDS

Examples
Q & AINTRODUCTIONPARABOLIC
SARBOLLINGER
BANDS
Examples
Q & AINTRODUCTIONPARABOLIC
SARBOLLINGER
BANDS

Bollinger Bands
INTRODUCTION Q & AINTRODUCTIONPARABOLIC
SAR
BOLLINGER
BANDS

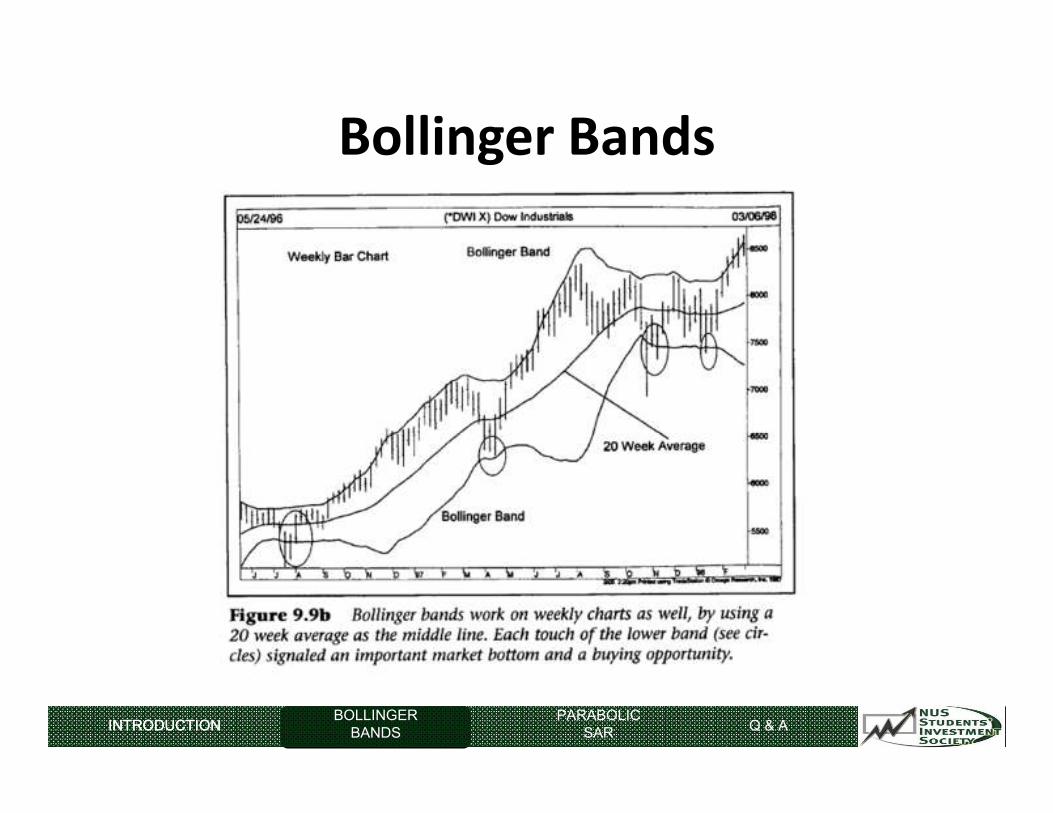
Bollinger Bands
• Technique developed by John Bollinger in
the 80’s and a term trademarked by him in
2011
• Two trading Bands placed around a moving
average similar to MA envelopes
• 2 standard deviations above and below the
moving average
INTRODUCTION Q & AINTRODUCTIONPARABOLIC
SAR
BOLLINGER
BANDS

Bollinger Bands
• When prices touch the upper band
• Overextended on the upside
(Overbought)
• When prices touch the lower band
• Overextended on the downside
(Oversold)
INTRODUCTION Q & AINTRODUCTIONPARABOLIC
SAR
BOLLINGER
BANDS

Bollinger Bands
INTRODUCTION Q & AINTRODUCTIONPARABOLIC
SAR
BOLLINGER
BANDS
Bollinger Bands
INTRODUCTION Q & AINTRODUCTIONPARABOLIC
SAR
BOLLINGER
BANDS

Use of Bollinger Bands as Targets
INTRODUCTION Q & AINTRODUCTIONPARABOLIC
SAR
BOLLINGER
BANDS

Use of Bollinger Bands as Targets
• Simplest way to use bollinger bands
• Use of upper and lower bands as price targets
INTRODUCTION Q & AINTRODUCTIONPARABOLIC
SAR
BOLLINGER
BANDS

Use of Bollinger Bands as Targets
• Situation 1
• Price bounces off lower
band and crosses the
moving average line
• Upper band becomes the
upper price target
INTRODUCTION Q & AINTRODUCTIONPARABOLIC
SAR
BOLLINGER
BANDS
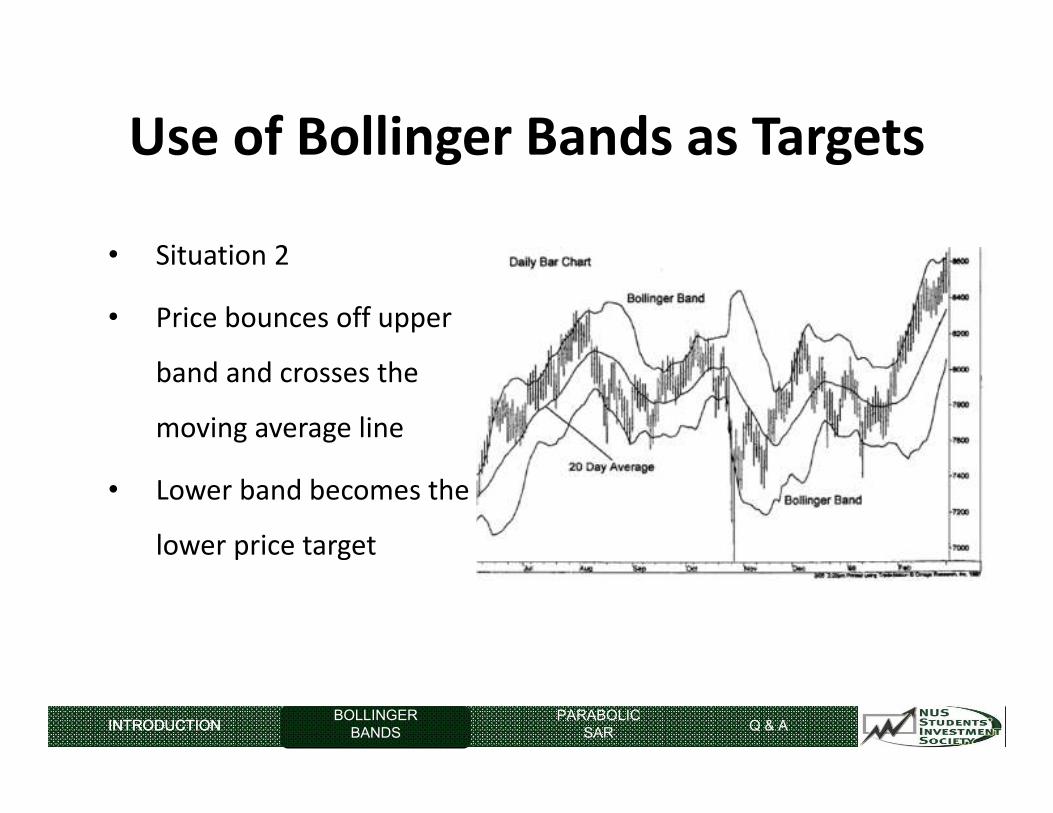
Use of Bollinger Bands as Targets
• Situation 2
• Price bounces off upper
band and crosses the
moving average line
• Lower band becomes the
lower price target
INTRODUCTION Q & AINTRODUCTIONPARABOLIC
SAR
BOLLINGER
BANDS
Use of Bollinger Bands as Targets
• Can also be used to predict reversals
• In a strong uptrend, prices will fluctuate between the
moving average line and the upper band
• If if falls below the moving average line, this warns of
a reversal to the downside
INTRODUCTION Q & AINTRODUCTIONPARABOLIC
SAR
BOLLINGER
BANDS
Measure of Volatility
• Bands width is a measure of volatility
• Unlike envelopes whose width stay the same,
bollinger bands expand and contract based on last 20
days volatility
• Rising volatility, bands expand
• Falling volatility, bands contract
INTRODUCTION Q & AINTRODUCTIONPARABOLIC
SAR
BOLLINGER
BANDS

Measure of Volatility
• When bands far apart, current trend is ending
• When band are very narrow, new trend is about to be
initiated.
INTRODUCTION Q & AINTRODUCTIONPARABOLIC
SAR
BOLLINGER
BANDS

Bollinger Squeeze
• Periods of low volatility are often followed by periods
of high volatility
• Therefore, a volatility contraction or narrowing of the
bands can foreshadow a significant advance or
decline.
• Once the squeeze play is on, a subsequent band break
signals the start of a new move.
INTRODUCTION Q & AINTRODUCTIONPARABOLIC
SAR
BOLLINGER
BANDS
Bollinger Squeeze
• A new advance starts with a squeeze and subsequent
break above the upper band.
• A new decline starts with a squeeze and subsequent
break below the lower band.
INTRODUCTION Q & AINTRODUCTIONPARABOLIC
SAR
BOLLINGER
BANDS

Bollinger Squeeze
• There is also an indicator for measuring the distance
between the Bollinger Bands, the BandWidth
indicator.
• It is simply the value of the upper band less the
value of the lower band.
INTRODUCTION Q & AINTRODUCTIONPARABOLIC
SAR
BOLLINGER
BANDS

Bollinger Squeeze
• Stocks with higher prices tend to have higher
BandWidth readings than stocks with lower prices.
• If price equals 100 and BandWidth equals 5, then
BandWidth would be 5% of the price.
• If price equals 20 and BandWidth equals 1, then
BandWidth would also be 5% of price. Keep this in
mind when using the indicator.
INTRODUCTION Q & AINTRODUCTIONPARABOLIC
SAR
BOLLINGER
BANDS

Strategy• Narrowing Bollinger Bands
and low BandWidth levels.
Ideally near the low end of
its six month range.
• Wait for a band break to
signal the start of a new
move.
• An upside bank break is
bullish, while a downside
bank break is bearish.
INTRODUCTION Q & AINTRODUCTIONPARABOLIC
SAR
BOLLINGER
BANDS

Strategy
• Note that narrowing bands do not provide any
directional clues.
• They simply infer that volatility is contracting
and chartists should be prepared for a
volatility expansion, which means a directional
move.
INTRODUCTION Q & AINTRODUCTIONPARABOLIC
SAR
BOLLINGER
BANDS

Strategy
INTRODUCTION Q & AINTRODUCTIONPARABOLIC
SAR
BOLLINGER
BANDS
Parabolic Stop and Reverse (SAR)
INTRODUCTION Q & AINTRODUCTIONPARABOLIC
SAR
BOLLINGER
BANDS

Parabolic SAR
• Developed by J. Welles Wilder Jr.
• Trend following system
• Stop and Reverse
• Position is reversed when the protective stop is hit
• Helps to identify when a trend is ending
• Trailing stops that are shaped like a parabola
INTRODUCTION Q & AINTRODUCTIONPARABOLIC
SAR
BOLLINGER
BANDS

Parabolic SAR
• Appears as dots on the charts
• As prices trend higher, the rising dots below the
price action starts out slower and then accelerates
with trend
• In the downtrend, the reverse happens
• Dots above the price action
INTRODUCTION Q & AINTRODUCTIONPARABOLIC
SAR
BOLLINGER
BANDS
Parabolic SAR
Acceleration Factor
• Wilder built in an acceleration factor into the system
• At first, movement of the stop is relatively slow to allow
the trend time to become established
• As the acceleration factor increases, the SAR begins to
move faster, catching up with the price action
• If trend fails to materialize, result is a stop and a reverse
signal
INTRODUCTION Q & AINTRODUCTIONPARABOLIC
SAR
BOLLINGER
BANDS
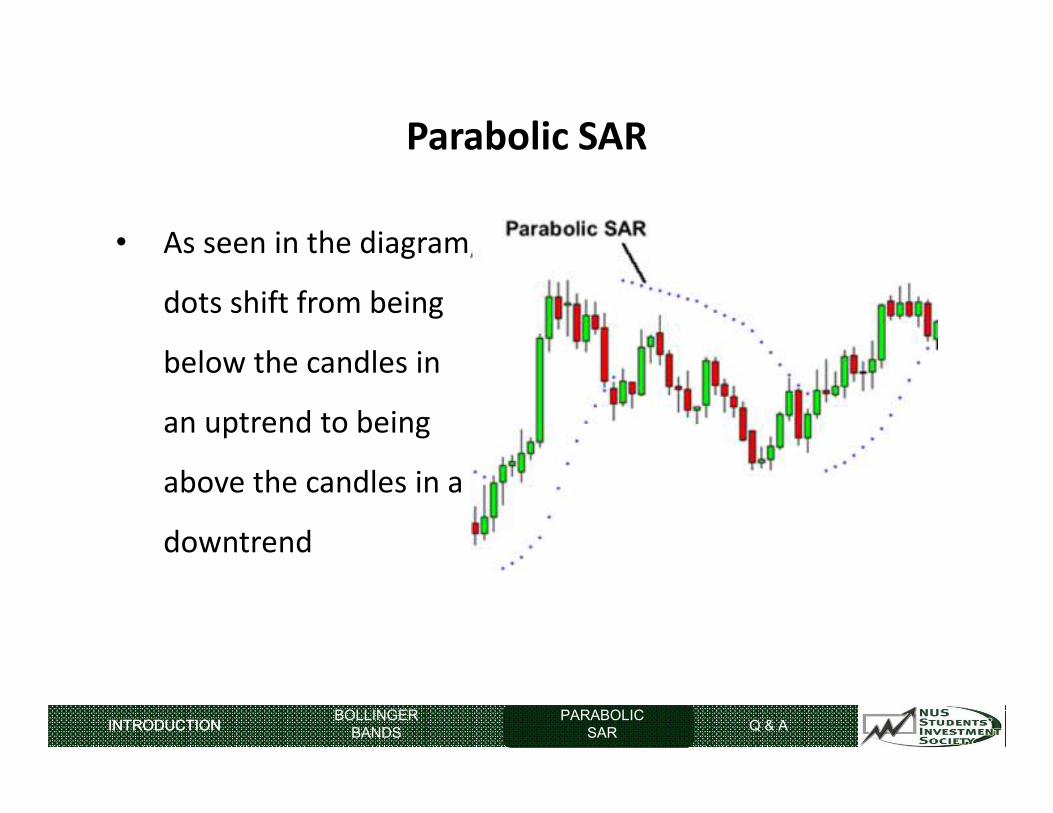
Parabolic SAR
• As seen in the diagram,
dots shift from being
below the candles in
an uptrend to being
above the candles in a
downtrend
INTRODUCTION Q & AINTRODUCTIONPARABOLIC
SAR
BOLLINGER
BANDS

Parabolic SAR
• Simply, when the dots
are below the candles
it is a buy signal
• When it is above the
candles it is a sell
signal
INTRODUCTION Q & AINTRODUCTIONPARABOLIC
SAR
BOLLINGER
BANDS
Parabolic SAR
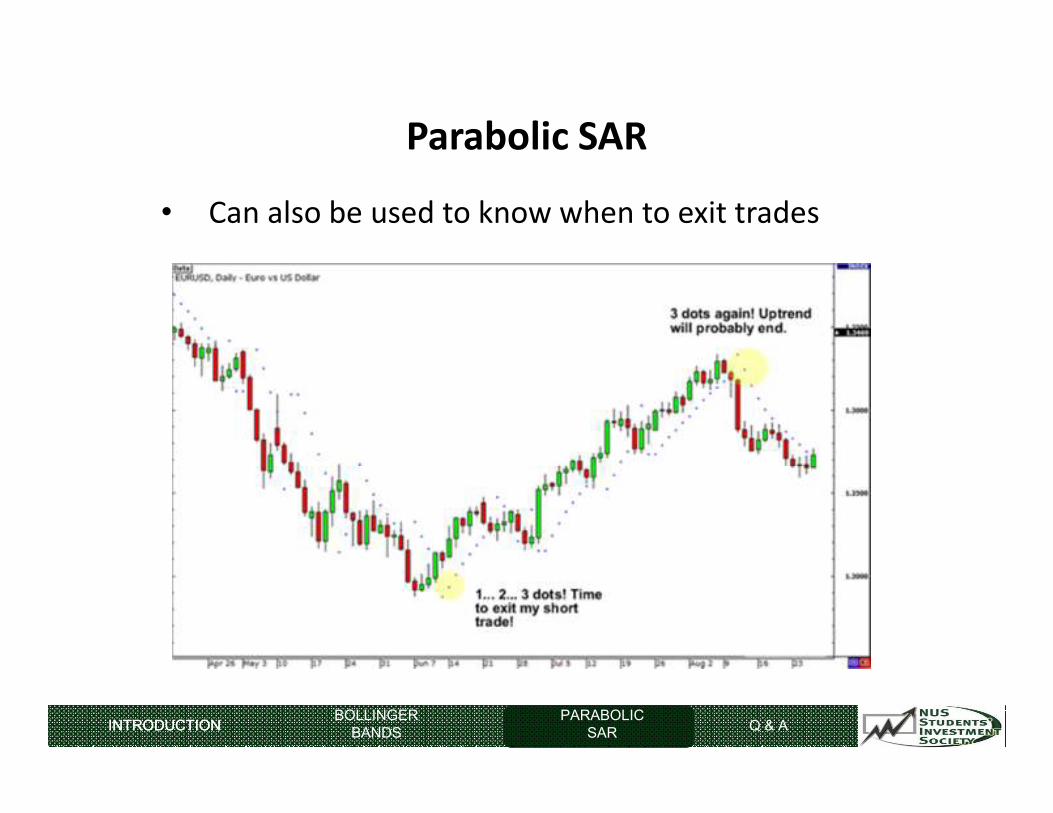
• Can also be used to know when to exit trades
INTRODUCTION Q & AINTRODUCTIONPARABOLIC
SAR
BOLLINGER
BANDS
Parabolic SAR
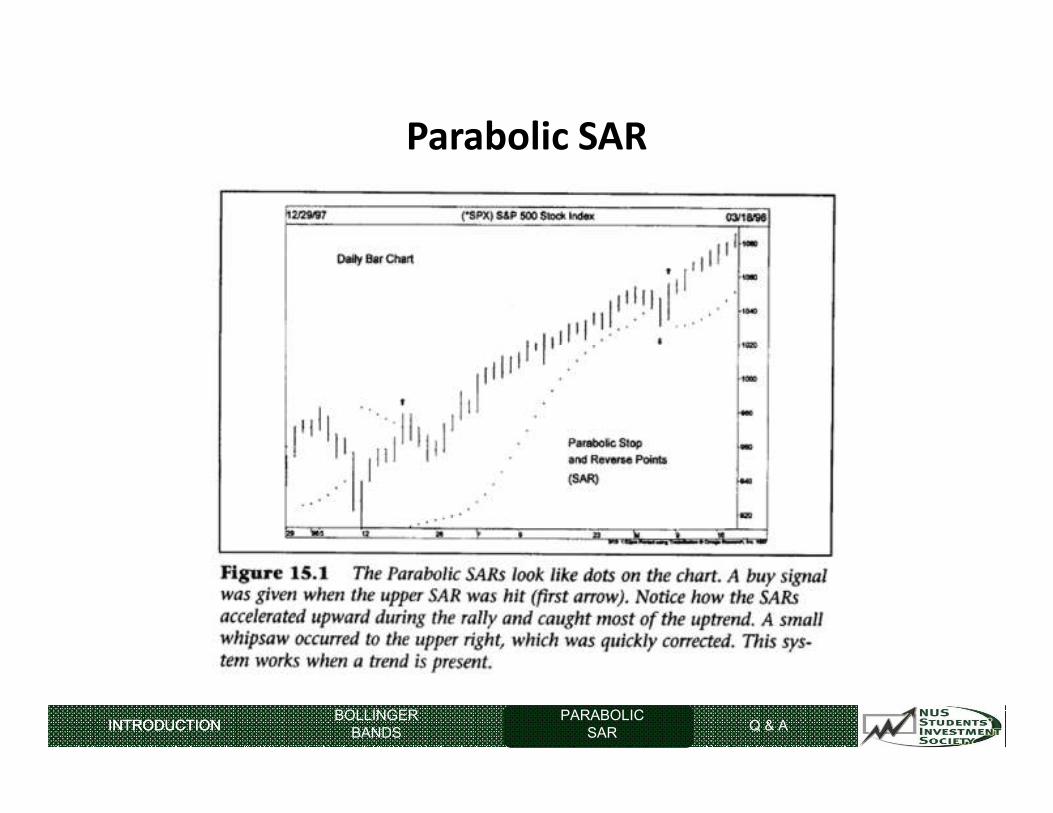
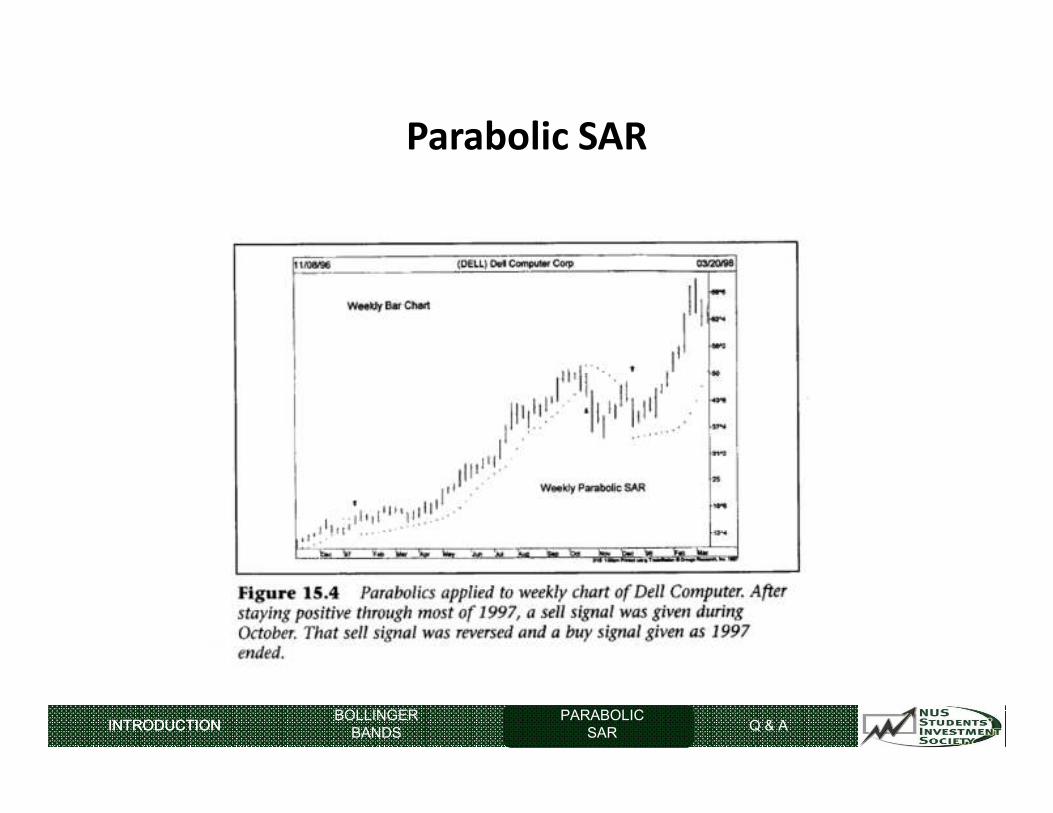
• Works extremely well during trending markets
• However, during non trending periods and ranges,
the system will whipsaw and not be very useful
INTRODUCTION Q & AINTRODUCTIONPARABOLIC
SAR
BOLLINGER
BANDS

Parabolic SAR
INTRODUCTION Q & AINTRODUCTIONPARABOLIC
SAR
BOLLINGER
BANDS
Parabolic SAR
INTRODUCTION Q & AINTRODUCTIONPARABOLIC
SAR
BOLLINGER
BANDS

Parabolic SAR
INTRODUCTION Q & AINTRODUCTIONPARABOLIC
SAR
BOLLINGER
BANDS

Parabolic SAR
INTRODUCTION Q & AINTRODUCTIONPARABOLIC
SAR
BOLLINGER
BANDS
Parabolic SAR
INTRODUCTION Q & AINTRODUCTIONPARABOLIC
SAR
BOLLINGER
BANDS

DMI and ADX
• One way to deal with this problem is to use some type of
filter or device to determine if the market is in trending
mode
• Wilder developed the directional movement index (DMI)
and the average directional movement index (ADX)
• ADX is essentially a smoothed difference between the
+DI and –DI lines
INTRODUCTION Q & AINTRODUCTIONPARABOLIC
SAR
BOLLINGER
BANDS
DMI and ADX
• Rates the directional movement of the market on a scale
of 0-100
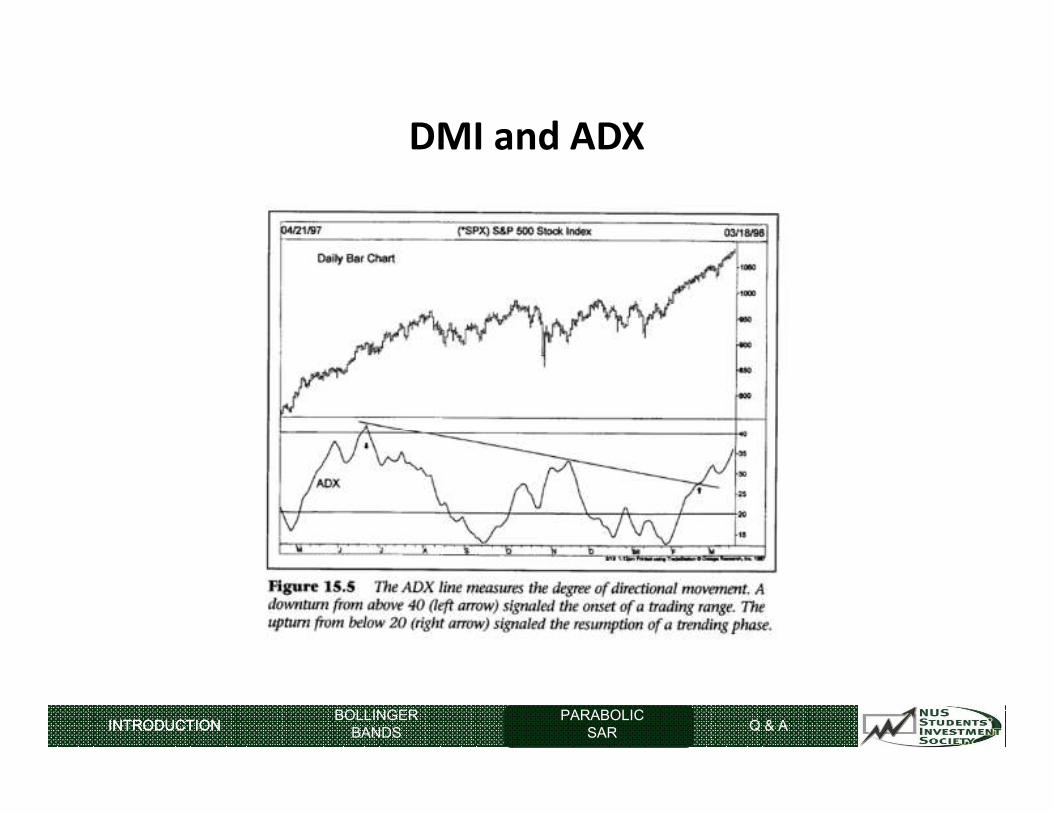
• A rising ADX line indicates that the market is trending
• Suitable for trend following system
• A falling ADX line indicates that the market is non-trending
• Not suitable for a trend following system
INTRODUCTION Q & AINTRODUCTIONPARABOLIC
SAR
BOLLINGER
BANDS
DMI and ADX
INTRODUCTION Q & AINTRODUCTIONPARABOLIC
SAR
BOLLINGER
BANDS
DMI and ADX
• Trader could simply trade on those markets with the
highest trend ratings
• Non trending systems (e.g. oscillators) can be utilized
on markets with low directional movement
INTRODUCTION Q & AINTRODUCTIONPARABOLIC
SAR
BOLLINGER
BANDS

DMI and ADX
• Directional indicators can be used on their own or as
a filter
• 2 lines are generated for DMI study
• +DI
• Measures positive (upward) movement
• -DI
• Measures negative (downward) movement
INTRODUCTION Q & AINTRODUCTIONPARABOLIC
SAR
BOLLINGER
BANDS

DMI and ADX
• A buy signal is given when the +DI line crosses over
the –DI line
INTRODUCTION Q & AINTRODUCTIONPARABOLIC
SAR
BOLLINGER
BANDS
DMI and ADX
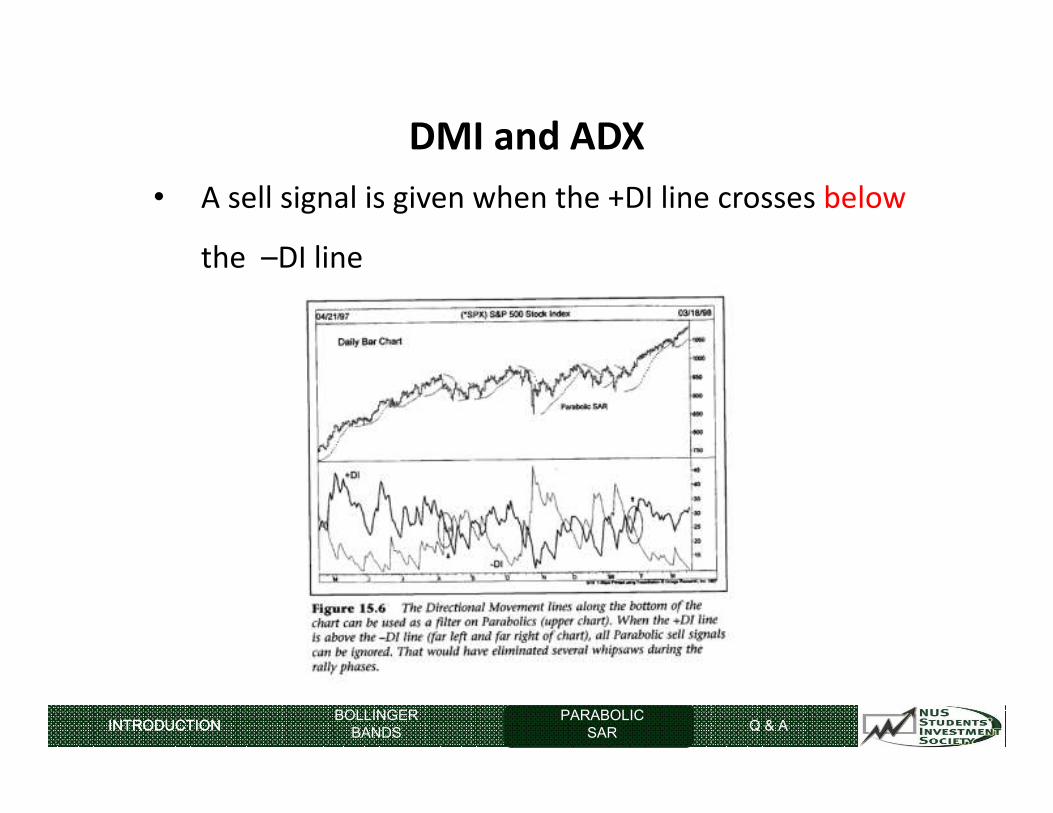
• A sell signal is given when the +DI line crosses below
the –DI line
INTRODUCTION Q & AINTRODUCTIONPARABOLIC
SAR
BOLLINGER
BANDS
Using both parabolic SAR and DMI together
• Parabolic SAR is a more sensitive system
• More frequent, earlier signals given
• DMI used as a filter
• Follow only those signals in the same direction as
the DMI lines
INTRODUCTION Q & AINTRODUCTIONPARABOLIC
SAR
BOLLINGER
BANDS

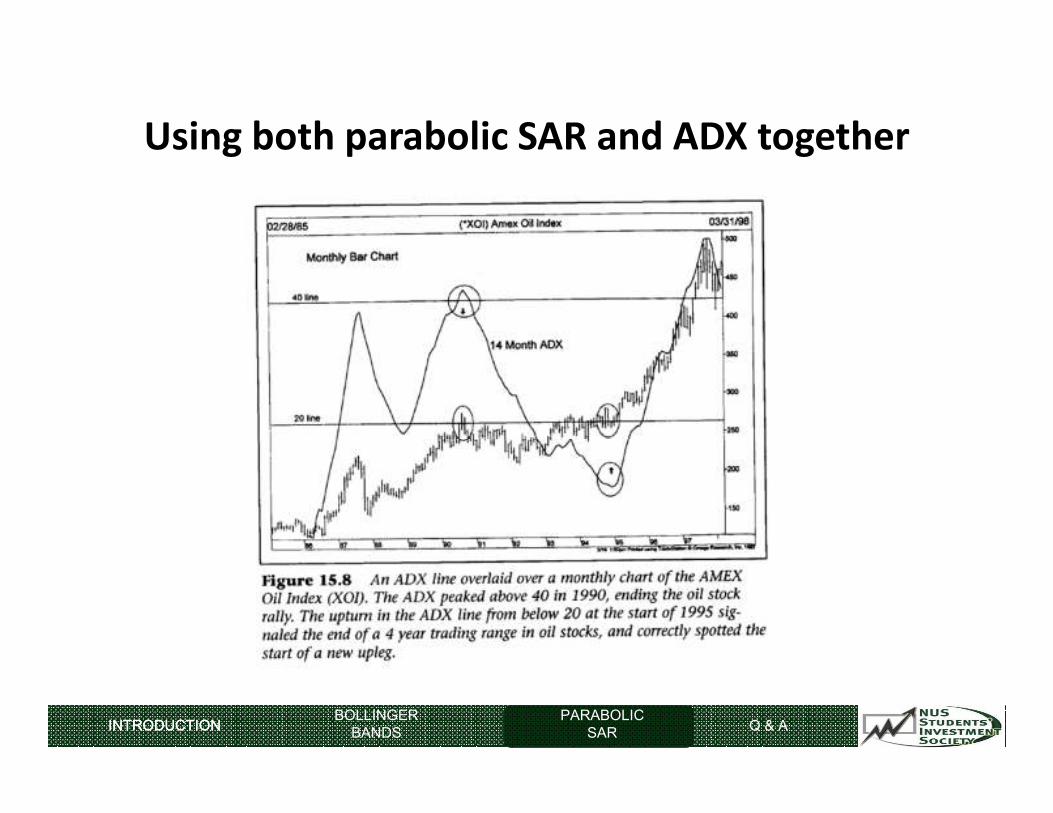
Using both parabolic SAR and ADX together
• Best to use trending system when ADX is rising
• Caveat
• When ADX starts to drop from above the 40 level,
early sign that the trend is weakening
• Rise back above the 20 level is often the start
of a new trend
INTRODUCTION Q & AINTRODUCTIONPARABOLIC
SAR
BOLLINGER
BANDS

Using both parabolic SAR and ADX together
INTRODUCTION Q & AINTRODUCTIONPARABOLIC
SAR
BOLLINGER
BANDS
Using both parabolic SAR and ADX together
INTRODUCTION Q & AINTRODUCTIONPARABOLIC
SAR
BOLLINGER
BANDS

Q & A
INTRODUCTIONINTRODUCTIONREVERSAL
PATTERNSQ & AINTRODUCTION PRACTICE

THANK YOU!
FM & BC MODELTECHNICAL
ANALYSISDOW THEORY Q & AINTRODUCTION REVERSAL
PATTERNSQ & AINTRODUCTION PRACTICE