technical memorandum - houstontx.gov has performed a portion of the effort needed for the lake...
TRANSCRIPT
10497 Town and Country Way, Suite 600 � Houston, Texas 77024 � 713-600-6800 � fax 713-600-6801 www.freese.com
TECHNICAL
MEMORANDUM
FNI has performed a portion of the effort needed for the Lake Houston Water Surface Reduction Alternative
Analysis. This initial effort included a review of the available information, such as the area capacity data and
the hydraulic capacity of the spillway. A review of previous structural analyses of the dam was performed in
order to develop a feasible structural option for additional spillway capacity. This allowed for an initial review
of the discharge capacity needed to draw Lake Houston down various amounts in advance of a tropical storm
or hurricane. Three potential drawdown levels (4, 6, and 8 feet) and three possible drawdown times (24, 48,
and 72 hours) were reviewed.
Gated Structure Required to Lower Starting Lake Levels (Rehabilitation of Existing Bays)
In order to provide for two realistic physical alternatives that would allow for this operation, a review of
previous structural analyses of the dam allowed for the development of a feasible spillway alternative for
additional gates. The existing gated spillway consists of two radial gates, each 20.5’x18’, and two flashboard
gates, each 5’x18’. The abutment of the slab and buttress portion of the dam to the east of the existing spillway
has eight bays similar to the gated spillway bays that could feasibly have gated structures added within each
18-feet wide bay.
TO: John R. Blount, Harris County
FROM Cody Cockroft
SUBJECT: Lake Houston Water Surface Reduction Alternatives
Interim Findings
PROJECT: HRR17653
DATE: February 5, 2018
CC: Matt Zeve, Harris County Flood Control

John R. Blount
Lake Houston Water Surface Reduction Alternatives
February 5, 2018 Page 2 of 15
Figure 1: Elevation View of Available Bays
The embankment material between Bays 3 and 10 would have to be removed and concrete gravity structures
placed between the buttresses. These could be placed with a crest level similar to the existing gated spillway
(e.g., elevation 26’) so that similar gates could be used. This could all be constructed behind the existing slabs
until the gates are completed. By doing so, the need for a robust upstream cofferdam would not be required.
Then the slabs in front could be removed down to an appropriate level. The buttresses would likely need
additional support (increase in cross section), so 15 feet wide gates were assumed to be able to fit within the
18 feet wide space. No structural or stability analyses were performed to confirm these dimensions. The
discharge would spill into a new stilling basin immediately adjacent to the existing basin (see Figure 2). It could
then be oriented to spill into the channel downstream from the existing spillway stilling basin. In addition, the
two uncontrolled bays between the four gated bays and the abutment (e.g., Bay 1 and Bay 2), could also
feasibly be turned into gated bays discharging into the same stilling basin. However, these two bays would
have significantly more risk during construction and would remove a portion of the uncontrolled length of the

John R. Blount
Lake Houston Water Surface Reduction Alternatives
February 5, 2018 Page 3 of 15
existing spillway. Combined, these bays would allow for a maximum of 10 new gates to be added. Figure 2
shows a 6-gate schematic option of the proposed configuration overlaid on a Google Earth photo.
Figure 2: Possible Additional Spillway Gates
The gate construction would proceed using the upstream slab as a cofferdam until the gate structure was
complete, as shown in Figure 3, which is a marked-up section from the original drawings.

John R. Blount
Lake Houston Water Surface Reduction Alternatives
February 5, 2018 Page 4 of 15
Figure 3: Section through Proposed Gate in Abutment Bays
When the full gate is complete, the slab in front could be demolished and the spillway would then be
functional. The two gates immediately adjacent to the existing gates are part of the current uncontrolled
spillway and would not have as much protection since the upstream slab only goes up to the normal water
level. They would also reduce slightly the capacity of the remaining uncontrolled spillway. Therefore the 8
gates in the abutment would be a preferred location, but all 10 would be feasible.
Hydraulic Evaluation
The hydraulic evaluation consisted of two main components: 1) sizing of the structure needed to lower the
starting lake levels in anticipation of a storm, and 2) evaluation of Hurricane Harvey with the lower starting
lake levels.
The existing gated spillway consists of two radial gates, each 20.5’x18’, and two flashboard gates, each 5’x18’.
The total discharge capacity of the four gates at normal pool level (42.5) is approximately 10,000 cfs. This
drops to about 8,200 cfs when the lake drops 4 feet and to 3,200 cfs after an 8-foot drop. In order to release
significant quantities of water for future flood storage, it was assumed the gates would be opened to their full
capacity. Using the existing spillway gates, the lake could be dropped about 4 feet in 3 days, 6 feet in 4 days,
and 8 feet in 6 days. This assumes no significant inflow. If significant inflows were occurring, these times could
be much longer, up to the possibility that if inflows were as high as 10,000 cfs, then the lake could not be
drawn down at all.

John R. Blount
Lake Houston Water Surface Reduction Alternatives
February 5, 2018 Page 5 of 15
In order to complete this assessment, two HEC-RAS unsteady flow models were used. The first model was
used to size the structures needed to lower the lake levels, and the second model was used to quantify the
flows experienced during Hurricane Harvey and provide a baseline of the lake levels.
Both models are based on the information collected as part of the Probable Maximum Flood Analysis
completed in May 2007 for the Coastal Water Authority. Lake volumes and discharge rating curves for the
current configuration of the dam were obtained from this report.
Three different starting water levels were evaluated and are listed in Table 1. The volumes to be released
were calculated based on information from the May 2007 report, and reference a normal water level of 42.5
feet. Also listed are the percentages of the total lake storage that these reductions would entail releasing. The
risk associated with releasing a large percentage of the available water supply is high, since rainfall forecasts,
particularly associated with tropical storms, can vary widely depending on the location of the actual landfall
and path of the storm.
Table 1: Starting Lake Levels and Released Volume
Lower Level By
(ft) To Elevation (ft)
Volume
Released (AF)
Percentage of
Water Supply Pool
(%)
4 38.5 39,000 32%
6 36.5 56,000 46%
8 34.5 71,000 59%
* Normal Water Level is 42.5-ft
The assumed structure consisted of a combination of 15’(W) x 22’(H) radial gates with a seating elevation of
26 feet, which is similar to the existing radial gate. Three drawdown times (24-hr, 48-hr, and 72-hr) to reach
the desired starting level were evaluated, with each resulting in a different configuration.
Table 2 summarizes the number of gates required to reach each lake level for each of the different drawdown
times, and the peak flows released while lowering the lake level (inclusive of capacity through the existing
radial gates). For instance, in order to lower the lake level by 6 feet over a 48-hour period, the structure will
need three 15’x22’ radial gates that will release a peak discharge of 21,000 cfs. Each value assumes that there
is no significant inflow into the lake at the time. If there is, more capacity would be needed into to lower the
lake in the prescribed times.
John R. Blount
Lake Houston Water Surface Reduction Alternatives
February 5, 2018 Page 6 of 15
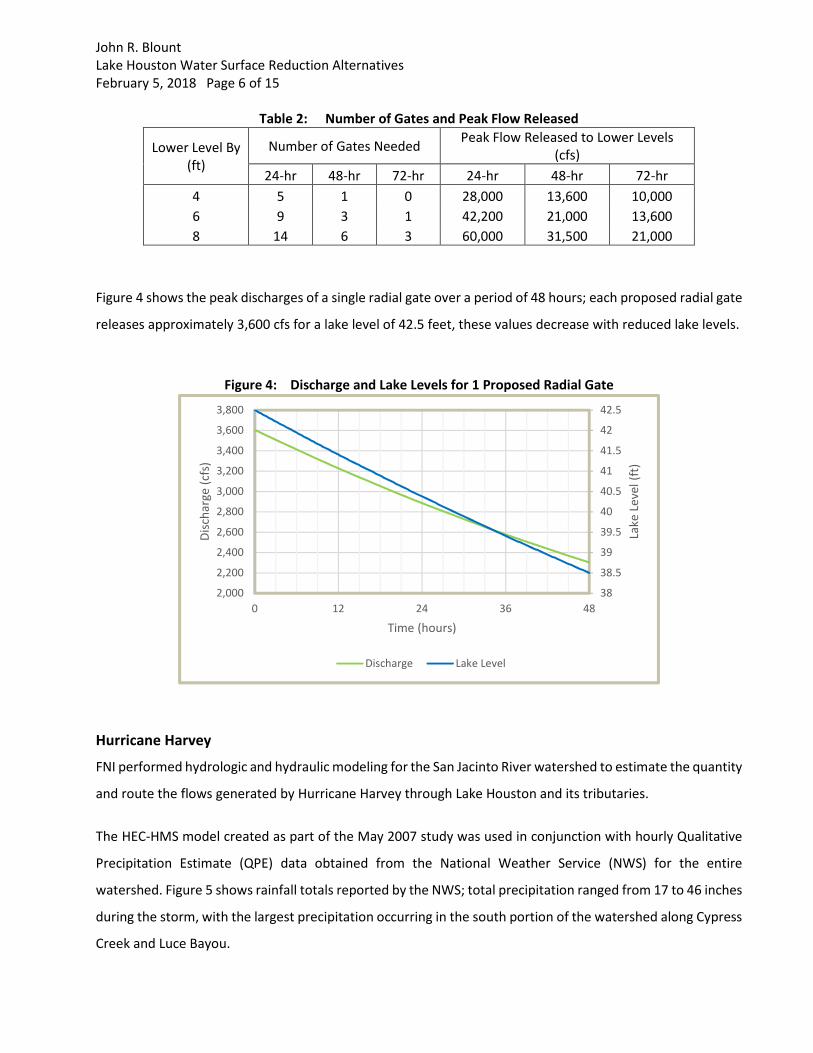
Table 2: Number of Gates and Peak Flow Released
Lower Level By
(ft)
Number of Gates Needed Peak Flow Released to Lower Levels
(cfs)
24-hr 48-hr 72-hr 24-hr 48-hr 72-hr
4 5 1 0 28,000 13,600 10,000
6 9 3 1 42,200 21,000 13,600
8 14 6 3 60,000 31,500 21,000
Figure 4 shows the peak discharges of a single radial gate over a period of 48 hours; each proposed radial gate
releases approximately 3,600 cfs for a lake level of 42.5 feet, these values decrease with reduced lake levels.
Figure 4: Discharge and Lake Levels for 1 Proposed Radial Gate
Hurricane Harvey
FNI performed hydrologic and hydraulic modeling for the San Jacinto River watershed to estimate the quantity
and route the flows generated by Hurricane Harvey through Lake Houston and its tributaries.
The HEC-HMS model created as part of the May 2007 study was used in conjunction with hourly Qualitative
Precipitation Estimate (QPE) data obtained from the National Weather Service (NWS) for the entire
watershed. Figure 5 shows rainfall totals reported by the NWS; total precipitation ranged from 17 to 46 inches
during the storm, with the largest precipitation occurring in the south portion of the watershed along Cypress
Creek and Luce Bayou.
38
38.5
39
39.5
40
40.5
41
41.5
42
42.5
2,000
2,200
2,400
2,600
2,800
3,000
3,200
3,400
3,600
3,800
0 12 24 36 48
Lake
Le
vel
(ft)
Dis
cha
rge
(cf
s)
Time (hours)
Discharge Lake Level

John R. Blount
Lake Houston Water Surface Reduction Alternatives
February 5, 2018 Page 7 of 15
Discharges reported by several USGS streamflow gages were used to define the hydrographs at the upstream
ends of the streams. SH 99 at the West Fork Trinity River, IH 45 at Spring Creek and Cypress Creek, US 59 for
Peach Creek, FM 2090 for Caney Creek, FM 1485 for East Fork, and Luce Bayou near the Harris County line.
Figure 5: Total Precipitation During Hurricane Harvey
Discharges from the HEC-HMS model were used to supplement the flows reported by the USGS, and were
routed through an unsteady flow one-dimensional HEC-RAS model that represented the tributaries to Lake
Houston downstream of the USGS streamflow gages, as shown in Figure 6.

John R. Blount
Lake Houston Water Surface Reduction Alternatives
February 5, 2018 Page 8 of 15
Figure 6: Extents of Hydraulic Model
The results of the HEC-RAS model were used to quantify the inflows into Lake Houston that occurred as a
result of Hurricane Harvey. The peak discharges from the three main tributaries into Lake Houston were
estimated as: 38,000 cfs from Luce Bayou, 171,000 cfs on the East Fork downstream of the confluence with
Peach Creek, and 240,0000 cfs on the West Fork downstream of the confluence with Spring Creek. After
accounting for timing and routing of the flows, the peak inflow into Lake Houston was estimated at
approximately 430,000 cfs, occurring the evening of August 29. Figure 7 shows the flows into Lake Houston
that were used in this analysis. The peak stage at the lake was calculated as elevation 53.01 feet, and a
maximum release of 425,000 cfs. Figure 8 shows the approximate extents of inundation as a result of this
flood.

John R. Blount
Lake Houston Water Surface Reduction Alternatives
February 5, 2018 Page 9 of 15
Figure 7: Inflows to Lake Houston during Hurricane Harvey
Figure 8: Inundation Extents during Hurricane Harvey
The impact of incorporating the gate configurations described in Table 2 was estimated by routing the
Hurricane Harvey flows through Lake Houston. The simulations start with the lowered lake levels, and the
proposed gates closed. Once the lake level reaches elevation 42.5 (normal lake level), the new gates are
0
50,000
100,000
150,000
200,000
250,000
300,000
350,000
400,000
450,000
500,000
8/25 8/26 8/27 8/28 8/29 8/30 8/31 9/1 9/2 9/3 9/4 9/5
Infl
ow
(cf
s)
Date

John R. Blount
Lake Houston Water Surface Reduction Alternatives
February 5, 2018 Page 10 of 15
opened to release flows in conjunction with the existing infrastructure. Table 3 summarizes the peak releases
through the proposed gates, and the combined peak release from Lake Houston during Hurricane Harvey.
Table 3: Releases from Lake Houston with Proposed Gates
Lower Level By
(ft)
To
Elevation
Peak Release Through New
Gates (cfs)
Peak Total Release
(cfs)
24 hr 48 hr 72 hr 24 hr 48 hr 72 hr
0 42.5 0 425,000
4 38.5 45,500 9,400 0 426,000 425,000 425,000
6 36.5 79,000 28,000 9,400 426,000 425,000 425,000
8 34.5 116,500 54,000 28,000 426,000 426,000 425,000
While the peak release through the proposed structure would greatly depend on the number of gates being
added, the combined peak release had a minimal change, indicating that the areas downstream of Lake
Houston would have experienced a similar outcome with the proposed structures.
Table 4 summarizes the peak lake levels at Lake Houston for each scenario analyzed, along with the
corresponding reduction in lake level compared to existing conditions. The maximum reduction of 1.9 feet
occurred with an initial lake level of 34.5 feet (8 feet below NPL), and 14 additional radial gates. A similar initial
lake level with only 3 radial gates results in a reduction of only 0.4 feet.
Table 4: Lake Levels at Lake Houston with Proposed Gates
Lower Level By
(ft)
To
Elevation
Peak Lake Level (ft) Reduction in Peak Lake Level (ft)
24 hr 48 hr 72 hr 24 hr 48 hr 72 hr
0 42.5 53.01 0.00
4 38.5 52.33 52.89 53.01 -0.68 -0.12 0.00
6 36.5 51.77 52.61 52.89 -1.24 -0.40 -0.12
8 34.5 51.11 52.19 52.61 -1.90 -0.82 -0.40
Discussion
From the results presented above, none of the configurations analyzed would have dramatically reduced the
inundation extents for the areas around Lake Houston. In addition, the majority of the reduction was due to
the additional spillway capacity of the added gates during the flooding and not from the additional storage
provided by the advanced lowering of the lake prior to the flooding. The reason for this is that the total flow
volume of a very large event, like the flooding resulting from Hurricane Harvey, is several times the volume of
the lake itself and many times the volume of the initial storage reduction. This storage is refilled early in the
John R. Blount
Lake Houston Water Surface Reduction Alternatives
February 5, 2018 Page 11 of 15
storm and the initial difference is typically lost well before the peak of the flood. Therefore, the risk associated
with releasing the water supply in advance of the flooding is not justified when compared to the very limited
benefits associated with a lower starting lake level. In this case, effectively the same benefit could have been
achieved by installing the additional gate capacity for use during the flood and not lowering the lake in
advance of the event.
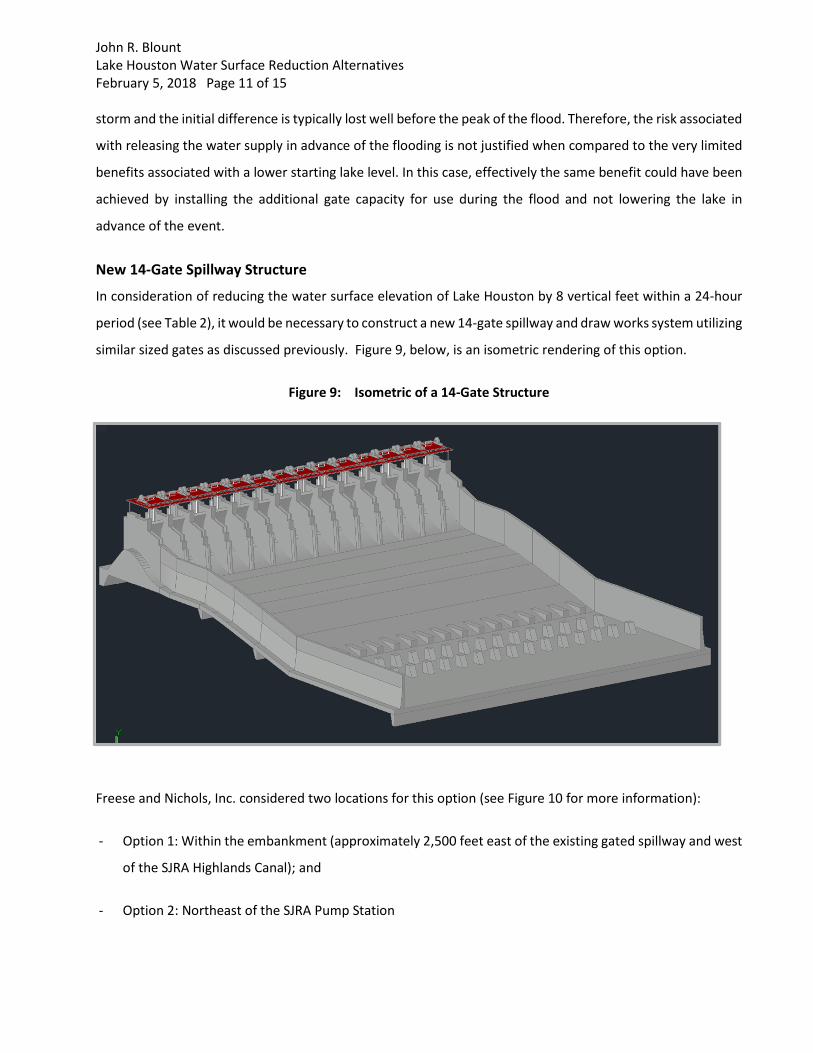
New 14-Gate Spillway Structure
In consideration of reducing the water surface elevation of Lake Houston by 8 vertical feet within a 24-hour
period (see Table 2), it would be necessary to construct a new 14-gate spillway and draw works system utilizing
similar sized gates as discussed previously. Figure 9, below, is an isometric rendering of this option.
Figure 9: Isometric of a 14-Gate Structure
Freese and Nichols, Inc. considered two locations for this option (see Figure 10 for more information):
- Option 1: Within the embankment (approximately 2,500 feet east of the existing gated spillway and west
of the SJRA Highlands Canal); and
- Option 2: Northeast of the SJRA Pump Station

John R. Blount
Lake Houston Water Surface Reduction Alternatives
February 5, 2018 Page 12 of 15
Figure 10: 14 Gate Structure Site Location Options
Each of the options offers variations in cost, complexity and risk. Care and control of surface and groundwater
are major concerns for each site location and each site needs a unique care of water plan. However, the cost
of the gate structure generally remains the same. Option 1 would require a more complex cofferdam design
as opposed to a standard cantilever system. For the purpose of this feasibility analysis, FNI considered a
gravel filled cellular coffer dam system which would require four large diameter (80- to 90-feet), gravel filled
cells or a larger number of smaller diameter cells. The cells would then be engaged by straight runs of
sheetpiles which would be driven through the existing embankment. The cellular cofferdam system would

John R. Blount
Lake Houston Water Surface Reduction Alternatives
February 5, 2018 Page 13 of 15
be a self-supporting structure to facilitate the construction of the new spillway and would be designed to
minimize the phreatic grade line through the cellular cofferdams and across the excavation zone. However,
Option 1 minimizes the amount of earthwork to construct the new earthen channel needed to connect back
with the existing channel, as this channel is west of the ridge line within which the SJRA Highlands Canal
system is constructed.
Option 2 is approximately 3,500 feet from the existing spillway system and is located northeast of SJRA’s
Highlands Canal system. This option would provide for easier surface water constructability as it would be
constructed well downstream of the reservoir. Groundwater would likely be significant, so this option would
likely require a 360-degree sheetpile cofferdam around the construction zone for the spillway. A significant
wellpoint system would be required to offset the buoyant forces within the excavation zone. The challenges
with this option is the elevation change from the proposed structure and the elevation of the new earthen
discharge channel. The length of the earthen channel will have a longer reach than the proposed channel for
Option 1. Additionally, a deep, hard armored siphon structure would need to be constructed beneath the
discharge channel at SJRA’s canal. With Option 2, it would be necessary to construct an earthen or steel
sheetpile cofferdam near the reservoir shoreline and the spillway in order to conduct a significant excavation
for the spillway approach to the reservoir.
Configuration and Costs
In order to estimate rough magnitudes of the potential costs of adding additional spillway capacity, two basic
configurations were considered. The first was the configuration described earlier to install gates in between
the existing buttresses to the east of the existing gates. There are two bays that open directly into the stilling
basin that now have an uncontrolled crest. There are eight bays that are part of the abutment structure that
would require removing a large quantity of backfill and adding a new stilling basin. A maximum of ten gates
could be added in this area. Figure 1 and Figure 2 show a schematic of where these could be located.
The construction cost for this configuration was estimated as an average cost per gate and a fixed cost for
portions of the structure that would be built no matter how many gates are installed, such as the side walls,
some demolition, and the connection to the existing chute. This was estimated as approximately $2 million
fixed cost plus approximately $4.5 million per gate. This is an approximate average as the gate locations
further to the east will require more embankment dirt removal, but that is a relatively small component of
the costs. The total cost for a 10-gate option within the existing buttress system could be approximately $47

John R. Blount
Lake Houston Water Surface Reduction Alternatives
February 5, 2018 Page 14 of 15
million. Refer to the “Cost per Bay” Opinion of Probable Construction Cost in the Appendix of this report for
more information.
The construction cost for the 14-gate alternatives (Option 1 and Option 2) would likely be more expensive
than the slab and buttress gate rehab options by a factor of approximately 2 (see “New 14 Gate Spillway
Structure Located West of SJRA Canal – Option 1” and “New 14 Gate Spillway Structure Located East of SJRA
Canal – Option 2” Opinions of Probable Construction Cost in the Appendix of this report). Both options would
require an emergency generator system electrical wiring. Option 1 will likely cost approximately $91 million
and Option 2 will likely cost approximately $98 million. The primary difference between the two 14-gate
alternatives is the costs associated with excavation of the discharge channels. Although the cellular cofferdam
system (Option 1) is more complex and expensive, it is offset by the cost of the excavation of the discharge
channel and construction of a hard armored siphon for SJRA’s Highlands Canal associated with Option 2.
Option 1 will also be a riskier option as there will be a full penetration of the dam to construct.
All Opinion of Probable Construction Costs (see Appendix) include the soft costs associated with this type of
work, e.g., permitting, engineering analysis and design, surveying, geotechnical, and construction
management and inspection. The contingency would likely cover dam safety instrumentation. See Table 5
for a general summary of the alternatives.
Table 5: Estimated Cost for Added Spillway Gates
Lower
Level By
(ft)
Number of Gates Needed Estimated Cost
($ millions)
$ millions/1-ft reduction of Peak
Lake Level*
24-hr 48-hr 72-hr 24-hr 48-hr 72-hr 24-hr 48-hr 72-hr
4 5 1 0 36 9 NA 53 75 NA
6 9 3 1 63 23 9 51 58 75
8 14 6 3 91-98 43 23 48-51 52 58
* Calculated by combining the reduction in lake level (Table 4) with the estimated cost
Conclusion
Adding additional gates to the spillway at Lake Houston would be a feasible alternative to allow for additional
discharge capacity to reduce the impact of very large flood events. The dam meets current TCEQ regulations
for capacity and storage and no additional gate capacity is required for any regulatory purposes. Though
additional gates would provide the ability to lower the lake quickly in advance of an anticipated major flood
event, the additional capacity of the gates would have far more impact on the flood level than any preliminary
lowering of the lake. However, the impact of the additional capacity is still limited, ranging from only 0.1 foot
John R. Blount
Lake Houston Water Surface Reduction Alternatives
February 5, 2018 Page 15 of 15
with a single gate up to 1.9 feet with 14 gates in an estimate of the Hurricane Harvey flood event. The cost of
installing this additional capacity would also be very high. If measured by the cost per foot of reduction in the
peak lake level, these costs range from $48 to 75 million per foot of reduction.
If the potential limited reductions in extreme events is considered reasonable for the rough estimated costs,
then further analysis with a more detailed layout and cost estimate would be needed to refine the proposed
configuration. If the potential configuration that adds gates to the existing concrete structure, then the
assume gate sizes would be appropriate. If a separate structure, such as shown in Figure 10, is more suitable,
then it is likely that fewer, smaller gates would be more economical.
Based on these findings, no prerelease operating policy is recommended. The risk of losing large quantities of
water supply is substantial with the scenarios considered while the potential benefit on peak flood levels
directly from this prerelease policy is negligible. Any real potential benefit in flood level reduction is simply
from the added spillway capacity used through the duration of the flood. If further consideration is pursued,
we recommend that it only be studied solely with the intent to add additional discharge capacity.
END OF MEMORANDUM