technical note - brighton-hove.gov.uk
TRANSCRIPT

This document is issued for the party which commissioned it and for specific purposes connected with the above-captioned project only. It should not be relied upon by any other party or used for any other purpose.
We accept no responsibility for the consequences of this document being relied upon by any other party, or being used for any other purpose, or containing any error or omission which is due to an error or omission in data supplied to us by other parties.
This document contains confidential information and proprietary intellectual property. It should not be shown to other parties without consent from us and from the party which commissioned it. This Report has been prepared solely for use by the party which commissioned it (the 'Client') in connection with the captioned project. It should not be used for any other purpose. No person other than the Client or any party who has expressly agreed terms of reliance with us (the 'Recipient(s)') may rely on the content, information or any views expressed in the Report. This Report is confidential and contains proprietary intellectual property and we accept no duty of care, responsibility or liability to any other recipient of this Report. No representation, warranty or undertaking, express or implied, is made and no responsibility or liability is accepted by us to any party other than the Client or any Recipient(s), as to the accuracy or completeness of the information contained in this Report. For the avoidance of doubt this Report does not in any way purport to include any legal, insurance or financial advice or opinion. We disclaim all and any liability whether arising in tort, contract or otherwise which we might otherwise have to any party other than the Client or the Recipient(s), in respect of this Report, or any information contained in it. We accept no responsibility for any error or omission in the Report which is due to an error or omission in data, information or statements supplied to us by other parties including the Client (the 'Data'). We have not independently verified the Data or otherwise examined it to determine the accuracy, completeness, sufficiency for any purpose or feasibility for any particular outcome including financial. Forecasts presented in this document were prepared using the Data and the Report is dependent or based on the Data Inevitably some of the assumptions used to develop the forecasts will not be realised and unanticipated events and circumstances may occur Consequently we do not guarantee or warrant the conclusions contained in the Report as there are likely to be differences between the forecasts and the actual results and those differences may be material While we consider that the information and opinions given in this Report are sound all parties must rely on their own skill and judgement when making use of it
Project: Brighton and Hove LUF Application Our reference: Kingsway to the Sea Prepared by: John Blundell Approved by: Oliver Steele Checked by: Georgi Rusinov Subject: Economic Case – Technical Note
1 Introduction This Technical Note details the methodology used to appraise the benefits for the schemes on West Hove Seafront. It set outs the methodology in terms of appraisal of benefits of the preferred option, in line with relevant guidance including MHCLG Appraisal Guide, HMT Green Book, Department for Transport TAG and the Levelling Up Fund Guidance.
The technical note sets the methodology utilised for estimating the benefits and economic costs to establish the project’s value for money – including the calculation of a benefit-cost ratios. It is structured as follows:
● Scheme Benefits – This section details the methodology used to appraise the scheme benefits in the West Hove Seafront Levelling Up Fund application form. It set outs the methodology in terms of appraisal of benefits of the preferred option, in line with relevant guidance.
● Economic Costs – This section details the methodology used to develop the economic costs in the West Hove Seafront economic case. It set outs the methodology in terms of appraisal of costs of the preferred option, in line with relevant guidance.
● Value for Money – This section details the methodology used to assess the Value for Money of the preferred option presented in the West Hove Seafront economic case. It sets out the approach used to calculate the “benefit-cost ratio (BCR)
The economic appraisal of the Kingsway to the Sea scheme has been undertaken in compliance with the relevant guidance, including MHCLG Appraisal Guide, HMT Green Book, Department for Transport TAG and Levelling-Up Fund guidance.
2 Scheme benefits To capture the full range of benefits of the scheme, the economic analysis has included the following methodologies:
● Pedestrian movement analysis using DfT’s WebTAG-compliant AMAT model. ● Public realm improvement using the Valuing Urban Realm Toolkit (VURT), centring on rateable values
of property in the vicinity of Kingsway to the Sea. ● Labour supply benefits from the creation of new employment in the visitor economy: Employment
impacts assessing the value of moving heretofore unemployed people into employment through this scheme.
● Wider land value uplift (LVU) – to capture the social value of the uplift in residential property values as a result of a regeneration project in the vicinity.
● Cultural and Sport Participation Wellbeing benefit - wellbeing benefits from participation in sport to both local residents and visitors.
Technical Note

30 July 2020
The benefits of VURT are set out over a 30-year appraisal period in line with the build out profile produced through work between the Council and Mott MacDonald. These benefits have been discounted at a rate of 3.5% per annum in line with MHCLG appraisal guidance. A consistent price base across all benefits has been applied to be compliant with HM Treasury Green Book guidance.
2.1 Wider LVU associated with West Hove Seafront
2.1.1 House Price LVU
There is expected to be significant impact on land value, a benefit known as land value uplift, from the interventions in the surrounding area. The scheme components below will considerably improve the public realm and visual amenity of the area:
● Significant remodelling and landscaping of the public parkland between the King Alfred Sports Centre and Hove Lagoon;
● Both new and improved sports facilities for residents and visitors – Padel tennis. beach tennis, croquet, traditional tennis, 5-a-side football;
● New leisure facilities such as a pump track and skate park to encourage greater footfall by young people; ● New business opportunities at the seafront through redevelopment of dilapidated buildings and creation
of outdoor events space; ● New accommodation provided for existing tenants, such as the bowling club, and expanded modern
accommodation will provide space for additional tenants; ● Expansion of outdoor family facilities at Hove Lagoon to devote more space for creative play which is free
for everyone; ● Improved biodiversity and attractiveness for a significant green space across West Hove and South
Portslade.
These improvements are expected to have a significant impact on the price of housing and the value of commercial property. This is because these scheme improvements are expected to make the area considerably more desirable for people to live, work and visit. A fundamental strategic aspiration for this scheme is to elongate the attractiveness of the city’s seafront so that Hove can share in the prosperity in the same way.
According to CBRE1, “Regeneration can significantly improve an area and the quality of life for its residents. It helps enhance public realm, connectivity and local amenities. Transforming an area into a more desirable place to live, regeneration increases the demand for homes. As a result, the price growth of residential properties in the area outperform the wider market”.
For Greater London, research by CBRE suggests from the start of the regeneration, property prices within 500m of a regeneration zone increase by 1.5% per annum over and above wider growth, and that this premium increases to 3.6% when the regeneration programme has become established.
The impact on residential properties has also been captured surrounding the West Hove Seafront improvements. The impact on property prices has been calculated by using HM Land Registry Price Paid Data2 for the Brighton and Hove area for 2019, 2020 and 2021. The average for each property type was taken for the district. The relevant calculations are shown in Table 2.1.
1 CBRE, 2019, Regeneration: transforming London's landscape, Available at: https://www.cbreresidential.com/uk/en-GB/content/regeneration-transforming-londonslandscape 2 HM Land Registry, 2021, Open Data Portal. Available at: https://landregistry.data.gov.uk/

30 July 2020
Table 2.1: Average price paid data by unit type (2019, 2020 and 2021) Unite Type Total Sales Price Number of transactions Average Sales Price Flat £ 579,768,665 2,060 £ 281,441
Terrace £ 896,708,506 1,924 £ 466,065
Semi-Detached £ 504,004,194 1,198 £ 420,705
Detached £ 469,396,431 770 £ 609,606 Source: HM Land Registry
An Ordnance Survey map was used to estimate the number of dwellings within a 500m radius of the intervention. Atypical properties such as house boats, other, and annexes have also been excluded from the analysis. The average price of the type of unit was multiplied by the number of units in the area to estimate the value of the property and land.
CBRE research suggests an increase in property prices of 3.6% per year once the redevelopment has been realised. However, since this quantitative research relates to London, for the purpose of this assessment for the LUF, the appraisal uses a significantly lower increase of 2.5% in property values over a five-year period following the development to reflect differentials in property price growth outside of the capital.
It is assumed that the increases in house prices happen over a two-year period in the area around the intervention. A period of two years was chosen given the nature of the Brighton and Hove district. The seafront has multiple attractions, monuments and buildings of significance, so the impact of improved visual amenities and public realm is likely to have an impact not over a prolonged period like somewhere without these assets. Had the intervention happened in a deprived location as a catalyst for regeneration, the impact may have been for more extensive period.
Assuming property price growth of 2.0% spread over a two-year period as a result of the proposed intervention, the total increase in property values is estimated at £ £23,729,000 (for both years total; discounted to 2021 prices). It has been assumed that this increase in property values reflects the LVU associated with nearby housing as a result of West Hove Seafront interventions.
2.1.2 LVU additionality
If the monies are not realised through this Levelling Up Fund application, it is unlikely that the private sector would bring forward these interventions, and thus would not go ahead. Therefore, we can expect that the Land Value Uplift impact to be additional because it is not something the private sector would deliver. The LVU would therefore be zero in the absence of the Levelling Up Funding and as such a deadweight loss of 0% has been assumed. The land value increase benefits have been discounted at a rate of 3.5%, in line with HMT Green Book guidance.
The displacement associated with this LVU impact is assumed to be low, given that Brighton and Hove is an attractive place to locate. The intervention is likely to increase the desirability of the whole rather than displace activity from elsewhere. The interventions are likely to make Hove more attractive without making Brighton relatively less attractive. An overall additionality assumption of 48% has been used, based on similar projects.
2.2 Public realm valuation (rateable value)
2.2.1 Valuing Urban Realm Toolkit (VURT)
The Valuing Urban Realm Toolkit (VURT) has been developed by Transport for London (TfL) to provide objective, evidence-based justifications for investment in public realm. VURT quantifies the uplift in the value
30 July 2020
of extant businesses within an area by applying an uplift to the rateable values of those businesses in proportion to the scale of the enhancement to the public realm.
The logic underpinning the VURT assessment is that an improved streetscape, with better lighting with a higher quality environment and a greater sense of personal security improves the attractiveness of an area and increases footfall in that area. The increased footfall and attractiveness of the area adds value to businesses whose customer base on the location of their premises increases, making the businesses more valuable.
Based on research undertaken by TfL3, a 1.22% uplift for each stepped increase in quality that is ascribed to the public realm enhancements being proposed in a scheme is applied to the current rateable value of each business assessed to be directly impacted by the enhancement to the public realm.
The VURT assessment is a multistage process as outlined below:
1) Assessment of the existing streetscape quality using a Pedestrian Environment Review System (PERS) review
PERS was developed by the Transport Research Laboratory (TRL) and provides a framework against which current and future streetscapes can be assessed. Typically, a PERS comprises two types of review: a link review and a space review in accordance with VURT methodology. However, only the link review has been undertaken for the purposes of this assessment. This is to avoid double counting the benefits captured in the pedestrian movement analysis.
Links are defined as any complete footway, or section of footway, as set by the reviewer. The sections are defined based on the use and characteristics of the different links in the study area. A link review was conducted for the area the promenade and the beach front shown in Figure 2.1.
A PERS link assessment process typically considers 14 parameters4, but in order to avoid double counting the benefits captured in the pedestrian movement analysis, this assessment only considers the following four parameters:
● Lighting ● Personal security ● Quality of environment ● Maintenance
PERS assessments attribute scores of between -3 and +3 for each of these four areas both on the current public realm and on the specific proposals for enhancements to the public realm. A score of 0 is considered average, +3 is very good and -3 is very poor in terms of the quality of the pedestrian environment.
Scoring is contextual and so one location that is considered average, for example in a residential area, may be poor in a retail area where footfall and pedestrian needs are greater, and the range of user types is more varied.
2) Assessment of the future streetscape quality arising from the proposed scheme (plan-based PERS assessment
This follows an identical methodology to Stage 1 but applied to the proposed scheme rather than the existing streetscape.
The PERS assessment for the West Hove Seafront scheme is detailed in Table 2.2.
3 Transport for London (November 2016) Valuing Urban Realm Toolkit 2016 - User Guide
4 Effective width; Dropped kerbs; Gradient; Obstructions; Permeability; Legibility; Lighting; Tactile information; Colour contrast; Personal security; Surface quality; User conflict; Quality of environment; and Maintenance

30 July 2020
Table 2.2: VURT PERS result Market Square Baseline Scenario Change Value Uplift Lighting -1 2 3 3.66%
Personal security 1 3 2 2.44%
Quality of environment 2 3 1 1.22%
Maintenance 1 3 2 2.44%
Total % Uplift in Rateable Value 9.76% Source: Mott MacDonald analysis
3) Valuation of the change in streetscape quality between the existing (Baseline) situation and the future (Scenario) situation through application of rateable values to monetise all user benefits
Using Valuation Office Agency (2017) data for the total rateable values for the businesses assessed to be directly impacted by the enhancement to the public realm have been calculated. The table below presents the estimated incremental uplift in rateable values from the PERS assessment explained above. These have been inflated to 2021/22 prices using HM Treasury GDP deflators.
Table 2.3: VURT results - annual Scheme Element Incremental uplift (2021/22, £)
West Hove Seafront £76,087 Source: Mott MacDonald, VURT
5) Annualisation of user benefits to calculate the overall benefit from the lifetime of the scheme in terms of public realm improvements
The impact in this case is an annual benefit, that can persist over the full lifetime of the asset, considered to be until 2050 for the purposes of this assessment. This is deemed to be prudent because the town is an economic centre of the South East and has good transport links to London. These benefits have subsequently been converted into present values by applying HM Treasury discount rate of 3.5%, assuming that the benefits begin once the scheme has been finished. Table 2.4 presents the results of the VURT analysis in a present value.
Table 2.4: VURT results total Scheme Element Present Value (2021/22, £) West Hove Seafront £1,448,374
Source: Mott MacDonald, VURT
2.3 Pedestrian movement analysis Pedestrian movement analysis has been undertaken using the Department for Transport (DfT)’s WebTAG-compliant Active Mode Appraisal Toolkit (AMAT)5. The toolkit allows the user to undertake the economic appraisal of cycling and walking trips and accounts for impacts such as: physical activity, journey quality, greenhouse gases, noise, air quality, indirect tax and accidents from changes in car trips. The economic appraisal that is undertaken is for cycling and walking interventions that are in line with TAG Unit A5-1 and are suitable for this analysis because modelling of other modes has not been undertaken (as per the guidance).
5 Department for Transport, 2020, Active Mode Appraisal Toolkit. Available at:
https://assets.publishing.service.gov.uk/government/uploads/system/uploads/attachment_data/file/888754/amat-user-guidance.pdf

30 July 2020
Datscha6 data was utilised to estimate the average number of people making a walking trip within or immediately surrounding the area shown in Figure 2.1. The number of cycling trips for this area was not readily available and therefore cycling was not considered as part of the AMAT appraisal. Datscha states that on average 1,587 walking trips per day are made.
Figure 2.1: Kingsway to the Sea area
Source: Brighton and Hove City Council
The AMAT Toolkit requires an uplift to be applied to the number of trips to consider the intervention. It is an accepted industry standard to apply a 30% uplift to the daily number of trips when considering that there will be significant public realm and visual amenity enhancements and the trip attractors along the route will also have been improved. Therefore, the do-minimum scenario considered 1,587 trips (as per the Datscha estimate) and a do something scenario which considered 2063 trips. The assumptions made in AMAT are presented in Table 2.5.
Table 2.5: AMAT Assumptions Assumption Value Justification Number of trips without the proposed intervention
1,587 Current number of trips on a weekday
Number of trips with the proposed intervention
2,063 Current number of trips on a weekend; assumed to become as many on every day of the week with the intervention.
How much of an average walking trip using the interventions
75% Mott MacDonald assumption.
Average length of walking trip 1.1km National Travel Survey Data 2012-2014, standard assumption in AMAT
Average walking speed
5km/h National Travel Survey Data 2016, standard assumption in AMAT
Return journeys 90% National Travel Survey Data 2018
Background growth rate in trips 0.75% National Travel Survey Data 2006-2016
6 Datscha, 2021, Pedestrian data. Available at: https://datscha.co.uk/solution/#:~:text=Datscha%20is%20a%20web-
based%20solution%20giving%20you%20fast%2C,or%20even%20days%20on%20your%20data-gathering%20and%20analysis.

30 July 2020
Assumption Value Justification Number of days for which intervention data is applicable per year
253 Number of working days per year (365 minus weekends minus public holidays)
Length of appraisal period 10 years MM Assumption
Source: Various, as per table above. Most are default assumptions recommended by AMAT.
In addition to the estimates inputted form Datscha, it was also assumed that 75% of those walking in the area would be using the intervention in the area. The opening year of the intervention was assumed to be 2022 and completed by 2025 and the appraisal period was entered as 30 years. There are several options for the type of area the intervention is in. The choices are London, Inner London, Other Urban, Rural and National Average and the description ‘Other Urban’ was opted for. There are several other assumptions that are already embedded in the spreadsheet provided by the Department for Transport.
AMAT then calculates the wellbeing benefits accruing to pedestrians as a result of the enhancement of the Madeira Terrace pedestrian route. This is the total benefits the intervention is expected to deliver over the appraisal period. These values are discounted and deflated to 2010 values and prices, so it has been necessary to inflate them back to 2021 prices. The discounted value of this benefit over a 10-year period is estimated to be £3,320,000 (2021/22 prices).
2.4 Labour supply benefits The commercial components of the intervention employ a range of people in the visitor, tourism and leisure economy. Given the current state of the facilities in the area it is expected, without a capital investment, they would continue to deteriorate, and this would have a negative impact on the level of employment in the area. A description of the current tenants, their uses and the number of Full Time Equivalents (FTEs) they employ is set out in Table 2.6.
Table 2.6: Commercial spaces, uses and FTE employment
Tenant Use Lease/licence Lease term Security of tenure? FTE Employed
Hove Lagoon Watersports Tuition, hire and club membership for
wakeboarding, sailing, SUP, kayaks, windsurfing.
Lease for watersports centre and a licence to use the lagoons
15 years to Sep 2028 Yes 12
Brighton & Hove Model Yacht Club Clubhouse and use of the lagoon
Lease for NW shelter and a licence to use the lagoon
10 years to Jan 2026 No 0
Big Beach Café Café and venue hire
Lease including outside seating area
15 years to Mar 2024 Yes 8
Heal’s children’s amusements
Crazy golf, trampolines and children’s rides Short term lease
2 years to Nov 2021 No 4
Rockwater Bar and restaurant Lease
25 years to Oct 2045 Yes
50 Rockwater
Kiosks on Esplanade Short term lease 2 years to Oct 2022 No
Hove & Kingsway Bowls Club Clubhouse bar and café Lease
15 years to Aug 2030 Yes 4

30 July 2020
Tenant Use Lease/licence Lease term Security of tenure? FTE Employed
Hove & Kingsway Bowls Club Pavilion changing rooms Lease
15 years to Aug 2030 Yes 0
Fish Galore Fish stall Lease
4 years to Nov 2021 No 4
Lex’s Café Café including outside seating Lease
15 years to Sep 2024 No 5
Source: Brighton and Hove Council
MHCLG guidance gives an approach for quantifying the fiscal benefits of moving locally unemployed workers into employment. The guidance utilises WebTAG A2.3 (Appraisal of Employment Affects) to calculate welfare impacts over and above user benefits to the Exchequer.
These are the tax revenues resulting from labour supply impacts and can be estimated as 40% of the resultant change in GDP. This tax revenue impact reflects both the increase in tax revenue (income tax, national insurance contributions and corporation tax) and the reduction in out-of-work subsidies.
Through safeguarding jobs, the intervention will have a positive effect, ensuring workers remain in employment due to the scheme. This welfare gain is estimated through the following steps:
Step Assumptions applied to the safeguarded employment at West Hove Seafront 1 Apply the direct employment at the commercial elements of West Hove Seafront which totals 87 jobs. However, 50
jobs are employed at the bar and restaurant and a further 13 in cafes that are likely to have a greater dependency to their proximity to the sea rather than the physical condition of some of the surroundings. Therefore, to be conservative, we have estimated a quarter of the 87 jobs are being safeguarded by the improvements, equating to 22 (rounded) jobs.
2 Apply an induced multiplier of 1.29 to account for induced from the direct employment at West Hove Seafront. This leads to 29 (rounded) gross total jobs.
3a Calculated the net additional jobs for all jobs. This is based on: 1. A leakage factor of 31% - Leakage is the proportion of the project outputs that benefit those outside of the intervention’s target area/population i.e. the residents of Brighton and Hove. Based on travel to workflows in the Brighton and Hove area (Census 2011), approximately 31% of Brighton and Hove jobs are filled by non-Brighton and Hove residents. 2. A displacement factor of 25% - as per HCA additionality guidance. Displacement is the proportion of intervention outputs accounted for by reduced outputs elsewhere in the target area. Displacement is anticipated to be low for this intervention. 3. A deadweight factor of 0% - This is due to the use of a Do-Nothing scenario (the loss of jobs within the Visitor Economy sector), which is then subtracted from the intervention scenario. 4. Substitution factor of 0% - Substitution arises when a firm substitutes one activity for a similar one as a result of the intervention. This is not identified as an issue for this scheme. Collectively, this leads to an additionality value of 52%, which is then applied to total jobs.
3b This calculation led to 15 (rounded) net additional jobs, which are considered safeguarded by the scheme intervention.
30 July 2020
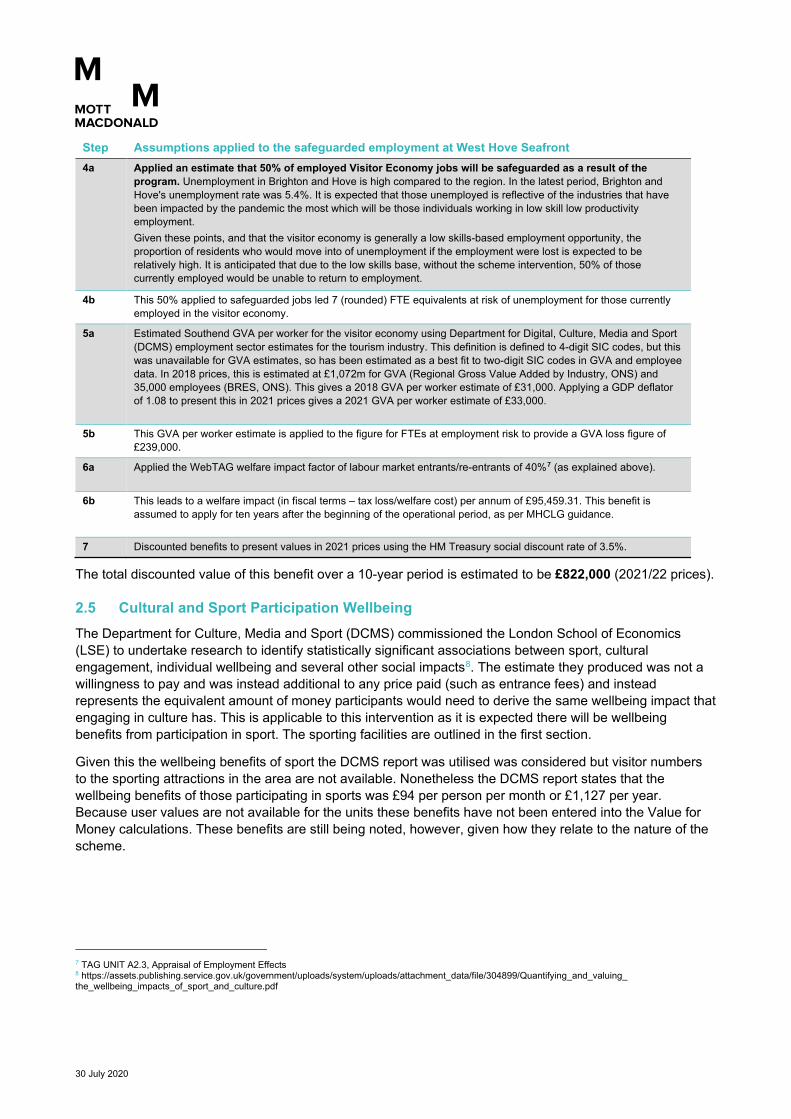
Step Assumptions applied to the safeguarded employment at West Hove Seafront 4a Applied an estimate that 50% of employed Visitor Economy jobs will be safeguarded as a result of the
program. Unemployment in Brighton and Hove is high compared to the region. In the latest period, Brighton and Hove's unemployment rate was 5.4%. It is expected that those unemployed is reflective of the industries that have been impacted by the pandemic the most which will be those individuals working in low skill low productivity employment. Given these points, and that the visitor economy is generally a low skills-based employment opportunity, the proportion of residents who would move into of unemployment if the employment were lost is expected to be relatively high. It is anticipated that due to the low skills base, without the scheme intervention, 50% of those currently employed would be unable to return to employment.
4b This 50% applied to safeguarded jobs led 7 (rounded) FTE equivalents at risk of unemployment for those currently employed in the visitor economy.
5a Estimated Southend GVA per worker for the visitor economy using Department for Digital, Culture, Media and Sport (DCMS) employment sector estimates for the tourism industry. This definition is defined to 4-digit SIC codes, but this was unavailable for GVA estimates, so has been estimated as a best fit to two-digit SIC codes in GVA and employee data. In 2018 prices, this is estimated at £1,072m for GVA (Regional Gross Value Added by Industry, ONS) and 35,000 employees (BRES, ONS). This gives a 2018 GVA per worker estimate of £31,000. Applying a GDP deflator of 1.08 to present this in 2021 prices gives a 2021 GVA per worker estimate of £33,000.
5b This GVA per worker estimate is applied to the figure for FTEs at employment risk to provide a GVA loss figure of £239,000.
6a Applied the WebTAG welfare impact factor of labour market entrants/re-entrants of 40%7 (as explained above).
6b This leads to a welfare impact (in fiscal terms – tax loss/welfare cost) per annum of £95,459.31. This benefit is assumed to apply for ten years after the beginning of the operational period, as per MHCLG guidance.
7 Discounted benefits to present values in 2021 prices using the HM Treasury social discount rate of 3.5%.
The total discounted value of this benefit over a 10-year period is estimated to be £822,000 (2021/22 prices).
2.5 Cultural and Sport Participation Wellbeing The Department for Culture, Media and Sport (DCMS) commissioned the London School of Economics (LSE) to undertake research to identify statistically significant associations between sport, cultural engagement, individual wellbeing and several other social impacts8. The estimate they produced was not a willingness to pay and was instead additional to any price paid (such as entrance fees) and instead represents the equivalent amount of money participants would need to derive the same wellbeing impact that engaging in culture has. This is applicable to this intervention as it is expected there will be wellbeing benefits from participation in sport. The sporting facilities are outlined in the first section.
Given this the wellbeing benefits of sport the DCMS report was utilised was considered but visitor numbers to the sporting attractions in the area are not available. Nonetheless the DCMS report states that the wellbeing benefits of those participating in sports was £94 per person per month or £1,127 per year. Because user values are not available for the units these benefits have not been entered into the Value for Money calculations. These benefits are still being noted, however, given how they relate to the nature of the scheme.
7 TAG UNIT A2.3, Appraisal of Employment Effects 8 https://assets.publishing.service.gov.uk/government/uploads/system/uploads/attachment_data/file/304899/Quantifying_and_valuing_ the_wellbeing_impacts_of_sport_and_culture.pdf

30 July 2020
3 Economic Costs This section describes the methods utilised to develop the economic costs in the West Hove Seafront Levelling Up Fund application. It sets out the appraisal of costs of the preferred option in terms of the methodology used. The MHCLG Appraisal Guide and HMT Green Book have been abided by throughout this analysis. A discount rate of 3.5% per annum has been applied and each scheme element has been financially appraised. As per the guidance in HM Treasure Green Book a consistent price base has been applied across all costs.
3.1 Scheme Costs Each scheme element has been individually financially appraised. The assumptions used to appraise each of the scheme elements conform to industry standards, although they do differ slightly according to how far design development has progressed for each element. Details of the financial appraisal are presented within the Financial Case.
Figure 3.1: Cost profile per year of the preferred option (Real Prices)
Real Prices Section Name Year 1 2021/22 Year 2 2022/23 Year 3 2023/24 Total 1 Park Garden East £45,425 £218,799 £417,158 £681,382
2 Events Space £54,417 £262,108 £499,727 £816,252
3 Bowls & Garden £145,939 £702,939 £1,340,205 £2,189,083
4 Rockwater Garden £8,655 £41,691 £79,488 £129,834
5 Courts & Pitches East £44,218 £212,982 £406,066 £663,266
6 Courts & Pitches West £85,081 £409,805 £781,324 £1,276,210
7 Park Garden West £58,644 £282,468 £538,547 £879,659
8 Skate & Pump £193,377 £931,434 £1,775,848 £2,900,659
9 Hove Lagoon £35,227 £169,675 £323,498 £528,400
- Total £670,983 £3,231,901 £6,161,861 £10,064,745 Source: Brighton and Hove Council
To calculate economic costs, inflation has been excluded as per MHCLG guidance and costs are discounted each year at a rate of 3.5%, in line with HMT Green Book guidance. All costs have been reported in a consistent 2019/20 price base.
3.2 Optimism bias and contingency cost The costs of this scheme include optimism bias and contingency to quantify the impact of risk on these costs. Optimism Bias is defined by HM Treasury in its supplementary Green Book guidance9 as a proportion of the cost of a scheme that is factored into the total scheme cost that accounts for the tendency for project appraisers to underestimate the cost, or to estimate the cost of a scheme overly optimistically.
Both optimism bias and risk are reflections of the level of uncertainty around an individual project and attempt to account for the potential cost implication of unknown factors or identified risks being realised. Optimism bias and contingency are conventionally higher the earlier into the project lifecycle a scheme is. As more appraisal and investigation work is undertaken on a scheme, the level of uncertainty and risk is reduced, which is reflected in reduction in both contingency and optimism bias.
9 HM Treasury, 2019, Supplementary Green Book Guidance: optimism Bias

30 July 2020
An optimism bias has been estimated for each of the constituent projects of this scheme. This has been allocated according to the type of scheme according to the upper bound limit of the HM Treasury Green Book guidance. We have classified the regeneration of the West Hove Seafront as standard given the Major Projects Team at Brighton and Hove Council are expected to deliver this as part of their day-to-day operations. As per the Greenbook’s guidance10 the optimism bias is therefore 24%. As the schemes progress to detailed design and greater confidence in the cost estimates is gained, the optimism bias will be reduced.
4 Value for Money This section of this technical note details the methodology used to assess the Value for Money for the preferred option presented in the West Hove Seafront Levelling Up Fund application. It sets out the benefit-cost ratio (BCR).
4.1 Benefit-Cost Ratio The Value for Money (VfM) of a proposed project is judged on the size of the project’s monetised benefits relative to monetised costs – the project’s benefit-cost ratio (BCR) – and the potential significance of any non-monetised impacts.
The BCR of a project is the estimated Present Value Benefits (PVB) divided by a budget constraint or the Present Value Costs (PVC). This can be interpreted as the estimated level of benefit per £1 of cost. The difference between the PVB and PVC is the Net Present Social Value (NPSV). This measures the overall level of public welfare generated by a policy.
This economic appraisal seeks to capture all the impacts (i.e. benefits and costs) associated with an intervention, including both private impacts and external impacts. All figures are discounted to 2019/20, and all co-funding costs (including borrowing) have been used in the present value of costs.
The BCR comprises of benefits where there is a strong underlying evidence base from the MHCLG department’s perspective and these have been monetised consistently with the published guidance (i.e. Green Book, Green Book Supplementary, and relevant Departmental guidance).
The formula for calculating regeneration and cultural projects’ BCR7 is:
BCR = total discounted benefits minus total discounted private sector costs divided by total discounted social costs
For the purposes of this economic appraisal, the following benefits have been included in the BCR:
● Wider LVU benefit ● Pedestrian Movement benefits ● Public Realm benefits ● Labour supply benefits ● No welfare benefits from enhanced sport engagement
10 HM Treasury, 2013, Green Book supplementary guidance: optimism bias. Available at: https://www.gov.uk/government/publications/green-book-
supplementary-guidance-optimism-bias

30 July 2020
The detailed methodology used to estimate these benefits has been set out above in the Scheme Benefits section of this Appendix.
The BCR for the Kingsway to the Sea scheme is 2.48, inclusive of co-funding. This indicates excellent value for money.
Table 4.1: Core economic impact assessment results Total net additional benefits Preferred Option (PV, 2021-22 prices) Benefits for the BCR £29,316,335 Residential land value uplift (LVU) £23,728,561
Labour Supply Benefits £821,684
AMAT £3,317,716
VURT £1,448,374
Total benefits for the BCR (A) £29,316,335 Costs £11,836,737 LUF cost/funding (B) £10,840,881 Co-funding local authority cost (including borrowing) (C) £995,857
Total cost (LUF + Co-funding) (D) 11,836,737
Private sector cost (E) 0.00
BCR calculation - (A-E)/D 2.48 Source: Mott MacDonald Calculations