technical report documentation page 1. report …...conductive asphalt concrete has a huge potential...
TRANSCRIPT

Technical Report Documentation Page 1. Report No.
SWUTC/14/600451-00025-1
2. Government Accession No.
3. Recipient's Catalog No.
4. Title and Subtitle CONTROLLING CONDUCTIVITY OF ASPHALT CONCRETE WITH
GRAPHITE
5. Report Date
August 2014 6. Performing Organization Code
7. Author(s) Philip Park, Younho Rew, and Aishwarya Baranikumar
8. Performing Organization Report No.
Report 600451-00025-1 9. Performing Organization Name and Address Texas A&M Transportation Institute
College Station, Texas 77843-3135
10. Work Unit No. (TRAIS)
11. Contract or Grant No.
DTRT12-G-UTC06 12. Sponsoring Agency Name and Address
Southwest Region University Transportation Center
Texas A&M Transportation Institute
College Station, Texas 77843-3135
13. Type of Report and Period Covered
14. Sponsoring Agency Code
15. Supplementary Notes
Supported by a grant from the U.S. Department of Transportation, University Transportation Centers Program. 16. Abstract
Electrically conductive asphalt concrete has a huge potential for various multifunctional applications such as
self-healing, self-sensing, and deicing. In order to utilize the full spectrum of applications of electrically conductive
asphalt composites, precise control of the asphalt mixture resistivity is needed. Most of the previous research using
conductive fibers as the primary conductive additives observed a sudden transition from the insulated to conductive
phase, commonly known as the percolation threshold, which obstructs more precise conductivity control. Aiming to
control the electrical conductivity of asphalt concrete with a smooth transition from the insulated to conductive
phase, the researchers have selected graphite powders as an alternative conductive additive in this study. Nine types
of graphite having different particle shape, size, and origin were mixed with asphalt binders, and their effects on
imparting conductivity were investigated. Based on the results, the research team selected two types of graphite and
evaluated the effects on the electrical conductivity of asphalt concrete. The team also examined the effects of
aggregate gradation, binder content, and binder type.
The results showed that the electrical conductivity of asphalt mastic is sensitive to the graphite type. The
natural flake graphite is effective to mitigate the percolation threshold, and a sufficiently high conductivity can be
achieved by replacing a part of the fillers with graphite (the conductivity ranged from 10−6
to 10−2
/Ω•cm). The results
also showed that the binder type does not make a significant change in the mixture conductivity, but the aggregate
gradation brings approximately two order differences in the volume resistivity. Mechanical performance of the
conductive asphalt is also an important factor for practical field applications. The indirect tension test results showed
that the addition of graphite improves the indirect tensile strength up to 41 percent. The electrical and mechanical
data obtained from this study provide essential information on the selection of graphite type and asphalt mixture
design to achieve the proper electrical conductivity required for the probable multifunctional applications of asphalt
concrete, which will lead to technical innovations for sustainable pavements.
17. Key Words
Electrical Conductivity Control, Graphite, Asphalt
Concrete, Percolation Threshold
18. Distribution Statement
No restrictions. This document is available to the
public through NTIS:
National Technical Information Service
Alexandria, Virginia 22312
http://www.ntis.gov 19. Security Classif. (of this report)
Unclassified
20. Security Classif. (of this page)
Unclassified
21. No. of Pages
106
22. Price
Form DOT F 1700.7 (8-72) Reproduction of completed page authorized


CONTROLLING CONDUCTIVITY OF
ASPHALT CONCRETE WITH GRAPHITE
By
Philip Park
Younho Rew
And
Aishwarya Baranikumar
Report 600451-00025-1
Project Title: Controlling Electrical Conductivity of Asphalt Concrete for
Multifunctional Applications
Sponsored by the
Southwest Region University Transportation Center
Texas A&M Transportation Institute
College Station, Texas 77843-3135
August 2014


v
DISCLAIMER
The contents of this report reflect the views of the authors, who are responsible for the
facts and the accuracy of the information presented herein. This document is disseminated under
the sponsorship of the Department of Transportation University Transportation Centers Program
in the interest of information exchange. The U.S. Government assumes no liability for the
contents or use thereof.

vi
ACKNOWLEDGMENTS
The authors recognize that support for this research was provided by a grant from the U.S.
Department of Transportation University Transportation Centers Program to the Southwest
Region University Transportation Center.
The authors extend their gratitude to Asbury Carbons and Knife River Corporation for
providing the raw materials used for the research at no cost. In addition, the authors acknowledge
Dr. Amit Bhasin from the University of Texas at Austin for serving as a project monitor for this
study.

vii
TABLE OF CONTENTS
Page
LIST OF FIGURES ....................................................................................................................... ix
LIST OF TABLES ........................................................................................................................ xii
EXECUTIVE SUMMARY ............................................................................................................ 1
1. INTRODUCTION ...................................................................................................................... 3
1.1 Background ......................................................................................................................... 3
1.2 Problem Statement .............................................................................................................. 5
1.3 Research Objectives ............................................................................................................ 7
2. LITERATURE REVIEW ........................................................................................................... 9
2.1 Approaches to Impart Conductivity into Asphalt Concrete ................................................ 9
2.2 Multifunctional Applications of Conductive Asphalt Concrete ....................................... 17
Snow and Ice Removal Using Electric Heating .................................................................... 17
Promoting Self-Healing ........................................................................................................ 18
Strain and Damage Self-Sensing .......................................................................................... 18
2.3 Multifunctional Applications of Conductive Cement Concrete ....................................... 19
Conductivity of Cement-Based Composites ......................................................................... 20
Self-Actuating Materials ....................................................................................................... 22
Self-Sensing Cement Matrix Composites ............................................................................. 22
Damage Sensing .................................................................................................................... 23
Temperature Sensing ............................................................................................................ 24
Electromagnetic Shielding .................................................................................................... 25
Percolation Theory ................................................................................................................ 25
3. CHARACTERIZATIONS OF RAW MATERIALS ............................................................... 27
3.1 Types of Graphite ............................................................................................................. 27
3.2 Scanning Electron Microscope Analysis .......................................................................... 28
3.3 Physical Properties of Other Materials ............................................................................. 33
4. ELECTRICAL CONDUCTIVITY OF ASPHALT MASTIC ................................................. 35
viii
4.1 Introduction ....................................................................................................................... 35
4.2 Materials and Experiments—Electrical and Viscoelastic ................................................. 35
4.3 Result and Discussion ....................................................................................................... 38
Effect of Steel Fiber on Electrical Conductivity ................................................................... 38
Effect of Graphite Types on Electrical Conductivity............................................................ 39
DSR Test Results .................................................................................................................. 46
Effect of Different Binder Types .......................................................................................... 48
5. ASPHALT CONCRETE TEST ............................................................................................... 51
5.1 Introduction ....................................................................................................................... 51
5.2 Materials and Experiments—Electrical and Mechanical .................................................. 51
Materials and Mix Design ..................................................................................................... 51
Specimen Preparation ........................................................................................................... 52
Electrical Resistivity Measurement Setup ............................................................................ 53
Indirect Tensile Strength Test ............................................................................................... 54
5.3 Results and Discussion ..................................................................................................... 55
Volumetrics ........................................................................................................................... 55
Electrical Resistivity Test ..................................................................................................... 57
Indirect Tensile Strength ....................................................................................................... 58
Electrical Resistivity Test Related to Effect of Gradation .................................................... 59
Indirect Tensile Strength Related to Effect of Gradation ..................................................... 60
6. CONCLUSIONS AND SUMMARY ....................................................................................... 63
REFERENCES ............................................................................................................................. 65
APPENDICES .............................................................................................................................. 71

ix
LIST OF FIGURES
Page
Figure 1. Possible Applications and Benefits of Electrically Conductive Asphalt
Concrete. ............................................................................................................................. 4
Figure 2. Components of High-Performance Conductive Asphalt Concrete. ................................ 4
Figure 3. Electrical Resistivity Transition Curve. .......................................................................... 6
Figure 4. Work Tasks. ..................................................................................................................... 8
Figure 5. Schedule of Activities...................................................................................................... 8
Figure 6. Effect of Type of Conductive Additive on Electrical Resistivity of Asphalt
Concrete (Wu et al. 2005). ................................................................................................ 10
Figure 7. Mechanical Properties of HMA Mixture with Conductive Additives (Huang et
al. 2009). ........................................................................................................................... 11
Figure 8. Schematic Representation of Volume Resistivity versus Conductive Additive
Content (Garcia et al. 2009). ............................................................................................. 12
Figure 9. Variation in Electrical Resistivity with Sand-Bitumen Ratio (Garcia et al.
2009). ................................................................................................................................ 13
Figure 10. Mechanical Test Results of Conductive Asphalt Concrete (Wu et al. 2010). ............. 14
Figure 11. Indirect Tensile Strength on Conductive Porous Asphalt Concrete (Liu et al.
2010b). .............................................................................................................................. 15
Figure 12. SEM Images of Graphite Powders. ............................................................................. 29
Figure 13. Experimental Setup for Measuring Electrical Property. .............................................. 36
Figure 14. Experimental Setup for Measuring Viscoelastic Property. ......................................... 38
Figure 15. Electrical Resistance of Asphalt Concrete Containing 30-mm-Long Steel
Fibers................................................................................................................................. 39
Figure 16. Electrical Resistivity of Asphalt Mastics Containing Various Graphite Types. ......... 40
Figure 17. Comparison of Volume Resistivity of Various Graphite Types. ................................ 45
Figure 18. Variation of Complex Modulus with Graphite Contents. ........................................... 46
Figure 19. Variation of Phase Angle with Graphite Contents. ..................................................... 47
Figure 20. Variation of ǀG*ǀ · sinδ (KPa) with Graphite Contents. .............................................. 47
Figure 21. Variation of G*/sinδ (KPa) with Graphite Contents. .................................................. 48
Figure 22. Volume Resistivity of Various Binder Types. ............................................................ 49

x
Figure 23. Effect of Binder Types on Electrical Resistivity ......................................................... 50
Figure 24.Compacted Asphalt Concrete Specimens. .................................................................... 53
Figure 25. Asphalt Concrete Specimens. ...................................................................................... 54
Figure 26. Indirect Tension Test Setup. ........................................................................................ 54
Figure 27. Volume Resistivity versus F146 Graphite Content for Conductive Asphalt
Concrete. ........................................................................................................................... 57
Figure 28. Volume Resistivity versus F516 Graphite Content for Conductive Asphalt
Concrete. ........................................................................................................................... 58
Figure 29. Effect of Graphite Contents on IDT Strength.............................................................. 59
Figure 30. Comparing IDT Strength of F146 and F516. .............................................................. 59
Figure 31. Comparing Volume Resistivity in Accordance with Gradation Types. ...................... 60
Figure 32. Effect of Graphite Contents on IDT Strength of Conductive Asphalt Concrete. ........ 61
Figure A1. Gradation of Coarse Aggregate. ................................................................................. 71
Figure A2. Gradation of Fine Aggregate. ..................................................................................... 72
Figure A3. Sieve Analysis of D-6 Mix. ........................................................................................ 74
Figure A4. Sieve Analysis of D-5 Mix. ........................................................................................ 75
Figure A5. Sieve Analysis of D-5 Mix. ........................................................................................ 76
Figure B1. Air Voids versus Percent Binder Content of D-6 Mixture. ........................................ 77
Figure B2. VMA versus Percent Binder Content of D-6 Mixture. ............................................... 77
Figure B3. VFA versus Percent Binder Content of D-6 Mixture. ................................................ 78
Figure B4. Air Voids versus Percent Binder Content of D-6 Mixture. ........................................ 78
Figure B5. VMA versus Percent Binder Content of D-6 Mixture. ............................................... 79
Figure B6. VFA versus Percent Binder Content of D-6 Mixture. ................................................ 79
Figure B7. Air Voids versus Percent Binder Content of D-5 Mixture. ........................................ 80
Figure B8. VMA versus Percent Binder Content of D-5 Mixture. ............................................... 80
Figure B9. VFA versus Percent Binder Content of D-5 Mixture. ................................................ 81
Figure B10. Air Voids versus Percent Binder Content of D-3 Mixture. ...................................... 81
Figure B11. VMA versus Percent Binder Content of D-3 Mixture. ............................................. 82
Figure B12. VFA versus Percent Binder Content of D-3 Mixture. .............................................. 82

xi
Figure B13. Air Voids versus Percent Binder Content of D-6 Mixture with Graphite. ............... 83
Figure B14. VMA versus Percent Binder Content of D-6 Mixture with Graphite. ...................... 83
Figure B15. VFA versus Percent Binder Content of D-6 Mixture with Graphite. ....................... 84
Figure D1. IDT Strength for Asphalt Concrete with F146—20 Percent. ..................................... 88
Figure D2. IDT Strength for Asphalt Concrete with F146—25 Percent. ..................................... 88
Figure D3. IDT Strength for Asphalt Concrete with F146—30%. ............................................... 89
Figure D4. IDT Strength for Asphalt Concrete with F516—20%. ............................................... 89
Figure D5. IDT Strength for Asphalt Concrete with F516—25%. ............................................... 90
Figure D6. IDT Strength for Asphalt Concrete with F516—30%. ............................................... 90
Figure D7. IDT Strength of Asphalt Concrete of D-3 Gradation. ................................................ 92
Figure D8. IDT Strength of Asphalt Concrete of D-5 Gradation. ................................................ 92
Figure D9. IDT Strength of Asphalt Concrete of D-6 Gradation. ................................................ 93
Figure D10. IDT Strength of Asphalt Concrete of D-3 Gradation with Graphite. ....................... 93
Figure D11. IDT Strength of Asphalt Concrete of D-5 Gradation with Graphite. ....................... 94
Figure D12. IDT Strength of Asphalt Concrete of D-6 Gradation with Graphite. ....................... 94

xii
LIST OF TABLES
Page
Table 1. Summary of Previous Research on Conductive Asphalt Composites. ........................... 16
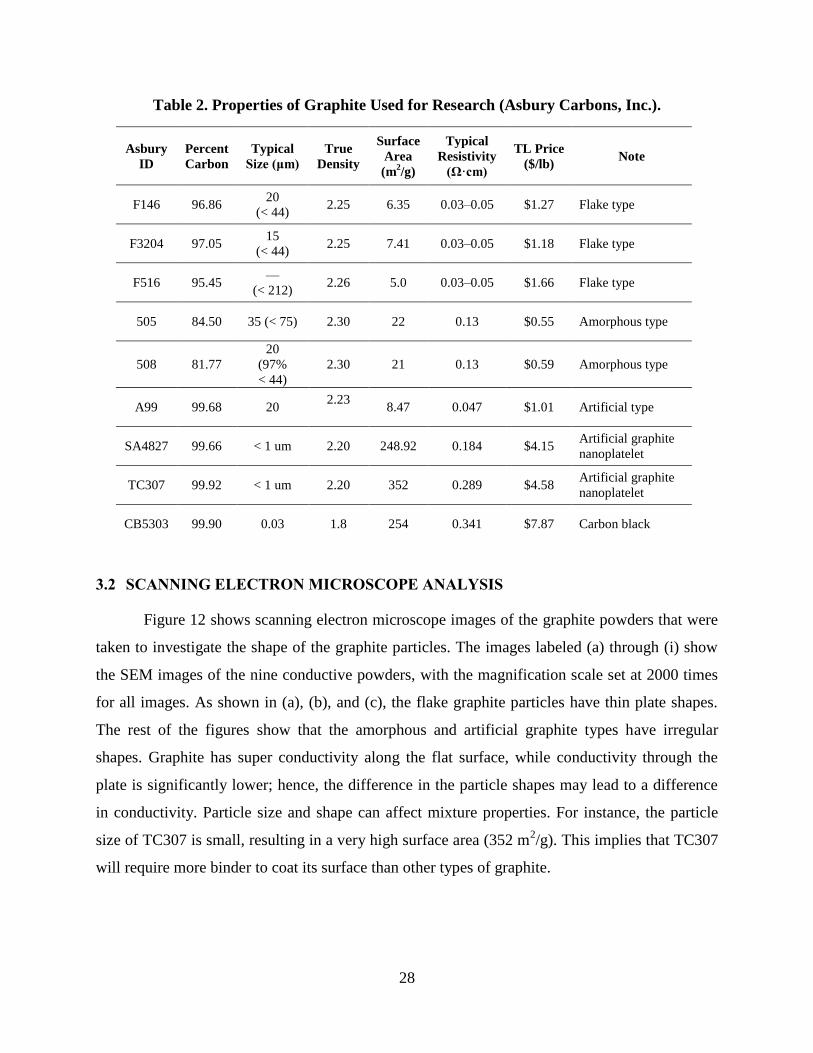
Table 2. Properties of Graphite Used for Research (Asbury Carbons, Inc.). ............................... 28
Table 3. Materials Used for Research. .......................................................................................... 34
Table 4. Composition of Bituminous Paving Mixtures. ............................................................... 52
Table 5. Aggregate Gradation. ...................................................................................................... 52
Table 6. Volumetric Properties of the Mixture. ............................................................................ 55
Table 7. Average Number of Gyrations for Different Mixes. ...................................................... 56
Table A1. Sieve Analysis of Coarse Aggregate............................................................................ 71
Table A2. Sieve Analysis of Fine Aggregate................................................................................ 72
Table A3. Sieve Analysis of Aggregate. ....................................................................................... 73
Table A4. Aggregate Gradation of D-6 Mixture. ......................................................................... 74
Table A5. Aggregate Gradation of D-5 Mixture. ......................................................................... 75
Table A6. Aggregate Gradation of D-3 Mixture. ......................................................................... 76
Table C1. Electrical Resistivity of Conductive Asphalt Concrete (F516). ................................... 85
Table C2. Electrical Resistivity of Conductive Asphalt Concrete (F146). ................................... 86
Table C3. Electrical Resistivity of Asphalt Concrete of Various Aggregate Gradation. ............. 86
Table D1. IDT Strength of Various Graphite Contents. ............................................................... 87
Table D2. IDT Strength of Various Aggregate Gradations. ......................................................... 91

1
EXECUTIVE SUMMARY
Conductive asphalt concrete has a huge potential for various nonstructural applications
such as self-healing, self-sensing, energy harvesting, and many others. Precise control of the
electrical conductivity is an essential element to enable such applications of conductive asphalt
concrete.
In this study, graphite powder is proposed as a conductive additive that allows
conductivity control in wide range by mitigating the percolation threshold. The electrical volume
resistivity of the mastic specimens containing various types and contents of graphite is examined,
and the physical properties of the raw materials including scanning electron microscope analysis
are obtained. Using two graphite types showed the best performance in the mastic tests. The
conductive asphalt concrete specimens were fabricated, and their electrical and mechanical
performances were evaluated for the various mixtures including different graphite contents and
aggregate gradations.
Major findings from the study are as follows:
A sudden change in electrical resistivity from no conduction to conduction, i.e., the
so-called percolation threshold, is observed in specimens containing steel fibers.
Achieving this threshold implies that the steel fibers form conductive paths by
contacting to each other. The conductive paths is similar to a set of switches, and
hence precise conductivity control with fibers is difficult.
The electrical conductivity of asphalt mastics varies significantly with the type of
conductive fillers. Natural flake graphite powder is the most efficient in imparting
conductivity to asphalt. Sufficiently low electrical resistivity can be obtained by
replacing a part of the fillers with the flake-type graphite powder in asphalt mastics
(up to 10−2
/Ω•cm).
The volume resistivity of asphalt mastic and asphalt concrete containing natural flake
graphite powder varies widely with the amount of graphite powder mixed into the
mastic. The graphite does not completely eliminate the percolation threshold but
substantially mitigates it. This implies that the electrical resistivity of asphaltic
composite can be manipulated over a wide range.

2
The different binder types do not have significant influence on the electrical
conductivity of asphalt mastics, but some binder modifiers may reduce electrical
conductivity.
When a fixed amount of graphite is added to the mixture, a smaller amount of fine
aggregate and binder results in higher electrical conductivity.
The conductive asphalt concrete containing the flake-type graphite has improved
indirect tensile strength when compared to control asphalt concrete. Dynamic shear
rheometer tests for asphalt mastic show that the flake-type graphite additives increase
complex modulus. This implies that adding graphite is beneficial for improving
rutting resistance.
This study shows that the flake-type graphite is efficient to control the electrical
conductivity of asphalt concrete up to a very low resistivity range. Moreover, the flake graphite
improves the indirect tensile strength and viscosity. The mechanical and electrical benefits of the
graphite filler will enable various multifunctional applications and improved durability of asphalt
concrete for longer-lasting asphalt pavements.

3
1. INTRODUCTION
1.1 BACKGROUND
Asphalt concrete is a composite material that is heavily used in the construction of
highways, runways, and parking lots. Riding comfort, durability, reliability, and water resistance
are some of the driving mechanical characteristics that make asphalt concrete the most preferred
choice in the pavement industry. With the increasing emphasis on the long-term well-being of
individuals and environmental conservation, sustainability is becoming a key goal in planning
and constructing civil infrastructures. Multifunctional materials have the simultaneous ability to
exhibit nonstructural functions apart from their regular structural functions (Gibson 2010).
Mechanical properties such as strength and stiffness are the primary functions of structural
materials. However, by manipulating electrical, magnetic, optical, and other nonstructural
properties, the material can exhibit advantages beyond the sum of the individual capabilities.
Materials of this kind have tremendous potential for a wide range of real-life applications that
can improve the efficiency and safety of daily lives. Asphalt concrete, by nature, is a
nonconductive composite material, but its electrical conductivity can be improved by using
conductive additives. Various nonstructural applications can be developed by controlling the
conductivity, and the multifunctional asphalt concrete has strong potential that can lead to a
breakthrough in sustainable pavement systems.
In 1968, Minsk (1968) initiated the concept of electrically conductive asphalt concrete,
and this topic has gained immense interest in the last decade, resulting in an increased number of
publications. The potential benefits of utilizing the electrical properties of asphalt composites
have largely motivated these efforts. For instance, the electrical heating applications of
conductive pavements have been studied to remove snow and ice (Xiangyang and Yuxing
2010). Electric heating is also expected to promote self-healing by reducing the rest period. In
addition, the piezoresistivity of conductive asphalt, which refers to the change in electrical
resistivity with applied mechanical pressure, can be used for self-sensing of strain (Liu and Wu
2009). Self-sensing of damage for evaluating pavement distress is possible if the relationship
between the electrical property and internal damage is provided. Moreover, some conductive
additives may improve the durability of asphalt concrete, thereby increasing the service life of
the pavement systems (Park 2012).

4
Figure 1 shows the possible nonstructural functions and the benefits of conductive asphalt
concrete, and Figure 2 summarizes the components of high-performance conductive asphalt
concrete.
Figure 1. Possible Applications and Benefits of Electrically Conductive Asphalt Concrete.
Figure 2. Components of High-Performance Conductive Asphalt Concrete.

5
1.2 PROBLEM STATEMENT
To use the full spectrum of applications of electrically conductive asphalt composites,
precise control of the volume resistivity is needed. Previous investigators have tested various
conductive fillers and fibers including micron-scale steel fibers (Huang et al. 2006, Serin et al.
2012), carbon fibers (Wu et al. 2005), steel wool (Garcia et al. 2009), carbon black (Wu et al.
2005), and graphite powder (Wu et al. 2005, Garcia et al. 2009) to impart electrical conductivity
into asphalt concrete. Most of the previous investigators selected fiber-type additives as their
primary conductive additives rather than powder-type additives because a relatively smaller
number of fibers is needed to improve conductivity than graphite or carbon black (Huang et al.
2006). Fibers have longer lengths, which can facilitate the flow of electrons more easily than
powder-type additives. On the other hand, asphalt concrete containing conductive fibers has a
phenomenon called percolation threshold, which hinders the precise control of the electrical
conductivity.
The percolation threshold is a sudden transition from the insulated to the conductive
phase (Wu et al. 2005, Garcia et. al 2009). The dotted line in Figure 3 shows a typical
relationship between the electrical resistivity and the content of the conductive additive reported
from the previous investigators. The transition between the insulated phase and conductive phase
can be characterized by a sudden drop in electrical resistivity at a specific content of conductive
additive, the percolation threshold. According to Huang et al. (2006), the electrical conductivity
of the asphalt composite comes from the formation of a continuous conductive path through the
contacts between the conductive additives. By narrowing the adjustable volume resistivity range
of conductive asphalt, the percolation threshold introduces limitations for developing various
multifunctional applications. To enable precise manipulation of electrical resistivity over a wide
range, a gradual resistance change with the increase of conductive additive is favorable; this is
illustrated as a solid line in Figure 3. Another limitation in using discrete fiber-type additives is
the dispersion and clumping of fibers during mixing (Abtahi et al. 2010). The clumping or
balling of discrete fibers becomes severe as the fiber-length-to-thickness ratio (the aspect ratio)
increases.

6
Figure 3. Electrical Resistivity Transition Curve.
Graphite is one of the powder-type conductive additives that some investigators used as a
supplementary material (Huang et al. 2006, Garcia et al. 2009, Liu and Wu 2011b). While the
percolation threshold is prevalent with fiber-type conductive additives, the use of graphite
powder ensures relatively easy mixing and uniform dispersion. More importantly, the percolation
threshold might be mitigated by using graphite powder even though larger quantities of graphite
rather than conductive fibers are needed to reduce the electrical resistivity (Huang et al. 2009,
Mo et al. 2005). On the other hand, the efficiency of graphite in imparting conductivity is not
consistent in previous publications. According to Park (2012), this is due to the use of different
types of graphite, but no other investigators have focused on the effect of graphite type,
including the shape, size, and origin of the graphite powders. Motivated by this observation, this
study investigated the effect of various graphite types on imparting conductivity, and identified
the most efficient graphite type that ensures a smooth resistivity transition.
Content of conductive additive
Ele
ctri
cal
resi
stiv
ity
Percolation threshold
Conductive phase
Insulated phase
Preferable relationship
entailing smooth transition
between insulated and
conductive phase
7
1.3 RESEARCH OBJECTIVES
The objective of this study was to find a proper conductive additive that enables a smooth
transition from the insulated to the conductive phase. The following subjects were investigated
through the study:
A comprehensive literature review on conductive construction materials.
Identification of the graphite types and their physical/geometrical characterizations.
The effect of graphite types and amounts on the conductivity of asphalt mastic
(asphalt binder and fillers).
The effect of binder types on the conductivity of asphalt mastic.
The effect of graphite on the viscoelastic properties of asphalt mastic.
Verification of imparting conductivity into asphalt concrete.
The effect of the aggregate gradation on electrical conductivity and adjustment of the
optimum binder content.
The strength of the conductive asphalt concrete.
Figure 4 shows the tasks of the research, and Figure 5 shows the schedule of the activities.

8
Figure 4. Work Tasks.
Figure 5. Schedule of Activities.
9
2. LITERATURE REVIEW
A review of the literature on imparting and controlling conductivity in asphalt concrete
and the various possible multifunctional applications is summarized in this section.
2.1 APPROACHES TO IMPART CONDUCTIVITY INTO ASPHALT CONCRETE
The interest in imparting electrical properties into asphalt concrete dates back to the
1970s. Minsk (1971) patented electrically conductive asphaltic concrete using graphite as a
conductive medium for the purpose of melting snow and ice on roadway surfaces by electrical
heating. Stratfull (1974) and Fromm (1976) used coke breeze from the steel industry to produce
conductive hot-mix asphalt (HMA) for cathodic protection of steel rebars in concrete bridges.
Zaleski et al. (1998) patented a pavement system containing an electrically conductive layer for
deicing purposes; the authors used graphite and coke as conductive additives. Parallel to asphalt
concrete, extensive study on electrically conductive Portland cement concrete has been published.
Barnard (1965) patented electrically conductive cementitious concrete. Since then, various
efforts have been reported on the widened applications of conductive concrete (Chung 2003).
Findings from numerous research studies in the past have shown that the electrical
conductivity of asphalt concrete can be improved with the addition of conductive fillers and/or
fibers. Wu et al. (2003) showed that the inclusion of graphite beyond a critical content decreases
the resistivity of asphalt-based composites. In this paper, the authors focused mainly on the
self-sensing ability of conductive asphalt. In 2005, the electrical conductivity of asphalt concrete
with other additives such as carbon black, graphite, and carbon fibers was investigated (Wu et al.
2005). It was found that pure carbon-fiber-modified asphalt concrete showed the best
performance in conductivity, followed by graphite and carbon black, as illustrated in Figure 6. In
the figure, the content of the conductive additive is presented as the volume percentage of the
binder phase of the mixture. The electrical resistivity was found to decline rapidly when specific
amounts of conductive additives were added, which is during the percolation threshold. Previous
investigators (Wu et al. 2005, Huang et al. 2006) explained that a three-dimensional conductive
network is established at the percolation threshold, and hence improvement in conductivity is not
significant after this point. Wu et al. (2005) thus concluded that the desired electrical resistivity
can be obtained by keeping the content of conductive additives slightly above the optimum

10
(percolation) level but making sure that the content does not go beyond to minimize the
influence on the mechanical properties of asphalt concrete.
Figure 6. Effect of Type of Conductive Additive on Electrical Resistivity of Asphalt
Concrete (Wu et al. 2005).
A research team at the University of Tennessee carried out similar studies. Huang et al.
(2006) investigated the different options for producing electrically conductive asphalt. Micro
scale steel fibers (8 μm in diameter and 6 mm in length), aluminum chips (passing a 0.10-mm
sieve), and graphite (passing a 0.075-mm sieve) were examined for their ability in imparting
conductivity. It was observed that aluminum chips are not effective in increasing the electrical
conductivity of the mixture in spite of their excellent conductivity. The reason is that aluminum
gets easily oxidized in the air and forms aluminum oxide, which has low conductivity. While
aluminum is not the right choice for practical purposes, the mixtures with microscale steel fibers
and graphite exhibited good electrical conductivity. Resistivity in the order of 103
Ω.m was
reached with the addition of 0.33 percent steel fibers by volume of asphalt binder.
Approximately 2.3 percent graphite by volume of asphalt binder was needed to obtain a similar
resistivity level. Variation in electrical conductivity during fatigue evolution was also studied
through an indirect tensile test (IDT) and beam fatigue tests.

11
Huang et al. (2009) extended their investigation to the mechanical performance of
conductive asphalt composites. They conducted the dynamic shear rheometer (DSR) test to study
the effect of conductive additives (i.e., microscale steel fibers, carbon fibers, and graphite) on the
viscoelastic properties of asphalt mastic (a mixture of asphalt binder and conductive additives).
The results show that with increased conductive additives, the complex shear modulus, G*,
increases. This implies that the conductive additives can stiffen the asphalt binder. High contents
of graphite were required to achieve sufficiently low resistivity; hence, the stiffness of the mastic
was improved greatly. The mechanical performances of conductive HMA mixtures were
investigated through an IDT and dynamic modulus tests. Though graphite reduces the IDT
strength of the mixtures, it improves the dynamic modulus. On the other hand, the fracture
energy of the mixtures with carbon or steel fibers was slightly improved due to the reinforcing
effect of the fibers. Figure 7 depicts the IDT strength and dynamic modulus of asphalt concrete
containing various additives.
(a) IDT strength for various additives
(b) Dynamic modulus at 10 Hz
Figure 7. Mechanical Properties of HMA Mixture with Conductive Additives
(Huang et al. 2009).

12
Garcia et al. (2009) conducted a comprehensive study. They examined the effect of fiber
content, the sand–bitumen ratio, and a combination of fillers and fibers (graphite and steel wool)
on the resistivity of asphalt mortar. The authors divided the changes in the resistivity with
volume percentages of conductive additive into four different phases:
The insulated phase. The insulated phase is where the fibers are not connected with
one another and the resistivity is approximately equal to that of plain asphalt concrete.
The transition phase. The transition phase is where the percolation path of fibers
forms and the resistivity rapidly drops, leading to the next phase.
The conductive phase. The conductive phase is where the fibers are connected with
each other, and the electrical resistivity of the composite becomes very low.
The excess of fibers phase. The last phase is the excess of fibers phase, during which
the reduction in length of conductive paths is no longer significant, and the electrical
resistivity of the composite decreases slightly with the increased fiber content. In
addition, the asphalt becomes difficult to mix when clusters of fibers start forming.
Figure 8 shows the schematic of the conductivity variation.
Figure 8. Schematic Representation of Volume Resistivity versus Conductive Additive
Content (Garcia et al. 2009).
13
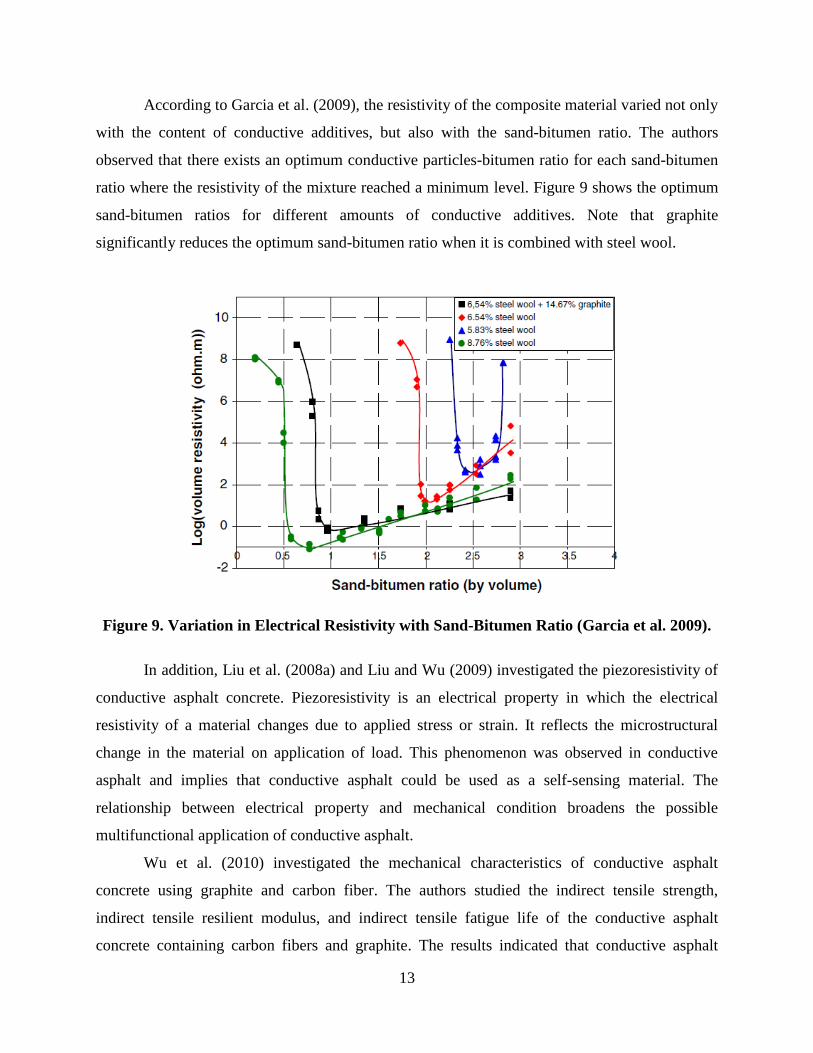
According to Garcia et al. (2009), the resistivity of the composite material varied not only
with the content of conductive additives, but also with the sand-bitumen ratio. The authors
observed that there exists an optimum conductive particles-bitumen ratio for each sand-bitumen
ratio where the resistivity of the mixture reached a minimum level. Figure 9 shows the optimum
sand-bitumen ratios for different amounts of conductive additives. Note that graphite
significantly reduces the optimum sand-bitumen ratio when it is combined with steel wool.
Figure 9. Variation in Electrical Resistivity with Sand-Bitumen Ratio (Garcia et al. 2009).
In addition, Liu et al. (2008a) and Liu and Wu (2009) investigated the piezoresistivity of
conductive asphalt concrete. Piezoresistivity is an electrical property in which the electrical
resistivity of a material changes due to applied stress or strain. It reflects the microstructural
change in the material on application of load. This phenomenon was observed in conductive
asphalt and implies that conductive asphalt could be used as a self-sensing material. The
relationship between electrical property and mechanical condition broadens the possible
multifunctional application of conductive asphalt.
Wu et al. (2010) investigated the mechanical characteristics of conductive asphalt
concrete using graphite and carbon fiber. The authors studied the indirect tensile strength,
indirect tensile resilient modulus, and indirect tensile fatigue life of the conductive asphalt
concrete containing carbon fibers and graphite. The results indicated that conductive asphalt
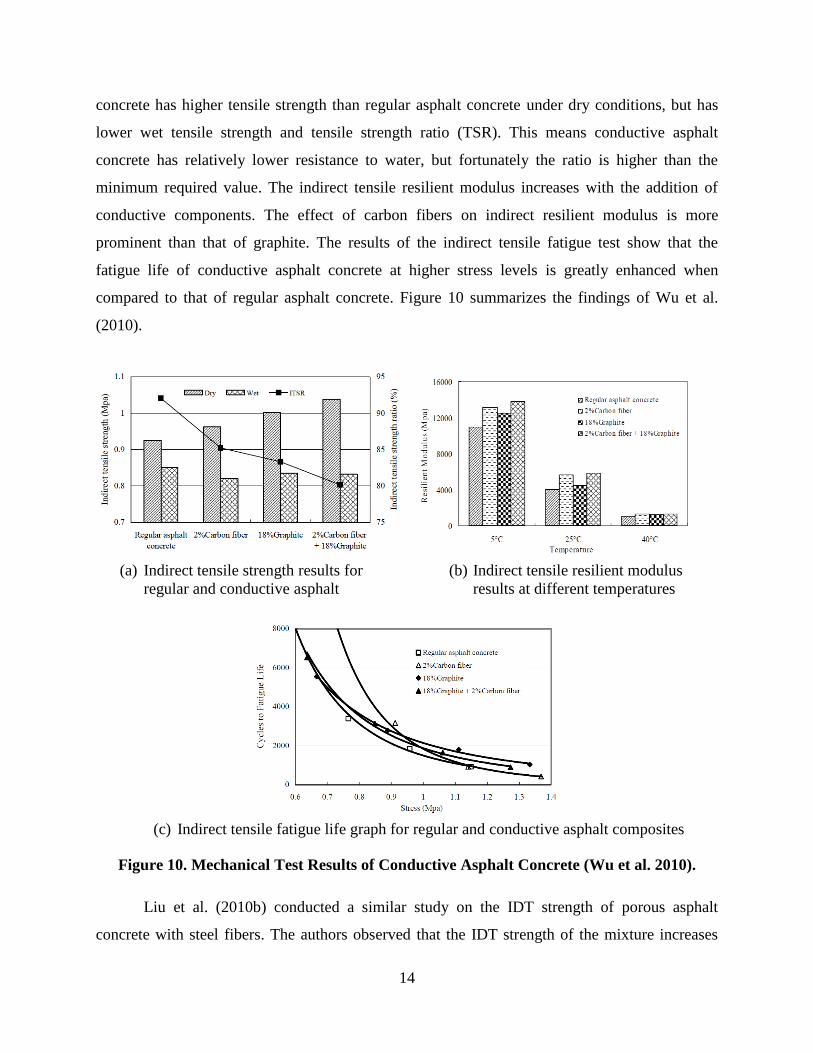
14
concrete has higher tensile strength than regular asphalt concrete under dry conditions, but has
lower wet tensile strength and tensile strength ratio (TSR). This means conductive asphalt
concrete has relatively lower resistance to water, but fortunately the ratio is higher than the
minimum required value. The indirect tensile resilient modulus increases with the addition of
conductive components. The effect of carbon fibers on indirect resilient modulus is more
prominent than that of graphite. The results of the indirect tensile fatigue test show that the
fatigue life of conductive asphalt concrete at higher stress levels is greatly enhanced when
compared to that of regular asphalt concrete. Figure 10 summarizes the findings of Wu et al.
(2010).
(a) Indirect tensile strength results for (b) Indirect tensile resilient modulus
regular and conductive asphalt results at different temperatures
(c) Indirect tensile fatigue life graph for regular and conductive asphalt composites
Figure 10. Mechanical Test Results of Conductive Asphalt Concrete (Wu et al. 2010).
Liu et al. (2010b) conducted a similar study on the IDT strength of porous asphalt
concrete with steel fibers. The authors observed that the IDT strength of the mixture increases

15
with the increase of steel fibers until a certain consistency. Beyond that, adding more fibers
reduces the thickness of mastic film around the aggregates, leading to poor adhesion that reduces
the IDT strength of porous asphalt concrete. Figure 11 shows the results of the IDT on
conductive porous asphalt concrete.
Figure 11. Indirect Tensile Strength on Conductive Porous Asphalt Concrete
(Liu et al. 2010b).
Liu and Wu (2011a) investigated the variation of Marshall stability, resilient modulus,
and dynamic stability of graphite- and carbon-fiber-modified asphalt concrete. According to Liu
and Wu, the addition of graphite did not considerably enhance the mechanical strength of asphalt
concrete. They concluded that graphite can be a good conductive filler, but its lubricating
property caused by weak bonds between plain hexagonal crystal structures of graphite might
impair the mechanical properties of asphalt concrete.
Park (2012) studied the effect of graphite powders on imparting electrical conductivity in
asphalt mastic and showed that the electrical resistivity significantly varied with the type (shape
and size) of graphite.
Zhang et al. (2011) proposed another type of conductive additive. Polyaniline (PANI) is a
conductive polymer, and the authors tried to impart electrical conductivity into stone matrix
asphalt using a self-made PANI/polypropylene (PP) compound. The conductivity increased by
six orders of magnitude, and the percolation threshold was 1 percent.

16
As reviewed above, electrically conductive asphalt concrete has become popular during
the last 10 years. Table 1 summarizes the previous research on conductive asphalt. As compared
in Table 1, the amount of conductive additives required for specific resistivity varies
significantly with the investigator. For example, the volume percentage of graphite at 103 Ω·cm
ranges from 11 percent to 30 percent. Therefore, the causes of this variability and the factors
affecting the conductivity of asphalt mixtures should be clarified for precise conductivity control.
Table 1. Summary of Previous Research on Conductive Asphalt Composites.
Author Conductive Filler
Used
Percentage of Additive to
Attain Resistivity of
103 Ω.cm (Percent Vol. by
Binder)
Purpose
Minsk
(1968) Graphite (G) G—17% and 21% Snow and ice removal
Stratfull
(1974) Coke breeze —
Cathodic protection of steel
rebars in concrete bridges
Fromm
(1976) Coke breeze —
Cathodic protection of concrete
bridge decks
Zaleski et al.
(1998) Graphite and coke — Deicing
Wu et al.
(2003) Graphite G—26% Self-sensing applications
Wu et al.
(2005)
Carbon black (CB),
graphite, and carbon
fibers (CF)
CB—13%, CF—6%, or
G—30%
Imparting conductivity
CF > G > CB
Huang et al.
(2006)
Microscale steel
fibers (SF),
aluminum chips, and
graphite
SF—0.75% or G—11% Study conductivity, IDT, and
beam fatigue test
Huang et al.
(2009)
Microscale steel
fiber, carbon fiber,
and graphite
SF—0.99%, CF—5%, or
G—18%
IDT strength, IDT fracture
energy, dynamic modulus, flow
number, and asphalt pavement
analyzer (APA) rut depth
Garcia et al.
(2009)
Graphite and steel
wool (SW) SW—6% or G—beyond 30%
Sand-bitumen ratio and effect of
fiber content
Liu and Wu
(2009)
Graphite and carbon
fiber G—12% Piezoresistivity
Wu et al.
(2010)
Graphite and carbon
fiber G—22% or CF—beyond 8%
IDT and indirect tensile fatigue
life
Liu and Wu
(2011a)
Graphite and carbon
fiber G—15%
Marshall stability, resilient
modulus, and dynamic stability
Park (2012) Graphite G—21% Electrical conductivity of
different types of graphite

17
2.2 MULTIFUNCTIONAL APPLICATIONS OF CONDUCTIVE ASPHALT CONCRETE
Multifunctional materials are considered smart and innovative materials due to their
widespread technological impact and ability to respond to external stimuli in an
environment-friendly manner. The technology necessary to build the next-generation devices
includes:
Autonomous robots.
Smart homes.
Intelligent sensors.
Structural health monitoring.
Smart transportation system.
The concept of developing multifunctional materials stems from the need to accomplish
multiple applications and performances in a single system. The sought-after characteristics of
these materials include energy-efficient nonstructural functions, such as self-sensing, self-healing,
and electromagnetic properties, in addition to the traditional structural functions of resisting
external forces. Hence, the research and development involved in multifunctional materials face
a great technological challenge with various applications. Interdisciplinary investigations have
been carried out for the molecular structure and nonstructural properties of various materials to
explore multifunctional possibilities and to extend their use across different disciplines.
In the case of conductive asphalt concrete, the potential multifunctional applications
include electrical heating, sensing, and energy harvesting. These features are discussed for a
more thorough understanding of the benefits.
Snow and Ice Removal Using Electric Heating
One of the major issues in society is improving transportation safety under freezing
and/or snowy weather. Removing snow and ice, especially on highway and bridge surfaces, is a
crucial step to enhance transportation safety. Deicing agents such as salt or sand can be used to
remove ice from pavements (Blackburn et al. 2004). Salt is the most popular deicing agent
because it is inexpensive and efficient. Deicing chemicals have obvious negative impacts,
including concrete corrosion and environmental pollution. The International Energy Agency
(IEA) and World Health Organization (WHO) pay much attention to these problems (Lofgren
2001, Sanzo and Hecnar 2006). Snow and ice on conductive asphalt pavement can be removed

18
by electric heating, which is the process of converting electric energy to heat (Chen et al. 2012).
This method ensures reliable deicing and reduced pollution.
Promoting Self-Healing
Asphalt concrete is a self-healing material (Bommavaram et al. 2009). Once the load
causing microcracks is removed, the molecules on either side of each crack start diffusing to the
other end, and the microcracks are healed with time. The time required for this healing process is
called the rest period. The challenge arises when the traffic flow is too heavy to allow a sufficient
rest period for self-healing. One of the solutions is to increase the temperature of asphalt concrete
because the healing can be accelerated with increased temperature (Bonnaure et al. 1982, Daniel
and Kim 2001). Liu et al. (2010a, 2010b, 2010c), Garcia (2012), and Garcia et al. (2011a, 2011b)
showed the possibility of promoting self-healing by inducting electrical energy into conductive
asphalt concrete. Garcia et al. (2011a, 2011b) and Liu et al. (2010a, 2010b, 2010c) suggested a
non-contact electric heating technique using electromagnetic fields. The induced current
dissipates heat in the specimen via the eddy current effect.
Strain and Damage Self-Sensing
A self-sensing material can monitor its own strain and damage without an external sensor.
Compared to the structural health-monitoring system based on the attached sensor network
(extrinsic), self-sensing structural materials are intrinsically smart. Structures made with the
intrinsically smart materials have possible advantages over extrinsically smart structures due to:
Low cost.
Good durability.
Large sensing volume.
Absence of mechanical property degradation due to the embedding of sensors (Chung
and Wang 2003).
The contact resistance between the conductive filler governs the resistivity of the asphalt
or cementitious composites. Upon application of an external compressive load, the filler particles
get closer, resulting in decreased resistivity (Wen and Chung 2007d). Such a change in resistivity
with application of mechanical stresses is referred to as piezoresistivity (Wu et al. 2006). This is
the mechanism by which conductive asphalt pavements sense their own structural health.
19
Liu et al. (2008a, 2009, 2011a, 2011b) proposed a series-wound model to explain the
piezoresistivity of conductive asphalt concrete by experimental studies. The number of electron
carriers (conductive path) in the interior of the conductive asphalt concrete influences the
electrical property, and the number of carriers is varied with different loading conditions. The
relationship between the number of carriers and electrical resistivity is inversely proportional. In
other words, resistance is reduced while under increased compressive stress during loading and
increases during unloading until the stress reaches a certain value. Under compression, the
contact resistance between graphite particles is reduced, and the insulating gaps between graphite
particles are decreased, developing new conductive paths.
Another reason mentioned is the ability of microcracks to destroy the conductive network
due to the large gap width of microcracks that prevent electron hopping.
The third effect is the dislocation of the conductive path, which results from the large
vertical deformation that originates from the shear stress between aggregates. In addition, Liu et
al. (2008b) studied the engineering properties and electrical properties of asphalt concrete with
different graphite and carbon fiber content. The filler was 5 percent by weight, and the asphalt
was 4.5 percent. Graphite of 150 μm and carbon fiber of 10-μm diameter and 5-mm length were
used. The results from the IDT indicate that the addition of conductive fillers like graphite and
carbon fiber influences or affects the mechanical properties of asphalt mixtures. The resilient
modulus increased when a combination of graphite and carbon fibers was used, while smaller
increases were observed with the use of only carbon fiber or graphite.
2.3 MULTIFUNCTIONAL APPLICATIONS OF CONDUCTIVE CEMENT CONCRETE
Concrete is the most widely used construction material nowadays and has a huge impact
on the construction industry. Concrete by itself has strong structural properties but is a poor
electrical conductor. Incorporation of electrically conductive materials in the cement matrix
enhances the smart function of concrete for various multifunctional applications. The typical
conductive additives are steel/carbon fibers and graphite powders. More recently, attempts to use
carbon nanotubes have been made. The promising multifunctional applications include:
Self-sensing.
Self-heating.
Self-healing.
20
Electromagnetic shielding.
Energy harvesting (more recently).
The factors affecting the conductivity of cement-based composites are:
Volume fraction of fibers.
Length of fibers.
Temperature.
Chloride content.
Compressive, tensile, or flexure load.
Sand-cement ratio.
Relative humidity.
Curing age.
The average length of carbon fibers found in the literature is between 5 mm and 10 mm;
the average diameter is 10–15 μm. The typical volume fraction of fibers ranges from 0.2 to
1.5 percent. Carbon fibers are considered the most effective for strain sensing, while steel fibers
are the most effective for thermal sensing and deicing purposes (Cao et al. 2001). Silica fume is a
useful additive for enhancing fiber dispersion (Chen and Chung 1995). Carbon fibers are strong,
durable, and not dense, but the one drawback is their high cost (Chung 1997, 1999, 2000, 2002,
2003, 2012).
Conductivity of Cement-Based Composites
Various investigators have verified that the conductivity of concrete increases with the
increase of fiber volume fraction. Banthia (1992) showed that 5 percent fiber volume fraction
produced hardly any increase in resistivity over time. In fact, samples with 3 percent fibers or
less showed significant increases in resistivity over time. Chiarello and Zinno (2004) showed that
longer fibers produced higher conductivity effects in concrete; e.g., 6-mm fibers yielded higher
conductivity than 3-mm or shorter fibers. Several samples showed that conductivity is
independent of specimen age. Chen et al. (2004) also showed the effect of fiber length on electric
conductivity and declared a volume fraction around 0.3–0.4 percent to be the percolation
threshold.
Chacko and Banthia (2007) examined the effect of various parameters on the resistivity
of concrete. The electrical resistivity of carbon-fiber-reinforced cement composites increases
21
dramatically over time due to the microstructure change in the hydration of concrete. There was
a considerable decrease in the conductivity of concrete when exposed to chloride ions, which
present a dilemma because of their highly corrosive nature. On direct compressive loading, the
resistivity decreased during the elastic stage, when fibers were coming in contact. The resistivity
flattened out until the first crack was encountered; then it increased suddenly, further supporting
the notion of self-sensing capability in concrete. The electrical resistivity decreased with
temperature and vice versa. The water-cementitious material (w/cm) ratio did not affect the
conductivity at high-volume fractions where the carbon fibers seem to provide most of the
conductivity, so moisture/humidity levels do not play a major role in controlling the resistivity of
cement materials. However, a w/cm ratio of 0.3 seemed to provide the least resistivity in low
fiber content composites. Wen and Chung (2008) showed that saturated moisture levels had
higher conductivity than less wet samples due to the effect of ionic conduction of cations of
water.
Wen and Chung (2001a) studied the effect of carbon fibers on dielectric constant. Carbon
fibers were found to be most effective in increasing dielectric constant (Wen and Chung 2001b).
Wen and Chung (2004) summarized and showed the trends that different fillers and additives
exhibited on the resistivity and thermoelectric power of concrete. Resistivity decreases with
increasing fiber volume fraction. Carbon fiber is more effective in decreasing resistivity than
carbon filament or graphite powder (Chung 2012). Carbon filaments were found more effective
in conductivity than coke powder but less inferior in electromagnetic interference (EMI)
shielding. A material stronger in thermoelectricity or electromagnetic shielding is not necessarily
stronger in conductivity. Hong et al. (2003) studied the effect of graphite slurry infiltrated with
steel fibers on the resistivity of fiber concrete. With a w/cm of 0.5 and 1:1 sand cement ratio,
resistivity decreased with increasing graphite content and, more importantly, showed less
resistance magnitudes with longer steel fibers. In the post-threshold zone, the resistivity decrease
slowed. With the addition of fiber, the graphite particles connected the loose steel fibers, forming
a graphite bridge and lowering the resistivity.
Vaidya (2011) attempted to impart electric conductivity in fly-ash-based composite.
Replacing Portland cement with fly ash proved more effective than using only Portland cement
in lowering resistivity with higher carbon fiber volume fractions. A fiber percentage of
0.1 percent is the required value to establish electric percolation. This was attributed to the

22
increased alkali content in supplementary cementitious materials, which contributed to higher
ionic conduction.
Self-Actuating Materials
The self-actuating capability allows material to respond to what has been sensed. The
structural material provides strain or stress in response to an input such as an electric field or a
magnetic field. The phenomenon known as reverse piezoelectric effect or electrostriction is
responsible for this behavior (Chung 2002). Short carbon fiber reinforced cement has been
observed to exhibit such behavior.
Self-Sensing Cement Matrix Composites
Self-sensing refers to the ability of a material to sense its own condition such as strain,
stress, damage, and temperature. Some applications of self-sensing include:
Structural vibration control.
Traffic monitoring.
Weighing.
Building facility management.
Structural health monitoring.
Sensing is achieved by electrical resistance measurements. Thermocouples have been
achieved when temperature adjustments are done on the structural materials. The development of
cement-based materials containing short carbon fibers is opening new possibilities in the
research field of multifunctional structural materials. The effects of numerous modes of loading
on the piezoresistive phenomenon that have been investigated include:
Flexure.
Tension.
Compression.
Impact.
Strain amplitude.
Moisture.
The electrical resistance of self-sensing concrete varies with stress or strain. To measure
the surface electrical resistance, the researchers used the four-probe method in which the outer

23
two contacts are meant for passing current and the inner two contacts are for voltage
measurement (Chen and Liu 2007). The two-probe method gives less effective results. The gage
factor, the fractional change in resistance per unit strain, ranges up to 700 for compression or
tension. The resistance increases reversibly with tension and decreases with compression, due to
fiber pull-out upon microcrack opening. Chung (1997) reported that concrete can contain as low
as 0.2 percent carbon fiber content in order to exhibit piezoresistive capabilities. During the
repeated loading test with various strain amplitudes in uniaxial compression, the peak resistivity
varies linearly with peak strain. This implies that strain can be estimated by measuring electrical
resistance. The gage factor for cementitious composites approaches 300, compared to a value of
2 that is typical of metal strain gages (Chung 2012). However, the gage factor does decrease with
increasing strain amplitude.
Azhari and Banthia (2012) attempted to study the effects of carbon nanotubes on
piezoresistivity. The combined use of carbon nanotubes and carbon fiber gives better sensing
than the use of carbon nanotubes as the sole conductive admixture. However, the high cost of
carbon nanotubes compared to carbon fiber is a significant disadvantage in view of the cost-
conscious concrete industry. Carbon black is even less expensive than short carbon fiber, but it
gives low values for the gage factor, so it is a useless material for controlling conductivity.
Replacing 50 percent cement with carbon black maintains conductivity and electromagnetic
shielding, but reduces strain sensing (Wen and Chung 2007a). Although research has emphasized
the use of cement in the form of Portland cement, sulfoaluminate cement has been shown to be
an effective cement matrix for providing piezoresistivity in the presence of short carbon fibers as
filler (Wen and Chung 2007b).
Damage Sensing
Damage sensing has also been investigated when damage causes some breakage of the
brittle carbon fibers, resulting in an irreversible increase in resistivity. The resistivity in both
stress direction and transverse direction increases upon tension because of the fiber pull-out that
accompanies crack opening and decreases upon compression, as a result of fiber push-in (Wen
and Chung 2007c). Piezoresistivity allows the use of alternating current (AC) or direct current
(DC) electrical resistance to monitor the strain of cement-based materials. The damage can be
monitored by measuring the DC electrical resistivity via a four-probe method. Damage was

24
found to increase the electrical resistivity. In the case of major damage, this resistivity increase is
irreversible because the strain never returned to zero, and it was found that fiber fracture controls
the damage. Various resistance measurements used throughout the field include (Chen and Liu
2007):
Volume resistance for measuring the damage of a volume.
Surface resistance for measuring the damage of a surface.
Contact resistance for measuring the damage of an interface.
Temperature Sensing
In regard to temperature sensing, cement-based materials have been developed into
thermistors and thermocouples. Each thermocouple takes the form of a cement-based p-n
junction. The thermoelectric effect of cement-based materials has been observed whereby a
temperature gradient generates electricity. Wen and Chung (2000) showed the thermistor effect
where electrical resistivity decreases with increasing temperature. The effect is attributed to the
jump of electrons from one lamina to another across the interlaminar surface. Steel fiber was
found to be very effective for heat resistance.
Wen and Chung (2000) reported that carbon fibers and graphite are less effective in heat
sensing due to a higher voltage requirement and electrical resistivity. The use of steel fibers
instead of carbon fibers results in highly positive thermoelectric power values because steel
fibers provide electron conduction, whereas carbon fibers involve hole conduction. Steel fibers
were found to produce a better thermoelectric material than carbon fiber. The thermoelectric
effect is the basis of thermocouples for temperature measurement. The resistivity decreases upon
heating, and the effect is quite reversible upon cooling. The fact that the resistivity is slightly
increased after a heating and cooling cycle is probably due to thermal degradation of the material.
Wen and Chung (2004) found that a cement-matrix composite containing 0.7 percent steel fibers
(8-μm diameter) by volume and a mat of discontinuous uncoated carbon fibers for use as an
interlayer are effective for self-heating. However, the effectiveness is low compared to flexible
graphite, which is not a structural material.

25
Electromagnetic Shielding
Mainly due to their high reflectivity, carbon materials are also effective for shielding. The
EMI shielding effectiveness of flexible graphite (made by compressing exfoliated graphite in the
absence of a binder) reaches 130 dB (at 1 GHz), which is higher than or comparable to all EMI
shielding materials, including carbon and non-carbon materials. The high effectiveness of
flexible graphite is due to the high electrical conductivity and high surface area, which is
valuable due to the skin effect. Flexible graphite has the additional advantages of:
Resiliency (needed for EMI gaskets, which are particularly challenging due to the
requirement of resiliency).
Low density.
Low thermal expansion.
Thermal conductivity (which helps microelectronic heat dissipation).
Chemical resistance.
Percolation Theory
The percolation theory describes the behavior of concrete reinforced with conductive
carbon fibers. The conductivity changes significantly at a critical fiber content that is found to be
independent of the matrix. This refers to the volume fraction above which the fibers touch one
another to form a continuous electrical path (Sui and Liu 2006). Longer fibers were found to
decrease the threshold where the threshold is between 0.5 and 1.0 percent fiber volume fractions.
Wen and Chung (2007a) observed double percolation in cement-based composites where one
percolation threshold was attributed to the fiber percolation and the other to cement percolation.
Baeza et al. (2010) also observed triple percolation.


27
3. CHARACTERIZATIONS OF RAW MATERIALS
This section introduces the physical properties of the materials used in the research. The
properties of graphite, including density, particle size, and surface area, play a major role in
deciding the electrical resistivity, mixing, and compaction difficulties of the conductive asphalt
concrete. Scanning electron microscope (SEM) images of the graphite provide an explanation of
the observed conductivity variation within the graphite types. In addition, the researchers
investigated the physical properties of other materials used in this study, such as:
Aggregate.
Binders.
Fillers.
Wood stick.
Silver paste.
Copper tape.
3.1 TYPES OF GRAPHITE
Eight different types of graphite and a carbon black produced by Asbury Carbons, Inc.,
were selected to study the effect of these materials on imparting conductivity into asphalt
concrete. Graphite has a two-dimensional hexagonal crystal structure; hence, the ideal shape of a
graphite particle is a hexagonal plate. However, the shape and size of the particles vary
according to the source and manufacturing process. The graphite types are classified into:
Three flake types (F146, F3204, and F516).
Two amorphous types (505 and 508).
One artificial type (A99).
Two types with ultra-high surface area (SA4827 and TC307).
Although the graphite types 505 and 508 are called amorphous types because of their
particle shape, they are actually crystalline materials. On the other hand, carbon black is a
genuine amorphous material, which does not have a long-range order in its atomic structure.
Table 2 presents the properties of the graphite types and carbon black.
28
Table 2. Properties of Graphite Used for Research (Asbury Carbons, Inc.).
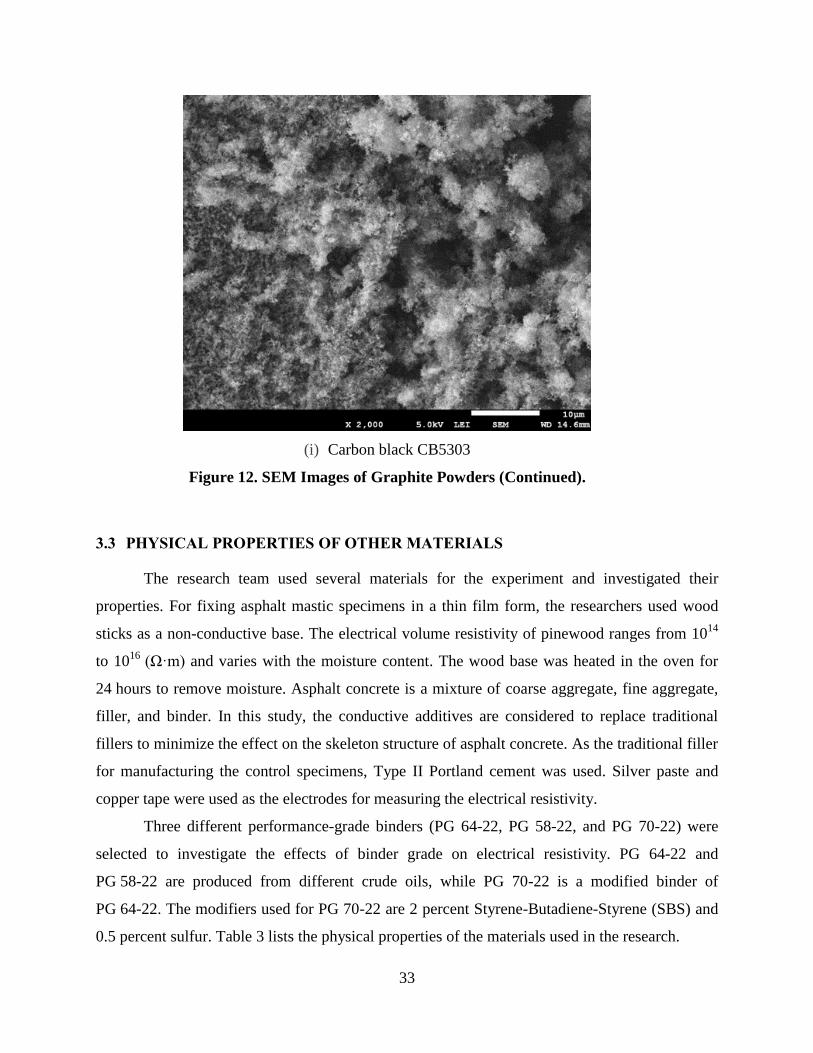
3.2 SCANNING ELECTRON MICROSCOPE ANALYSIS
Figure 12 shows scanning electron microscope images of the graphite powders that were
taken to investigate the shape of the graphite particles. The images labeled (a) through (i) show
the SEM images of the nine conductive powders, with the magnification scale set at 2000 times
for all images. As shown in (a), (b), and (c), the flake graphite particles have thin plate shapes.
The rest of the figures show that the amorphous and artificial graphite types have irregular
shapes. Graphite has super conductivity along the flat surface, while conductivity through the
plate is significantly lower; hence, the difference in the particle shapes may lead to a difference
in conductivity. Particle size and shape can affect mixture properties. For instance, the particle
size of TC307 is small, resulting in a very high surface area (352 m2/g). This implies that TC307
will require more binder to coat its surface than other types of graphite.
Asbury
ID
Percent
Carbon
Typical
Size (μm)
True
Density
Surface
Area
(m2/g)
Typical
Resistivity
(Ω·cm)
TL Price
($/lb) Note
F146 96.86 20
(< 44) 2.25 6.35 0.03–0.05 $1.27 Flake type
F3204 97.05 15
(< 44) 2.25 7.41 0.03–0.05 $1.18 Flake type
F516 95.45 —
(< 212) 2.26 5.0 0.03–0.05 $1.66 Flake type
505 84.50 35 (< 75) 2.30 22 0.13 $0.55 Amorphous type
508 81.77
20
(97%
< 44)
2.30 21 0.13 $0.59 Amorphous type
A99 99.68 20 2.23
8.47 0.047 $1.01 Artificial type
SA4827 99.66 < 1 um 2.20 248.92 0.184 $4.15 Artificial graphite
nanoplatelet
TC307 99.92 < 1 um 2.20 352 0.289 $4.58 Artificial graphite
nanoplatelet
CB5303 99.90 0.03 1.8 254 0.341 $7.87 Carbon black

29
(a) Flake graphite F146
(b) Flake graphite F3204
Figure 12. SEM Images of Graphite Powders.

30
(c) Flake graphite F516
(d) Amorphous graphite 505
Figure 12. SEM Images of Graphite Powders (Continued).

31
(e) Amorphous graphite 508
(f) Artificial graphite A99
Figure 12. SEM Images of Graphite Powders (Continued).

32
(g) Ultra-high-surface-area graphite SA4827
(h) High-surface-area graphite TC307
Figure 12. SEM Images of Graphite Powders (Continued).
33
(i) Carbon black CB5303
Figure 12. SEM Images of Graphite Powders (Continued).
3.3 PHYSICAL PROPERTIES OF OTHER MATERIALS
The research team used several materials for the experiment and investigated their
properties. For fixing asphalt mastic specimens in a thin film form, the researchers used wood
sticks as a non-conductive base. The electrical volume resistivity of pinewood ranges from 1014
to 1016
(Ω·m) and varies with the moisture content. The wood base was heated in the oven for
24 hours to remove moisture. Asphalt concrete is a mixture of coarse aggregate, fine aggregate,
filler, and binder. In this study, the conductive additives are considered to replace traditional
fillers to minimize the effect on the skeleton structure of asphalt concrete. As the traditional filler
for manufacturing the control specimens, Type II Portland cement was used. Silver paste and
copper tape were used as the electrodes for measuring the electrical resistivity.
Three different performance-grade binders (PG 64-22, PG 58-22, and PG 70-22) were
selected to investigate the effects of binder grade on electrical resistivity. PG 64-22 and
PG 58-22 are produced from different crude oils, while PG 70-22 is a modified binder of
PG 64-22. The modifiers used for PG 70-22 are 2 percent Styrene-Butadiene-Styrene (SBS) and
0.5 percent sulfur. Table 3 lists the physical properties of the materials used in the research.

34
Table 3. Materials Used for Research.
Material Typical
Size
Density
Thermal
Conductivity
(W/mK)
Electrical
Resistivity
(Ω·m)
Note
Coarse
aggregate
4.75 mm–
25 mm
Specific gravity
2.57 g/cc 1.25–1.75 10
9
Fine
aggregate
0.075 mm–
4.75 mm
Specific gravity
2.63 g/cc 1.25–1.75 10
9
Fillers < 0.075
mm
Specific gravity
3.15 g/cc 0.29 10
9
Type II Portland cement
measured temp.: 25°C
Binder Liquid 1.032 g/cm3
Jebro, Inc.
PG 76-22/PG 70-22
PG 64-22/PG 58-22
Wood stick 1″×2″×8′ 400–420 kg/m3 0.12 W/mK 10
14–10
16
Radiata Pine
Claymark, Inc.
Silver paste
Particle
size: 0.4–
1.0µm
Specific gravity
2.25g/cc3
-
Sheet resistance
0.02–0.05
ohms/sq/mil
(25 µm)
Ted Pella, Inc.
Copper tape
W: 6.3 mm
L: 16.46 m
T: 2.4 mils
(66 µm)
8.94kg/cm3 -
Sheet resistance
(ohms/sq): 0.001
Ted Pella, Inc.

35
4. ELECTRICAL CONDUCTIVITY OF ASPHALT MASTIC
4.1 INTRODUCTION
The literature review highlighted the possible applications of electrically conductive
asphalt and some of the attempts of previous investigators. Steel wool, steel fibers, carbon fibers,
and some anonymous types of graphite have been used as the conductive additive to impart
conductivity. Among these additives, graphite showed the possibility for precise conductivity
control—a gradual drop in resistivity with increasing graphite content. The present study focuses
on the effect of various types of graphite on controlling the conductivity of asphalt composites.
In this section, the test procedure, specimen preparation, and test results for asphalt mastic are
presented. In addition, mixing difficulties observed in certain graphite types are discussed.
4.2 MATERIALS AND EXPERIMENTS—ELECTRICAL AND VISCOELASTIC
The asphalt mastic specimens were prepared using PG 70-22 asphalt binder (ASTM
International 2007b) and various combinations of conductive and non-conductive fillers. The
density of the binder is 1.032 g/cm3.
The asphalt mastics are composed of 50 percent asphalt binder and 50 percent filler by
weight. This proportion was kept constant throughout the experiment. The research team used
Type II Portland cement as the non-conductive traditional filler. Graphite or carbon black
replaced part of the cement filler in the mastic specimens and ranged from 10 percent to
50 percent by weight of the mastic. For example, when the graphite content is 20 percent, cement
content is 30 percent to maintain the 50 percent filler content in the mastic.
Figure 13(a) shows that the mastic specimens were prepared in thin film shape. Dry
pinewood was used as a base for spreading the asphalt mastic. The wooden base blocks were
coated with heat-resistant epoxy to prevent the absorption of asphalt binder. The wood, binder,
and filler were conditioned at 150°C for 2 hours in the oven before mixing. Once the materials
were heated, the binder and filler (a combination of cement and graphite with various
proportions) were mixed manually by hand for 3–5 minutes to ensure uniform and complete
dispersion of the filler in the mastic. The mastic was then spread on the epoxy-coated wooden
blocks. The researchers measured the average thickness of the mastic by reading the weight of

36
the wooden block before and after spreading the mastic. Once they found the weight of the
mastic on the wooden block, they divided this weight by the density of mastic and the spread
area to obtain its average thickness. The density of the mastic was estimated using the individual
densities of the binder, cement, and graphite, and their respective weight proportions in the
mastic. For each type and content of graphite, three mastic specimens were prepared to improve
the reliability of the results.
(a) Mastic specimens
(b) Resistivity measurement setup: Solartron 1296 and 1260A
Figure 13. Experimental Setup for Measuring Electrical Property.
The mastic specimens were conditioned at room temperature for 8 hours before testing.
Figure 13(a) shows that copper tape was installed at every 50 mm and was used as electrodes.

37
Silver paste was painted between the mastic and copper tape to ensure full contact between these
items. The research team used the two-point sensing method to measure impedance of the mastic
specimens. Because of the copper tape at various locations on the specimen, the researchers were
able to select different combinations of electrodes (i.e., the distance between electrodes can be
50 mm, 100 mm, or 200 mm) and to observe the impedance change with distance.
Figure 13(b) shows the Solartron 1260A and 1296 that the research team used to measure
the resistance of the specimens. The Solartron 1260A can measure resistance only up to 100 MΩ.
To extend the measurable range up to 100 TΩ, the Solartron 1296 was combined with the 1260A.
The electrical impedances of the specimens were measured at 0.1 V with an AC frequency sweep
ranging from 0.01 Hz to 1000 Hz. Once the resistances were obtained, the volume resistivity was
calculated using Equation (1):
Eq. (1)
where ρ is the volume resistivity measured in ohm·centimeter (Ω-cm); R is the resistance in ohm
(Ω) obtained from the experiment; A is the cross-sectional area of the mastic in square
centimeters; and L is the distance between the electrodes in centimeters. The electric field is
assumed to be constant, and the end effect is assumed to be negligible.
Figure 14 shows the DSR that was used to obtain the rheological parameters of the
mastics at intermediate and high temperatures. The tests are conducted in accordance with
American Association of State Highway and Transportation Officials T315, and the
investigators obtain complex shear modulus (|G*|) and phase angle of binder (δ). |G*|
represents the stiffness of a binder that includes the contribution of elastic property and viscous
property of an asphalt. δ represents the contribution of viscosity in the viscoelastic behavior of
asphalt binder. In the DSR test, the asphalt specimen was placed between two plates (see
Figure 14[a]). The bottom plate was fixed, while the top one was oscillating with a frequency
of 10 radians per second. The diameter of the mastic sample was 25 mm.

38
(a) DSR plates
(b) DSR test equipment
Figure 14. Experimental Setup for Measuring Viscoelastic Property.
4.3 RESULT AND DISCUSSION
Effect of Steel Fiber on Electrical Conductivity
Prior to the tests for the graphite, the effect of steel fibers on the electrical conductivity
was demonstrated. Figure 15 shows the conductivity measurements for the specimens containing
30-mm steel fibers. The electrical resistance was measured using AC current for the frequency
range from 0.1 to 106 Hz. The flat line at the bottom is the resistance of the specimen containing
1.5 percent steel fibers. As shown in the figure, when the conductivity of the material is in the
measurable range, the measured resistivity is constant over the frequency range. The other three
lines in Figure 15 show a typical signal pattern for non-conductive materials. For those,
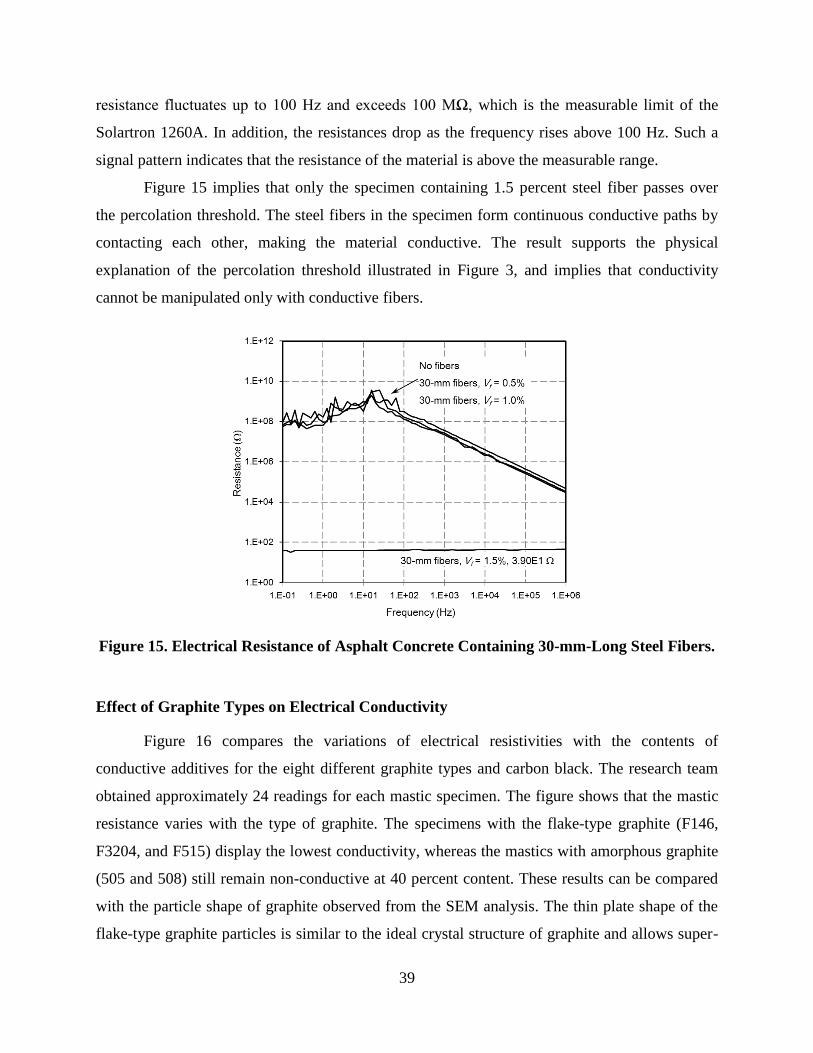
39
resistance fluctuates up to 100 Hz and exceeds 100 MΩ, which is the measurable limit of the
Solartron 1260A. In addition, the resistances drop as the frequency rises above 100 Hz. Such a
signal pattern indicates that the resistance of the material is above the measurable range.
Figure 15 implies that only the specimen containing 1.5 percent steel fiber passes over
the percolation threshold. The steel fibers in the specimen form continuous conductive paths by
contacting each other, making the material conductive. The result supports the physical
explanation of the percolation threshold illustrated in Figure 3, and implies that conductivity
cannot be manipulated only with conductive fibers.
Figure 15. Electrical Resistance of Asphalt Concrete Containing 30-mm-Long Steel Fibers.
Effect of Graphite Types on Electrical Conductivity
Figure 16 compares the variations of electrical resistivities with the contents of
conductive additives for the eight different graphite types and carbon black. The research team
obtained approximately 24 readings for each mastic specimen. The figure shows that the mastic
resistance varies with the type of graphite. The specimens with the flake-type graphite (F146,
F3204, and F515) display the lowest conductivity, whereas the mastics with amorphous graphite
(505 and 508) still remain non-conductive at 40 percent content. These results can be compared
with the particle shape of graphite observed from the SEM analysis. The thin plate shape of the
flake-type graphite particles is similar to the ideal crystal structure of graphite and allows super-

40
conductivity along the flat surface. On the other hand, the irregular shapes of the amorphous
graphite particles seem to work as a barrier against the flow of electrons, leading to poor
conductivity. These graphs demonstrate the importance of selecting the proper type of graphite
for imparting conductivity.
As shown in Figure 16(a) through (c), the resistance gradually decreases with the increase
of the graphite content. A relatively rapid drop in resistivity exists between 13 and 16 percent
(F146 and F3204) or 10 and 13 percent (F516) by mastic volume; after that point, the resistivity
drops gradually from 105 Ω·cm and reaches resistivity at about 10
2 Ω·cm. This implies that the
electrical resistivity can be controlled within the range of 102–10
5 Ω·cm, and sufficiently low
conductivity (10−2
/Ω·cm) can be obtained only by using graphite.
(a) Flake graphite F146
Figure 16. Electrical Resistivity of Asphalt Mastics Containing Various Graphite Types.
1.E+00
1.E+02
1.E+04
1.E+06
1.E+08
1.E+10
1.E+12
0% 5% 10% 15% 20% 25% 30%
Vo
lum
e R
esis
tivi
ty (Ω·c
m)
Graphite Content by Volume % of Mastic
F146
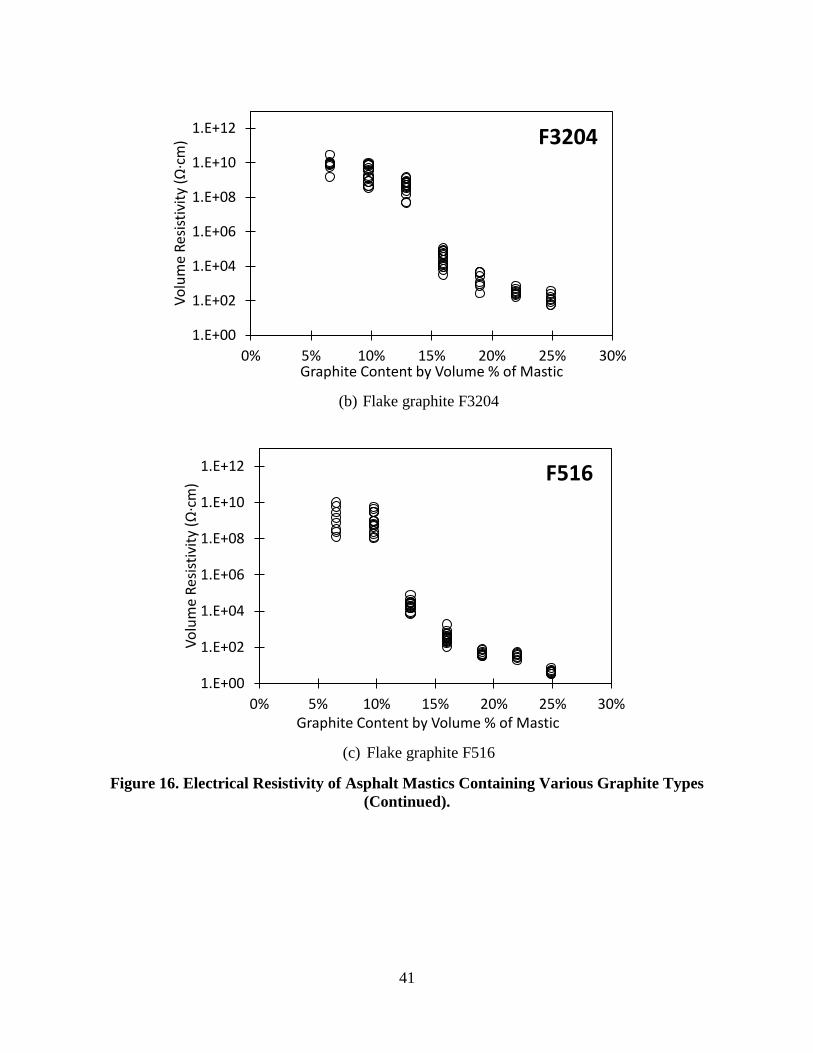
41
(b) Flake graphite F3204
(c) Flake graphite F516
Figure 16. Electrical Resistivity of Asphalt Mastics Containing Various Graphite Types
(Continued).
1.E+00
1.E+02
1.E+04
1.E+06
1.E+08
1.E+10
1.E+12
0% 5% 10% 15% 20% 25% 30%
Vo
lum
e R
esis
tivi
ty (Ω·c
m)
Graphite Content by Volume % of Mastic
F3204
1.E+00
1.E+02
1.E+04
1.E+06
1.E+08
1.E+10
1.E+12
0% 5% 10% 15% 20% 25% 30%
Vo
lum
e R
esis
tivi
ty (Ω·c
m)
Graphite Content by Volume % of Mastic
F516

42
(d) Amorphous graphite 505
(e) Amorphous graphite 508
Figure 16. Electrical Resistivity of Asphalt Mastics Containing Various Graphite Types
(Continued).
1.E+00
1.E+02
1.E+04
1.E+06
1.E+08
1.E+10
1.E+12
0% 5% 10% 15% 20% 25% 30%
Vo
lum
e R
esis
tivi
ty (Ω·c
m)
Graphite Content by Volume % of Mastic
505
1.E+00
1.E+02
1.E+04
1.E+06
1.E+08
1.E+10
1.E+12
0% 5% 10% 15% 20% 25% 30%
Vo
lum
e R
esis
tivi
ty (Ω·c
m)
Graphite Content by Volume % of Mastic
508

43
(f) Artificial graphite A99
(g) Ultra-high-surface-area graphite SA4827
Figure 16. Electrical Resistivity of Asphalt Mastics Containing Various Graphite Types
(Continued).
1.E+00
1.E+02
1.E+04
1.E+06
1.E+08
1.E+10
1.E+12
0% 5% 10% 15% 20% 25% 30%
Vo
lum
e R
esis
tivi
ty (Ω·c
m)
Graphite Content by Volume % of Mastic
A99
1.E+00
1.E+02
1.E+04
1.E+06
1.E+08
1.E+10
1.E+12
0% 5% 10% 15% 20% 25% 30%
Vo
lum
e R
esis
tivi
ty (Ω·c
m)
Graphite Content by Volume % of Mastic
SA4827

44
(h) High-surface-area graphite TC307
(i) Carbon black CB5303
Figure 16. Electrical Resistivity of Asphalt Mastics Containing Various Graphite Types
(Continued).
Figure 17 summarizes the measured electrical resistivity. Each dot in the figure
represents the average value of 24 volume resistivity readings. The first noticeable observation is
the similar trends in resistivity of all the flake-type graphite. As noted earlier, the gradual
resistivity that dropped to sufficiently low levels implies the possibility of precise conductivity
1.E+00
1.E+02
1.E+04
1.E+06
1.E+08
1.E+10
1.E+12
0% 5% 10% 15% 20% 25% 30%
Vo
lum
e R
esis
tivi
ty (Ω·c
m)
Graphite Content by Volume % of Mastic
TC307
1.E+00
1.E+02
1.E+04
1.E+06
1.E+08
1.E+10
1.E+12
0% 5% 10% 15% 20% 25% 30%
Vo
lum
e R
esis
tivi
ty (Ω·c
m)
Graphite Content by Volume % of Mastic
CB5303

45
control with the flake-type graphite. The amorphous and artificial types of graphite proved
ineffective in improving conductivity. The specimens have high volume resistivity even at high
content.
Figure 17. Comparison of Volume Resistivity of Various Graphite Types.
Mixing difficulty was observed with the high-surface-area graphite. The mastics became
thick and sticky beyond a certain concentration. Specimens with SA4827 graphite were prepared
with up to 18 percent by volume graphite content because of the mixing difficulty. TC307 and
CB5303 were even harder to mix, and specimens with only 7 percent by volume graphite content
were prepared. This limits the use of this type of graphite. The mastics containing flake-type
graphite (F146, F3204, and F516) also became sticky as the concentration in the mastic increased.
However, in the mixing of asphalt concrete including aggregate, no significant difficulty was
observed with high concentrations of graphite. The artificial type, A99, produced a watery mix
that was easier to spread on the wood than the other graphite types. In contrast, the amorphous
types 505 and 508 were difficult to mix beyond a graphite content of 18 percent by volume of the
mastic.
1.E+00
1.E+02
1.E+04
1.E+06
1.E+08
1.E+10
1.E+12
0% 10% 20% 30% 40% 50% 60%
Vo
lum
e R
esis
tivi
ty (Ω·c
m)
Graphite Content by Volume % of Mastic
CB5303
505
508
A99
SA4827
F3204
F146
F516
TC307

46
DSR Test Results
The DSR test measured the complex shear modulus (|G*|) and phase angle (δ) of the
mastics. The mastics containing the traditional filler (cement) and F516 graphite with various
proportions were tested at three different temperatures (64°C, 70°C, and 76°C).
Figure 18 shows that the complex modulus (|G*|) increases as the graphite content
increases. On the other hand, the phase angle (δ) of the mastic is not affected as significantly as
|G*|. Figure 19 shows that δ drops slightly (22–25 percent by volume) at high graphite content.
Correspondingly, ǀG*ǀ · Sinδ (Figure 20) and ǀG*ǀ/Sinδ (Figure 21) show a trend similar to that in
Figure 18. This implies that graphite can improve rutting resistance but may reduce fatigue
resistance.
Figure 18. Variation of Complex Modulus with Graphite Contents.
0
10
20
30
40
50
60
0% 1% 7% 10% 13% 16% 19% 22% 25%
Co
mp
lex
Mo
du
lus,
G*
(KPa
)
F516 Content by Volume of the Mastic
Temperature 64
Temperature 70
Temperature 76

47
Figure 19. Variation of Phase Angle with Graphite Contents.
Figure 20. Variation of ǀG*ǀ · sinδ (KPa) with Graphite Contents.
0.50
0.60
0.70
0.80
0.90
1.00
1.10
1.20
0% 1% 7% 10% 13% 16% 19% 22% 25%
Sinδ
, δ (
Ph
ase
An
gle
of
Bin
der
)
F516 Content by Volume of the Mastic
Temperature 64
Temperature 70
Temperature 76
0
10
20
30
40
50
60
0% 1% 7% 10% 13% 16% 19% 22% 25%
ǀ G*ǀ S
inδ
(K
Pa)
F516 Content by Volume of the Mastic
Temperature 64
Temperature 70
Temperature 76

48
Figure 21. Variation of G*/sinδ (KPa) with Graphite Contents.
Effect of Different Binder Types
To find the effect of different binder grades for the electrical properties, the research team
prepared asphalt mastic specimens with PG 70-22, PG 64-22, and PG 58-22 binders. These
specimens also contain various proportions of F516 graphite and non-conductive fillers.
Figure 22 illustrates the resistivity data obtained from three types of binder grade. The
three cases do not show clear differences. To examine the effect of binder types more closely, the
researchers selected the data for the conductive range (16–22 percent graphite by volume of
mastic) and plotted their fitting curves (see Figure 23). The fitting curves of PG 64-22 and
PG 58-22 are almost identical to each other, while the electrical resistivity of PG 70-22 is
approximately one order higher than the others. Considering that PG 64-22 and PG 58-22 are
produced from different crude oils, the sources of the binder do not influence the electrical
resistivity. PG 70-22 is a modified binder of PG 64-22 with 2 percent SBS and 0.5 percent sulfur.
This means that the binder modifiers can be an important factor in controlling electrical
conductivity and may increase the volume resistivity.
0
10
20
30
40
50
60
0% 1% 7% 10% 13% 16% 19% 22% 25%
G*/S
inδ
(K
Pa)
F516 Content by Volume of the Mastic
Temperature 64
Temperature 70
Temperature 76
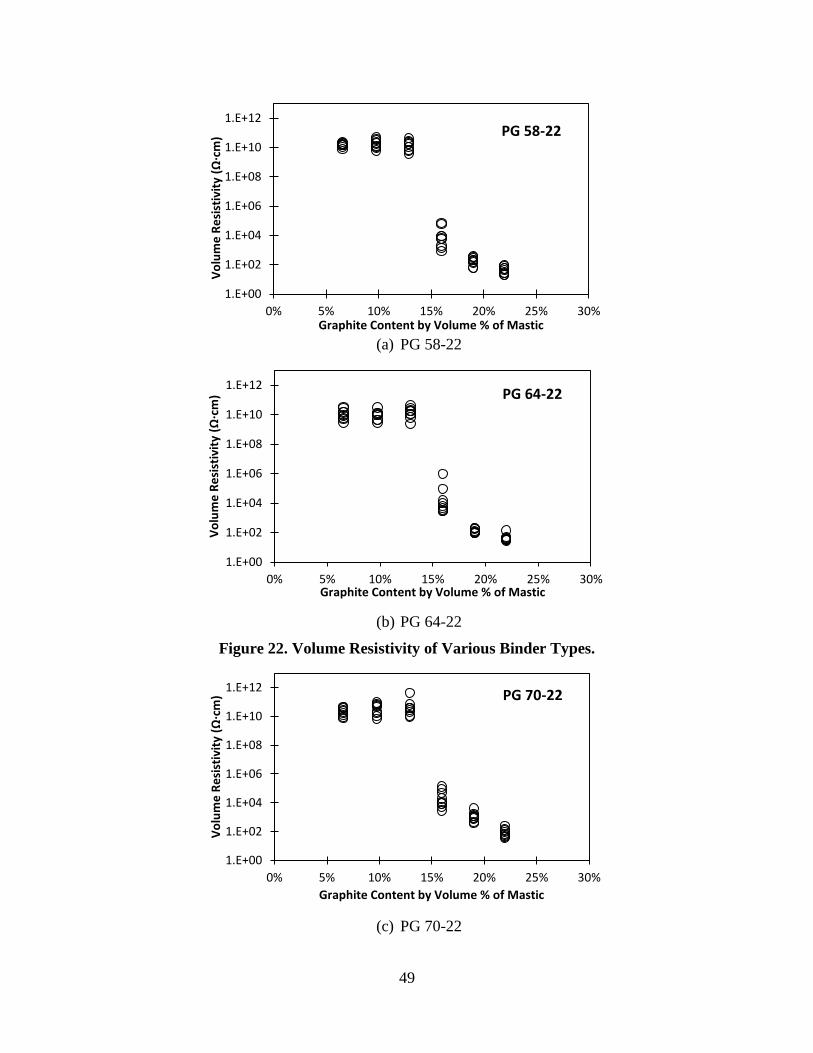
49
(a) PG 58-22
(b) PG 64-22
Figure 22. Volume Resistivity of Various Binder Types.
(c) PG 70-22
1.E+00
1.E+02
1.E+04
1.E+06
1.E+08
1.E+10
1.E+12
0% 5% 10% 15% 20% 25% 30%
Vo
lum
e R
esi
stiv
ity
(Ω·c
m)
Graphite Content by Volume % of Mastic
PG 58-22
1.E+00
1.E+02
1.E+04
1.E+06
1.E+08
1.E+10
1.E+12
0% 5% 10% 15% 20% 25% 30%
Vo
lum
e R
esi
stiv
ity
(Ω·c
m)
Graphite Content by Volume % of Mastic
PG 64-22
1.E+00
1.E+02
1.E+04
1.E+06
1.E+08
1.E+10
1.E+12
0% 5% 10% 15% 20% 25% 30%
Vo
lum
e R
esi
stiv
ity
(Ω·c
m)
Graphite Content by Volume % of Mastic
PG 70-22

50
Figure 22. Volume Resistivity of Various Binder Types (Continued).
Figure 23. Effect of Binder Types on Electrical Resistivity
1.E+00
1.E+01
1.E+02
1.E+03
1.E+04
1.E+05
1.E+06
15% 17% 19% 21% 23% 25%
Vo
lum
e R
esis
tivi
ty (Ω·c
m)
Graphite Content by Volume % of Mastic
Mastic 70-22Mastic 64-22Mastic 58-22
PG 64-22
PG 58-22 PG 70-22

51
5. ASPHALT CONCRETE TEST
5.1 INTRODUCTION
Asphalt concrete is composed of asphalt binder, aggregate, and air voids. Traditional
asphalt concrete is a good insulator by nature with resistivity ranging from 109 to 10
11 Ω.cm.
From the experiments with asphalt mastics containing various graphite types, the two best
performing graphite types (F146 and F516) were selected as conductive additives for asphalt
concrete. This section presents the mix design, specimen preparation, test method, and test
results of the conductive asphalt concrete.
5.2 MATERIALS AND EXPERIMENTS—ELECTRICAL AND MECHANICAL
Materials and Mix Design
Asphalt concrete specimens were prepared using PG 70-22 asphalt binder (density
1.032 g/cc). The specimens were prepared in accordance with the Superpave mixture design
method. Appendix A presents the sieve analysis results of fine and coarse aggregates used in this
study. The specific gravities of coarse aggregates, fine aggregates, and filler are measured as
2.57 g/cc, 2.63 g/cc, and 3.15 g/cc, respectively. The research team selected the proportion of
coarse and fine aggregates to satisfy mixture requirements specified in ASTM D3515. Table 4
shows the standard aggregate gradations for D-3, D-5, and D-6. In this study, D-6_1 gradation
(Table 5) was used to investigate the effect of different gradation types. For D-6_1 gradation, the
team used the Superpave method and determined the optimum binder content to be 5.3 percent
by weight of the total mixture. Also, the optimum binder contents for D-3, D-5, and D-6_2
gradations were determined to be 4.0 percent, 4.8 percent, and 4.86 percent, respectively, by
weight of the total mixture. Appendix Bshows the test data for these optimum binder contents.
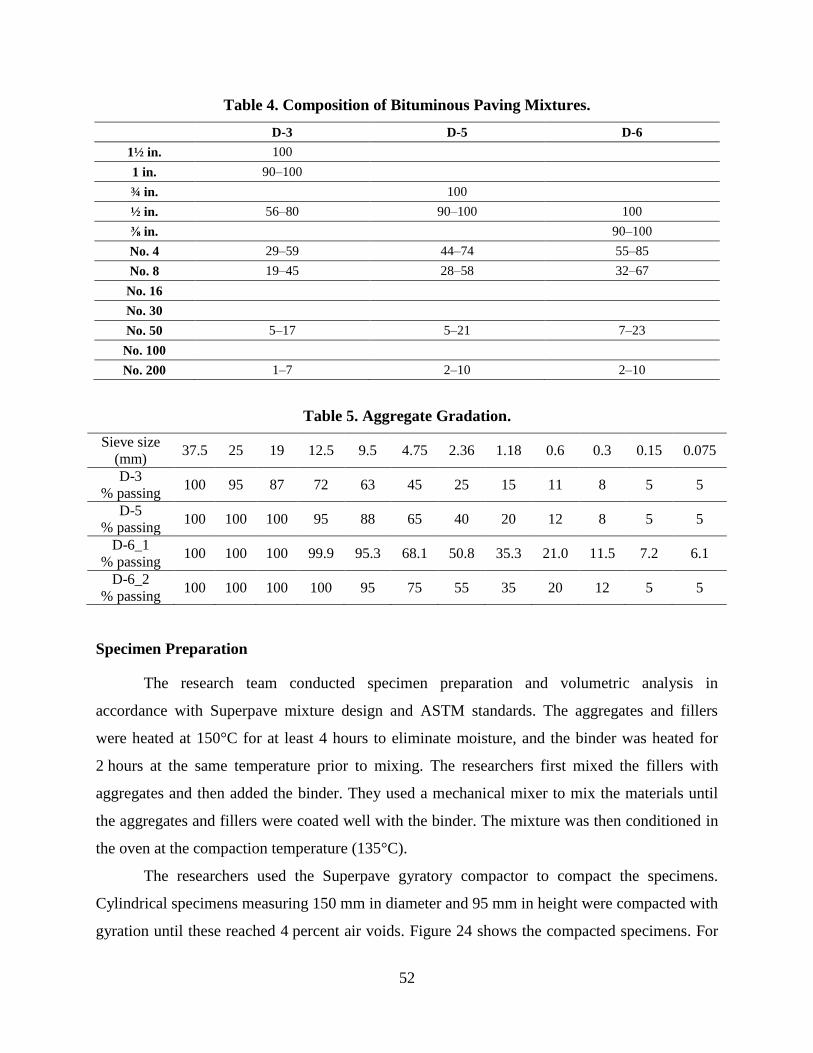
52
Table 4. Composition of Bituminous Paving Mixtures.
D-3 D-5 D-6
1½ in. 100
1 in. 90–100
¾ in. 100
½ in. 56–80 90–100 100
⅜ in. 90–100
No. 4 29–59 44–74 55–85
No. 8 19–45 28–58 32–67
No. 16
No. 30
No. 50 5–17 5–21 7–23
No. 100
No. 200 1–7 2–10 2–10
Table 5. Aggregate Gradation.
Sieve size
(mm) 37.5 25 19 12.5 9.5 4.75 2.36 1.18 0.6 0.3 0.15 0.075
D-3
% passing 100 95 87 72 63 45 25 15 11 8 5 5
D-5
% passing 100 100 100 95 88 65 40 20 12 8 5 5
D-6_1
% passing 100 100 100 99.9 95.3 68.1 50.8 35.3 21.0 11.5 7.2 6.1
D-6_2
% passing 100 100 100 100 95 75 55 35 20 12 5 5
Specimen Preparation
The research team conducted specimen preparation and volumetric analysis in
accordance with Superpave mixture design and ASTM standards. The aggregates and fillers
were heated at 150°C for at least 4 hours to eliminate moisture, and the binder was heated for
2 hours at the same temperature prior to mixing. The researchers first mixed the fillers with
aggregates and then added the binder. They used a mechanical mixer to mix the materials until
the aggregates and fillers were coated well with the binder. The mixture was then conditioned in
the oven at the compaction temperature (135°C).
The researchers used the Superpave gyratory compactor to compact the specimens.
Cylindrical specimens measuring 150 mm in diameter and 95 mm in height were compacted with
gyration until these reached 4 percent air voids. Figure 24 shows the compacted specimens. For

53
each test case, the team prepared four cylindrical specimens: three for measuring indirect tensile
strength and one for measuring the electrical conductivity. The specimen for electrical
conductivity was drilled to make three core samples out of it. This cutting eliminated the error in
conductivity measurement by removing the conductive mastic at the side of the specimens.
Figure 24.Compacted Asphalt Concrete Specimens.
Electrical Resistivity Measurement Setup
Copper tape was installed as electrodes at the top and bottom of the core-cut specimens.
The rough top and bottom surfaces of the specimen were cut. A highly conductive silver paste
was applied on the specimen surface to maintain full contact between the specimen and copper
tape. The researchers used the Solartron 1260A and 1296 (Figure 13) to measure the resistance
of the specimens. The measured resistance was then converted to volume resistivity
corresponding to the dimensions of the specimen. Figure 25 shows the specimens and
measurement setup.
(a) Painting silver paste on top and bottom (b) Installing copper tape

54
surfaces of specimens as electrodes
Figure 25. Asphalt Concrete Specimens.
Indirect Tensile Strength Test
For each case, the research team conditioned three compacted specimens at room
temperature (25°C) before testing. An electromechanical materials testing instrument, Instron
5583, was used for performing the IDT. During the IDT, a monotonic compressive load was
applied on the specimen at a constant displacement rate of 50.8 mm/min. (2 in./min.) until
fracture. The load and displacement were recorded. The IDT strength was computed as follows:
ST =
Eq. (2)
where ST is the IDT strength in MPa, P is the maximum load in N, t is the specimen height
immediately before test in millimeters, and D is the specimen diameter in millimeters. The
researchers performed the test in accordance with ASTM D6931-07. Figure 26 shows the IDT
setup and the fractured specimen.
Figure 26. Indirect Tension Test Setup.

55
5.3 RESULTS AND DISCUSSION
Volumetrics
Four specimens for each case were prepared, and their volumetric properties were
evaluated. Table 6 provides the average values of these volumetric properties.
Table 6. Volumetric Properties of the Mixture.
Specimen
Optimum
Binder
Content
(OBC) (%)
Bulk
Specific
Gravity
(Gsb) (g/cc)
Maximum
Specific
Gravity
(Gmm)
Bulk Specific
Gravity of
Compacted
Hot Mix
Asphalt (Gmb)
Air
Voids
(%)
Voids in
Mineral
Aggregate
(VMA)
Voids
Filled with
Asphalt
(VFA)
Control Mix 5.3 2.642 2.428 2.329 4.09 16.52 75.27
F146-20% 5.3 2.625 2.394 2.298 4.01 17.09 76.57
F146-25% 5.3 2.621 2.411 2.311 4.14 16.50 74.92
F146-30% 5.3 2.617 2.427 2.315 4.60 16.22 71.65
F516-10% 5.3 2.633 2.415 2.316 4.10 16.44 75.06
F516-15% 5.3 2.628 2.424 2.322 4.21 16.06 73.80
F516-20% 5.3 2.624 2.389 2.285 4.38 17.55 75.01
F516-25% 5.3 2.620 2.402 2.302 4.19 16.79 75.07
F516-30% 5.3 2.615 2.386 2.288 4.10 17.14 76.09
F516-35% 5.3 2.611 2.406 2.311 3.95 15.92 75.19
F516-40% 5.3 2.606 2.423 2.331 3.80 15.02 74.73
D-3
Gradation 4.0 2.618 2.444 2.358 4.34 15.16 71.39
D-5
Gradation 4.8 2.634 2.425 2.325 4.12 16.14 76.18
D-6
Gradation 4.9 2.638 2.465 2.354 4.50 15.23 70.43
D-6 25%
Gradation 3.9 2.638 2.431 2.335 3.95 15.91 75.18
To determine the effect of various graphite contents, this mixture design was kept
constant for the control specimens and the specimens containing graphite. In addition, 5 percent
of filler content in the mixture was kept constant, but the proportion of the graphite and
traditional filler varies. The contents of graphite were 7 percent, 10 percent, 13 percent,
16 percent, 19 percent, 22 percent, and 25 percent by volume of asphalt mastics, which are
1.1 percent, 1.6 percent, 2.1 percent, 2.6 percent, 3.1 percent, 3.6 percent, and 4.1 percent,
respectively, by weight of the total mix. On the other hand, for experiments related to the effect
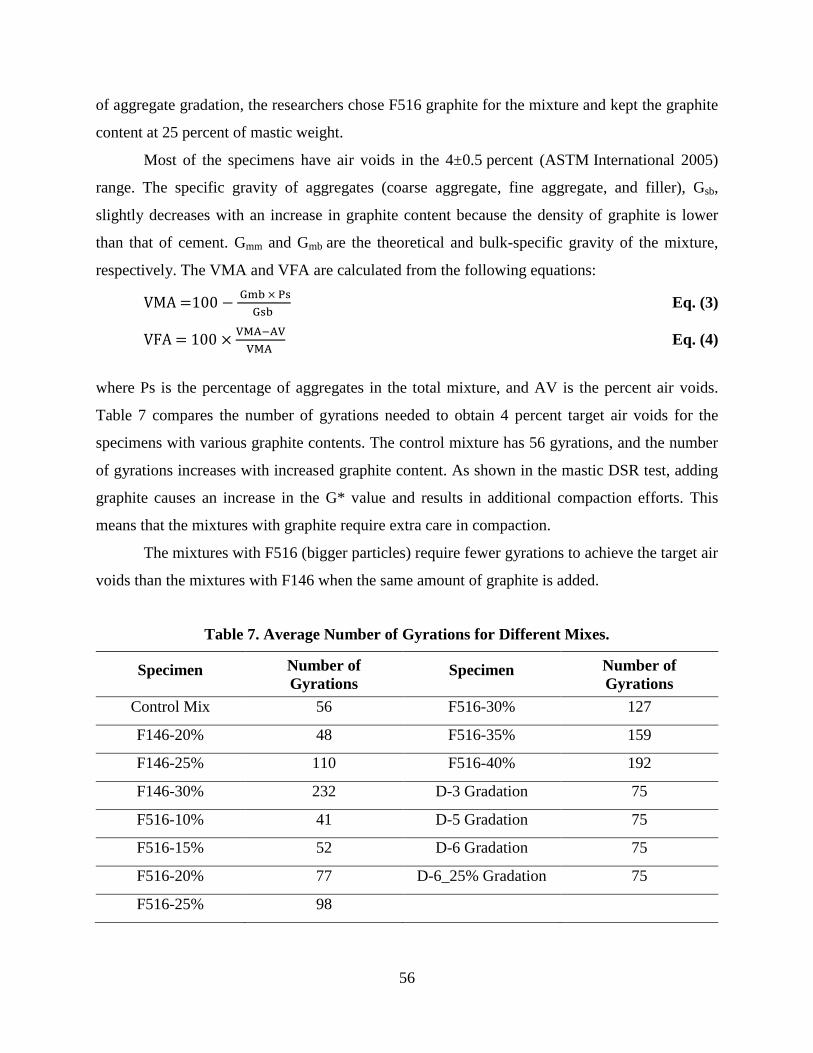
56
of aggregate gradation, the researchers chose F516 graphite for the mixture and kept the graphite
content at 25 percent of mastic weight.
Most of the specimens have air voids in the 4±0.5 percent (ASTM International 2005)
range. The specific gravity of aggregates (coarse aggregate, fine aggregate, and filler), Gsb,
slightly decreases with an increase in graphite content because the density of graphite is lower
than that of cement. Gmm and Gmb are the theoretical and bulk-specific gravity of the mixture,
respectively. The VMA and VFA are calculated from the following equations:
VMA =
Eq. (3)
VFA =
Eq. (4)
where Ps is the percentage of aggregates in the total mixture, and AV is the percent air voids.
Table 7 compares the number of gyrations needed to obtain 4 percent target air voids for the
specimens with various graphite contents. The control mixture has 56 gyrations, and the number
of gyrations increases with increased graphite content. As shown in the mastic DSR test, adding
graphite causes an increase in the G* value and results in additional compaction efforts. This
means that the mixtures with graphite require extra care in compaction.
The mixtures with F516 (bigger particles) require fewer gyrations to achieve the target air
voids than the mixtures with F146 when the same amount of graphite is added.
Table 7. Average Number of Gyrations for Different Mixes.
Specimen Number of
Gyrations Specimen Number of
Gyrations
Control Mix 56 F516-30% 127
F146-20% 48 F516-35% 159
F146-25% 110 F516-40% 192
F146-30% 232 D-3 Gradation 75
F516-10% 41 D-5 Gradation 75
F516-15% 52 D-6 Gradation 75
F516-20% 77 D-6_25% Gradation 75
F516-25% 98

57
Electrical Resistivity Test
Figure 27 shows the variation of volume resistivity of asphalt concrete specimens and
asphalt mastic specimens containing F146 graphite. Figure 28 represents volume resistivity
according to the F516 graphite content of the specimens. The lines in Figure 27 and Figure 28
show the volume resistivity from the asphalt mastic specimens. In Figure 28, the volume
resistivity of the control mixture (no graphite) is 1.03 × 10¹³
Ω.cm. The specimens with the two
types of conductive graphite (F146 and F516) show a similar trend to the mastic test results—
resistivity decreases with increased graphite content. Although there are exceptions, the volume
resistivity data of asphalt concrete specimens in the conductive range (13–25 percent by volume
of mastics) are higher than those of the mastic specimens because of the additional non-
conductive volume of aggregate. Appendix C presents all of the electrical resistivity values.
Figure 27. Volume Resistivity versus F146 Graphite Content for Conductive Asphalt
Concrete.
1.E+00
1.E+02
1.E+04
1.E+06
1.E+08
1.E+10
1.E+12
0% 5% 10% 15% 20% 25% 30%
Vo
lum
e R
esis
tivi
ty (Ω·c
m)
Graphite content by volume % of mastic
Mastic_F146
AC_F146
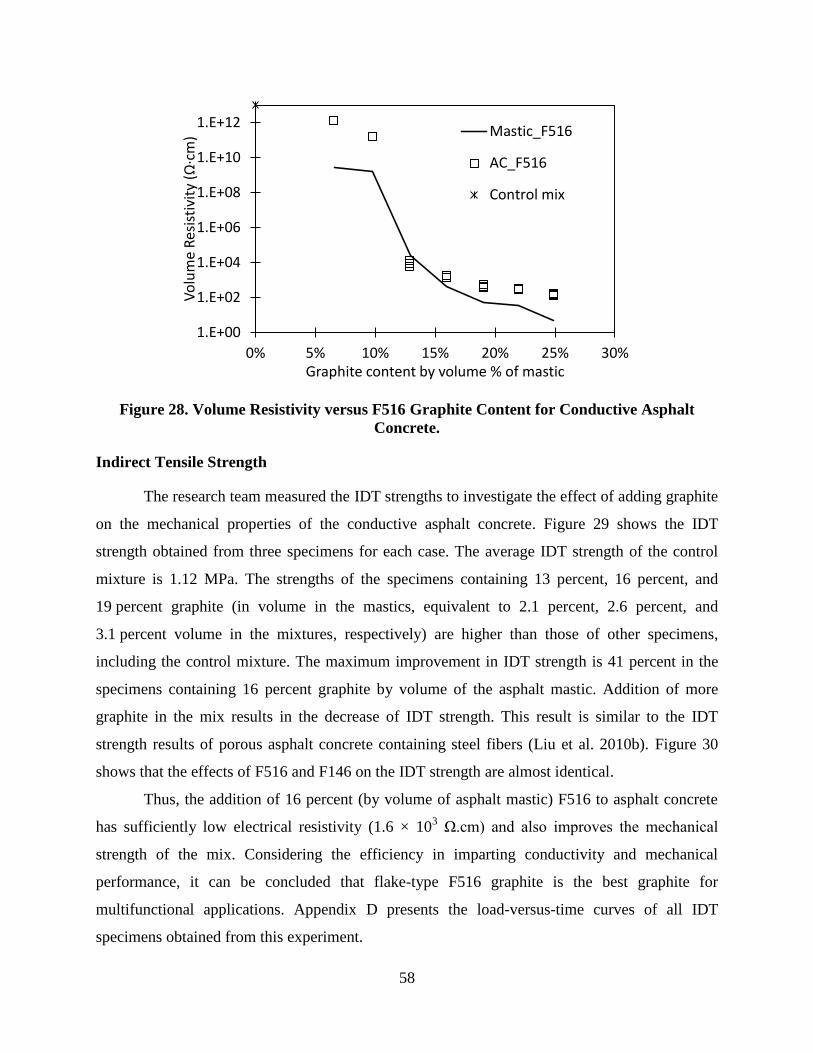
58
Figure 28. Volume Resistivity versus F516 Graphite Content for Conductive Asphalt
Concrete.
Indirect Tensile Strength
The research team measured the IDT strengths to investigate the effect of adding graphite
on the mechanical properties of the conductive asphalt concrete. Figure 29 shows the IDT
strength obtained from three specimens for each case. The average IDT strength of the control
mixture is 1.12 MPa. The strengths of the specimens containing 13 percent, 16 percent, and
19 percent graphite (in volume in the mastics, equivalent to 2.1 percent, 2.6 percent, and
3.1 percent volume in the mixtures, respectively) are higher than those of other specimens,
including the control mixture. The maximum improvement in IDT strength is 41 percent in the
specimens containing 16 percent graphite by volume of the asphalt mastic. Addition of more
graphite in the mix results in the decrease of IDT strength. This result is similar to the IDT
strength results of porous asphalt concrete containing steel fibers (Liu et al. 2010b). Figure 30
shows that the effects of F516 and F146 on the IDT strength are almost identical.
Thus, the addition of 16 percent (by volume of asphalt mastic) F516 to asphalt concrete
has sufficiently low electrical resistivity (1.6 × 10³ Ω.cm) and also improves the mechanical
strength of the mix. Considering the efficiency in imparting conductivity and mechanical
performance, it can be concluded that flake-type F516 graphite is the best graphite for
multifunctional applications. Appendix D presents the load-versus-time curves of all IDT
specimens obtained from this experiment.
1.E+00
1.E+02
1.E+04
1.E+06
1.E+08
1.E+10
1.E+12
0% 5% 10% 15% 20% 25% 30%
Vo
lum
e R
esis
tivi
ty (Ω·c
m)
Graphite content by volume % of mastic
Mastic_F516
AC_F516
Control mix
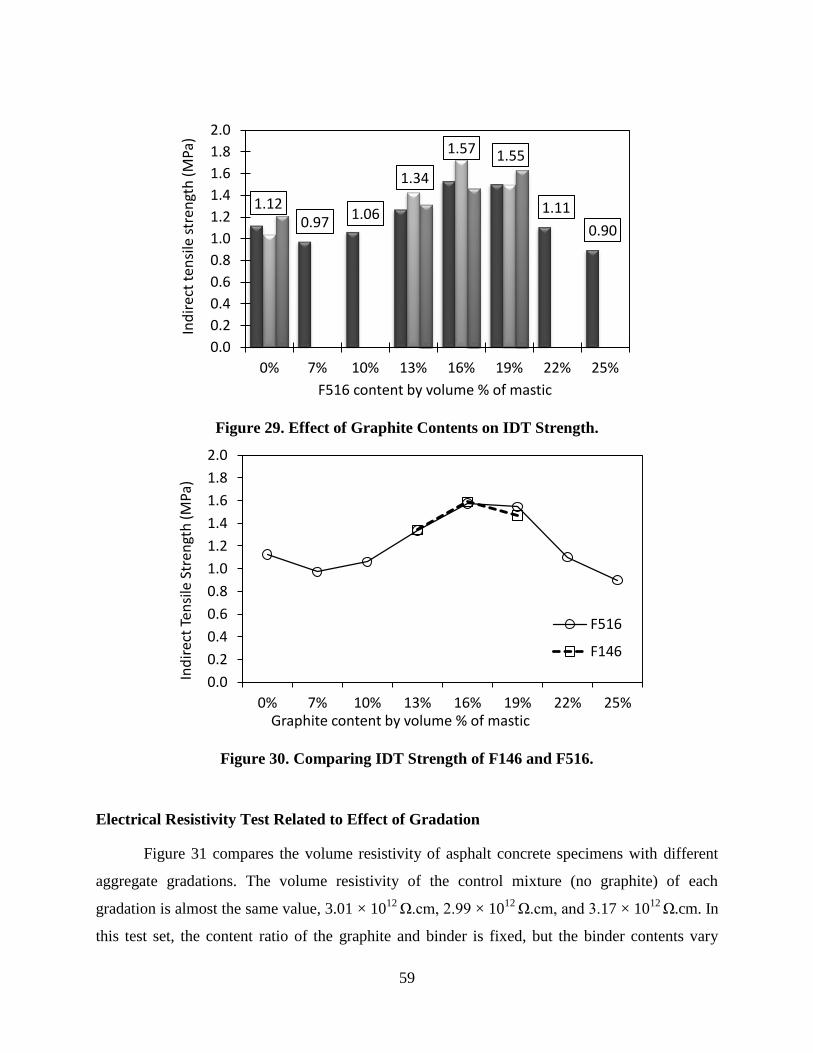
59
Figure 29. Effect of Graphite Contents on IDT Strength.
Figure 30. Comparing IDT Strength of F146 and F516.
Electrical Resistivity Test Related to Effect of Gradation
Figure 31 compares the volume resistivity of asphalt concrete specimens with different
aggregate gradations. The volume resistivity of the control mixture (no graphite) of each
gradation is almost the same value, 3.01 × 10¹²
Ω.cm, 2.99 × 10¹²
Ω.cm, and 3.17 × 10¹²
Ω.cm. In
this test set, the content ratio of the graphite and binder is fixed, but the binder contents vary
1.12 0.97
1.06
1.34
1.57 1.55
1.11
0.90
0.0
0.2
0.4
0.6
0.8
1.0
1.2
1.4
1.6
1.8
2.0
0% 7% 10% 13% 16% 19% 22% 25%
Ind
irec
t te
nsi
le s
tren
gth
(MPa
)
F516 content by volume % of mastic
0.0
0.2
0.4
0.6
0.8
1.0
1.2
1.4
1.6
1.8
2.0
0% 7% 10% 13% 16% 19% 22% 25%
Ind
irec
t Te
nsi
le S
tren
gth
(MPa
)
Graphite content by volume % of mastic
F516
F146
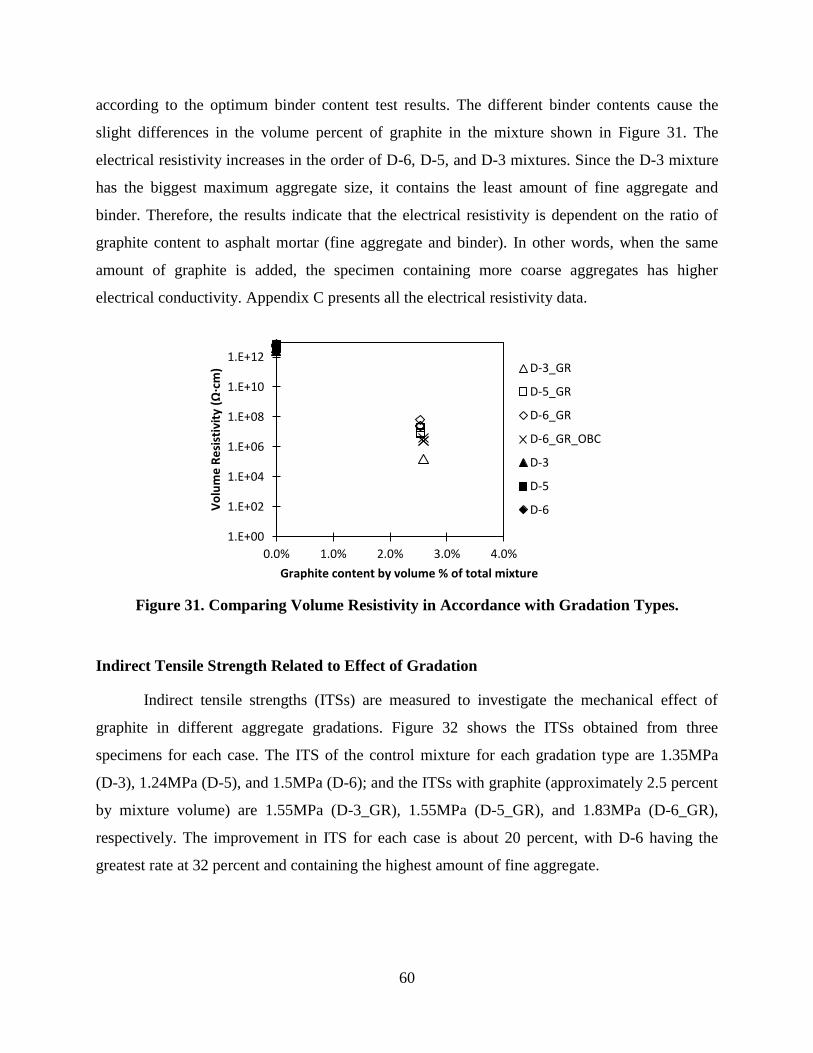
60
according to the optimum binder content test results. The different binder contents cause the
slight differences in the volume percent of graphite in the mixture shown in Figure 31. The
electrical resistivity increases in the order of D-6, D-5, and D-3 mixtures. Since the D-3 mixture
has the biggest maximum aggregate size, it contains the least amount of fine aggregate and
binder. Therefore, the results indicate that the electrical resistivity is dependent on the ratio of
graphite content to asphalt mortar (fine aggregate and binder). In other words, when the same
amount of graphite is added, the specimen containing more coarse aggregates has higher
electrical conductivity. Appendix C presents all the electrical resistivity data.
Figure 31. Comparing Volume Resistivity in Accordance with Gradation Types.
Indirect Tensile Strength Related to Effect of Gradation
Indirect tensile strengths (ITSs) are measured to investigate the mechanical effect of
graphite in different aggregate gradations. Figure 32 shows the ITSs obtained from three
specimens for each case. The ITS of the control mixture for each gradation type are 1.35MPa
(D-3), 1.24MPa (D-5), and 1.5MPa (D-6); and the ITSs with graphite (approximately 2.5 percent
by mixture volume) are 1.55MPa (D-3_GR), 1.55MPa (D-5_GR), and 1.83MPa (D-6_GR),
respectively. The improvement in ITS for each case is about 20 percent, with D-6 having the
greatest rate at 32 percent and containing the highest amount of fine aggregate.
1.E+00
1.E+02
1.E+04
1.E+06
1.E+08
1.E+10
1.E+12
0.0% 1.0% 2.0% 3.0% 4.0%
Vo
lum
e R
esi
stiv
ity
(Ω·c
m)
Graphite content by volume % of total mixture
D-3_GR
D-5_GR
D-6_GR
D-6_GR_OBC
D-3
D-5
D-6

61
Figure 32. Effect of Graphite Contents on IDT Strength of Conductive Asphalt Concrete.
1.51
1.83
1.55
1.35
1.55
1.24
0.0
0.2
0.4
0.6
0.8
1.0
1.2
1.4
1.6
1.8
2.0
D-6 D-6_GR D-5 D-5_GR D-3 D-3_GR
Ind
ire
ct t
en
sile
str
en
gth
(M
Pa)


63
6. CONCLUSIONS AND SUMMARY
The effects of graphite additives on the electrical conductivity and mechanical properties
of asphalt concrete were investigated in this study. The electrical volume resistivity of the mastic
specimens containing various types and contents of graphite was examined, and the
physical/geometrical properties of the graphite particles were evaluated through the SEM
analysis. From the mastic test results, two graphite types were selected and added to the asphalt
concrete. The conductivity of these asphalt concrete samples was compared with that of asphalt
mastics. The effects of binder type and aggregate gradation were investigated as well.
Major findings from the study are listed as follows:
A sudden change in electrical resistivity from no conduction to conduction, i.e., the
so-called percolation threshold, is observed in specimens containing steel fibers.
Achieving this threshold implies that the steel fibers form conductive paths, which
behave like a switch. Therefore, it is difficult to manipulate the electrical resistivity
of asphalt concrete only with fibers.
The electrical conductivity of asphalt mastics varies significantly with the type of
conductive fillers. Natural flake graphite powder is the most efficient in imparting
conductivity into asphalt. Sufficiently low electrical resistivity can be obtained by
replacing a part of the fillers with the flake-type graphite powder in asphalt mastics.
The volume resistivity of asphalt mastic and asphalt concrete containing natural flake
graphite powder varies widely with the amount of graphite powder mixed in the
mastic. The graphite does not completely eliminate the percolation threshold but
substantially mitigates it. This implies that the electrical resistivity of asphaltic
composite can be manipulated over a wide range of resistivity.
The different binder types do not have significant influence on the electrical
conductivity of asphalt mastics, but binder modifiers may reduce electrical
conductivity.
When a fixed amount of graphite is added to the mixture, using less fine aggregate
and binder results in higher electrical conductivity.
The conductive asphalt concrete containing the flake-type graphite has improved ITS
when compared to the control asphalt concrete. DSR tests for asphalt mastic show

64
that the flake-type graphite additives increase complex modulus. This implies that
adding graphite is beneficial for improving rutting resistance.
Flake graphite exhibits good electrical conductivity along with mechanical performance.
As discussed in the previous chapters, the stepwise decrease in electrical resistivity of this
conductive asphalt concrete can be used for various multifunctional applications.

65
REFERENCES
Abtahi, S. M., M. Sheikhzadeh, and S. M. Hejazi (2010). “Fiber-Reinforced Asphalt-Concrete—
A Review.” Construction and Building Materials, 24 (6), pp. 871–877.
American Society for Testing and Materials (2000) (reapproved 2004). “Standard Specification
for Coarse Aggregate for Bituminous Paving Mixtures.” ASTM D692-00, West
Conshohocken, PA.
Asbury Carbons (2013). Materials. http://asbury.com/materials/graphite/.
ASTM International (2001). “Standard Specification for Hot-Mixed, Hot-Laid Bituminous
Paving Mixtures.” ASTM D3515-01, West Conshohocken, PA.
ASTM International (2003). “Standard Test Method for Theoretical Maximum Specific Gravity
and Density of Bituminous Paving Mixtures.” ASTM D2041-03, West Conshohocken, PA.
ASTM International (2005). “Standard Test Method for Percent Air Voids in Compacted Dense
and Open Bituminous Paving Mixtures.” ASTM D3203-05, West Conshohocken, PA.
ASTM International (2006). “Standard Test Method for Sieve Analysis of Fine and Coarse
Aggregates.” ASTM C136-06, West Conshohocken, PA.
ASTM International (2007a). “Standard Specification for Fine Aggregate for Bituminous Paving
Mixtures.” ASTM D1073-07, West Conshohocken, PA.
ASTM International (2007b). “Standard Specification for Performance Graded Asphalt Binder.”
ASTM D6373-07, West Conshohocken, PA.
ASTM International (2007c). “Standard Test Method for Bulk Specific Gravity and Density of
Compacted Bituminous Mixtures Using Coated Samples.” ASTM D1188-07, West
Conshohocken, PA.
ASTM International (2007d). “Standard Test Method for Indirect Tensile (IDT) Strength of
Bituminous Mixtures.” ASTM D6931-07, West Conshohocken, PA.
Azhari, F., and N. Banthia (2012). “Cement-Based Sensors with Carbon Fibers and Carbon
Nanotubes for Piezoresistive Sensing.” Cement and Concrete Composites, 34 (7), pp. 866–
873.
Baeza, J. F., D. D. Chung, E. Zornoza, L. G. Andion, and P. Carces (2010). “Triple Percolation
in Concrete Reinforced with Carbon Fiber.” ACI Material Journal, 107 (4), pp. 396–402.
Banthia, N. (1992). “Electrical Resistivity of Carbon and Steel Micro-fiber Reinforced
Cements.” Cement and Concrete Research, 22 (5), pp. 804–814.

66
Barnard, E. H. (1965). “Electrically Conductive Concrete.” U.S. Patent 3,166,518.
Blackburn, R. R., K. M. Bauer, D. E. Amsler, Sr., S. E. Boselly III, and A. D. McElroy (2004).
NCHRP Report 526: Snow and Ice Control: Guidelines for Materials and Methods.
Transportation Research Board, National Cooperative Highway Research Program,
Washington, DC.
Bommavaram, R. R., A. Bhasin, and D. N. Little (2009). “Determining Intrinsic Healing
Properties of Asphalt Binders.” Transportation Research Record, 2126 (1), pp. 47–54.
Bonnaure, F. P., A. H. Huibers, and A. Boonders (1982). “A Laboratory Investigation of the
Influence of Rest Periods on the Fatigue Characteristics of Bituminous Mixes.” Journal
of the Association of Asphalt Paving Technologists, 51, pp. 104–128.
Cao, J., S. Wen, and D. D. L. Chung (2001). “Defect Dynamics and Damage of Cement-Based
Materials, Studied by Electrical Resistance Measurement.” Journal of Materials Science,
36 (18), pp. 4351–4360.
Chacko, R., and N. Banthia (2007). “Carbon Fiber Reinforced Cement Based Sensors.”
Canadian Journal of Civil Engineering, 34 (3), pp. 284–290.
Chen, B., and J. Liu (2007). “Damage in Carbon Fiber-Reinforced Concrete, Monitored by Both
Electrical Resistance Measurement and Acoustic Emission Analysis.” Construction and
Building Materials, 22 (11), pp. 2196–2201.
Chen, B., K. Wu, and W. Yao (2004). “Conductivity of Carbon Fiber Reinforced Cement-Based
Composites.” Cement and Concrete Composites, 26 (4), pp. 291–297.
Chen, F., M. Chen, S. Wu, and J. Zhang (2012). “Research on Pavement Performance of Steel
Slag Conductive Asphalt Concrete for Deicing and Snow Melting.” Key Engineering
Materials, 509, pp. 168–174.
Chen, P., and D. D. L. Chung (1995). “Improving the Electrical Conductivity of Composites
Comprised of Short Conducting Fibers in a Non-conducting Matrix: The Addition of a
Non-conducting Particulate Filler.” Journal of Electronic Materials, 24 (1), pp. 47–51.
Chiarello, M., and R. Zinno (2004). “Electrical Conductivity of Self-Monitoring CFRC.” Cement
and Concrete Composites, 27 (4), pp. 463–469.
Chung, D. D. L. (1997). “Self-Monitoring Structural Materials.” Materials Science and
Engineering, 22 (2), pp. 57–78.
67
Chung, D. D. L. (1999). “Cement Reinforced with Short Carbon Fibers: A Multifunctional
Material.” Composites, 31 (6), pp. 511–526.
Chung, D. D. L. (2000). “Cement-Matrix Composites for Smart Structures.” Smart Materials
and Structures, 9 (4), pp. 389–401.
Chung, D. D. L. (2002). “Piezoresistive Cement-Based Materials for Strain Sensing.” Journal of
Intelligent Material Systems and Structures, 13 (9), pp. 599–609.
Chung, D. D. L. (2003). Multifunctional Cement-Based Materials. Marcel Dekker, Inc.,
New York, NY.
Chung, D. D. L. (2012). “Carbon Materials for Structural Self-Sensing, Electromagnetic
Shielding and Thermal Interfacing.” Carbon, 50 (9), pp. 3342–3353.
Chung, D. D. L., and S. Wang (2003). “Self-Sensing of Damage and Strain in Carbon Fiber
Polymer-Matrix Structural Composites by Electrical Resistance Measurement.” Polymer
and Polymer Composites, 11 (7), pp. 515–525.
Daniel, J. S., and Y. R. Kim (2001). “Laboratory Evaluation of Fatigue Healing of Asphalt
Mixtures.” Journal of Materials in Civil Engineering, 13 (6), pp. 434–440.
Fromm, H. J. (1976). “Electrically Conductive Asphalt Mixes for the Cathodic Protection of
Concrete Bridge Decks.” Proceedings of Association of Asphalt Paving Technologists,
pp. 382–399.
Garcia, A. (2012). “Self-Healing of Open Cracks in Asphalt Mastic.” Fuel, 93, pp. 264–272.
García, A., E. Schlangen, M. Van de Ven, and D. Van Vliet (2011a). “Crack Repair of Asphalt
Concrete with Induction Energy.” Heron, 56 (1/2), pp. 37–48.
García, A., E. Schlangen, M. Van de Ven, and D. Van Vliet (2011b). “Induction Heating of
Mastic Containing Conductive Fibers and Fillers.” Materials and Structure, 44, pp. 499–
508.
García, A., E. Schlangen, M. Van de Ven, and Q. Liu (2009). “Electrical Conductivity of Asphalt
Mortar Containing Conductive Fibers and Fillers.” Construction and Building Materials,
23 (10), pp. 3175–3181.
Gibson, R. F. (2010). “A Review of Recent Research on Mechanics of Multifunctional
Composite Materials and Structures.” Composite Structures, 92, pp. 2793–2810.
Hong, L. (2003). “Experimental Study on Graphite Slurry Infiltrated Fiber Concrete Slab for
Snow Melting.” Journal of Building Materials, 12 (1), pp. 96–100.

68
Huang, B., J. Cao, X. Chen, X. Shu, and W. He (2006). “Laboratory Investigation into
Electrically Conductive HMA Mixtures.” Journal of the Association of Asphalt Paving
Technologists, 75, pp. 1235–1253.
Huang, B., X. Chen, and X. Shu (2009). “Effects of Electrically Conductive Additives on
Laboratory-Measured Properties of Asphalt Mixtures.” Journal of Materials in Civil
Engineering, 21, pp. 612–617.
Liu, Q., E. Schlangen, M. Ven, and M. Poot (2010a). “Optimization of Steel Fiber Used for
Induction Heating in Porous Asphalt Concrete.” Proceedings of the Seventh International
Conference on Traffic and Transportation Studies, ASCE, Kunming, China, August 3–5,
pp. 1320–1330.
Liu, Q., E. Schlangen, A. García, and M. Ven (2010b). “Induction Heating of Electrically
Conductive Porous Asphalt Concrete.” Construction and Building Materials, 24 (7),
pp. 1207–1213.
Liu, Q., E. Schlangen, M. Ven, and A. Garcia (2010c). “Healing of Porous Asphalt Concrete via
Induction Heating.” Road Materials and Pavement Design, 11 (S1), pp. 527–542.
Liu, X., and S. Wu (2009). “Research on the Conductive Asphalt Concrete’s Piezoresistivity
Effect and Its Mechanism.” Construction and Building Materials, 23 (8), pp. 2752–2756.
Liu, X., and S. Wu (2011a). “Study on the Graphite and Carbon Fiber Modified Asphalt
Concrete.” Construction and Building Materials, 25, pp. 1807–1811.
Liu, X., and S. Wu (2011b). “Study on the Piezoresistivity Character of Electrically Conductive
Asphalt Concrete.” Advanced Materials Research, Vol. 233–235, pp. 1756–1761.
Liu, X., S. Wu, L. Ning, and G. Bo (2008a). “Self-Monitoring Application of Asphalt Concrete
Containing Graphite and Carbon Fibers.” Materials Science Edition, 23 (2), pp. 268–271.
Liu, X., S. Wu, Y. Qunshan, Q. Jian, and L. Bo (2008b). “Properties Evaluation of Asphalt-
Based Composites with Graphite and Mine Powders.” Construction and Building
Materials, 22, pp. 121–126.
Lofgren, S. (2001). “The Chemical Effects of Deicing Salt on Soil and Stream Water of Five
Catchments in Southeast Sweden.” Water, Air, and Soil Pollution, 130, pp. 863–868.
Minsk, L. D. (1968). “Electrically Conductive Asphalt for Control of Snow and Ice
Accumulation.” Highway Research Record, 227, pp. 57–63.

69
Minsk, L. D. (1971). “Electrically Conductive Asphaltic Concrete.” U.S. Patent 3,573,427.
Mo, L., S. Wu, X. Liu, and Z. Chen (2005). “Percolation Model of Graphite-Modified Asphalt
Concrete.” Journal of Wuhan University of Technology Materials Science Edition, 20 (1),
pp. 111–113.
Park, P. (2012). Characteristics and Applications of High-Performance Fiber Reinforced
Asphalt Concrete. Ph.D. Dissertation, University of Michigan, Ann Arbor, MI.
Sanzo, D., and S. J. Hecnar (2006). “Effects of Road Deicing Salt (NaCl) on Larval Wood
Frogs.” Environmental Pollution, 140, pp. 247–256.
Serin, S., N. Morova, M. Saltan, and S. Terzi (2012). “Investigation of Usability of Steel Fibers
in Asphalt Concrete Mixtures.” Construction and Building Materials, 36, pp. 238–244.
Stratfull, R. F. (1974). “Experimental Cathodic Protection of a Bridge Deck.” Highway Research
Report CA_DOT-TL-5117-4-74-02, California Department of Transportation,
Sacramento, CA.
Sui, L., and T. Liu (2006). “State of the Art of Multi-functional and Smart Concrete.” Key
Engineering Materials, pp. 302–303, 424–431.
Vaidya, S., and E. Allouche (2011). “Experimental Evaluation of Electrical Conductivity of
Carbon Fiber Reinforced Fly Ash Based Geopolymer.” Smart Structure and Systems,
7 (1), pp. 27–40.
Wen, S., and D. D. L. Chung (2000). “Cement as a Thermoelectric Material.” Journal of
Materials Research, 15 (12), pp. 2844–2848.
Wen, S., and D. D. L. Chung (2001a). “Effect of Admixtures on the Dielectric Constant of
Cement Paste.” Cement and Concrete Research, 31 (4), pp. 673–677.
Wen, S., and D. D. L. Chung (2001b). “Effect of Stress on the Electric Polarization in Cement.”
Cement and Concrete Research, 31 (2), pp. 291–295.
Wen, S., and D. D. L. Chung (2004). “Effect of Fiber Content on the Thermoelectric Behavior of
Cement.” Journal of Materials Science, 39 (13), pp. 4103–4106.
Wen, S., and D. D. L. Chung (2007a). “Double Percolation in the Electrical Conduction in
Carbon Fiber Reinforced Cement-Based Materials.” Carbon, 45 (2), pp. 263–267.
Wen, S., and D. D. L. Chung (2007b). “Electrical Resistance Based Damage Self-Sensing in
Carbon Fiber-Reinforced Cement.” Carbon, 45 (4), pp. 710–716.

70
Wen, S., and D. D. L. Chung (2007c). “Partial Replacement of Carbon Fiber by Carbon Black in
Multifunctional Cement-Matrix Composites.” Carbon, 45 (3), pp. 505–513.
Wen, S., and D. D. L. Chung (2007d). “Piezoresistivity-Based Strain Sensing in Carbon Fiber
Reinforced Cement.” ACI Materials Journal, 104 (2), pp. 171–179.
Wen, S., and D. D. L. Chung (2008). “Effect of Moisture on Piezoresistivity of Carbon Fiber-
Reinforced Cement Paste.” ACI Materials Journal, 105 (3), pp. 274–280.
Wu, S., L. Mo, and Z. Shui (2003). “Piezoresistivity of Graphite Modified Asphalt-Based
Composites.” Key Engineering Materials, 249, pp. 391–396.
Wu, S., L. Mo, Z. Shui, and Z. Chen (2005). “Investigation of the Conductivity of Asphalt
Concrete Containing Conductive Fillers.” Carbon, 43 (7), pp. 1358–1363.
Wu, S., X. Liu, Q. Ye, and N. Li (2006). “Self-Monitoring Electrically Conductive Asphalt-
Based Composite Containing Carbon Fillers.” Transactions of Nonferrous Metals Society
of China, 16 (S2), pp. 512–516.
Wu, S., Y. Zhang, and M. Chen (2010). “Research on Mechanical Characteristics of Conductive
Asphalt Concrete by Indirect Tensile Test.” Proceedings of SPIE, pp. 752265-752265.
Xiangyang, W., and G. Yuxing (2010). “Research on the Preparation of Conductive Asphalt
Concrete for Deicing and Snow Melting.” Proceedings of the 3rd International
Conference on Advanced Computer Theory and Engineering, pp. 381–384.
Zaleski, P. L., D. J. Derwin, and W. H. Flood (1998). “Electrically Conductive Paving Mixture
and Paving System.” U.S. Patent 5,707,171.
Zhang, H., X. H. Wu, and X. L. Wang, (2011). “Conductivity mechanism of asphalt concrete
with the PANI/PP compound conductive fiber.” In Materials Science Forum, Vol. 689,
pp. 69-73.

71
APPENDICES
A. Sieve Analysis of Aggregates
(1) Asphalt concrete with various contents of graphite
Table A1. Sieve Analysis of Coarse Aggregate.
Sieve
Size
Sieve Size
(mm)
Mass Sieve
(g)
Mass Sieve +
Agg. (g)
Mass
Retained (g)
Total %
Retained
Total %
Passing
3/4" 19 794 794 0 0 100
1/2" 12.5 787 789.5 2.5 0.17 99.83
3/8" 9.5 804.5 1,003.5 199 13.43 86.57
#4 4.75 777 1,939.5 1,162.5 90.93 9.07
#8 2.36 717 840.5 123.5 99.17 0.83
#16 1.18 630.5 634 3.5 99.40 0.60
Pan 0 383 392 9 100.00 0.00
Figure A1. Gradation of Coarse Aggregate.
1.18 2.36 4.75 9.5 12.5 19
0
20
40
60
80
100
0 1 2 3 4
Tota
l % P
assi
ng
Sieve Size (mm)

72
Table A2. Sieve Analysis of Fine Aggregate.
Sieve
Size
Sieve Size
(mm)
Mass Sieve
(g)
Mass Sieve +
Agg. (g)
Mass
Retained (g)
Total %
Retained
Total %
Passing
3/8" 9.5 804.5 804.5 0 0 100
#4 4.75 777 778.5 1.5 0.10 99.90
#8 2.36 717 1,079 362 24.23 75.77
#16 1.18 630.5 1,016 385.5 49.93 50.07
#30 0.6 575 925.5 350.5 73.30 26.70
#50 0.3 545.5 782.5 237 89.10 10.90
#100 0.15 529 636.5 107.5 96.27 3.73
#200 0.075 294 323.5 29.5 98.23 1.77
Pan 0 383 409.5 26.5 100.00 0.00
Figure A2. Gradation of Fine Aggregate.
0.075
0.15
0.3 0.6 1.18 2.36 [SERIES NAME] 9.5
0
20
40
60
80
100
0 1 2 3 4
Tota
l % P
assi
ng
Sieve Size (mm)

73
Table A3. Sieve Analysis of Aggregate.
Sieve Size
(mm)
% Passing
Coarse
Aggregate
(CA)
% Passing
Fine
Aggregate
(FA)
% Passing
Filler
Gradation
(0.35/0.6/0.05)
Specification
D-6 Mix
19 100 100 100 100.0
12.5 99.83 100 100 99.9 100
9.5 86.57 100 100 95.3 90–100
4.75 9.07 99.90 100 68.1 55–85
2.36 0.83 75.77 100 50.8 32–67
1.18 0.60 50.07 100 35.3
0.6 0.00 26.70 100 21.0
0.3 0.00 10.90 100 11.5 7–23
0.15 0.00 3.73 100 7.2
0.075 0.00 1.77 100 6.1 2–10
Nominal maximum size: 9.5 mm
Maximum size: 12.5 mm
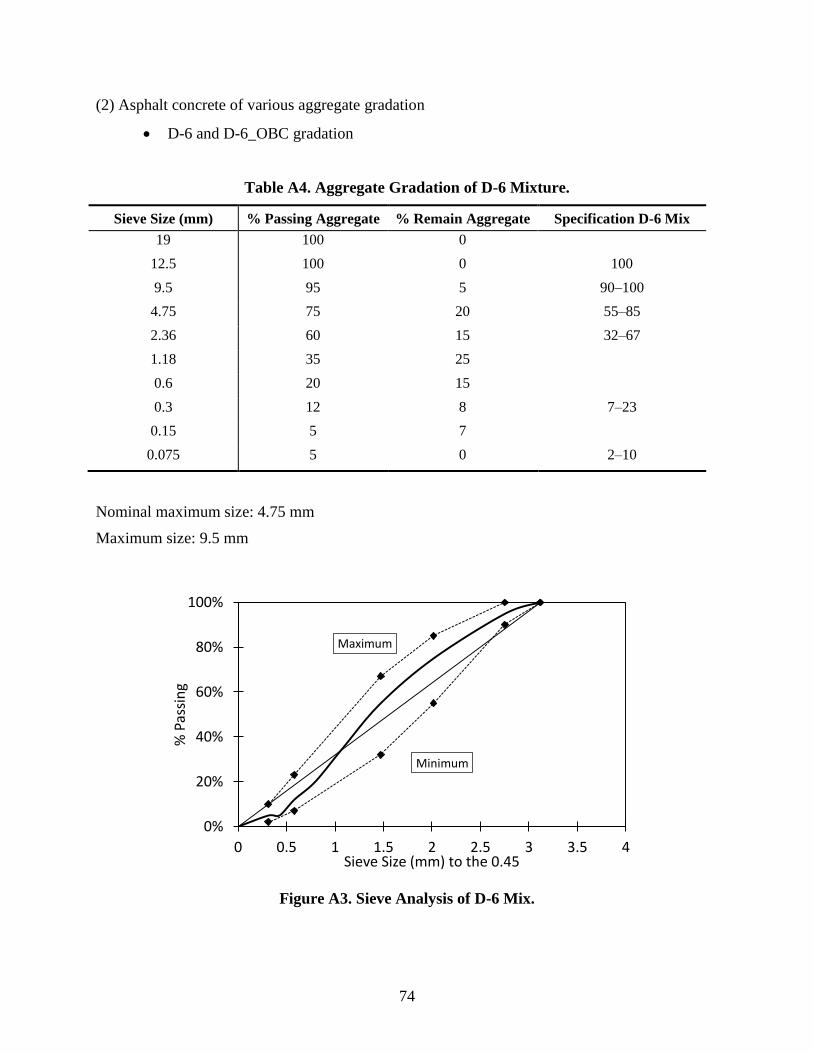
74
(2) Asphalt concrete of various aggregate gradation
D-6 and D-6_OBC gradation
Table A4. Aggregate Gradation of D-6 Mixture.
Sieve Size (mm) % Passing Aggregate % Remain Aggregate Specification D-6 Mix
19 100 0
12.5 100 0 100
9.5 95 5 90–100
4.75 75 20 55–85
2.36 60 15 32–67
1.18 35 25
0.6 20 15
0.3 12 8 7–23
0.15 5 7
0.075 5 0 2–10
Nominal maximum size: 4.75 mm
Maximum size: 9.5 mm
Figure A3. Sieve Analysis of D-6 Mix.
Maximum
Minimum
0%
20%
40%
60%
80%
100%
0 0.5 1 1.5 2 2.5 3 3.5 4
% P
assi
ng
Sieve Size (mm) to the 0.45

75
D-5 gradation
Table A5. Aggregate Gradation of D-5 Mixture.
Sieve Size (mm) % Passing Aggregate % Remain Aggregate Specification D-5 Mix
19 100 0 100
12.5 95 5 90–100
9.5 88 7
4.75 65 23 44–74
2.36 40 25 28–58
1.18 20 20
0.6 12 8
0.3 8 4 5–21
0.15 5 3
0.075 5 0 2–10
Nominal maximum size: 9.5 mm
Maximum size: 12.5 mm
Figure A4. Sieve Analysis of D-5 Mix.
Maximum
Minimum
0%
20%
40%
60%
80%
100%
0 0.5 1 1.5 2 2.5 3 3.5 4
% P
assi
ng
Sieve Size (mm) to the 0.45

76
D-3 gradation
Table A6. Aggregate Gradation of D-3 Mixture.
Sieve Size (mm) % Passing Aggregate % Remain Aggregate Specification D-3 Mix
37.5 100 0 100
25 95 8 90–100
19 87 15
12.5 72 15 56–80
9.5 63 9
4.75 45 18 29–59
2.36 25 20 19–45
1.18 15 10
0.6 11 4
0.3 8 3 5–17
0.15 5 3
0.075 5 0 1–7
Nominal maximum size: 19 mm
Maximum size: 25 mm
Figure A5. Sieve Analysis of D-5 Mix.
Maximum
Minimum
0%
20%
40%
60%
80%
100%
0 0.5 1 1.5 2 2.5 3 3.5 4 4.5 5 5.5
% P
assi
ng
Sieve Size (mm) to the 0.45
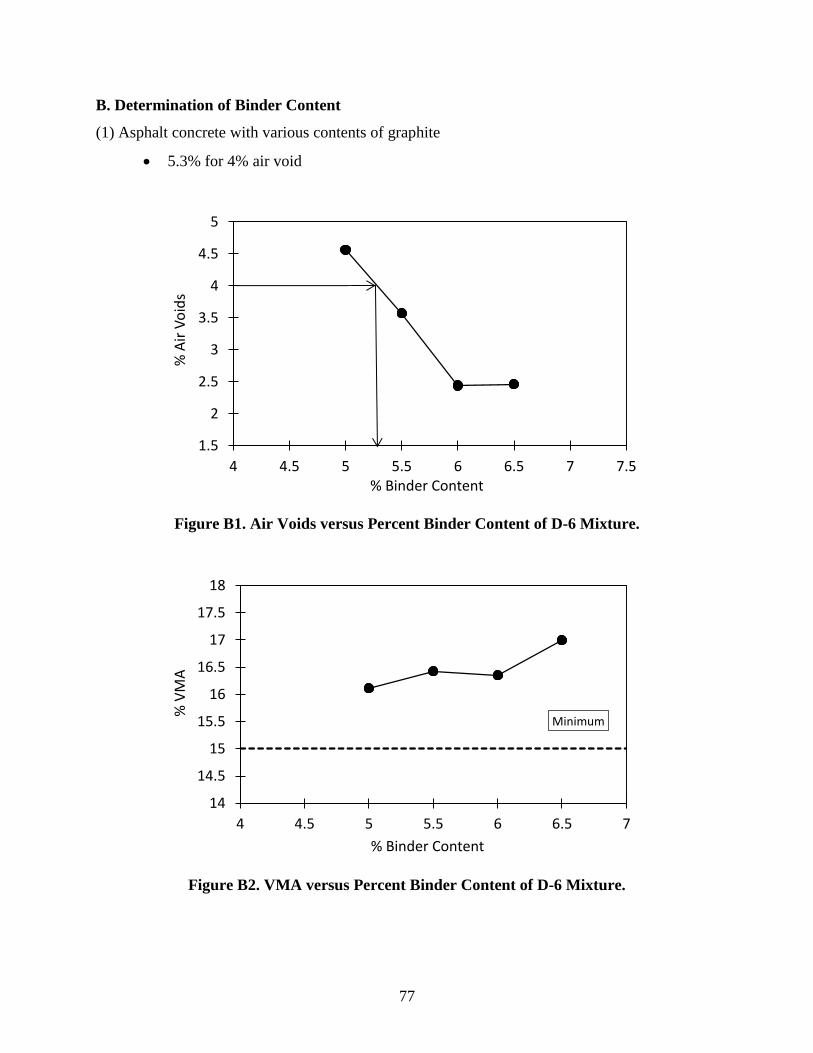
77
B. Determination of Binder Content
(1) Asphalt concrete with various contents of graphite
5.3% for 4% air void
Figure B1. Air Voids versus Percent Binder Content of D-6 Mixture.
Figure B2. VMA versus Percent Binder Content of D-6 Mixture.
1.5
2
2.5
3
3.5
4
4.5
5
4 4.5 5 5.5 6 6.5 7 7.5
% A
ir V
oid
s
% Binder Content
Minimum
14
14.5
15
15.5
16
16.5
17
17.5
18
4 4.5 5 5.5 6 6.5 7
% V
MA
% Binder Content

78
Figure B3. VFA versus Percent Binder Content of D-6 Mixture.
(2) Asphalt concrete with various aggregate gradation
D-6 (4.86% for 4% air void)
Figure B4. Air Voids versus Percent Binder Content of D-6 Mixture.
Maximum
Minimum
60
70
80
90
100
4 4.5 5 5.5 6 6.5 7
% V
FA
% Binder Content
1
1.5
2
2.5
3
3.5
4
4.5
5
5.5
6
3.5 4 4.5 5 5.5 6 6.5
% A
ir V
oid
s
% Binder Content

79
Figure B5. VMA versus Percent Binder Content of D-6 Mixture.
Figure B6. VFA versus Percent Binder Content of D-6 Mixture.
Minimum
14
14.5
15
15.5
16
16.5
17
17.5
18
3.5 4 4.5 5 5.5 6 6.5
% V
MA
% Binder Content
Maximum
Minimum
60
70
80
90
100
3.5 4 4.5 5 5.5 6 6.5
% V
FA
% Binder Content

80
D-5 (4.8% for 4% air void)
Figure B7. Air Voids versus Percent Binder Content of D-5 Mixture.
Figure B8. VMA versus Percent Binder Content of D-5 Mixture.
1
2
3
4
5
6
7
3 3.5 4 4.5 5 5.5 6
% A
ir V
oid
s
% Binder Content
Minimum
1414.5
1515.5
1616.5
1717.5
1818.5
1919.5
20
3 3.5 4 4.5 5 5.5 6
% V
MA
% Binder Content

81
Figure B9. VFA versus Percent Binder Content of D-5 Mixture.
D-3 (4.08% for 4% air void)
Figure B10. Air Voids versus Percent Binder Content of D-3 Mixture.
Maximum
Minimum
60
70
80
90
100
3 3.5 4 4.5 5 5.5 6
% V
FA
% Binder Content
0
0.5
1
1.5
2
2.5
3
3.5
4
4.5
3 3.5 4 4.5 5 5.5 6
% A
ir V
oid
s
% Binder Content

82
Figure B11. VMA versus Percent Binder Content of D-3 Mixture.
Figure B12. VFA versus Percent Binder Content of D-3 Mixture.
Minimum
12
12.5
13
13.5
14
14.5
15
15.5
16
16.5
17
3 3.5 4 4.5 5 5.5 6
% V
MA
% Binder Content
Maximum
Minimum
60
70
80
90
100
3 3.5 4 4.5 5 5.5 6
% V
FA
% Binder Content
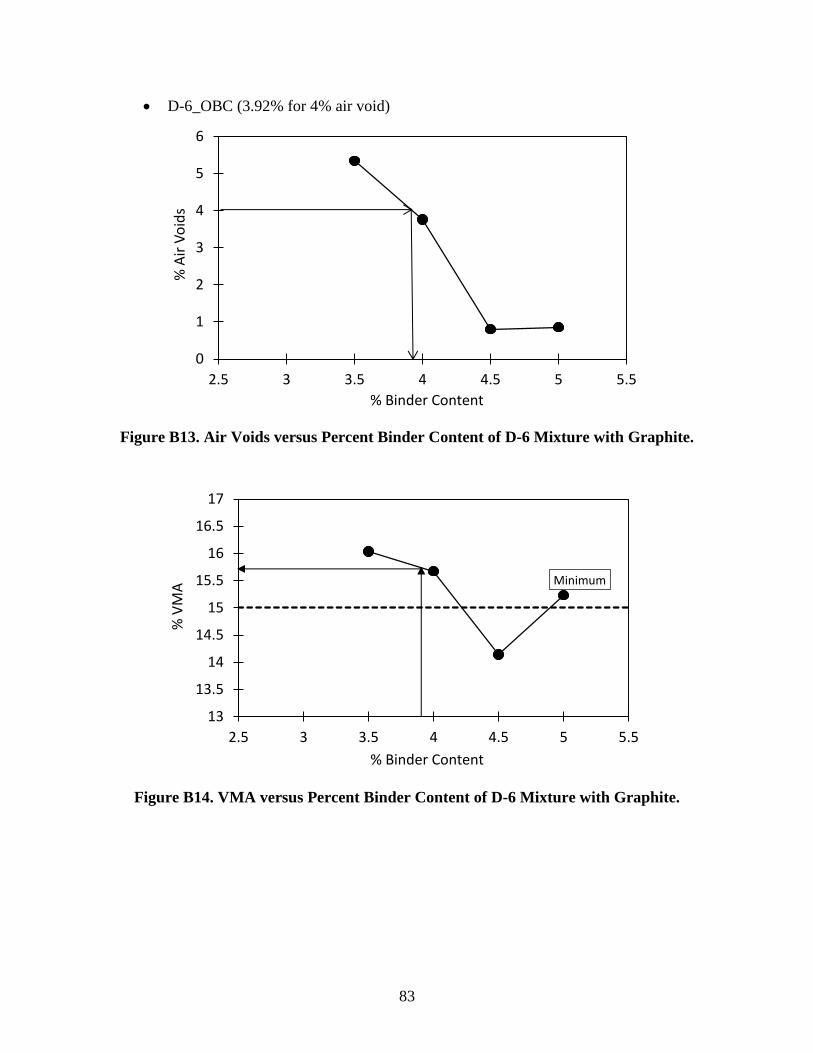
83
D-6_OBC (3.92% for 4% air void)
Figure B13. Air Voids versus Percent Binder Content of D-6 Mixture with Graphite.
Figure B14. VMA versus Percent Binder Content of D-6 Mixture with Graphite.
0
1
2
3
4
5
6
2.5 3 3.5 4 4.5 5 5.5
% A
ir V
oid
s
% Binder Content
Minimum
13
13.5
14
14.5
15
15.5
16
16.5
17
2.5 3 3.5 4 4.5 5 5.5
% V
MA
% Binder Content
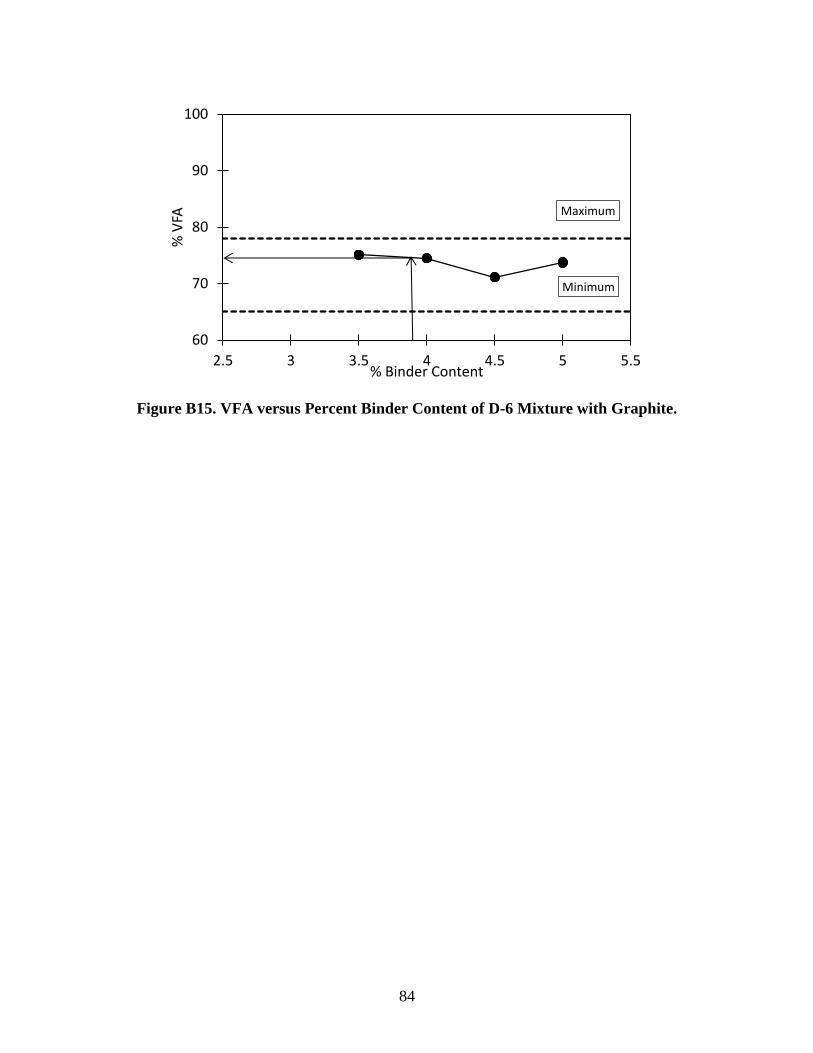
84
Figure B15. VFA versus Percent Binder Content of D-6 Mixture with Graphite.
Maximum
Minimum
60
70
80
90
100
2.5 3 3.5 4 4.5 5 5.5
% V
FA
% Binder Content

85
C. Electrical Resistivity of Conductive Asphalt Concrete
Table C1. Electrical Resistivity of Conductive Asphalt Concrete (F516).
Specimen Resistance (Ω) Volume Resistivity (Ω. cm)
Control mix
1
516–10%
1 1.30E+12 2.42E+12
516–15%
1 1.62E+11 3.02E+11
516–20%
1 2.94E+03 5.48E+03
2 4.67E+03 8.89E+03
3 6.98E+03 1.30E+04
516–25%
1 9.08E+02 1.69E+03
2 9.25E+02 1.73E+03
3 7.37E+02 1.37E+03
516–30%
1 2.32E+02 4.33E+02
2 2.02E+02 3.76E+02
3 2.92E+02 5.44E+02
516–35%
1 1.51E+02 2.81E+02
2 1.76E+02 3.28E+02
3 1.76E+02 3.27E+02
516–40%
1 8.92E+01 1.66E+02
2 7.35E+01 1.37E+02
3 7.44E+01 1.39E+02
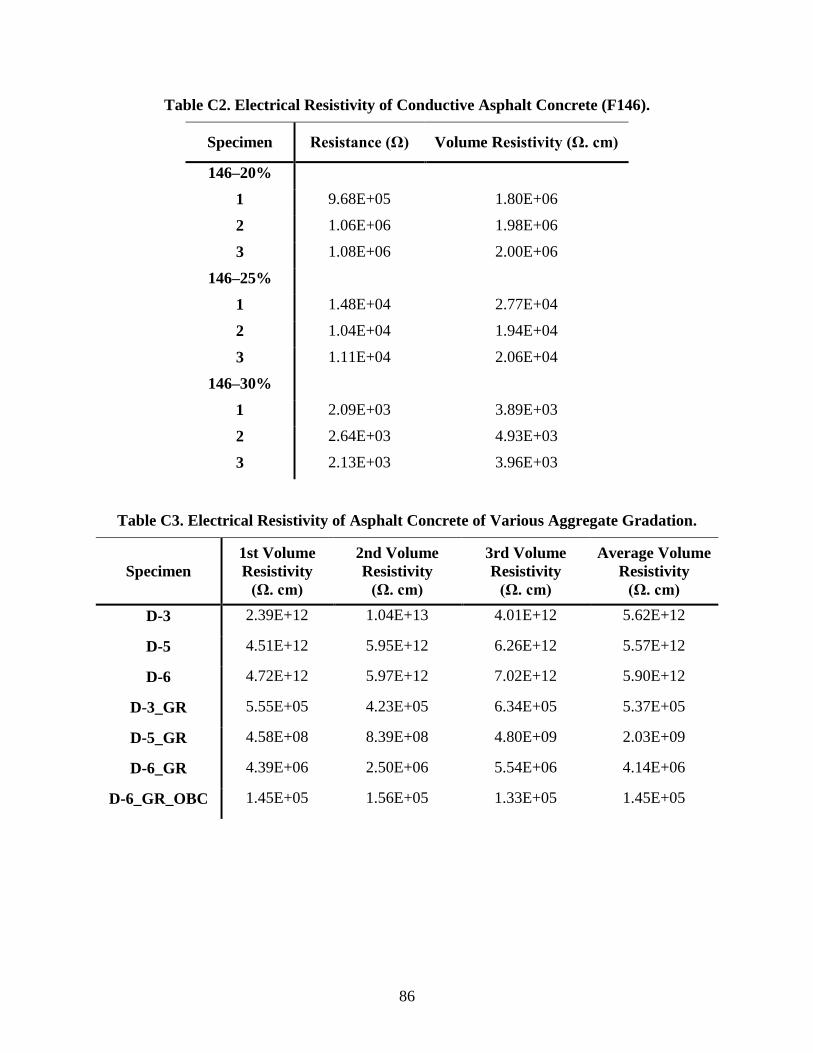
86
Table C2. Electrical Resistivity of Conductive Asphalt Concrete (F146).
Specimen Resistance (Ω) Volume Resistivity (Ω. cm)
146–20%
1 9.68E+05 1.80E+06
2 1.06E+06 1.98E+06
3 1.08E+06 2.00E+06
146–25%
1 1.48E+04 2.77E+04
2 1.04E+04 1.94E+04
3 1.11E+04 2.06E+04
146–30%
1 2.09E+03 3.89E+03
2 2.64E+03 4.93E+03
3 2.13E+03 3.96E+03
Table C3. Electrical Resistivity of Asphalt Concrete of Various Aggregate Gradation.
Specimen
1st Volume
Resistivity
(Ω. cm)
2nd Volume
Resistivity
(Ω. cm)
3rd Volume
Resistivity
(Ω. cm)
Average Volume
Resistivity
(Ω. cm)
D-3 2.39E+12 1.04E+13 4.01E+12 5.62E+12
D-5 4.51E+12 5.95E+12 6.26E+12 5.57E+12
D-6 4.72E+12 5.97E+12 7.02E+12 5.90E+12
D-3_GR 5.55E+05 4.23E+05 6.34E+05 5.37E+05
D-5_GR 4.58E+08 8.39E+08 4.80E+09 2.03E+09
D-6_GR 4.39E+06 2.50E+06 5.54E+06 4.14E+06
D-6_GR_OBC 1.45E+05 1.56E+05 1.33E+05 1.45E+05

87
D. Indirect Tensile Strength Test Results
Table D1. IDT Strength of Various Graphite Contents.
1 lbf = 4.448 N
ST =
where t = 95 mm and D = 150 mm.
Sample Load (lbf) Load P (N) ST (MPa)
Cement
5.64E+03 2.51E+04 1.12E+00
5.23E+03 2.32E+04 1.04E+00
6.10E+03 2.71E+04 1.21E+00
F146—20%
6.66E+03 2.96E+04 1.32E+00
6.72E+03 2.99E+04 1.34E+00
6.85E+03 3.05E+04 1.36E+00
F146—25%
7.85E+03 3.49E+04 1.56E+00
8.24E+03 3.66E+04 1.64E+00
7.91E+03 3.52E+04 1.57E+00
F146—30%
6.97E+03 3.10E+04 1.38E+00
7.82E+03 3.48E+04 1.56E+00
F516—20%
6.39E+03 2.84E+04 1.27E+00
7.18E+03 3.19E+04 1.43E+00
6.62E+03 2.94E+04 1.32E+00
F516—25%
7.71E+03 3.43E+04 1.53E+00
8.69E+03 3.86E+04 1.73E+00
7.36E+03 3.27E+04 1.46E+00
F516—30%
7.55E+03 3.36E+04 1.50E+00
7.54E+03 3.35E+04 1.50E+00
8.22E+03 3.66E+04 1.63E+00
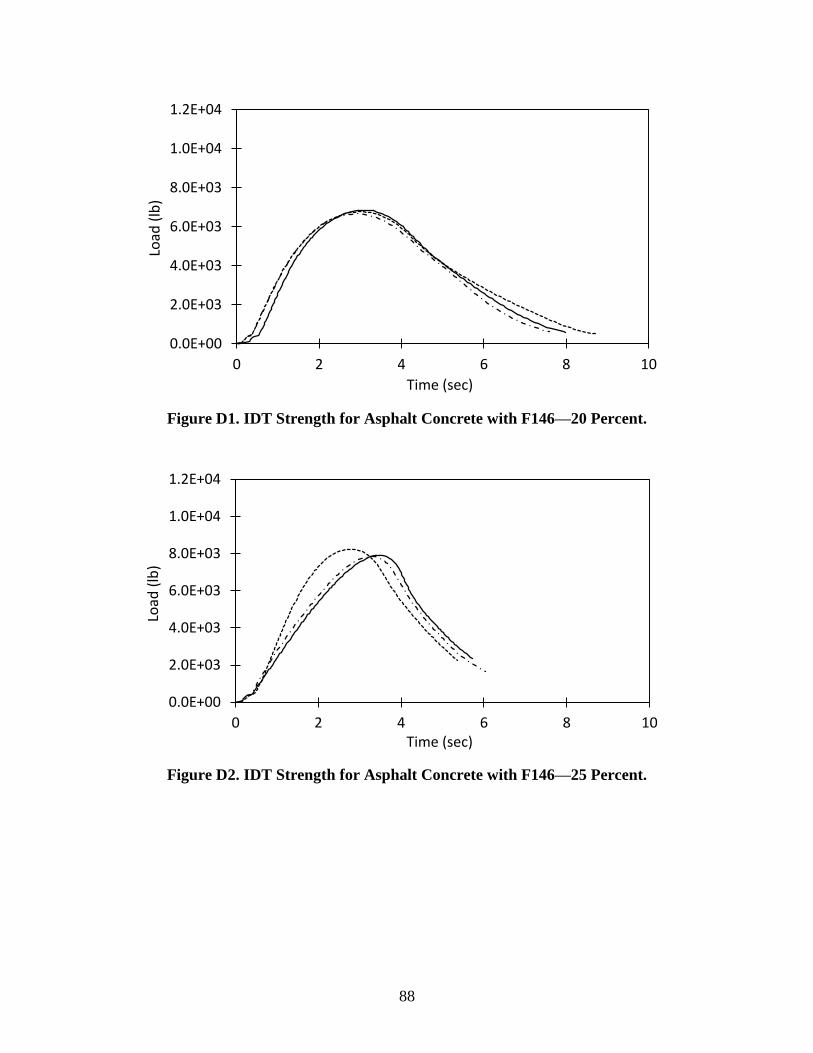
88
Figure D1. IDT Strength for Asphalt Concrete with F146—20 Percent.
Figure D2. IDT Strength for Asphalt Concrete with F146—25 Percent.
0.0E+00
2.0E+03
4.0E+03
6.0E+03
8.0E+03
1.0E+04
1.2E+04
0 2 4 6 8 10
Load
(lb
)
Time (sec)
0.0E+00
2.0E+03
4.0E+03
6.0E+03
8.0E+03
1.0E+04
1.2E+04
0 2 4 6 8 10
Load
(lb
)
Time (sec)

89
Figure D3. IDT Strength for Asphalt Concrete with F146—30%.
Figure D4. IDT Strength for Asphalt Concrete with F516—20%.
0.0E+00
2.0E+03
4.0E+03
6.0E+03
8.0E+03
1.0E+04
1.2E+04
0 2 4 6 8
Load
(lb
)
Time (sec)
0.0E+00
2.0E+03
4.0E+03
6.0E+03
8.0E+03
1.0E+04
1.2E+04
0 2 4 6 8 10
Load
(lb
)
Time (sec)
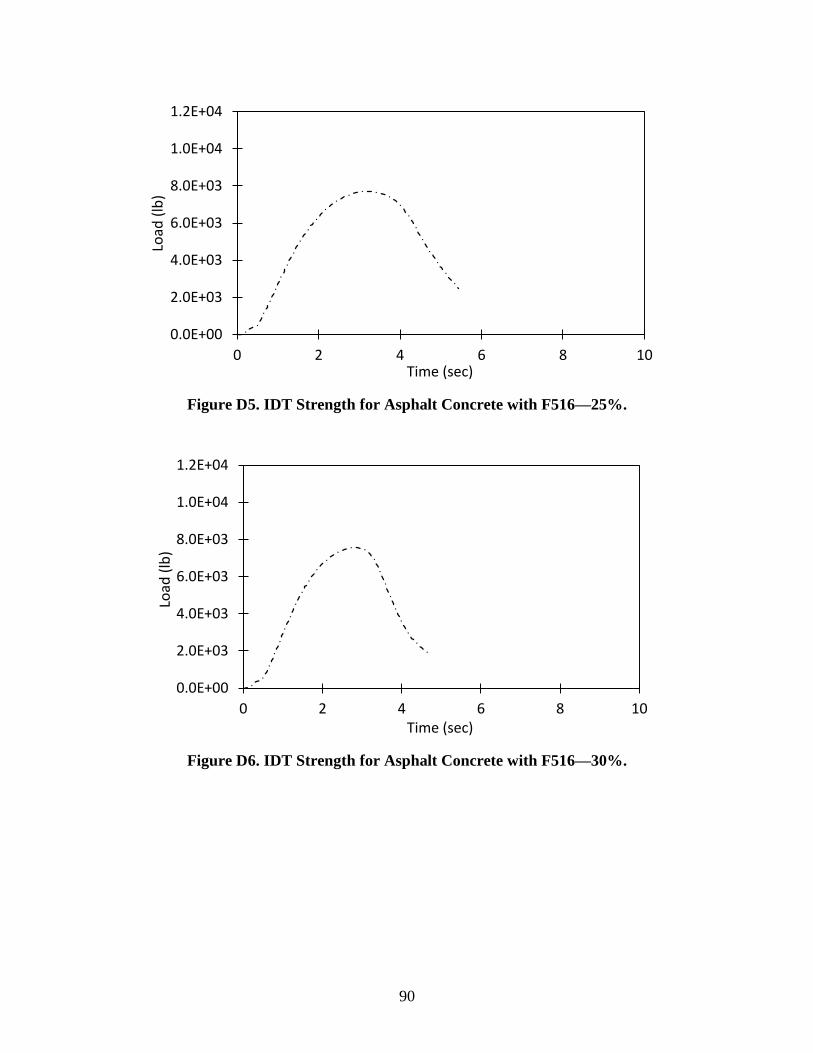
90
Figure D5. IDT Strength for Asphalt Concrete with F516—25%.
Figure D6. IDT Strength for Asphalt Concrete with F516—30%.
0.0E+00
2.0E+03
4.0E+03
6.0E+03
8.0E+03
1.0E+04
1.2E+04
0 2 4 6 8 10
Load
(lb
)
Time (sec)
0.0E+00
2.0E+03
4.0E+03
6.0E+03
8.0E+03
1.0E+04
1.2E+04
0 2 4 6 8 10
Load
(lb
)
Time (sec)
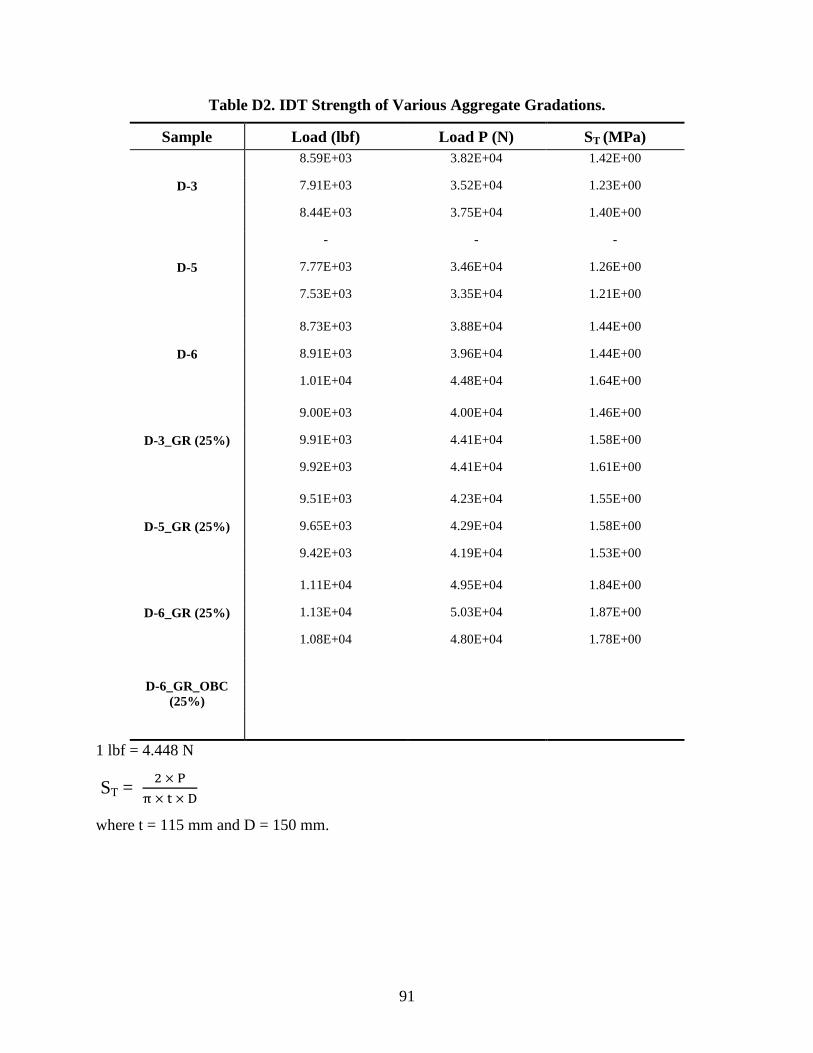
91
Table D2. IDT Strength of Various Aggregate Gradations.
Sample Load (lbf) Load P (N) ST (MPa)
D-3
8.59E+03 3.82E+04 1.42E+00
7.91E+03 3.52E+04 1.23E+00
8.44E+03 3.75E+04 1.40E+00
D-5
- - -
7.77E+03 3.46E+04 1.26E+00
7.53E+03 3.35E+04 1.21E+00
D-6
8.73E+03 3.88E+04 1.44E+00
8.91E+03 3.96E+04 1.44E+00
1.01E+04 4.48E+04 1.64E+00
D-3_GR (25%)
9.00E+03 4.00E+04 1.46E+00
9.91E+03 4.41E+04 1.58E+00
9.92E+03 4.41E+04 1.61E+00
D-5_GR (25%)
9.51E+03 4.23E+04 1.55E+00
9.65E+03 4.29E+04 1.58E+00
9.42E+03 4.19E+04 1.53E+00
D-6_GR (25%)
1.11E+04 4.95E+04 1.84E+00
1.13E+04 5.03E+04 1.87E+00
1.08E+04 4.80E+04 1.78E+00
D-6_GR_OBC
(25%)
1 lbf = 4.448 N
ST =
where t = 115 mm and D = 150 mm.
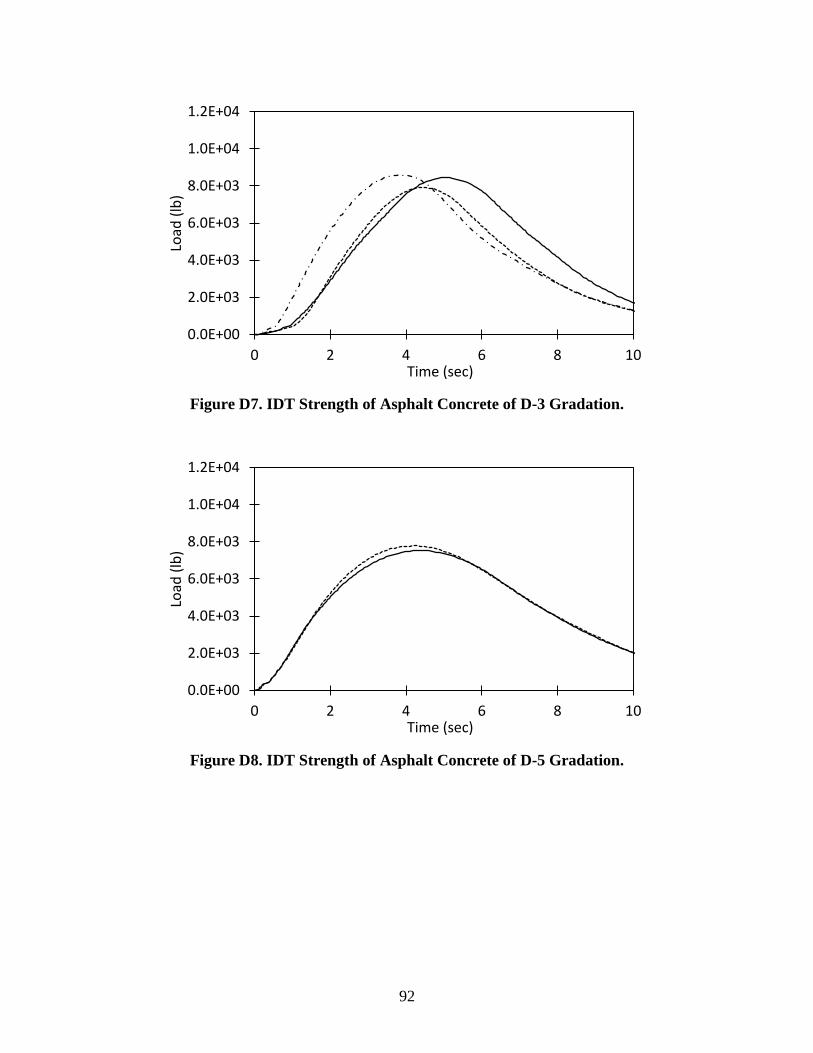
92
Figure D7. IDT Strength of Asphalt Concrete of D-3 Gradation.
Figure D8. IDT Strength of Asphalt Concrete of D-5 Gradation.
0.0E+00
2.0E+03
4.0E+03
6.0E+03
8.0E+03
1.0E+04
1.2E+04
0 2 4 6 8 10
Load
(lb
)
Time (sec)
0.0E+00
2.0E+03
4.0E+03
6.0E+03
8.0E+03
1.0E+04
1.2E+04
0 2 4 6 8 10
Load
(lb
)
Time (sec)
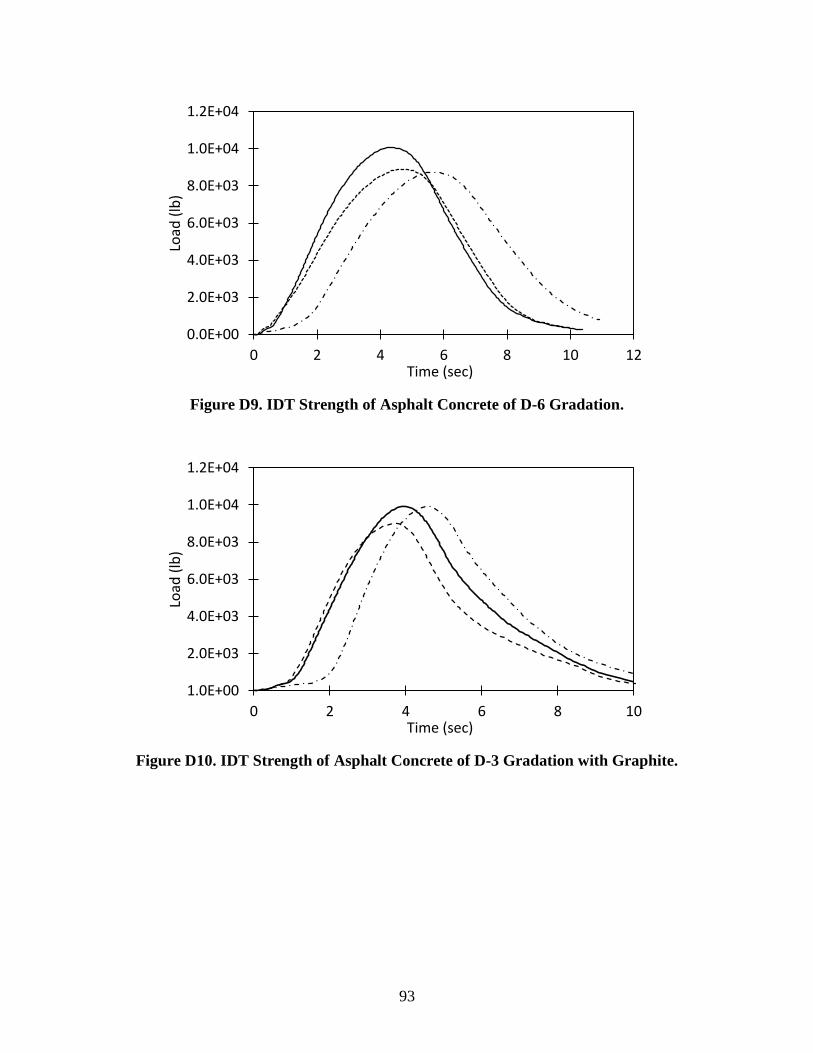
93
Figure D9. IDT Strength of Asphalt Concrete of D-6 Gradation.
Figure D10. IDT Strength of Asphalt Concrete of D-3 Gradation with Graphite.
0.0E+00
2.0E+03
4.0E+03
6.0E+03
8.0E+03
1.0E+04
1.2E+04
0 2 4 6 8 10 12
Load
(lb
)
Time (sec)
1.0E+00
2.0E+03
4.0E+03
6.0E+03
8.0E+03
1.0E+04
1.2E+04
0 2 4 6 8 10
Load
(lb
)
Time (sec)
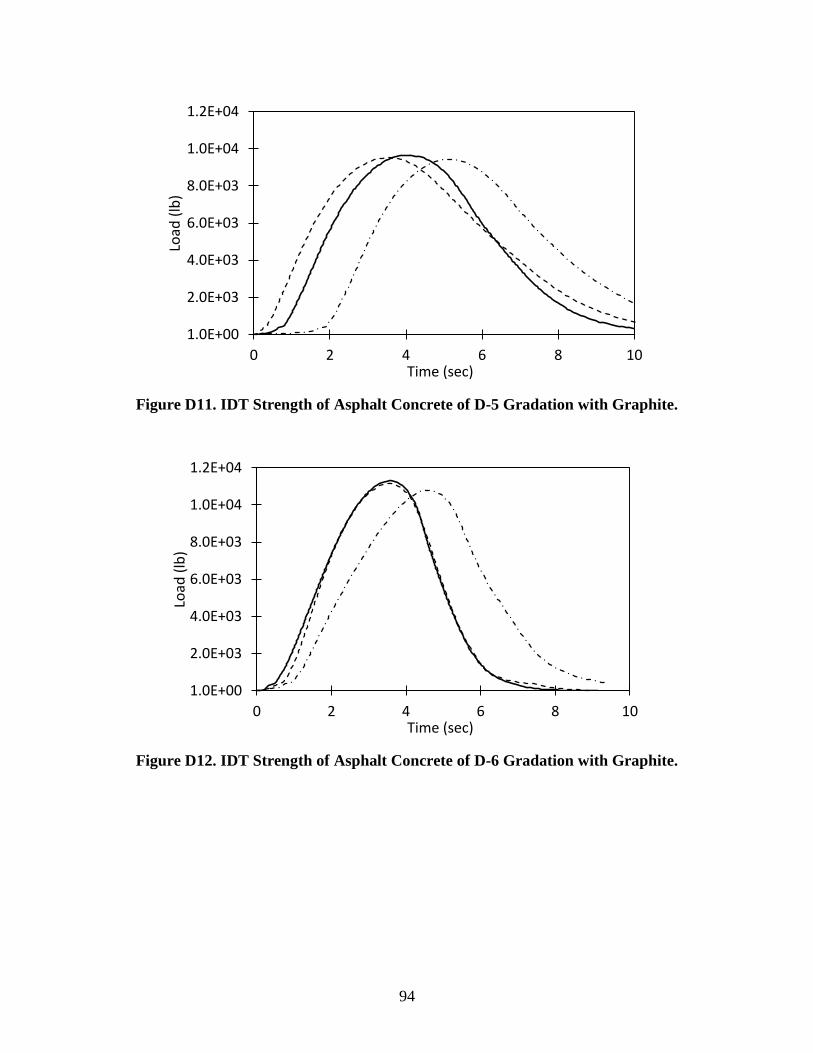
94
Figure D11. IDT Strength of Asphalt Concrete of D-5 Gradation with Graphite.
Figure D12. IDT Strength of Asphalt Concrete of D-6 Gradation with Graphite.
1.0E+00
2.0E+03
4.0E+03
6.0E+03
8.0E+03
1.0E+04
1.2E+04
0 2 4 6 8 10
Load
(lb
)
Time (sec)
1.0E+00
2.0E+03
4.0E+03
6.0E+03
8.0E+03
1.0E+04
1.2E+04
0 2 4 6 8 10
Load
(lb
)
Time (sec)