technical report: structure of the cooking banana …study was conducted based on five specific...
TRANSCRIPT

Technical report: Structure of the Cooking Banana Value
Chain in Uganda and Opportunities for Value Addition and Postharvest Losses Reduction
Nalunga, Asha1; Kikulwe, Enoch2; Nowakunda, Kephas1; Ajambo, Susan2; Naziri, Diego3
1 National Agricultural Research Laboratories, Kampala, Uganda 2 Bioversity International, Kampala, Uganda 3 International Potato Center (CIP), Kampala, Uganda
* Contact person: Enoch Kikulwe ([email protected])
Expanding Utilization of Roots, Tubers and Bananas and Reducing Their Postharvest Losses
December 2015
1
Expanding Utilization of Roots, Tubers and Bananas and Reducing Their Postharvest Losses (RTB-ENDURE) is a 3 year project (2014-2016) implemented by the CGIAR Research Program on Roots, Tubers and Bananas (RTB) with funding by the European Union and technical support of IFAD. http://www.rtb.cgiar.org/endure
The CGIAR Research Program on Roots, Tubers and Bananas (RTB) is a broad alliance led by the International Potato Center (CIP) jointly with Bioversity International, the International Center for Tropical Agriculture (CIAT), the International Institute for Tropical Agriculture (IITA), and CIRAD in collaboration with research and development partners. Our shared purpose is to tap the underutilized potential of root, tuber and banana crops for improving nutrition and food security, increasing incomes and fostering greater gender equity, especially among the world's poorest and most vulnerable populations.

0
Table of Contents List of Figures ........................................................................................................... 1
List of Tables ........................................................................................................... 2
List of Acronyms ........................................................................................................... 3
EXECUTIVE SUMMARY ...................................................................................................... 4
1. INTRODUCTION ......................................................................................................... 10
1.1. Objectives of the study ................................................................................................. 10
1.2. Methodology ......................................................................................................... 11
1.2.1. Study areas ............................................................................................................... 11
1.3.2. Sampling and data collection methods ...................................................................... 11
1.2.3. Data analysis ............................................................................................................ 12
2. RESULTS ......................................................................................................... 13
2.1. Production ......................................................................................................... 13
2.2. Consumption ......................................................................................................... 16
2.3. Value Chain Analysis ................................................................................................... 18
2.3.1. Value chain actors ..................................................................................................... 18
2.3.1.1. Input suppliers ........................................................................................................ 18
2.3.1.2. Producers ............................................................................................................... 20
2.3.1.3. Bicycle traders........................................................................................................ 21
2.3.1.4. Brokers .................................................................................................................. 23
2.3.1.5. Wholesaler / lorry traders ....................................................................................... 24
2.3.1.6. Retailers ................................................................................................................. 24
2.3.1.7. Exporters................................................................................................................ 24
2.3.1.8. Consumers ............................................................................................................. 25
2.4. Margins along the banana value chain ......................................................................... 25
2.5. Banana presentation forms along the value chain ........................................................ 27
2.6. Grading of bananas along the value chain ................................................................... 29
2.7. Weight based price system along the value chain........................................................ 30
2.8. Postharvest losses ....................................................................................................... 32
2.8.1. Postharvest losses at the farm level ...................................................................... 32
2.8.2. Postharvest losses at the broker level ................................................................... 33
2.8.3. Postharvest losses at the wholesale level ............................................................. 34
2.8.4. Postharvest losses at the retail level .................................................................... 34
2.8.5. Postharvest losses at the export level .................................................................. 35
2.8.6. Mitigation measures for postharvest losses ............................................................... 35
3. CONCLUSIONS ......................................................................................................... 36
REFERENCES ......................................................................................................... 37

1
List of Figures
Figure 1: A map showing the study sites................................................................................11
Figure 2: Varieties grown by male and female farmers in Isingiro and Rakai ..................... 144
Figure 3: Figure 3: Buyer-seller relationships………………………………………………….…16
Figure 4: Representation of the cooking banana value chain ........................................... .188
Figure 5: Bicycle traders’ searched attributes for bananas ................................................. .21
Figure 6: Bicycle traders’ challenges in buying and selling bananas ................................. 222
Figure 7: information received by bicycle traders .............................................................. 222
Figure 8: Challenges in buying bananas ........................................................................... 233
Figure 9: Rating of packaging materials used for peeled bananas ...................................... 28
Figure 10: Percentage of banana value chain actors practicing the different forms of grading29
Figure 11: Share of value chain actors using the kilogram system .................................... 300
Figure 12: Number of consumers buying or ever bought in kilograms per market ............. 311
2
List of Tables
Table 1: Number of retailers and consumers selected per market ..................................... 122
Table 2: Household land use and avareage acreage ........................................................ 133
Table 3: Average banana production and yield at farm level ............................................. 156
Table 4: Banana attributes considered by consumers at purchase ................................... 177
Table 5: Total volume handled by the nursery operator per variety ..................................... 19
Table 6: Average 6-month sales of banana plantlets ........................................................... 19
Table 7: Demographic characteristics of producers ........................................................... 200
Table 8: Marketing margins in low and high supply seasons ............................................. 255
Table 9: Margins at different nodes of the value chain.......................................................... 26
Table 10: Gender difference across the value chain ......................................................... 266
Table 11: Volumes of different presentations forms sold by different actors ..................... 277
Table 12: Availability of desired quantities for consumers ................................................. 288
Table 13: Perceptions about the weight based pricing system by VC actor and gender ...... 32
Table 14: Extent of postharvest losses at farm level ......................................................... 333
Table 15: Gender distribution of postharvest losses at farm level ...................................... 333
Table 16: Average postharvest losses at broker level ....................................................... 333
Table 17: Postharvest losses at wholesale level by season .............................................. 344
Table 18: Postharvest losses at retail level by season ...................................................... 344
Table 19: Gender distribution of postharvest losses at retail level ..................................... 355
3
List of Acronyms
MBADIFA Mbarara District Farmers’ Association
NAADS National Agricultural Advisory Services
PH Postharvest
SACCO Savings and Credit Co-operative
UGX Uganda Shillings
VC Value chain

4
EXECUTIVE SUMMARY
Cooking banana is the main staple crop in Uganda produced mostly by smallholders for food and
income. However, actors along the cooking banana value chain in Uganda face risks high
postharvest (PH) losses due to short green life of bananas and damage arising from poor
postharvest handling, leading to high physical and economic losses. To understand and quantify
the extent of the losses and other overarching issues along the value chain (VC), a detailed market
study was conducted based on five specific objectives, including: (1) identify and describe the key
players in the banana value chain; (2) establish the current demand and future growth prospects of
the different banana presentation forms; (3) establish the level of sorting and grading in the banana
value chain; (4) establish the level of use of the weight-based pricing system along the VC and the
actor’s willingness to pay for its introduction; and (5) determine the extent and causes of
postharvest losses along the banana value chain.
The study was conducted in south-western Uganda in the districts of Rakai and Isingiro between
July and September 2015. The two districts were selected because they are among the main
banana producing districts in Uganda. Isingiro is located about 310 km and Rakai about 208 km
south-west of Kampala, Uganda’s largest urban and capital city. One sub-county from each district
was purposively selected, that is, Dwaniro sub-county in Rakai and Rugaaga sub-county in Isingiro
district. 100 farmers (50 per sub-county) were randomly selected for the survey. Ten wholesalers
(lorry traders), seven bicycle traders, and ten brokers were selected for the study to get acquainted
with the roles played by various value chain actors. Similarly, eight markets (Kasubi, Kisaasi,
Bugolobi, Kalerwe, Kawempe, Kibuye, Nakawa and Kansanga) in Kampala and Wakiso districts
were also selected. In these markets a total of 40 retailers and 80 consumers were randomly
selected. Eight market masters (one per market) were also interviewed to obtain an overall picture
of the banana retail market. Lastly, five supermarkets and three exporters were also interviewed.
Different tools were used for data collection. A pretested structured questionnaire (for face-to-face
interviews) was administered to producers, traders, and consumers, while checklists were used to
gather information from key informants (including market masters, bicycle traders, brokers,
wholesalers, exporters, and supermarket representatives). Direct observations and literature
review were also used. Data were coded and entered in SPSS (version 17), while analysis was
done using STATA 13. Descriptive statistics such as means and percentages are presented in this
report.
Value chain analysis: The cooking banana value chain mainly comprises of producers, collectors
(brokers and bicycle traders), wholesalers, exporters, retailers and consumers. The chain involves
the movement of bananas from the producer to the lorry traders either directly by farmers or
through brokers and bicycle traders. Lorry traders transport and distribute the bananas to the
retailers who then sell to the final consumers. Some bananas move from producers directly to the
5
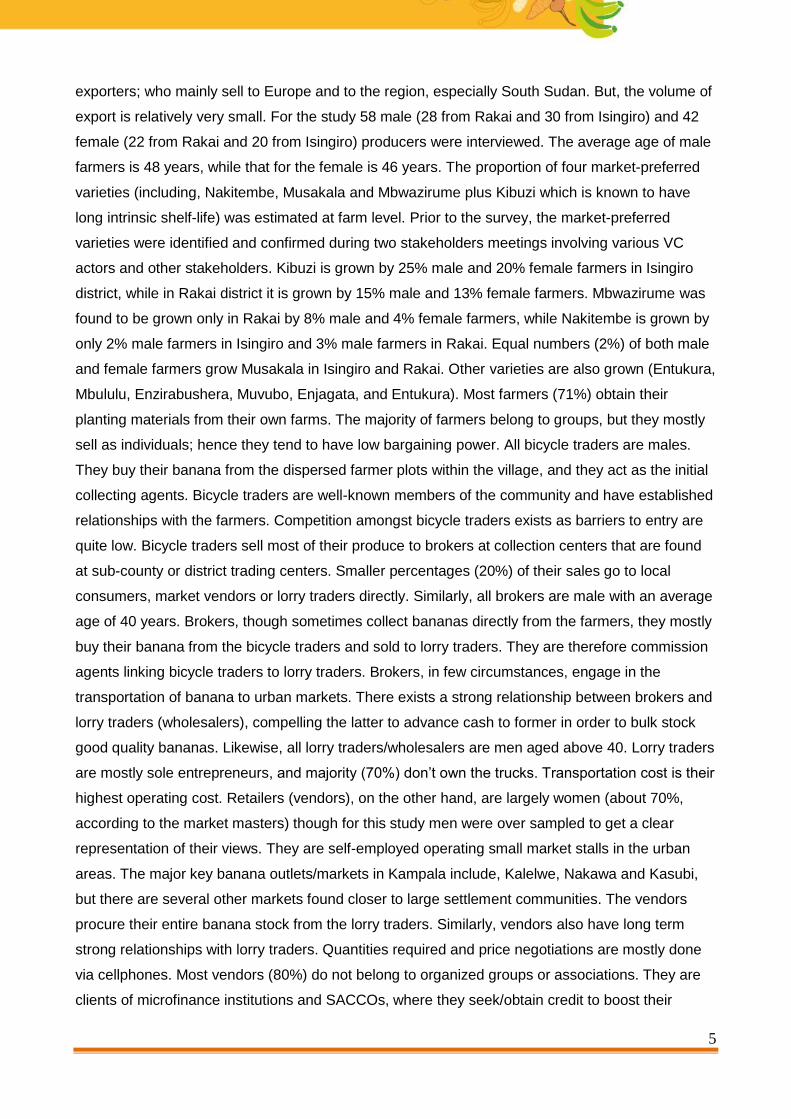
exporters; who mainly sell to Europe and to the region, especially South Sudan. But, the volume of
export is relatively very small. For the study 58 male (28 from Rakai and 30 from Isingiro) and 42
female (22 from Rakai and 20 from Isingiro) producers were interviewed. The average age of male
farmers is 48 years, while that for the female is 46 years. The proportion of four market-preferred
varieties (including, Nakitembe, Musakala and Mbwazirume plus Kibuzi which is known to have
long intrinsic shelf-life) was estimated at farm level. Prior to the survey, the market-preferred
varieties were identified and confirmed during two stakeholders meetings involving various VC
actors and other stakeholders. Kibuzi is grown by 25% male and 20% female farmers in Isingiro
district, while in Rakai district it is grown by 15% male and 13% female farmers. Mbwazirume was
found to be grown only in Rakai by 8% male and 4% female farmers, while Nakitembe is grown by
only 2% male farmers in Isingiro and 3% male farmers in Rakai. Equal numbers (2%) of both male
and female farmers grow Musakala in Isingiro and Rakai. Other varieties are also grown (Entukura,
Mbululu, Enzirabushera, Muvubo, Enjagata, and Entukura). Most farmers (71%) obtain their
planting materials from their own farms. The majority of farmers belong to groups, but they mostly
sell as individuals; hence they tend to have low bargaining power. All bicycle traders are males.
They buy their banana from the dispersed farmer plots within the village, and they act as the initial
collecting agents. Bicycle traders are well-known members of the community and have established
relationships with the farmers. Competition amongst bicycle traders exists as barriers to entry are
quite low. Bicycle traders sell most of their produce to brokers at collection centers that are found
at sub-county or district trading centers. Smaller percentages (20%) of their sales go to local
consumers, market vendors or lorry traders directly. Similarly, all brokers are male with an average
age of 40 years. Brokers, though sometimes collect bananas directly from the farmers, they mostly
buy their banana from the bicycle traders and sold to lorry traders. They are therefore commission
agents linking bicycle traders to lorry traders. Brokers, in few circumstances, engage in the
transportation of banana to urban markets. There exists a strong relationship between brokers and
lorry traders (wholesalers), compelling the latter to advance cash to former in order to bulk stock
good quality bananas. Likewise, all lorry traders/wholesalers are men aged above 40. Lorry traders
are mostly sole entrepreneurs, and majority (70%) don’t own the trucks. Transportation cost is their
highest operating cost. Retailers (vendors), on the other hand, are largely women (about 70%,
according to the market masters) though for this study men were over sampled to get a clear
representation of their views. They are self-employed operating small market stalls in the urban
areas. The major key banana outlets/markets in Kampala include, Kalelwe, Nakawa and Kasubi,
but there are several other markets found closer to large settlement communities. The vendors
procure their entire banana stock from the lorry traders. Similarly, vendors also have long term
strong relationships with lorry traders. Quantities required and price negotiations are mostly done
via cellphones. Most vendors (80%) do not belong to organized groups or associations. They are
clients of microfinance institutions and SACCOs, where they seek/obtain credit to boost their
6
working capital. Their main clients are household consumers, hotels, restaurants and schools.
Market vendors incur few costs, including rent for stalls, own transport, meals and labor costs. The
market margins along the value chain vary significantly with large differences between the farm
gate price and the retail price. In the low production seasons, the total market margin for a small
bunch (10-15Kg) is estimated at UGX 13,500 and UGX 16,500 for a large bunch (above 25Kg),
while in the high production season it is estimated at an average of UGX 9,900 for a small and
UGX 15,850 for a large bunch.1 The node of the value chain with the highest market margin is the
wholesale level, yet all actors at this level are men.
Presentation forms across the value chain: All producers, all brokers and 90% of wholesalers
sell their banana in form of bunches and/or sacks of unpeeled fingers. On average, each producer
sells approximately 400 bunches and 23 sacks of unpeeled fingers per month during surplus
(June-August and December-February), while in scarcity season (September-November and
March-May) each sells approximately 280 bunches and 14 sacks per month. Each broker sells an
average of 1,900 bunches and 1,128 sacks, while wholesalers sell 1,292 bunches and 148 sacks
per month. A bicycle trader (deals only in bunches) sell an average of 80 bunches per month in the
high production season and 60 bunches in the low production season. Exporters sell in form of
bunches (for regional market) and/or clusters (for European Market) while supermarkets sell in
clusters. However, at retail level different presentations are sold, though all retailers reported that
bunches are the most preferred form by consumers. On average, they sell between 122 and 210
bunches (low and high respectively) per month. The second most preferred type of presentation by
consumers is unpeeled fingers as reported by 62.5% of the retailers; they sell from 714 to 760
small heaps (about 8-12 fingers) per month. On average a retailer sells 10 bags of unpeeled
fingers, 520 clusters, and 530 (small) packs of peeled fingers per month. The proportion of total
banana sales sold at retailer level in different presentation forms is approximately 47% bunches,
17% bags of unpeeled bananas, 11% clusters, 15% heaps of unpeeled banana and 10% peeled
bananas. The preference for the different presentation types at different nodes of the value chain is
attributed to the ease of handling and high demand for a particularly presentation form, in
particular, 32% of the retailers reported that there is an increased demand for peeled bananas .
Sorting and grading of bananas across the value chain: VC actors practice some sort of
grading. For instance, results show that all VC actors grade their banana bunches by size.
However, with exception of exporters, all other VC actors do not grade their banana by varieties
and/or quality. VC actors have varying perceptions in relation to quality and variety grading.
Results show that 78% of the producers agree that sorting and grading by variety and quality is a
good practice and would increase revenues from banana sales, and close to three quarters of such
1 Exchange rate 1 US$=3,150 UGX at the time of the survey.

7
farmers (73%) believe that such practice would not require many (or any) additional skills since it
can be done easily at farm level. However, the majority of farmers (80%) acknowledged that
sorting and grading requires more time. Most farmers (80%) and bicycle traders (57%) are willing
to accept and pay a premium for good quality and sorted bananas, respectively. 80% of retailers
and 60% of wholesalers are also willing to accept and pay a premium for good quality and sorted
bananas. Approximately 90% of the consumers are willing to purchase good quality and sorted
bananas at a premium if availed on the market. About 55% of consumers are not satisfied with the
quality of bunches sold in the market and 58% are not satisfied with the quality of peeled bananas
sold in some open markets.
The weight based pricing system: Unit prices are determined by visual inspection, as reported
by all producers, brokers, bicycle traders and wholesalers, which is subjective and arbitrary and
therefore presents risks for unfair marketing transactions. All exporters to Europe buy and sell
banana in kilograms, yet their suppliers negotiate (through brokers) the bunch price using visual
inspection at farm level and sell to exporters in kilograms. Only one of the five supermarkets visited
had once sold bananas using the kilogram system, while only five female (12.5%) and three male
retail traders (7.5%) in open markets sell (or have ever sold) their bananas by weight. However,
the study shows that 98% of the producers, 40% retailers, 75% supermarkets and 50% consumers
are willing to embrace the weight-based pricing system. Similarly, 40% of the interviewed
consumers believe that other consumers (who were not interviewed) will purchase cooking
bananas sold in kilograms. Most consumers (57%) would prefer to purchase unpeeled fingers
using the weight-based pricing system. The most preferred pack of weighted unpeeled banana
would be a 5kg pack, with 55% of the consumers stating that they are likely to purchase weighed
bananas in such quantities (5kg). Most producers are willing to accept an average price of about
UGX 750 per kilogram of banana, while bicycle traders are willing to pay an average of UGX 413
per kilogram of banana bought. Super market traders are willing to buy a kilogram at UGX 1,000
and would sell it at UGX 3,200. A big proportion of consumers (45%) are willing to pay between
UGX 1,000 and UGX 2,000 per kilogram. Value chain actors ─ most producers and wholesalers,
and all bicycle traders believe that the introduction of a weight-based pricing system along the
value chain would improve efficiency and lead to fairer pricing in the banana business. These
actors as well as half of the brokers also believe that sales by weight would improve trust among
the banana VC actors. However, retailers and consumers appear less optimistic at this regard and
are mainly afraid that traders would mostly use fake weighing scales, not properly calibrated as
required by UNBS. Moreover, some actors believe that the weight-based pricing system will come
with added costs in terms of labor for weighing as reported by most producers, bicycle traders and
retailers. Results show some gender differences in perceptions. Male producers and retailers are
more positive about the weight-based pricing system in terms of efficiency, fair pricing and trust
8
compared to their female counter parts. However, female producers and retailers are more prone
to think that the weight based pricing system will not add any extra cost.
The postharvest losses across the value chain: Actors along the cooking banana VC face risks
of high postharvest (PH) losses due to short green life of bananas and damage arising from poor
postharvest handling. During low production (scarcity), on-farm postharvest losses affect about
3.3% (in form of physical losses) and 5.4% (in form of economic losses) of bananas, while during
high production PH losses increases to 9.6% (physical losses) and 8.1% (economic losses). On-
farm economic PH losses translate into an average residual value of about UGX 7,500 during
scarcity (e.g., a bunch that would have been sold at UGX 10,000 is sold at about UGX 7,500 due
to quality deterioration) and UGX 2,400 during surplus per damaged bunch. The major causes of
PH losses at farm level during scarcity are thefts (for physical losses) and sell of immature
bananas (for economic losses), while ripening is the main cause of both physical and economic
losses during surplus season. Though physical losses are not significantly different across gender,
economic losses do differ. Female farmers exhibit more economic losses with approximately 8.3%
of bananas affected by some degree of quality deterioration leading to lower prices compared to
5.6% of their male counterparts. Furthermore, this quality deterioration translates into higher price
discounts for female than male farmers, with residual values of approximately UGX 4,700
compared to UGX 5,100 per bunch, respectively. PH losses in Isingiro are more than 50% higher
than those in Rakai district. At retail level (for open market vendors) physical losses ranges from
approximately 6.2%-9.8% (scarcity-surplus) and economic losses from approximately 6.5% to 12%
selling at an average residual value of UGX 12,000 to 7,500 per bunch, respectively. The major
causes of PH losses at retail level are thefts, bruising, finger-plucking and ripening. Losses due to
ripening are mostly associated with production gluts, which are partly due to seasonal scheduling
of follower sucker selection. Results also show that other chain actors experience PH losses as
well. For brokers physical losses range from 2 to 4% while economic losses affect 2 to 5% of
bananas. Bruising is the lead cause of physical losses while ripening causes the greatest
economic losses in the scarce season. In the surplus season, ripening, bruising and scotching
(browning of the fingers when exposed to the sun for long hours) stand out as the major causes.
For wholesalers, physical losses range from 7 to 9% while economic ones range from 3 to 8%.
Bruising and thefts are the lead causes of both the physical and economic losses in scarcity times,
while ripening and bruising cause tremendous losses in the surplus season. The forms in which
bananas are handled and transported lead to these high PH losses. Bananas are transported to
the markets mainly as bunches on bicycles or stacked on trucks and unprotected. They are also
transported as fingers tightly packed in poorly aerated polythene bags that build up heat around
the bananas in transit. For the exporters, physical losses range from 2 to 3%, while economic
losses are about 4 to 6%. Ripening is the major cause of physical losses in both scarcity and
surplus seasons while bruising causes most of the economic losses during both seasons. The
9
losses at export level are minimized by transporting banana clusters with great care and protected
in cardboard boxes.
Conclusion: Banana varieties Kibuzi, Nakitembe Mbwazirume and Musakala are only accessed
by few farmers yet these are the most preferred varieties in the market. Farmers are willing to
purchase clean planting materials of these varieties from the nurseries if availed. This presents a
business opportunity to farmers who are willing to establish nurseries. Banana presentation forms
of clusters and peeled fingers are missing at lower levels of the value chain. There is an increasing
demand for peeled bananas at retail level therefore retailers could demand for peeled bananas
right from the farm. Farmers are willing to provide peeled bananas as they would wish to use the
banana peelings as manure for their gardens. Banana value chain actors are very positive and
willing to embrace the weight based pricing system. This is expected to improve efficiency and
fairness in the banana pricing system as well as improve transparency between buyers and sellers.
The total postharvest losses across the value chain are high and thus require various interventions
to reduce them tremendously. All these innovations are expected to improve margins along the
value chain and thus reduce the difference between farm gate and retail prices.

10
1. INTRODUCTION
Cooking bananas are an important starchy food and cash crop in Uganda. About 24% of all
agricultural households are engaged in banana production (Kalyebara et al. 2005). Communities
from central, eastern, western and south-western Uganda have mostly relied on bananas for over
150 years. Compared to other important crops in the country, banana occupies the biggest
proportion of utilized agricultural land - about 1.4 million hectares or 38% of the total utilized land
(Wanda, 2009). The Uganda national banana production was estimated to be four million MT (from
a total area of 807,000 Ha) in 2009 as compared with other staple crops such as cassava (2.9
million MT) and sweet potato (1.8 million MT) (UBOS, 2010). Production is mainly by smallholder
farmers owning an average of < 0.5 ha, with medium-sized farms gaining prominence in southern
Uganda (Ouma and Jagwe, 2010). Isingiro, Mbarara and Bushenyi districts in southwestern
Uganda were ranked as the major banana producing districts in terms of production (UBOS, 2010).
This region produces 68% of the cooking bananas in Uganda, with Isingiro district being the main
producer (UBOS, 2010) providing a daily average of 37,000 bunches of marketed bananas in
Uganda (The New Vision, August 2014).
Bananas are a major staple food for more than a half of the Ugandan population, with per capita
consumption of 172Kg/person/year (Haggblade and Dewina, 2010) , making Uganda the largest
consumer of cooking banana in the world (Kabahenda and Kapirir, 2010). Banana is the single
most important source of calories among Ugandans accounting for 17% of total daily per capita
caloric food intake (Fiedler et al., 2013). Smallholder producers mostly sell their bananas to other
agents at farm gate who finally deliver to the urban markets. Moreover, smallholder producers get
the least share of the profits in the banana value chain due to a large number of middle men (about
5 to 7 according to Ngambeki et al., 2010). According to the New Vision newspaper (August,
2014), for a 40kg bunch sold at UGX 25,000 in Kampala, its farm gate price is UGX 4,000, yet the
transport costs for the same bunch is just UGX 2,000. About 90% of the bananas produced are
consumed within the domestic market and the rest exported as fresh or processed banana
products (Smale and Tushemereirwe, 2007).
However, actors along the cooking banana value chain in Uganda face risks of high postharvest
(PH) losses due to short green life of bananas and damage arising from poor postharvest handling,
leading to high physical and economic losses. To understand and quantify the extent of the losses
and other overarching issues along the value chain, a detailed market study was conducted.
1.1. Objectives of the study
The objectives of the study were:
1. To identify and describe the key players in the banana value chain
2. To establish the current demand and future growth prospects of the different banana
presentation forms

11
3. To establish the level of sorting and grading in the banana value chain
4. To establish the level of use of the weight based pricing system along the VC and the
actor’s willingness to pay for its introduction
5. To determine the extent and causes of postharvest losses along the banana value chain
1.2. Methodology
1.2.1. Study areas
The study was conducted in southwestern Uganda in the districts of Rakai and Isingiro for farm
level analysis. Two districts were selected because they are cited among the highest banana
producing districts in Uganda (UBOS, 2010). Isingiro district is located about 310 Km west of
Kampala while Rakai is located about 208Km south west of Kampala, Uganda’s largest urban and
capital city. Similarly, the study was also conducted in different markets across the greater
Kampala region for VC market analysis as showing in figure 1. This study was conducted between
July and September 2015.
Figure 1: A map showing the study sites
1.3.2. Sampling and data collection methods
One sub-county from each district was purposively selected: Dwaniro sub-county from Rakai and
Rugaaga sub-county from Isingiro district. A total of 100 farmers, 50 per district, were randomly
selected. Similarly, in the same districts, ten wholesalers (lorry traders), seven bicycle traders and
ten brokers were also randomly selected. Data regarding retailers and consumers were obtained
from the major banana markets in the greater Kampala region as indicated in table 1. A total of 40
retailers (market vendors) and 80 consumers were randomly selected. Eight banana market

12
masters (one per market) were also interviewed to obtain an overall picture of the banana market.
Lastly, five super markets and three banana (and fruit) exporters were also included in the study.
Table 1: Number of retailers and consumers selected per market
Name of market Number of retailers Number of consumers
Kasubi 6 14
Bugolobi 5 14
Kalerwe 8 4
Kansanga 4 9
Kibuye 3 9
Kawempe 1 7
Nakawa 7 15
Kisaasi 5 8
Total 40 80
Data were collected using different tools: a pretested structured questionnaire (for face-to-face
interviews) was administered to producers, traders, and consumers, while checklists were used to
gather information from key informants (including market masters, bicycle traders, brokers,
wholesalers, exporters, and supermarket representatives). Direct observations and literature
review were also used.
1.2.3. Data analysis
Data were coded and entered in SPSS version 17 while analysis was done using STATA 13.
Descriptive statistics such as means, standard deviations and percentages were used to obtain the
baseline values regarding banana varieties grown, banana presentation forms, grading, use of the
weight based pricing system, and extent of postharvest losses across the banana value chain.
Descriptive statistics were also used to determine the gender distribution of males and females
across the value chain. Results were presented in tables and figures.

13
2. RESULTS
2.1. Production
The majority of farmers (93%) are members of at least one famers group in the village. Each group
has an average of 31 members, with 16 females and 15 males. There are four main joint activities
carried out in the different groups, including, savings and credit management, collective marketing,
pooling of labor and bulk procurement of inputs. The major group activity is savings and credit
management as reported by 72% of the respondents. Through groups, farmers are able to easily
access credit even without any collateral. The second major activity is collective marketing (25%).
Though farmers agreed that collective marketing improves bargaining power and access to bulky
markets, it was practiced by only 2% of farmers. Pooling of labor was practiced by 2%, while bulk
procurement of inputs was practiced by 1% only. Farmers reported that if structured in groups they
can easily organize and mobilize for trainings being much easier and cheaper to invite an
extension worker in a group than on individual basis. Majority of the banana growing farmers in the
study area are semi commercial (93%); i.e., they produce for both food and the market. Only 6%
are exclusively subsistence farmers, while the least (1%) are commercial farmers. On average, the
total land owned per household is 10.1 acres, of which more than a half (6.0 acres of land) is
dedicated to crop production. An average of 5.4 acres of land is dedicated to banana production
(table 2).
Table 2: Household land use and avareage acreage
Land acreage and use All Rakai Isingiro
Total acreage 10.1(16.5) 8.0(14.2) 14.9(18.0)
Land under livestock 4.1(10.4) 0.9(1.3) 7.3(13.8)
Land under crops
(banana inclusive)
6.0(5.4) 4.4(2.8) 7.6(8.3)
Land under banana 5.4(6.4) 3.2(2.5) 7.4(6.7)
Note: values in parentheses are standard deviations
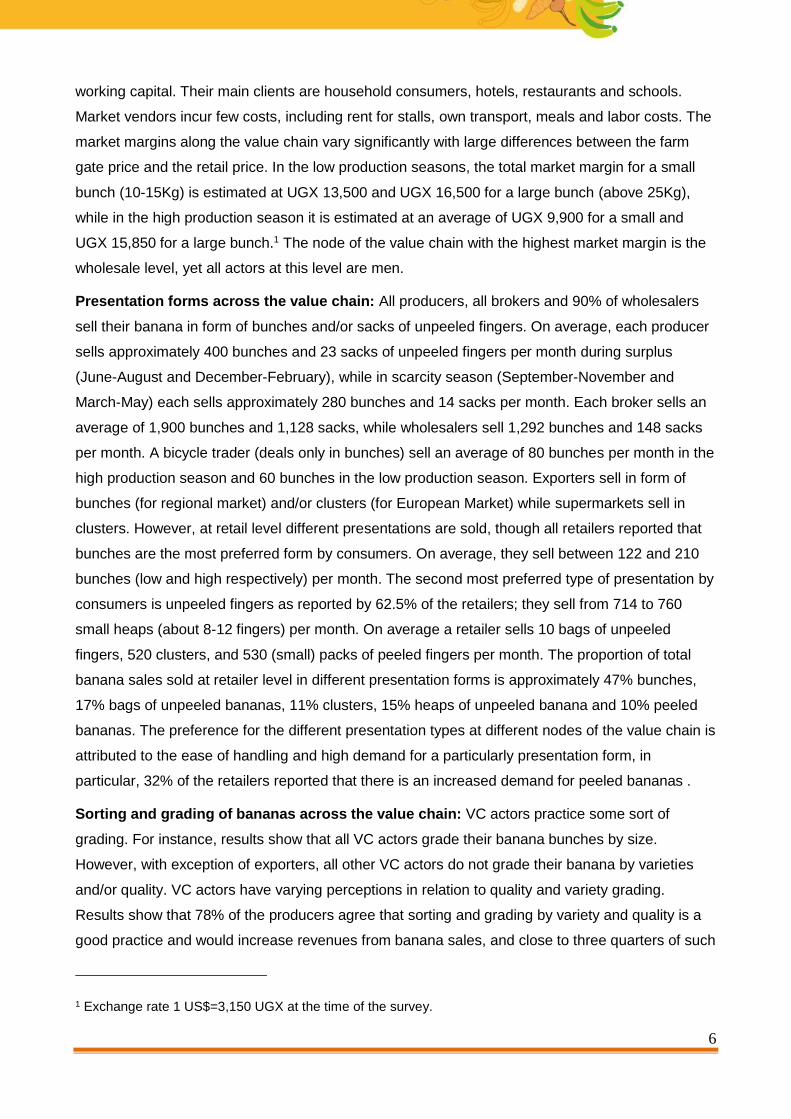
Generally, the four most commonly grown varieties are Kibuzi, Mbwazirume, Musakala and
Nakitembe. Other varieties grown include: Entukura, Mbululu, Enzirabushera, Muvubo, Enjagata,
and Entukura. Kibuzi is most popular in Rakai and Mbwazirume is very popular in Isingiro. Male
farmers grow more Kibuzi than their female counterparts in both districts, i.e., 25% of males as
14
compared to 18% of females in Rakai and 14% of males versus 12% of females in Isingiro district
(figure 2).
Figure 2: Varieties grown by male and female farmers in Isingiro and Rakai
The Pearson chi square test shows that there is a strong association between the main banana
farming objective and the type of variety that is mostly cultivated. Moreover this test is highly
significant (pr=0.000). Results show that 63 out of 93 semi-commercial farmers would like to grow
Kibuzi as their number one priority because this variety is more preferred in the market compared
to other varieties. Kibuzi is preferred for its large finger size and longer shelf life (Spilsbury et al.,
2004). However, farmers have a challenge in accessing clean planting materials. About 55%
farmers report that it is not easy for them to access clean planting materials when they want to
expand their banana plantations. 14% of the farmers are not sure whether the planting materials
they use are clean, while 30% are able to reliably access clean planting materials. Results further
show that 95% of the farmers do not get their planting materials from nurseries. The main source
of planting materials is the farmer’s own farm (as reported by 71%). 3% of the farmers obtain their
planting material from neighbors, while those who obtain planting materials from both neighbors
and their own farms are 26%. If obtained from a neighbor’s plantation, each farmer will incur an
average cost of UGX 500 per sucker. If nurseries were established in their respective localities,
86% of the farmers would be willing to purchase the clean planting materials at a cost of UGX 900
per sucker. Generally, farmers anticipate a high demand for clean planting materials if grown in
nurseries near their homesteads. Other purchased inputs include manure and mulching materials.
On average, farmers spend UGX 1.5 million on manure per annum, while mulching materials
purchases contribute approximately UGX 645,000.

15
Labor, including family and hired, is another input greatly required on banana farms. Both men and
women participate in the day to day management of banana plots, with men participating more
than women. Male family labor is mostly used in land preparation, while female labor is mainly
used in weeding. Male household members generally work for more hours compared to the
female. This can be explained by the fact that women have other roles (reproductive roles and
household chores) to fulfill other than the productive roles. Similarly, more men are employed as
laborers (hired labor) than their women counterparts. Hired labor is mostly used for land
preparation, planting, weeding and manure spreading. On average, UGX 380,000 is spent on hired
labor per annum.
The average annual banana production per farmers is about 660 bunches in Rakai and 2,050
bunches in Isingiro (table 3). The difference is primarily due to larger acreage allocated to banana
production in the latter. The average annual yield is about 220 bunches per acre in Rakai
compared to 260 bunches per acre in Isingiro. Approximately 78 bunches are produced per month
in Rakai during surplus seasons (June-August and December-February) compared to 220 bunches
produced per month in Isingiro, while approximately 40 bunches are produced per month in Rakai
and 136 bunches are produced per month in Isingiro during scarcity seasons (March-May and
September-November). Generally, most farmers (77%) experienced an increase in their banana
production over the last one year.
Table 3: Average banana production and yield at farm level
High production season
(bunches per month)
Low production season
(bunches per month)
Annual production
(bunches)
Production Yield/acre Production Yield/acre Production Yield/acre
Rakai 78 26 39 13 663 221
Isingiro 220 28 136 17 2052 257
In relation to attributes considered at the point of purchase at farm level, most buyers (55%)
primarily pay attention to the size of the bunch and fingers while only 20% pay more attention to
quality of the cooking banana. Producers mostly talk about prices (58%) when they meet their
buyers, followed by quality of the banana (41%). Other issues discussed include, availability of
bananas and the working relations. In addition, some buyers (13%) demand for varieties that are
not currently grown by the producers.
When asked about the most crucial issues affecting the banana market, most producers reported
taxes (71.7%), followed by lack of access to market information (66.7%). In particular, most women

16
producers (65%) do not have timely access to the prevailing market prices due to their immobility
and thus they sell at lower prices than what could be fetched. 55% of the producers who sell to
exporters reported that the export market has stringent regulations and standards and sometimes
their bananas are rejected due to their poor quality. Similarly, another challenge reported by many
producers (80%) is the lower prices caused by the production gluts (during the high supply
seasons). Other challenges included lack of access to financial service (54%), lack of access to
extension services (70%) and pest and disease outbreaks (30%).
2.2. Consumption
In general, women participates more in purchasing cooking bananas for consumption. In our
sample across the market 72% of the respondents who buy cooking banana for consumption were
women compared to 28% men. At farm level most (65%) of the banana produced is consumed and
an average of about 30% is taken to the market. 60% of the banana sold in the open markets in
the urban centers goes to individual households consumers, while the rest goes to other customers
such as hotels and restaurants.
Results indicate that consumers have developed strong relationships with their respective sellers
over time. For instance, figure 3 shows that about 36% of the consumers are loyal to their sellers.
The main reasons given for their commitment include: fair price, good quality bananas (in terms of
color and finger size), ability to purchase on credit and good customer care. Nevertheless, a good
number of consumers purchase from more than one seller. This is mainly to cater for the seasonal
supply of bananas in the market. Consumers feel that they can obtain bananas from other sellers
even in the low supply seasons.
Figure 3: Buyer-seller relationships
17
There is information sharing regarding cooking bananas through the established buyer-seller
relationships. For instance, approximately 71% of the consumers reported that they mainly inquire
about prices when they talk to their respective sellers, 36% talk more about the quality while only
1% pays more attention to availability of specific varieties. Similarly, some consumers often inform
sellers of the type of bananas they need in case they do not find them on the market. The most
common means of communication is through face to face interaction (75 %), while 16% of
consumers reports use of telephones and 9% communicates to their sellers through other people.
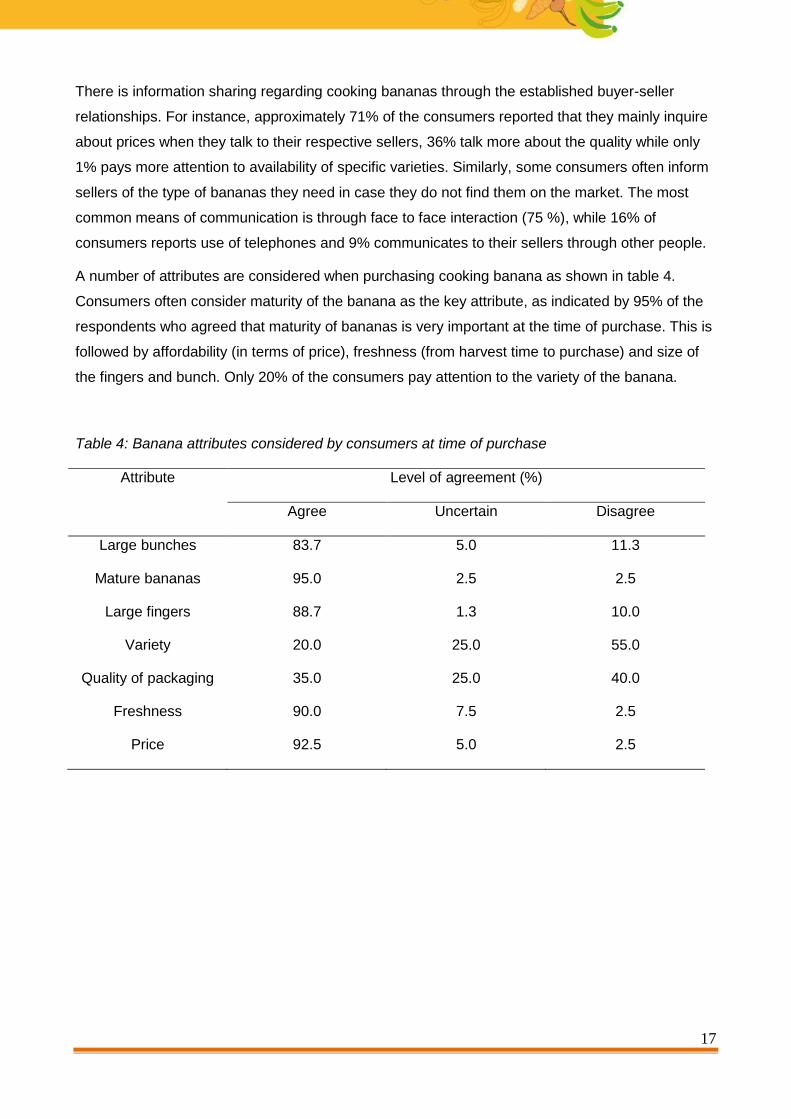
A number of attributes are considered when purchasing cooking banana as shown in table 4.
Consumers often consider maturity of the banana as the key attribute, as indicated by 95% of the
respondents who agreed that maturity of bananas is very important at the time of purchase. This is
followed by affordability (in terms of price), freshness (from harvest time to purchase) and size of
the fingers and bunch. Only 20% of the consumers pay attention to the variety of the banana.
Table 4: Banana attributes considered by consumers at time of purchase
Attribute Level of agreement (%)
Agree Uncertain Disagree
Large bunches 83.7 5.0 11.3
Mature bananas 95.0 2.5 2.5
Large fingers 88.7 1.3 10.0
Variety 20.0 25.0 55.0
Quality of packaging 35.0 25.0 40.0
Freshness 90.0 7.5 2.5
Price 92.5 5.0 2.5
18
2.3. Value Chain Analysis
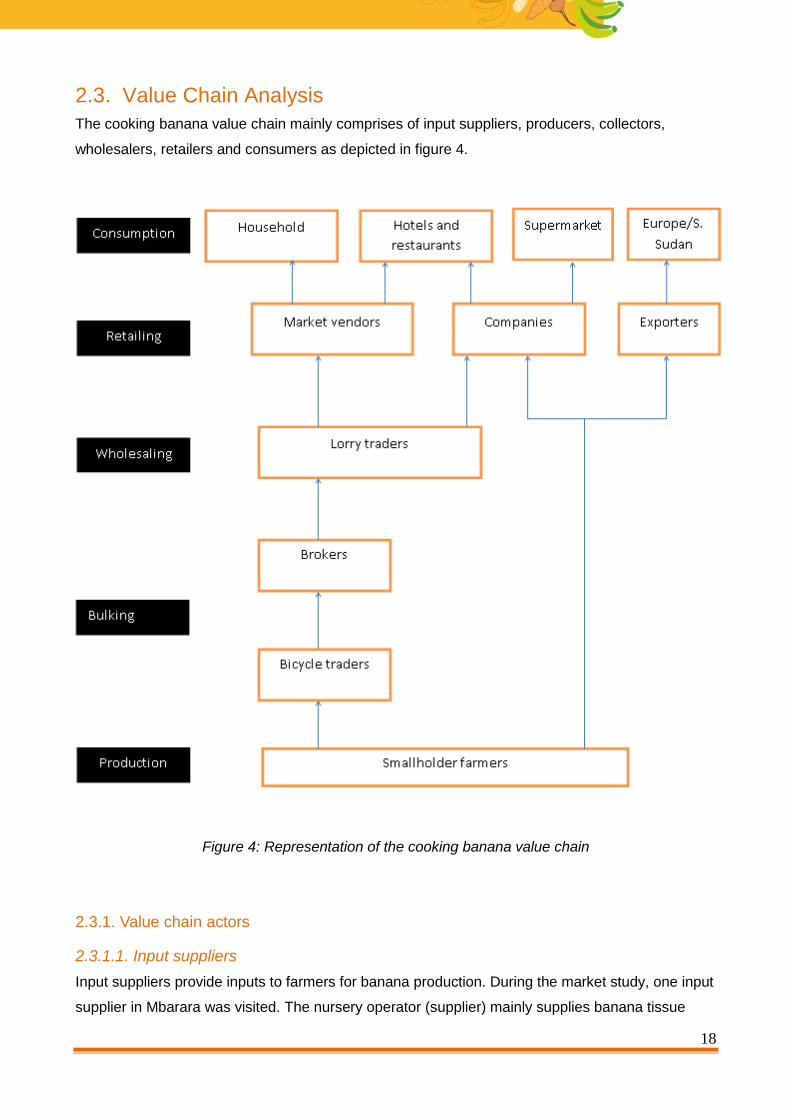
The cooking banana value chain mainly comprises of input suppliers, producers, collectors,
wholesalers, retailers and consumers as depicted in figure 4.
Figure 4: Representation of the cooking banana value chain
2.3.1. Value chain actors
2.3.1.1. Input suppliers
Input suppliers provide inputs to farmers for banana production. During the market study, one input
supplier in Mbarara was visited. The nursery operator (supplier) mainly supplies banana tissue
19
plantlets and manure (cow dung) to farmers. The total volume of plantlets handled by the supplier
is 2,000 plantlets in every six months. Of these, 1,700 plantlets are sold directly to individual
farmers while others are sold to NGOs and institutions. On average, plantlets stay for two months
in the nursery for hardening before being sold. On the other hand, four trucks of manure are sold
per six months season each at UGX 150,000. The input supplier does variety selection for banana
tissue plantlets and often sort and label (Table 5).
Table 5: Total volume handled by the nursery operator per variety
Variety Volume handled in
6 months
Cost/plantlet
(UGX)
Reason for variety preference
Mbwazirume 500 1,500 Commonly grown
Nakitembe 1,000 1,500 Fast maturing
Kibuzi 500 1,500 Large bunch size and longer shelf life
Each plantlet is purchased at UGX 1,500 from Agro Genetic Technologies Ltd (AGT) located at
Buloba town in Wakiso district, which is about 300 km away from the nursery operator’s point of
operation. When the nursey operator meets with the supplier at AGT, they often talk about price
related issues, availability of different banana varieties and disease control methods. Generally,
there is no variation in varietal prices, though purchase prices slightly increase in the wet (rainy)
season. This is due to the high demand generated by farmers who wish to benefit from the rain.
The main customers are mostly men (table 6).
Table 6: Average 6-month sales of banana plantlets
Variety Quantity sold Buyers (%) Price (UGX)
Dry season Wet season Males Females Dry season Wet season
Mbwazirume 500 250 90 10 1,800 2,000
Nakitembe 300 500 87 13 1,800 2,000
Kibuzi 200 250 97 3 1,800 2,000
The input supplier reported that the majority of farmers (80%) does not use banana tissue
plantlets. There are no other banana input suppliers known in the district except the interviewed
one. The input supplier agrees that banana plantlet business presents future business
20
opportunities for farmer entrepreneurs. The biggest challenge faced by the input supplier is
disease outbreaks, specifically banana Xanthomonas wilt (BXW). The main services received by
the input supplier are trainings on agronomy and these are provided by MBADIFA and NAADS
twice a year.
2.3.1.2. Producers
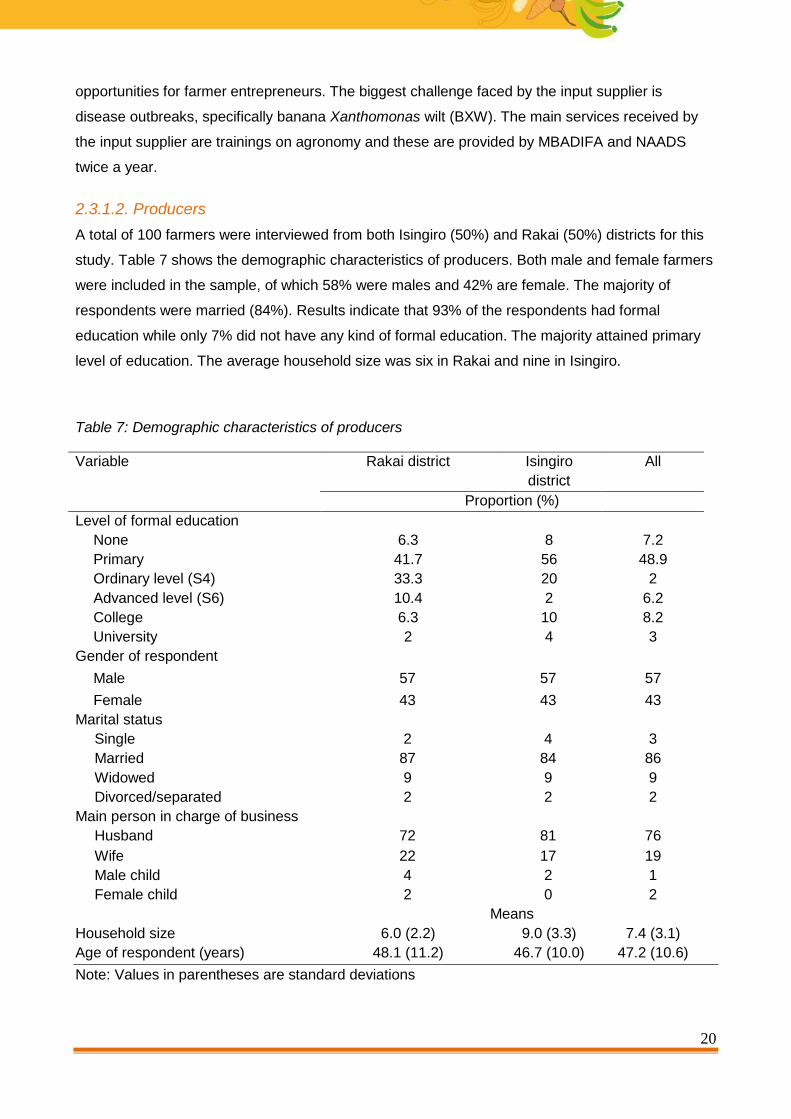
A total of 100 farmers were interviewed from both Isingiro (50%) and Rakai (50%) districts for this
study. Table 7 shows the demographic characteristics of producers. Both male and female farmers
were included in the sample, of which 58% were males and 42% are female. The majority of
respondents were married (84%). Results indicate that 93% of the respondents had formal
education while only 7% did not have any kind of formal education. The majority attained primary
level of education. The average household size was six in Rakai and nine in Isingiro.
Table 7: Demographic characteristics of producers
Variable Rakai district Isingiro
district
All
Proportion (%)
Level of formal education
None 6.3 8 7.2
Primary 41.7 56 48.9
Ordinary level (S4) 33.3 20 2
Advanced level (S6) 10.4 2 6.2
College 6.3 10 8.2
University 2 4 3
Gender of respondent
Male 57 57 57
Female 43 43 43
Marital status
Single 2 4 3
Married 87 84 86
Widowed 9 9 9
Divorced/separated 2 2 2
Main person in charge of business
Husband 72 81 76
Wife 22 17 19
Male child 4 2 1
Female child 2 0 2
Means
Household size 6.0 (2.2) 9.0 (3.3) 7.4 (3.1)
Age of respondent (years) 48.1 (11.2) 46.7 (10.0) 47.2 (10.6)
Note: Values in parentheses are standard deviations
21
2.3.1.3. Bicycle traders
The study shows that all bicycle traders are males and self-employed, with an average age of 33
years. They buy bananas from dispersed farmer plots within the village. They operate as the initial
collecting agents. They are well-known members of the community and they have established
strong relationships with the farmers. The strong relationship helps the bicycle traders to collect
enough volumes (quantities) and good quality bananas from farmers at reasonable prices.
Nevertheless, competition amongst bicycle traders exists as barriers to entry are quite low. Bicycle
traders mostly obtain information from fellow traders. There is also information sharing between
bicycle traders and farmers in terms of price and quality of the product. Information is shared
through telephones (50%) and face to face interaction (50%). About 57% of the traders inform the
producers about customer needs in terms of quality (i.e., fresh, green and large finger size) and
about 86% of the producers occasionally respond to such needs. On average, bicycle traders
make four trips per day during the surplus season and three trips per day in the low supply season.
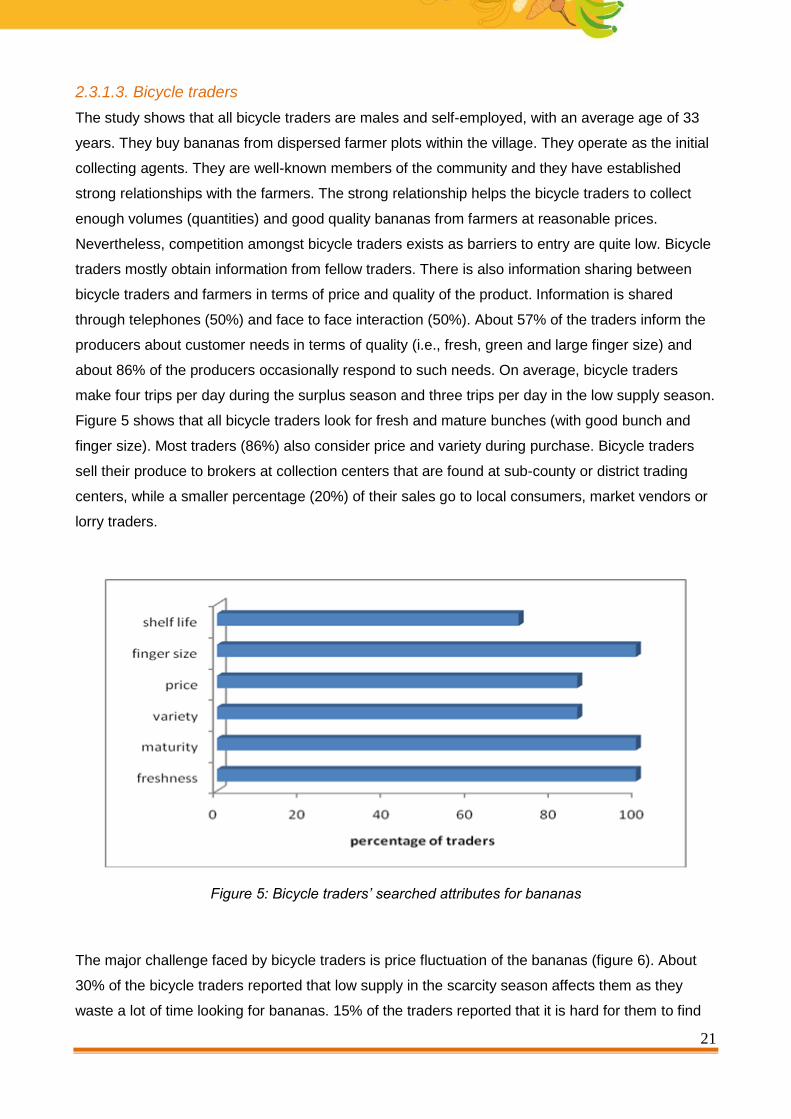
Figure 5 shows that all bicycle traders look for fresh and mature bunches (with good bunch and
finger size). Most traders (86%) also consider price and variety during purchase. Bicycle traders
sell their produce to brokers at collection centers that are found at sub-county or district trading
centers, while a smaller percentage (20%) of their sales go to local consumers, market vendors or
lorry traders.
Figure 5: Bicycle traders’ searched attributes for bananas
The major challenge faced by bicycle traders is price fluctuation of the bananas (figure 6). About
30% of the bicycle traders reported that low supply in the scarcity season affects them as they
waste a lot of time looking for bananas. 15% of the traders reported that it is hard for them to find
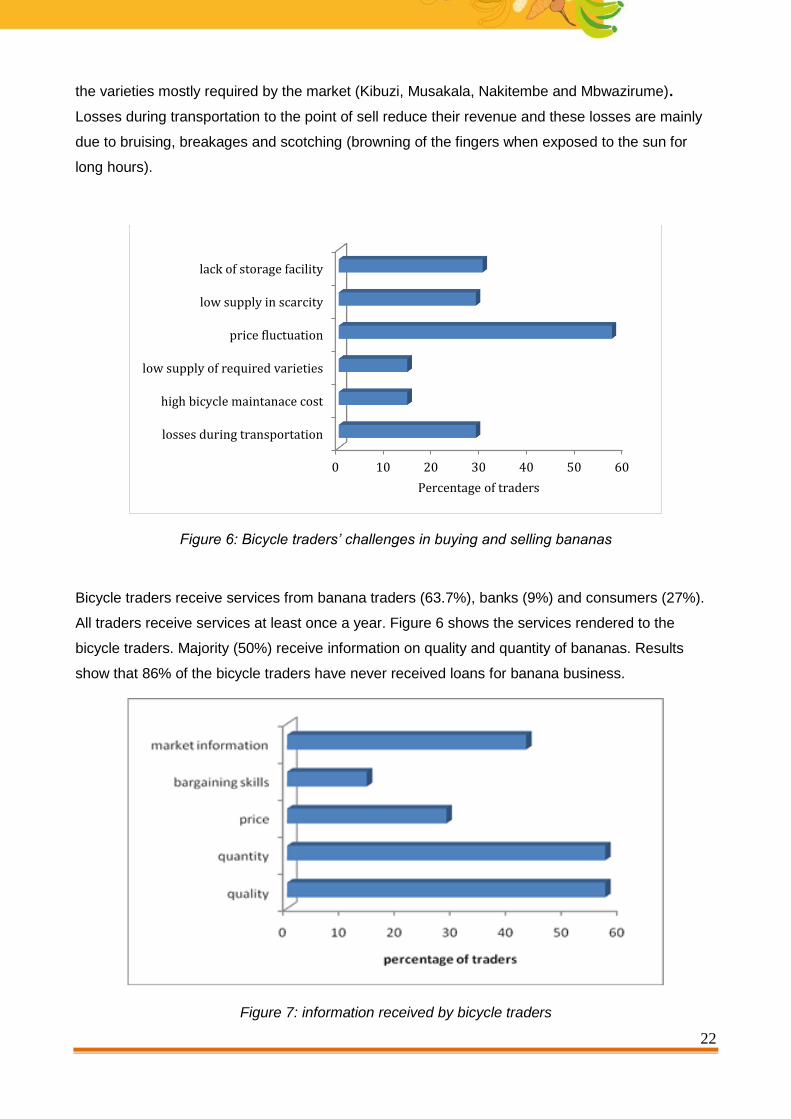
22
the varieties mostly required by the market (Kibuzi, Musakala, Nakitembe and Mbwazirume).
Losses during transportation to the point of sell reduce their revenue and these losses are mainly
due to bruising, breakages and scotching (browning of the fingers when exposed to the sun for
long hours).
Figure 6: Bicycle traders’ challenges in buying and selling bananas
Bicycle traders receive services from banana traders (63.7%), banks (9%) and consumers (27%).
All traders receive services at least once a year. Figure 6 shows the services rendered to the
bicycle traders. Majority (50%) receive information on quality and quantity of bananas. Results
show that 86% of the bicycle traders have never received loans for banana business.
Figure 7: information received by bicycle traders
0 10 20 30 40 50 60
losses during transportation
high bicycle maintanace cost
low supply of required varieties
price fluctuation
low supply in scarcity
lack of storage facility
Percentage of traders

23
2.3.1.4. Brokers
All brokers were found to be male with an average age of 40 years. At least 50% of the brokers
have attained primary level education and own their businesses. Brokers have been involved in the
banana business for an average of ten years. Brokers, though might collect directly from the
farmers, buy most (70%) of their banana from the bicycle traders. Brokers are commission agents
linking bicycle traders with lorry traders who buy directly from them. Brokers, however, also engage
in the transportation of banana to urban markets. Brokers sell primarily to lorry traders. Results
show that about 34% of the brokers have good relationships with the lorry traders, and as a result
they get cash advances to consolidate stocks and, likewise, sometimes lorry traders are able to
buy on credit. 47% of the brokers reported that the main information shared between the brokers,
suppliers and the buyers is price-related, while 45% reported to mainly share information related to
the quality of bananas. The most popular mode of communication is telephone as reported by 62%
of the brokers while 38% communicate face to face. 40% of the banana producers occasionally
respond to the brokers needs in the banana market. Results further show that 80% of the brokers
look for large fingers, 100% look for mature bananas, 50% look for particular varieties and 80%
look for freshness while buying bananas. Brokers reported some challenges in buying bananas as
shown in figure 8. Due to the inability to meet the market demand, there are many immature
bananas on the market during the scarcity season and, despite the higher market prices at this
time, such bananas are low priced due to their low quality. Brokers are also challenged with
procuring the preferred varieties (Musakala, Nakitembe, Mbwazirume and Kibuzi) and, most of the
times, the varieties are mixed especially for fingers packed in polyethene bags. This makes it
difficult to sell to buyers who have a clear preference for particular varieties (e.g. the export
market). Brokers receive training once a year by NGOs and NAADSs and pay an average of UGX
2,500 per training. 88% do not have access to loans.
Figure 8: Challenges in buying bananas
0 10 20 30 40
immature bananas
scarcity of preferred varieties
high transport costs
loss due to ripening
mix of different varieties
Percentage of brokers
Fingers
Bunches

24
2.3.1.5. Wholesaler / lorry traders
All lorry traders (wholesalers) are men and mostly above 40 years of age. The majority (80%) have
attained primary level of education. Lorry traders mainly buy their bananas from brokers, with
whom they have long and well established relationships. These traders are individuals, and unlike
farmers, most (80%) are not organized into any group or association. These traders are self-
employed. However, most of them (70%) do not own the trucks. These are hired, which represents
their highest operating cost. Traders tend to work with brokers because they prefer to buy bulked
stocks which have already been quality screened by the brokers. Mainly price related information is
shared between the lorry traders and the suppliers, where 70% communicate occur through
telephones. Lorry traders transact mostly (71%) on cash basis but sometimes (21%) procure on
credit. All lorry traders have obtained business loans at least once, with an average of UGX
7,500,000. The major constraints faced by lorry traders are high transportation costs, postharvest
losses due to ripening and low supply in the scarcity season that leads to purchasing immature
bananas. The scattered nature of farmers and the poor road infrastructure in the villages
discourage lorry traders to transact directly with the farmers.
2.3.1.6. Retailers
Market vendors are largely women (about 70%) though for this study men were oversampled to get
a better representation of their views. Most (43%) market vendors attained secondary level
education. Retailers operate market stalls and most of them (90%) are self-employed. The major
banana outlets are the open markets such as Kalerwe, Nakawa and Kasubi. There are several
other markets mainly located nearby large communities. The vendors procure their entire banana
stock from the lorry traders. They have long term relationships with 70% of their suppliers and at
least 40% of their customers. They mostly communicate by mobile phone (52%) for pricing and
delivery requirements. Most (83%) vendors do not belong to organized groups or associations.
They are largely clients of microfinance institutions and SACCOs, from whom they derive most of
their working capital requirements. The main micro finance institutions include FINCA, Pride
microfinance and Brac. Market vendors sell their produce to household consumers, hotels,
restaurants and schools are mostly paid (65%) on cash basis. Market vendors incur few costs,
including rent for stalls, own transport, meals and labor costs resulting in high business profitability.
Supermarkets are also involved in the retailing of bananas, and they prefer varieties with longer
shelf life and large finger size. The greatest challenge faced by supermarkets is the inconsistent
supply of bananas.
2.3.1.7. Exporters
67% of the exporters are male with an average age of 38 years and 9 years of working experience.
The majority (67%) of exporters procure their bananas from farmers directly, while 38% obtain from

25
brokers. Their main challenges are poor quality of bananas during the scarcity season. Exporters
sell their bananas to South Sudan and Europe.
2.3.1.8. Consumers
Consumers play the end-user’s role in the banana value chain. Eight markets in and around
Kampala were visited from which 80 consumers were interviewed. Among those interviewed, 73%
were female and 27% were male. The majority (95%) had acquired some level of formal education,
where 24% had primary education, 43% secondary education, 13% tertiary and 15% university
degrees. 66% of the respondents were married, with an average age of 34 years. The average
household size is was five members per household. Decisions on whether to purchase bananas or
not in a household are mainly (70%) taken by wives. About 35% of banana consumers earn below
UGX 500,000, while 33% earn between UGX 500,000 and 1,000,000 per month. The average
distance to the market is 2.5 kilometers. The majority of consumers (52%) mentioned rice as the
typical substitute of banana, while 35% mentioned maize. The preference for these substitutes is
because of their consistent availability in the market.
2.4. Margins along the banana value chain
At farm level, 77% of the banana business is managed by male household heads. Bananas are
sold in form of bunches and sacks of fingers. The majority of farmers sell at farm gate, whereas
80% sell individually and only 20% sell in groups. About 12% of producers operate their banana
business under contracts with buyers. Under these agreements, farmers are given advance
payments before harvest. Producers rate their buyers as being trustworthy and bulk purchasers.
Results show that majority of the males are positioned in the most profitable nodes of the value
chains (table 8).
The marketing margin (difference between the retail price and farm-gate price) is higher in the
scarce season compared to the surplus season as shown in table 8. In the low production
seasons, the total market margin for a small bunch is estimated at about UGX 13,500 and UGX
16,500 for a large bunch, while in the high production season it is estimated at an average of UGX
9,900 for a small and UGX 15,850 for a large bunch. Margins are higher in the scarcity season and
for large bunches because of the higher prices of bananas.
Table 8: Marketing margins in low and high supply seasons
Season Large bunch Small bunch
Low supply (scarcity) 16,458 13,489
High supply (surplus) 15,850 9,900
26
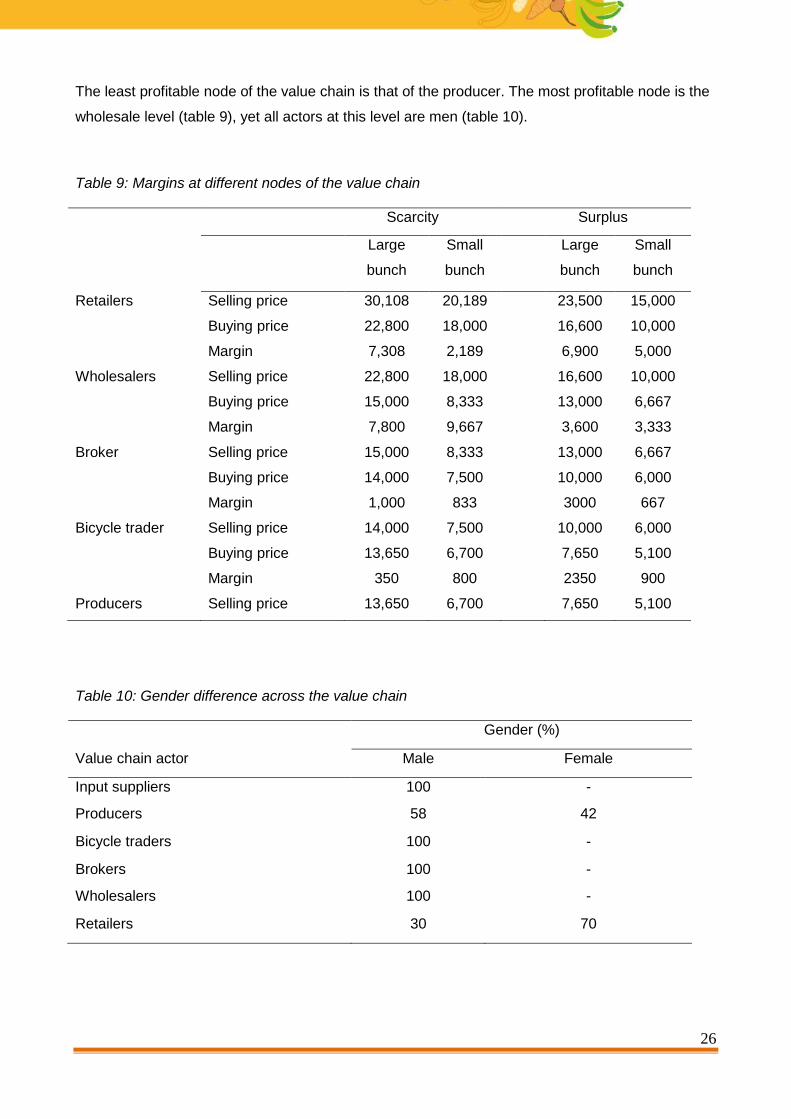
The least profitable node of the value chain is that of the producer. The most profitable node is the
wholesale level (table 9), yet all actors at this level are men (table 10).
Table 9: Margins at different nodes of the value chain
Scarcity Surplus
Large
bunch
Small
bunch
Large
bunch
Small
bunch
Retailers Selling price 30,108 20,189 23,500 15,000
Buying price 22,800 18,000 16,600 10,000
Margin 7,308 2,189 6,900 5,000
Wholesalers Selling price 22,800 18,000 16,600 10,000
Buying price 15,000 8,333 13,000 6,667
Margin 7,800 9,667 3,600 3,333
Broker Selling price 15,000 8,333 13,000 6,667
Buying price 14,000 7,500 10,000 6,000
Margin 1,000 833 3000 667
Bicycle trader Selling price 14,000 7,500 10,000 6,000
Buying price 13,650 6,700 7,650 5,100
Margin 350 800 2350 900
Producers Selling price 13,650 6,700 7,650 5,100
Table 10: Gender difference across the value chain
Gender (%)
Value chain actor Male Female
Input suppliers 100 -
Producers 58 42
Bicycle traders 100 -
Brokers 100 -
Wholesalers 100 -
Retailers 30 70

27
2.5. Banana presentation forms along the value chain
Bananas can be sold to the market in different presentation forms, including bunches, unpeeled
fingers, peeled fingers, and clusters. Different presentation forms could be preferred at different
nodes of the value chain. This study establishes the volume and preferences of different
presentations at each node of the banana value chain. All producers, brokers and 90% of
wholesalers sell their bananas in form of bunch and/or bags of unpeeled fingers, while bicycle
traders buy and sell only bunches. Exporters buy bunches and sell in form of clusters and
supermarkets sell unpeeled fingers and clusters. At retail level (in open markets) different
presentations are sold, though all retailers reported that bunches are the most preferred by
consumers and thus the most sold. The second most preferred type of presentation is unpeeled
fingers as reported by 63% of the retailers. Retailers either sell the whole bag of fingers (typically of
X Kg) to the consumer or small heaps (about 8-13 fingers) depending on the consumers’
preference. Table 11 provides an indication of the current volumes sold by different value chain
actors. The preference for the different presentation types at different levels of the value chain is
attributed to the ease of handling and the high demand for a particularly presentation form. 32% of
the retailers reported that there is an increased demand for peeled bananas.
Table 11: Volumes of different presentations forms sold by different actors per month
The most common types of presentations in the market (table 12) are the unpeeled bananas and
bunches as reported by 65% and 55% of the consumers, respectively. The proportion of total
banana sales sold at retailer level in different presentation forms is approximately 47% bunches,
Actor
Presentation form
Bunch (#) Bag (#) Cluster (#) Unpeeled
(# of heaps)
Peeled
(# of packs)
High Low High Low High Low High Low High Low
Producers* 596 280 23 14 - - - - - -
Bicycle traders** 80 60 - - - - - - - -
Brokers ** 1900 1128 - - -
Wholesalers** 1292 148 - - -
Retailers** 210 122 11 9 480 308 760 714 712 356
28
17% bags of unpeeled bananas, 11% clusters, 15% heaps of unpeeled banana and 10% peeled
bananas.
Table 12: Availability of desired quantities for consumers
Presentation type Never Rarely Occasionally Regularly
Unpeeled fingers 10.3 3.5 20.7 65.5
Clusters 15.4 7.7 30.8 46.2
Bunches 10.7 1.8 32.1 55.3
Peeled fingers 7.1 7.1 50.0 35.0
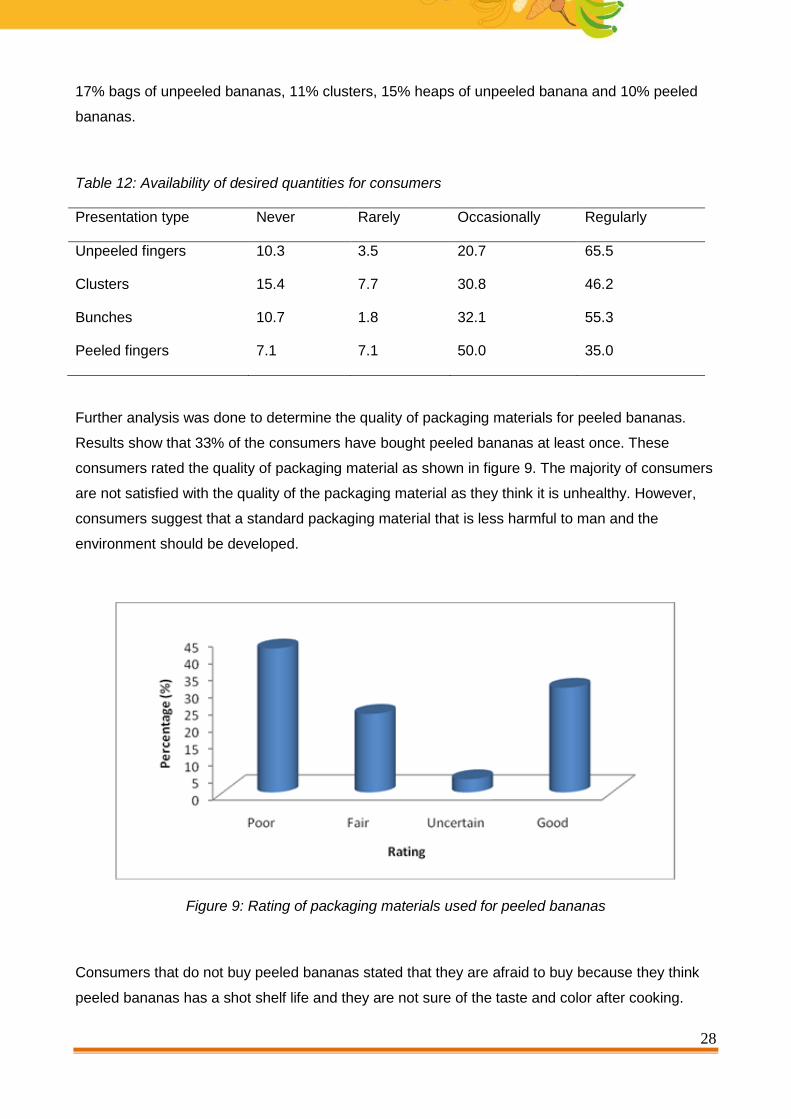
Further analysis was done to determine the quality of packaging materials for peeled bananas.
Results show that 33% of the consumers have bought peeled bananas at least once. These
consumers rated the quality of packaging material as shown in figure 9. The majority of consumers
are not satisfied with the quality of the packaging material as they think it is unhealthy. However,
consumers suggest that a standard packaging material that is less harmful to man and the
environment should be developed.
Figure 9: Rating of packaging materials used for peeled bananas
Consumers that do not buy peeled bananas stated that they are afraid to buy because they think
peeled bananas has a shot shelf life and they are not sure of the taste and color after cooking.
29
About 60% of the producers reported an increased demand for bunches in the last one year, while
50% reported increase in demand for bags of unpeeled fingers. At retail level, 91% of the retailers
reported an increased demand for bunches, 70% for heaps of unpeeled fingers, and 62% reported
an increased demand for bags of fingers. Though the increase in demand for peeled fingers is not
large (32%), retailers reported that the demand is steadily increasing over time. Bunches are the
most highly demanded type of presentation, with 61% of the consumers demanding small
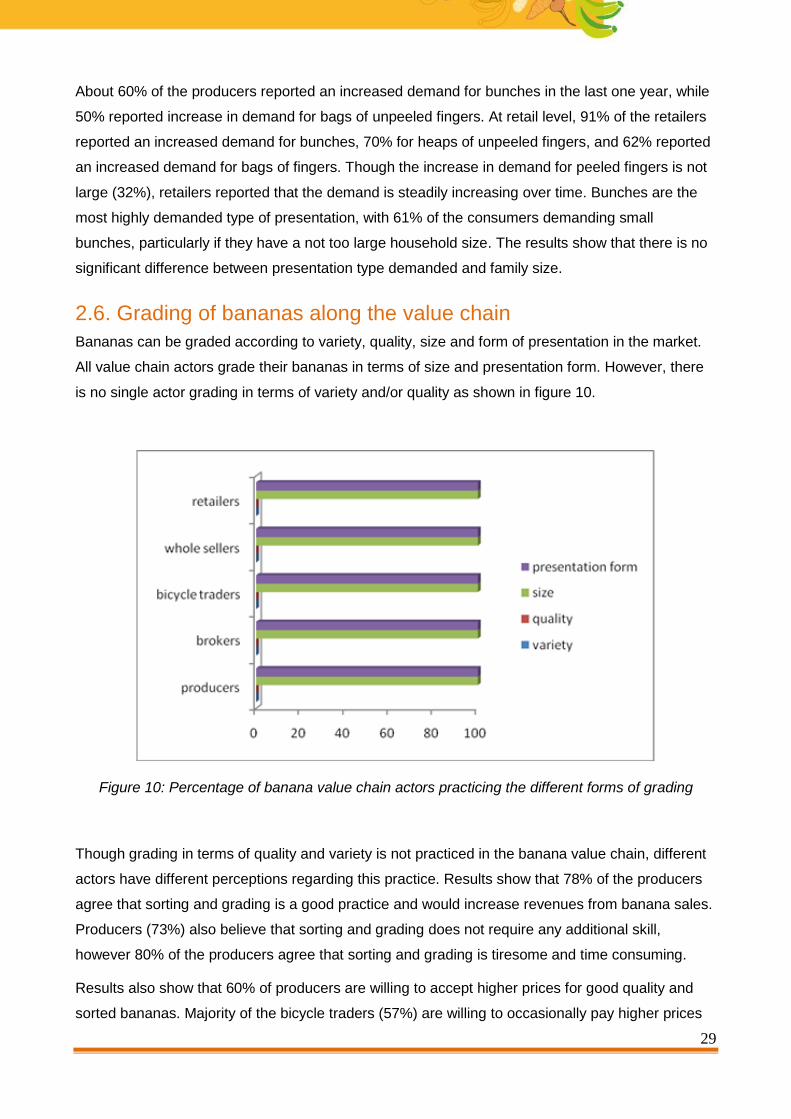
bunches, particularly if they have a not too large household size. The results show that there is no
significant difference between presentation type demanded and family size.
2.6. Grading of bananas along the value chain
Bananas can be graded according to variety, quality, size and form of presentation in the market.
All value chain actors grade their bananas in terms of size and presentation form. However, there
is no single actor grading in terms of variety and/or quality as shown in figure 10.
Figure 10: Percentage of banana value chain actors practicing the different forms of grading
Though grading in terms of quality and variety is not practiced in the banana value chain, different
actors have different perceptions regarding this practice. Results show that 78% of the producers
agree that sorting and grading is a good practice and would increase revenues from banana sales.
Producers (73%) also believe that sorting and grading does not require any additional skill,
however 80% of the producers agree that sorting and grading is tiresome and time consuming.
Results also show that 60% of producers are willing to accept higher prices for good quality and
sorted bananas. Majority of the bicycle traders (57%) are willing to occasionally pay higher prices
30
for good sorted bananas while 43% are willing to regularly pay higher prices. 50% of brokers, 67%
of wholesalers and 88% of the consumers reported that they are willing to pay higher prices for
good quality and sorted bananas if availed on the market.
The majority of bicycle traders (86 %) occasionally find the required quantities of the preferred
banana varieties, while 14% rarely find the right quantities of the required varieties. About 32% of
the retailers reported increased demand for particular varieties like Kibuzi, Nakitembe, Musakala
and Mbwazirume. 55% of the consumers are not satisfied with the quality of bunches and 58% are
not satisfied with the quality of peeled bananas.
2.7. Weight based price system along the value chain
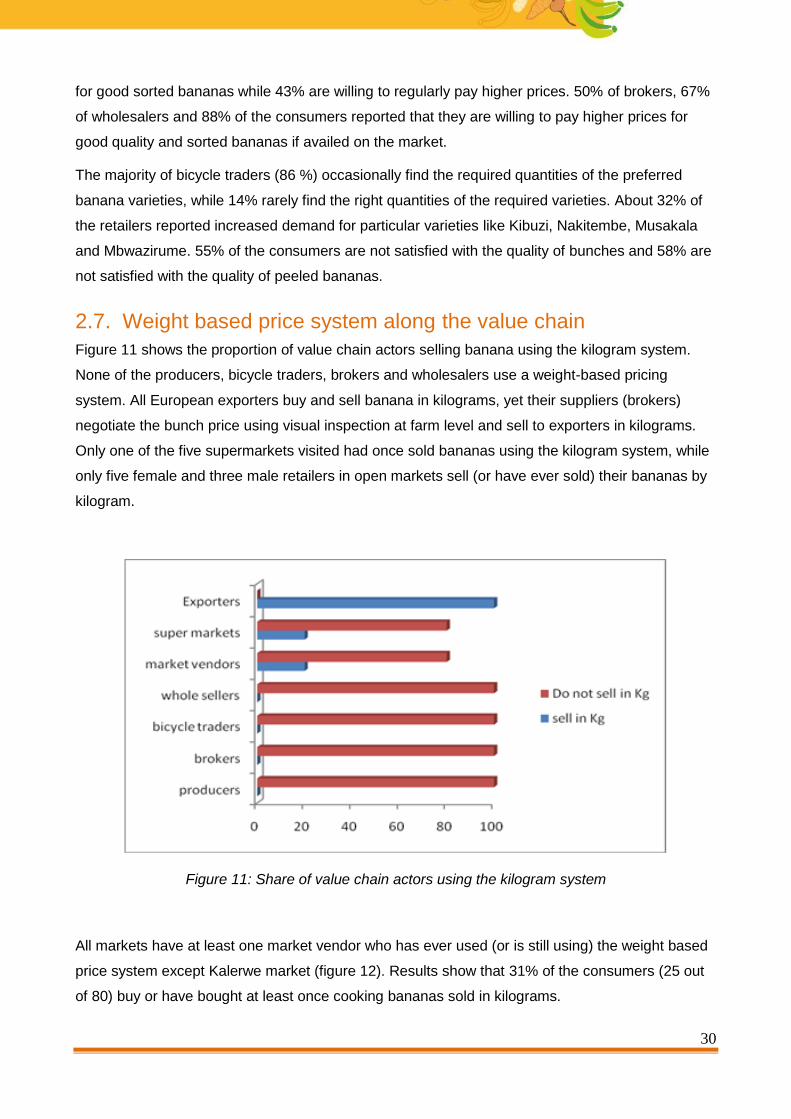
Figure 11 shows the proportion of value chain actors selling banana using the kilogram system.
None of the producers, bicycle traders, brokers and wholesalers use a weight-based pricing
system. All European exporters buy and sell banana in kilograms, yet their suppliers (brokers)
negotiate the bunch price using visual inspection at farm level and sell to exporters in kilograms.
Only one of the five supermarkets visited had once sold bananas using the kilogram system, while
only five female and three male retailers in open markets sell (or have ever sold) their bananas by
kilogram.
Figure 11: Share of value chain actors using the kilogram system
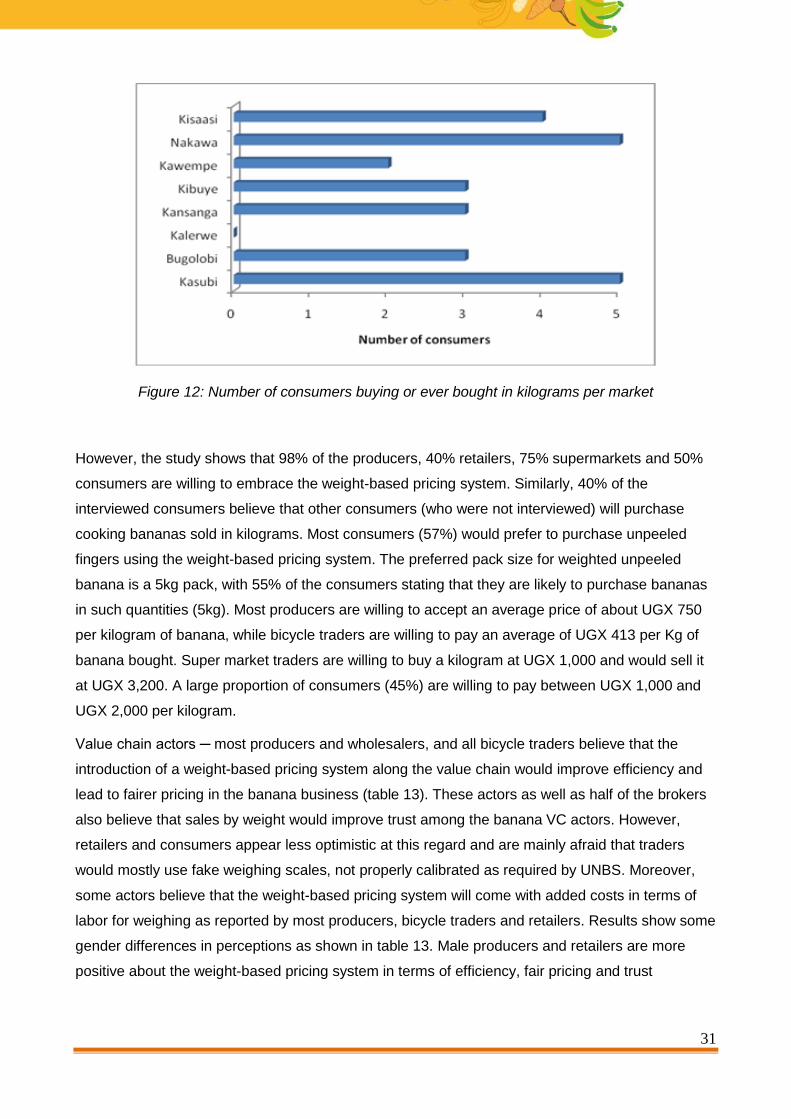
All markets have at least one market vendor who has ever used (or is still using) the weight based
price system except Kalerwe market (figure 12). Results show that 31% of the consumers (25 out
of 80) buy or have bought at least once cooking bananas sold in kilograms.
31
Figure 12: Number of consumers buying or ever bought in kilograms per market
However, the study shows that 98% of the producers, 40% retailers, 75% supermarkets and 50%
consumers are willing to embrace the weight-based pricing system. Similarly, 40% of the
interviewed consumers believe that other consumers (who were not interviewed) will purchase
cooking bananas sold in kilograms. Most consumers (57%) would prefer to purchase unpeeled
fingers using the weight-based pricing system. The preferred pack size for weighted unpeeled
banana is a 5kg pack, with 55% of the consumers stating that they are likely to purchase bananas
in such quantities (5kg). Most producers are willing to accept an average price of about UGX 750
per kilogram of banana, while bicycle traders are willing to pay an average of UGX 413 per Kg of
banana bought. Super market traders are willing to buy a kilogram at UGX 1,000 and would sell it
at UGX 3,200. A large proportion of consumers (45%) are willing to pay between UGX 1,000 and
UGX 2,000 per kilogram.
Value chain actors ─ most producers and wholesalers, and all bicycle traders believe that the
introduction of a weight-based pricing system along the value chain would improve efficiency and
lead to fairer pricing in the banana business (table 13). These actors as well as half of the brokers
also believe that sales by weight would improve trust among the banana VC actors. However,
retailers and consumers appear less optimistic at this regard and are mainly afraid that traders
would mostly use fake weighing scales, not properly calibrated as required by UNBS. Moreover,
some actors believe that the weight-based pricing system will come with added costs in terms of
labor for weighing as reported by most producers, bicycle traders and retailers. Results show some
gender differences in perceptions as shown in table 13. Male producers and retailers are more
positive about the weight-based pricing system in terms of efficiency, fair pricing and trust
32
compared to their female counter parts. However, female producers and retailers are more prone
to think that the weight based pricing system will not add any extra cost.
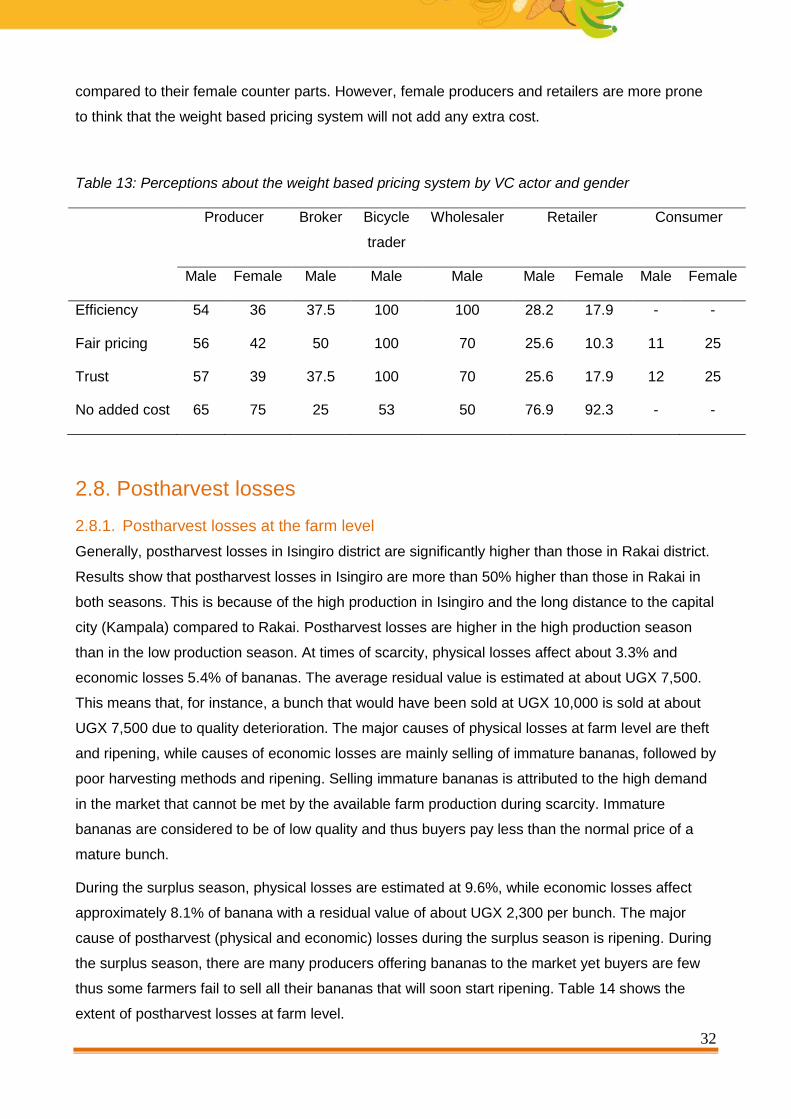
Table 13: Perceptions about the weight based pricing system by VC actor and gender
Producer Broker Bicycle
trader
Wholesaler Retailer Consumer
Male Female Male Male Male Male Female Male Female
Efficiency 54 36 37.5 100 100 28.2 17.9 - -
Fair pricing 56 42 50 100 70 25.6 10.3 11 25
Trust 57 39 37.5 100 70 25.6 17.9 12 25
No added cost 65 75 25 53 50 76.9 92.3 - -
2.8. Postharvest losses
2.8.1. Postharvest losses at the farm level
Generally, postharvest losses in Isingiro district are significantly higher than those in Rakai district.
Results show that postharvest losses in Isingiro are more than 50% higher than those in Rakai in
both seasons. This is because of the high production in Isingiro and the long distance to the capital
city (Kampala) compared to Rakai. Postharvest losses are higher in the high production season
than in the low production season. At times of scarcity, physical losses affect about 3.3% and
economic losses 5.4% of bananas. The average residual value is estimated at about UGX 7,500.
This means that, for instance, a bunch that would have been sold at UGX 10,000 is sold at about
UGX 7,500 due to quality deterioration. The major causes of physical losses at farm level are theft
and ripening, while causes of economic losses are mainly selling of immature bananas, followed by
poor harvesting methods and ripening. Selling immature bananas is attributed to the high demand
in the market that cannot be met by the available farm production during scarcity. Immature
bananas are considered to be of low quality and thus buyers pay less than the normal price of a
mature bunch.
During the surplus season, physical losses are estimated at 9.6%, while economic losses affect
approximately 8.1% of banana with a residual value of about UGX 2,300 per bunch. The major
cause of postharvest (physical and economic) losses during the surplus season is ripening. During
the surplus season, there are many producers offering bananas to the market yet buyers are few
thus some farmers fail to sell all their bananas that will soon start ripening. Table 14 shows the
extent of postharvest losses at farm level.
33
Table 14: Extent of postharvest losses at farm level
Physical loss (%) Economic loss (%) Residual value
(UGX)
Scarcity Surplus Scarcity Surplus Scarcity Surplus
Overall 3.3 9.6 5.4 8.1 7,534 2,385
Rakai 1.0 8.9 0.7 3.8 9,661 3,312
Isingiro 5.4 10.1 10.0 12.1 5,491 1,495
There is not substantial difference in postharvest losses for male and female farmers though
female farmers have bigger economic and incur higher price discounts in the surplus season as
shown in table 15.
Table 15: Gender distribution of postharvest losses at farm level
Type of loss Scarcity Surplus
Male Female Male Female
Physical loss (%) 2.5 4.2 8.9 10.4
Economic loss (%) 4.5 6.7 6.8 9.8
Residual value (UGX) 7753 7232 2566 2135
2.8.2. Postharvest losses at the broker level
Only three out of eight brokers reported postharvest losses. Larger losses are experienced during
the surplus season as shown in table 16. Bruising, ripening and overstaying are the lead causes of
physical and economic losses in both the surplus and scarcity seasons.
Table 16: Average postharvest losses at broker level
Physical loss (%) Economic loss (%) Residual value (UGX)
Scarcity season 1.8 2.2 8,981
Surplus season 3.9 4.6 7,499
34
2.8.3. Postharvest losses at the wholesale level
At wholesale level physical losses during scarcity are estimated at about 6.7% and economic
losses at 3%. These economic losses result into a residual value of about UGX 20,000 per
damaged large bunch in scarcity season. The major causes of such losses are thefts and bruising
for physical losses and bruising and ripening for economic losses. However, in the surplus season,
both physical and economic losses increase and are mainly caused by ripening and bruising.
Likewise, the residual value also decreases significantly to approximately UGX 11,000 per bunch if
damaged (table 17).
Table 17: Postharvest losses at wholesale level by season
Physical loss (%) Economic loss (%) Residual value (UGX)
Scarcity season 6.7 3.2 19,950
Surplus season 8.7 7.5 11,419
2.8.4. Postharvest losses at the retail level
At retail level during scarcity physical losses are estimated at about 6.2%, while economic losses
are approximately at 6.5% translating into a residual value of about UGX 12,000 per damaged
bunch (table 18). During surplus physical losses increases to 10 and volumes affected by
economic losses almost double to 12%, resulting into an average residual value of UGX 7,500 per
damaged bunch. Physical losses are mainly caused by ripening, bruising, and thefts while
economic ones are caused by ripening, bruising and finger plucking in scarcity seasons. Generally,
workers who load (and offload) bananas onto (from) the truck are not paid cash. So at any point of
loading and offloading those workers pull out (pluck) fingers as their in kind payment. On average
about 10 fingers are removed per bunch. Retailers are very dissatisfied with the act of plucking out
fingers from the bunch and about 57% of the retailers reported tremendous losses (due to weight
loss and accelerated quality deterioration) from finger plucking.
Table 18: Postharvest losses at retail level by season
Physical loss (%) Economic loss (%) Residual value (UGX)
Scarcity season 6.2 6.5 11,833
Surplus season 9.8 11.9 7,558
35
Bruising and ripening are the lead causes of postharvest (both physical and economic) losses
during the surplus season at retail level. Bruising results into discoloration and exposes the banana
to infections thus shortening the shelf life and lowering the quality. Other causes that have been
mentioned include overstaying, scotching and finger plucking. Table 19 shows PH losses by
gender. Though no significant differences were observed, males tend to incur more physical and
economic losses during scarcity than females, while during surplus women tend to incur more
economic losses compared to men. Residual values are not significantly different in both seasons.
Table 19: Gender distribution of postharvest losses at retail level
Scarcity Surplus
Type of loss Male Female Male Female
Physical loss (%) 6.4 5.8 10.5 8.9
Economic loss (%) 6.8 6.1 11.5 12.6
Residual loss
(UGX)
12,206 11,273 7963 6952
2.8.5. Postharvest losses at the export level
Ripening is the major cause of physical losses at export level in both scarcity (1.5%) and surplus
(2.5%) season, while bruising causes most of the economic losses (4.4%) in scarcity season.
However, in surplus season over staying and bruising are the main causes of economic losses
(5.8%).
2.8.6. Mitigation measures for postharvest losses
At production level, farmers suggested that if they can even out the supply throughout the year
then the tremendous losses in the surplus season will be reduced. All value chain actors agreed
that marketing varieties with longer shelf life can help reduce losses caused by ripening. Farmers
suggested that training in proper harvesting time can reduce immature harvests, thus reducing
losses arising from selling immature bananas. Similarly, farmers hinted that fencing off banana
plantations can help reduce losses due to theft, but it would be costly to implement. Lorry traders
suggested that improving roads in rural areas and proper packing of bananas on trucks can reduce
losses during transportation. At retail level, about 50% of the vendors also suggested that avoiding
overloading can reduce bruising during transportation to the market. All VC actors believe that
proper handling of bananas right from the farm to the market can reduce bruises. Finally, covering
bananas with tarpaulins after harvest at farm level, during transportation and at retail markets can

36
reduce exposure of bananas to direct sunlight, which in turn can minimize losses as result of
scotching.
3. CONCLUSIONS
Banana varieties of Kibuzi, Nakitembe Mbwazirume and Musakala are only accessed by few
farmers yet these are the most demanded varieties in the market. Farmers are willing to purchase
clean planting materials of these varieties from the nurseries if availed. This presents a business
opportunity to farmers who are willing to establish nurseries. Banana presentation forms of clusters
and peeled fingers are missing at the production end of the value chain. There is an increasing
demand for peeled bananas at retail level therefore retailers could demand for peeled bananas
right from the farm. Farmers are willing to provide peeled bananas as they could use the banana
peelings as manure for their gardens. Banana value chain actors are very positive and willing to
embrace the weight based pricing system. This is expected to improve efficiency and fairness in
the banana pricing system as well as improve transparency between buyers and sellers. The
postharvest losses across the value chain are high and thus require various interventions to
considerably reduce them. All these innovations are expected to improve margins along the value
chain and thus reduce the gap between retail prices and farm gate prices.
37
REFERENCES
Fiedler, J.L., Kikulwe, E.M., and E. Birol (2013). An Ex Ante Analysis of the Impact and Cost-
Effectiveness of Biofortified High-Provitamin A and High-Iron Banana in Uganda. IFPRI
Discussion Paper 01277, Washington, DC: IFPRI.
Haggblade, S., and Dewina, R. (2010). Staple food prices in Uganda. Prepared for the Comesa
policy seminar on “Variation in staple food prices: causes, consequence, and policy options,”
Maputo, Mozambique (pp. 25-26).
Kabahenda M. and Kapiriri N.M. (2010). Analyzing Agricultural Science and Technology Innovation
Systems: A Case Study of the Banana Sub-sector in Uganda.
Kalyebara, R., Wood, S. and P. Abodi (2005). The Potential Economic Benefits of Improved
Banana Productivity in Uganda: An industry-scale analysis.
Ngambeki, D., Nowakunda, K. and Tushemereirwe, W.K. (2010). Extent and causes of banana
(Musa Spp) market distortions in Uganda. Acta Horticulturae, ISHS.
Nyombi, K. (2013). Towards sustainable highland banana production in Uganda: opportunities and
challenges. African Journal of Food, Agriculture, Nutrition and Development, 13(2).
Smale, M. and Tushemereirwe, W. (Eds.) (2007). An economic assessment of banana genetic
improvement and innovation in the Lake Victoria region of Uganda and Tanzania (Vol. 155). Intl
Food Policy Res Inst.
The New Vison (August, 2014). Raw deal for banana farmers. Accessed on August 20,
http://www.newvision.co.ug/news/658639-raw-deal-for-banana-farmers.html
UBOS (2010). Uganda census of Agriculture 2008/2009. Crop area and production report, volume
IV.
Wanda, O. (2009). Production risk and input use in banana production in Uganda.