techniqu es in mineral exploration
TRANSCRIPT

City & Regional Planning Department.
Term 122.
Term Paper:
The feasibility of Remote sensing systems \techniques in mineral
exploration.
Student name:
Ammar Juma Abdlmutalib
Supervised by:
Dr. Baqer Alramadan
May.18,2013

2
List Of Contents:
Abstract ........................................................................................................................................................... 3
Introduction: .................................................................................................................................................... 3
Remote sensing technology: ........................................................................................................................... 3
Landsat images: ............................................................................................................................................. 4
SPOT: ........................................................................................................................................................... 5
Hyperspectral imaging system: ........................................................................................................................ 5
Radar systems: .............................................................................................................................................. 5
Advanced Spaceborne Thermal Emission and Reflection Radiometer data (ASTER):............................................... 5
Algorithms applied on remote sensing image: ................................................................................................... 6
Digital image processing: ................................................................................................................................ 7
Methodology & Objectives: ................................................................................................................................ 7
Literature review: .............................................................................................................................................. 8
Case study 1: Mapping hydrothermal alterations at epithermal vein deposit – Goldfield, Nevada: ............................ 11
Case study 2: Integrating geologic and satellite imagery data for high-resolution mapping and gold exploration targets
in the South Eastern Desert, Egypt: ................................................................................................................... 18
Discussion and Conclusion: ............................................................................................................................... 21
References: .................................................................................................................................................... 23

3
Abstract This paper aims to collect many previous publications and literatures discussed one of important approaches
used in mineral exploration which is remote sensing. Through reviewing many papers, feasibility of using
remote sensing can be evaluated. Remote sensing has various systems such as : Landsat, Spot, ASTER, and
AVIRIS. All of them have been used for the purpose of delineating zones associated with mineral existence
zones like hydrothermally altered zones and heavily fractured zones. The outcomes of these systems is then
subjected to many processing algorithms (ratio image, composite ratio, image classifications, Principal
Co po e t a alysis,… etc). Ma y studies have been discussed and finally all systems and algorithms were
evaluated statistically and quantitatively. Many cases studies represents the real world application for these
techniques also have been provided.
Introduction:
Remote sensing is defined as obtaining images using aircrafts or satellites, processing, interpreting and
relating them through detecting interactions between material and electromagnetic spectrum (Sabin, 1997).
This paper describes different systems of remote sensing used in mineral exploration, processing methods,
different examples of delineating of hydrothermal alteration zone which is supposed to be related to ore
minerals occurrences of gold and copper in different sites in the world. The paper also describes the
methods of targeting mineralized zones which are covered by vegetations and soils.
Remote sensing technology:
Table 1 summarizes different systems of remote sensing utilized in mineral exploration and their
characteristics including: spectral bands, regions, terrain coverage in different geographical directions and
their spatial resolution.
Table 1: remote sensing systems employed for mineral exploration and their properties (Sabins, 1999).

4
These systems can be obtained using either aircrafts or satellites. A system which uses satellites includes
landsat and SPOT systems and they have different advantages: lower cost per Km2, large areas coverage,
and easy archives of the world data. A system which uses aircraft such as hyperspectral systems has a lot of
advantages: they are easily adjustable to be adapted to project requirement, and the most modern
technology (hyperspectral) used only for aircraft.
Landsat images:
There are two generation of landsat were used for mineral exploration. The first one is Landsat 1,2, and 3
was launched in 1972, the second generation is landsat 4,5 and 7 which started since 1982. Landsat 6 failed
to reach to the orbit. All landsat generation use Thematic Mapper (TM) which is defined by Sabin, 1999 as
"optical mechanical cross-track scanner". This scanner oscillates and sweeps the field view perpendicular to
the orbit path. Then solar energy which is reflected from the earth is separated by spectrometer into
different spectral bands (Sabins, 1997, Chap.3).
Figure 1 shows reflectance ratio of various spectra for different media such as sedimentary rocks (sandstone,
limestone and shale) and vegetation. In this graph, energy wavelengths for different spectral regions
including visible spectra and Infrared (IR) spectra versus their reflectance percentage are plotted. Infrared
spectral regions which are not included in the naked eye sensitivity region are not shown.
Figure 1: reflectance ratio for different media (vegetation, sedimentary rocks) under various spectral ranges (Sabin, 1997).

5
SPOT:
SPOT images, which have been launched by a French company in 1986, collect image data through two
modes: the panchromatic (pan) mode which collects data in a single band at a green and red wavelength
covering maximum 60 by 60 km of land with a spatial resolution equal to 10 m. multispectral mode (XS)
which collect data in three bands using green, red, and IR spectra spatial resolution 10m(Sabins, 1999).
Hyperspectral imaging system:
Hyperspectral scanners are scanners that record several tens of spectral bands with wavelength 0.01 μm.
This is one of the most important advantages of this type over SPOT and landsat. It is used mainly by aircraft
based remote sensing (Sabins, 1997). Many minerals have wide range of reflectance ratios under various
spectra (Hunt, 1980). One of the well known spectrometer which uses this system is called "Airborne
Visible\Infrared Imaging Spectrometer (AVIRIS)" which scans tens of Kilometers length and 10.5 km wide.
Radar systems:
Radar is considered as an active type of remote sensing i.e: it depends on its own electromagnetic energy
source to illustrate terrain. It is able to move through clouds and rain which is important under tropical
conditions. It has a second advantage which is its ability to acquire data at low depression angle to enhance
very minor topographic features. This second advantage is useful for detecting some geological aspects such
as: faults, folds, and fractures. Radar is able also to illuminate mineral occurrences under dense
vegetation(Sabins, 1999)..
Advanced Spaceborne Thermal Emission and Reflection Radiometer data (ASTER):
It is high radiometric, spectral and spatial resolution instrument of remote sensing launched by NASA in 1999
as a result of co-operation between NASA and Japanese ministry of economic trade. It contains 3 subsystems
each of these subsystems has an observation in one electromagnetic spectrum. They are: Shortwave length
(SWIR): (6channels 1.6-2.43 μm and 30 m spatial resolution), Thermal Infra Red (TIR)(5channels 8.125-11.65
μm, with 90 m spatial resolution ), and visible\near Infra red (VNIR) (3 recording channels 0.52-0.86 μm
spatial resolution 30m). the total swath width of ASTER is 60 km it can collect more than 600 scenes daily but
discontinuously. ASTER data have many levels such as: Level-1A "unprocessed raw image data", level-
1B"resampled image data from level-1A" and level-2 which is corrected for physical parameters (Mars and
Rowan, 2010)..

6
Figure 2: reflectance ratios for various minerals in different wavelengths bands (Clark et al., 1993; modified from
Mars and Rowan, 2006).
Algorithms applied on remote sensing image:
1) Principal component analysis:
It is a statistical technique which is used for suppressing the effect undesired band effect and
enhancing desired band effect which is in our case the geologic features. This is almost done based
on what is called Eeigenvector loading. Principal component image with high to moderate loading for
absorptive and reflective bands of group of minerals having negative and positive signs enhances
these minerals scenes Singh and Harrison (1985).
2) Band Ratio Images:
Where the digital number of one band is divided by the digital number of another one. This method
is useful for certain materials or features highlighting which is not seen clearly in the raw image.
Usually the two bands selected for ratio is the highest and the lowest one Rowan et al. (1977).
3) Color Composite ratio image:
Is produced by combining three band ratio images in blue, green, and red. It is useful to delineate
two or more targets than normal ratio image. However, it has less resolution than that of the original
band ratio image Sabins (1999).

7
4) Classification image:
It is a multispectral classification which is routine for extraction of the information. In this
classification pixels are assigned into classes according to similarity between them. When the process
is done by computer it is called supervised classification but when it is done by operator, it is called
supervised classification Sabins (1999). .
5) Minimum Noise Fraction:
It is used to determine the inherent dimensionality of image data. Segregate noise in the data, and
reduce the computational requirement for processing Green et al.(1988); Boardman et al.(1995).
Digital image processing:
Most of modern systems of remote sensing record images in the form of Raster which make its processing
easy. All processing methods have been grouped by Sabins,1983 into three functional categories:
1) Image restoration: correcting errors and compensating for geometric distortions and noses. The
target is to make a restored image similar to reality. This includes: periodic line striping and line
dropouts restoring, noise filtering, geometric distortion and atmospheric scattering corrections.
2) Image enhancement: change the interpreter impact on the image. This targeted improve the
information content of image. This includes: Edge enhancement, Density slicing, contrast
enhancement, and merging dataset.
3) Information extraction: the objective here is to display several characteristics such as spectral
properties of the scene. This includes: Ratio images, principal component images, multispectral
(supervised and unsupervised) classification, and detection images changing.
Methodology & Objectives:
Many publications have been reviewed are covering different systems of Remote Sensing. Outcomes of
these systems were processed using different techniques (mentioned in the previous sections). All system
and techniques were evaluated in term of statistics (number of publications) and their quality in detecting
zones associated with mineral existence zones.

8
Literature review:
The most recent mineral exploration studies focus mainly on two different approaches of mineral
exploration:
1) Geological and fracture patterns mapping at small and large scales: many mining geologists and
mineral explorationists have recognized the significance of fracture on ore mining. Rowan and
Wetlaufer (1975) studied the relationship between ore occurrences and lineament patterns using
landsat mosaic in Nevada, they showed that mining districts are associated always with lineaments
and especially in the lineaments intersections. Nicolais (1974) made an interpretation for local
fracture patterns in Colorado. He concluded that the fracture intersection is of higher significance for
ore detection. Rwan and Bowers (1995) used Radar aircraft images and thematic mapper to for the
purpose of linear features interpreting west of Nevada, they interpreted these features to be
geologic structure dominated by mineralization.
2) Hydrothermal altered zones recognition: the spectral bands of thematic mapper are suitable for
distinguishing between different altered mineral such as alunite, clay, and iron oxides.
Spats and Wilson (1994) summarize various published remote sensing papers of 12 mining provinces
from Chile to Colombia. Knepper and Simpson (1992) discussed Thematic Mapper (TM) color ratio
composite utilized to identify hydrothermally altered minerals. 10 unpublished studies on mineral
exploration through radar and landsat were done by Singhory (1991) table(2).
As for the most recent studies been gone through, chromite bearing mineralized zone detection in
Ophiolitic massif in Oman using ASTER by (Rajendran, 2012). The study has proved the potentiality of
this method in delineating such zone as cost and time effective methods.
A review paper discussing the applicability of ASTER remote sensing method in copper and gold
mineralized zones has been by (Pour, 2012), he concluded that ASTER remote Sensing is a reliable for
mineral exploration because of their ability to detect hydrothermal altered minerals spectra. It is also
mentioned that the modern processing technologies associated with it makes it widely used
nowadays.
Rowan et al. (2003) discussed ability of ASTER data for hydrothermally altered zone mapping and
differentiating them from unaltered host rocks in Cuprite district in Nevada. They applied Matched
filtering technique (MF) to identify hydrothermally altered minerals and their surface distribution
through ASTER bands (visible\Infra red\ and Shortwave Infrared).

9
Yamaguchi and Naito, (2003) suggested number of spectral ratios using ASTER shortwave infrared
(SWIR) bands to discriminate certain lithologies and surface exposed rock types. Mars and Rowan
(2006) suggested more mineralogical and lithologic indices from all 14 bands of ASTER data.
Figure 3: Hydrothermal alteration zones associated with porphyry copper deposit, modified from Lowell and Guilbert (1970),
and Mars and Rowan (2006). (A) Schematic cross section of hydrothermal alteration mineral zones, which consist of propylitic,
phyllic, argillic, and potassic alteration zones. (B) Schematic cross section of ores associated with each alteration zone.
Ninomiya, (2003) defined mineralogical indices and vegetation indices using SWIR and VNIR ASTER
bands also TIR ASTER. These indices were applied on level- 1B ASTER in Cuprite district, Nevada in
USA, some ophiolite zones in Tibet, China and Oman and there was a strong agreement with geologic
mapping results.

10
Crosta et al, (2003) applied Principal Component Analysis on ASTER SWIR\VNIR bands for targeting
epithermal gold deposits related minerals in Los Menucos, Patagonia, Argentina. Their results
showed that PCA techniques can detailed mineralogical spectral information.
Velosky et al. (2003) used ASTER band ratio image of (4\2,4\5,5\6) to distinguish massive sulfide
mineralization in host rocks of gossan. This was done in Wadi Bidah shear zone south western Saudi
Arabia.
Xu et al. (2004) recognized many hydrothermally altered zones around epithermal gold deposits
through utilizing PCA\ band ratio image to delimit vegetation clay minerals and iron oxides.
Rowan et al. (2006) identified hydrothermal alteration zones distribution containing propylitic,
argillic, and phyllic altered zones through analysis of ASTER VNIR\SWIR bands, this study was done in
Reko Diq in Pakistan Cu-Au rich zones.
Di Tommaso and Rubinstein, (2007) used band ratio image technique to map hydrothermally altered
minerals related to Infiernllo porphyric copper deposition in San Rafale massif, south Mendoza
province in Argentine.
Yujun et al. (2007) applied PCA technique on ASTER data for detecting hydrothermally altered zone in
Oyu Tolgi Mongolion.
Table 2 summarizes some representative studies discussed remote sensing using in mineralized zones
exploration.

11
Table 2: representative studies about the role of remote sensing in ore mineral exploration (Sabin, 1997).
Case study 1: Mapping hydrothermal alterations at epithermal vein deposit – Goldfield,
Nevada:
Altered rocks presence is important indicator for possible occurrence of ore deposits. Many mines were
recognized for the first time by identifying altered rocks outcrops. Altered rocks can be delineated through
their appearances in the visible spectral ranges. Nowadays remote sensing and processing technologies of
images enable us to use other additional bands for mineral exploration. Because their distinctive reflectance
from unaltered rocks, multispectral remote sensing can be used for recognition of these bedrocks outcrops.
The goldfield mining district located in southern Nevada desert is site of test where remote sensing is utilized
for mineral exploration (Rowan et al., 1974).
This goldfield is well known for its ore richness (figure 2) producing more than 4 million ounces (130000 kg)
of gold associated with copper and silver between 1903 and 1910. The background data for this area have
been collected earlier by analyzing and mapping done by USGS (Ashley, 1979).

12
Figure 4: Map for geology and various hydrothermal alteration zones of goldfield district in Nevada (Ashley, 1979).
Volcanisms in this area have taken place within two periods. The first one began in Oligocene epoch with
rhyolite and quartz latite eruptions. This resulted in ring fractures and caldera formation. Ore deposition and
hydrothermal alteration happened during the second eruption period (Miocene epoch). This was associated
with andesite and dacite flows which host ore deposits were extruded. High temperature related to these
volcanism cause acidic hot hydrothermal solutions circulations between the rocks. This flow of fluids is
concentrated mainly in fractured zones within the ring fracture. This area was then covered by later volcanic
and then been eroded and outcropped in the surface. In the map of figure 4 the cross hatched area
represents the altered rocks and the blank area is unaltered rocks. 40 km2 of the area is covered mainly by
altered rocks but only 2 km2 consists of significant minerals represented by black circles. This area is
extensively fractured and closely space faulted. The host rock is characterized by clay minerals (illite,
Kaolinite, and montmorillonite). The highly altered rocks are the veins of alunite and quartz. The pyrite
deposited within the host rock is weathered to iron oxides. Therefore, this mineral assemblage characterized
altered zone contains: alunite and clay mineral assemblage and iron oxides mineral are called argillic zone
(Harvey and Vitaliano, 1964).
Recognition of hydrothermal alteration using landsat image: Figure 4 is color image of thematic
mapper bands 1-2-3 illustrated in blue, green, and red respectively. The yellow patch northeast of goldfield
is caused mainly by mine waste dumps and changed the mineralized area. A white patch north of the field is

13
dry tailing pond of the abandoned channel mill, where gold was treated by separating gold from host rocks.
This area is useful to be used as a reference standard because it consists of altered rocks concentration. The
black zones in the image margins represent younger volcanic rocks than ore deposits. Volcanic tuffs are
represented outcrops are represented by distinctive blue colors in the south east part.
Figure 5: enhanced normal color image of thematic mapper 1-2-3 bands represented by blue, green, and red (Sabins, 1999).
1) Alunite\ clay mineral using 5\7 ratio imaging:
Figure 4 shows reflectance spectra percentages of various hydrothermal minerals assemblages: alunite and
clay minerals. These minerals have distinguished absorption properties (reflectance minima) at band 7, and
other distinctive maxima (high reflectance values) in band 5.
Figure 6: reflectance ratio for various clay minerals and alunite (Sabin, 1997).
These spectral differences can be quantified and emphasized by ratio image. A TM image contains of pixels
(picture elements) they represents 30 by 30 m resolution cell. For each band, digital numbers (DN's) are
recorded on 8 bit scale from 0 to 255. Ratio image is then can be done through dividing one band value by
the another band. Table 3 illustrates how to prepare 5\7 ratio image. From the table we can notice that both
14
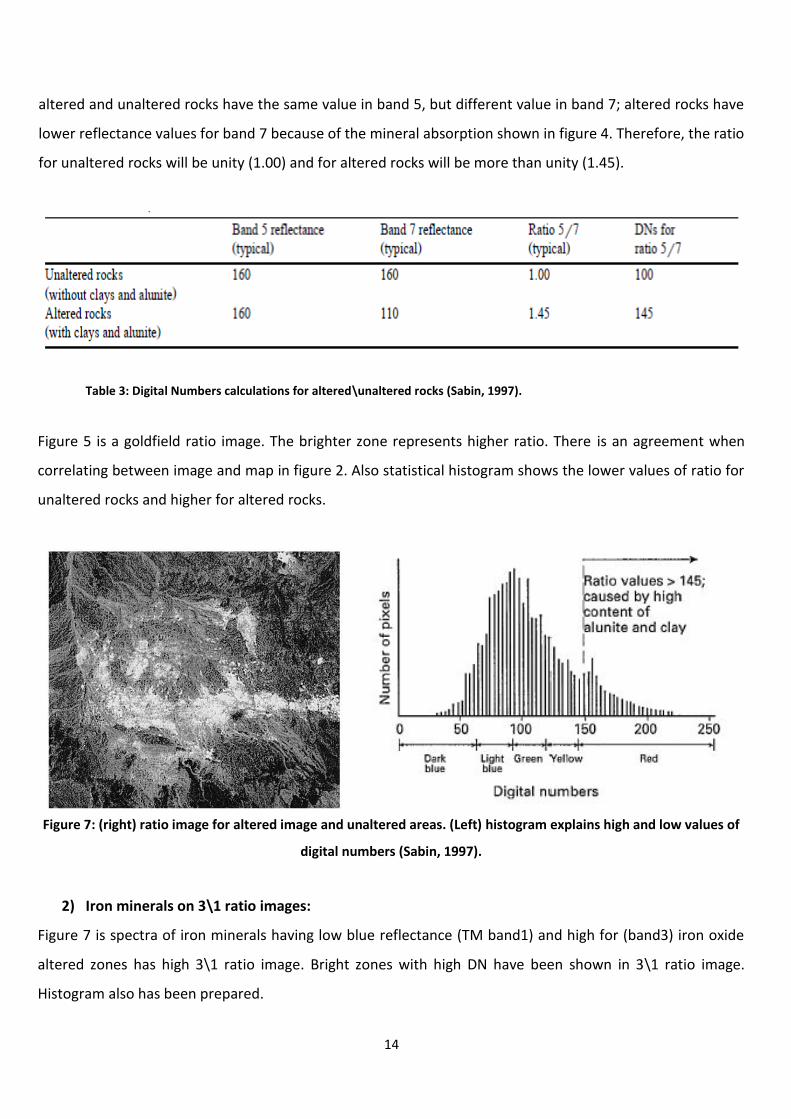
altered and unaltered rocks have the same value in band 5, but different value in band 7; altered rocks have
lower reflectance values for band 7 because of the mineral absorption shown in figure 4. Therefore, the ratio
for unaltered rocks will be unity (1.00) and for altered rocks will be more than unity (1.45).
Table 3: Digital Numbers calculations for altered\unaltered rocks (Sabin, 1997).
Figure 5 is a goldfield ratio image. The brighter zone represents higher ratio. There is an agreement when
correlating between image and map in figure 2. Also statistical histogram shows the lower values of ratio for
unaltered rocks and higher for altered rocks.
Figure 7: (right) ratio image for altered image and unaltered areas. (Left) histogram explains high and low values of
digital numbers (Sabin, 1997).
2) Iron minerals on 3\1 ratio images:
Figure 7 is spectra of iron minerals having low blue reflectance (TM band1) and high for (band3) iron oxide
altered zones has high 3\1 ratio image. Bright zones with high DN have been shown in 3\1 ratio image.
Histogram also has been prepared.

15
Figure 8: reflectance ratio for various iron oxides minerals (Sabin, 1997).
Figure 9: (left) ratio image 3\1 for iron oxides. (right) histogram for number of pixels with digital numbers (Sabin,
1997)..
Color composite ratio images:
They are produced by compiling three ratio images 3\1, 3\5, 5\7 in green, red, and blue. The yellow and
orange mark the inner and outer areas of altered minerals. This image combines the distributions of both
hydrothermal clays and iron minerals. However, it does ’t provide disti ctive color patter for each i eral.

16
Figure 10: color composite ratio for hydrothermal altered zones (Sabin, 1997).
Figure 9 is a color density slice version defined as the color scale replacing gray scale in ratio image, here we
have density slice for both 3\1 "for iron" and 5\7 "for alunite and clay mineral". Highest values (more than
145) in red.,(125-145) yellow. Therefore, they both are well correlated with altered zones.
Figure 11: color composite ratio for hydrothermal altered zones (Sabin, 1997).
Classification images:
It is a computerized process to extract information which attribute pixels into various classes on the basis of
similarity between different spectral characteristics. It is divided into supervised multispectral classification

17
in which the operator is responsible for classes specification, and unsupervised in which the computer is
responsible for this process (Sabins, 1997). In the study, unsupervised classification has been applied , and 6
classes has been done shown in figure 10.
Figure 12: thematic mapper unsupervised classification (Sabin, 1997)..

18
Case study 2: Integrating geologic and satellite imagery data for high-resolution mapping
and gold exploration targets in the South Eastern Desert, Egypt:
In geological point of view the area is composed of nearly 3 or 4 groups of rock types figure (12) and heavily
structured and tectonized. In this study, level 1-B ASTER VNIR and SWIR data were collected on
March.15,2008. Then it has been processed by using ENVI V.4.5 software (ITT visual information solutions)
band ratioing, principal Component analysis, and color composite techniques have been used to map
lithology, structures, and alteration zones within study area.
Figure 13: geological\structural elements in Alfawi and Egat mines (Pours,2012)
Band ratio images:
Band ratio of TM 5\7,5\4 ,and 3\1 in RGB images were created to detect hydrous minerals (Crosta and
Moores, 1989) clay has a high absorption in SWIR ASTER in band 5 and 6, whereas carbonate has absorption
in band 8 also Mg-OH\Fe-OH rich minerals such as amphibolites, chlorite, and talc.
In band ratio images of 5\7 and 4\7 serpentinite and talc carbonate schist has bright signature. More
carbonatized zone has more darker signature.
In band ratio image TM 3\1 and ASTER 2\4, granitoid rocks can be distinguished from amphibolites by
having more bright color.
Gabbro- diorite can be recognized in 4\5 band ratio image in the southern corner by dark gray
signature and other types have different appearance. Thrust structures within talc\serpentinite are
shown in bright color.

19
Granitoid intrusions can be known here by bright signature and other lithology groups can be
presented by dark gray to black.
Figure 14: principal component analysis for different band ratios (Pours,2012)
Principal Compnent analysis:
Principal Component Analysis CPA have been done and outputs have been presented in table ( ).
PC1 image: for ASTER and TM are all positive weightings. So overall scenes will be bright.
PC2 in TM has large difference in between band 1-4 " in which we have high positive values and band
5-7". In band1 we have very high Eeignvector value (0.442) "reflectance" and very high negative
loading for band 7 (-0.609). OH-bearing minerals which have high reflectance in band 1 and very high
absorption in band 7 can be presented in PC2 where hydrothermally altered zone are bright pixels in
PC.
PC3 TM has high +ve loading for band 1 (0.588) and high –ve loading for band 4 (-0.617) and high –ve
loading in band 3 (-0.301). Iron stained\rich rocks are characterized by high absorption of band 1 and
high reflectance in band 4 and 3. Fe rich rocks "basic\ultrabasic" can be presented in bright were
granitoids "silica rich" can be presented as bright color in PC3.
PC4 has high +ve loading for band 5 and –ve loading for band 7. This can be applied for hydrous
bearing minerals that have high reflectance in band 5 and high absorption in band 7.

20
Table 4: Eignvector values for ASTER and TM bands (Pours,2012).
PC3 ASTER high +ve loading in band 4 and –ve in band 2. Iron rich rocks again can be distinguished by
bright colors. However, serpentinite\talc schist can be seen in dark gray and black respectively.
Hydrous rocks (altered rocks) can be identified in more details using PC5 and PC6. Al-OH can be
distinguished from Fe or Mg-OH.
PC6 enable to differentiate between granitoid (dark) from gabbroid rocks (bright).
Figure 15: principal component analysis for different band ratios (Pours,2012)

21
Color composite ratio images derived from band ratio image can easily identify lithology and hydrothermally
altered zones. Images derived from principal component analysis can identify heavily structured or
deformed areas.
Figure 16:RGB false color composite images for various band ratio image and principal component analysis
(Pours,2012)
Discussion and Conclusion:
1. All systems of remote sensing have been used starting from landsat, SPOT, hyperspectral, and
ASTER.
2. It is noticed that with time ASTER system became the more common used system and
nowadays the number of publications which use ASTER exceeds that use other systems.
3. The use of ASTER system in mineral exploration is the most common because of the following
reasons:
The possibility of applying many processing techniques such as Principal Component Analysis ,
band ratio, and composite color.

22
Spectral properties of ASTER because ASTER has a great sensitivity for hydrothermal altered
zones.
Broad terrain coverage 60*60 m which is beneficial for regional mapping.
Cost effective method.
4. Processing techniques are thought to be useful for enhancing raw images and to suppress
area that is favorable to host mineral deposits such as: hydrothermally altered zones,
intensively fractured areas, and rock types that hosts mineral occurrences:
Ratio image method is valuable for hydrothermally altered zone identification i.e:
zones expected to host mineral deposits, and to limited extent, they can recognize
mineralization related fractures\lineaments.
More than one band ratio image can be collected in only one composite ratio image,
so more than one rock type can be seen in it.
Principal Component Analysis gives more details than the previous types about rock
types covering the area.
All algorithms are complementing and integrating each other to have a complete
picture.

23
References:
Abdeen, M.M., Abdelghaffar, A.A., 2011. Syn- and post-accretionary structures in the Neoproterozoic Central Allaqi-
Heiani suture zone. Southeastern Egypt. Precambrian Research 185 (3–4), 95–108.
Abdelsalam, M., Stern, R., 2000. Mapping gossans in arid regions with landsat TM and SIR-C images, the Beddaho
Alteration Zone in northern Eritrea. Journal of African Earth Sciences 30 (4), 903–916.
Aboelkhair, H., Yoshiki, N., Yasushi, W., Isao, SIsao, S., 2010. Processing and interpretation of ASTER TIR data for
mapping of rare-metal-enriched albite granitoids in the Central Eastern Desert of Egypt. Journal of African Earth
Sciences 58 (1), 141–151.
Abrams,
Ashley, R.P., 1974. Goldfield mining district. Nevada Bureau of Mines and Geology Report 19, 49–66.
Ashley, R.P., 1979. Relation between volcanism and ore deposition at Goldfield, Nevada. Nevada Bureau of Mines and
Geology Report 33, 77–86.
Brown, M.A., 1982. Chromite Deposits and Their Ultramafic Host Rocks in the Oman Ophiolite. Ph.D. thesis, Open
Univ., Milton Keynes, U.K.
Bucher, J., Kurz, D., Peters, T.J., Stoessel, F., Ziegler, U., 1988. The metamorphics below the Semail nappe in the
northern Oman Mountains. The Geology and Tectonics of the Oman Region; A discussion meeting. Edinburgh, p. 12.
Abstracts.
Crósta, A.P., Filho, C.R.S., 2003. Searching for gold with ASTER. Earth Obs. Mag. 12 (5), 38–41.
Eiswerth, B.A., Rowan, L.C., 1993. Analyses of Landsat thematic mapper images of study areas located in western
Bolivia, northern Chile, and southern Peru: Investigation de Metales Preciosos en El Complejo Volcanico Neogeno-
Cuaternario de Los Andes Centrales, U.S. Geol. Surv. Projecto BIDrTC-88-02-32-5, pp. 19–44.
Di Tommaso, I., Rubinstein, N., 2007. Hydrothermal alteration mapping using ASTER data in the Infiernillo porphyry
deposit, Argentina. Ore Geol. Rev. 32, 275–290.
Dilles, J.H., Einaudi, M.T., 1992. Wall-rock alteration and hydrothermal flow paths about the Ann-Mason porphyry
copper deposit, Nevada-a 6-km vertical reconstruction. Econ. Geol. 87, 1963–2001.
Green, R.O. et al., 1998. Imaging spectroscopy and the airborne visiblerinfrared imaging spectrometer _AVIRIS..
Remote Sensing of The Environment 65, 227–248.
Griffiths, P.S., Curtis, P.A.S., Fadul, S.E.A., Scholes, P.D., 1987.Reconnaissance geological mapping and mineral
exploration in northern Sudan using satellite remote sensing. Geol. J. 22, 225–249.
Klitzsch, E., List, F.K., Pohlmann, G. Geological map of Egypt Quseir sheet. Scale 1:500,000, in: T. E. G. P.
Corporation/Conoco (Editor),Cairo, Egypt, 1987.
Murphy, R.J., 1995. Mapping of jasperoid in the Cedar Mountains, Utah, U.S.A., using imaging spectrometer data. Int.
J. Remote Sensing 16, 1021–1041.
Nicolais, S.M., 1974. Mineral exploration with ERTS imagery: Third ERTS-1 Symposium, NASA SP-351, Vol. 1, pp. 785–796.

24
Ninomiya, Y. A stabilized vegetation index and several mineralogic indices defined for ASTER VNIR and SWIR data, in:
Proceedings of IEEE, International Geosciences and Remote Sensing Symposium (IGARSS), vol. 3, pp. 1552–1554, 2003.
Pour, B.A., Hashim, M., 2011. Spectral transformation of ASTER data and the discrimination of hydrothermal alteration
minerals in a semi-arid region, SE Iran. Int. J. Phys. Sci. 6 (8), 2037–2059.
Pour, B.A., Hashim, M., Marghany, M., 2011. Using spectral mapping techniques on short wave infrared bands of
ASTER remote sensing data for alteration mineralmapping in SE Iran. Int. J. Phys. Sci. 6 (4), 917–929.
Rowan, L.C., Trautwien, C.A., Purdy, T.L., 1991. Maps showing association of linear features and metallic mines and
prospects, Butte, Montana. USGS Misc. Invest. Ser. Map.
Sabins, F.F., 1999. Remote sensing for mineral exploration. Ore Geol. Rev. 14, 157–183.
Sabins, F.F., 1983. Geologic interpretation of Space Shuttle images of Indonesia. Am. Assoc. Pet. Geol. Bull. 67, 2076–2099.
Sabins, F.F., 1997. Remote Sensing — Principles and Interpretation, 3rd edn., W.H. Freeman, New York, NY., 494 pp.
Sabins, F.F., Miller, R.M., 1994. Resource assessment — Salar de Uyuni and vicinity. Proceedings of Tenth Thematic
Conference on Geologic Remote Sensing. Environmental ResearchInstitute of Michigan, Ann Arbor, MI, pp. I92–I103.
Singhroy, V.H. _Ed.., 1991. Geological remote sensing in Canada.Can. J. Remote Sensing, 17, 71–200.
Spatz, D.M., Wilson, R.T., 1994. Exploration remote sensing for porphyry copper deposits, western America Cordillera.
ProceedingsTenth Thematic Conference on Geologic Remote Sensing. Environmental Research Institute of Michigan,
Ann Arbor, MI, pp. 1227–1240.
Volesky, J.C., Stern, R.J., Abdelsalam, M.G., submitted for publication. Mineral exploration using ASTER and Landsat
ETM+ data, Wadi Bidah Mineral District, Saudi Arabia.Photogrammetric Eng. Remote Sensing .
Xu, Y., Qizhong, L., Yun, S., Lu, W., 2004. Extraction mechanism of alteration zones using ASTER imagery. Geosciences
and Remote Sensing Symposium, IGARSS 04, Proceeding 2004 IEEE International, 6, pp. 4174–4175.
Watson, K., Kruse, F.A., Hummer-Miller, S., 1990. Thermal infrared exploration in the Carlin trend, northern Nevada.
Geophysics 55, 70–79.
Yost, E., Wenderoth, S., 1971. The reflectance spectra of mineralized trees. Proceedings of Seventh International
Symposium on Remote Sensing of Environment, Vol. 1, University ofMichigan, Ann Arbor, MI, pp. 269–284.
Ziab, A.M., Ramsay, C.R., 1986. Geologic Map of the Turabah Quadrangle, Sheet 21E. Directorate General of Mineral
Resources, Ministry of Petroleum and Mineral Resources, Jeddah, Saudi Arabia.