techniques for epigenetic analysis - harvard university · techniques for epigenetic analysis how...
TRANSCRIPT

Techniques for epigenetic analysisHow to apply them to human and
epidemiology studies
Andrea Baccarelli, MD, PhD, MPHLaboratory of Environmental Epigenetics
Harvard School of Public Health

microRNAs(snRNAs)Small non coding RNAs that cause mRNA degradation or impair translation into protein
DNA methylationMethyl marks added to certain DNA bases repress gene activity
Histone modificationsA combination of different molecules can attach to the ‘tails’ of proteins called histones. These alter the activity of the DNA wrapped around them
How to detect epigenetic marks?

DNA methylation & histonemodification analysis• Molecular biology: largely related to genetics
– methods that analyze the DNA sequence
• Epigenetic marks: do not modify the underlying DNA sequence
• Workarounds:– Bisulfite treatment– Antibody‐based methods (or alternatively methyl‐binding proteins)

Bisulfite treatment Antibodies
Modifies non methylatedcytosines
Bind modified or methylated cytosines, modified histones Workaround
DNA methylation
Differentiation of methylated and non methylated cytosines
DNA enriched with the mark of interest (Ab specificity)
Histone modifications
Analysis
Any method that can analyze sequence
Any method that can quantify enrichment

• DNA Methylation• Gene‐specific analysis
– How much methylation at or nearby a candidate gene
• Global methylation content– How much methylation in a test DNA, regardless of the position
• Genome‐wide scans– Microarrays, Next Generation Sequencing
• Histone Modifications• Gene‐specific analysis• Global modification content• Genome‐wide scans
Some Lab Nomenclature

Bisulfite modification of DNA
• Prior to PCR, DNA is treated with sodium bisulfite
• Non‐methylated C is permanently modified to U
• In PCR, U and T are equivalent

DNA methylation methods
• DNA Methylation Techniques– Gene‐specific analysis
• Qualitative• Quantitative
– Global methylation content• How much methylation in a test DNA, regardless of the position
– High‐coverage methods• Genome‐wide scans, Arrays

Gene‐Specific AnalysisWorkflow for DNA methylation analysisby bisulfite‐pyrosequencing
Biospecimen
DNA isolation
Bisulfite treatment
PCR amplification
Data analysis
methylated C
(methylated C) +(unmethylated C)×100%
Abbreviations: %5mC, percentage of 5-methylcytosine; C, cytosines
%5mC =
Pyrosequencing

Pyrosequencing
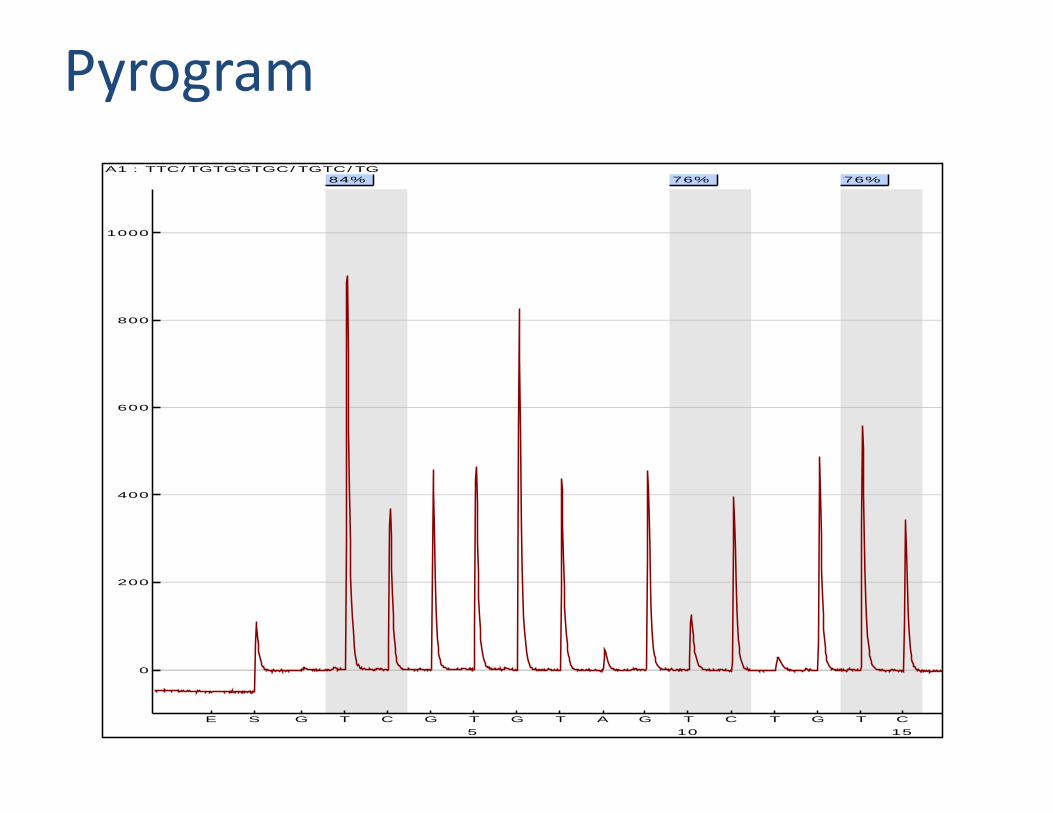
Pyrogram84% 76% 76%
EE SS GG TT CC GG TT
5
GG TT AA GG TT
10
CC TT GG TT CC
15
0
200
400
600
800
1000
A1 : TTC/TGTGGTGC/TGTC/TG

Pyrosequencing analysis
• Provides overview of the the methylation pattern
• Allows for the measurement of the methylation percentage of individual CpG dinucletodes
• Flexibility in sequencing primer position to analyze any CpG sites you like

Pyrosequencing & other methods• Pyrosequencing
– Pro: Highly quantitative, single site resolution– Cons: dedicated equipment
• Methylation Specific PCR– Pro: inexpensive and easy to perform– Cons: qualitative/semiquantitative, no single site resolution
• Real‐time PCR– Pro: equipment easily accessible– Cons: low precision, no single site resolution
• Maldi‐TOF (SequenomMass Array)– Pro: Quantitative, single site resolution, extended sequence (amplicon)
– Cons: dedicated equipment (high costs), high costs/gene

DNA Methylation Content

Figure 7.13 Genomes 3 (© Garland Science 2007)

Global Methylation
• Most methylation in repeated elements:– LINE‐1 elements: >500K/haploid genome – Alu elements: >1,100K/haploid genome
• LINE‐1/Alu methylation is correlated with global content (Weisenberger, 2005)
• Function of repeated elements?:– Chromosomal structure– Repeat sequence transcription– miRNA

How to confuse one reader’s mind
• Global DNA methylation• Genomic methylation content• Genome‐wide methylation content• Genome‐wide methylation• Global cell methylation

Lower Global Methylation• Tissue DNA
– Cancer (Feinberg & Vogelstein, 1982)– Atherosclerotic lesions (Hiltunen, 2002)
• Blood DNA– Cancer (Hsiung, 2007)– Cardiovascular Disease (Castro, 2003)– Folate deficiency (Choi, 2005)– Inflammatory states (Stenvinkel, 2007)– Aging (Fuke 2004)– Environmental Exposures (Chanda 2005, Bollati 2007, Rusiecki 2008, Baccarelli, 2009)
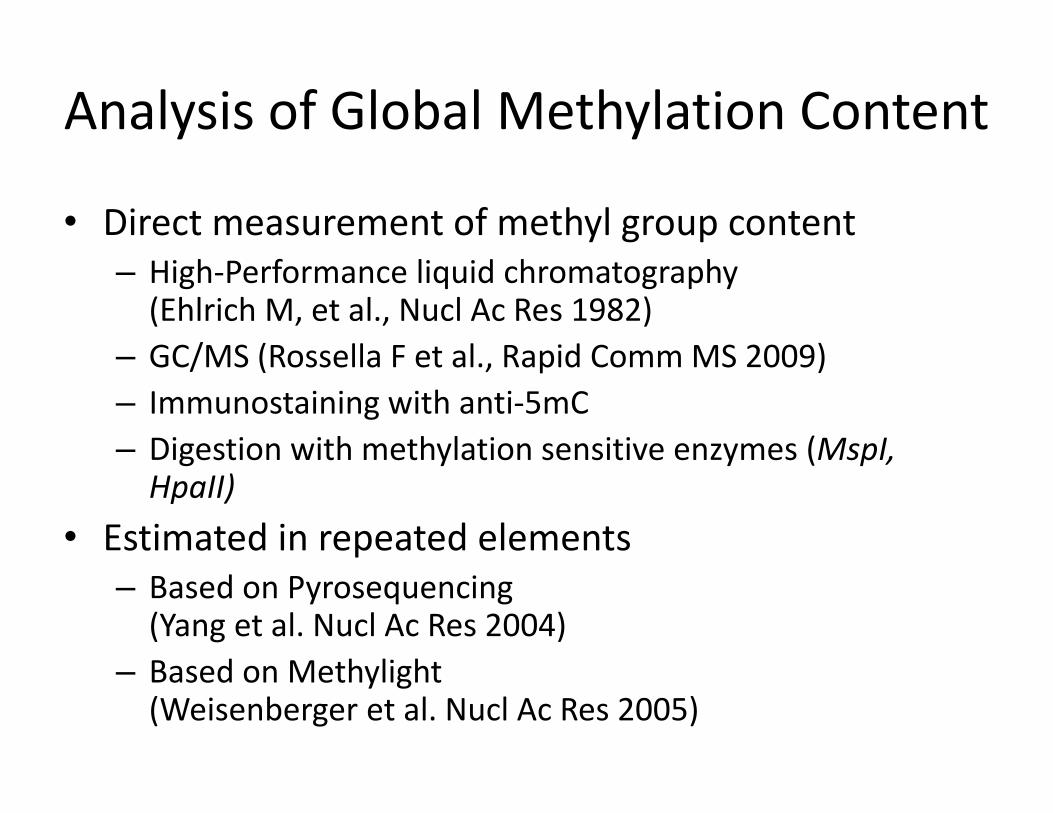
Analysis of Global Methylation Content
• Direct measurement of methyl group content– High‐Performance liquid chromatography (Ehlrich M, et al., Nucl Ac Res 1982)
– GC/MS (Rossella F et al., Rapid CommMS 2009)– Immunostaining with anti‐5mC– Digestion with methylation sensitive enzymes (MspI, HpaII)
• Estimated in repeated elements– Based on Pyrosequencing(Yang et al. Nucl Ac Res 2004)
– Based on Methylight(Weisenberger et al. Nucl Ac Res 2005)

Retrotransposons• Transposition: Movement of
gene from one chromosome to another or movement from one site to another; does not require homology
• Transposons: mobile genetic elements that enable genes to move between non‐similar sites
• Retrotransposition: Creates genetic diversity
• Retrotransposons: Replicate and move to other sites on DNA through an RNA intermediate
Retrotransposon mRNA
Retrotransposon DNA
Retrotransposon
RNA polymerase
Reverse transcriptase
Integration Protein
Original Retrotransposon
Duplicated retrotransposon

What do we measure in repeated elements
• A few CpG sites in a specific repeated element sequence• The sequence (and the CpG sites therein) are repeated
throughout one single haploid genome:– LINE‐1 elements: >500K/haploid genome– Alu elements: >1,100K/haploid genome – The LINE‐1 and Alu assays measure the %mC in those repeated
elements, with no distiction about their position in the genome
• Correlation with global content demonstrated only in studies including cancer tissues– A marker of global methylation only for cancer tissues?
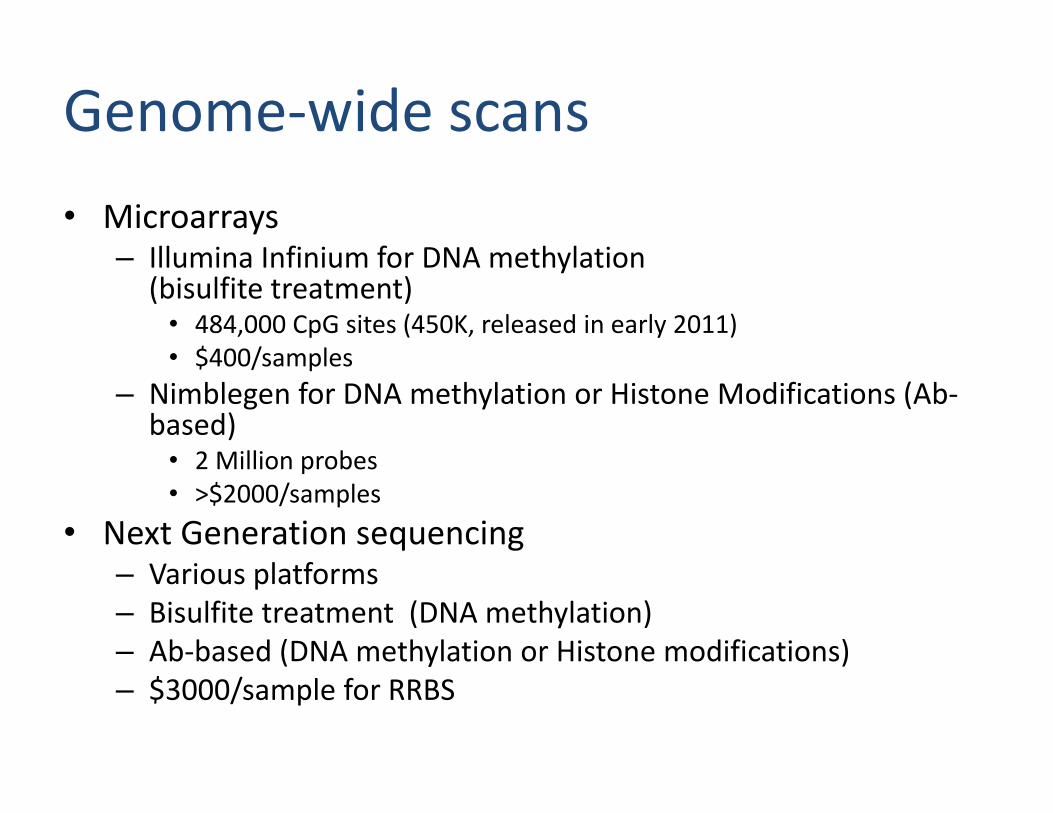
Genome‐wide scans• Microarrays
– Illumina Infinium for DNA methylation (bisulfite treatment)
• 484,000 CpG sites (450K, released in early 2011)• $400/samples
– Nimblegen for DNA methylation or Histone Modifications (Ab‐based)
• 2 Million probes• >$2000/samples
• Next Generation sequencing– Various platforms– Bisulfite treatment (DNA methylation)– Ab‐based (DNA methylation or Histone modifications)– $3000/sample for RRBS

Region Type Regions CpG sites covered on 450K BeadChip array
Average # of CpG sites per region
CpG Island 26,153 139,265 5.08N Shore 25,770 73,508 2.74S Shore 25,614 71,119 2.66N Shelf 23,896 49,093 1.97S Shelf 23,968 48,524 1.94
Remote/Unassigned - 104,926 -Total 485,553
CpG shelves, shores & islands classification (UCSC CpGi annotation)
5’ UTR 3’ UTRTSS1500 TSS200
N Shelf N Shore S Shore S ShelfCpG Island
The 450K BeadChip covers a total of 77,537 CpG Islands and CpG Shores (N+S)
Illumina 450K BeadChip Coverage

NGS vs Infinium HM27
Bock et al., Nat Genet 2010
Infinium: less expensive, most accurate (together with RRBS), easiest for bioinformatic analysis

Ammerpohl O et al. Biochim Biophys Acta. 2009 Sep;1790(9):847‐62.
MSP: Methylation>25% generated positive results

Histone Modification Analysis
• Step 1:– Histone Purification & Isolation
• Step 2:– Histone Analsyis (Several Methods)
• ELISA (Enzyme‐Linked ImmunoSorbent Assay)• ChIP (Chromatin ImmunoPrecipitation)

Types of measure• ELISA
– Global genomic content of a certain modification:
• ChIP qPCR– Gene specific measure of a certain modification next to a specific gene
• ChIP‐on‐chip– Gene specific measure of a certain modification next to many specific gene at the same time

Examples• ELISA
• Histone: H3 • Modification: Di‐Methyl‐Histone • Position: Lys4 (K4)
• ChIP qPCR• Histone: H3 • Modification: Di‐Methyl‐Histone • Position: Lys4 (K4)• Gene: p15
• ChIP‐on‐chip• Histone: H3 • Modification: Di‐Methyl‐Histone • Position: Lys4 (K4)• Genes: all the genes spotted on the chip

ChIP qPCR
Cells isolated nuclei
Sonicate
Immunoprecipitate
Reverse crosslink
Formaldeide Cross Link
Purify DNA
qPCR
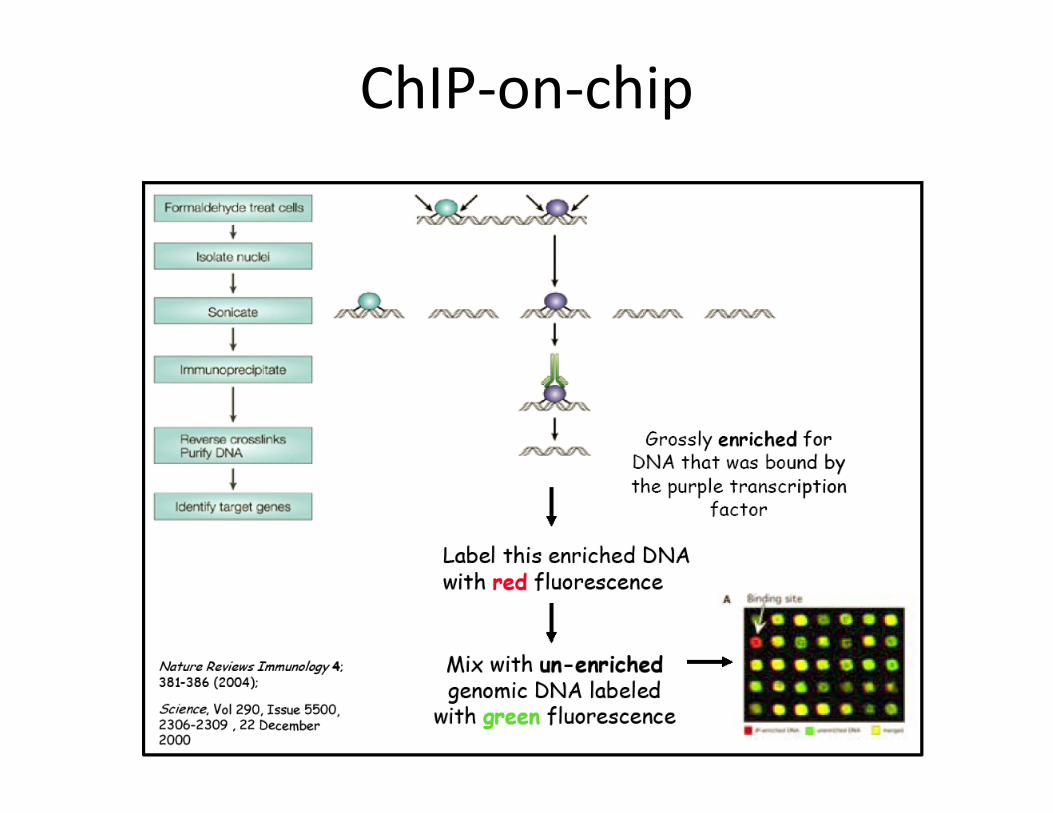
ChIP‐on‐chip

He and Hannon, 2004
MiRNA biogenesis and mechanisms of action

miRNA analysis
• Sample collection and processing– Same methods as for mRNA– Isolation of total RNA
• Methods– Candidate miRNAs: Real Time PCR– Microarrays– nCounter Nanostring Analysis– Deep Sequencing
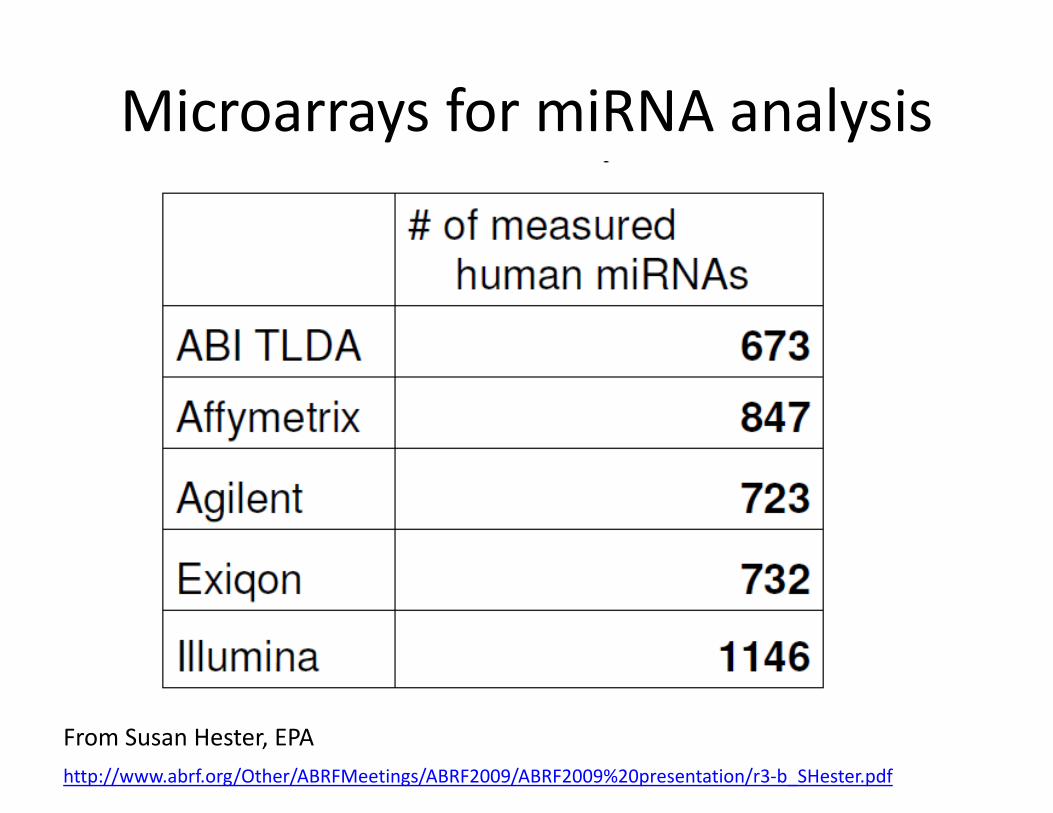
Microarrays for miRNA analysis
From Susan Hester, EPAhttp://www.abrf.org/Other/ABRFMeetings/ABRF2009/ABRF2009%20presentation/r3‐b_SHester.pdf

Nanostring nCounter
• Digital counting technology
• Allows for measuring more than 700 miRNAs
• Moderate operating costs
• No need for PCR amplyfication
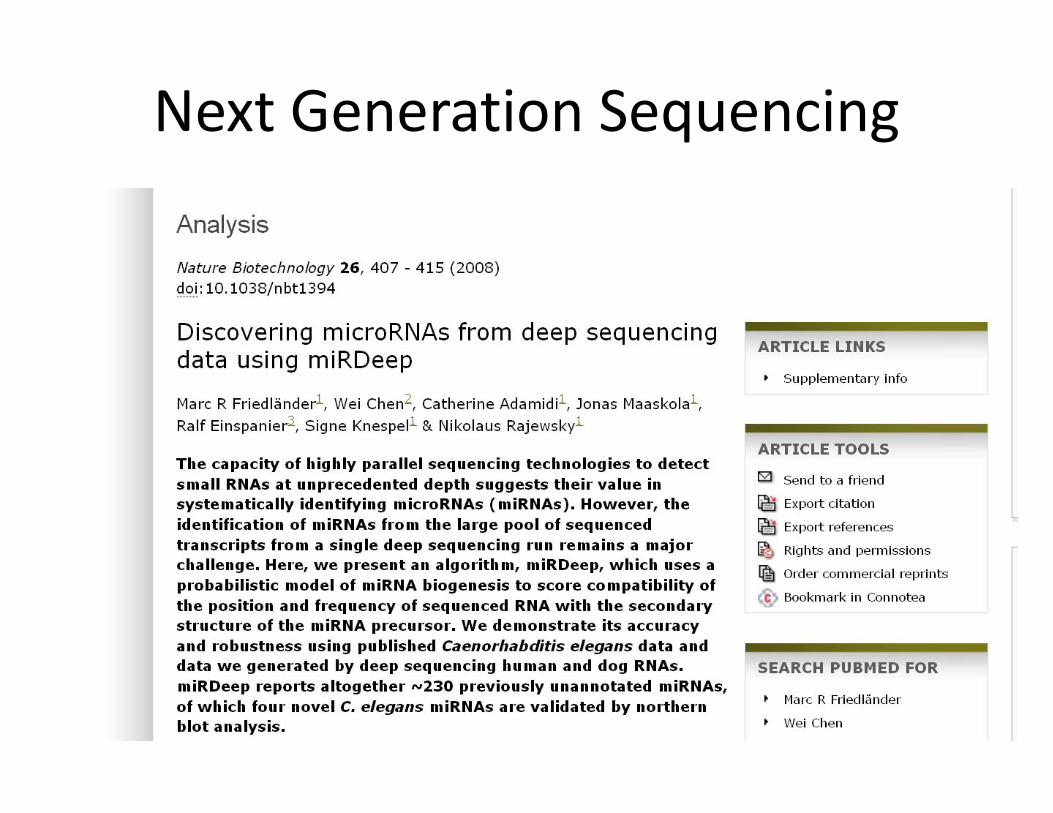
Next Generation Sequencing

Questions related to study design
• Which tissue can I use?• How stable are the epigenetic marks within‐subject over time?
• Data analysis:– Cell type effects– Confounders

Human Studies: Which Tissue?
• Target tissues– Cancer tissues are easy to obtain
• They do not necessarily reflect pre‐disease status• FFPE are not easy to work with
– For some disease we can get at least close• Bladder cancer → Cells in urine sediments• Leukemias →White blood cells (benzene effects in Bollati et al Cancer Res 2007)

Non‐Target Tissues
• How about psychiatric diseases?– Embryo layer approach
(Neuroectoderma→buccal; good only for in‐utero exposure?)
– Uniform effects approach: Do exposures modify epigenetic marks in the same way across all tissues?
• Problem 1: Epigenetic marks are tissue specific• Problem 2: Distribution of pollutants: different doses in different tissues (e.g., particulate matter)
– Highest dose/first target approach• Inhalable pollutants → nasal mucosa• Pollutants in food and water/smoking→ buccal cells

A Practical Starting Point
• Existing cohort/studies have collected:– Blood/buffy coat– Buccal cells– Urine
• Storage– Many studies extracted DNA and have no more cells available
• Questions:– Can we use them?– Which information can we get?

How we have been using WBCs
• Requirement 1: The gene is expressed in WBCs (http://www.ncbi.nlm.nih.gov/IEB/Research/Acembly/ )
• Requirement 2: The gene has a function in WBCs that is related with:– Mechanisms of action of the exposure– Disease of interest
(http://www.ncbi.nlm.nih.gov/omim/)
• E.g.: Particulate matter→ iNOS→Cardiovascular disease (Tarantini et al. Environ Health Perspectiv 2009)

WBC Methylation in Epidemiology
• When analyzing data, which are the confounders we need to control for?
• What do we know about determinants of DNA methylation in human populations?
• To address this question:– Pooled analysis of 1,465 subjects from five investigations
– In all the investigations: DNA methylation analysis of LINE‐1 and Alu

Pooled Analysis Data
Study #1 Study #2 Study #3 Study #4 Study #5 All studies
Boston, USA
Warsaw, Poland
Milan, Italy
Brescia, Italy
Trissino, Italy n=1,465
Alu, 5%mC(SD)
26.3 (1.1)
25.1 (1.4)
27.1 (3.4)
25.8 (0.7)
24.9 (1.0)
26.0 (1.8)
LINE-1, 5%mC(SD)
76.9 (2.0)
80.2 (3.2)
71.7 (5.9)
78.8 (1.0)
78.7 (3.2)
76.2 (6.2)
Zhu et al., Int J Epidemiology 2012

Blood Count and Methylation
Alu LINE-1Beta * P-value * Beta * P-value *
White blood cells, 103cell/mm3 0.002 0.938 0.078 0.168Neutrophils, % 0.009 0.226 0.036 0.005Lymphocytes, % -0.009 0.246 -0.039 0.004Monocytes, % -0.001 0.981 -0.033 0.374Eosinophils, % -0.014 0.643 0.007 0.888Basophils, % 0.005 0.968 -0.202 0.399* Adjusted for age, gender and study.
Zhu et al., Int J Epidemiology 2012

Age, gender, alcohol
a Adjusted for age, gender and study.b Beta and P‐value for age were obtained using continuous variables.
Alu LINE-1 Variable No. %5mCa 95% CIa Betaa P-valuea No. %5mCa 95% CIa Betaa P-valuea
Age, years <48 285 26.2 25.9, 26.5 264 77.4 76.8, 77.9 48-63 279 26.0 25.8, 26.2 271 77.5 77.1, 77.9 64-69 314 26.0 25.8, 26.2 307 77.2 76.8, 77.6 70-74 267 25.9 25.7, 26.1 263 77.1 76.7, 77.5 ≥75 320 25.9 25.7, 26.1 -0.012b 0.019b 313 77.1 76.7, 77.5 -0.003b 0.780b
Gender Female 206 26.3 26.0, 26.6 202 76.5 76.0, 77.0 Male 1,238 25.9 25.8, 26.0 -0.361 0.012 1,216 77.4 77.2, 77.5 0.874 0.001
Alcohol drinking Nondrinker 609 26.1 26.0, 26.3 604 77.2 76.9, 77.4 Ever-drinker 717 25.9 25.8, 26.0 -0.208 0.043 700 77.1 76.9, 77.3 -0.049 0.798
Zhu et al., Int J Epidemiology 2012

Summary of pooled analysis
• Alu and/or LINE‐1 methylation associated with:– WBC differential– Age– Gender– Alcohol
• It may not apply to gene specific methylation• Need to adjust for WBC differential

How stable is blood methylation? Variability between Day 1 and 4
APCCDH13
eNOS
ET-1
hTERT
IFNγ
IL6iNOS
p16
p53
RASSF1A
TNFα
Alu
LINE-1
0.00
2.00
4.00
6.00
8.00
10.00
12.00
0 5 10 15 20 25
with
in‐in
dividu
al variability
between‐individual variability (σID)
Byun HM et al, under review

Examples of variability
Byun HM et al, under review

Determinants of variability
Byun HM et al, under review

Mela Valley Asthma Study(Sicily, Italy)
• DNA from nasal swab in 38 third graders with asthma symptoms
• Lung function testing and exhaled nitric oxide measures

Airway inflammation and DNA methylation• Interleukine‐6 (IL‐6) expression:
– Associated with reduced DNA methylation of the gene promoter– Associated with reduced forced expiratory volume in 1 second
(FEV1) in asthma patients
• Inducible Nitric Oxide Synthase (iNOS) expression:– Associated with reduced DNA methylation of the gene promoter– increased NO production in the airway epithelium– NO production in asthma can be non‐invasively measured as
Fractional exhaled Nitric Oxide (FeNO).

Piko FEV‐1(obstruction)
FeNO(inflammation)

p=0.001
iNOS Methylation in Nasal EpithelialCells & Exhaled Nitric Oxide
30 40 50 60 70 80
2
3
4
5
6
iNOS promoter methylation (%5mC)
Exhaled Nitric Oxide
(log
scale)
Baccarelli et al. under review

p=0.003
IL‐6 Methylation in Nasal EpithelialCells vs. Lung Function
20 40 60 80 1001
2
3
4
IL‐6 promoter methylation (%5mC)
FEV‐1 (lo
g scale)
Baccarelli et al. under review

y
w
v
x
m
l
b
1. 3.2.iNOS
methylation
LINE‐1methylation
Alumethylation
FeNO
IL‐6methylation
FEV1
wheezing
Graphical Chain Modeling
an IQR decrease in IL‐6methylation:OR= 2.5 (90% CI 1.1‐5.9, p=0.076) for wheezing

Conclusions• Different methods for different questions
– Gene‐specific, global, genome‐wide– Need to balance number of samples vs. coverage
• Pyrosequencing and Illumina chips are a good fit for large human studies (Bisulfite treatment is easier and cheaper)
• Progress is fast– First methylation microarray chip released in 2006– Need for additional head‐to‐head comparisons between different methods
– Bioinformatic/biostat methods to integrate data between different platforms
• Tissue specificity – Target tissues– Pure cell populations