techno-economic modeling of voice call continuity
TRANSCRIPT

1 © 2007 Nokia Toivonen_09102007.ppt / 2007-10-09 / M.E.T
Techno-economic modeling of Voice Call Continuity
Supervisor: Prof. Raimo KantolaInstructor: M.Sc (Tech) Markus SalmenpohjaNokia
Mikko Toivonen9.10.2007

2 © 2007 Nokia Toivonen_09102007.ppt / 2007-10-09 / M.E.T
Content
•Background
•Voice Call Continuity Technology
•Operator Issues
•Techno-Economic Model Implementation
•Results – Elisa
•Conclusions & Further Development

3 © 2007 Nokia Toivonen_09102007.ppt / 2007-10-09 / M.E.T
Background
•Spread of wireless LANs
•Larger set of features supported by handsets
•Convergence of different access technologies
•Need to evaluate the economic impact of convergence technologies to operators’ business
•How much profit can be made with voice call continuity (VCC)?

4 © 2007 Nokia Toivonen_09102007.ppt / 2007-10-09 / M.E.T
Voice Call Continuity Technology
• VCC is a fixed-mobile convergence technology
• Seamless handover between circuit switched and packet switched access networks
• Requires new network components
• Requires client software in the terminal

5 © 2007 Nokia Toivonen_09102007.ppt / 2007-10-09 / M.E.T
Operator Issues
•Better ability to compete against free and low priced VoIP operators
•Replace PSTN services
•Possible reduction in costs
•Reduce customer churn through bundling
6 © 2007 Nokia Toivonen_09102007.ppt / 2007-10-09 / M.E.T
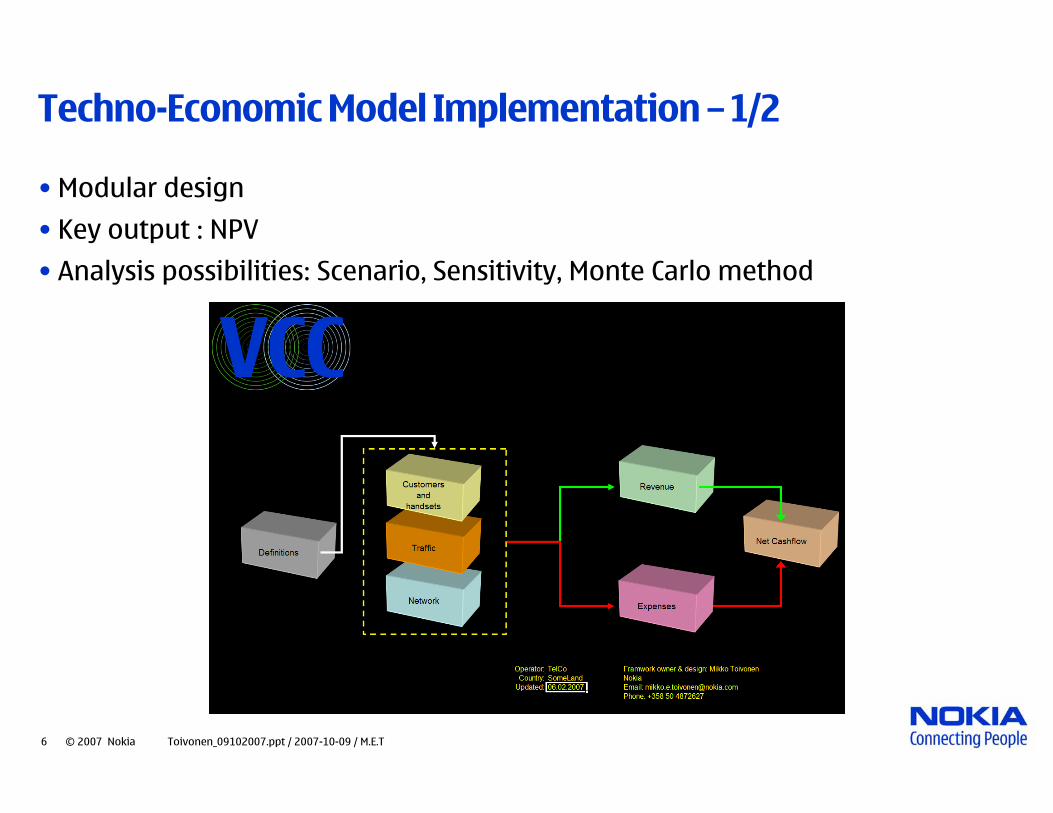
Techno-Economic Model Implementation – 1/2
• Modular design
• Key output : NPV
• Analysis possibilities: Scenario, Sensitivity, Monte Carlo method
7 © 2007 Nokia Toivonen_09102007.ppt / 2007-10-09 / M.E.T
Techno-Economic Model Implementation – 2/2
• All of an operator’s business is not modeled, only those that are assumed to be affected by VCC
• All analysis is based on delta analysis, i.e. what is the difference between scenarios
• Results are based on a base case. The base case is a scenario which assumes that VCC will not be implemented
Δ

8 © 2007 Nokia Toivonen_09102007.ppt / 2007-10-09 / M.E.T
Results – Elisa 1/5
•How much profit can Elisa make by implementing VCC?
•Publicly available data (statistics, Elisa annual report) has been used as input
•Some input data has been calculated or estimated

9 © 2007 Nokia Toivonen_09102007.ppt / 2007-10-09 / M.E.T
Results – Elisa 2/5Best Estimate
0.0%
10.0%
20.0%
30.0%
40.0%
50.0%
60.0%
70.0%
80.0%
90.0%
100.0%
2007 2008 2009 2010 2011 2012 2013 2014 2015
Year
% of VCC capable handset, consumer segment % of VCC capable handset, enterprise segment
VCC Attachement rate, consumer segment VCC Attachement rate, enterprise segment
DELTA
-20.000
-10.000
0.000
10.000
20.000
30.000
40.000
50.000
60.000
70.000
80.000
2008 2009 2010 2011 2012 2013 2014
Year
Mill
ion
Expenses Revenue Cumulative Cash Flow

10 © 2007 Nokia Toivonen_09102007.ppt / 2007-10-09 / M.E.T
Results – Elisa 3/5Sensitivity Results
-5% -1% +1% +5% Inversely Sensitive?NPV Sensitive Parameters
IMS Minute Charge, EUR 20.07% 3.75% -3.62% -16.93% YES% of Mobile CS Traffic for VCC Subscribers, Consumer Segment 9.51% 1.90% -1.90% -9.53% YES
WLAN Coverage -9.24% -1.85% 1.84% 9.21%VCC attachement rate, Consumer Segment -8.78% -1.76% 1.76% 8.78%
VCC Capable Handsets Ratio, Consumer Segment -8.78% -1.76% 1.76% 8.78%NPV Insensitive Parameters
IMS Network, Customer Acquisition Cost, EUR/Subscriber 4.78% 0.96% -0.96% -4.78% YESVCC attachement rate, Enterprise Segment 3.42% 0.68% -0.68% -3.42% YES
VCC Capable Handsets Ratio, Enterprise Segment 3.42% 0.68% -0.68% -3.42% YES% of Mobile CS Traffic for VCC Subscribers, Enterprise Segment -2.66% -0.53% 0.53% 2.66%
International VCC Minute Charge, EUR -1.58% -0.32% 0.32% 1.58%Little or no effect on NPV
Churn Rate Reduction for VCC Subs., Consumer Segment -0.68% -0.14% 0.14% 0.68%IMS Infrastructure Investement,MEUR 0.59% 0.12% -0.12% -0.59% YES
IMS Investment split to VCC 0.59% 0.12% -0.12% -0.59% YESChurn Rate Reduction for VCC Subs., Enterprise Segment -0.23% -0.05% 0.05% 0.23%
IMS Minute Cost, EUR 0.04% 0.01% -0.01% -0.04% YESVCC Roaming Minute Charge, EUR 0.00% 0.00% 0.00% 0.01%
International VCC Minute Cost, EUR 0.00% 0.00% 0.00% 0.00%VCC Roaming Minute Cost, EUR 0.00% 0.00% 0.00% 0.00%
NPV Sensitivity
11 © 2007 Nokia Toivonen_09102007.ppt / 2007-10-09 / M.E.T
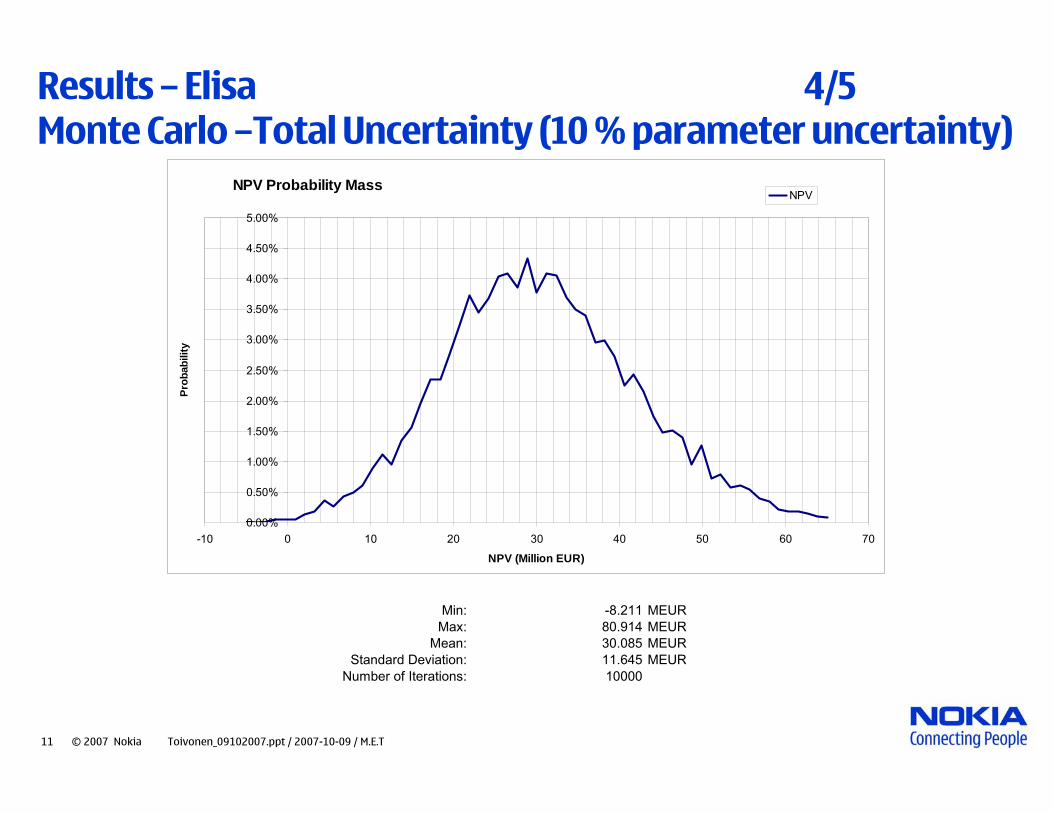
Results – Elisa 4/5Monte Carlo –Total Uncertainty (10 % parameter uncertainty)
NPV Probability Mass
0.00%
0.50%
1.00%
1.50%
2.00%
2.50%
3.00%
3.50%
4.00%
4.50%
5.00%
-10 0 10 20 30 40 50 60 70
NPV (Million EUR)
Prob
abili
tyNPV
Min: -8.211 MEURMax: 80.914 MEUR
Mean: 30.085 MEURStandard Deviation: 11.645 MEUR
Number of Iterations: 10000

12 © 2007 Nokia Toivonen_09102007.ppt / 2007-10-09 / M.E.T
Results – Elisa 5/5Monte Carlo –Total Uncertainty (25% parameter uncertainty)
NPV Probability Mass
0.00%
0.50%
1.00%
1.50%
2.00%
2.50%
3.00%
3.50%
4.00%
4.50%
5.00%
-80 -60 -40 -20 0 20 40 60 80 100 120 140
NPV (Million EUR)
Prob
abili
tyNPV
Min: -53.103 MEURMax: 212.151 MEUR
Mean: 30.241 MEURStandard Deviation: 29.748 MEUR
Number of Iterations: 10000

13 © 2007 Nokia Toivonen_09102007.ppt / 2007-10-09 / M.E.T
Conclusions & Further Development
• Conclusions• Voice Call Continuity can be profitable for operators
• Sensitivity results indicate that fixed monthly charge would be most successful strategy
• Increase in revenue mainly from increased overall consumption
• Expense savings are likely to be small
• Development• Current model assumes symmetric traffic between operators
• In asymmetric cases further analysis of transfer costs needs to be made
• Current model does not consider fixed charges associated with subscriptions

14 © 2007 Nokia Toivonen_09102007.ppt / 2007-10-09 / M.E.T
Questions, please?