technological modernization and its impact on agriculture
TRANSCRIPT

Publications
2017
Technological Modernization and Its Impact on Agriculture, Technological Modernization and Its Impact on Agriculture,
Fisheries and Fossil Fuel Utilization in the Asia Pacific Countries Fisheries and Fossil Fuel Utilization in the Asia Pacific Countries
with Emphasis on Sustainability Perspective with Emphasis on Sustainability Perspective
Rajee Olaganathan Embry-Riddle Aeronautical University, [email protected]
Kathleen Quigley Embry Riddle Aeronautical University
Follow this and additional works at: https://commons.erau.edu/publication
Part of the Agriculture Commons, Aquaculture and Fisheries Commons, Oil, Gas, and Energy
Commons, and the Sustainability Commons
Scholarly Commons Citation Scholarly Commons Citation Olaganathan, R., & Quigley, K. (2017). Technological Modernization and Its Impact on Agriculture, Fisheries and Fossil Fuel Utilization in the Asia Pacific Countries with Emphasis on Sustainability Perspective. International Journal of Advanced Biotechnology and Research (IJBR), 8(2). Retrieved from https://commons.erau.edu/publication/839
This Article is brought to you for free and open access by Scholarly Commons. It has been accepted for inclusion in Publications by an authorized administrator of Scholarly Commons. For more information, please contact [email protected].

International Journal of Advanced Biotechnology and Research (IJBR) ISSN 0976-2612, Online ISSN 2278–599X,
Vol-8, Issue-2, 2017, pp422-441 http://www.bipublication.com
Research Article
Technological modernization and its impact on Agriculture, Fisheries and Fossil fuel utilization in the Asia Pacific Countries with emphasis on
sustainability perspective
Olaganathan Rajee* and Kathleen Quigley College of Arts and Sciences and College of Business Embry Riddle Aeronautical University Worldwide,
75 Bukit Timah Road, #02-01/02 Boon Siew Building, Singapore. 229833 * Corresponding Author E-mail: [email protected]; Phone: +1 626 236 2254
ABSTRACT Modernization is a process that moves towards efficiency. This affects most of the fields such as agriculture, fisheries, forestry, urban planning, policy, fossil fuel usage, manufacturing, technology, economic growth etc. This process plays a major role in moving forward making things faster, better and basically more efficient. The effects of modernization on all these fields bring about the major changes to aspects such as social, economic and the environment. The level of operation has increased from a domestic level; small family scale business to large commercial levels. As the level of operation increased, the utilization of natural resources increased gradually and paved way for the use of synthetic materials and machines. This shift brought about changes in attitude of managing resources and economic growth. Most of the countries upheld importance in maximising short-term benefits in terms of economic efficiency rather than sustainability of the resources. The rapid increase in human population also contributed to this. This paper discusses about the impact of modernization on different perspectives such as socioeconomic, environmental and sustainability issues in the field of agriculture, fisheries, fossil fuel and energy sector in Asia pacific countries.
Key words: Modernization, Agriculture, Fisheries, Fossil fuel, Energy, Sustainability INTRODUCTION Modernization is a process in which a country moves from a traditional society to an urbanized and industrialized society. During this process the country changes in different levels. The changes are depicted in terms of traditional value rather than scientific belief. Its population becomes more urbanized, it changes economically from conventional farming to industrialized/ mechanized farming which can create dire consequences compared to the fact that the country’s economy solely depends on producing goods and services. Modernization is due to the
improvements in science which in turn leads to the advancements in technology. Technology drives modernization in different directions. It allows the farmers to cultivate more crops, it allows the development of factories thereby providing jobs to the new urban dwellers; provides entertainment, improved health care and other innovations. This leads the society to become more modernized, providing access to many goods which in turn make life more comfortable. Besides these benefits, modernization also has its own drawbacks. The main negative impact is on the

Technological modernization and its impact on Agriculture, Fisheries and Fossil fuel utilization in the Asia Pacific Countries
Olaganathan Rajee, et al. 423
environment because modernization encourages corporate giants to source pollution rich sources of cheap fuel to power new technology. Another negative impact is that it causes society to break up social ties and lose its social identity. Thus, the cause & effects of modernization can be both positive and negative. This paper will discuss mainly about the impact of modernization on the food sector i.e., agriculture and fisheries division and in the energy sector about the fossil fuels and relevant environmental issues and the associated sustainability perspective in the Asia Pacific region with special emphasis on the most populated countries such as China, India, Indonesia and Philippines which are of course the developing nations in this region. Fisheries Sector Traditionally, fishing has been the main profession of the people living along the coastal region. Apart from providing food security, fisheries occupy an important place in the socio-economic development of the country by providing employment and income to the rural population and it serves as a valuable foreign exchange for the development of the country. During the last five decades in fact outpacing the world population growth, the annual global fish production has been growing steadily at the rate of 3.2% (FAO, 2012). Meanwhile, the global per capita consumption of fish has also increased steadily from an average of 9.9 kg in 1961 to 19.2 kg in 2012 (FAO, 2012) and is still increasing thus exerting more pressure on resources available. This increase in fish consumption is attributed to a sustained fish production, increase in human population, high per capita income and urbanization which is facilitated by the strong industrialization in fishing industry and modernization in the efficient distribution of the products. This section will discuss about technological advancement in the fisheries industry and the role of fisheries in highly populated countries such as China, Indonesia, India and Philippines in the Asia Pacific region with special reference to production,
challenges/negative impacts, sustainability perspective and socio economic perspective. Technological Advancement In early 1900’s all activities related to the fishing industry was carried out by the fishermen community with versatile skills and knowledge such as craft engineering, textile engineering, navigational skills, oceanography, astronomy, engineering, transportation, processing, marketing etc. of which they acquired through experience from previous generations. As human population increased, the demand for seafood also increased tremendously. Knowledge and technological growth played a major role in capture fisheries and helped to go further into the ocean in search for more fish varieties and yield. After globalization, fishing became a commercialized venture. The modern fishing fleet with processing facilities, fish scouting airplanes, cold storage and the acoustic technology help to detect the size and nature of fish schools in the open ocean and at various depths. Modernization brought new changes causing structural shift by improving the efficiency of crafts and gears, creating new employment, increasing the economic growth of the community and the country. In the late 1900s and early 21st century there has been a considerable increase in the mechanization of the industry especially the ring seine, mini trawlers which led to the over exploitation of some fishery causing destruction and collapse (FAO-SOFIA, 2006). Production Perspective Asia-Pacific region plays a dominant role in global fishery production. In 2002, total production was around 133 million tons and Asia-Pacific countries contributed to 50 percent of capture fishery production and 89 percent of global aquaculture production. In 2003, the top 10 producers in Asia –Pacific Countries are China, Japan, Indonesia, India, Thailand, Philippines, Republic of Korea, Vietnam, Malaysia and Taiwan Province of China (FAO, 2005). This tremendous growth and reliance of Asia-Pacific

Technological modernization and its impact on Agriculture, Fisheries and Fossil fuel utilization in the Asia Pacific Countries
Olaganathan Rajee, et al. 424
countries on fishing are mainly due to their socio economic benefits. China: China has a coastline of 14,500 km, and an Exclusive Economic Zone of 877,019 square km. China has ongoing disputes with neighboring countries over the exact extent of EEZ. In 1985 China started distant water fishing activities. It had agreements with other foreign countries to access their EEZ for fishing. This opened up new fishing grounds for Chinese fishermen providing more income and contributed to the nation’s economy. In 1996 it extended to 60 regions globally with an operation of 1381 vessels providing employment to 21,200 fishermen and their capture fisheries produced 926, 500 tons (NOAA, 2000). This led to an increase in the fishery trade and annual growth was estimated to be 15.7% in export and 17.2% in imports (Aquaculture in China and Asia, FAO, 2007). China is the world’s largest exporter of fish and fish products from 2002 and the value of the industry was US$ 7.7 billion. In 2013 China earned a surplus of USD$ 11.6 billion through the fishery trade (NOAA, 2000). In 2015, China aims to expand its distant water fleet to 2,300 vessels. Indonesia: Indonesia has a long coastline of 54,716 km with an Exclusive Economic Zone of 3.1 million square km which is the fifth largest in the world (FAO, 2013a). In the coastal zone it has approximately 5.8 million square km of fishing area and its fresh water sector has over 5,500 rivers and an estimated total dam capacity of 22.49 km3 (FAO, 2013b). Fishery plays a major role in the socio economic sector of Indonesia due to these abundant water resources and the growth of fishing industry is about 7 % per year. Indonesia is one of the largest producers of fishery products in Southeast Asia; in 1998, Indonesian prawn exports exceeded USD$1 billion and it ranks third in tuna production. The production in the tuna sector alone has increased by 3.31% during 2005-09 accounting for total production of 203,269 tons. In 2009 the total production was 9.82 million tons and in 2010 the total fishery production reached 10.83 million tons, up by
10.29%. According to the data of the Indonesian Chamber of Commerce and Industry (Kadin), in 2010 the Indonesia’s fishery exports was USD$2.86 billion; in 2011 it rose to USD$ 3.52 billion and in 2012 has reached USD$3.85 billion. India: India has a long coastal line of about 8,118 km with a wide exclusive economic zone (EEZ) of about 2.172-million square km. Since 1947, the fish production has increased more than ten times in India. In 1950 the fish production was 800,000 tons and increased to 4.1 million tons in the early 1990s. The fish production has doubled in India between 1990 and 2010 (FAO, 2011) it reached approximately 8 million metric tons. As a result of modernization special efforts were made by the Government to promote both coastal farming, extensive and intensive inland fish farming. Apart from this the Government also encouraged deep sea fishing through joint venture. These efforts played a major role in increasing the nation’s economy by reaping increase in fish production in marine sector from 520,000 tons in 1950 to 3.35 million tons in 2013; in inland sector it increased from 218,000 tons in 1950 to 6.10 million tons in 2013. In 2006, it exported over 600,000 metric tons of fish, to some 90 countries, earning over USD$1.8 billion (MPEDA, 2013). In 2008, India was the sixth largest producer of marine and freshwater capture fisheries, and the second largest aquaculture farmed fish producer in the world (FAO, 2010). During 2013 -14 the fish production was 9.58 million metric tons out of which 6.14 million metric from inland and 3.44 million metric tons from sector. During this year the growth of marine sector is 3.7% and the inland sector is 7.3% which together contributed to the overall growth in of 5.9 % (Handbook on Fisheries Statistics, 2014). Philippines: Philippines have an extensive coastline of 17,460 km with an Exclusive Economic Zone of 2.2 million sq km. In 1950s to 1960s the fish production mainly came from the marine sector and only during 1970s a significant contribution came from inland sector and aquaculture. In 1951 the fish production was only

Technological modernization and its impact on Agriculture, Fisheries and Fossil fuel utilization in the Asia Pacific Countries
Olaganathan Rajee, et al. 425
250,000 tons and this increased substantially to 1.6 million tons in 1990s (Ahmad et al, 2003). The growth rate of the industry was 2.04% from 1992 to 2001. In 2001 the production was around 3.149 metric tons and they achieved 105% against the targeted production for the year. In 2010 it ranked as the fifth top fish producer globally. In 2011 eventually the total production decreased at a rate of 3.6% but the total export value was USD$ 871 million while import was USD$ 217 million and left a positive balance in trade and contributed to the country’s GDP (BFAR 2011). Negative Impacts of Modernization in Fishery Sector Modernization has been overwhelmingly good for humanity in terms of economic and social improvement but it also has some negative impacts. With regard to the fishery sector it has caused the following impacts: Most of the marine fishing grounds have been excessively overexploited for human consumption, for fish meal, vitamins and various other uses. Due to this over fishing 8% of marine fisheries were depleted, 16% over exploited and 52% fully exploited, 21% moderately exploited and 3% under exploited (FAO-SOFIA, 2006). This poses a terrible threat to the sustainability of marine resources. Aquatic habitats have also been altered or destructed massively for the construction of embankments for flood control, irrigation, drainage, construction of weirs in rivers, excessive withdrawal of surface water, pollution caused by the agricultural pesticides, fertilizers, indiscriminate release of industrial effluents, unplanned construction of rural roads and culverts that obstruct the movement of fish all together contributed to the destruction of marine fisheries. FAO (2007) report states that fish catch has decreased drastically in China, India, Japan, New Zealand, South Korea and Thailand. Due to declining fish stocks, fishermen have ventured out into the country’s offshore waters including disputed waters and other countries EEZ to catch fish. This causes a great challenge not only to marine resources but also the security of the countries. China being the
world’s largest exporter of fish and fish products for twelve consecutive years is facing criticism with regards to offshore fishing by their fishermen and their export value of products is US$ 20 billion in 2013. China’s Institute of Oceanology stated that 30% of fisheries have collapsed and 20% were overexploited and the impact of overfishing and pollution is larger than a decade ago (www.worldfishing.net/news101). Sustainability Perspective Modernization and the technological advancements have extremely changed the fishery sector during the past few years. This has depleted the resources drastically and has raised the question of Sustainability. FAO (2005) quantified that the catch from capture fisheries increased three times from 20 million tons (1950) to 60 million tons (1970). Hannesson (1995) reported signs of stress in numerous large scale fisheries globally. The Peruvian anchovy fishery collapsed due to over fishing in 1971-72. Further North Atlantic demersal fisheries like haddock, halibut and cod were also declining (Botsford, 1997 and Haggon, 1998). In 1992 the situation was worsen in Canada where the abundance of Cod stocks were reduced to 10% of their long term abundance (Charles, 1998 and Pauly et al., 2002). Canada government announced a 2 year ban for commercial fishing off Labrador and Newfoundland. In 1997-98 Canada partially reopened the fisheries but data confirmed that cod stocks were not recovering. In 2003 the cod fisheries were closed until further notice. In 2011, at Grand banks the stock had increased by 34%. When Cod population decreased, the population of forage fishes increased several fold due to the absence of the predator. Due to the ban in the area not only cod but other marine invertebrate populations have also recovered (Frank Kenneth et al., 2005). This proves that protecting marine areas will help to protect not only the marine fauna and flora but the entire ecosystem. Seeing the success in cod fishery, other developing countries are also changing their policy to protect resources for future generations thus moving

Technological modernization and its impact on Agriculture, Fisheries and Fossil fuel utilization in the Asia Pacific Countries
Olaganathan Rajee, et al. 426
towards a sustainable future. There are legislations in place to protect the resources for future sustainability. This is discussed briefly in the following section. China: In China the production, development and the utilization of the country’s fishery resources is regulated by the Fisheries law (1986) which was amended in 2000. According to this law the state government has to adopt a policy with special emphasis on the development of fishing, aquaculture and fish processing. The Protection of Wildlife Act (1988) implemented by the Regulations for the Protection of Aquatic Wildlife (1993) regulates responsibility to the Fisheries administration to manage the endangered species in aquatic wildlife. Meanwhile, marine resources were protected by the Marine Environment Protection law (1982). China also have the Water Law (1988) amended in 2002 to regulate the development, utilization and management of water resources. The establishment of Marine Functional Zonation Schemes such as coastal land use, urban and port development was regulated by the Sea Area Use Management Law (2002). Indonesia: The Act of the Republic No.6 relating to Indonesian Waters (1996) regulates the navigation in Indonesian waters and emphasizes the management, utilization and protection of the water resources; the Law on Water Resources (2004) which regulates the sustainable use of both freshwater and coastal water. Besides this there is a Fisheries Law (2004), Environmental Management Act (1997) which protects the fishery resources, provides guidelines for aquaculture activities and protects the environment on a wider perspective. Garcia et al., (2003) suggested that “Ecosystem Based Management” will be the new approach for fishery management but it would be an extension of the gradual improvement of existing fishery management ideas. Moreover, they report that fisheries has a substantial negative impact on the ecosystem and only an Ecosystem based management approach will strive to minimize those impacts.
India: India has a federal structure of government. There are many laws and regulations that may be relevant to fisheries and aquaculture adopted at state and central level. It includes the British-era Indian Fisheries Act 1897, which penalizes the killing of fish by poisoning water and by using explosives; the Environment Protection Act 1986, an umbrella act containing provisions for all environment related issues affecting fisheries and aquaculture industry in India. India also has enacted the Water Act 1974 (Prevention and Control of Pollution) and the Wild Life Protection Act 1972. All these legislations must be read in conjunction with one another, and with the local laws of a specific state, to gain a full picture of the law and regulations that are applicable to fisheries and aquaculture in India. During the Eleventh Five Year Plan (2007-12) the Planning Commission suggested to employ a Fishery Management Plan through the enforcement of Marine Fisheries Regulations Act which limits the entry of new coastal mechanized fishing crafts in banned areas. Philippines: Agriculture and Fisheries Modernization Act (1997), provides guidelines to modernize the agriculture and fisheries sectors in order to enhance their profitability. The Philippines Fisheries Code (1998) provides regulations for the development, management, conservation and utilization of fisheries and aquatic resources. Apart from these two acts they also have Biological and Genetic Resources Order (1995), National Integrated Protected Areas System Act (1992), Philippines Clean Water Act (2004), Philippines Environment Code (1988) which protects the natural resources and environment. All these legislations play a major role in protecting natural resources. Following the success of Marine Protected areas in developed countries Asia Pac is also adopting this approach. Both in conservation and in the fishery perspective, these protected areas are valuable and is considered as a management tool in Fishery sector (Mous et al., 2005). The development and expansion of these areas is required from both conservation and fisheries perspective. In fact,
Technological modernization and its impact on Agriculture, Fisheries and Fossil fuel utilization in the Asia Pacific Countries
Olaganathan Rajee, et al. 427
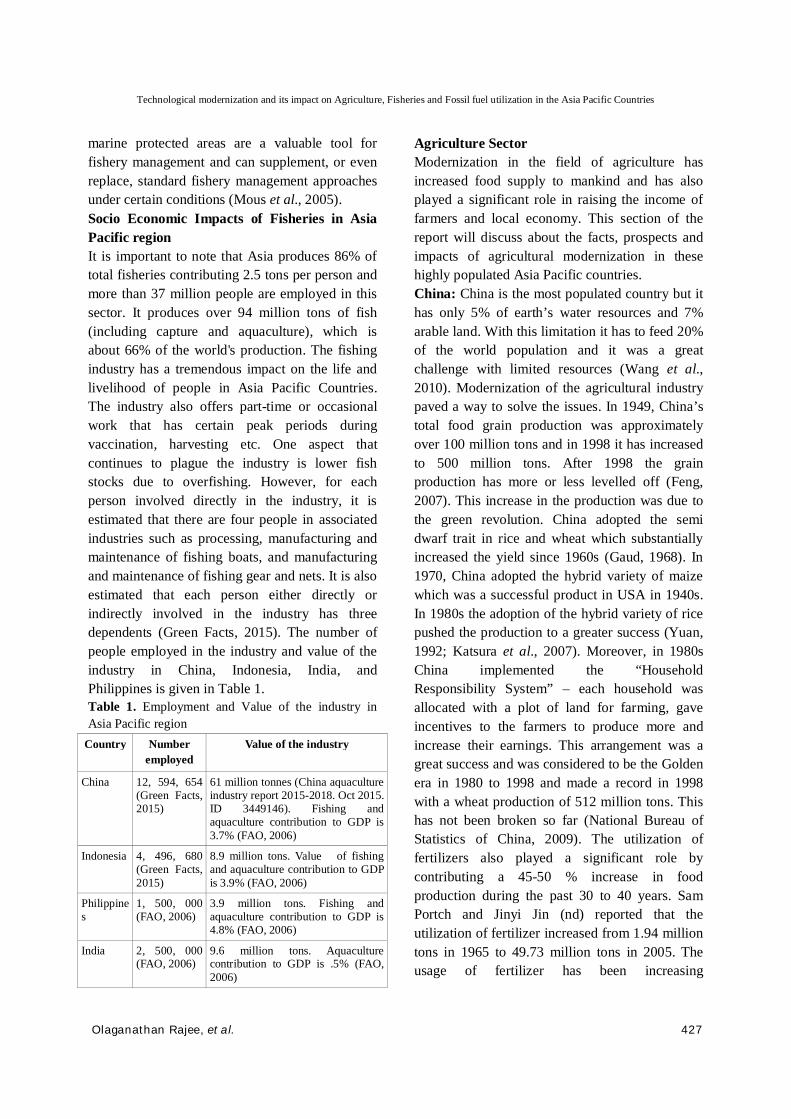
marine protected areas are a valuable tool for fishery management and can supplement, or even replace, standard fishery management approaches under certain conditions (Mous et al., 2005). Socio Economic Impacts of Fisheries in Asia Pacific region It is important to note that Asia produces 86% of total fisheries contributing 2.5 tons per person and more than 37 million people are employed in this sector. It produces over 94 million tons of fish (including capture and aquaculture), which is about 66% of the world's production. The fishing industry has a tremendous impact on the life and livelihood of people in Asia Pacific Countries. The industry also offers part-time or occasional work that has certain peak periods during vaccination, harvesting etc. One aspect that continues to plague the industry is lower fish stocks due to overfishing. However, for each person involved directly in the industry, it is estimated that there are four people in associated industries such as processing, manufacturing and maintenance of fishing boats, and manufacturing and maintenance of fishing gear and nets. It is also estimated that each person either directly or indirectly involved in the industry has three dependents (Green Facts, 2015). The number of people employed in the industry and value of the industry in China, Indonesia, India, and Philippines is given in Table 1. Table 1. Employment and Value of the industry in Asia Pacific region
Country Number employed
Value of the industry
China 12, 594, 654 (Green Facts, 2015)
61 million tonnes (China aquaculture industry report 2015-2018. Oct 2015. ID 3449146). Fishing and aquaculture contribution to GDP is 3.7% (FAO, 2006)
Indonesia 4, 496, 680 (Green Facts, 2015)
8.9 million tons. Value of fishing and aquaculture contribution to GDP is 3.9% (FAO, 2006)
Philippines
1, 500, 000 (FAO, 2006)
3.9 million tons. Fishing and aquaculture contribution to GDP is 4.8% (FAO, 2006)
India 2, 500, 000 (FAO, 2006)
9.6 million tons. Aquaculture contribution to GDP is .5% (FAO, 2006)
Agriculture Sector Modernization in the field of agriculture has increased food supply to mankind and has also played a significant role in raising the income of farmers and local economy. This section of the report will discuss about the facts, prospects and impacts of agricultural modernization in these highly populated Asia Pacific countries. China: China is the most populated country but it has only 5% of earth’s water resources and 7% arable land. With this limitation it has to feed 20% of the world population and it was a great challenge with limited resources (Wang et al., 2010). Modernization of the agricultural industry paved a way to solve the issues. In 1949, China’s total food grain production was approximately over 100 million tons and in 1998 it has increased to 500 million tons. After 1998 the grain production has more or less levelled off (Feng, 2007). This increase in the production was due to the green revolution. China adopted the semi dwarf trait in rice and wheat which substantially increased the yield since 1960s (Gaud, 1968). In 1970, China adopted the hybrid variety of maize which was a successful product in USA in 1940s. In 1980s the adoption of the hybrid variety of rice pushed the production to a greater success (Yuan, 1992; Katsura et al., 2007). Moreover, in 1980s China implemented the “Household Responsibility System” – each household was allocated with a plot of land for farming, gave incentives to the farmers to produce more and increase their earnings. This arrangement was a great success and was considered to be the Golden era in 1980 to 1998 and made a record in 1998 with a wheat production of 512 million tons. This has not been broken so far (National Bureau of Statistics of China, 2009). The utilization of fertilizers also played a significant role by contributing a 45-50 % increase in food production during the past 30 to 40 years. Sam Portch and Jinyi Jin (nd) reported that the utilization of fertilizer increased from 1.94 million tons in 1965 to 49.73 million tons in 2005. The usage of fertilizer has been increasing

Technological modernization and its impact on Agriculture, Fisheries and Fossil fuel utilization in the Asia Pacific Countries
Olaganathan Rajee, et al. 428
tremendously till 2007 and has reached the maximum plateau of 50 million tons per year now (History of Soy in China and Taiwan, 2014). Indonesia and Philippines: Rice is the staple food in Indonesia and production was about 10 million tons in 1961 and has since increased to 54 million tons in 2004. In 1961 the yield per hectare was 2 tons and increased to 4.5 tons in 2003. The highest growth rate occurred during 1970-90. During the green revolution, infrastructure development played an important role in improving rice yields mainly due to the development of irrigation networks which were developed before World War II (van der Kroef, 1963). The utilization of fertilizers, pesticides and cultivation of high-yielding hybrid rice, especially insect-resistant hybrids contributed to increased production. Government also offered the “Mass guidance program” through which it provided technical assistance, credits and marketing support through cooperative departments. This reflected in the success of green revolution. Rosset and Collins (1998) reported that in West Java alone the fertilizer and pesticide utilization increased by 65% and 19% respectively. In 1961 the fertilizer consumption was 135,990 metric tons and it increased to 1,173,025 metric tons in 1980 and in 2002 it approximately doubled to 2,992,000 metric tons (FAOSTAT, 2015). According to FAOSTAT (2011), Philippines is the 8th largest rice producer in the world contributing to 2.8% of total global rice production. Since 1950, rice production has increased significantly. This increase in production is mainly due to the green revolution, improved crop varieties and increase in the utilization of foliar fertilizer. The average productivity increased from 1.23 metric tons per hectare in 1961 to 3.59 metric tons per hectare in 2009 (FAOSTAT, 2011). In 2010, nearly 15.7 million metric tons of palay (pre-husked rice) were produced and accounted for 21.86% percent of gross value in agriculture (Philippines economy posts, 2011). In 1980s the rice yield increased 13% in Central Luzon but at the cost of 21% increase in fertilizer usage. While in Central plains
the yield was up to 65% due the increased utilization of 53% pesticide and 24% of fertilizer Rosset and Collins (1998). India: In 1940s the ‘Grow more Food Campaign’ was started towards promoting the growth of food crops while the Integrated Production Program concentrated on cash crops production. Reclamation of land and its development, mechanization, use of chemicals – fertilizers, pesticides, herbicides were promoted extensively by the government under the five year plan. From 1960s revolutions started in many areas including Green Revolution (agriculture products), Yellow Revolution (oil seeds from 1986-1990), Blue Revolution (Fishing from 1973-2002). A remarkable growth was noted after 1991 due to economic reforms and innovations in Agro Processing and Biotechnology (Kumar, 2005). Due to industrialization in agricultural sector the ratio of the economic yield to the biological yield was high (Shiva, 1993). The average yield per hectare for rice is 7.1 quintals and 6.6 quintals for wheat in 1949-50. This increases to 10.8 quintals of rice and 9.1 quintals of wheat in 1964-65 with an annual growth rate of 2.1% and 1.3% respectively. During post green revolution i.e., from 1965-2009 the average yield of rice increased to 21.86 quintals with an annual growth rate of 2.3% and wheat yield was 28.91 quintals with a growth rate of 3.4%. In 2001, the wheat production was 74 million tonnes of wheat which is high compared to 6 million tons during 1947 (Abrol, 2000). The overall annual production of food grains is about 82 million tons in 1960-61 and increased to 123.7 and 172.5 million tons during 1980-81 and 1990-91 respectively (Abrol, 2000). In 1979, India was holding 16 million tons of surplus food grain in storage (Lappe et al., 1982). Though food availability increased there was unequal access to food and resources which led to poverty. During 1998-99 production level is 195 million tons and the country has been able to accumulate substantial quantity of 35 million ton as stocks to cope up with any sudden difficulties arising from drought or a similar situation in any

Technological modernization and its impact on Agriculture, Fisheries and Fossil fuel utilization in the Asia Pacific Countries
Olaganathan Rajee, et al. 429
part of the country (Abrol, 2000). This increase in the production of food grains are attributed to the utilization of fertilizers. Next to China and USA, India utilizes more amounts of fertilizers which have increased from 1.54 million tons in 1967-68 to 17.31 in 1997-98. However 65% of the fertilizer is used for rice and wheat production. The requirement of the fertilizers is projected to increase up to 30-35 million tons by 2020 for food grain crops. The demand will increase to another 15 million tons for horticulture, vegetables and other commercial crops. The wide spread adoption of high yielding varieties and the irrigational coverage coupled with fertilizer and pesticide usage had led to significant increases in cropping intensities. Negative Impacts of Modernization in Agricultural Sector The main objective of the Green revolution was to produce more food for the growing population and it was successful (Janvry and Sadoulet, 2002). It involves the widespread use of chemical fertilizers, pesticides, intensive irrigation and hybrid strains/high yielding strains. The introduction of chemicals reduced the productivity of land and created a necessity for intensive inputs to get the same yield from the land thus added to the financial burden of farmers (Pereira, 1996). Moreover, the approach of green revolution neglected indigenous knowledge, assumed farmers were ignorant and thus benefits were not evenly distributed (Gadgil et al., 1996). Dogra (1990) reported that large scale farmers had more access to subsidies for irrigation and credit from the government. Genetically modified crops gained attention and were used widely in Asia Pacific countries. China and India together contributed 8% of genetically modified (GM) crop production at a global scale (FAOSTAT, 2004). In spite of the advantages, there were severe impacts both on the health and environmental perspective. Steinbrecher (1996) reported that GM crops can be sprayed with a herbicide to kill weeds without killing the crops but intensified spraying on long term might boost the resistance of some weeds
against the herbicide. As weeds become resistant higher doses of herbicide are needed and that might remain as a residue on crops and soil. The chance for bioaccumulation and bio magnification will be higher. Above all GM crops might itself become a weed. Besides the development of pest resistant and herbicide tolerance crops biotechnologists are also developing pathogen resistant crops. The risk related to the herbicide resistant crop is the transfer of the genes to wild varieties through cross pollination producing super weeds which is later difficult to eradicate (Ho, 1998). Stone (2002) reported that insects might adapt their behavior and genetics in unpredictable ways to survive and emerge as superbugs which can become difficult to control. Ho (1998) reported that genetic modification for disease or pest resistance in not a solution and on the other hand, intensive agriculture creates conditions favorable for new pathogens. IR-36, a hybrid rice variety was engineered to be resistant to eight major diseases and pests including bacterial blight and tungro, but when it was grown were attacked by two new viruses, ragged stunt and wilted stunt is an example for this. GM crops also pose a large threat to biosafety (Wilson et al., 2006). Threat to biodiversity, evolution of resistance varieties and genetic pollution are some of the concerns related to GM crops. Sustainability Perspective Generally, less research was done during the green revolution on integrated technology for diversifying the livelihoods of small-scale farmers in developing countries and increasing the sustainability of land use. The importance of organic matter in soil, role of legumes in biological nitrogen fixation, use of organic fertilizers, reduced tillage systems gained importance during the beginning of this century. The technology and practices that do not have adverse impacts on the environment and human health, leading to the improved food production is referred to as Sustainable agriculture (Ho and Ching, 2003). The research carried out by Niggli et al. (2007) showed that sustainable agriculture

Technological modernization and its impact on Agriculture, Fisheries and Fossil fuel utilization in the Asia Pacific Countries
Olaganathan Rajee, et al. 430
requires a site specific technology. They also reported that several projects done by grass root organizations has shown increased productivity, high income, increased access to food, reduced malnutrition and improved the livelihood of poor people. There are lots of socio, economic and environmental benefits related to sustainable agriculture: Some organic farms require more labor. Due to crop diversifications there is distribution of labor in organic farming which contributes to the stabilization of employment and reduces problems related to seasonal migration (FAO, 2002). It improved food security and meets the goal of mitigating poverty and enhancing environmental sustainability (ESCAP, 2002). IFAD (2002) reported there is an increased demand for organic food. On the environmental side it plays a significant role in reducing the contamination of water by synthetic fertilizers, pesticides and especially nitrogen and phosphorus leaching which causes eutrophication in nearby aquatic habitats. Soil erosion and sedimentation of aquatic habitats are also reduced at a greater extent (FAO, 2002). FAO (2002) report proved that 98% of energy inputs (animal manure, biogas) in organic systems were from renewable resources while 70% energy inputs in conventional system were nonrenewable (electricity, chemical fertilizers and pesticides). It also plays a significant role in reducing the emissions of agricultural greenhouse gases and thus contributes positively towards climate change. The carbon sink idea of Kyoto protocol was effectively achieved by sustainable agriculture (Climate Change Conference, 2015). Moreover, organic crop rotation protects surface soil and prevents nutrients from leaching. Based on these benefits of organic farming and to protect resources for future generations by reducing soil compaction, soil erosion, soil degradation that occurs due to mechanization most of the countries have legislations that are directed towards sustainability. This is discussed briefly in the following section.
The Chinese government has implemented a series of policies and measures for agriculture according to national economic and agricultural development for different periods. There were three categories in this agricultural legal framework namely basic agricultural policies, agricultural production policies and policies to protect agricultural benefits. Under these categories there were several laws and regulations such as Basic rural management system, Farmland protection policy, Food security policy, Agricultural structural adjustment policy, Agricultural product quality and safety policy, Agricultural taxes policy, Agricultural subsidy policy, Agricultural product marketing policy, Agricultural science and technology policy, Agricultural resources and Environmental protection policy, Agricultural product trading policy etc. The most recent one is the Environment and Natural Resources policy which promotes the development of eco-friendly agriculture (Zhen Zhong and Xiangzhi Kong, 2014). Similar to this, the recent regulation in Indonesia is the Grand Strategy of Agricultural Development 2015-2045. This emphasizes on the development of agricultural bio industry and offers a new concept and approach on future agriculture development in Indonesia. This approach is in accordance to emerging challenges related to resource constraints, climate change, science and Innovation as well as the governance issues. The Comprehensive Agrarian Reform Law amended in 1988 aims to improve equity and productivity in the agriculture sector by establishing owner cultivator ship of economic sized farms to landless farmers and tenants. In the absence of National Land Use Act, the AFMA has instituted its policy - the establishment of the Strategic Agriculture and Fisheries Development Zones (SAFDZ) within the Network of Protected Areas for Agriculture and Agro Industrial Development (NPAAAD). SAFDZ aims to ensure that lands are efficiently utilized for agricultural purposes (Habito and Briones, 2005). After modernization, a common act was amended

Technological modernization and its impact on Agriculture, Fisheries and Fossil fuel utilization in the Asia Pacific Countries
Olaganathan Rajee, et al. 431
in Philippines in 1997. That is the Agriculture and Fisheries Modernization Act, - simply known as AFMA and it defines measures to modernize agriculture and fisheries for the country to compete in the global market. The main principle is to improve living conditions of farmers and fishermen and increase their productivity and income. An Executive Order (EO) 481 was issued in 2005 in Philippines which called for “Promotion and Development of Organic Agriculture in the Philippines”. It aims to promote and develop organic agriculture as a farming scheme that would enhance global competitiveness, forge effective networking and collaboration among stake holders, and guarantee food and environmental safety. Furthermore, it covers the integrity of organic products through approved organic certification procedures and organic production, handling and processing standards. This was later amended as the “Organic Agriculture Act” in 2010. This is to ensure prioritization and appropriation of funds to support programs, projects and activities for its operation and sustainability. In India there are several laws and regulation in place regarding the agricultural activities. Some are listed here: Seeds Act 1966, Seeds Rules 1968, Seeds (Control) Order 1983, Insecticides Act, 1968, Insecticides Rules, 1971, Dangerous Machine Act 1983, Dangerous Machines (Regulation) Rules, 2007; Environment Protection Act on genetically modified organisms - the companies dealing with development of transgenic seeds/vegetables, genetically modified seeds or planting material are obligated to meet the safety requirements as stated under this Act. Furthermore the import of GMOs may be subjected to conditions laid down in the notifications issued under the Foreign Trade (Development and Regulation) Act 1992. The latest national agricultural policy of India was announced on 28 July 2000, with its core goal being equitable inclusive growth and sustainability in terms of efficient use of resources. The policy incorporates scientific and technological advancement in its objectives in
order to compete globally. The policy encourages the use of biotechnology for evolving plants that consume less water, are drought resistant, pest resistant, contain more nutrition, provide higher yields and are environmentally safe for consumption. Socio Economic Impacts of Agriculture The employment in Agriculture is measured as a percentage of total employment in the country. Agriculture, hunting, fishing, and forestry are included in the Agriculture sector (worldbank.org). In all of the above countries, the relative value of agriculture is measured as percentage of GDP which had steadily fallen since 2011 (worldbank.org). The value added per worker is one way of measuring the productivity in this sector. In all the above countries, the value added per worker increased slowly but steadily since 2011 (worldbank.org). The statistics from 2004-2006 shows that the crop production index has slowly grown in China, Indonesia, India, and has slightly declined in the Philippines. One concern that has been raised is that these countries could be in the “Middle income traps” (Wilson, 2014). As the economy becomes stronger, wages are raised. These countries are competing with other developing countries that may have a lower cost of production. At the same time, they are also competing with developed countries that offer high value products (Wilson, 2014). As technology and equipment are added, the production per worker in the agricultural sector can increase. Labor force participation may also grow, as more people are employed. Urbanization and increased labor in the manufacturing sector may provide a boost to the GDP of a country thus agriculture may show a decreasing trend as a percentage of the GDP (Wilson, 2014). Both reduction in poverty and an increase in food security have been linked to productivity in the agricultural sector (FAO, 2006). The number of people employed in the industry and value of the industry in China, Indonesia, India, and Philippines is given in Table 2.

Technological modernization and its impact on Agriculture, Fisheries and Fossil fuel utilization in the Asia Pacific Countries
Olaganathan Rajee, et al. 432
Table 2. Employment and Value of the industry in Asia Pacific region Country Employment Value of industry
China
29.5% of the workforce was employed in Agriculture in 2014. This figure has steadily decreased each year; in 2004, 46.9% of the workforces were in agriculture (statistica.com). The value added per worker was $7.91 as measured in 2005 USD (worldbank.org).
Even though the percentage of employees has decreased, the agricultural gross production value has continued to grow. In 2014, the value was about 5.5 trillion yuan. This has grown each year; in 2004, the value was 1.8 trillion yuan (statistica.com). The value of agriculture in 2014 was 9.2% of GDP (worldbank.org). Crop production index was 133.6 in 2013 (worldbank.org).
Indonesia
35% of the workforce was employed in Agriculture in 2013 (worldbank.org). The value added per worker was $1,079 as measured in 2005 USD (worldbank.org).
The value of agriculture in 2014 was 13.4% of GDP. Crop production index was 136.6 in 2013 (worldbank.org).
Philippines
30% of the workforce were employed in Agriculture in 2014 (worldbank.org).The value added per worker was $1,148 as measured in 2005 USD (worldbank.org).
The value of agriculture in 2014 was 11.3 of GDP (worldbank.org). Crop production index 117.6 in 2013 (worldbank.org).
India 50% of the workforce were employed in Agriculture in 2013 (worldbank.org).The value added per worker was $7.16 as measured in 2005 USD (worldbank.org).
The value of agriculture in 2014 was 17.8% of GDP (worldbank.org). Crop production index was 141.9 in 2013 (worldbank.org).
Fossil Fuels and Energy During industrialization and modernization fossil fuel played a significant role in the fields of transportation, electricity, industrial power, military, and medical applications. In spite of these advancements and the potential benefits, fossil fuel technologies also played a major role behind war, political unrest, human rights abuses, extreme and permanent environmental degradation, and human disease. This section will discuss about both the sides of fossil fuels in modernization with special emphasis on environment. Energy Production and the emissions China: The energy production in 1990 was 880.8 thousand metric tons of oil equivalents and in 2012 increased to 2525.3 thousand metric tons of oil equivalent. The energy usage from 1990 to 2012 has increased by 5.9% (www.wdi.worldbank.org/table/3.6). Since 1950 China’s industrial emissions of CO2 has grown tremendously due to modernization and its coal production has increased since 1960s and due to this emission from fossil fuel has doubled. In 2008, it was approximately 1.92 billion metric tons due to fossil fuel utilization and cement production while the liquid fuel contributed 14.7% of emissions (Energy Statistics,
http://www.iea.org/statistics/). The fossil fuel emissions have grown at 5.4% per annum from 1970 to 1997 mainly due to the utilization of coal which accounted for 98.7% of total emissions in 1950 and 73.3% in 2008. There was an increase in per capita emissions due to the high GDP and in 2006 it increased up to 4.83 metric tons of carbon which is above the global average. China’s per capita emission is 2.65 in 2000, increased to 6.07 metric tons of carbon in 2010 and in 2011 it is at 6.59 metric tons (Millennium Development Goals Indicators, 2015). Indonesia: The energy production in 1990 was 168.5 thousand metric tons of oil equivalents and in 2012 it increased to 440.3 thousand metric tons of oil equivalent. The energy usage from 1990 to 2012 has increased by 3.5% (www.wdi.worldbank.org/table/3.6). The emissions from fossil fuel usage has increased since 1960s in Indonesia which has a population of approximately 230 million people and the per capita emission has increased five folds up to 0.49 metric tons of carbon in 2008 and it is below the global average. On the other hand the emissions from natural gas consumption and liquid petroleum has increased steadily since 1970s and constituted 15% and 36.6% respectively of total emissions of 2008 in Indonesia. Emissions from

Technological modernization and its impact on Agriculture, Fisheries and Fossil fuel utilization in the Asia Pacific Countries
Olaganathan Rajee, et al. 433
coal usage have increased sharply up to 47 million metric tons of carbon and it surpassed the emissions from liquid fuels for the first time in 2008. Indonesia emitted nearly 111 million metric tons of carbon in 2008 and ranked 15th at the global level (Boden, Marland and Andres, 2011). Indonesia’s per capita emission rate is 1.26 metric tons in 2000, 1.76 metric tons in 2008 and 2.3 metric tons in 2011 (Millennium Development Goals Indicators, 2015). India: The energy production in 1990 was 291.8 thousand metric tons of oil equivalents and in 2012 it increased to 544.6 thousand metric tons of oil equivalent. The energy usage from 1990 to 2012 has increased by 4.1% (www.wdi.worldbank.org/table/3.6). From 1950 to 2008, India’s CO2 emissions increased dramatically at the rate of 5.7% per year and it ranked third at the global level in emitting CO2 from fossil fuels. The emissions from coal contributed approximately 87% of emissions in 1950 and 71% in 2008 while at the same time the emission from oil utilization increased from 11 to 20%. Compared to 2007, India’s total fossil fuel CO2 emission increased 8.1% in 2008 which was equivalent to 475 million metric tons. Being the second most populated country with a population of 1.1 billion India’s per capita emission rate is 1.13 metric tons in 2000, 1.52 metric tons in 2008 and 1.69 metric tons in 2011 (Millennium Development Goals Indicators, 2015). Philippines: The energy production in 1990 was 17.2 thousand metric tons of oil equivalents and in 2012 it increased to 24.4 thousand metric tons of oil equivalent. The energy usage from 1990 to 2012 has increased by 1.6% (www.wdi.worldbank.org/table/3.6). It is projected the production will increase up to 31.6 metric tons in 2035 (DOE, 2010 a). The emissions due to coal alone accounted for 14% in 2010 (DOE, 2010 b). Philippines’s per capita emission rate is 0.94 metric tons in 2000, 0.84 metric tons in 2008 and 0.86 metric tons in 2011 (Millennium Development Goals Indicators, 2015). It is
gradually decreasing due to efforts taken by the government. Environmental Impacts of fossil fuel Fossil fuels are becoming more important in this modernized world as it provides lots of luxury services. These fossil fuels are reclaimed from the terrestrial and aquatic environment and converted into energy. Fossil fuels are considered as a nonrenewable energy and environmental impacts are linked with a large number of natural disasters / reactions which are irreversible both on a local and global level and it has to be addressed to ensure a sustainable life for the future generations. The environmental implications were discussed briefly in the following section: Global Warming, Climate change and Natural disasters CO2 is the most significant greenhouse gas that traps heat at the troposphere and contributes to global warming. As a result the earth’s average temperature increases slowly and affects ecosystems across the earth due to the resultant change in the climate. This climate change is responsible for economic consequences across the countries. The economic loss that occurred between 1950 and 1959 due to the natural disasters were USD$ 38 billion and increased to USD$535 billion in 1995 and 1999 (ECLAC 2000). During 1991-92 and 1997-98, where the El Nino was in effect, affected over 200 million people in China were by the worsened floods. In 1991, Bangladesh had 139,000 people affected by cyclones. During 1995 the worst economic loss occurred in Japan due to the earthquake. Despite being a highly developed country which is economically strong Japan faced serious setbacks. In 2003 Europe’s heat wave was the biggest event that costed more than USD$ 10 billion losses in the agricultural sector and killed approximately 20,000 people. In 2015 the heavy rainfall during the northeast monsoon caused heavy floods in South India which affected the Coromandel coastal region particularly Chennai City was hit very badly. More than 400 people died (The Hindu, 2015) and over 1.8 million people were

Technological modernization and its impact on Agriculture, Fisheries and Fossil fuel utilization in the Asia Pacific Countries
Olaganathan Rajee, et al. 434
displaced (North Rosemarie, 2015). The economic loss ranged from US$ 3 to 15 billion. This is the costliest flood and natural disaster that occurred in 2015 (Business Standard, 2015 a). The flood was attributed to the El Niño phenomenon during the El Niño year of 2015 (Business Standard, 2015 b). Apart from economic losses, the changes in global temperature also have a significant impact on other animals which subsequently cause them to enter an endangered status and might lead to their extinction. In California a marine mammal hospital has rescued 1631 marine animals in 2009 and has increased to more than 1740 stranded seals and sea lions in 2015. This increase in stranding is due to warm waters in the Pacific Ocean. The change in water temperature is mainly attributed to 2015’s exceptionally strong El Nino and this affected the distribution of fish populations and made it harder for seals and sea lions to find food. This has raised a question of what would happen to the next generation if this phenomenon continues. The Marine Mammal Center in California also insists the need for further research on both climatology and other anthropogenic activities such as pollution and overfishing that have a major impact on marine ecosystems (www.discovery.com). This type of research would help us develop a better understanding about the impacts and implement the corrective measures to not only protect the environment as an ecosystem but also help us to take measures to move towards Sustainability for future generations. Solid Wastes The fossil fuel extraction also causes the accumulation of solid waste. This type of waste increases the risk of toxic run off that can pollute surface water, ground water sources and also soil. This toxic run off endangers surrounding fauna and flora in both terrestrial and aquatic environments. The most significant impact in fossil fuel production is the potential environmental disaster that occurs during transportation. Apart from these transportation disasters at a lower level even the leakage from
storage tank and other accidents can directly damage the environment. The following are some of the spills that occurred during the transportation of fossil fuels. In China both the Xingang port oil spill and Yellow river oil spill occurred in 2010, in India, Mumbai-Uran Pipeline spill, Mumbai oil spill both occurred in 2011, in Philippines Guimaras oil spill occurred in 2006 and during 2013, typhoon Haiyan caused the oil spill, though the flow rate was not known exactly this spill has caused approximately 520 tons of oil leakage. The pollution of this sort is often costly to clean up. The extraction of oil and gas from underneath the earth causes large holes underground and this ultimately leads to land subsidence causing both environmental and property damage. Next to oil spills, coal mining is also considered disastrous as it affects the health of the environment and people. Especially so strip mining affects the environment to a greater extent. In China, Benxihu Colliery mine had an accident that occurred in 1942 and was regarded as the biggest accident in the coal mining history because it caused the death of 1549 miners in a single day. A similar incident happened in the France Courrières mine in 1906 where 1099 miners were killed after an explosion. Apart from accidents there are also other impacts such as loss of top soil, soil erosion, ash that is left after burning of coal and the materials other than coal that is brought to the surface after mining also accumulates as solid wastes and removing them is labor intensive and costly. On the other hand, during extraction certain fluids and muds containing toxic and nontoxic chemicals that are used for lubrication also accumulate and contaminate the environment. Acid Pollution Recently in East Asia there has been an increase in acid rain incidents. Among one third of the world’s population resides in East Asia and modernization has given rise to lot of industries thereby increasing the economic growth of the region over the last two decades. But within the last one decade acid rain has grown from being local problem to a major problem at a global level.

Technological modernization and its impact on Agriculture, Fisheries and Fossil fuel utilization in the Asia Pacific Countries
Olaganathan Rajee, et al. 435
Rapid industrialization and agricultural modernization especially in populated regions like China, India, Indonesia and Thailand has resulted in abnormal increases in SO2 and NOX emissions and is projected that these levels will increase in the future. Although the per capita emissions are less compared to US and Europe, scientists believe that total emissions in the regions will exceed the cumulative emissions of US and Europe by 2020 International Energy Agency Report (2006). In Asia, China and India are the two major polluters. The SO2 emissions are mainly due to the utilization of coal and in 2005 China emitted approximately 25.5 metric tons which was at the rate of 71% increase compared to 1990 and 27% compared to 2000 emissions. Since 1980 India’s SO2 emission is increasing steadily and almost doubled between 1985 and 2005. An uncertainty with SO2 was estimated in 2010-2011 by Smith et al. (2011) due to major contributions from developing countries and international shipping. From 2000 to 2009, Zhang and Reid (2010) found a statistically negligible trend in aerosol optical depth over the marine ecosystem. They found the consistent increase over Bay of Bengal, east coast of Asia and the Arabian Sea in Asia region while there was a decrease in the terrestrial emissions in China but emissions from shipping sector is increasing steadily. However, declining emissions in China and the planned decrease in shipping emissions in other Asian countries are likely to lead to further net decrease in the future at the global level (Forster et al. 2007). This will cause a change in the future of climate change. Sea level rise Sea level is increasing at an alarming rate and there is strong evidence for this. The two major reasons for this is the thermal expansion of the ocean caused by global warming and loss of land based ice such as glaciers which melt due to an increased atmospheric temperature. Research shows that from 1900 the sea level is increasing by 0.04 to 0.1 inches per year. Since 1992 it is
increasing by 0.12 inches per year (Ocean service, nd). During the past 22 years it has been increasing by 2.75 inches but the west coast of US has not seen much rise due to the Pacific Decadal Oscillation which is masking the global effect (Tia Ghose, 2015). It is projected to rise another 1 to 4 feet by 2100. The sea level rise will be accompanied by the storm surges, high tides, land subsidence, flood, salt water intrusion (NASA, nd). Due to the insufficient supply of sediments, coastal wetlands such as saltmarshes and mangroves will also decline. This physical impact will have a cascading effect on the socioeconomic impacts which is overwhelmingly negative (Nicholls et al., 2008). Besides, human activities are intensifying the incidence of subsidence on susceptible coasts, including the river deltas such as the Ganges, Brahmaputra, Mekong, and Changjiang deltas Ericson et al. (2006) and Syvitski et al. (2009). The subsidence effect caused by drainage and groundwater withdrawal have caused the coastal subsidence of up to 5 m in Tokyo, 3 m in Shanghai, 2m in Bangkok (Nicholls et al., 2009). All these cities are now depending on the water management infrastructure and flood defense mechanism to avoid the effect of subsidence. Other changes that occur in coastal areas include coastal defenses, destruction of wetlands, construction of port and harbor works, reduced supply of sediments due to the construction of dams worsens the impacts of sea level rise (Nicholls et al ., 2008 and 2009). Health Impacts The scientists from WHO reported that 160,000 people die every year due to the side effects of climate change such as floods, droughts, warmer temperatures and related disease outbreaks like malaria, diarrhea and malnutrition and will increase two times by 2020 (Alister Doyle, 2003). The chemicals used in the extraction of fossil fuel such as oil, gas and coal are extremely dangerous to human health. The chemicals used widely in fossil fuel extraction are Benzene, Sulphur di oxide, Nitrogen oxides, petroleum coke, formaldehyde, polycyclic aromatic hydrocarbons,

Technological modernization and its impact on Agriculture, Fisheries and Fossil fuel utilization in the Asia Pacific Countries
Olaganathan Rajee, et al. 436
mercury, silica, radon and hydrogen fluoride. Among these, Benzene is a carcinogen that causes leukemia, breast and urinary tract cancers. The exposure to benzene causes a reduction in both red and white blood cells in the bone marrow and decreases the human body’s immunity. The primary air pollutants from coal power plants such as Sulphur di oxide and nitrogen oxides are highly toxic and cause lung cancer and other cardiopulmonary illness. The dangers that arise from petroleum coke are not revealed to the general public. When it is burned it causes 5 to 10% more CO2 that contributes towards global warming. Another important pollutant from the coal industry is mercury which is a neurotoxin. It damages the brain and the nervous system through inhalation, ingestion or contact with skin. According to International agency for Research on Cancer, formaldehyde is highly toxic which is linked to leukemia, nasopharyngeal cancers and DNA alteration. Polycyclic aromatic hydrocarbons are also carcinogenic and mutagenic in nature and it contributes to childhood asthma, adverse birth abnormalities such as heart malformations and damage DNA. Silica and Radon are also carcinogenic in nature (Ecowatch, 2013). Apart from the public health danger, fossil fuel also contributes to climate change through combustion. Sustainability Perspective Due to the health implications, global warming, sea level rise and other associated disasters the world nations are now making an attempt to move towards renewable energy and reduce reliance on fossil fuels which was evident in the Paris Climate Change Conference (2015). During industrialization the high energy requirement of China has pushed the country towards an increase in the consumption of coal. Coal is supplying nearly 80% of China’s energy requirements. In 2009 China built the world’s largest dam, the Three Gorges Dam which provides hydroelectric power and plays a major role in reducing air pollution that arises from coal power plants. This is the major step taken by
China towards renewable energy. During the Paris Climate Change Conference (2015) China has promised to quadruple solar installations by 2020. This will be China’s contribution towards the bill to lessen climate change (Priya, 2015). The fossil fuel consumption of India increased during the industrial revolution and greenhouse gas emissions increased greatly. At the Paris Climate Change Conference (2015) India being the third largest coal consumer at the global level has complied to stop importing thermal coal by 2018 (Priya, 2015). India has also mentioned that 40% of its energy requirement will be from clean energy after 2030 till that it will be relying on coal. Yet India’s coal utilization is not close to China. At the Climate Change conference Indian Environment Minister has mentioned that India is targeting to increase the production in renewable energy sector by 10 times by 2030 (Priya, 2015). Not only China and India, the most populated countries in the world but other developed and developing countries are also moving towards renewable energy sources such as wind energy, solar energy, tidal energy, geothermal energy and nuclear energy Most of the countries are switching towards the energy efficient technologies which is a step to protect the earth for sustainable future. Socio Economic Impacts Fossil fuels The consumption of fossil fuels includes petroleum, coal, oil and natural gas products. Consumption is measured as a percentage of the total consumption of energy. The recent statistics from the countries listed below it is obvious that there is a little change from 2013 to 2014 for all of these countries (World Bank, 2015). All four of the countries relay heavily on the fossil fuels. Worldwide consumption and production of coal, oil, and gas are growing continuously (IER, 2015). Fossil fuels are stable, produce a great amount of energy, and thus can be easily transported and stored for a long period of time. They are also readily available, and have a relatively low cost of production (Conserve Energy Future, 2015). “Energy use refers to use of primary energy before transformation to other end-use fuels, which is

Technological modernization and its impact on Agriculture, Fisheries and Fossil fuel utilization in the Asia Pacific Countries
Olaganathan Rajee, et al. 437
equal to indigenous production plus imports and stock changes, minus exports and fuels supplied to ships and aircraft engaged in international transport” (World bank, 2015). It is measured as the kilogram of oil equivalent per capita. In all the countries discussed in this study, this figure has increased since 2011, and the latest figures are from 2012. It is important to discuss the renewable energy jobs in Asia. China holds 43% of renewable energy jobs in the world. Primarily, this is due to manufacturing jobs for solar panels and wind power manufacturing.
Table 3. Fossil fuel consumption and energy usage for Asia Pacific countries
Country
Fossil fuel energy consumption as measured
as a percentage of the total consumption
Energy use as reported as the kg of oil equivalent
per capita
China 88.2% 2143
Indonesia 66.5% 861
Philippines 60.7% 443
India 73.6% 624
CONCLUSION Modernization is a process of socioeconomic, cultural and environmental transformation. Today’s environment is totally different from ancient periods. As discussed in this paper technology and innovation are the main forces that still lead in the fields such as agriculture, fisheries, energy usage and have established a superior quality of life and convenience. On the downside it has caused deforestation, soil erosion, soil salinization, soil degradation, destruction fisheries, and depletion of natural resources. It has also created serious environmental problems in the world, such as air pollution, water pollution, soil pollution, increase in carbon dioxide emissions and increase in other greenhouse gases that has ultimately resulted in the increase in global temperature that has caused global warming and resultant climate change. Climate change has indirectly caused the increase in sea levels, submergence of low lying coastal areas and an overall impact on the ecosystem as such. Though
the negative impacts of the modernization have been overlooked for several centuries, now the world countries are taking lot of measures to reduce the dependency on natural resources, increasing the efficiency of the resources utilization, reforestation, restoration of fisheries, developing the technology for renewable resources. All the issues discussed in this paper helps to understand the correlation between modernization and its impact on environmental issues in the few countries mentioned in the Asia Pacific region. All these findings have played an important role in developing and implementing lots of strict policies thereby moving towards the sustainability of natural resources for future generations. But it is necessary to do a review at the global level to have a bigger picture of the issue. This type of review will help to develop new policies to protect resources and sustain the earth for future generations. REFERENCES 1. FAO 2012. The State of World Fisheries and
Aquaculture. Available at http://www.fao.org/docrep/016 /i2727e/i2727e.pdf
2. FAO-SOFIA 2006. The state of world fisheries and aquaculture. Available at http://www.env-edu.gr/Documents/The%20State%20of%20World%20Fisheries%20and%20Aquaculture%20 2006.
3. Pdf 4. FAO 2005. The State of Food and Agriculture:
Agricultural trade and poverty - Can trade work for the poor? Available at ftp://ftp.fao.org/docrep/fao/008/a0050e/a0050e_full.pdf
5. NOAA 2000. Importance of the Fishery Industry in China. Available at http://www.lib.noaa.gov /retiredsites/china/fishing.htm
6. FAO 2007. Aquaculture in China and Asia. Available at http://www.fao.org/Newsroom/common /ecg/1000565/en/factsheet.pdf

Technological modernization and its impact on Agriculture, Fisheries and Fossil fuel utilization in the Asia Pacific Countries
Olaganathan Rajee, et al. 438
7. FAO 2013a, Fisheries and Aquaculture Country Profile, Food and Agriculture Organization of the United Nations. Available at http://www.fao.org/fishery/countryprofiles/search/en.
8. FAO 2013b, ‘FAOSTAT’, Food and Agriculture Organization of the United Nations, Rome. Available at faostat.fao.org/site/368/DesktopDefault.aspx?PageID=368#ancor
9. FAO 2011. Fishery and Aquaculture Statistics. Available at http://www.fao.org/docrep /019/i3507t/i3507t.pdf
10. MPEDA 2013. Marine products export crosses US 5 Billion in 2013-14. Available at http://www.mpeda.com/press.pdf
11. FAO 2010. Fishery and Aquaculture Statistics. Available at http://www.fao.org/docrep/015/ba0058t/ ba0058t.pdf
12. Handbook on Fisheries Statistics 2014. Government of India. Available at http://dahd.nic.in /dahd/WriteReadData/Handbook/Cover%20Page.pdf
13. Ahmad AT, Tan, Geik-Hong, Yasin, AH (2003) Assessment, management and future directions for coastal fisheries in Asian countries. WorldFish Center conference proceedings; p. 543-576.
14. BFAR 2011. Philippine Fisheries Profile.
Available at http://www.bfar.da.gov.ph/files/img /photos/2011FisheriesProfile(Final)(4).pdf
15. www.worldfishing.net/news101. 16. Hannesson, R (1995) Fishing on the High
Seas: Cooperation or competition? Marine Policy 19(5): 5.
17. Botsford LW (1997) The management of fisheries and marine ecosystems. Science 275(5325): 7.
18. Haggan N (1998) Reinventing the tree: reflections on the organic growth and creative
pruning of fisheries management structures. Reinventing Fisheries Management. T. J. Pitcher, Hart, J.B., & Pauly, D. London, Kluwer Academic Publishers: p20-29.
19. Charles AT (1998) Fisheries in Transition. Ocean Yearbook 13. C. Mann-Borgese, A., McConnell, M & Morgan, J.R. (Editors). University of Chicago Pres, Chicago. p 15-37.
20. Pauly D, Christensen, V and Guenette (2002). Towards sustainability in world fisheries. Nature 418, p 689-695.
21. Frank Kenneth, Brian Petrie1, Jae S. Choi1, William C. Leggett (2005). Trophic cascades in a formally cod dominated ecosystem. Science. 308: 1621-1623.
22. Garcia SM, Zerbi A, Aliaume C, Do Chi T, Lasserre G (2003). The ecosystem approach to fisheries. Issues, terminology, principles, institutional foundations, implementation and outlook. FAO Fisheries Technical Paper, 443. 71 pp.
23. Mous PJ, Pet JS, Arifin Z, Djohani R, Erdmann MV, Halim A, Knight M, Pet-Soede L, and Wiadnya G (2005). Policy needs to improve marine capture fisheries management and to define a role for marine protected areas in Indonesia. Fisheries Management and Ecology. 12:259-268.
24. FAO 2006. Status and potential of fisheries and aquaculture in Asia and the Pacific. Available at http://www.fao.org/3/a-ag110e/
25. Green Facts, 2015. Available at http://www.greenfacts.org/en/fisheries/l-2/02-fishers-farmers-fleet.htm
26. Wang J, Huang J, Rozelle S. 2010. Climate change and China's agricultural sector: an overview of impacts: adaptation and mitigation. Issue brief no. 5, International Food and Agriculture Trade Policy Council 2010.
27. Feng Z. 2007. China's population, food security and arable land protection. Population Study 2007;2:15-29.
28. Gaud SW. 1968. The Green Revolution: accomplishments and apprehensions. Address to the Society for International Development.

Technological modernization and its impact on Agriculture, Fisheries and Fossil fuel utilization in the Asia Pacific Countries
Olaganathan Rajee, et al. 439
Available online at: http://www.agbioworld.org/biotech-info/topics/borlaug/borlaug-green.html.
29. Yuan L, editor. 1992. Current status of two line hybrid rice research. 1992. Agriculture Publisher of China.
30. Katsura K, Maeda S, Horie T, Shiraiwa T. 2007. Analysis of yield attributes and crop physiological traits of Liangyoupeijiu, a hybrid rice recently bred in China. Field Crops Research 2007.103:170-177.
31. National Bureau of Statistics of China. 2009. China statistical yearbook 2009. Beijing: China Statistics Publishing; 2009.
32. Sam Portch and Ji yun Jin (nd). Fertilizer use in China : Types and amounts. Agricultural Sciences – Vol II retrieved from http://www.eolss.net/Eolss-sampleAllChapter.aspx
33. History of Soybeans and Soyfoods in China and Taiwan, and in Chinese Cookbooks, Restaurants, and Chinese Work with Soyfoods Outside China (1024 BCE to 2014): Extensively Annotated Bibliography and Sourcebook, Including Manchuria, Hong Kong and Tibet Page 2854.
34. Van der Kroef, 1963. Indonesia rice economy: problems and prospects. Am. J. Econ. Sociol., 22 (1963), pp. 379–392
35. Rosset, P., and J. Collins, 1998. Lessons from the green revolution. Food First Publ., San Francisco.
36. FAO, 2015. FAOSTAT. Food and Agriculture Organization of the United Nations, Rome, Italy Web http://faostat.fao.org/default.aspx
37. FAO, 2011. FAOSTAT. Food and Agriculture Organization of the United Nations. Available at http://www.faostat.fao.org/default.aspx
38. Philippines economy posts, 2011. "Philippine economy posts 7.1 percent GDP growth". National Accounts of the Philippines. National Statistical Coordination Board. Retrieved from http://www.nscb.gov.ph/sna/2013/1st2013/2013qpr1.asp#.VoZQ3vmqqko
39. Kumar R (2005) Land Records-Issues and Innovations: A case study of Bhojpur, Bihar", Computerisation of land records edited by Wajahat Habibullah & Manoj Ahuja, Sage Publications, ISBN 0-7619-3347-6.
40. Shiva, V. 1993. Monocultures of the mind: Biodiversity, Biotechnology and Scientific Agriculture. London: Zed books.
41. Abrol IP (2000) Agriculture in India of Planning commission. Available at www.planningcommission.nic.in/reports/sereport/ser/.../agricul.doc
42. Lappe, F.M., J. Collins, and D. Kinley. 1982. United States-sponsored development: is it possible? p. 483. In R. Anderson et al .(ed) Science, politics and the agriculture revolution in Asia. AAAS, Washington DC and Westview Press, Boulder.
43. Janvry, A., and E. Sadoulet. 2002. World poverty and the role of agricultural technology: direct and indirect effects. J. Dev. Studies 38(4):1-26.
44. Pereira, W. 1996. The inefficiency of western agriculture. Organic farming source book. The Other India Press, Delhi and Third World Network, Penang.
45. Gadgil, M., N.S. Heman, and D.M. Reddy. 1996. People, refugia and resilience linking soil and ecological systems. In F. Berkes and C. Folke (ed) Management practices and social mechanisms for building resilience. Cambridge Univ. Press, UK.
46. Dogra, B. 1990. Green Revolution: no joy for the poor. p. 242-244. In Return to the good earth—damaging effects of modern agriculture and the case for ecological farming. 2nd ed. Third World Network, Penang.
47. FAO. 2004. FAOSTAT, Database of FAO. www.fao.org. FAO, Rome.
48. Steinbrecher, R.A. 1996. From Green to Gene Revolution: the environmental risks of genetically engineered crops. Ecologist 26:6.
49. Ho, M.W. 1998. Genetic engineering: Dream
or nightmare? Third World Network, Penang.
Technological modernization and its impact on Agriculture, Fisheries and Fossil fuel utilization in the Asia Pacific Countries
Olaganathan Rajee, et al. 440
50. Stone, G.D. 2002. Fallacies in the genetic modification wars: implications for developing countries and anthropological perspectives. Curr. Anthrop. 43:4.
51. Wilson, A.K., T.L. Jonathan, and R.A. Steinbrecher. 2006. Transformation-induced mutations in transgenic plants: analysis and biosafety implications. Biotech. Genetic Trade Rev. 23.
52. Niggli, U., J. Early, and K. Ogorzalek. 2007. Organic agriculture and environmental stability of the food supply. Available at www.fibl.org/index.php and www.wwwf.org.
53. FAO. 2002. Organic agriculture, environment and food security. FAO, Rome.
54. ESCAP. 2002. Organic agriculture and rural poverty alleviation: potential and best practices in Asia. Econ. Social Comm. Asia and the Pacific (ESCAP), Bangkok.
55. IFAD (Int. Fund Agric. Dev). 2002. IFAD strategy for rural poverty reduction in Asia and the Pacific. Available at http://www.ifad.org/operations/regional/2002/pi/pi.htm. IFAD, Rome.
56. Climate Change Conference, 2015. Available at http://blogs.ei.columbia.edu/2015/11/11/the-paris-climate-change-conference-what-you-need-to-know/
57. Zhen Zhong and Xiangzhi Kong, 2014. The framework of Agricultural policy and Recent major agricultural policies in China. Retrieved from http://ap.fftc.agnet.org/ap_db.php?id=255
58. Habito C and Briones R (2005) Philippine Agriculture over the years: Performance, policies and Pitfalls. Paper presented at the conference entitled “Policies to strengthen productivity in the Philippines” Makati City, Philippines, June 27, 2005.
59. worldbank.org. Available at http://www.worldbank.org/en/topic/agriculture
60. Wilson, W. Aug 2014. Beating the middle-income trap in Southeast Asia. Heritage foundation special report)].
61. www.statistica.com 62. www.wdi.worldbank.org/table/3.6
63. Energy Statistics, http://www.iea.org/statistics/ 64. Millennium Development Goals Indicators,
2015. Available at: http://mdgs.un.org/unsd/mdg/Series Detail.aspx?srid=751
65. Boden TA, Marland G, Andres RJ 2011. Global, Regional, and National Fossil-Fuel CO2 Emissions in Trends. (Carbon Dioxide Information Analysis Center, Oak Ridge National Laboratory, U.S. Department of Energy, Oak Ridge, TN).
66. DOE (Department of Energy) –– (2010a), ‘Energy Reform Agenda’ website page, Available at www.doe.gov.ph/era.htm
67. DOE (Department of Energy)–– (2010b), The Philippine Energy Plan 2009–2030, Available at www.doe.gov.ph/PEP/default.htm
68. ECLAC 2000. Available at http://www.cepal.org/en/pressreleases/eclac-proposes-debt-relief-english-speaking-caribbean-invest-fight-against-climate
69. The Hindu, 2015. "347 dead in rain-related incidents since Oct 1 in TN". The Hindu. 10 December 2015. Retrieved 10 December 2015.
70. North, Rosemarie (1 December 2015). "Poorest hit hardest by South Indian floods". IFRC. Retrieved 25 November 2015.
71. Business Standard, 2015 a. Retrieved from http://www.business-standard.com/article/current-affairs/chennai-floods-are-world-s-8th-most-expensive-natural-disaster-in-2015-115121100487_1.html
72. Business Standard, 2015 b. Retrieved from http://wap.business-standard.com/article/current-affairs/climate-experts-say-el-nino-responsible-for-heavy-chennai-rains-115120201026_1.html
73. www.discovery.com. Thousands of Hungry Seals & Sea Lions Are Washing Up in California. Available at http://www.discovery.com/dscovrd/wildlife/thousands-of-hungry-seals-are-washing-up-in-california/

Technological modernization and its impact on Agriculture, Fisheries and Fossil fuel utilization in the Asia Pacific Countries
Olaganathan Rajee, et al. 441
74. International Energy Agency. (2006) Trends in SO2 emissions. IEA-Coal.org (2006). Retrieved from http://www.iea-coal.org.uk/documents/81545/6152/Trends-in-SO2-emissions
75. Smith S J, van Aardenne J, Klimont Z, Andres R, Volke A C and Delgado Arias S 2011 Anthropogenic sulfur dioxide emissions: 1850–2005 Atmos. Chem. Phys. 11 1101–16
76. Zhang J and Reid J S, 2010. A decadal regional and global trend analysis of the aerosol optical depth using a data-assimilation grade over-water MODIS and Level 2 MISR aerosol products Atmos. Chem. Phys. 10 10949–63.
77. Forster P et al., 2007. Changes in atmospheric constituents and in radiative forcing Climate Change 2007: The Physical Science Basis. Contribution of Working Group I to the Fourth Assessment Report of the Intergovernmental Panel on Climate Change ed S Solomon, D Qin, M Manning, Z Chen, M Marquis, K B Averyt, M Tignor and H L Miller (Cambridge: Cambridge University Press).
78. Ocean Service nd. Retrieved from http://oceanservice.noaa.gov/facts/sealevel.html
79. Tia Ghose, 2015. NASA: Rising Sea Levels More Dangerous Than Thought. Retrieved from http://www.livescience.com/51990-sea-level-rise-unknowns.html
80. NASA, nd Sea level Rise. Retrieved from http://climate.nasa.gov/effects/
81. Nicholls et al., in Climate Change 2007: Impacts, Adaptation and Vulnerability. Contribution of Working Group II to the Fourth Assessment Report of the Intergovermental Panel on Climate Change, M. L. Parry et al ., Eds. (Cambridge Univ. Press, Cambridge, 2007)
82. Ericson JP, Vorosmarty C, Dingman S, Ward L, Meybeck M. 2006. Global Planet. Change 50, 63 (2006).
83. Syvitski et al., JPM. Nat. Geosci. 2, 681 (2009).
84. Nicholls RJ, Wong PP, Burkett V, Woodroffe CD, Hay J. 2008. Ranking Port Cities with High Exposure and Vulnerability to Climate Extremes: Exposure Estimates. Environment Working Papers No. 1 (Organization for Economic Co-Operation and Development, Paris, 2008). Sustainability Sci. 3, 89.
85. Nicholls RJ, Woodroffe CD, Burkett VR. 2009. in Climate Change: Observed Impacts on Planet Earth, T. M. Letcher, Ed. (Elsevier, Oxford, 2009), pp. 409–424.
86. Alister Doyle 2003. Available at http://story.news.yahoo.com/news?tmpl=story&cid=570&ncid=753&e=1&u=/nm/20030930/scnm/environment_russia_health_dc
87. Ecowatch. 2013. 10 Most Toxic Ingredients Used In Coal, Oil and Gas Production. Available at: http://ecowatch.com/2013/12/09/10-toxic-ingredients-used-in-coal-oil-gas-production/
88. Priya 2015. To avert disaster, China and India must make fossil fuels a thing of the past. South China Morning Post. Retrieved from http://www.scmp.com/comment/insight-opinion/article /1889023/avert-disaster-china-and-india-must-make-fossil-fuels-thing
89. IER 2015. Institute for Energy Research, (June 2015), Available at http://www.Instituteforenergy research.org
90. Paris Climate Change Conference, 2015. Available at http://www.theguardian.com/environment/2015 /jun/02/everything-you-need-to-know-about-the-paris-climate-summit-and-un-talks
91. http://www.conserve-energy-future.com, advantages_FossilFuels.php
92. http://www.vox.com.