technology as a competitive advantage in supermarket
TRANSCRIPT

TECHNOLOGY AS A COMPETITIVE ADVANTAGE
IN SUPERMARKET OPERATIONS IN NAIROBI COUNTY
BY
MUTISYA HARLEY KISYULA
A RESEARCH PROJECT REPORT SUBMITTED IN PARTIAL FULFILLMENT OF THE REQUIREMENT FOR AWARD OF MASTER OF BUSINESS ADMINISTRATION, SCHOOL OF BUSINESS, UNIVERSITY OF NAIROBI
OCTOBER 2015
University of NAIROBI Library
0478796 6
DECLARATION
This research proposal is my original work and has never been presented for any degree in this or
any other university.
Signed...........(fclfcfl.:........................ Dat
Mutisya Harley Kisyula
D61/70914/2014
/
This research report has been submitted for examination with my approval as the university
Supervisor.
School of Business,
University of Nairobi
i

DEDICATION
I thank the almighty God for His providence. My wife Joyce kept the family together as I was
busy with my studies. My daughter Kasese too sacrificed a lot to keep me awake till late for my
assignments and this project too. God bless you all.
n

ACKNOW LEDGEM ENT
I wish to express my heartfelt gratitude to a number of individuals and scholars who were
particularly very instrumental in the completion of the study and thanks to God for his unlimited
grace. First, I am indebted to my supervisor Michael Chirchir, lecturer in the department of
management science, School of Business University of Nairobi who rendered valuable judgment
at the adequacy of the study. I appreciate his wise guidance, creative thinking, encouragement
and kindly scholarly criticism with effective correction; which made the study enjoyable.
Without this inspiration the study would not have taken shape.
My sincere gratitude also goes to the respondents who took their time to fill in the questionnaires
and provided us with the relevant information that addressed our research objectives. Many
thanks to the University o f Nairobi for the library materials that supported in search for
knowledge throughout the entire study; with the current technology research was made even
lighter, easy and more enjoyable.
My heartfelt gratitude goes to my father, and my mother-in-law for their wise guidance, counsel
and prayers. To crown it all, I thank our Almighty God for his unlimited grace, love provision
and protection throughout the entire course; indeed knowledge and understanding actually comes
from him.

TABLE OF CONTENTS
DECLARATION..................................................................................................................................i
DEDICATION.....................................................................................................................................ii
ACKNOWLEDGEMENT............................................................................................................... iii
LIST OF FIGU RES.........................................................................................................................vii
LIST OF TABLES..........................................................................................................................viii
LIST OF ABBREVIATIONS......................................................................................................... ix
ABSTRACT......................................................................................................................................... x
CHAPTER ONE: INTRODUCTION............................................................................................ 1
1.1 Background...............................................................................................................................1
1.1.1 Technology in Business.................................................................................................. 2
1.1.2 Competitive Advantage.................................................................................................. 4
1.1.3 Supermarkets in Nairobi County....................................................................................6
1.2 The Research Problem............................................................................................................ 8
1.3 Objectives of the study...........................................................................................................11
1.4 Value of the Study..................................................................................................................11
CHAPTER TWO: LITERATURE REVIEW .......................................................................... 12
2.1 Introduction.............................................................................................................................12
2.2 Theoretical Perspectives of Technology Adoption.............................................................12
2.2.1 Instrumentalization Theory........................................................................................... 12
2.2.2 Unified Theory o f Acceptance and Use of Technology.............................................13
iv

2.2.3 Critical Theory of Technology...................................................................................... 13
2.2.4 Diffusion on Innovation (DOI) Theory........................................................................ 14
2.2.5 Institutional theory..........................................................................................................14
2.3 Technology Applications...................................................................................................... 15
2.3.1 Information Communications Based Technology...................................................... 15
2.3.2 Non-Information Communications Based Technology..............................................19
2.4 Technology and Competitive Advantage in Business........................................................ 20
2.5 Challenges in the Implementation of Technology............................................................. 22
2.6 Summary of Literature Review and Knowledge G ap......................................................... 24
2.7 Conceptual Framework.........................................................................................................27
CHAPTER THREE: RESEARCH DESIGN............................................................................ 28
3.1 Introduction............................................................................................................................ 28
3.2 Research Design.....................................................................................................................28
3.3 Population................................................................................................................................28
3.4 Data Collection.......................................................................................................................29
3.5 Data Analysis......................................................................................................................... 30
CHAPTER FOUR: DATA ANAYSIS, RESULTS AND DISCUSSION.............................32
4.1 Introduction..................................................................................................................................32
4.2 Response Rate............................................................................................................................. 32
4.3 General information....................................................................................................................33
4.4 Extent to which technology is applied in the management of supermarkets operations..... 37
4.5 Impact of the adoption of such technology in achieving competitive advantage.................39
4.6 Pearson Correlation Analysis.....................................................................................................42
4.7 Regression Analysis....................................................................................................................44
v

4.8 Challenges faced in the implementation of the technology................................................ 49
CHAPTER FIVE: SUMMARY OF THE FINDINGS, CONCLUSION AND
RECOMMENDATIONS.................................................................................................................52
5.1 Introduction..................................................................................................................................52
5.2 Summary of the Findings........................................................................................................... 52
5.2.1 Adoption of technology in management of operations.................................................. 53
5.2.2 Impact of technology on competitive advantage.............................................................. 54
5.2.3 Challenges faced in adopting technology.......................................................................... 54
5.3 Conclusion....................................................................................................................................55
5.4 Recommendations....................................................................................................................... 56
5.5 Implications of the study on policy, Theory and practice.......................................................57
5.5 Limitations of the Study............................................................................................................. 57
5.6 Areas of further Research........................................................................................................... 58
REFERENCES..................................................................................................................................59
Appendix I: Questionnaire............................................................................................................... 64
Appendix II: List of Supermarkets in Nairobi............................................................................... 68
Appendix III: Supervisor Allocation Form.....................................................................................69
Appendix IV: Proposal Correction Form........................................................................................70
Appendix V: Data Collection Form................................................................................................ 71

LIST OF FIGURES
Figure 4.1: Response R ate....................................................................................................................33
Figure 4.2: Work Experience............................................................................................................... 34
Figure 4.3: Level of Education............................................................................................................ 34
Figure 4.4: Age of Respondents.................................. 35
Figure 4.5: Type of Supermarket......................................................................................................... 36
Figure 4.6: Size of supermarket........................................................................................................... 36
vii
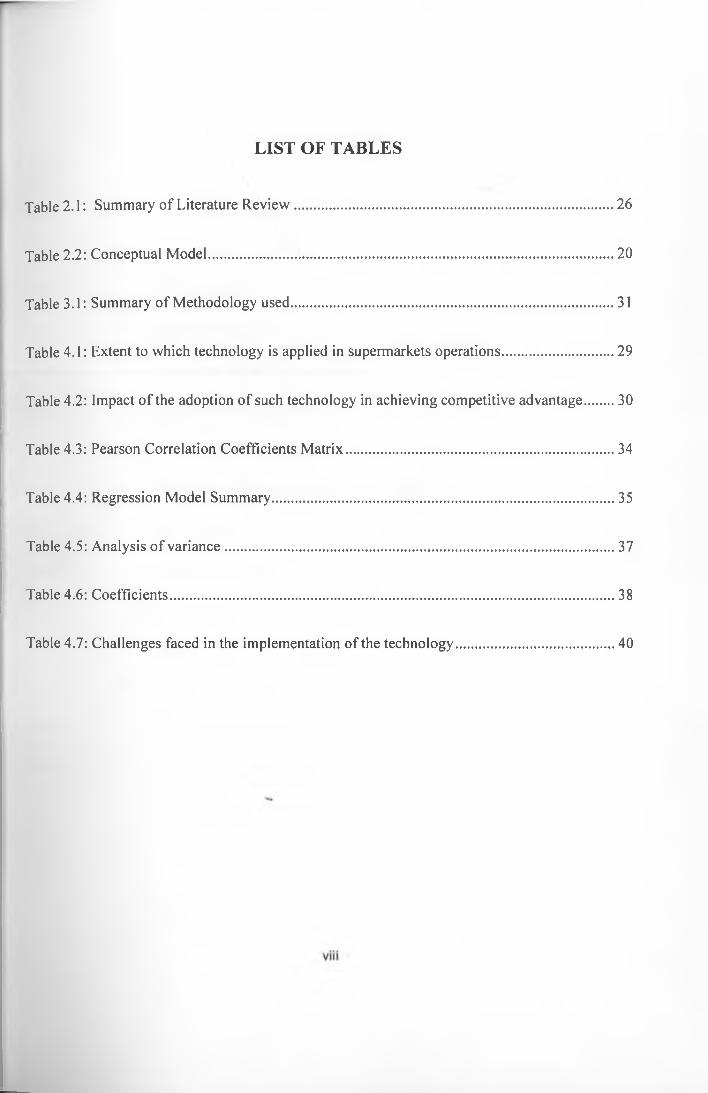
LIST OF TABLES
Table 2.1: Summary of Literature Review........................................................................................26
Table 2.2: Conceptual Model............................................................................................................... 20
Table 3.1: Summary of Methodology used......................................................................................... 31
Table 4.1: Extent to which technology is applied in supermarkets operations............................... 29
Table 4.2: Impact of the adoption of such technology in achieving competitive advantage.......30
Table 4.3: Pearson Correlation Coefficients Matrix.......................................................................... 34
Table 4.4: Regression Model Summary.............................................................................................. 35
Table 4.5: Analysis o f variance........................................................................................................... 37
Table 4.6: Coefficients.......................................................................................................................... 38
Table 4.7: Challenges faced in the implementation of the technology.............................................40
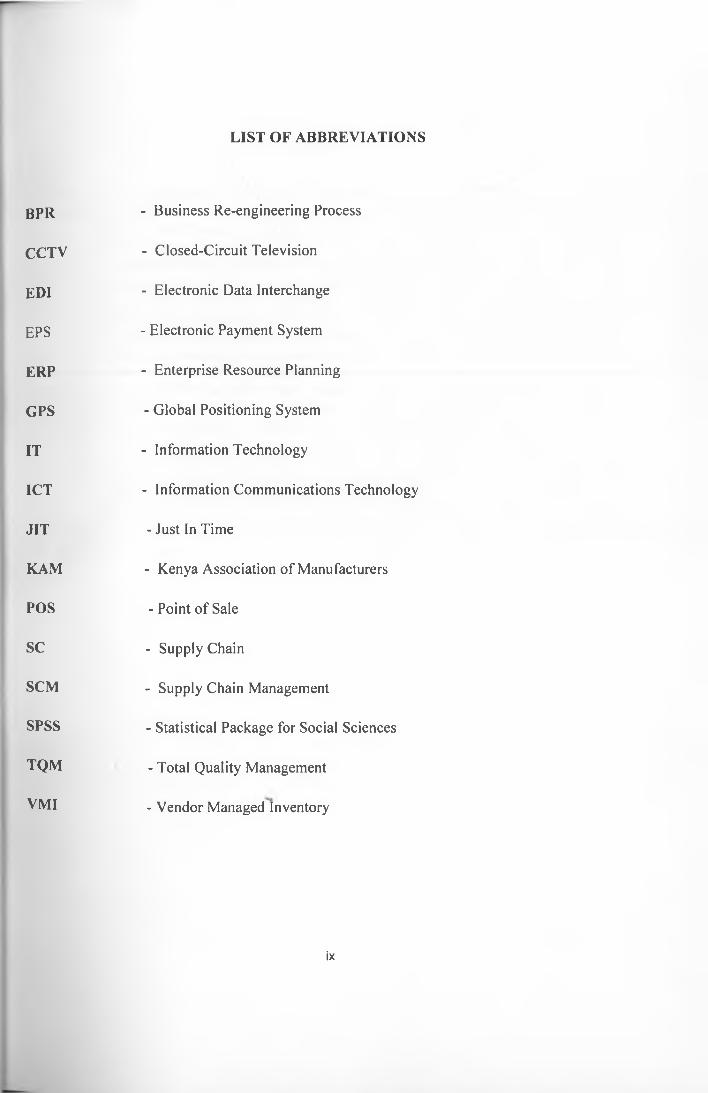
LIST OF ABBREVIATIONS
BPR
CCTV
EDI
EPS
ERP
GPS
IT
ICT
JIT
KAM
POS
SC
SCM
SPSS
TQM
VMI
- Business Re-engineering Process
- Closed-Circuit Television
- Electronic Data Interchange
- Electronic Payment System
- Enterprise Resource Planning
- Global Positioning System
- Information Technology
- Information Communications Technology
- Just In Time
- Kenya Association of Manufacturers
- Point of Sale
- Supply Chain
- Supply Chain Management
- Statistical Package for Social Sciences
- Total Quality Management
- Vendor Managed Inventory
ix

ABSTRACT
Technology is a prerequisite for globally competitive organizations. The study aimed at investigating technology as a competitive advantage in supermarket operations in Nairobi County, Kenya. The study sought to answer the following specific objectives: to determine the extent to which technology is applied as a technique to gain competitive advantage, to establish the impact of implementation of technology on the supermarkets’ competitive advantage, and to determine challenges faced in the implementation of technology in supermarkets. A cross sectional survey design was adopted, targeting 46 employees of the supermarkets in Nairobi County. Out of the 46 questionnaires distributed, 42 were returned which represented 91.3% response rate. Primary data was used in the study leading to collection and analysis of quantitative data using descriptive statistics. Statistical Package for Social Sciences (SPSS version 22.0) as a tool of analysis presented results through percentages, means, and standard deviations. The inferential analysis which includes regression and correlation was done to establish the relationship between independent variable and operational performance of supermarkets in Nairobi County. The study concluded that the adoption and applications of technology improved operational performance of the supermarkets. There were certain limitations such as company policy prohibiting staff from providing certain information without prior authorization from the Headquarters which was also against the time allocated. It was difficult to collect the questionnaires on times agreed because most managers had very busy schedules. Although the study was on technology as a competitive advantage in supermarkets operations in Nairobi County, it is recommended that the study be carried in other sectors and industries in the Kenyan economy so as to create value in those sectors.

CHAPTER ONE: INTRODUCTION
1.1 B ack grou nd
A common feature of the environment in which all types of organizations operate is the presence
of ever-accelerating rate of change. Management and the information systems that support the
organizations must lean towards changing proportionately in order to survive and prosper. The
typical changes taking place today within organizations are; more competition, faster pace
leading to shorter cycle times, and increased globalization (Lucey, 2005). Internet and global
communications have greatly reduced the economic and cultural advantages of developed
countries because the Western world is competing for markets and resources with the highly
educated and motivated populations from the developing countries (Friedman, 2007).
Vella (2012) posits that in order to stay competitive globally in a complex business world,
companies are today incorporating technology into their supply chain management systems; and
this is due to customer demands on quality and service. Managers equally have realized that
technology can help them ensure accountability and visibility, production tracking, mistake
proofing, quality improvements, vehicle tracking through GPS, electronic invoicing, bar-coding,
CCTV surveillance, stocks management, and easier communications through smart phones.
Technology, as the knowledge and application of tools, techniques, systems, and methods of
organization, dates back to the era when human beings started use of tools, but the use was
geared up during the industrial revolution era so as to achieve mass production. These include
manual stock taking techniques such as ABC analysis, and delivery systems such as JIT.1

Information communications technology (ICT) is an essential infrastructural system for
gathering, storing, retrieving, processing, analyzing and transmitting information and is the back
bone of digitized firms and a platform for e-commerce (Wikipedia). These include internet based
technologies such as transport management systems, vendor managed inventory systems,
enterprise resource planning systems, and electronic payment systems.
According to Laudon and Laudon (2012), digital firms sense and respond to their environments
far more rapidly than traditional firms, giving them more flexibility to survive in turbulent times.
There is a growing interdependence between a firm’s ability to use information technology and
its ability to implement corporate strategies and achieve its corporate goals. Increasing market
share, becoming high-quality product, innovation, and employee productivity depend more on
the quality of information systems in the organization. Businesses invest heavily in information
systems to achieve six strategic business objectives: operational excellence, innovation, services
and business models, customer and supplier intimacy, improved decision making, and
competitive advantage.
1.1.1 Technology in Business
According to Sople (2011), technology is playing a major role in operational effectiveness and
efficiency of various functional areas of management. The importance of technology is today
being directed to the value addition in organizations’ competitive capacity (Chase and Jacobs,
2010). The ability by managers to forecast demand, manage order fulfillment, inventory levels
and production schedules is necessary for a logistical performance. Information technology
2

enables real time information processing and analysis, accuracy, reliability and speed in
information flow in the supply chain leading to productivity; hence profits for the organizations.
Companies use technology and ICT in their logistics and transportation functions mainly to
achieve cost reduction, customer satisfaction, and revenue and market share growth objectives.
Langley, Coyle and Novack (2009), and Sople (2011) concur that in support to the three
objectives, and to provide practical solutions, technology and ICT in SCM should be accessible,
integrated, relevant, accurate, timely and transferable. When functions are integrated through
technology, information is readily available to consumers for decision making, and operations
are synchronized and synergized for efficiency, the right decisions are made based on accurate
and reliable information, channel decisions transform to goods availability on timely basis.
Chopra and Meindl (2010), and Burt, Dobler and Starling (2010) agree that Wal-Mat, the largest
discount retailer in the world, built its competence by leveraging point-of-sale technology. The
scanning is able to speed up customer movement and gather information on items sold. The
aggregated information is then electronically sent to supply collaborator for replenishment. This
has improved customer service and decreased inventories. Sople (2011) traces use of bar code to
retail markets in storage, retrieval, dispatch and transit of products. The bar codes are assigned to
particular inventory item, and then scanners are used to identify the product at the point of sale or
retrieval.
Use of technology and information systems to provide firm integration is necessary for customer
and supplier relationship, and also leads to organized transport systems. Handfield (2013) posits
that information systems can use optimization modeling and simulation to decide how many
3

units to transport from one warehouse of the retail markets to another. Planning and execution of
networks, routes, and modes through use of technology provides information for decisions on
costs, customer locations and transport selection. Murphy and Wood (2008) write that global
positioning system (GPS) has dramatically changed the ability of the businesses to manage the
actual movements in the distribution system.
Strategic procurement decisions require use of information systems and technology for online
quotations, e-negotiations and e-payments; making it efficient to purchase goods and services
without leaving one’s desk. Processing and Packaging - Processing and conveyance of good
around the manufacturing facility performs optimally with technology. The volumes of materials
handled in a day through the use of technology save on costs as well as promoting economies of
scale Chopra et al., (2010).
1.1.2 Competitive Advantage
Gunasekaran and Ngai (2008), bring a view of responsive supply chain in relation to competitive
advantage of a firm. Knowledge management in the design of supportive systems creates an
enabling infrastructure, strategic planning follows in the implementation of the right information
systems, and then a network of partnering firms lead to speed to the market for customer
satisfaction. Supply chain management includes long term and short term relationships between
main stakeholders with the orientation for customer service, sharing information, profits and
risks. Kopczak and Johnsons (2003) define this action as the cause and effect that provides the
mutual competitive advantage. This increases effectiveness relative to the competitors by
4

reducing costs, increasing profits and customer satisfaction (Elmuti, 2002; Wisner, Long & Tan,
2012).
Competition today is on value chains and calls for collaboration between functions, across and
beyond the value chain; caused by a shift in expectations on the supply chain to deliver
operational excellence in the performance organizations (Council of Supply Chain Management
Professionals, 2013). Supply chain management is seen as the internal and external integration of
the enterprise process with the customers and suppliers creating value for the customers (Cooper
& El Iran, 1993; Cooper & Lambert, 1997).
Johnson and Scholes (2002) define strategy as the direction and scope of an organization over a
long, term which achieves advantage for the organization through its configuration of resources
within a challenging environment with an aim to meet the needs of market and fulfill stakeholder
expectations and is often stated explicitly in the organization mission statement. Ansoff (1998)
posits that competitive strategy is the distinctive approach which the firm uses or intends to use
to succeed in her market and adds that the formulation of competitive strategy include the
consideration of strength weakness opportunities and threats.
Porter (1985) describes the competitive strategy model with three main pillars as cost leadership,
differentiation and focus, with a stuck in the middle positions for firms that do not proactively
embrace strategy. In cost leadership, some of the supermarkets in Nairobi offer competitive
pricing of their products across board to attract the masses. Kariuki (2011) established that
Naivas and Ukwala supermarkets were in this category of targeting low income earners through
5

offering low priced goods leading to volume sales. The niche market is differentiated by some
supermarkets like Nakumatt targeting customers whose mentality is value for money coupled
with 24 hour service and also placement of their stores in upper markets. On focus strategy, some
other supermarkets target estate customers because they cannot compete effectively in suburbs
and city centre.
Building on Porter’s strategy, Turban, Lee and King (2006) cited 12 competitive strategies
among which is growth strategy with web-based selling strongly quoted as a supporting pillar.
Thomson, Strickland and Gamble (2007) observe that a company strategy is management action
plan for running the business and conducting operations. Collaboration links vendors and the
firm to share common infrastructure that leads to significant reliability of service delivery.
Technology and automation adoption have led to better planning, transaction processing,
monitoring and tracking, and better material handling methods.
1.1.3 Supermarkets in Nairobi County
The supermarkets, like any other marketing channel today, have realized the potential of
customer demographics, lifestyles and purchasing power. A study by Kariuki (2011) examined
the cost and product differentiation as generic competitive strategies applied by supermarkets in
Nairobi and identified modernization and consumer behaviour influence business operating* 4-
environment. This operating environment could be turbulent if technology applied by
competition is directly affecting internal business competitiveness. Due to customer preferences,
deregulations and globalization, innovation via use of technology has revolutionalised the retail
industry leading to market growth. Mutegi (2013) studied supermarkets operations in Nairobi
6

and established that supermarkets use differentiation strategies such as market and innovation
strategies in a bid to remain competitive in the market only to a little extent. Use of technology is
a key factor in innovativeness especially in supermarkets operations where the rate of change in
customer expectations is very high. Service line, geographical areas and customer characteristics
inform focus strategies by supermarkets affects performance to a little extent.
According to Richbell and Kite (2007), shoppers in the UK supermarkets showed a trend of
evening and early morning shopping. Majority of the workers were on shift schedules. Owuor
(2009) looks at 24-hour economy in Kenya; in reference to supermarkets operating round the
clock as a solution to nocturnal customers with hustle free service. With this kind of a service,
there is increased trade, with night sales volumes increasing to being equal to day sales.
According to Ouma, Mwangi and Oduk (2013), the supermarket chains have continued to grow
tremendously because of the self service operations and the nature of the Kenyan customer on
touch and feel mentality. The latest information on each of the firms’ websites indicates that
Nakumatt operates 16 branches, Uchumi supermarket has 13, and Naivas has 14, with Tuskys
having 23 branches in Nairobi County. Other supermarkets include: Ukwala, Eastmatt,
Chandarana, Rikana, Cleanshelf, and others not in any order of size. Supermarkets are very
demanding customers because they command very high and complex supply chain management
for goods, services and information flow as well as reverse logistics.
A study by Kestrel Capital (2012) classified Nakumatt, Uchumi, Tuskys, and Naivas
supermarkets as the large retails stores based on the fact that each one of them controlled a
7
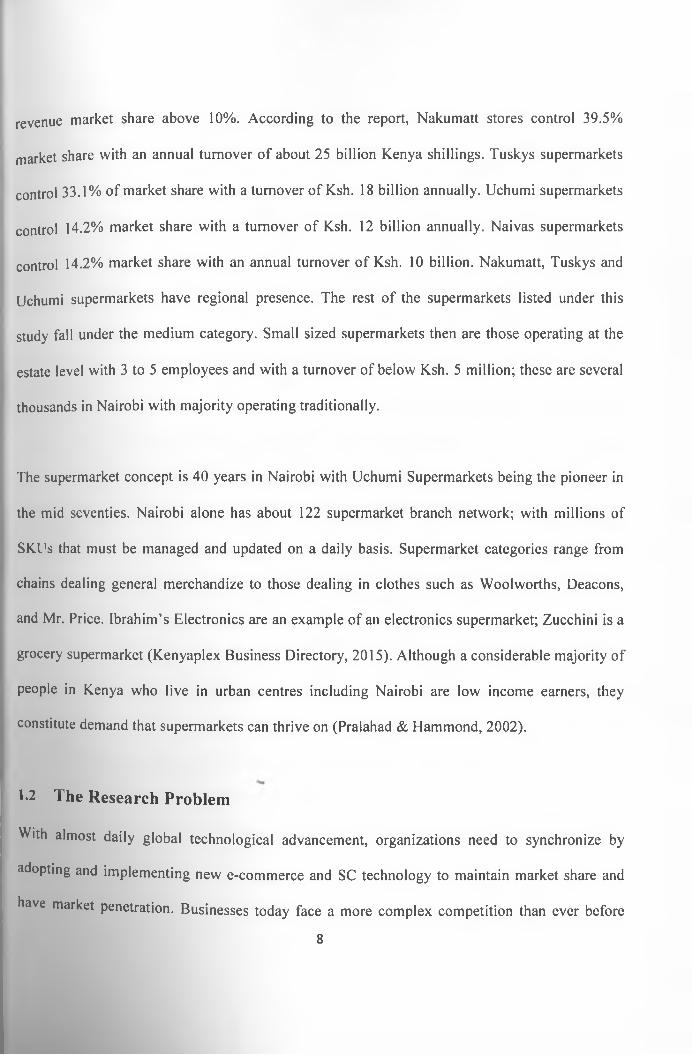
revenue market share above 10%. According to the report, Nakumatt stores control 39.5%
market share with an annual turnover of about 25 billion Kenya shillings. Tuskys supermarkets
control 33.1% of market share with a turnover of Ksh. 18 billion annually. Uchumi supermarkets
control 14.2% market share with a turnover of Ksh. 12 billion annually. Naivas supermarkets
control 14.2% market share with an annual turnover of Ksh. 10 billion. Nakumatt, Tuskys and
Uchumi supermarkets have regional presence. The rest of the supermarkets listed under this
study fall under the medium category. Small sized supermarkets then are those operating at the
estate level with 3 to 5 employees and with a turnover of below Ksh. 5 million; these are several
thousands in Nairobi with majority operating traditionally.
The supermarket concept is 40 years in Nairobi with Uchumi Supermarkets being the pioneer in
the mid seventies. Nairobi alone has about 122 supermarket branch network; with millions of
SKUs that must be managed and updated on a daily basis. Supermarket categories range from
chains dealing general merchandize to those dealing in clothes such as Woolworths, Deacons,
and Mr. Price. Ibrahim’s Electronics are an example of an electronics supermarket; Zucchini is a
grocery supermarket (Kenyaplex Business Directory, 2015). Although a considerable majority of
people in Kenya who live in urban centres including Nairobi are low income earners, they
constitute demand that supermarkets can thrive on (Pralahad & Hammond, 2002).
1-2 The Research Problem
With almost daily global technological advancement, organizations need to synchronize by
adopting and implementing new e-commerce and SC technology to maintain market share and
have market penetration. Businesses today face a more complex competition than ever before
8
(Ellram, 1991; Srinivasan & Kekre, 1994; Porter & Stern, 2001). The expansion of information
technology capability has reduced communication cycle to an almost an instant game. This has
led to enhancing the competitor capacity to display their products on the any electronic platform
faster and cheaply (Garten, 1998).
In Nairobi Kenya, it is important to clearly understand if there is collaboration through systems
i such as Vendor Managed Inventory (VMI) systems that are supported by suppliers of goods to
the supermarkets. Improving firm performance through technology depends on the combination
of IT infrastructure, integration, relevant skills and supportive relationships (Armstrong &
Sambamurthy, 1999). As customers have become more discriminating and demanding (Ellinger
& Daugherty 1997), product life cycles has been reduced forcing companies to contract the
window of opportunity and provide higher customer service levels. With a 24 hour economy,
Owuor (2009) looks at Nairobi as a hub with millions of working class people who look to the
supermarkets for their shopping solutions. On the flip side, with this kind of a service, there is
increased trade for the supermarkets that contribute to the national growth.
Effective SCM in retail markets require supportive elements from external sources provided by
partners (Bensaou, 1997), and the effectiveness of the SCM depends on the support of a cluster
of suppliers (Lee & Tang, 2000). Some of the inter-organizational factors that may influence
adoption of technology in business are coercive pressure from the partners or industry
(Premkumar & Ramamurthy, 1997) in order to standardize and coordinate communication.
9

Studies have been done in related areas, for example; Omwansa (2011) studied the information
and communications technology and operational efficiency in supermarkets in Nairobi and found
out that supermarkets with higher extent of use of 1CT had a higher rate of operational
efficiency. Makori (2013) studied real-time information processing and supply chain
optimization among supermarkets in Nairobi, Kenya and found out that use of real-time
information processing technology had benefits such as improved inventory management,
reduced labour costs and supply chain visibility. Lagat (2010) also investigated the state of
marketing intelligence activities in Kenya’s retailing sector “The case of supermarkets in
Nairobi” Kenya.
From all the above, it is evident that operational efficiency achieved is dependent on the industry
the firms operate in and technology implemented by organizations in each industry. Although
research has been done on supermarkets in Nairobi, none has focused on application of
technology as a competitive strategy by supermarkets in Nairobi. Direct competition among the
supermarkets creates a turbulent environment whose complexity requires implementation and
use of technology. Therefore the research questions that arise are: To what extent is technology
applied in the management of supermarkets operations in Nairobi, Kenya? What is the impact of
the implementation of such technology in achieving competitive advantage by the supermarkets?
What are the challenges faced in the implementation of the technology in the supermarkets?
10

1 3 Objectives of the study
The objectives o f this study are:
To determine the extent to which technology is applied as a technique to gain competitive
advantage in supermarkets in Nairobi County.
ii To establish the impact o f implementation of technology on the supermarkets’
competitive advantage, and
iii To determine challenges faced in the implementation of technology in supermarkets and
possible solutions suggested.
1.4 Value o f the Study
The study w ill be of importance to supermarket management for critical decisions on
competitiveness. The management in the supermarket operations wants to base their decisions on
empirical evidence that this study will provide. Business people will make investment decisions
based on the dynamics and operations relate to retail business and supermarkets business.
Researchers and academicians will use the information as a basis for further interrogation of
literature. Competitors in the supermarkets operations will utilize the study for benchmarking
and service delivery improvement. The analytical information provided through the data will
keep the management of the supermarkets informed to make the standards necessary for
benchmarking. Policy makers will jrse the information for infrastructural and technology
regulations in the supermarket industry. The government and other policy stakeholders will
utilize the information for a basic legislation and regulatory framework. The government for
example can use the applied technology for taxation purpose since the POS systems can clearly
show the total sales periodically.
11
CHAPTER TWO: LITERATURE REVIEW
2.1 Introduction
This chapter lays focus on review of theoretical, conceptual and empirical literature along the
study’s conceptualization. The chapter presents literature on theoretical underpinnings of the
study followed by conceptual and empirical literature on use of technology as a competitive
advantage by supermarkets in Nairobi.
2.2 Theoretical Perspectives of Technology Adoption
There are existing theories about technology as viewed in the perspective of being a human
extension. The theories are essential in the understanding the technology evolution, different
forms and their applications in business today.
2.2.1 Instrumentalization Theory
This theory analyses technology at two levels: the first level brings out the superiority of the
human beings in manipulating tools to their advantageous use in solving their daily practical
problems. This perhaps is the inherent basic functionality of the tools in relation to reality and
the affordances that can be mobilized to the devices and systems to make them useful properties.
The second level designs are then introduced to the devices and systems for social, technical and
environmental integration (Heidegger & Marcuse, 2004). Though the design might have some
differences with final aesthetics of the final product, the flow in the instrumentalization brings
12
about the team as one. For instance, the designers for ERP systems will not work in isolation
with users and technical teams.
2.2.2 Unified Theory o f Acceptance and Use o f Technology
The theory explains the intentions for using information technology and also the subsequent
usage behaviour. The theory holds four constructs: performance expectancy, effort expectancy,
social influence, and the facilitating conditions. Gender, age and experience are moderating
factors in the intentions and behaviour (Venkatesh, Morris and Davis, 2003). The intentions are
the driving force in the implementation while the behaviour is what is formed out of the
outcome.
2.2.3 Critical Theory o f Technology
This theory argues that the technical order is more superior to the sum of tools or structure that is
assembled to make things happen. The order shapes the future in a more autonomous way and
not the modernity caused by consumer behaviour. The level of civilization according to this
theory is not determined by the level of technology rather by human action. The ruling elite
make choices on the type of technology to utilize and design it with social attributes for
development. Michel (1980) advocates for a form of resistance of exercise of power through
technical strategies. Worldwide environmental crisis has forced in the culture of responsibility
and that advancement of technology inherently has become synonymous with management
decisions.
13

This theory is about how, why and what rate technology ideas spread through cultures, operating
at individual firm level. According to Rogers (1995), individuals are seen as having different
levels of willingness to adopt and implement technology in their organizations. The theory
proposes inclusivity of complexity, formalization and interconnectedness. In complexity,
members posses high level of knowledge and expertise on technology. In formalization, the
organization calls to its members to adhere to rules and procedures of existing systems.
Interconnectedness is the degree to which units of a social systems links to interpersonal
networks. Laudon et al (2012) refers to information technology as a social system that
| interconnects several people in communication.
2.2 5 Institutional theory
This theory views organizational decisions as driven by social and cultural factors and concern
for legitimacy rather than by rational goals for efficiency only. Dimaggio and Powell (1983)
explain that firms in the same field become homologous as competitive and customer pressure
forces them to copy the industry leader. This pressure could lead to some disposition towards a
shared IT system, adopting a practice and innovation imitating competitors.
The above theories are essential in linking the literature with the study objectives. They will also
guide the questionnaire structure in preparation of data collection. The theories form a strong
basis from which analysis will directly inform management of the supermarkets on the
•mportance of the study to their organizations. The significance of this was premised on the zeal
to ensure all target beneficiaries of the study have a well founded and informed research.
2.2.4- Diffusion on Innovation (DOI) Theory
14

Recent improvement and adaptation of diverse technologies in many firms has led to
effectiveness and efficiency in inventory management. Customers also have access to product
information in terms of its availability among other variables; this has been made possible by
technology (Langley et al., 2009). There are several technological applications and techniques in
supporting sound business strategic management:
2.3.1 Information Comm unications Based Technology
Chopra et al., (2011) states that e-commerce is related to web-based sales while e-business
relates the holistic use of information technology; though in many cases it refers to the use of
internet. Ngugi (2014) found out that there were 16.2 million internet subscribers in Kenya by
December 2012. Mobile internet dominated the penetration due to social media among the youth.
According to McGaughey and Mason (1998), internet and World Wide Web have continued to
make it easier, simpler, cheaper, and more accessible for customers and suppliers to interact and
conduct commercial transactions electronically. The internet has altered the customer shopping
behaviour because they spend minimal time to get the right product and purchase online thus
reducing their shopping time.
2.3.1.1 Transport Management Systems
Transportation is a major cost element in supply chain in the supermarkets. Vehicle routes are
planned to have wider distribution coverage for those with several branch networks in order to
minimize costs. The information system here is required to provide information about distance
2 3 T ech n ology A p p lica tion s
15

between branches, replenishment requirements. Some linear programming software may be
needed for critical optimality and sensitivity analysis Sople (2011).
According to Murphy and Wood (2008), global positioning system (GPS) has dramatically
changed the ability of the businesses to manage the actual movements in the distribution system
which enhances accountability among the drivers thereby improving speed to the market. The
monitoring of the trucks makes the drivers more accountable on their trips. The trip reports also
help managers with proper periodic analysis on performance.
2.3.1.2 Enterprise Resource Planning
Enterprise Resource Planning is a business management system that through modular application
software, integrates all the departments or functions of an enterprise (Farrington et al., 2012). A
marketing module is linked with the inventory module, and then integrated with the transport
module. The inventory module helps the warehouse manager to known on a real time basis the
stock levels within the warehouse and is able to plan for more production. He/she will determine
the location of the stock keeping units for ease of loading. The information contained in this
module is important in servicing pending orders.
The ERP system picks orders on an aging sequence and keeps the distribution manager informed*»*■
on stocks availability and also trucks available for loading for the next delivery. The manager
can assess the transport module and the stock levels through a touch of a button thanks to ERP
system. The system is ideal in procurement in authorizing purchase orders and payments on
aPproved deliveries.
16

Vendor Managed Inventory places the supplier as the in charge of inventory management of
products and replenishment process based on age and shelves off take with information flowing
from the customer to suppliers on a set platform. Sople (2011) explains that in VMI, partnership
is based on mutual trust, which implies a willingness on the part of the buyer to share
information and capabilities with the supplier. Farrington (2012) posits that VMI assists
manufactures or distributors to eliminate the need for customers to reorder, reduce or exclude
inventory and obviate stockouts.
With VMI, customers no longer “pull” inventory from suppliers. Rather, inventory is
automatically “pushed” to customers as suppliers check customers’ inventories and respond to
agreed stock levels. Lee (2000) found that VMI greatly reduced inventory-carrying costs and
stock-out problems while, at the same time, it enables synchronization of both inventory and
transportation decisions. Fox (1996) noted that VMI’s advantages included improved customer
service, reduced demand uncertainty, reduced inventory requirements and reduced cost. Due to
the real time stock level visibility, replenishment is done promptly therefore eliminating
unnecessary long lead times.
2 3.1-3 Vendor Managed Inventory
2.3.1.4 Bar coding
This is an automatic identification system that captures data at the point of goods receiving and
at the point of sale (POS). The benefits gained by organizations such as Wal-Mat, is labor
savings and faster customer service (Leenders & Fearon, 2010). Bar coding can be integrated
with VMI such that the information on the bar code label can be scanned at the point of sale to
17

venerate packing list to the buyer; and communicate replenishment information to the suppliers ©
(Sople, 2011). This also fastens stock taking in inventory management to eliminate pilferages. At
the point of sale, this system can also be linked with the VM1 for transmission to the suppliers;
replenishment therefore is fastened.
2.3.1.5 Electronic Payment Systems
According to Sumanjeet (2009), the e-payment can be any form of payment for business
transactions or bank transfers using telecommunications or electronic network. For use in e-
commerce or m-transactions, the system, according to Turban et al., (2006), requires high
security to safeguard the client and suppliers’ money. VISA and MasterCard have continued to
use this type of payment system and have made it very convenient for retail shoppers especially
supermarkets.
The cashless systems continue to guarantee customers peace of mind because they do not have to
carry cash around; they can also shop conveniently at any time of the day. Kemibaro (2010)
studied on M-Pesa usage in m-commerce and found out that it is a more acceptable method of
payments in Kenya today. Most supermarkets today have M-Pesa till numbers for payment
transactions.
18

2.3.2.1 ABC Analysis
This type of analysis in made on the basis of the annual monetary consumption and items are
ranked in order of their average inventory investment. The analysis provides basis on which
funds will be allocated and managed (Burt et al., 2010). The classification may be done
following either; by velocity, by sales volume, by quantities sold, by inventory investment, or by
margin (Sople, 2011).
The proper arrangement of the products by class helps in picking and loading efficiencies.
Periodic stock taking exercise is also made easy because items are stacked at their respective
marked bays. This technology can work even where there are no electronic identification
devices.
2.3.2.2 Just In Time
Just-In-Time, as part of the technology used in managing inventory, is a concept widely
practiced by Toyota in Japan, but has its origin from America, having been invented by Henry
Ford. JIT approach seeks to minimize inventory by reducing or eliminating safety stocks as it
views inventory as a waste since it ties capital which could have been utilized elsewhere to
generate more money (Murphy et al, 2008).
2 3.2 Non-Information Comm unications Based Technology
When faced with trade-offs between cost of stock outs and the cost of excess inventory, firms
find themselves in a dilemma. Stock out cost is difficult to quantify because dissatisfied clients
Wa*k °ff quietly and lack of their return purchase may not be monetarily estimated. Excess
19
inventory can be estimated through calculating interest rates at current market prices. JIT
therefore plays the role of eliminating the excess inventory by ordering only when an item is
demanded; therefore releasing the tied capital for re-investment.
2.4 Technology and Competitive Advantage in Business
According to Langley et al., (2009), management use of technology in supply chain decisions
must consider issues related to costs and customer service requirements. There are gains from the
use of technology in business management. Cost reduction and revenue collection; waste is the
biggest cost in any organization and therefore skills on the reduction of wastes using technology
are a key requirement for firms’ survival. Information sharing is a basic tool in consolidation of
functions in any supply chain enables managers to work closely together and establish market
needs for their customers with ease. Through use of the VMI system, TMS or GPS systems,
reordering costs, management monitoring time are eliminated, and paper computer entries and
printing are done away with.
The interface between logistics and marketing links the functions closely and enables speedy
servicing of orders by the dispatch staff (Nigel et al., 2012). The role of the ERP system
therefore is to keep real time information that firms’ managers will utilize to execute informed
decisions that will improve customer satisfaction through timely and efficient delivery of ordered
products. Both the internal and external customer demands are met through effective availability
°f goods and information. Farrington et al (2012), writes that, technology such as the ERP also
gives a firm the power to proactively examine accounts receivable early in advance before
problems occur, which improves cash flow.

Swink et al., (2011) introduce the importance of better demand forecasting and smoothing and
state that it will determine the acceptable lead time a customer is willing to wait for the product
to be delivered. The use of VMI information improves demand forecast from customers which
enables the firm to determine with certainties the amount to be produced by the manufacturers
and delivered to the retail markets within a given time.
With the use of JIT, materials are delivered only when needed; eliminating a chance of ordering
the wrong item since demand is known in advance and delivery timing attached to the demand.
According to Burt et al., (2010), a major driver of the 2001-2002 recessions was the proliferation
of errors in forecasts which were not identified and led to billions of accumulated inventories in
some supply chains. The primary cause of inaction was lack of use of techniques in demand
management by several players. Excess inventories force forms to incur storage costs, security
and staff costs, costs of obsolescence, insurance, handling and damage costs. This is a case of
proof how important technology and its use is to the organization and the general economy.
According to Sople (2011), in relation to reduction of lead times, JIT concept is based on the fact
that an activity should not take place until there is need for it. Hence an inventory item should
not be bought into the system until it is required for making the final product. JIT involves close
coordination of buyer and suppliers on a real time basis, reducing lead time to a manageable
level. According to Handfield et al., (2013), JIT reflected the idea that the timing and level of
‘nventory and production activities are matched to demand. With an average inventory level of
0n,y two hours, Toyota was receiving parts “just” before they were needed.
21
While systems keep upgrading, MRP plays a key role in managing manufacturing requirements
and equally accounting for the inventories consumed during the production processes. Since
production scheduling can be executed with certainty based on market demand, order to delivery
cycle time is drastically reduced Aquilano et al., (2010). There is reduction of order to delivery
cycle times - Bill of materials contains information on all the materials, components and sub-
assemblies required to produce each end item which is sold to the consumer either as a finished
product or work-in-progress item for further processing.
2.5 Challenges in the Implementation of Technology
Farrington et al., (2012) posit that JIT may not be applied in situations where suppliers have
relocated to greater distances since they end up sending several trucks to take care of small
batches of orders leading to road congestion and high transportation costs. Lack of skills leads to
problems such as low setup times and high defect rates, making JIT work to become more costly
because of the adoption approach and capabilities. In the absence of skills, appropriate ethics are
not applied and hence become a challenge in applying the JIT techniques.
According to Langley et al., (2009), ERP system as a technique may face the challenge of high
capital investment which many organisations may not be able to acquire due to high costs
involved. Even for organisations that are able to acquire it, they find employee training very
^pensive and time consuming. Lack of labour specialization, resistance to change, and
unwillingness in sharing information by departments or functions is equally another challenge
Kitheka (2012). ERP systems tend to focus on operational decisions and have relatively weak
analytical capabilities. Farrington et al (2012) concurs that implementation involves fundamental
2 2

rhange from a functional to a process approach to a business. This means that even for those
large firms that can afford it, their functional integration process is characterized by slow change
process which may affect the business running
One drawback of VM1 arises because retailers ignore the impact of product substitution when
making inventory forecasting decisions. As a result, inventories at the retailer will be higher than
optimal. Munyui (2011) establishes that lack of knowledge by local players was a limitation to
the implementation of technology in inventory management. He also established that lack of
efficient supply chains and better management of partnerships was also a challenge in the
implementation of inventory management techniques.
According to Burt (2010), planning for handling and control of the items classified in the ABC
model has limitations as well. The class C has thousands of items which by laxity of
management control in them poses and renders them less important yet there is capital tied on the
items. Control may therefore be a challenge, providing a loophole for pilferage and theft in the
warehouse. Changes in customer preferences may render a class A item a C item within a short
time and therefore making it difficult to project future investment planning. According to Lulu
(2011), some of the challenges experienced in technology in inventory management were;
adherence to procedural control, demand forecasting, overstocking due to number of franchise
and variant models.
23
£Sselaar and Miller (2001) in reference to Africa, relate barriers to implementation of e-
commerce and m-commerce to monopolized telecommunications providers, making it costly to
end-users. High communications costs, especially M-Pesa transactions costs are restrictive to the
number of purchases one can make on a daily basis.
2.6 Summary of Literature Review and Knowledge Gap
Although this summary is not exhaustive, it provides an overview of the reviewed literature and
research gap that motivated the study of the above topic. Research shows that information
technology plays a key role in improving information sharing and coordination (Love, 1996).
The information technology has been implemented largely by firms for strategic planning, virtual
enterprise, E-commerce and knowledge management (Gunasekaran & Ngai, 2004). With internet
penetration rate rising in the Kenyan market, there are still a large number that still needs to be
tapped to realize full service capacity.
EDI and VMI in retail markets play an important role of enhancing faster purchase order
processing, invoicing, order confirmation and payments; reducing inventory levels and adopting
just-in-time. This leads to reduced costs and improving business processes, shortened lead times,
reduced stock outs, accelerated response, and better demand forecast (Vijayasarathy & Tyler,
1997). With high costs of implementing these systems, medium sized supermarkets are less
privileged and are therefore not able to reap similar benefits and are not competing at the same
P'aying field.
24
Use of bar coding systems by retailers improves on the coordination of processes. Many retailers
are now looking for partnerships with suppliers who can integrate the systems for continuous
improvement (Power, 2003). The benefits from use of technology include: reduced check-out
time for customers and reduced errors (Cassidy, 1994), improved inventory management (Weber
& Kantamneni, 2002), increased traceability and improved collaboration between partners,
enhanced competitiveness (Iacovou et al., 1995), better customer service (Angeles et al., 1998),
improved communication and information accuracy, and improved cash flows (Ferguson et al.,
1990, Murphy & Daley, 1999). Small scale manufactures who do not use bar codes may find
themselves locked out of supplier base; supermarkets can device a method of coding for such
small scale suppliers as a collaborative and supplier development strategy.
25

Table 2.1: Summary of Literature Review
"Author Study Major Findings Research Gap
"\4 urphy and Wood (2008)
Global Positioning System as a transport management system.
The system is key in tracking fleet for efficiency and better customer satisfaction.
How savings from the efficiency can be translated to lower prices for customers.
Farrington et al., (2012), Makori (2013)
Use of Enterprise Resource Planning for real-time information processing
The system integration improved inventory levels, reduced labour costs and visibility of transactions.
There is no guidelines on how different firms can share a platform for cost savings
Lee (2000) and Swink etal, (2 0 1 1 )
Vendor Managed Inventory (VMI) System
VMI improves demand forecasting, eliminates excess inventory and chances of wrong orders
Studies did not cover customer substitution forecasting methods, and collaborative criteria
Sople (2011) and Handfield et al., (2013)
Just-In-Time Concept Key in reduction of cost of inventory; goods are ordered only when needed, and matched demand to production schedules.
The study did not cover customer - supplier collaborative techniques that must be applied to ensure JIT works
Chopra et al., (2011) and Ngugi(2014)
Use of Internet as an infrastructure in operational efficiency
Internet Connectivity rate, enabling use of social media as an enabler for communications between the business and its customers.
Cost of operating the internet still high with no mitigating factors such as offline mobile applications that can operate affordably.
Leenders et al., (2010), Turban et al., (2006), Sople, (2011)
Point of Sale and electronic payment systems
Faster customer service and labour savings, convenience of shopping, and cashless transactions
How telecommunications interconnectivity can lower the transactions costs
Munyui (2011), Lulu(2011) , Kitheka(2012) , and Farrington e(ol., (2012)
Challenges in the implementation of technology in business
High capital investment,
Lack of necessary skills,
Resistance to change,
The study did not reveal how systems providers can link organizations for a collaborative approach in operations.
26

2.7 Conceptual Framework
Competitive advantage is the resultant output which is the dependent variable. The practices are
the independent variables. The objectives by management to use ERP, bar coding and scanning
system, VMI, JIT, and transport management systems is to achieve operational performance as a
competitive advantage through reduced costs, speedy deliveries, enhanced productivity and
customer satisfaction.
Table 2.2: Conceptual Model
Independent Variables Dependent Variables
27

CHAPTER THREE: RESEARCH DESIGN
3.1 Introduction
This chapter sets out the research methodology that was adopted so as to meet the objectives of
this study. The research setting, the population of interest, sampling and sampling design, data
collection instruments and data analysis techniques was used.
3.2 Research Design
The study was carried out through cross sectional survey design. The survey was a field study
conducted within Nairobi, since most of the supermarkets have concentrated networks in Nairobi
due to the convenience in terms of accessibility, time schedule and financial resources available.
According to Mugenda and Mugenda (2003), data collected from a sample can be generalized to
a whole population.
3.3 Population
The population included 23 supermarkets within Nairobi County that the researcher investigated
in reference to the study objectives. Since some technology is applicable in integrating and
networking branches, size of the supermarket is important in determining the technology
applicable. Type of technology and type of supermarkets are important in determining the
operational performance. Burns and Grove (2003), define criteria for eligibility into a
Populations as the salient individual characteristics each member must possess in order to qualify
■nclusion into the population. Since the branch network utilizes a common technological
28

platform, data from one branch will be replicated to all other branches. A census was carried out
due to the relatively small number of supermarkets in Nairobi and that fact that the researcher
wants a total appreciation of practices in all the firms.
3.4 Data Collection
Primary data was used in the study to obtain first hand information on use of technology and
appreciate if indeed there exists and benefits leading to competitive advantage in the operations
of supermarkets in Nairobi. A structured questionnaire was used to collect data that was
organized in four parts: Part A; Organizational profile, part B; the extent and impact of the
adoption of technology in achieving considerable competitive edge by the supermarkets, part C;
establishing the impact of technology implementation, and part D; determining the challenges
faced in the implementation of the technology. The questionnaire is popular because the
researcher has control over types of data at the time of data gathering.
The respondents were presented with descriptive statements about the management involvement
in implementation of technology and contribution to competitiveness; this was done in a Likert
scale that was used for scoring. This is because Likert scale is an important tool for rating
responses from respondents on various identified variables (Kothari, 2004; Cooper et al., 2011).
The questionnaires were administered through drop and pick later method. Operations managers,
Procurement Managers or their equivalents were the target group to answer the questionnaires
s>nce they are well placed to understand the application and benefits of use of technology within
lheir operations. Therefore two questionnaires per supermarket were administered; making a
total of 46 questionnaires.
29

3.5 Data Analysis
The nature of data collected was largely be quantitative; thus the study made use of descriptive
statistical tools for analysis (Mean scores, Standard Deviation and Percentages) to analyze the
data that was collected. According to Mugenda and Mugenda (2003), percentages show the
proportion of respondents who score in different variables. Findings were presented in a tabular
form for ease of interpretation and reporting. Tables enable the reader to compare the trend of
distribution more vividly than simply looking at the numbers.
The data analyzed was directly from the questionnaire which captured the three research
objectives. Section A was to provide general information about the organizations, Section B was
to describe the extent of technology implementation; Section D was to describe challenges faced
in implementation of such technology. Section C was to analyze the relationships among
independent and dependent variables using a regression model;
Y=a+b2X2+b2X2+b3 X3 +b4 X4 +b5X5+b6X6+e where:
Y = Operational Performance
a = The Y Intercept, bi, b2, b3.b4.and bs are the regression coefficient of respective variables;
e= is the error term;
X, =Enterprise Resource Planning
Xj= Bar Coding
Xj = Vendor Managed Inventory
Xi= Transport Management Systems
X?= Electronic Payment Systems
= Just in Time
30

Table 3.1: Summary of Methodology used
rObjectives Data Type Collection Technique Data Analysis
"General Information Secondary Data Questionnaire
Section A
Descriptive
"Determine the extent of
technology implementation
Primary data Questionnaire
Section B
Descriptive Statistics
"Establish impact of
technology implementation
Primary data Questionnaire
Section C
Correlation and
Regression Analysis
"Determine challenges faced
in the implementation of
technology
Primary data Questionnaire
Section D
Descriptive Statistics
31

CHAPTER FOUR: DATA ANAYSIS, RESULTS AND
DISCUSSION
4.1 Introduction
fhis chapter provides a summary of the data analysis, results of the study and the discussion of
he results of the study. The results were presented on the technology as a competitive advantage
n supermarket operations in Nairobi County. The study was based on the following specific
ibjectives: To determine the extent to which technology is applied as a technique to gain
sompetitive advantage in supermarkets in Nairobi County, to establish the impact of
mplementation of technology on the supermarkets’ competitive advantage, and to determine
hallenges faced in the implementation of technology in supermarkets and possible solutions
uggested.
4.2 Response Rate
The study targeted a sample size of 46 respondents from which 42 filled in and returned the
questionnaires making a response rate of 91.3%. This response rate was satisfactory and
representative to make conclusions for the study. According to Mugenda and Mugenda (2003), a
esponse rate of 50% is adequate for analysis and reporting; a rate of 60% is good and a response
rate of 70% and over is excellent. Based on the assertion, the response rate was considered to be
excellent.
32

figure 4.1: Response Rate
Returned not Returned
Source: Research data, (2015)
4.3 General information
The study sought to establish the information on the respondents employed in the study with
length of period of work at the supermarket, type of supermarket, highest level of education
attained, and age of the respondents. These bio data point at the respondents’ appropriateness in
answering the questions. When asked the duration of time they had worked for the supermarket,
26.2% of all respondents reported to have worked for 5 years, 19% had worked for a period of 2
years, 14.3% for 4 years, 11.9% was shared equally between those respondents who had worked
for 7 and 3 years, 9.5% had worked for 1 year and the remaining 7.1% had worked for 6 years.
This is the product of the supermarket culture of attracting and retaining the best and hence the
extensive experience resource, internal capabilities, the organization enjoy in building its
competitiveness as reflected in its technology.
33

figure 4.2: Work Experience
30 .0 0 %
25 .0 0 %
20 .0 0 %
15 .0 0 %
10.00%
5 .00 %
0 .0 0 %
1 Year 2 Years 3 Years 4 Years 5 Years 6 Years 7 Years
Source: Research data, (2015)
As pertaining to their highest level of education attained the distribution of the respondents
indicated 26.2% had master’s degree, 59.5% had undergraduate degree, while 14.3% were
Diploma holders in various fields indicating clearly their level of articulation of the subject
matter and their ability to contribute to the supply value chain as was evidence in the research
findings. This is also the reflection of the supermarkets culture change philosophy of continuous
training for best results.
Figure 4.3: Level of Education
70.00% ----------------------------------------------------------------------------------------------------------------------------------------------------- —
Source: Research data, (2015)34

The researcher requested the respondents to indicate their age category. From the findings it was
established that, 40.5% of the respondents were aged between 26 to 35 years, 35.5% of the
respondent indicated they were aged between 36 to 45 years, 14.3% of the respondents indicated
they were aged between 46 to 55 years, whereas 9.5 % of the respondents indicated that they
were aged between 18 to 25 years. This is an indication that respondents were well distributed in
terms of their age. This also is an implication that the majority were able with adequate
experience in matters of technology in supermarkets.
Figure 4.4: Age of Respondents
Source: Research data, (2015)
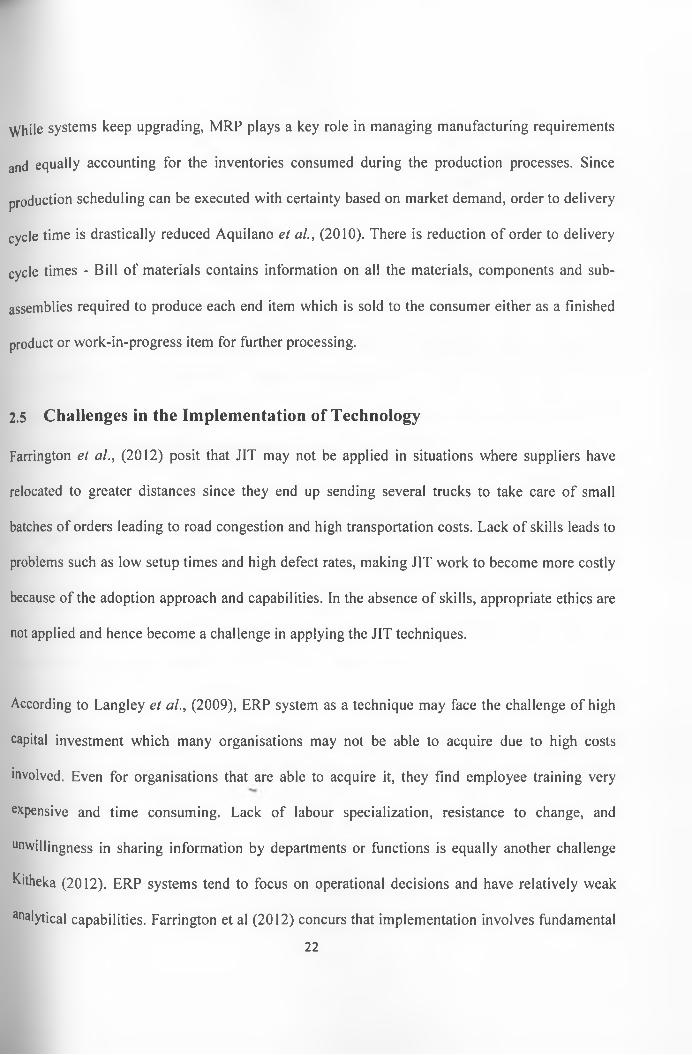
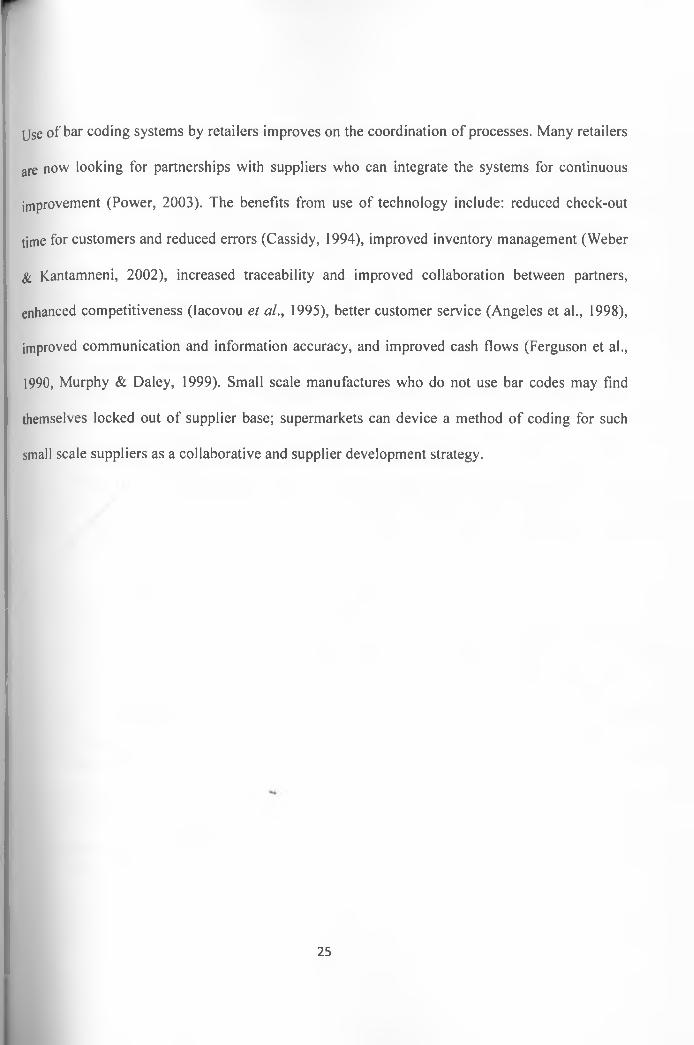
The respondents were also asked to indicate the type of the supermarket they work with, 71.4%
°f the respondents indicated their type of supermarket is general, 16.7% indicated electronic,
9'5% indicated grocery and the remaining 2.4% of the respondents indicated their supermarket is
clothing supermarket. This shows that most of the supermarkets are general hence provides
variety of goods and services in the same building and floor.
35
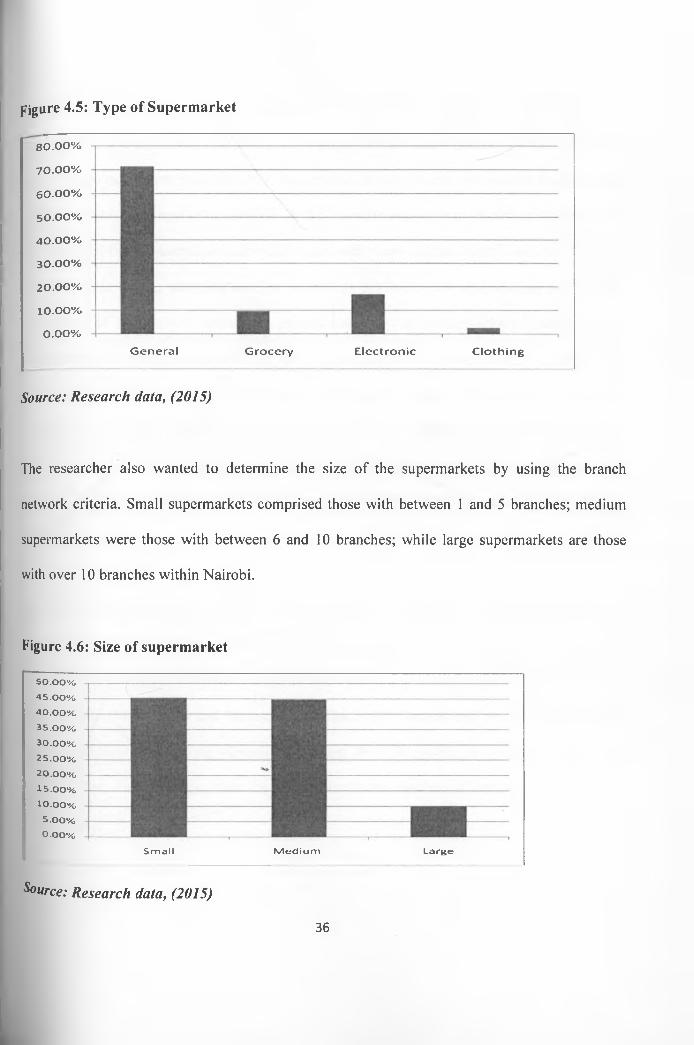
Figure 4.5: Type of Supermarket
80 .00 %
70 .00 %
60 .00%
50 .00 %
40 .00 %
30 .00%
20 .00%
10 .00 %
0 .00%
General Grocery Electronic Clothing
Source: Research data, (2015)
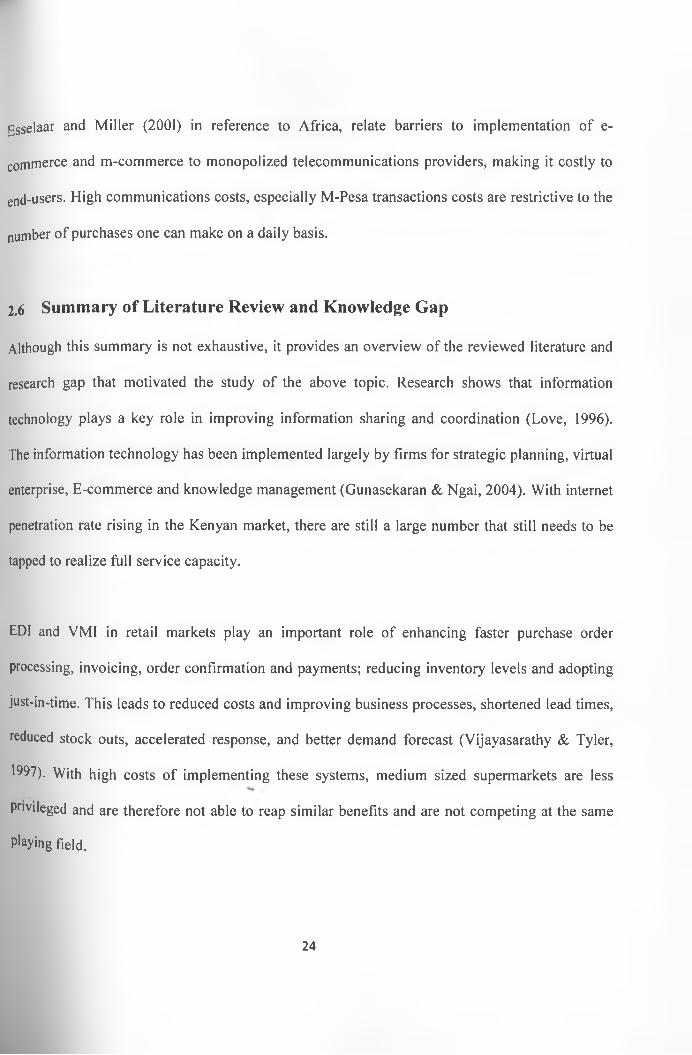
The researcher also wanted to determine the size of the supermarkets by using the branch
network criteria. Small supermarkets comprised those with between 1 and 5 branches; medium
supermarkets were those with between 6 and 10 branches; while large supermarkets are those
with over 10 branches within Nairobi.
Figure 4.6: Size of supermarket
5 0 .0 0 %
4 5 .0 0 %
4 0 .0 0 %
3 5 .0 0 %
3 0 .0 0 %
2 5 .0 0 %
20.00%
1 5 .0 0 %
10.00 %
5 .0 0 %
0 .00%
Sm all M e d iu m Large
Source: Research data, (2015)
36
On a scale of 1 to 5, where (1) to a very small extent (2) to a small extent (3) to medium extent
(4) to a large extent where (5) to a very large extent, the respondents were asked to indicate the
extent to which they applied technology in the management of their supermarkets operations.
The Table 4.1 below summarizes the mean scores with a low margin above 3 and average of 4/5
to a very large extent; affirming that the technology applied by the supermarkets have greatly
contributed to its competitiveness and performance. The technology adopted mostly by the
supermarket is scanning used at the point of sale terminals with a mean of 4.095 as indicated by
the respondents; followed by use of internet in communications at 3.90; and JIT for goods
deliveries only when needed at 3.83. This concurs with the literature review that some of the
factors that may influence adoption of technology in business are coercive pressure from the
partners or industry (Premkumar & Ramamurthy, 1997) in order to standardize and coordinate
communication.
Even the small supermarkets are adopting these types of technology to cope with the industry
pressure. Some o f the pressures, according to the literature review are that use of internet has
increased the interaction between customers and suppliers to conduct commercial transactions
electronically (McGaughey and Mason, 1998). The internet has altered the customer shopping
behaviour because they spend minimal time to get the right product and purchase online thus■ v*.
reducing their shopping time; thus the push towards the adoption of internet in supermarkets
operations.
4.4 Extent to which technology is applied in the management of supermarkets operations
37
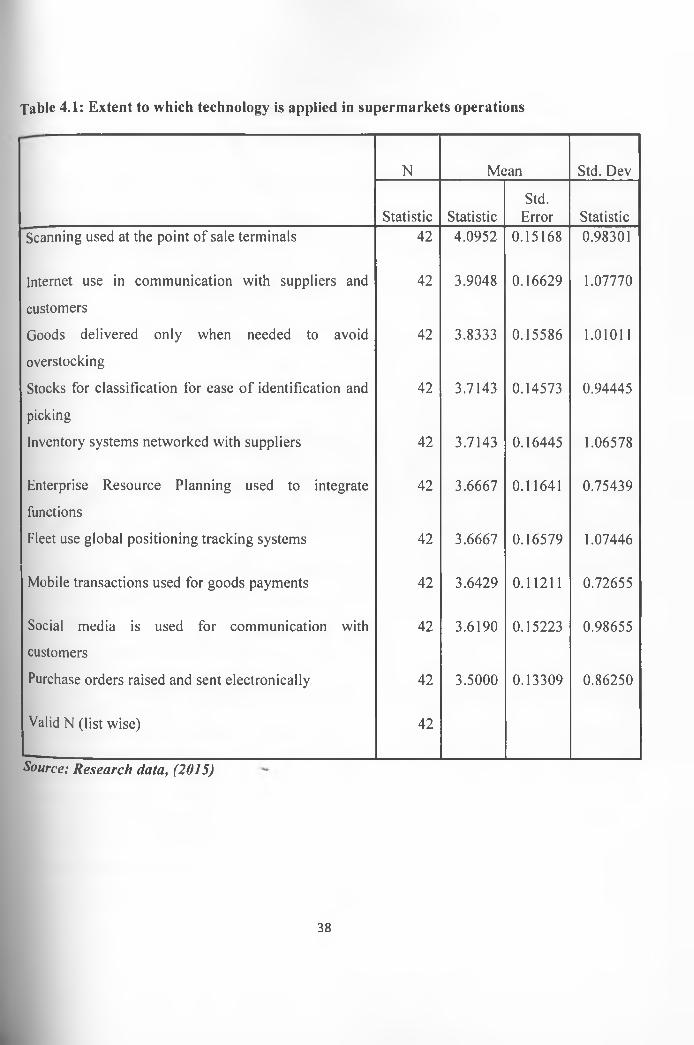
Table 4.1: Extent to which technology is applied in supermarkets operations
N Mean Std. Dev
Statistic StatisticStd.
Error StatisticScanning used at the point of sale terminals 42 4.0952 0.15168 0.98301
Internet use in communication with suppliers and 42 3.9048 0.16629 1.07770
customers
Goods delivered only when needed to avoid 42 3.8333 0.15586 1.01011
overstocking
Stocks for classification for ease of identification and 42 3.7143 0.14573 0.94445
picking
Inventory systems networked with suppliers 42 3.7143 0.16445 1.06578
Enterprise Resource Planning used to integrate 42 3.6667 0.11641 0.75439
functions
Fleet use global positioning tracking systems 42 3.6667 0.16579 1.07446
Mobile transactions used for goods payments 42 3.6429 0.11211 0.72655
Social media is used for communication with 42 3.6190 0.15223 0.98655
customers
Purchase orders raised and sent electronically 42 3.5000 0.13309 0.86250
Valid N (list wise) 42
Source: Research data, (2015)
38
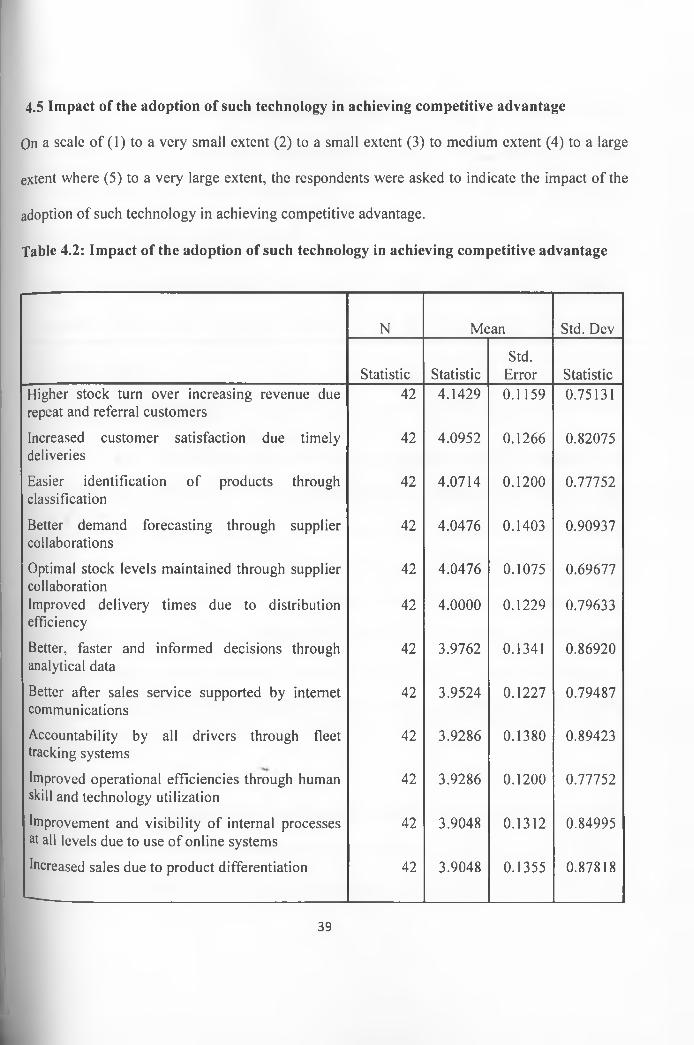
4.5 Impact of the adoption of such technology in achieving competitive advantage
On a scale of (1) to a very small extent (2) to a small extent (3) to medium extent (4) to a large
extent where (5) to a very large extent, the respondents were asked to indicate the impact of the
adoption of such technology in achieving competitive advantage.
Table 4.2: Impact of the adoption of such technology in achieving competitive advantage
N Mean Std. Dev
Statistic StatisticStd.
Error StatisticHigher stock turn over increasing revenue due repeat and referral customers
42 4.1429 0.1159 0.75131
Increased customer satisfaction due timely deliveries
42 4.0952 0.1266 0.82075
Easier identification of products through classification
42 4.0714 0.1200 0.77752
Better demand forecasting through supplier collaborations
42 4.0476 0.1403 0.90937
Optimal stock levels maintained through supplier collaboration
42 4.0476 0.1075 0.69677
Improved delivery times due to distribution efficiency
42 4.0000 0.1229 0.79633
Better, faster and informed decisions through analytical data
42 3.9762 0.1341 0.86920
Better after sales service supported by internet communications
42 3.9524 0.1227 0.79487
Accountability by all drivers through fleet tracking systems
42 3.9286 0.1380 0.89423
improved operational efficiencies through human skill and technology utilization
42 3.9286 0.1200 0.77752
Improvement and visibility of internal processes at all levels due to use of online systems
42 3.9048 0.1312 0.84995
Increased sales due to product differentiation 42 3.9048 0.1355 0.87818
39

Faster feedback from market through online 42 3.8095 0.1455 0.94322infrastructure
Improved information sharing due to internet and integration
42 3.7857 0.1653 1.07149
Increased market share achieved through better customer service and market focus
42 3.7381 0.1408 0.91223
Faster inbound and point of sale transactions 42 3.7381 0.1773 1.14890
Minimal labour intervention due to real time systems
42 3.6905 0.1543 0.99971
Competitive pricing due to cost reduction achieved from functional integration
42 3.5238 0.1746 1.13133
Valid N (list wise) 42
Source: Research data, (2015)
The Table 4.2 above summarizes the mean scores with a low margin above 3 and average of 4/5
to a large extent; affirming that the technology adopted by the supermarket have greatly
contributed to its competitiveness. The improved competitive advantage is mainly reflected
through increased customer satisfaction due timely deliveries, easier identification of products
through classification, optimal stock levels maintained through supplier collaboration, higher
stock turn over increasing revenue due repeat and referral customers, improved delivery times
due to distribution efficiency and better demand forecasting through supplier collaborations as
indicated by respondents. This indicates supermarkets drives out inefficiencies from business
processes.
The findings above concur with the literature review data to the effect that supermarkets that
adopt technology have better performance and hence competitive advantage. Swink et al., (2011)
■ntroduce the importance of better demand forecasting and smoothing and state that it will
40
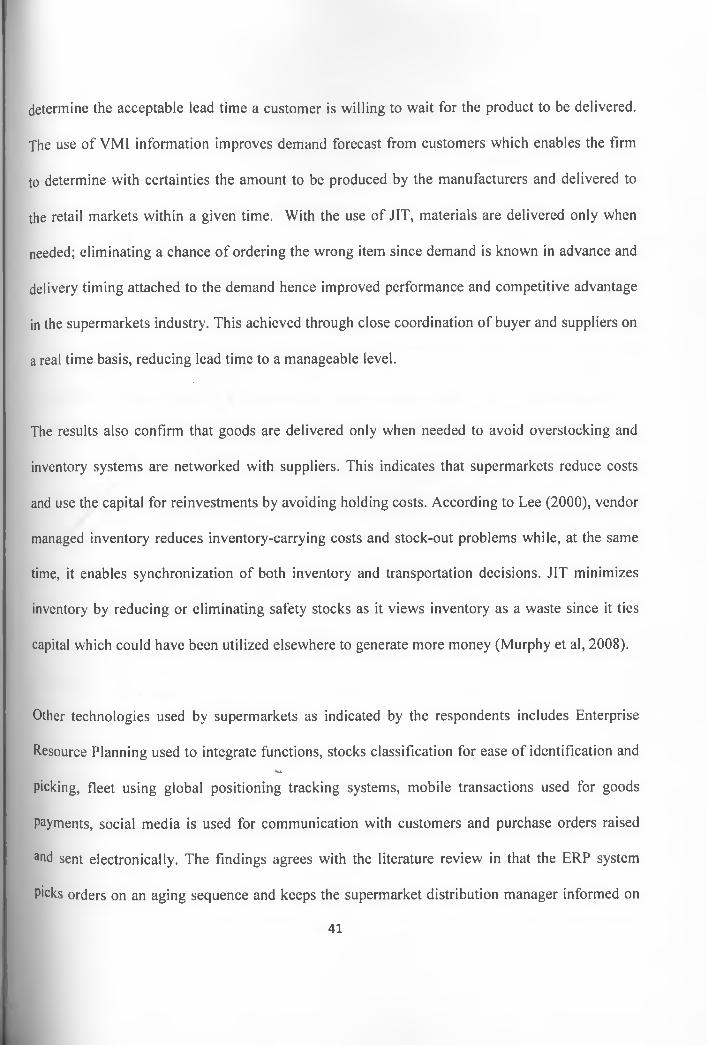
determine the acceptable lead time a customer is willing to wait for the product to be delivered.
The use of VM1 information improves demand forecast from customers which enables the firm
to determine with certainties the amount to be produced by the manufacturers and delivered to
the retail markets within a given time. With the use of JIT, materials are delivered only when
needed; eliminating a chance of ordering the wrong item since demand is known in advance and
delivery timing attached to the demand hence improved performance and competitive advantage
in the supermarkets industry. This achieved through close coordination of buyer and suppliers on
a real time basis, reducing lead time to a manageable level.
The results also confirm that goods are delivered only when needed to avoid overstocking and
inventory systems are networked with suppliers. This indicates that supermarkets reduce costs
and use the capital for reinvestments by avoiding holding costs. According to Lee (2000), vendor
managed inventory reduces inventory-carrying costs and stock-out problems while, at the same
time, it enables synchronization of both inventory and transportation decisions. JIT minimizes
inventory by reducing or eliminating safety stocks as it views inventory as a waste since it ties
capital which could have been utilized elsewhere to generate more money (Murphy et al, 2008).
Other technologies used by supermarkets as indicated by the respondents includes Enterprise
Resource Planning used to integrate functions, stocks classification for ease of identification and•v*-
Picking, fleet using global positioning tracking systems, mobile transactions used for goods
payments, social media is used for communication with customers and purchase orders raised
and sent electronically. The findings agrees with the literature review in that the ERP system
Picks orders on an aging sequence and keeps the supermarket distribution manager informed on
41
stocks availability and also trucks available for loading for the next delivery. It also module helps
the supermarket warehouse manager to know on a real time basis the stock levels within the
warehouse and is able to plan for more production. Kemibaro (2010) found that M-pesa is more
acceptable method of payment by supermarkets as they have till numbers for transactions
purposes hence guarantees customers peace of mind as they do not have to carry cash around.
Also the purchase orders are raised and sent electronically to enhance faster purchase order
processing, invoicing, order confirmation and payments and reduce inventory levels. This leads
to reduced costs and improving business processes, shortened lead times, reduced stock outs,
accelerated response, and better demand forecast (Vijayasarathy & Tyler, 1997). The above
results generally agree with the literature data to the effect that supermarket that applies
technology in the management of operations have better performance and hence increase their
competitive edge. Supermarket, just like any other organization that practices sound technology
strategies as was reflected in the literature review, has grown and sustained its competitive edge,
no wonder its market leadership position. Supermarkets continuously reviews these technology
for relevance given the rapidly changing business environment and diversification and growth
strategies.
4.6 Pearson Correlation Analysis
The Karl Pearson’s coefficient of correlation (simple correlation) is a measure of the degree of
relationship between two variables and is denoted by r. Basically, a Pearson product-moment
correlation attempts to draw a line of best fit through the data of two variables, and the Pearson
correlation coefficient was conducted to examine the relationship between variables, r, indicates
42
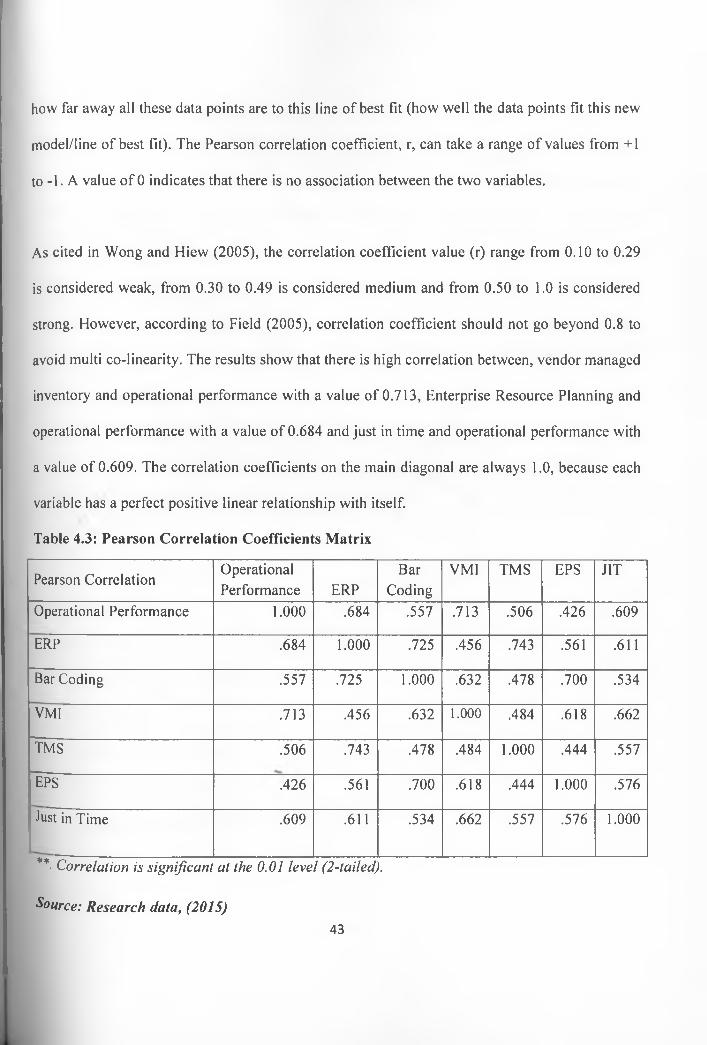
how far away all these data points are to this line of best fit (how well the data points fit this new
model/line of best fit). The Pearson correlation coefficient, r, can take a range of values from +1
to -1. A value of 0 indicates that there is no association between the two variables.
As cited in Wong and Hiew (2005), the correlation coefficient value (r) range from 0.10 to 0.29
is considered weak, from 0.30 to 0.49 is considered medium and from 0.50 to 1.0 is considered
strong. However, according to Field (2005), correlation coefficient should not go beyond 0.8 to
avoid multi co-linearity. The results show that there is high correlation between, vendor managed
inventory and operational performance with a value of 0.713, Enterprise Resource Planning and
operational performance with a value of 0.684 and just in time and operational performance with
a value of 0.609. The correlation coefficients on the main diagonal are always 1.0, because each
variable has a perfect positive linear relationship with itself.
Table 4.3: Pearson Correlation Coefficients Matrix
Pearson CorrelationOperationalPerformance ERP
BarCoding
VMI TMS EPS JIT
Operational Performance 1 . 0 0 0 .684 .557 .713 .506 .426 .609
ERP .684 1 . 0 0 0 .725 .456 .743 .561 .611
Bar Coding .557 .725 1 . 0 0 0 .632 .478 .700 .534
VM1 .713 .456 .632 1 . 0 0 0 .484 .618 .662
TMS .506 .743 .478 .484 1 . 0 0 0 .444 .557
EPS .426 .561 .700 .618 .444 1 . 0 0 0 .576
Just in Time .609 .611 .534 .662 .557 .576 1 . 0 0 0
**■ Correlation is significant at the 0.01 level (2-tailed).
Source: Research data, (2015)43
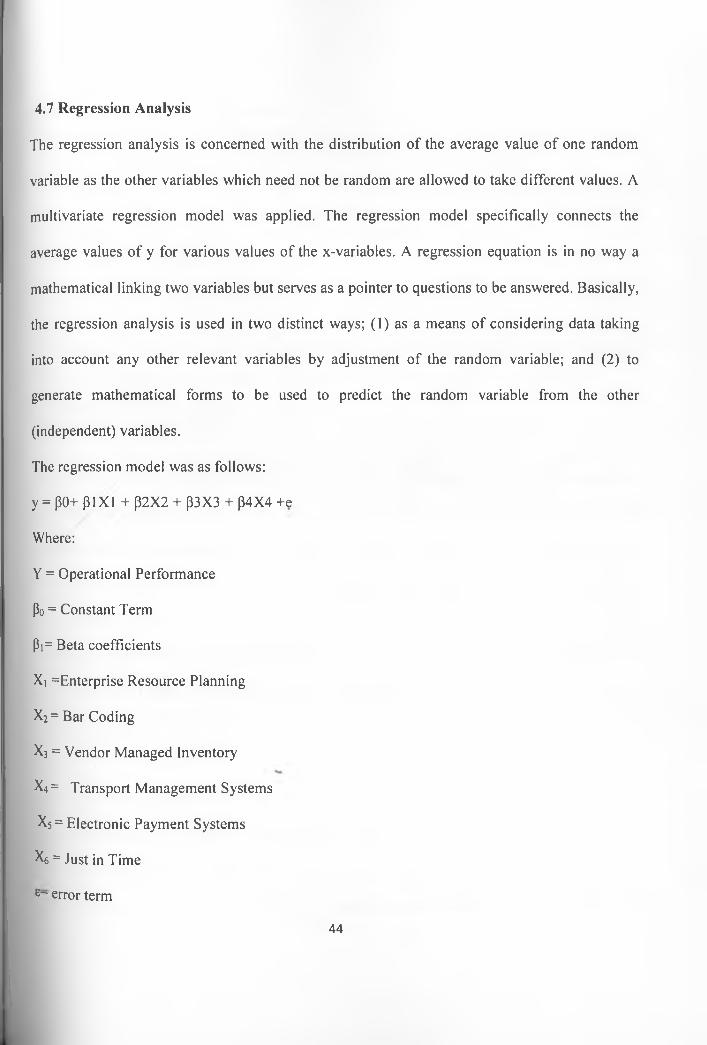
The regression analysis is concerned with the distribution of the average value of one random
variable as the other variables which need not be random are allowed to take different values. A
multivariate regression model was applied. The regression model specifically connects the
average values of y for various values of the x-variables. A regression equation is in no way a
mathematical linking two variables but serves as a pointer to questions to be answered. Basically,
the regression analysis is used in two distinct ways; ( 1 ) as a means of considering data taking
into account any other relevant variables by adjustment of the random variable; and (2 ) to
generate mathematical forms to be used to predict the random variable from the other
(independent) variables.
The regression model was as follows:
y = p0+ plX l + P2X2 + p3X3 + P4X4 +e
Where:
Y = Operational Performance
Po = Constant Term
Pi= Beta coefficients
X, =Enterprise Resource Planning
X2= Bar Coding
X3 = Vendor Managed Inventory
^ 4 = Transport Management Systems
Xs= Electronic Payment Systems
^ 6 = Just in Time
e~ error term
4.7 Regression Analysis
44

Table 4.4: Regression Model Summary
Model R RSquare
AdjustedRSquare
Std. Error of the Estimate
Change Statistics
RSquareChange
FChange
dfl df2 Sig. F Change
Durbin-Watson
"1 .931“ .867 .849 .219 .867 42.212 14 53 . 0 0 0 2 . 2 1 1
a. Predictors: (Constant), Enterprise Resource Planning, Bar Coding, Vendor Managed
Inventory, Transport Management Systems, Electronic Payment Systems, and Just in Time
b. Dependent Variable: Operational Performance Source: Research data, (2015
The model summary is presented in Table 4.4. The model summary was highly significant
(p=0.000) showing that the model was functional. The model had an R square value of 0.867
indicating that the percentage of the dependent variable variance that was explained by the
independent variables was 86.7%. The P- value of 0.000 (Less than 0.05) implies that the model
of operational performance is significant at the 5 per cent significance. R is the correlation
coefficient which shows the relationship between the study variables. From the findings shown
in the table above there was a strong positive relationship between the study variables as shown
by 0.931.
Durbin-Watson is number that tests for autocorrelation in the residuals from a statistical
regression analysis. The Durbin-Watson statistic is always between 0 and 4. Values close to 2
Means that there is no autocorrelation in the sample; values approaching 0 indicate positive
autocorrelation, while values toward 4 indicate negative autocorrelation. The findings shows that45

Durbin-Watson value is 2.211 hence no autocorrelation in the sample. The Standard Error of the
Estimate is the standard deviation of the data about the regression line, rather than about the
sample mean. This statistic is used with the correlation measure, the Pearson R. It is used to
construct a confidence interval within which the true population correlation will fall. The
computations derived from the r and the standard error of the estimate can be used to determine
how precise an estimate of the population correlation is the sample correlation statistic.
ANOVA findings (P- value of 0.00) in Table 4.5 show that there is correlation between the
predictor’s variables and response variable. An F ratio is calculated to represent the variance
between the groups, divided by the variance within the groups. A large F ratio indicates that
there is more variability between the groups (caused by the independent variable) than there is
within each group, referred to as the error term (Pallant, 2005). Therefore, this is an indication of/
a better the predictor model. A significant F test indicates that we can reject the null hypothesis
which states that the population means are equal. The F value of 146.75 indicates that the overall
regression model is significant hence it has some explanatory value. This indicates that there is a
significant relationship between the predictor variables Enterprise Resource Planning, Bar
Coding, Vendor Managed Inventory, Transport Management Systems, Electronic Payment
Systems, and Just in Time and operational performance. At 95 percent confidence interval i.e. P -
value (p=0.00<0.05) it implies that all the independent variables combined do influence the
decisions to impact operational performance.
46
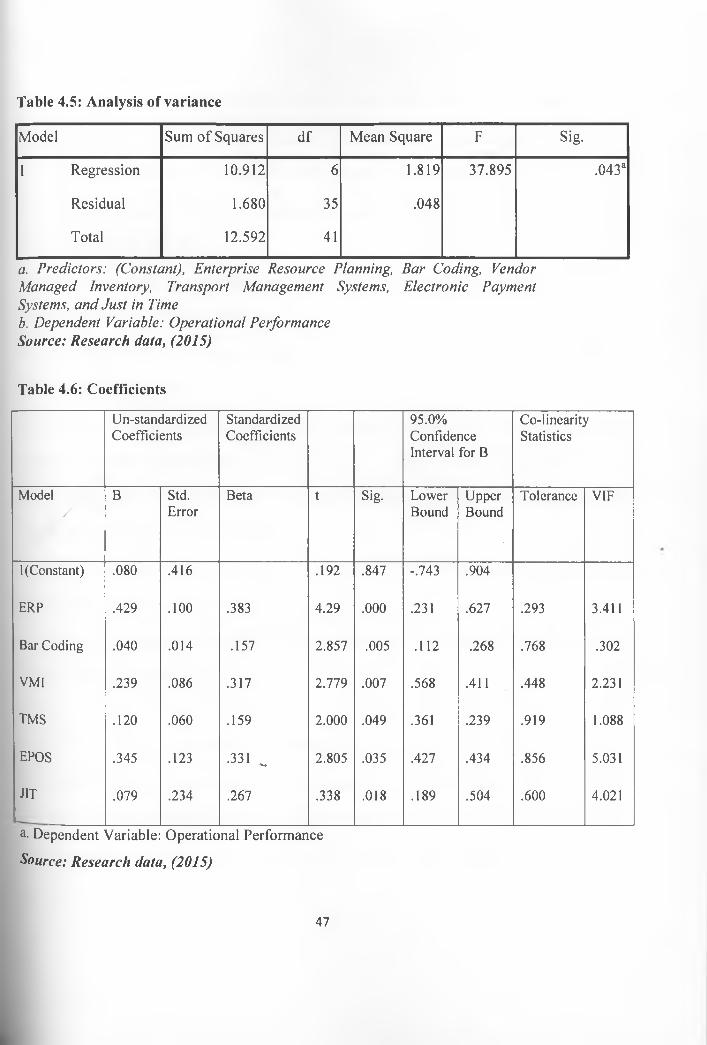
Table 4.5: Analysis of variance
Model Sum of Squares df Mean Square F Sig.
1 Regression 10.912 6 1.819 37.895 .043a
Residual 1.680 35 .048
Total 12.592 41
a. Predictors: (Constant), Enterprise Resource Planning, Bar Coding, Vendor Managed Inventory, Transport Management Systems, Electronic Payment Systems, and Just in Timeb. Dependent Variable: Operational Performance Source: Research data, (2015)
Table 4.6: Coefficients
Un-standardizedCoefficients
StandardizedCoefficients
95.0% Confidence Interval for B
Co-linearityStatistics
Model/
B Std.Error
Beta t Sig. LowerBound
UpperBound
Tolerance VIF
1 (Constant) .080 .416 .192 .847 -.743 .904
ERP .429 . 1 0 0 .383 4.29 . 0 0 0 .231 .627 .293 3.411
Bar Coding .040 .014 .157 2.857 .005 . 1 1 2 .268 .768 .302
VMI .239 .086 .317 2.779 .007 .568 .411 .448 2.231
TMS . 1 2 0 .060 .159 2 . 0 0 0 .049 .361 .239 .919 1.088
EPOS .345 .123 .331 *»*• 2.805 .035 .427 .434 .856 5.031
JIT .079 .234 .267 .338 .018 .189 .504 .600 4.021
&• Dependent Variable: Operational Performance
Source: Research data, (2015)
47

From the table 4.6, the variable had no multi co-linearity since the variance inflation factors
(VIF) were less than 10. The established multiple linear regression equation becomes:
Y = .080 + .429 Xj+ .040 X2+ .239 X3+ .120 X4+ .345 X5+ .079 X6, Where:
Po = 0.08, shows that if the level of independent variables are held at constant zero, operational
performance would be 0.08.
Pi= 0.429, shows that one unit change in Enterprise Resource Planning would results in 0.429
units increase in operational performance
p2= 0.040, shows that one unit change in Bar Coding would results in 0.040 units increase in
operational performance
p3= 0.239, shows that one unit change in Vendor Managed Inventory would results in 0.239 units
increase in operational performance
p4= 0.120, shows that one unit change in Transport Management Systems would results in 0.120
units increase in operational performance
P5= 0.345, shows that one unit change in Electronic Payment Systems would results in 0.345
units increase in operational performance
p6= 0.079, shows that one unit change in Just in Time would results in 0.079 units increase in
operational performance
The Standard Errors are the standard errors of the regression coefficients. They can be used for^4-
hypothesis testing and constructing confidence intervals. The Standardized coefficients (Beta)
are what the regression coefficients would be if the model were fitted to standardized data, that
•s, if from each observation we subtracted the sample mean and then divided by the sample SD.
48

The t statistic tests the hypothesis that a population regression coefficient is p is 0, that is, Ho: P=
0. It is the ratio of the sample regression coefficient B to its standard error. The statistic has the
form (estimate - hypothesized value) / SE. Sig. labels the two-sided P values or observed
significance levels for the t statistics. The degrees of freedom used to calculate the P value is
given by the Error DF from the ANOVA table. The P value for the independent variable tells us
whether the independent variable has statistically significant predictive capability. From the table
above the significance values are less than 0.05 hence the independent variables are significant.
95% Confidence Limit for B Lower Bound and Upper Bound, these are the 95% confidence
Intervals for the coefficients. The confidence intervals are related to the p-values such that the
coefficient will not be statistically significant if the confidence interval includes 0. These
confidence intervals helps to put the estimate from the coefficient into perspective by seeing how
much the value could vary.
4.8 Challenges faced in the implementation of the technology
In examining the possible challenges the supermarkets experiences when implementing the
technology, the respondents were asked to rate some possible limitation on a scale of 1 to 5,
where, (1) to a very small extent (2) to a small extent (3) to medium extent (4) to a large extent
where (5) to a very large extent.
49
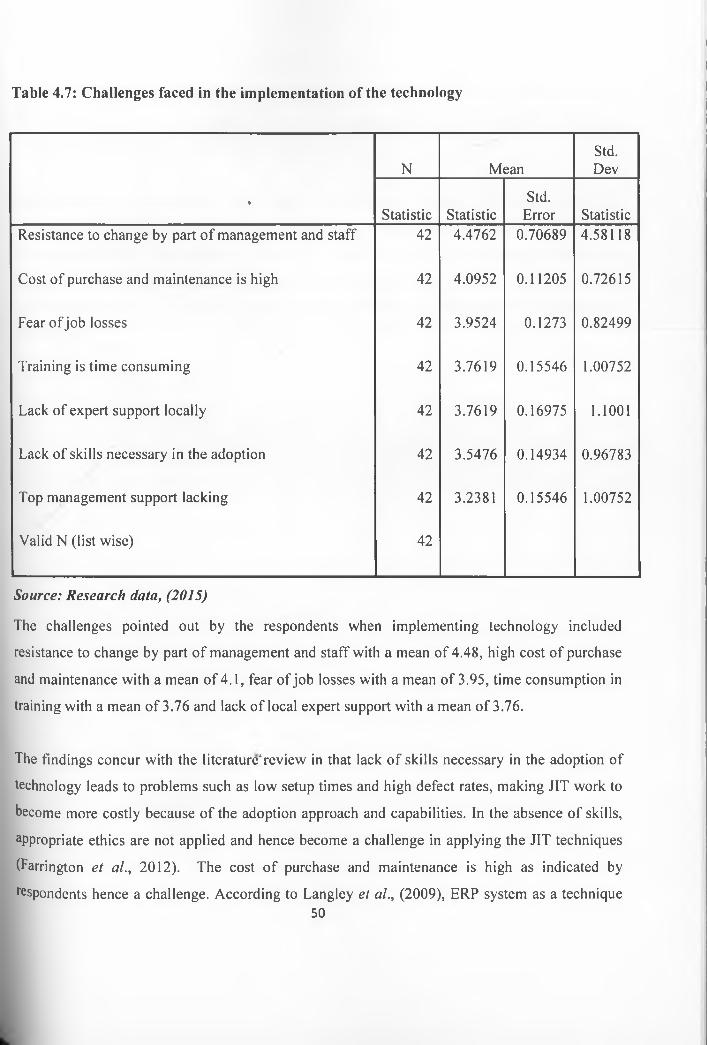
Table 4.7: Challenges faced in the implementation of the technology
*
N MeanStd.Dev
Statistic StatisticStd.
Error StatisticResistance to change by part of management and staff 42 4.4762 0.70689 4.58118
Cost of purchase and maintenance is high 42 4.0952 0.11205 0.72615
Fear of job losses 42 3.9524 0.1273 0.82499
Training is time consuming 42 3.7619 0.15546 1.00752
Lack of expert support locally 42 3.7619 0.16975 1 . 1 0 0 1
Lack of skills necessary in the adoption 42 3.5476 0.14934 0.96783
Top management support lacking 42 3.2381 0.15546 1.00752
Valid N (list wise) 42
Source: Research data, (2015)
The challenges pointed out by the respondents when implementing technology included
resistance to change by part of management and staff with a mean of 4.48, high cost of purchase
and maintenance with a mean of 4.1, fear of job losses with a mean of 3.95, time consumption in
training with a mean of 3.76 and lack of local expert support with a mean of 3.76.
The findings concur with the literature^review in that lack of skills necessary in the adoption of
technology leads to problems such as low setup times and high defect rates, making JIT work to
become more costly because of the adoption approach and capabilities. In the absence of skills,
appropriate ethics are not applied and hence become a challenge in applying the JIT techniques
(Farrington et al., 2 0 1 2 ). The cost of purchase and maintenance is high as indicated by
respondents hence a challenge. According to Langley et al., (2009), ERP system as a technique50
may face the challenge in high capital investment which many supermarkets may not be willing
to acquire due to high costs involved. Even for supermarkets that are able to acquire it, they find
employee training very expensive and time consuming.
Management and staff resistance to adopt the change due fear of change connected to difficulties
of interpretation, the complexity involved, and the underlying business logic with its clear focus
on financial aspects, all contribute to the inertia in reaching adoption of technology (Abbasi and
Nilsson, 2012). The respondents indicated that top management support is a challenge to a
medium extent as they do not participate and share necessary information to implement the
technology.
/
51
CHAPTER FIVE: SUMMARY OF THE FINDINGS,
CONCLUSION AND RECOMMENDATIONS
5.1 Introduction
Examining technology as the knowledge and application of tools, techniques, systems, and
methods of organizations to make or improve goods and services, this chapter provides a
summary of findings, challenges faced in the implementation of technology, impacts of
implementing technology on competitive advantage, adoption of sustainable technology,
conclusion, recommendations, implications of the study on policy, theory and practice, limitation
of the study, and suggestion for further research.
5.2 Summary of the Findings
The study findings revealed clearly that supermarkets adopts specific technology in management
of their operations that are aligned to its corporate strategy in running its value chain function
and these technologies have significantly contributed to the performance and hence creating
competitive advantage in the very supermarket industry by focusing on operational effectiveness
and efficiency.
The findings concur with the literaturereview on other similar studies of other organizations. At
this age of very uncertain, sporadic business environment and stiff competition coupled with a
very knowledgeable customer, supermarkets are turning inward, tapping as much value from
52

their core competencies to establish a sustainable competitive edge through operational
effectiveness and efficiency to improve the organizational performance.
5.2.1 Adoption of technology in management of operations
Supermarkets adopt various technologies in their operations to improve their performance and
hence creating competitive advantage. Enterprise Resource Planning used to integrate functions
it helps supermarkets to maximize the efficiency of business process across the entire
organization, increase on time delivery, increase ability to forecast demand to supplies, increase
order capacity, and improve customer service. An ERP system also integrates all supermarket
management functions, and hence decreases level of inconsistency information from different
systems thus; managers gather correct information and make a right decision. Scanning used at
the point of sale terminals allows staff to tend to revenue generating tasks such as helping
customers. It eliminates the need to double-check inventory disparities and cash register
reconciliation, it reduces the effort required to do inventory and other repetitive paperwork hence
improved efficiency leading to higher customer satisfaction, lower costs and higher sales.
Goods delivered only when needed to avoid overstocking helps the supermarket to reinvest the in
profitable projects, internet use in communication with suppliers and customers and inventory
systems networked with supplier’s increases the interaction between the supplier and customer
hence improved performance. Having a diverse supplier network ensures products are produced
on time and delivered to customer on time as this reduces the chances of customer to switch to
other competitors in the market
53
5.2.2 Impact of technology on competitive advantage
As earlier indicated, supermarkets have managed to consolidate and sustain market leadership
position over the years through diverse technology applications as confirmed by the respondents
of this study. The adoption of various technologies have impacted positively on the operational
performance and consequently on building its operational efficiency. Technology provides a very
fertile ground of creating competitiveness and hence the move by some supermarkets to
reposition this technology to operation to enhance customer satisfaction. Increased customer
satisfaction is enhanced through timely deliveries; easier identification of products through
classification helps a business design and executes an effective marketing plan and customer to
make informed decisions about the product.
•
Optimal stock levels maintained through supplier collaboration reduces the holding costs hence
reinvest in viable projects, higher stock turn over increasing revenue due repeat and referral
customers, improved delivery times due to distribution efficiency and better demand forecasting
through supplier collaborations creates a competitive edge.
5.2.3 Challenges faced in adopting technology
As leaders world over are realizing the value in adopting the technology and now viewing supply
chain as strategic imperative, they grapple with serious adoption challenges. In this study,<*•
respondent site some challenges as: top management and staff resistance to adopt the change due
fear of change connected to difficulties of interpretation, and the complexity involved.
Employees become comfortable with the way the business is run. They know the expectations
54

and their role within the company. When a major change disrupts their familiarity, some
employees become upset. They don't want to relearn their jobs or change the way they do things.
Lack of Support from top management and minimal local expertise support leads to unnecessary
frustrations in work place. Also, it will cause delay in operations and ineffective decisions in
supermarkets; Cost o f purchase and maintenance is a challenge since some supermarkets do not
have enough funds to acquire the right properties. Lack of skills necessary in the adoption,
knowledge is an essential strategic resource in order for a supermarket to retain sustainable
competitive advantage. As knowledge is created and disseminated throughout the supermarket, it
has the potential to contribute to the supermarket’s value by enhancing its capability to respond
to new and unusual situation. Lack of knowledge in managing and implementing technology, is a
major challenge to the success of implementing and practicing management in the supermarket
industry.
5.3 Conclusion
Based on the findings of the study and the forgoing discussions, it is clear that there exists very
strong technology strategies that have contributed to good performance within the operations and
supply chain and conversely impacting on the supermarket overall performance and its
competitive strength in the challenging business environment.
From the study findings the study concludes that the adoption of technology improves the
operational performance. The improved performance is reflected through increased customer
satisfaction, easier identification of products through classification, optimal stock levels
maintained through supplier collaboration, higher stock turn over increasing revenue due repeat
55
and referral customers, improved delivery times due to distribution efficiency and better demand
forecasting through supplier collaborations. This shows that technology was well customized
process to suit the supermarket’s change needs as supermarket had very well defined technology
strategies. This technology would give the supermarket the higher success rate to the change
process hence competitive advantage.
From the study, findings the study concludes that the technology being adopted supermarkets in
Nairobi County faced various challenges which hindered the effectiveness of the adoption
process. The main challenges included; top management and staff resistance, lack of Support
from top management and expert support locally, cost of purchase and maintenance, lack of
skills necessary in the adoption and fear of job loss. Therefore, the supermarkets faced diverse
challenges that slowed down the technology adoption process.
5.4 Recommendations
Technology need to be embraced to help the management team appreciate the direct impact of
these initiatives. Adoption of flexible technological practices through appropriate research will
help efficiently and effectively meet the business diverse yet drastic changing needs as well as
address challenges arising from a dynamic global business environment. Management should
embrace both qualitative and quantitative aspects in their decision making and more sustainable
technological strategies integration across the group will yield synergies.
56

5.5 Implications of the study on policy, Theory and practice
The technology is an important technique for improvement of goods and services, as evident
from the study, clearly reflecting how they marry with corporate strategy to yield improved
performance and hence creating competitive advantage. To achieve effective adoption of the
various technological practices, it requires clear policies to be formulated, implemented and
monitored to ensure they remain relevant to the business.
The theory as captured at the literature review stage is such that organization that adopt sound
technological practices outperform those that do not and indeed the gap keep widening as such
supermarkets continue to innovatively implore fresh technology practices targeting further and
faster creation of value given immense competition and pressure from the stake holders such that
sustainability of those that do not embrace such best technology strategies is at stake. The/
outcome of this study on supermarkets clearly supports this theory.
With the globalization and stiff competition, there is not much time left to slow copying
supermarkets, proactively and innovatively investing in appropriate technologies should be the
core calling of top management if their supermarkets are to grow.
5.5 Limitations of the Study
The study was faced by several limitations. Firstly, the sample size in this study may be adjudged
to be small. To this extent the results for the study may suffer from sampling bias, therefore it
lead to the narrow understanding of the population. Secondly, a resource constraint was a major
challenge. Due to financial constraints, the study did not cover the national geographical area
57

that would have given the study a different view of technology applied outside Nairobi. Thirdly,
some information was deemed by respondents as too confidential, thus they did not wish to
diverge. There was lack of response from some of the targeted respondents. Others failed to
return the questionnaires claiming that they had no time to fill them, while others argued that it
was against the supermarket’s policy to disclose any information relating to their supermarket
making support from their supermarket a challenge.
5.6 Areas of further Research
The study sought to explore the technology as a competitive advantage in supermarket
operations in Nairobi County in Kenya. The study recommends that an in-depth study should be
accrued out on factors influencing adoption of technology supermarkets in Kenya. Since this
study explored the technology as a competitive advantage in supermarket operations in Nairobi
County, the study recommends that; similar studies should be done in other sectors of the
Kenyan economy for comparison purposes and to allow for generalization of findings on the
technology in Kenya.
58

REFERENCES
Angeles R., Nath R. (2000). The importance of congruence in implementing electronic data interchange systems, Supply Chain Management: An International Journal, 5 (4), 198- 205.
Aquilano, N., Chase, R., Shankar, R., Jacobs R. (2010). Operations & Supply Management. Twelfth Edition. Tata McGraw Hill
Armstrong, C., Sambamurthy, V. (1999). Information technology assimilation in firms: The influence of senior leadership and IT infrastructures. Inform. Systems Res. 10(4) 304- 327.
Bensaou, M.(1997). Inter-organizational cooperation: The role of information technology an empirical comparison of US and Japanese supplier relations. Inform. Systems Res. 8(2) 107-124.
Burns, N., Grove, S. K. (2003). The practice o f nursing research: Conduct, critique and utilization. Toronto: WB Saunders.
Dimaggio, P.J., Powell, W.W. (1983). The iron cage revisited - institutional isomorphism and collective rationality in organizational fields. American Sociological Review, Vol. 48, No. 2, pp 147-160.
Ellram, L.M., 1991. Supply chain management: the industrial organisation perspective.International Journal o f Physical Distribution and Logistics Management 21 (1), 13-22.
Ellinger, A. E., Daugherty, P. J., Gustin, C. M. (1997). The relationship between integrated logistics and customer service. Logistics & Transportation Review 33 (3), 129-138.
Esselaar, P., & Miller, .T. (2001). Towards Electronic Commerce in Africa. A Perspective from Three Country Studies. Miller Esselaar & Associates.
Ferguson, D. M., Hill, N. C., Hansen, J. V. (1990). Electronic data interchange: foundations and survey evidence on current use. Journal o f Information Systems, 4, 81-91.
Field, A. (2005): Discovering Statistics Using SPSS, 2nd ed., Sage, London.-M-
Garten, J.E. (1998). Why the global economy is here to stay. Business Week 23, 21.
Gunasekaran, A. and Ngai, E. W. (2004). Information systems in supply chain integration and management. European Journal o f Operational Research, 159 (2), 269-295.
Heidegger, Marcuse. (2004). The Catastrophe and Redemption of Technology. New York: Routledge
59

Helms, M. M , Jacobs, F. R., Chase, R. B., & Aquilano, N. J. (2009). Study guide and lecture guide for use with Operations and supply management. Twelfth Edition. Boston: McGraw-Hill/Irwin.
Hiew, J.F. (2005), Multivariate Data Analysis: A Global Perspective, Pearson Education Inc., NJ.
Iacovou, C.L., Benbasat, I., and Dexter, A.S. (1995). Electronic data interchange and small organisations: adoption and impact of technology. MIS Quarterly, 19 (4), 465-485.
Jannat, S., Hasin, M. A. A. and Khaled, A. A. (2009). Advances in Materials and Processing Technologies. AMPT Conference , Jalan Gombak.
Kemibaro, M. (2010, February 8). E-commerce on a steady rise in Kenya. The East African: http://www.theeastafrican.co. ke/business/-/2560/856868/-/4eayibz/-/index.html. Accessed 22.06.2015
Kestrel Capital (E. A) Ltd. (2012). A study of Uchumi Supermarket. ICO Report, March 2012. Kitheka, S. (2012). Inventory Management Automation And The Performance OJ
Supermarkets In Western Kenya. MBA project at the University of Nairobi.
Koumanakos, D.P. (2008). The effect of inventory management on firm performance. International Journal o f Productivity and Performance Management, Vol. 57 No. 5, p p .335-69.
Langley J., Coyle J., Gibson B., Novack R. & Bardi R. (2009). Managing Supply Chains - A Logistics Approach. Eighth Edition. South Western, Cengage Learning.
Lee, H. L., K. C. So, C. S. Tang. (2000). The value of information sharing in a two-level supply chain. Management Sci. 46(5) 626-643.
Leo Mielizulu Lulu (2012). Inventory management strategies employed by Kenya motor vehicle distribution in managing their parts inventory. MBA Project. University of Nairobi.
Love, P. (1996). Enablers of process reengineering. International Construction InformationTechnology Conference, Sydney, Australia, 18-19 April, 77-84.
<*•
Lucey, T., (2002). Quantitative techniques (6th ed.). London: Continuum.
Lysons K., Farrington B. (2012). Purchasing And Supply Chain Management. Eighth Edition. Pearson Education Limited.
McGaughey, R. E., & Mason, K. H. (1998). The Internet as a marketing tool. Journal o f Marketing Theory and Practice, 6, 1-11.
60
Merrifield, D.B. (2000). Changing nature of competitive advantage. Research Technology Management 41 (1), 41-45.
Michel Foucault (1980). Power and Knowledge. Colin Gordon. (New York: Pantheon, 1980)
Min, W., Pheng, L.S. (2005). Re-modeling EOQ and JIT purchasing for performance enhancement, International Journal o f Productivity and Performance Management, Vol. 54 No. 4, pp. 256-77.
Munyui, W. (2011). Application o f inventory models in management o f raw materials by food manufacturing firms in Kenya. MBA Project. University of Nairobi.
Murphy, P.R. and Daley M. J. (1999). EDI benefits and barriers comparing international freight forwarders and their customers. International Journal o f Physical Distribution and Logistics Management, 29 (3), 207-216.
Murphy, P. & Wood, D. (2008). Contemporary Logistics. Ninth Edition. Prentice - Hall of India.
Ngugi, K (2014). Factors Influencing Online Shopping Adoption In Kenya: A Case Of Westlands District, Nairobi County. Unpublished Research Project for Master Of Arts In Project Planning And Management Of The University Of Nairobi
Ouma, D., Mwangi, T. D., Oduk, P.M (2013). Modeling Agility in Kenyan Supermarkets Chain Expansion. International Journal o f Business and Commerce Vol. 2, No.8: Apr 2013. Asian Society of Business
Owuor, S. (2009). A 24-Hour Nairobi City Economy? Opportunities and challenges. Remembering Kenya: Governance, citizenship and economics. Nairobi, Kenya, September 23.
Pallant, J. (2005). SPSS Survival Manual: A Step Guide to Data Analysis Using SPSS for Windows (Version 12).New York (2nded.). Open University Press.
Porter, M.E., Stern, S., 2001. Innovation: location matters. MIT Sloan Management Review 42 (4), 28-36.
Power, D., (2003) Implementation and use of B2B-enabling technologies: five manufacturing cases. Journal o f Manufacturing Technology Management, 16 (5), 554-572.
Pralahad, C.K. & Hammond, A. 2002. Serving the World’s Poor, Profitably. Harvard Business Review, September: 48-57.
61
Render, B., Stair, R, M. and Hanna, M. (2009), Quantitative Analysis for Management, 10th ed., Pearson Education, Upper Saddle River, NJ
Richbell, S., Kite, V. (2007). Night shoppers in the “open 24 hours” supermarket: a profile.International Journal o f Retail & Distribution Management, Vol. 35 Iss: 1, pp.54 - 68
Rogers, E.M. (1995). Diffusion o f innovations. Fourth Edition. New York, Free Press
Sumanjeet, S. (2009). Emergence of Payment Systems in the Age of Electronic Commerce: The State of Art. Global Journal o f International Business Research, Vol. 2. No.2, pp20.
Scott, C., Brian, H. (1996). How to measure customer service effectively. Managing Service Quality, Vol. 6 Iss: 1, pp.36 - 39
Slack N., Chambers S. & Johnston R. (2010). Operations Management. Sixth Edition. Prentice Hall Financial Times - Pearson Education Limited
Sople V., (2011). Logistics Management. Second Edition. Pearson Education Limited.
Sople V. V. (2011). Supply Chain Management: Text and Cases (2nd Ed.). Pearson.
Srinivasan, K., Kekre, S., Mukhopadhyay, T., (1994). Impacts of electronic data interchange technology on JIT shipments. Management Science 40 (10), 1291-1304./ '
Swink M., Melnyk M., Cooper B., & Hartley, J.(2011). Managing Operations across The Supply Chain (International Student Edition), McGraw Hill
Turban, E., Lee, J., King, D., & Chung, H. M. (2006). Electronic Commerce: A Managerial Perspective. New Delhi: Dorling Kindersley (India).
Vella, D. (2012). Using technology to improve supply chain management. Article on Business process management training and supply chain management
Venkatesh, V., Morris, Davis (2003). User Acceptance of Information Technology: Toward a Unified View. MIS Quarterly 21 (3), pp. 425^478
Vijayasarathy, L. R. and Tyler, M. L. (1997). Adoption factors and electronic data interchange use: a survey of retail companies. International Journal o f Retail & Distribution Management, 25 (9), 286-292.
Weber, M. M., Kantamneni, S. P. (2002). POS and EDI in retailing: an examination of underlying benefits and barriers, Supply Chain Management. An International Journal, 7(5), 31 \ - 3 \ l .Online Resources
62
Williams, B., Brown, T., & Onsman, A. (2010). Exploratory factor analysis: A five-step guide for novices. Australasian Journal o f Para-medicine, 8(3). Retrieved from http://ro.ecu.edu.au/jephc/vol8/iss3/! on 27.08.2015
63

APPENDICES
APPENDIX I: QUESTIONNAIRE
Technology as a Competitive Advantage in Supermarket Operations
Part A:
Organisation Profile
Name of the Supermarket:...................................................................................................................
Year of Establishment:.........................................................................................................................
Number of Branches in Nairobi County:...........................................................................................
Type of Supermarket: General........ Grocery....... Electronic.......Clothing......Please Tick One.
Management Profile
Management Level: Supervisory....... Mid-level....... Senior Manager............ Executive.......
Position held..........................................................................................................................................
Number o f years worked in the supermarket.....................................................................................
Level of Education: Diploma....... Degree....... Masters degree....... Other.................................
Age: 1 8 -2 5 ........ 2 6 - 3 5 ............ 3 6 - 4 5 .......... 4 6 - 5 5 ......... Above 55....................
Part B: Extent to which technology is applied in the management of supermarkets operations
Please rank in a scale of 1-5; (where: 1- to a very small extent, 2- to a small extent, 3- to medium
extent, 4- to a large extent and 5- to a very large extent). Tick as appropriate.
Extent of application of technology Ranking
1 2 3 4 5
Enterprise Resource Planning used to integrate functions
64

Scanning used at the point of sale terminals
Stocks classification for ease of identification and picking
Fleet use global positioning tracking systems
Mobile transactions used for goods payments
Inventory systems networked with suppliers
Social media is used for communications with customers
Internet use in communication with suppliers and customers
Purchase orders raised and sent electronically
Goods delivered only when needed to avoid overstocking
Others (Please Specify)
PART C: Impact of the adoption of such technology in achieving competitive advantage
Please rank in a scale of 1-5; (where: 1- to a very small extent, 2- to a small extent, 3- to medium
extent, 4- to a large extent and 5- to a very large extent). Tick as appropriate.
Impact of the technology adoption Ranking
1 2 3 4 5
Competitive pricing due to cost reduction achieved from
functional integration
65

Minimal labour intervention due to real-time systems
Improvement and visibility of internal processes at all levels
due to use of online systems
Accountability by all drivers through fleet tracking systems
Increased sales due to product differentiation
Increased market share achieved through better customer
service and market focus
Faster inbound and point of sale transactions
Increased customer satisfaction due to timely deliveries
Improved operational efficiencies through human skill and
technology utilization
Faster feedback from market through online infrastructure
Easier identification of products through classification
Better after sales service supported by internet communications
Improved information sharing due to internet and integration
Better, faster and informed decisions through analytical data
Better demand forecasting through supplier collaborations
Improved delivery times due to distribution efficiency
Higher stock turn-over increasing revenue due to repeat and
referral customers
Optimal stock levels maintained through supplier collaboration
66

Others (Please Specify)
PART D: Challenges faced in the implementation of the technology
Please rank in a scale of 1-5; (where: 1- to a very small extent, 2- to a small extent, 3- to medium
extent, 4- to a large extent and 5- to a very large extent). Tick as appropriate.
Challenges faced in implementation of technology Ranking
1 2 3 4 5
Top management support lacking
Lack of skills necessary in the adoption
Resistance to change by part of management and staff
Fear of jobs losses
Cost of purchase and maintenance is high
Training is time consuming
Lack of expert support locally
Others (Please Specify)
Thank you for your cooperation and support67

APPENDIX II: LIST OF SUPERMARKETS IN NAIROBI
1) Chandarana Supermarkets
2) Cleanshelf Supermarkets
3) Deacons Ltd
4) Eastmatt Supermarkets
5) Ibrahim’s supermarkets
6) G-Mart Supermarkets
7) Jaharis Supermarkets
8) Kassmart Supermarkets
9) Maguna Andu Supermarkets
10) Naivas Limited
11) Maathai Supermarkets
12) Mr. Price Ltd
13) Nakumatt Holdings Limited
14) Quickmart Supermarkets
15) Rikana Supermarkets
16) Selfridges Supermarkets
17) Tumaini Supermarkets
18) Tuskys
19) Uchumi Supermarkets
20) Ukwala Supermarkets
21) Karrymatt Supermarkets
22) Woolworths Ltd
23) Zucchini Groceries **
Source: Kenyaplex Business Directory 2015
68

APPENDIX III: SUPERVISOR ALLOCATION FORM
UNIVERSITY OF NAIROBISCHOOL OF BUSINESS
DEPARTMENT OF MANAGEMENT SCIENCE MBA PROJECT SUPERVISION ALLOCATION FORM
SECTION A: (To lie completed by the student)
Name of Student: Reg. No: .P. ./. IP.. V.ff..Mobile Phone ......... Email.. ..........
Proposed Title of the Study....UA£...Q£.....7.G..etW.?.9?.*X. ...... .<f...........Y<r. f). Qf&iffX/?. $£.. T'f.f..... €.... .Qp.........
. ...AH... ..Al/%•.£?.& i. CgM.t?.. 7 .X ...................
( J [ I
Suggested Supervisors: (1) P.. . £ (2) ......
Signature of Student:..........Ofc?................. Bate :....9.&I.9.LJ.&?.!.£.,.........................
Specialization (Tick as appropriate):
Operations Management
Management Information Systems
Procurement & Supply Chain Mgt.
SECTION B (To be completed by the Department) .•?
Name of Supervisor Allocated..tak1.(.^H!;f.\(r...^...f.h... ...
Allocated Moderator. A i u l . ..................Total number of students allocated to the supervisor within the year to date
Acceptance by Supervisors,
Signature:,
Acceptance by Supervisor:^
yizme:...pA.\i\:fJyp:̂ f'- Si
Approval by the Thematic Coordinator:
N a m e : . }...kX.e..9.. ' Signature/..,
Approv al by Chairman o f Department:
Name:. !X(. / Signature:... Bate
Note:
D a te :.. f9S : .4.'./. -a . .
Date
r U . I - K - «• 1 t , f l l . 4 ! . •> . 1rv ^
69

APPENDIX IV: PROPOSAL CORRECTION FORM
UNIVERSITY OF NAIROBI
SCHOOL OF BUSINESS
PROPOSAL CORRECTION FORM
studcotNa™ . M U T ( $ y A H l T f u C A . . .
Registration Number... X $ J . . . / . 7.P.. f f j . t t . ( H iP .L Lf . .......................
Department... 1)1 A * ! * $ € * * . .......«£<rl £ .£ .................
Specialization.../?/???. f~lS.fi . . -r"t .. .
Title ofProject Proposal.
, $ T> y& N Jft6 T 0&W 7fcvvr
... w ....sojfii. A-pA CfuAfry.........................
The student has done all the corrections as suggested during the Proposal Presentation and can now proceed to collect data.
jMfci2w ̂ [(.c/LhJLtSupervisor..............; ..............................SName of Supervisor..............................................S ignatured rrr.......... Date .a ffo tlo (5
70

APPENDIX V: DATA COLLECTION FORM
UNIVERSITY OF NAIROBISCHOOL OF BUSINESS
_________________________ MBA PROGRAMMETelephone: 020-2059162 Telegrams: “Varsity", NairobiTelex:____ 22005 Varsity_______________________________________________________
P.O. Djx J0IO7 Naimbi. Kenya
DATE
T9 WHQM IT MAY CONCERN
The bearer of this letter
Registration N o .............................
is a bona fide continuing student in the Master of Business Administration (MBA) degree program in this University.
He/she is required to submit as part of his/her coursework assessment a research project report on a management problem. We would like the students to do their projects on real problems affecting firms in Kenya. We would, therefore, appreciate your assistance to enable him/her collect data in your organization.
The results of the report will be used solely for academic purposes and a copy of the same will be availed to the interviewed organizations on request.
manK you.
MBA ADMINISTRATOR SCHOOL OF BUSINESS
71