technology & standards committee shanghai meeting … ofda4000 vs almeter hauteur.pdf · barbe...
TRANSCRIPT

TECHNOLOGY & STANDARDS COMMITTEE SHANGHAI MEETING Sliver Group November 2004
Chairman: G.S. SINGH (India) Report No: SG nn
Improving Agreement on Hauteur Measurement between OFDA4000 and Almeter
By
Mark Brims
BSC Electronics 13 Willcock St Ardross 6153 Western Australia
BRIEFING PAPER
SUMMARY OF FINDINGS
The agreement between OFDA4000 and Almeter measurements has been improved by including in the OFDA4000 software a model which simulates the effects of capacitance measurement.
OFDA4000 Length is left unadjusted to provide alternative information for top performance prediction evaluation. It is not known at this stage whether Length would give a more reliable prediction than the current Hauteur approach, although experimental evidence is presented supporting previous assertions that Length gives more accurate short fibre measurement in wools with significant diameter profiles.
Naming conventions need to be redefined to prevent confusion between Length, Hauteur and distribution descriptions.
Experiments have been described that can be repeated by others to verify the estimation of short fibre content by both the OFDA4000 and the Almeter as the K25 values.
COMMERCIAL IMPLICATIONS – CURRENT AND FUTURE
The table below summarises the comparison between the Almeter and the OFDA400, using new software, for measurements of Hauteur, CV Hauteur and Short Fibre Content on 10 wool tops.
Top Number
Almeter Hauteur
New OFDA4000
Hauteur Almeter
CVH
New OFDA4000
CVH Almeter K25(H)
New OFDA4000
K25(H)
1 43.9 45.5 45.7 47.9 18.6 18.1
2 47.5 47.8 48.1 48.7 16.6 16.8
3 86.0 87.5 41.0 37.7 4.6 3.1
4 83.3 83.7 30.6 29.3 0.6 0.2
5 43.3 43.9 37.1 39.0 12.9 13.2
6 91.1 90.2 38.8 37.6 3.5 3.3
7 71.8 71.4 52.9 51.8 8.5 8.6
8 75.8 77.2 33.3 34.7 0.7 1.5
9 62.6 61.8 44.7 45.8 7.7 9.2
10 91.7 94.1 45.9 43.7 4.3 3.3
Average 69.7 70.3 41.8 41.6 7.8 7.7
The new measure of OFDA length, CV length and short fibre content by length may produce better processing predictions than the current capacitance based measurements from the Almeter.
NOTE
The Report will be presented to the Sliver Group meeting to be held at 1040 Saturday 20th November 2004

Sliver Group Briefing Paper for Report : nn
Improving Agreement on Hauteur Measurement between OFDA4000 and Almeter\…:- Page 2 of 40

Sliver Group Report : nn
Improving Agreement on Hauteur Measurement between OFDA4000 and Almeter\…:- Page 3 of 40
TECHNOLOGY & STANDARDS COMMITTEE SHANGHAI MEETING Sliver Group November 2004
Chairman: G.S. SINGH (India) Report No: SG nn
Improving Agreement on Hauteur Measurement between OFDA4000 and Almeter
By
Mark Brims
BSC Electronics 13 Willcock St Ardross 6153 Western Australia
SUMMARY
The Almeter represented a good solution to fibre length measurement using the only viable technology of its time. However, using capacitance field as a measure of length causes the length to be biased by the cross sectional area of the fibres, which is called hauteur. In addition, capacitance introduces other effects, which cause the hauteur to be biased.
Agreement between OFDA4000 and Almeter on the measurement of hauteur has been reported previously [1] [2] [3] and found to be generally acceptable. However, it was found that on short wools (H<50mm) the OFDA4000 was trending shorter and some of the distribution values showed differences. The L1 values (longest 1% of fibres by hauteur) was up to 15mm longer by Almeter than by OFDA4000.
To find the reasons for the difference a Fibroliner and Almeter (AL100) were installed next to an OFDA4000. Direct measurements of the capacitance output from the Almeter gave insight into the effects of using capacitance as a measure of length. The OFDA4000 software was modified to simulate the capacitance curve, and then the Hauteur was calculated from this curve in a similar way to the Almeter. This produced a significant improvement in the alignment between the instruments.
The measure of Hauteur is to be used for comparison with Almeter; Length is left unadjusted and should be used for performance estimation. Barbe can be calculated from either the Length or Hauteur, but it was decided that the two numbers could cause confusion, so to provide the best agreement with the Almeter, the OFDA4000 Barbe was calculated from the OFDA4000 Hauteur.
Naming Conventions
The Almeter Test Method refers to Hauteur and Barbe as H and B respectively. However, in general use of Almeter, the term Length has sometimes been used instead of Hauteur. For example the term L1 is used by some Almeter software to indicate the length in mm of the longest 1% of fibres, the correct name should be H1. The OFDA4000 software refers to Length, Hauteur and Barbe as L, H and B respectively.
The term K25 has come to represent the percentage of fibres less than 25mm by hauteur. The terminology used here is L1, H1, B1 for the measure of the longest 1% of fibres, KL25, KH25, KB25 for the percentage of fibres less than 25mm etc.
Measuring the Capacitance Curves from Almeter
Hauteur is defined as “cross section biased length”. Almeter measures Hauteur on an end-aligned beard of fibres using a capacitance sensor. The capacitance sensor introduces some extra side effects that are not related to the length of the fibres, and this means the Almeter actually outputs“capacitance biased” hauteur. To improve agreement of hauteur measurement between OFDA4000 and Almeter, the capacitance effect must be modelled.

Sliver Group Report : nn
Improving Agreement on Hauteur Measurement between OFDA4000 and Almeter\…:- Page 4 of 40
The Almeter 100 raw capacitance output was connected to a 12bit A/D converter and thus to a computer. Samples were taken at 500 per second, or one approximately every 0.13mm when the bed was moving. A file was produced that could be read easily into Excel for analysis.
The linearity of the capacitance measurements was checked with cardboard squares and wool beards and found to be very good.
The width of the capacitance field was measured using a cardboard square. The signal across the edge of the cardboard is shown in Figure 1.
Figure 1: The Capacitance Profile along a Card Board Square.
-0.2
0
0.2
0.4
0.6
0.8
1
1.2
1.4
1.6
1.8
80 85 90 95 100 105 110 115 120 125
mm
Cap
acita
nce
volta
ge
The 5% to 95% rise distance of the voltage signal across the edge was 7.3mm.
The capacitance profile of a beard was found to have a much longer rise distance (Figure 2).

Sliver Group Report : nn
Improving Agreement on Hauteur Measurement between OFDA4000 and Almeter\…:- Page 5 of 40
Figure 2: The Capacitance Profiles along Two Different Wool Beards
0
20
40
60
80
100
120
1 9 17 25 33 41 49 57 65 73 81 89 97 105 113 121 129 137 145 153 161 169 177 185 193 201
mm
Cap
acita
nce
volta
ge
4594
4632
The capacitance profiles in Figure 2 are from two commercial tops of about 80mm Hauteur. According to the Almeter Test Method [4], the Almeter calculates Hauteur by setting the beard start at the 50% threshold of the rising edge. It then appears to set the fibre density at 100% until the voltage begins to fall from its maximum. All the capacitance curves in this paper have a resolution of 1mm, and are aligned so that the 50% threshold at the rising edge is at 20mm.
Sample 4632 is from an Autumn-shorn wool and has a 5-95% rise distance of 16mm. The other has a low along beard diameter profile and has a 5-95% rise distance of 12mm. This causes the KH25 (i.e. the Hauteur %<25mm) short fibre count to be reduced. In the case of 4632, the combined effect of this low pass filter and the diameter profile cause the voltage to start dropping from 100% at about 24mm from the start of the beard (50% threshold).
Figure 3 shows that the Almeter Hauteur follows the capacitance graph almost exactly. Detail is not given in the test method of how the voltages are handled at the other end of the beard, where voltage noise and background level become a major factor in determining the H1 (i.e. the Hauteur at 1%) value.

Sliver Group Report : nn
Improving Agreement on Hauteur Measurement between OFDA4000 and Almeter\…:- Page 6 of 40
Figure 3: Comparison of Almeter and Capacitance Graphs
0
20
40
60
80
100
120
1 8 15 22 29 36 43 50 57 64 71 78 85 92 99 106 113 120 127 134 141 148 155 162 169 176
mm
Cap
acita
nce
volta
ge4632 Almeter H
4632 Capacitance voltage
Differences in Measurement of the Longest 1% (i.e.t he H1 value)
It was observed on many samples that the H1 value is up to 15mm longer when measured by Almeter than by OFDA4000. The beard was watched when being drawn by OFDA4000, and a ruler held alongside, and the OFDA values appeared to be correct. For example, if the OFDA4000 drew 600 fibres, then 6 should be at the H1 length.
A beard was prepared by the Fibroliner and placed between clear plastic films to hold it. A capacitance curve was captured from the Almeter with markers placed near the end and start of the beard to provide reference points. The beard in the sheets was then removed and scanned on a high-resolution flat bed scanner. Lines were drawn at the beard 50% start point, and at the Almete H1 distance. The number of fibres at the H1 distance was then counted. The total number of fibres in the beard was calculated by drawing the same top on the OFDA4000, which provided the number of fibres per mm of draw, and then multiplying this number by 2.5mm (the length of the Fibroliner needle bed feed) and by the number of Fibroliner draws.

Sliver Group Report : nn
Improving Agreement on Hauteur Measurement between OFDA4000 and Almeter\…:- Page 7 of 40
A much lower resolution of the beard is shown here. This beard was calculated to contain 5080 fibres based on the OFDA4000 count, hence at the H1 distance 51 fibres should be counted. The Almeter H1 was 166.0 and the OFDA H1% was 148.2. At the Almeter H1 line, 22 fibres were counted (0.43%) and at the OFDA4000 line 89 fibres were counted (1.74%).
Figure 4: A Picture of a Fibre Beard Showing the Alignment and Angle of Individual Fibres at the Extremes
It is possible that two mechanisms are at work: fibres that are not very well aligned at the beard end as seen in Figure 4, and increased capacitance caused by fibres lying at an angle to the scan axis. It can be clearly seen that the fibre ends lie off the vertical axis. The effect of this is to increase the capacitance at the end of the fibre, and make it appear that there are more fibres present.

Sliver Group Report : nn
Improving Agreement on Hauteur Measurement between OFDA4000 and Almeter\…:- Page 8 of 40
Figure 5 shows a fibre crossing the capacitance field at an angle of 52deg, which produces the same capacitance voltage as 2 fibres crossing the field perpendicularly.
Figure 5: Schematic of Fibres Crossing a Capacitance Field
Figure 6 shows the image of curved plastic “fibre” (diameter approx 0.8mm) and the resultant capacitance voltage output from the Almeter. The effect of the slope of the fibre on its capacitance can be clearly seen. In this case the peak is about 4 times the voltage of the straight fibre, hence 4 fibres are “seen” where there is only 1.
Figure 6: Almeter Voltage Response of a Curved Fibre Scan direction
0
0.2
0.4
0.6
0.8
1
1.2
1.4
1 91 181 271 361 451 541 631 721 811 901 991Distance
Vol
tage

Sliver Group Report : nn
Improving Agreement on Hauteur Measurement between OFDA4000 and Almeter\…:- Page 9 of 40
This will be a factor in increasing the H1 measured by capacitance.
Applying Capacitance Prediction to OFDA4000
Regardless of the causes of the pre-mentioned results, the capacitance output of an Almeter beard scan can be matched by trial and error to the output of the OFDA4000.
Ten tops were selected covering a wide range of diameter, length and diameter profile. Autumn and spring shorn were included. The following table shows the Almeter and original OFDA4000 measurements on these 10 tops. All numbers are the average of two Almeter readings, and the average of two OFDA4000 readings of 6000 fibres each. OFDA4000 is normally set to measure 4000 fibres, but for to improve the experimental prediction, a higher number was used.
Sample OFDA Top Diam Almeter H CVH KH25 1 18.5 43.9 45.7 18.6 2 19.8 47.5 48.1 16.6 3 20.9 86.0 41.0 4.6 4 19.6 83.3 30.6 0.6 5 18.9 43.3 37.1 12.9 6 22.7 91.1 38.8 3.5 7 21.3 71.8 52.9 8.5 8 21.5 75.8 33.3 0.7 9 18.7 62.6 44.7 7.7
10 29.8 91.7 45.9 4.3
Almeter Sample H CVH KH25 KH50 H50 H5 H1
1 43.9 45.7 18.6 65.0 41.1 82.9 108.3 2 47.5 48.1 16.6 59.4 43.9 92.1 114.6 3 86.0 41.0 4.6 20.0 90.8 139.7 154.8 4 83.3 30.6 0.6 11.2 85.5 125.1 141.6 5 43.3 37.1 12.9 67.4 41.8 73.9 88.5 6 91.1 38.8 3.5 14.2 93.5 147.1 165.9 7 71.8 52.9 8.5 39.0 64.7 134.1 150.3 8 75.8 33.3 0.7 18.3 78.7 121.9 136.9 9 62.6 44.7 7.7 37.8 60.9 114.5 131.1
10 91.7 45.9 4.3 19.1 91.1 163.8 200.2
Original OFDA4000 Sample H CVH KH25 KH50 H50 H5 H1
1 43.0 48.1 20.7 65.9 40.9 79.2 101.5 2 45.4 48.5 19.0 61.5 43.0 85.2 106.9 3 85.9 37.3 3.8 17.4 91.7 130.3 138.3 4 82.6 27.4 0.1 9.2 84.5 116.7 125.6 5 41.9 39.1 15.0 69.0 41.2 69.8 81.6 6 89.1 36.3 3.0 14.0 93.0 136.6 148.7 7 68.2 52.8 11.0 40.0 61.9 126.0 137.6 8 76.1 32.7 1.0 17.2 77.0 115.9 127.8 9 59.7 45.1 9.9 39.8 58.9 104.4 118.0 10 93.7 41.1 2.6 15.5 95.5 159.8 179.4
The biggest differences were in the H5 and H1 values.

Sliver Group Report : nn
Improving Agreement on Hauteur Measurement between OFDA4000 and Almeter\…:- Page 10 of 40
The following table shows the tops with OFDA400 Hauteur calculated from the predicted capacitance curve.
Sample H CVH KH25 KH50 H50 H5 H1 1 45.5 47.9 18.1 63.5 42.2 85.1 109.3 2 47.8 48.7 16.8 59.9 44.1 91.6 114.4 3 87.5 37.7 3.1 17.2 92.0 135.8 145.8 4 83.7 29.3 0.2 10.3 85.2 121.4 132.5 5 43.9 39.0 13.2 66.5 42.2 74.6 88.4 6 90.2 37.6 3.3 14.3 93.0 142.4 156.7 7 71.4 51.8 8.6 37.0 64.6 133.3 147.2 8 77.2 34.7 1.5 18.0 77.4 121.6 135.5 9 61.8 45.8 9.2 38.7 59.6 111.0 126.9 10 94.1 43.7 3.3 16.7 94.4 166.7 189.4
The length and diameter curves can be combined in many ways. The original Almeter Hauteur prediction was very simple; the percentage of fibres at each 5mm interval was multiplied by the square of the diameter to calculate the cross section area.
How OFDA Measures Hauteur Using Capacitance Predict ion
Trial and error was used to simulate the low pass effect of the beard start and the stretching effect of the fibre ends not being aligned with the beard. An unexpected discovery was that the cross section area was best matched by raising the diameter to a power less than 2. The exact coefficients used are commercially confidential since they can be used to allow other length measurement systems to simulate Almeter hauteur.
The final procedure is as follows:
1. The percentage of fibres at each 5mm scan point is linear interpolated to 1mm
2. The diameter profile measured at each 5mm scan point is linear interpolated to 1mm resolution, with the beard end placed at 20mm on the “virtual sheet”.
3. The percentage of fibres at each 1mm point is multiplied by the diameter at that point
4. A Gaussian low pass filter (1mm<SD<4mm) is convolved with the curve.
5. The long end of the beard is stretched by a fixed percentage (in the range 1.05 to 1.3%), raised to the power n (1.5<n<2). This simulates the cross-sectional biased area of a very well end-aligned beard
6. The final capacitance curve is aligned at the 50% rising edge point and this is used as the start of the beard.
7. The curve is sampled at 5mm intervals to provide the hauteur percentages.
8. Barbe is calculated from the predicted hauteur.
9. OFDA4000 Length is not adjusted.
The OFDA4000 Length measurement has been retained in the software to enable the evaluation of it as an alternative to the capacitance derived Hauteur distribution for monitoring the quality characteristics of a top. The ten tops used in the current study may be considered as more extreme in their differences than normal commercial tops. However, they do highlight differences between measurement systems that need to be resolved and they have enabled a modelling approach to align the length measurement system to a system based on capacitance measurement.
Appendix 1 raises further questions regarding the short fibre content as measured by a capacitance system compared to a more direct approach.

Sliver Group Report : nn
Improving Agreement on Hauteur Measurement between OFDA4000 and Almeter\…:- Page 11 of 40
Figure 7: Profiles Before and After Fitting the Capacitance Model
0
20
40
60
80
100
120
1 8 15 22 29 36 43 50 57 64 71 78 85 92 99 106 113 120 127 134 141 148 155 162 169 176 183 190 197 204
mm
Cap
acita
nce
volta
ge
41 Almeter capacitance
41 OFDA Estimated Capacitance
OFDA Length
Figure 8: Capacitance Voltage Compared to the Almeter Hauteur Output
0
20
40
60
80
100
120
1 8 15 22 29 36 43 50 57 64 71 78 85 92 99 106 113 120 127 134 141 148 155 162 169 176
mm
Cap
acita
nce
volta
ge
4632 Almeter H
4632 Voltage

Sliver Group Report : nn
Improving Agreement on Hauteur Measurement between OFDA4000 and Almeter\…:- Page 12 of 40
Comparisons Between OFDA4000 Measures Before and Af ter the Capacitance Modelling
The following graphs show the original and new OFDA hauteur relationship with Almeter hauteur. Full analyses conducted in accordance with IWTO-0 are presented in Appendix 2.
Figure 9: Hauteur Comparison Between the Original and New OFDA4000 with the Almeter.
Mean Hauteur
0.0
10.0
20.0
30.0
40.0
50.0
60.0
70.0
80.0
90.0
100.0
0.0 10.0 20.0 30.0 40.0 50.0 60.0 70.0 80.0 90.0 100.0
Almeter
OF
DA
Original OFDA New OFDA
Slope Offset R^2 SE
Original OFDA 1.036 (NS) -3.677 0.994 1.541
New OFDA 1.006 (NS) 0.224 0.9967 1.165
The average differences were –1.14 mm for the Original and 0.61 mm for the New.

Sliver Group Report : nn
Improving Agreement on Hauteur Measurement between OFDA4000 and Almeter\…:- Page 13 of 40
Figure 10: CV Hauteur Comparison Between the Original and New OFDA4000 with the Almeter.
CV Hauteur
0.0
10.0
20.0
30.0
40.0
50.0
60.0
0.0 10.0 20.0 30.0 40.0 50.0 60.0
Almeter
OF
DA
Original OFDA New OFDA
Slope Offset R^2 SE
Original OFDA 1.078 -4.21 0.9079 2.24
New OFDA 1.023 -1.160 0.930 1.943
The average differences were -0.95% for the Original and –0.19 % for the New.

Sliver Group Report : nn
Improving Agreement on Hauteur Measurement between OFDA4000 and Almeter\…:- Page 14 of 40
Figure 11: KH25 Comparison Between the Original and New OFDA4000 with the Almeter.
H%<25mm
0.0
5.0
10.0
15.0
20.0
25.0
0.0 5.0 10.0 15.0 20.0 25.0
Almeter
OF
DA
Original OFDA New OFDA
Slope Offset R^2 SE
Original OFDA 1.1891 -0.66 0.9803 0.944
New OFDA 1.020 -0.229 0.9825 0.892
The average differences were 0.81 % for the Original and –0.07 % for the New.

Sliver Group Report : nn
Improving Agreement on Hauteur Measurement between OFDA4000 and Almeter\…:- Page 15 of 40
Relationship between OFDA400 Length and Almeter Hau teur
The following graphs show the relationship between Almeter hauteur and OFDA4000 Length.
Figure 12: Comparison of OFDA4000 Length and Almeter Hauteur.
Mean
0.0
10.0
20.0
30.0
40.0
50.0
60.0
70.0
80.0
90.0
0.0 10.0 20.0 30.0 40.0 50.0 60.0 70.0 80.0 90.0 100.0
Almeter Hauteur
OF
DA
Len
gth
Slope Offset R^2 SE
0.935 -0.38 0.9884 2.196
The correlation coefficient r^2 was 0.997 for OFDA CVH vs. Almeter CVH and 0.988 for OFDA CVL which suggests that the OFDA hauteur prediction gives better agreement than OFDA length with the Almeter Hauteur.

Sliver Group Report : nn
Improving Agreement on Hauteur Measurement between OFDA4000 and Almeter\…:- Page 16 of 40
Figure 13: Comparison of OFDA4000 CV Length and Almeter CV Hauteur
CV
0.0
10.0
20.0
30.0
40.0
50.0
60.0
0.0 10.0 20.0 30.0 40.0 50.0 60.0
Almeter Hauteur
OF
DA
Len
gth
Slope Offset R^2 SE
0.404 28.92 0.444 5.49
The range of CVH is approximately double the range of CVL and there is low correlation coefficient. It would appear that the CVL range in tops may have been overestimated in the past due to measurement effects.
The correlation coefficient r^2 was 0.929 for OFDA4000 CVH versus. Almeter CVH and 0.444 for OFDA4000 CVL, which suggests that the OFDA4000 CV Hauteur prediction gives much better agreement than OFDA4000 length with the Almeter results.

Sliver Group Report : nn
Improving Agreement on Hauteur Measurement between OFDA4000 and Almeter\…:- Page 17 of 40
Figure 14: Comparison of OFDA4000 Length KL25 Values and Almeter Hauteur KH25 Values.
%<25mm
0.0
5.0
10.0
15.0
20.0
25.0
30.0
0.0 2.0 4.0 6.0 8.0 10.0 12.0 14.0 16.0 18.0 20.0
Almeter Hauteur
OF
DA
Len
gth
Slope Offset R^2 SE
0.9749 5.499 0.76876 3.25
The short fibre content by OFDA length KL25 is generally much larger than the short fibre content by Almeter Hauteur KH25.
The correlation coefficient r^2 was 0.983 for OFDA4000 KH25 versus the Almeter KH25 and 0.768 for OFDA4000 KL25 versus OFDA4000 KH25 which again suggests that for the short fibre content OFDA4000 hauteur prediction gives better agreement than the short fibre content estimated by OFDA4000 Length with Almeter Hauteur.

Sliver Group Report : nn
Improving Agreement on Hauteur Measurement between OFDA4000 and Almeter\…:- Page 18 of 40
The following graphs show the relationship between OFDA4000 Barbe and Almeter Barbe, which has only a slightly lower correlation coefficient (R^2 0.996) than Hauteur (R^2 0.997).
Figure 15: Comparison between OFDA4000 Barbe and Almeter Barbe.
Mean
0.0
20.0
40.0
60.0
80.0
100.0
120.0
0.0 20.0 40.0 60.0 80.0 100.0 120.0
Almeter barbe
OF
DA
Bar
be
Slope Offset R^2 SE
0.9615 3.59 0.9964 1.40

Sliver Group Report : nn
Improving Agreement on Hauteur Measurement between OFDA4000 and Almeter\…:- Page 19 of 40
Figure 16: Comparison between OFDA4000 CV Barbe and Almeter CV Barbe.
CV
0.0
5.0
10.0
15.0
20.0
25.0
30.0
35.0
40.0
45.0
0.0 5.0 10.0 15.0 20.0 25.0 30.0 35.0 40.0 45.0
Almeter barbe
OF
DA
Bar
be
Slope Offset R^2 SE
1.051 -1.66 0.94767 1.33

Sliver Group Report : nn
Improving Agreement on Hauteur Measurement between OFDA4000 and Almeter\…:- Page 20 of 40
Figure 17: Comparison between OFDA4000 KB25 Barbe and Almeter KB25 Barbe.
%<25mm
0.0
1.0
2.0
3.0
4.0
5.0
6.0
7.0
8.0
0.0 1.0 2.0 3.0 4.0 5.0 6.0 7.0 8.0 9.0 10.0
Almeter barbe
OFD
A B
arbe
Slope Offset R^2 SE
0.9277 0.024 0.9922 0.279
Conclusions
The agreement between OFDA4000 and Almeter measurements has been improved by including biases in the OFDA4000 software a model, which simulates the effects of capacitance measurement.
In the current software package, OFDA4000 Length is left unadjusted to provide alternative information for top performance prediction evaluation. It is not known at this stage whether Length would give a more reliable prediction than the current Hauteur approach, although experimental evidence is presented in Appendix 1 supporting previous assertions that Length gives more accurate short fibre measurement in wools with significant diameter profiles.
Experiments have been described that can be repeated by others to verify the estimation of short fibre content by both the OFDA4000 and the Almeter as the KH25 values.
Naming conventions need to be standardised for the measurement of Length, Hauteur and Barbe distributions.
Acknowledgements
The author gratefully acknowledges the comments of Jim Marler, Bob Couchman and Peter Baxter in the writing of this paper.

Sliver Group Report : nn
Improving Agreement on Hauteur Measurement between OFDA4000 and Almeter\…:- Page 21 of 40
REFERENCES
1) Brims, M. (2002) Introducing OFDA4000: Improving. IWTO Sliver Group, Barcelona, Report SG02
2) Brims, M. (2003) Improving Agreement on Hauteur Measurement between OFDA4000 and Almeter. IWTO Sliver Group, Buenos Aries, Report SG02
3) Brims, M., Baxter P.,(2004) Improving Agreement on Hauteur Measurement between OFDA4000 and Almeter. IWTO Sliver Group, Evian, Report SG01
4) IWTO-18-00, Method for the Determination of Evenness of Textile Strands using Capacitance
Testing Equipment.

Sliver Group Report : nn
Improving Agreement on Hauteur Measurement between OFDA4000 and Almeter\…:- Page 22 of 40
APPENDIX 1
The Importance of the New OFDA4000 Measurement of L ength
Before entering the technical section of this paper, it is important to address the most common question asked by the industry. Whilst the new technology offers labour reduction and simpler operation, why bother with the measurement of Length when the industry is used to Hauteur? The reason is that Hauteur is not always proportional to Length, but has differences that appear random (mostly due to the diameter profile). For example, the following two commercial tops, top A has KH25 of 4.6% and top B has KH25 of 2.5%, but the situation is REVERSED when measured by Length, top A has the lesser short fibre content KL25 of 6.5% and top B has the greater KL25 of 9.4%. Commercial tops C and D show virtually no short fibre content by Almeter Hauteur, while significant quantities are found when measured by OFDA4000 Length.
Top Mean Diameter
Almeter Hauteur
OFDA4000 Length
KH25 KL25
A 20.9 86.0 83.1 4.6 6.5
B 29.6 92.2 82.1 2.5 9.4
C 25.5 83.0 72.2 0.6 11.5
D 19.6 83.3 75.9 0.6 8.7
As a general rule, tops have a finer end at the start of the beard, so short fibre by Hauteur often gives much lower values than short fibre by number. Of 40 commercial tops measured, 11 were found to have over double the short fibre content by Length than measured by Hauteur.
Experimental Verification of Short Fibre Content
Wool tops with fine ends, often due to preparation from Autumn-shorn wool, show much lower short fibre content by Hauteur than by OFDA4000 Length. In theory, this is due to the lower diameter giving a lower cross-sectional area and hence a lower capacitance.
It is very difficult to measure these short fibres by hand, and so an experiment was devised using the Almeter and Fibroliner, without requiring any OFDA4000 involvement. Two tops prepared from Autumn-shorn wool were used; one specially manufactured from such wool, the other a commercial top.
The procedure used for each top was:
• the top was placed in the Fibroliner lower needle bed and predrawn to align the ends.
• an end-aligned beard of approximately 15 draws was drawn into the upper (removable) needle bed.
• the top was removed from the lower needle bed.
• the upper needle bed holding the beard was removed and placed in reverse over the lower needle bed
• the beard was pushed into the lower needle bed so that the aligned end was facing away from the draw end.
• the beard was drawn until it was about 35mm from the end, and draws were performed one at a time until it was measured to be as close as possible to 25mm from the end.
• the long part of the beard was removed from the upper needle bed and weighed, and the remaining 25mm beard was drawn into the upper needle bed.
• the upper needle bed was removed and whilst the short fibre beard was still in the upper needle bed, fibres longer than 25mm were removed by tweezers and the 25mm length was checked by ruler.

Sliver Group Report : nn
Improving Agreement on Hauteur Measurement between OFDA4000 and Almeter\…:- Page 23 of 40
• the short beard was weighed.
Results
Sample Beard Wt >25mm Beard Wt <25mm Weighed Barbe %<25mm
52 1.781g 0.050g 2.7%
4632 1.953g 0.039g 1.96%
Sample Almeter Hauteur KH25
OFDA4000 Length KL25
Almeter Barbe KB25
OFDA Barbe KB25
Weighed Barbe KB25
52 0.7 11.1 0.25 2.45 2.7%
4632 0.6 8.7 0.15 1.85 1.96%
The results show a much better agreement between OFDA4000 Barbe KB25 and the Weighed Barbe KB25.
This experiment can be easily repeated by others. It requires only the Fibroliner, a balance and an Autumn-shorn wool top.
Sliver Group Report : nn
Improving Agreement on Hauteur Measurement between OFDA4000 and Almeter\…:- Page 24 of 40
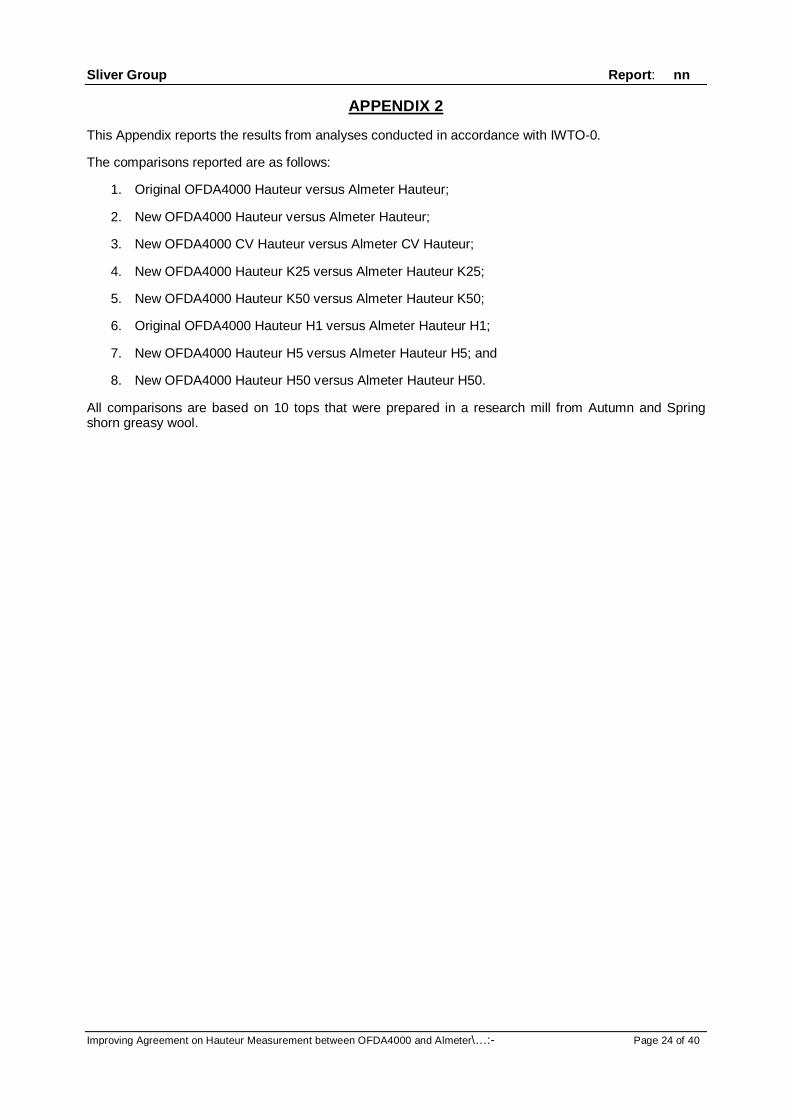
APPENDIX 2
This Appendix reports the results from analyses conducted in accordance with IWTO-0.
The comparisons reported are as follows:
1. Original OFDA4000 Hauteur versus Almeter Hauteur;
2. New OFDA4000 Hauteur versus Almeter Hauteur;
3. New OFDA4000 CV Hauteur versus Almeter CV Hauteur;
4. New OFDA4000 Hauteur K25 versus Almeter Hauteur K25;
5. New OFDA4000 Hauteur K50 versus Almeter Hauteur K50;
6. Original OFDA4000 Hauteur H1 versus Almeter Hauteur H1;
7. New OFDA4000 Hauteur H5 versus Almeter Hauteur H5; and
8. New OFDA4000 Hauteur H50 versus Almeter Hauteur H50.
All comparisons are based on 10 tops that were prepared in a research mill from Autumn and Spring shorn greasy wool.

Sliver Group Report : nn
Improving Agreement on Hauteur Measurement between OFDA4000 and Almeter\…:- Page 25 of 40
Results 1: Original OFDA4000 Hauteur Values Versus Almeter Hauteur Values.
(A) Test for Overall Relative Bias & Paired t-test.
Overall Bias PairedAlmeter OFDA4000 t-test
Number 10 10 10Average 69.7000 68.5600 -1.1400SD 19.2645 19.9656 1.6379SE 6.0920 6.3137 0.5179t value 11.4413 10.8589 -2.2010p value 0.0000 0.0000 0.0552Significance NS
Control Treatment
(B) Test for Correlation.
Number 10DF 8R 0.9972
t-value 37.3949p-value 0.0000
Significance ***
(C) Test for Level Dependent "Bias".
Statistical Significance
Regression Slope Significance SE of Slope t-Value p-value RsqGM 1.0364 NS 0.0276 1.3170 0.2204 0.9943DVA 0.0358 NS 0.0267 1.3410 0.2128
Intercept(GM) -3.6769 STEYXIntercept(DVA) -3.6147 1.5411
Magnitude of the Level Dependent "Bias". Max/Mins.
Nominal Calculated Avg. "Bias" Control max 91.7040 37.78 -2.22 min 43.3050 48.14 -1.86 Treatment max 93.7060 58.51 -1.49 min 41.9070 68.87 -1.13 average max 92.7080 79.23 -0.77 min 42.6090 89.60 -0.40 difference max 2.00
min -3.60

Sliver Group Report : nn
Improving Agreement on Hauteur Measurement between OFDA4000 and Almeter\…:- Page 26 of 40
Difference versus Average
-5.0
-4.0
-3.0
-2.0
-1.0
0.0
1.0
2.0
3.0
4.0
5.0
40.0 50.0 60.0 70.0 80.0 90.0 100.0Average
Diff
eren
ce
Original OFDA4000 Hauteur versus Almeter Hauteur
40
50
60
70
80
90
100
40 50 60 70 80 90 100
Almeter
Orig
inal
OF
DA
4000

Sliver Group Report : nn
Improving Agreement on Hauteur Measurement between OFDA4000 and Almeter\…:- Page 27 of 40
RESULTS 2: New OFDA4000 Hauteur Values Versus Almeter Hauteur Values.
(A) Test for Overall Relative Bias & Paired t-test.
Overall Bias PairedAlmeter OFDA4000(2) t-test
Number 10 10 10Average 69.7000 70.3100 0.6100SD 19.2645 19.3711 1.1070SE 6.0920 6.1257 0.3501t value 11.4413 11.4779 1.7425p value 0.0000 0.0000 0.1154Significance NS
Control Treatment
(B) Test for Correlation.
Number 10DF 8R 0.9984
t-value 49.5278p-value 0.0000
Significance ***
(C) Test for Level Dependent "Bias".
Statistical Significance
Regression Slope Significance SE of Slope t-Value p-value RsqGM 1.0055 NS 0.0203 0.2732 0.7909 0.9967DVA 0.0055 NS 0.0202 0.2739 0.7903
Intercept(GM) 0.2241 STEYXIntercept(DVA) 0.2232 1.1650
Magnitude of the Level Dependent "Bias". Max/Mins.
Nominal Calculated Avg. "Bias" Almeter max 91.7040 40.45 0.45 min 43.3050 50.50 0.50 OFDA4000(2) max 94.1060 60.56 0.56 min 43.9070 70.61 0.61 average max 92.9080 80.67 0.67 min 43.6090 90.72 0.72 difference max 2.40
min -0.90

Sliver Group Report : nn
Improving Agreement on Hauteur Measurement between OFDA4000 and Almeter\…:- Page 28 of 40
Difference versus Average
-5.0
-4.0
-3.0
-2.0
-1.0
0.0
1.0
2.0
3.0
4.0
5.0
40.0 50.0 60.0 70.0 80.0 90.0 100.0Average
Diff
eren
ce
New OFDA4000 Hauteur versus Almeter Hauteur
40
50
60
70
80
90
100
40 50 60 70 80 90 100
Almeter
New
OF
DA
4000

Sliver Group Report : nn
Improving Agreement on Hauteur Measurement between OFDA4000 and Almeter\…:- Page 29 of 40
RESULTS 3: New OFDA4000 CV Hauteur Values Versus Almeter CV Hauteur Values.
(A) Test for Overall Relative Bias & Paired t-test.
Overall Bias PairedAlmeter OFDA4000(2) t-test
Number 10 10 10Average 41.81 41.62 -0.19SD 6.93 7.10 1.88SE 2.19 2.24 0.59t value 19.07 18.55 -0.32p value 0.00 0.00 0.76Significance NS
Control Treatment
(B) Test for Correlation.
Number 10DF 8R 0.9645
t-value 10.3270p-value 0.0000
Significance ***
(C) Test for Level Dependent "Bias".
Statistical Significance
Regression Slope Significance SE of Slope t-Value p-value RsqGM 1.0232 NS 0.0956 0.2427 0.8137 0.9302DVA 0.0233 NS 0.0951 0.2455 0.8116
Intercept(GM) -1.1597 STEYXIntercept(DVA) -1.1637 1.9428
Magnitude of the Level Dependent "Bias". Max/Mins.
Nominal Calculated Avg. "Bias" Almeter max 52.9025 24.42 -0.58 min 30.6030 29.54 -0.46 OFDA4000(2) max 51.8035 34.65 -0.35 min 29.3040 39.77 -0.23 average max 52.3545 44.88 -0.12 min 29.9550 50.00 0.00 difference max 2.20
min -3.30

Sliver Group Report : nn
Improving Agreement on Hauteur Measurement between OFDA4000 and Almeter\…:- Page 30 of 40
Difference versus Average
-5.0
-4.0
-3.0
-2.0
-1.0
0.0
1.0
2.0
3.0
4.0
5.0
25.0 30.0 35.0 40.0 45.0 50.0 55.0Average
Diff
eren
ce
New OFDA4000 CVH versus Almeter CVH
25
30
35
40
45
50
55
25 30 35 40 45 50 55
Almeter
New
OF
DA
4000

Sliver Group Report : nn
Improving Agreement on Hauteur Measurement between OFDA4000 and Almeter\…:- Page 31 of 40
RESULTS 4: New OFDA4000 Hauteur K25 Values Versus Almeter Hauteur K25 Values.
(A) Test for Overall Relative Bias & Paired t-test.
Overall Bias PairedAlmeter OFDA4000(2) t-test
Number 10 10 10Average 7.80 7.73 -0.07SD 6.36 6.49 0.86SE 2.01 2.05 0.27t value 3.88 3.77 -0.26p value 0.00 0.00 0.80Significance NS
Control Treatment
(B) Test for Correlation.
Number 10DF 8R 0.9912
t-value 21.1873p-value 0.0000
Significance ***
(C) Test for Level Dependent "Bias".
Statistical Significance
Regression Slope Significance SE of Slope t-Value p-value RsqGM 1.0204 NS 0.0477 0.4280 0.6787 0.9825DVA 0.0203 NS 0.0470 0.4324 0.6756
Intercept(GM) -0.2294 STEYXIntercept(DVA) -0.2278 0.8923
Magnitude of the Level Dependent "Bias". Max/Mins.
Nominal Calculated Avg. "Bias" Almeter max 18.600 -0.23 -0.23 min 0.605 4.87 -0.13 OFDA4000(2) max 18.10
10 9.97 -0.03 min 0.2015 15.08 0.08 average max 18.3520 20.18 0.18 min 0.4025 25.28 0.28 difference max 1.50
min -1.50

Sliver Group Report : nn
Improving Agreement on Hauteur Measurement between OFDA4000 and Almeter\…:- Page 32 of 40
Difference versus Average
-2.0
-1.5
-1.0
-0.5
0.0
0.5
1.0
1.5
2.0
0.0 2.0 4.0 6.0 8.0 10.0 12.0 14.0 16.0 18.0 20.0Average
Diff
eren
ce
New OFDA4000 K25 versus Almeter K25
0
2
4
6
8
10
12
14
16
18
20
0 2 4 6 8 10 12 14 16 18 20
Almeter
New
OF
DA
4000

Sliver Group Report : nn
Improving Agreement on Hauteur Measurement between OFDA4000 and Almeter\…:- Page 33 of 40
RESULTS 5: New OFDA4000 Hauteur K50 Values Versus Almeter Hauteur K50 Values.
(A) Test for Overall Relative Bias & Paired t-test.
Overall Bias PairedAlmeter OFDA4000(2) t-test
Number 10 10 10Average 35.14 34.21 -0.93SD 21.92 22.15 1.25SE 6.93 7.00 0.39t value 5.07 4.88 -2.36p value 0.00 0.00 0.04Significance *
Control Treatment
(B) Test for Correlation.
Number 10DF 8R 0.9985
t-value 50.8085p-value 0.0000
Significance ***
(C) Test for Level Dependent "Bias".
Statistical Significance
Regression Slope Significance SE of Slope t-Value p-value RsqGM 1.0104 NS 0.0199 0.5255 0.6119 0.9969DVA 0.0104 NS 0.0197 0.5283 0.6101
Intercept(GM) -1.2967 STEYXIntercept(DVA) -1.2902 1.2923
Magnitude of the Level Dependent "Bias". Max/Mins.
Nominal Calculated Avg. "Bias" Almeter max 67.4010 8.81 -1.19 min 11.2020 18.91 -1.09 OFDA4000(2) max 66.5030 29.02 -0.98 min 10.3040 39.12 -0.88 average max 66.9550 49.23 -0.77 min 10.7560 59.33 -0.67 difference max 0.90
min -2.80

Sliver Group Report : nn
Improving Agreement on Hauteur Measurement between OFDA4000 and Almeter\…:- Page 34 of 40
Difference versus Average
-4.0
-3.0
-2.0
-1.0
0.0
1.0
2.0
3.0
4.0
0.0 10.0 20.0 30.0 40.0 50.0 60.0 70.0Average
Diff
eren
ce
New OFDA4000 K50 versus Almeter K50
0
10
20
30
40
50
60
70
0 10 20 30 40 50 60 70
Almeter
New
OF
DA
4000

Sliver Group Report : nn
Improving Agreement on Hauteur Measurement between OFDA4000 and Almeter\…:- Page 35 of 40
RESULTS 6: New OFDA4000 Hauteur H1 Values Versus Almeter Hauteur H1 Values.
(A) Test for Overall Relative Bias & Paired t-test.
Overall Bias PairedAlmeter OFDA4000(2) t-test
Number 10 10 10Average 139.22 134.61 -4.61SD 31.64 27.93 4.51SE 10.00 8.83 1.43t value 13.92 15.24 -3.23p value 0.00 0.00 0.01Significance *
Control Treatment
(B) Test for Correlation.
Number 10DF 8R 0.9963
t-value 32.6166p-value 0.0000
Significance ***
(C) Test for Level Dependent "Bias".
Statistical Significance
Regression Slope Significance SE of Slope t-Value p-value RsqGM 0.8830 ** 0.0270 4.3390 0.0019 0.9925DVA -0.1245 ** 0.0305 4.0851 0.0027
Intercept(GM) 11.6821 STEYXIntercept(DVA) 12.4398 2.8989
Magnitude of the Level Dependent "Bias". Max/Mins.
Nominal Calculated Avg. "Bias" Almeter max 200.2080 82.32 2.32 min 88.50
100 99.98 -0.02 OFDA4000(2) max 189.40120 117.64 -2.36 min 88.40140 135.30 -4.70 average max 194.80160 152.96 -7.04 min 88.45180 170.62 -9.38 difference max 1.00
min -10.80

Sliver Group Report : nn
Improving Agreement on Hauteur Measurement between OFDA4000 and Almeter\…:- Page 36 of 40
Difference versus Average
-12.0
-7.0
-2.0
3.0
8.0
85.0 105.0 125.0 145.0 165.0 185.0 205.0Average
Diff
eren
ce
New OFDA4000 L1 versus Almeter L1
85
105
125
145
165
185
205
85 105 125 145 165 185 205
Almeter
New
OF
DA
4000

Sliver Group Report : nn
Improving Agreement on Hauteur Measurement between OFDA4000 and Almeter\…:- Page 37 of 40
RESULTS 7: New OFDA4000 Hauteur H5 Values Versus Almeter Hauteur H5 Values.
(A) Test for Overall Relative Bias & Paired t-test.
Overall Bias PairedAlmeter OFDA4000(2) t-test
Number 10 10 10Average 119.51 118.35 -1.16SD 29.02 28.39 2.68SE 9.18 8.98 0.85t value 13.02 13.18 -1.37p value 0.00 0.00 0.20Significance NS
Control Treatment
(B) Test for Correlation.
Number 10DF 8R 0.9959
t-value 31.0941p-value 0.0000
Significance ***
(C) Test for Level Dependent "Bias".
Statistical Significance
Regression Slope Significance SE of Slope t-Value p-value RsqGM 0.9784 NS 0.0313 0.6898 0.5077 0.9918DVA -0.0219 NS 0.0321 0.6824 0.5122
Intercept(GM) 1.4234 STEYXIntercept(DVA) 1.4443 2.7880
Magnitude of the Level Dependent "Bias". Max/Mins.
Nominal Calculated Avg. "Bias" Almeter max 163.8070 69.91 -0.09 min 73.9090 89.48 -0.52 OFDA4000(2) max 166.70
110 109.05 -0.95 min 74.60130 128.61 -1.39 average max 165.25150 148.18 -1.82 min 74.25170 167.75 -2.25 difference max 2.90
min -4.70

Sliver Group Report : nn
Improving Agreement on Hauteur Measurement between OFDA4000 and Almeter\…:- Page 38 of 40
Difference versus Average
-6.0
-4.0
-2.0
0.0
2.0
4.0
6.0
70.0 80.0 90.0 100.0 110.0 120.0 130.0 140.0 150.0 160.0 170.0Average
Diff
eren
ce
New OFDA4000 L5 versus Almeter L5
70
80
90
100
110
120
130
140
150
160
170
70 80 90 100 110 120 130 140 150 160 170
Almeter
New
OF
DA
4000

Sliver Group Report : nn
Improving Agreement on Hauteur Measurement between OFDA4000 and Almeter\…:- Page 39 of 40
RESULTS 8: New OFDA4000 Hauteur H50 Values Versus Almeter Hauteur H50 Values.
(A) Test for Overall Relative Bias & Paired t-test.
Overall Bias PairedAlmeter OFDA4000(2) t-test
Number 10 10 10Average 69.20 69.47 0.27SD 21.51 21.72 1.36SE 6.80 6.87 0.43t value 10.18 10.12 0.63p value 0.00 0.00 0.55Significance NS
Control Treatment
(B) Test for Correlation.
Number 10DF 8R 0.9981
t-value 45.3107p-value 0.0000
Significance ***
(C) Test for Level Dependent "Bias".
Statistical Significance
Regression Slope Significance SE of Slope t-Value p-value RsqGM 1.0099 NS 0.0222 0.4458 0.6663 0.9961DVA 0.0099 NS 0.0220 0.4480 0.6647
Intercept(GM) -0.4162 STEYXIntercept(DVA) -0.4149 1.4211
Magnitude of the Level Dependent "Bias". Max/Mins.
Nominal Calculated Avg. "Bias" Almeter max 93.5040 39.98 -0.02 min 41.1050 50.08 0.08 OFDA4000(2) max 94.4060 60.18 0.18 min 42.2070 70.28 0.28 average max 93.2580 80.38 0.38 min 41.6590 90.48 0.48 difference max 3.30
min -1.30

Sliver Group Report : nn
Improving Agreement on Hauteur Measurement between OFDA4000 and Almeter\…:- Page 40 of 40
Difference versus Average
-4.0
-3.0
-2.0
-1.0
0.0
1.0
2.0
3.0
4.0
40.0 50.0 60.0 70.0 80.0 90.0Average
Diff
eren
ce
New OFDA4000 L50 versus Almeter L50
40
50
60
70
80
90
40 50 60 70 80 90
Almeter
New
OF
DA
4000