tectonic plates: what are they made of and what …dsw/lect4_geodyn_asthen.pdf · lithospheric...
TRANSCRIPT
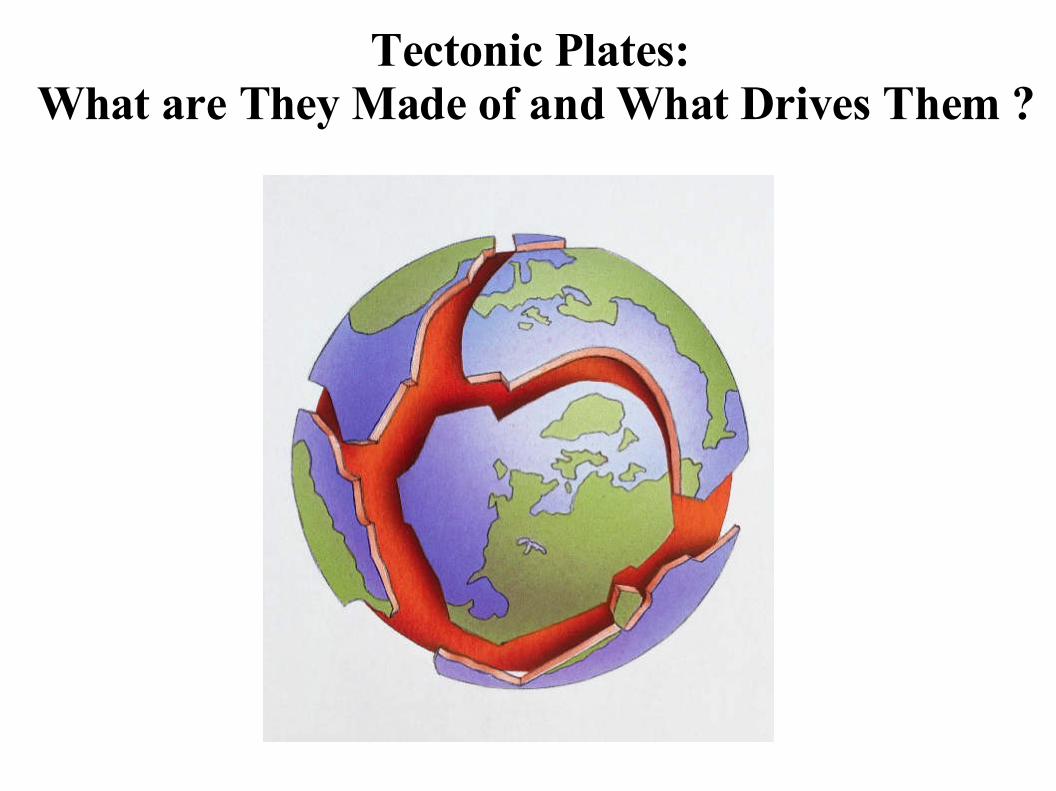
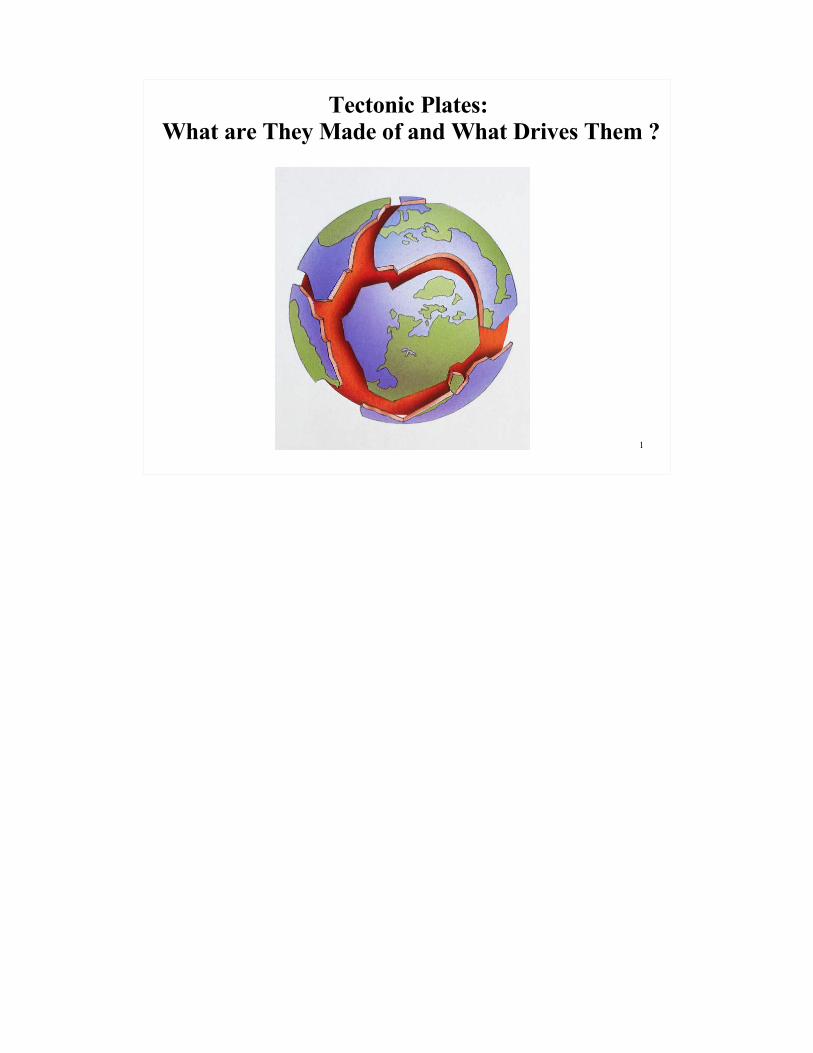
Tectonic Plates: What are They Made of and What Drives Them ?

Lithospheric Plates
The lithosphere can be defined thermally by an isotherm at the base of the lithosphere which should be around 1350oC.
How are plates created ?
How and Why do plates move ?
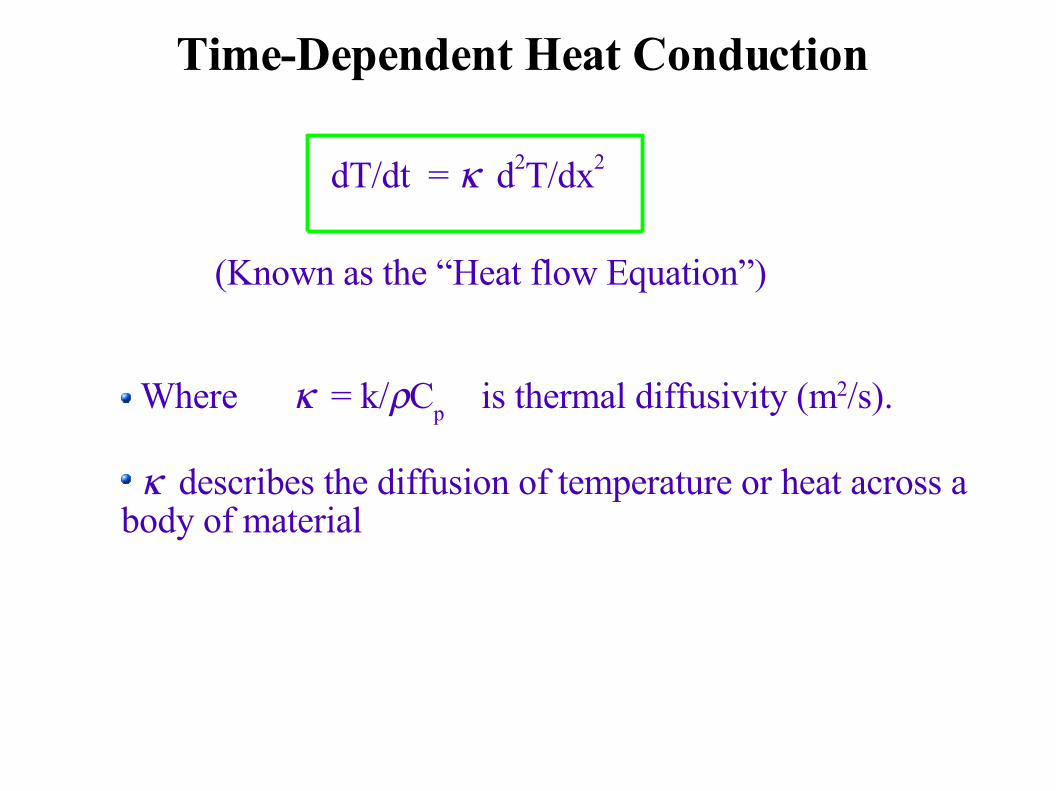
Time-Dependent Heat Conduction
dT/dt = d2T/dx2
(Known as the “Heat flow Equation”)
Where = k/Cp
is thermal diffusivity (m2/s).
describes the diffusion of temperature or heat across a body of material
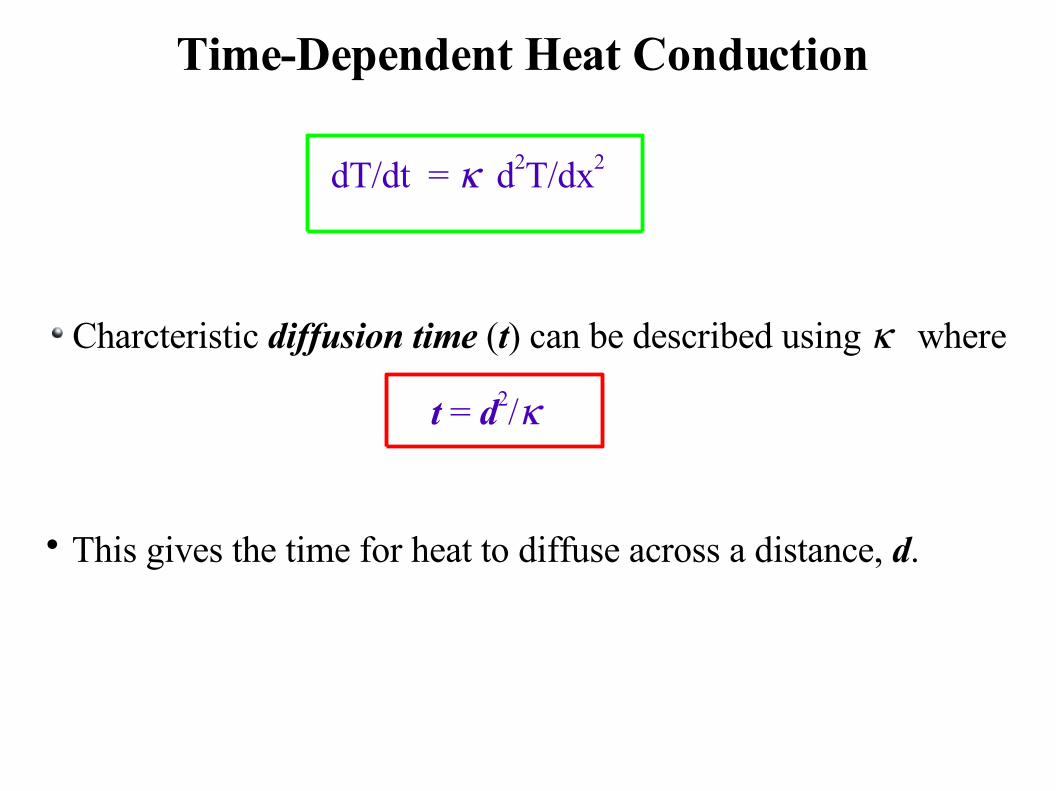
Time-Dependent Heat Conduction
dT/dt = d2T/dx2
Charcteristic diffusion time (t) can be described using where
t = d2/
This gives the time for heat to diffuse across a distance, d.
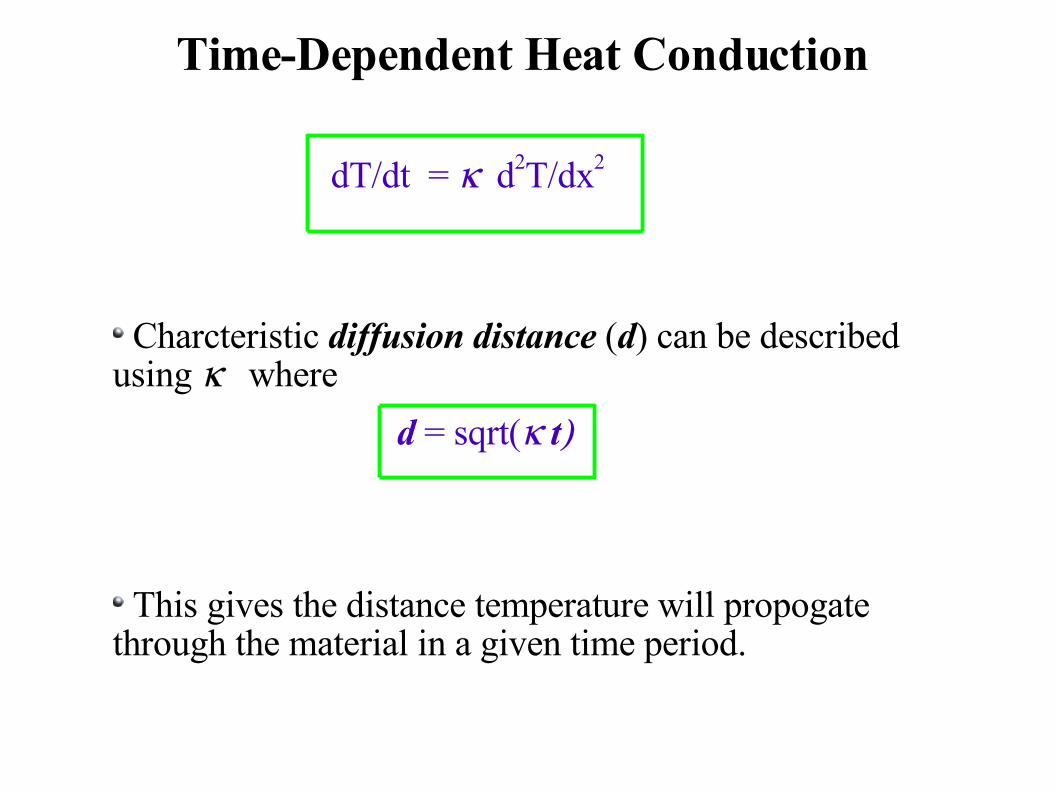
Time-Dependent Heat Conduction
dT/dt = d2T/dx2
Charcteristic diffusion distance (d) can be described using where
This gives the distance temperature will propogate through the material in a given time period.
d = sqrt(t

Time-Dependent Heat Conduction
dT/dt = d2T/dx2
Charcteristic diffusion distance (d) can be described using where
This gives the distance temperature will propogate through the material in a given time period.
d = sqrt(t
Activity
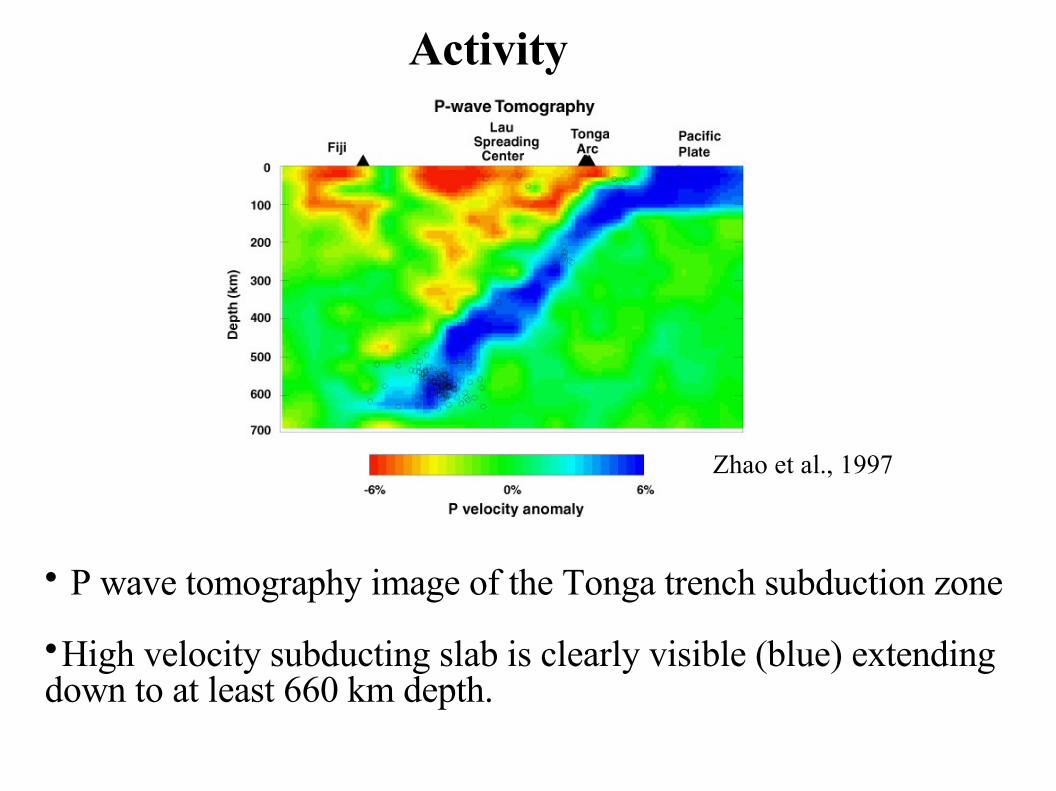
Zhao et al., 1997
P wave tomography image of the Tonga trench subduction zone
High velocity subducting slab is clearly visible (blue) extending down to at least 660 km depth.

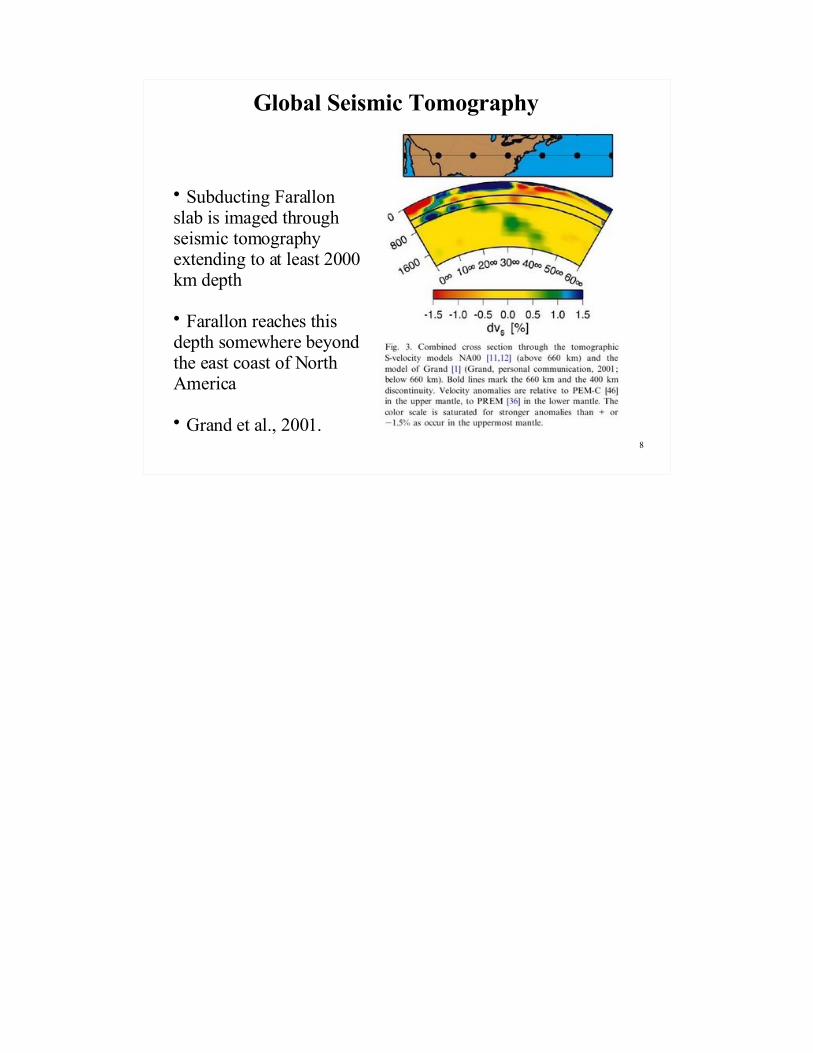
Global Seismic Tomography
Subducting Farallon slab is imaged through seismic tomography extending to at least 2000 km depth
Farallon reaches this depth somewhere beyond the east coast of North America
Grand et al., 2001.
Activity
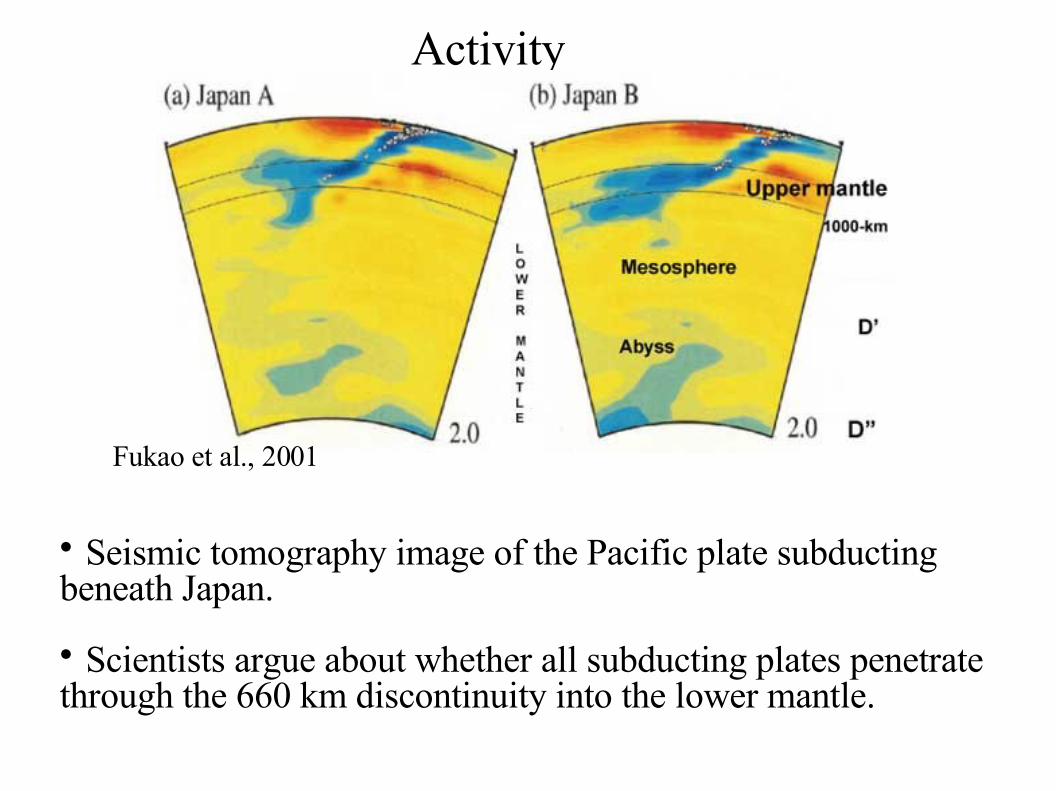
Seismic tomography image of the Pacific plate subducting beneath Japan.
Scientists argue about whether all subducting plates penetrate through the 660 km discontinuity into the lower mantle.
Fukao et al., 2001
Activity
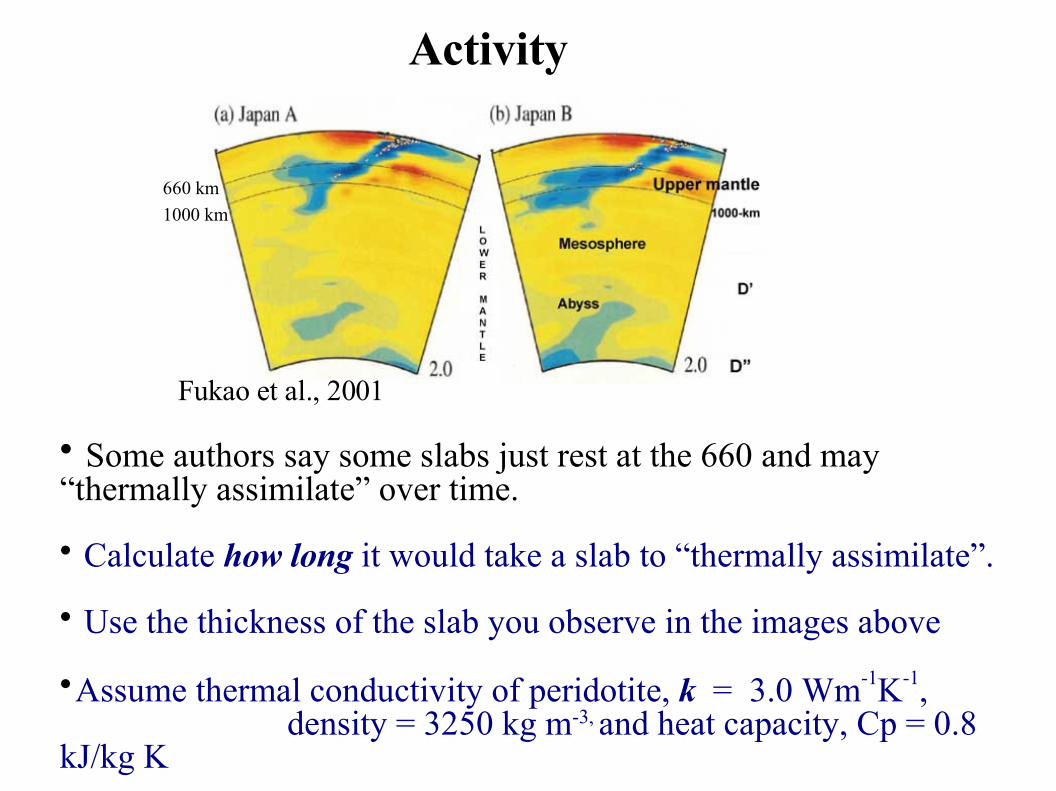
Some authors say some slabs just rest at the 660 and may “thermally assimilate” over time.
Calculate how long it would take a slab to “thermally assimilate”.
Use the thickness of the slab you observe in the images above
Assume thermal conductivity of peridotite, k = 3.0 Wm-1K-1,density = 3250 kg m-3, and heat capacity, Cp = 0.8
kJ/kg K
Fukao et al., 2001
660 km
1000 km

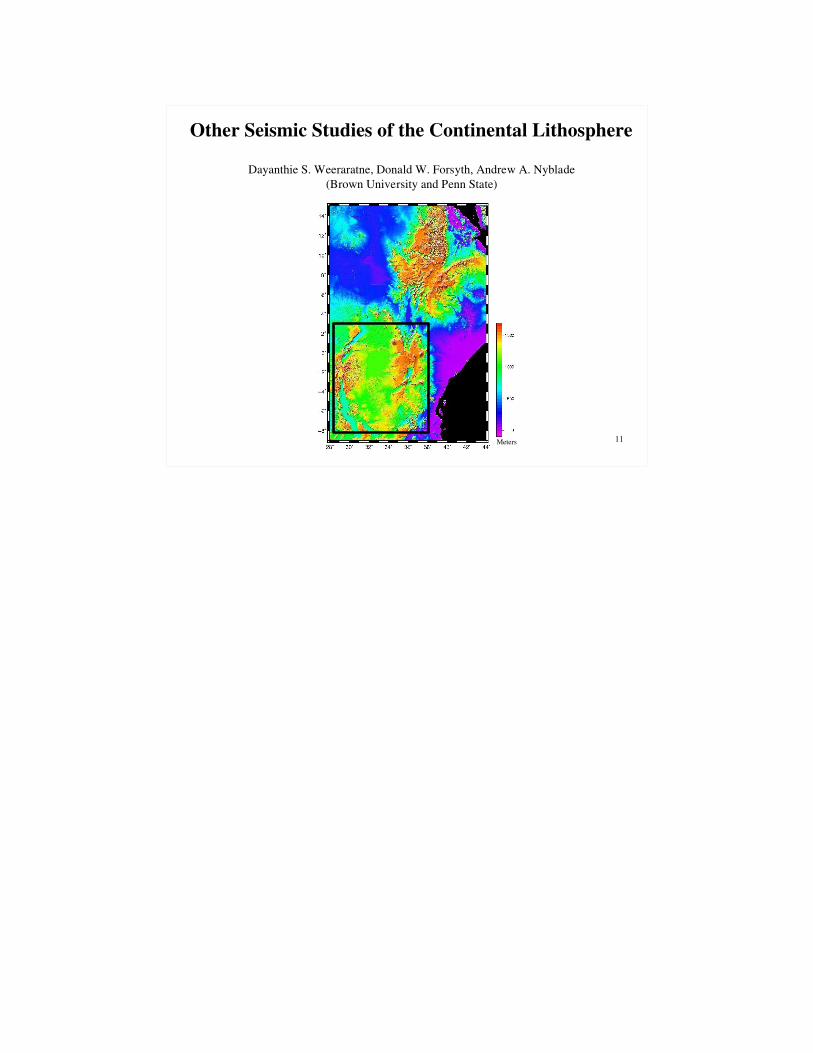
Other Seismic Studies of the Continental Lithosphere
Dayanthie S. Weeraratne, Donald W. Forsyth, Andrew A. Nyblade (Brown University and Penn State)
Meters
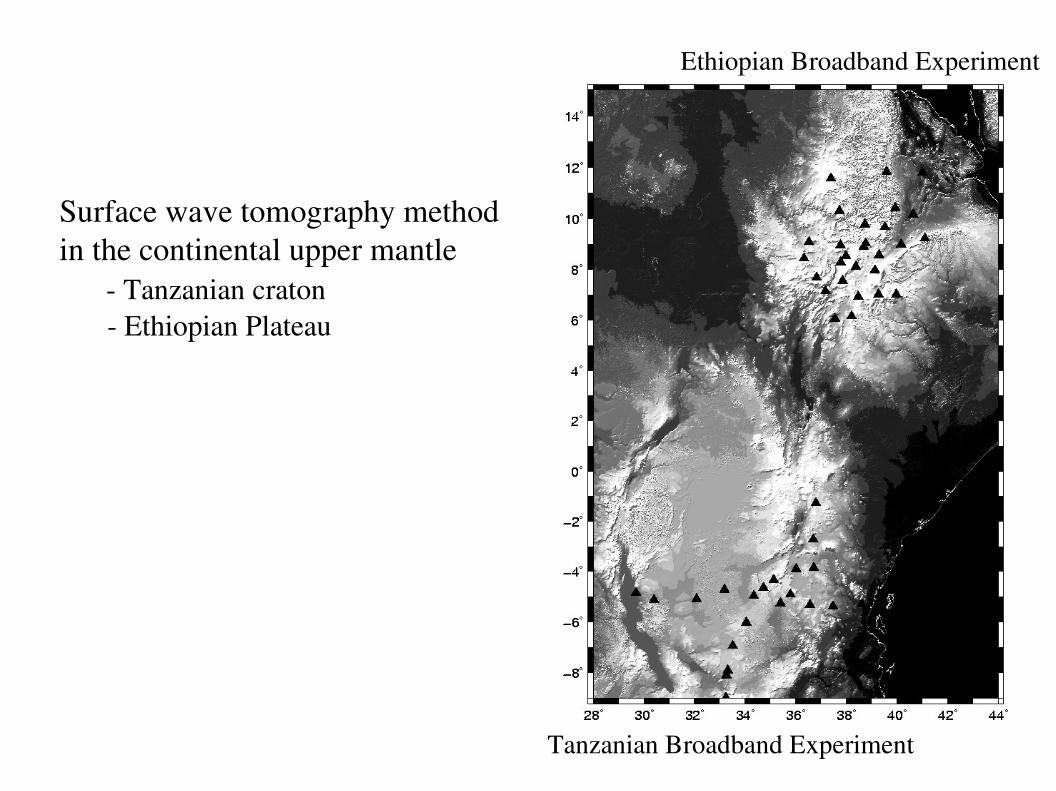
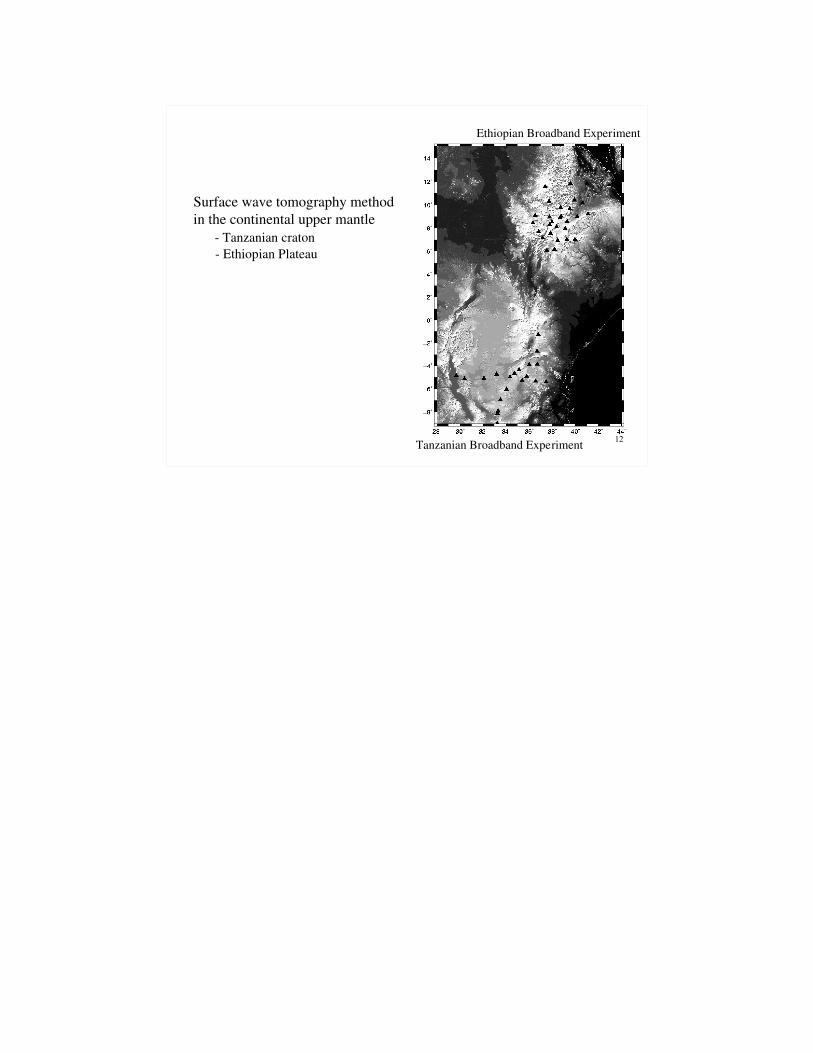
Surface wave tomography methodin the continental upper mantle Tanzanian craton
Ethiopian Plateau
Tanzanian Broadband Experiment
Ethiopian Broadband Experiment

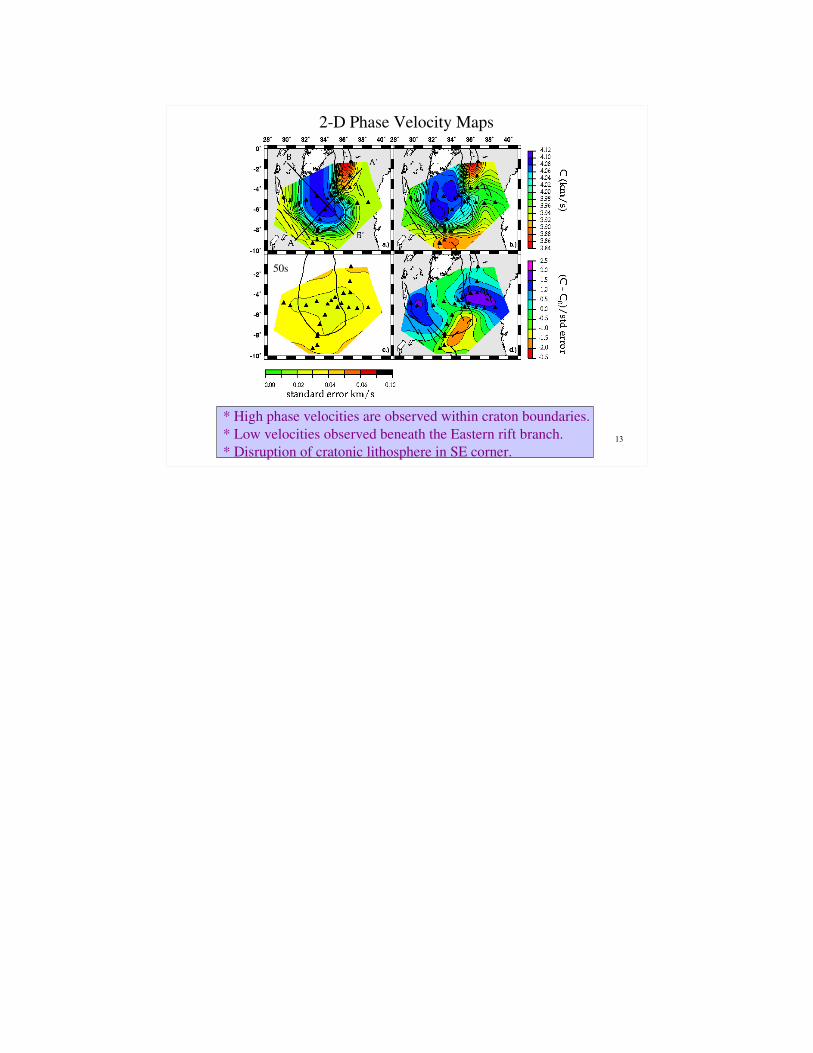
50s
2D Phase Velocity Maps
* High phase velocities are observed within craton boundaries.* Low velocities observed beneath the Eastern rift branch.* Disruption of cratonic lithosphere in SE corner.
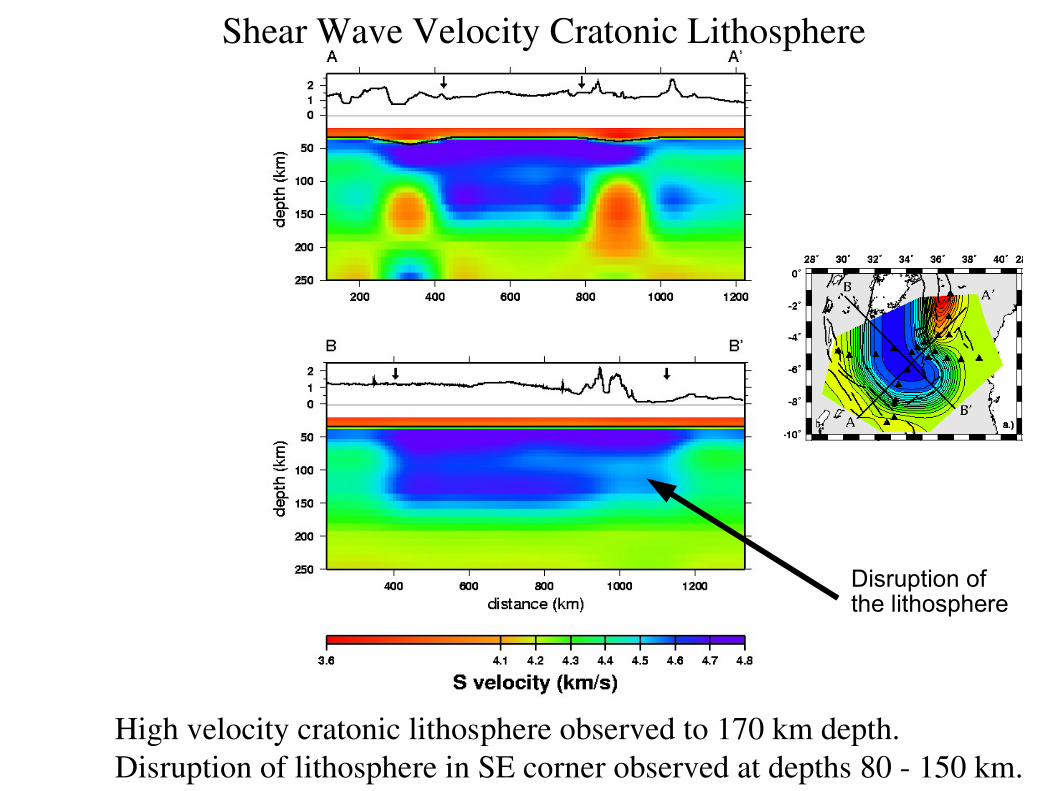
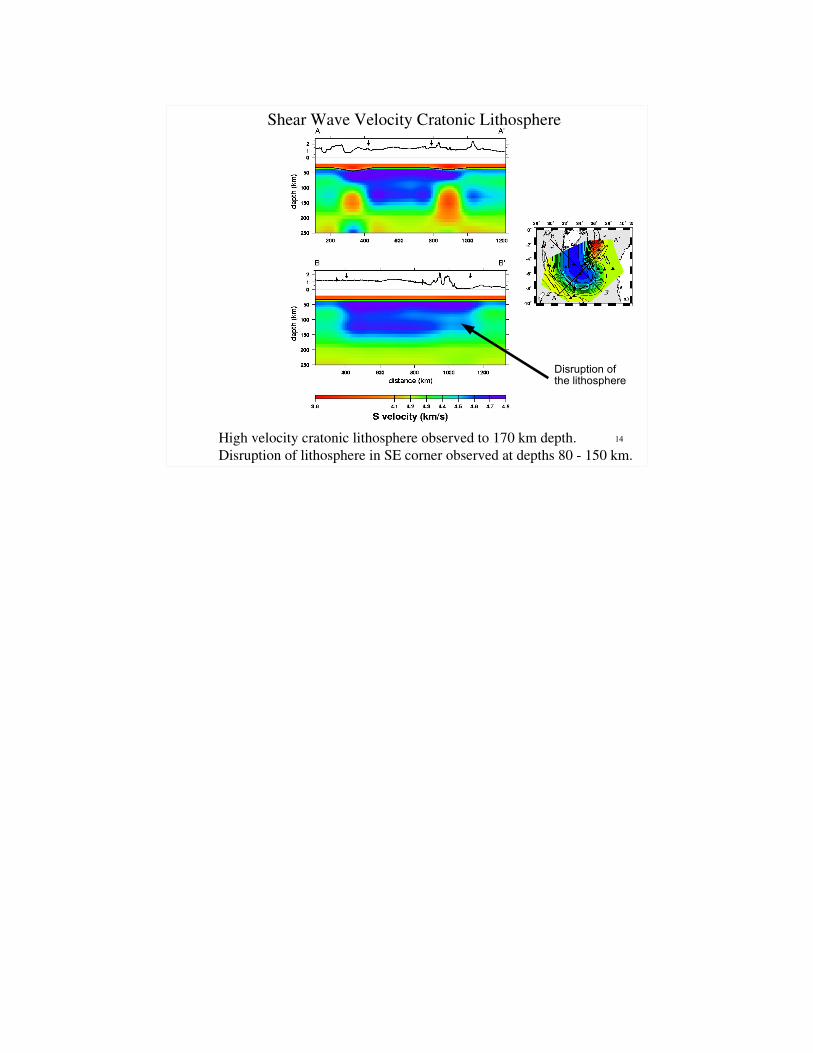
Shear Wave Velocity Cratonic Lithosphere
High velocity cratonic lithosphere observed to 170 km depth.Disruption of lithosphere in SE corner observed at depths 80 150 km.
Disruption of the lithosphere
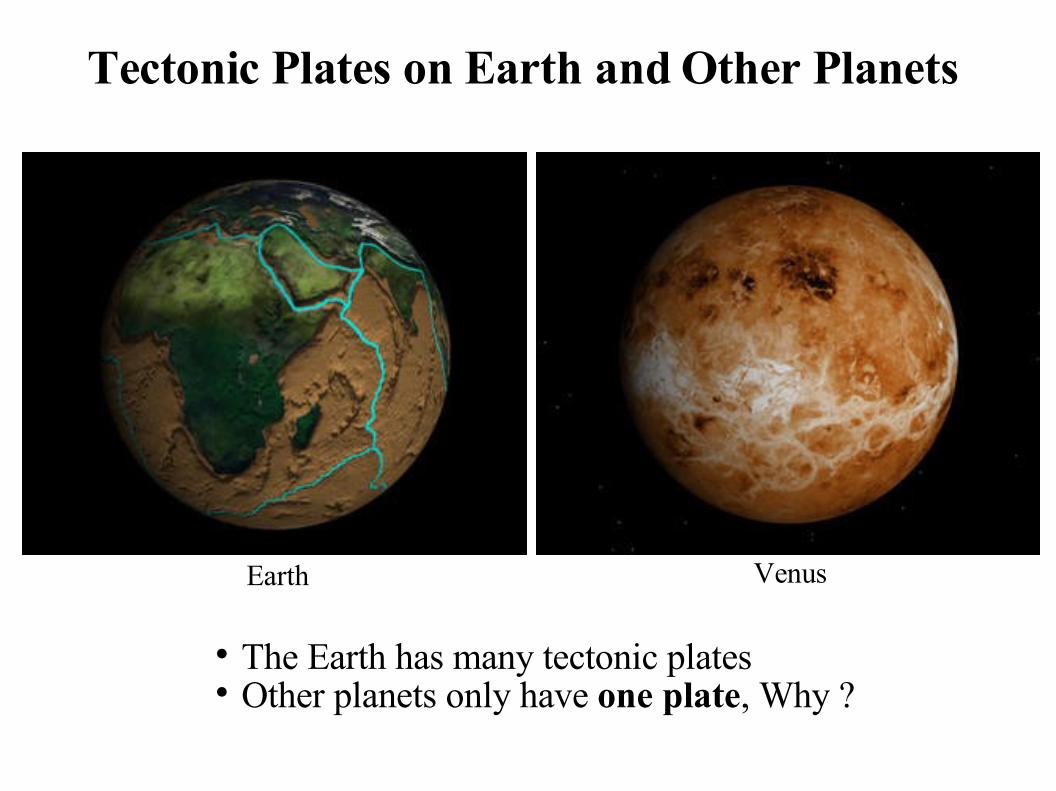
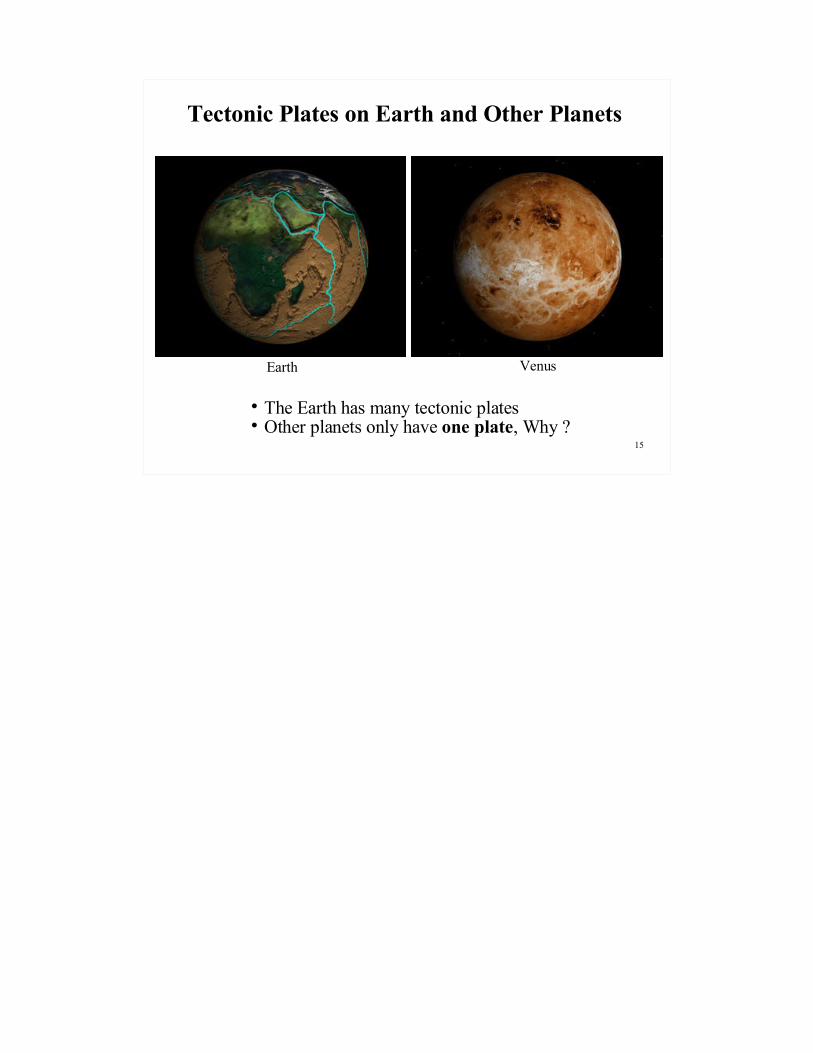
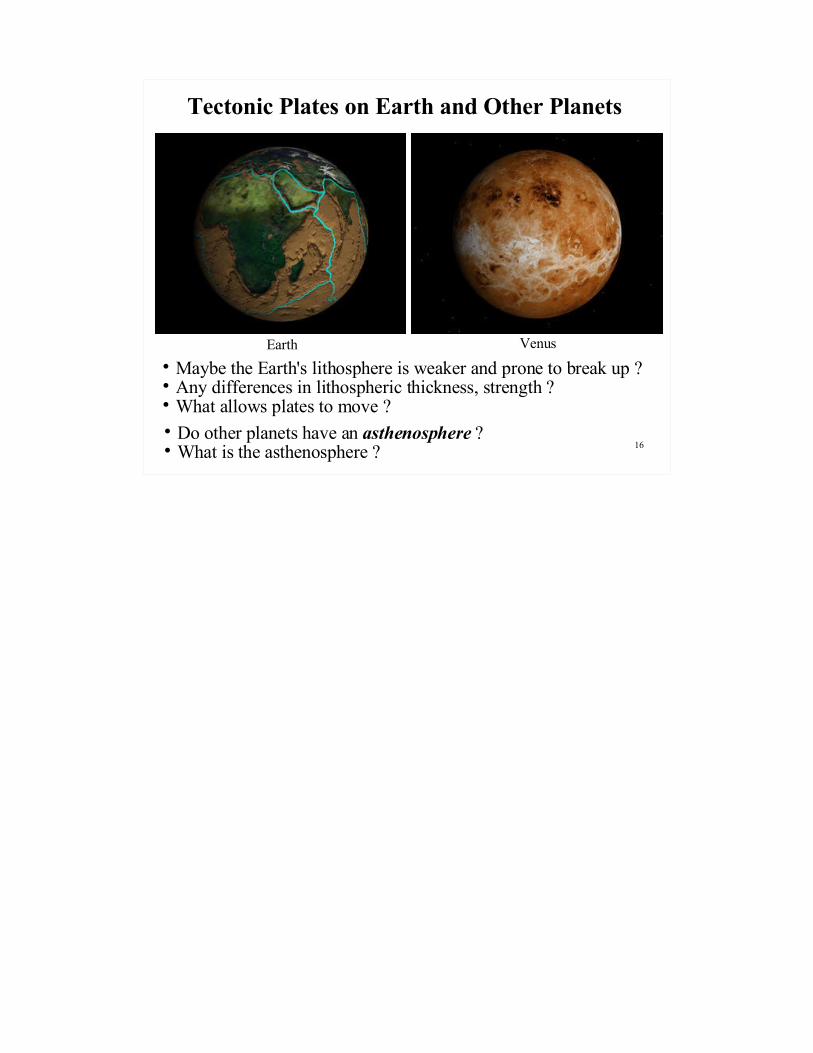
Tectonic Plates on Earth and Other Planets
VenusEarth
The Earth has many tectonic plates Other planets only have one plate, Why ?
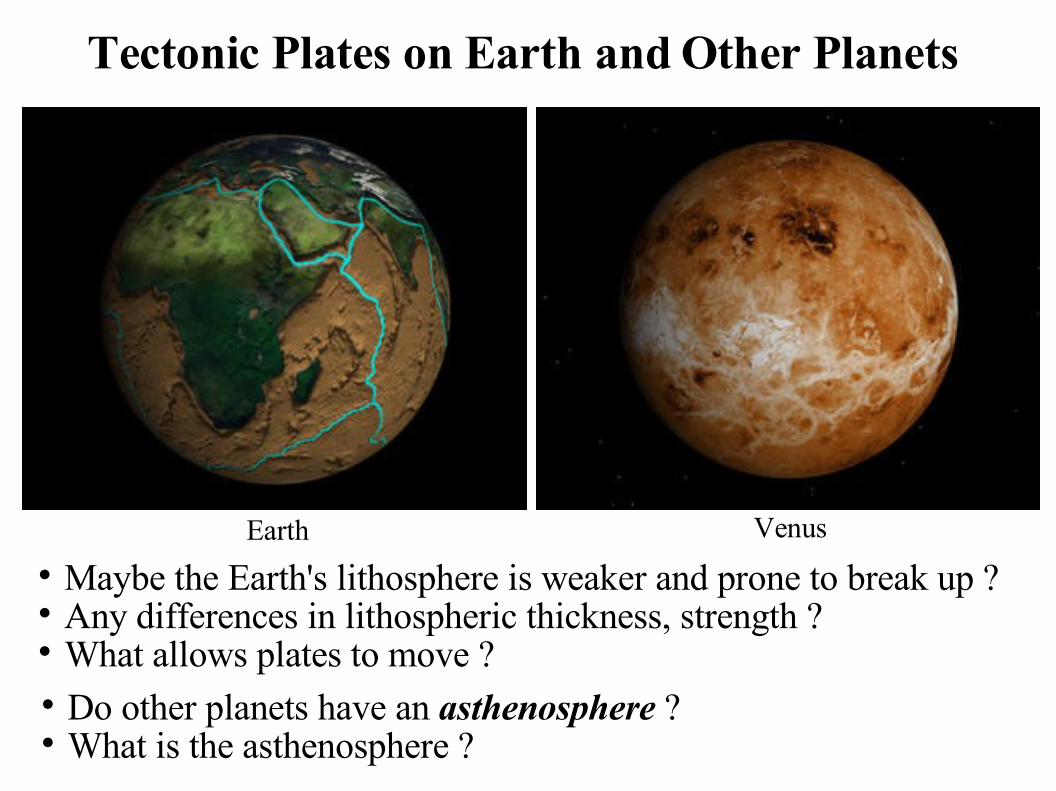
Tectonic Plates on Earth and Other Planets
VenusEarth
Maybe the Earth's lithosphere is weaker and prone to break up ? Any differences in lithospheric thickness, strength ? What allows plates to move ? Do other planets have an asthenosphere ? What is the asthenosphere ?

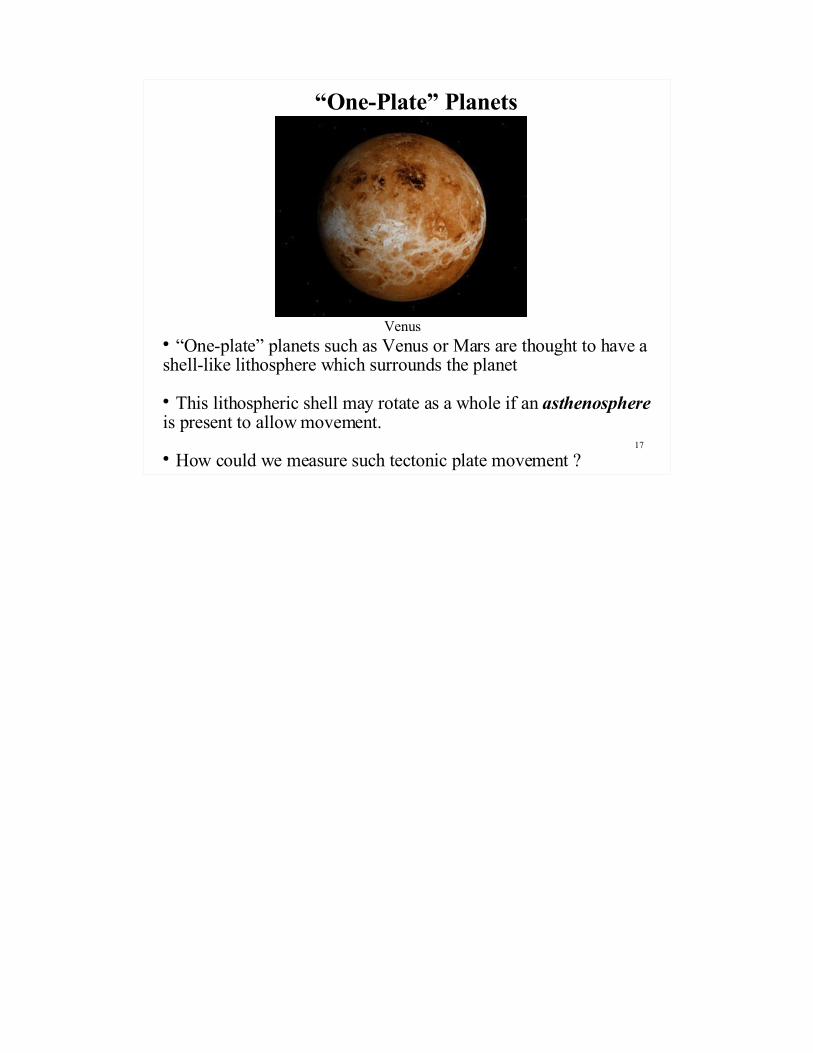
“One-Plate” Planets
Venus “One-plate” planets such as Venus or Mars are thought to have a shell-like lithosphere which surrounds the planet
This lithospheric shell may rotate as a whole if an asthenosphere is present to allow movement.
How could we measure such tectonic plate movement ?

We know very little about the physical properties of the asthenosphere.What makes the asthenosphere “ductile” ?
?LithosphereAsthenosphere
*Seismic low velocity zone (LVZ)*Competing effects of increasing temperature and pressure at depth*Compositional variations in water content or presence of partial melt
Study of the Oceanic Asthenosphere
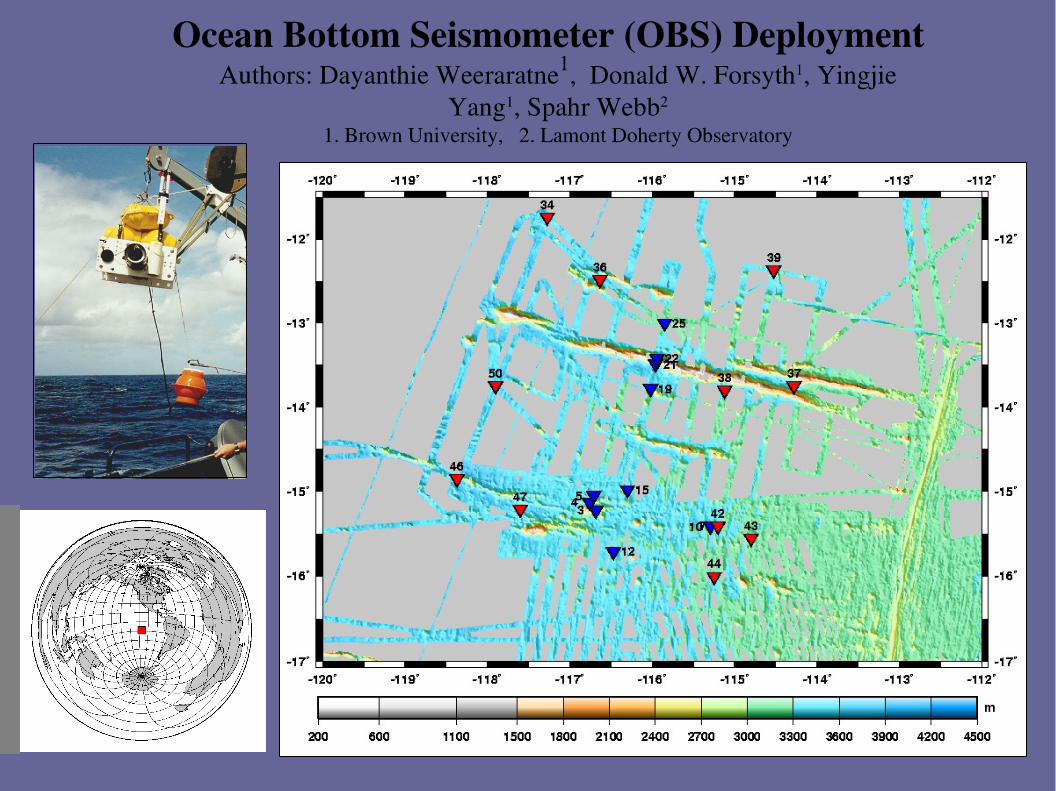
Ocean Bottom Seismometer (OBS) DeploymentAuthors: Dayanthie Weeraratne1, Donald W. Forsyth1, Yingjie
Yang1, Spahr Webb2
1. Brown University, 2. Lamont Doherty Observatory
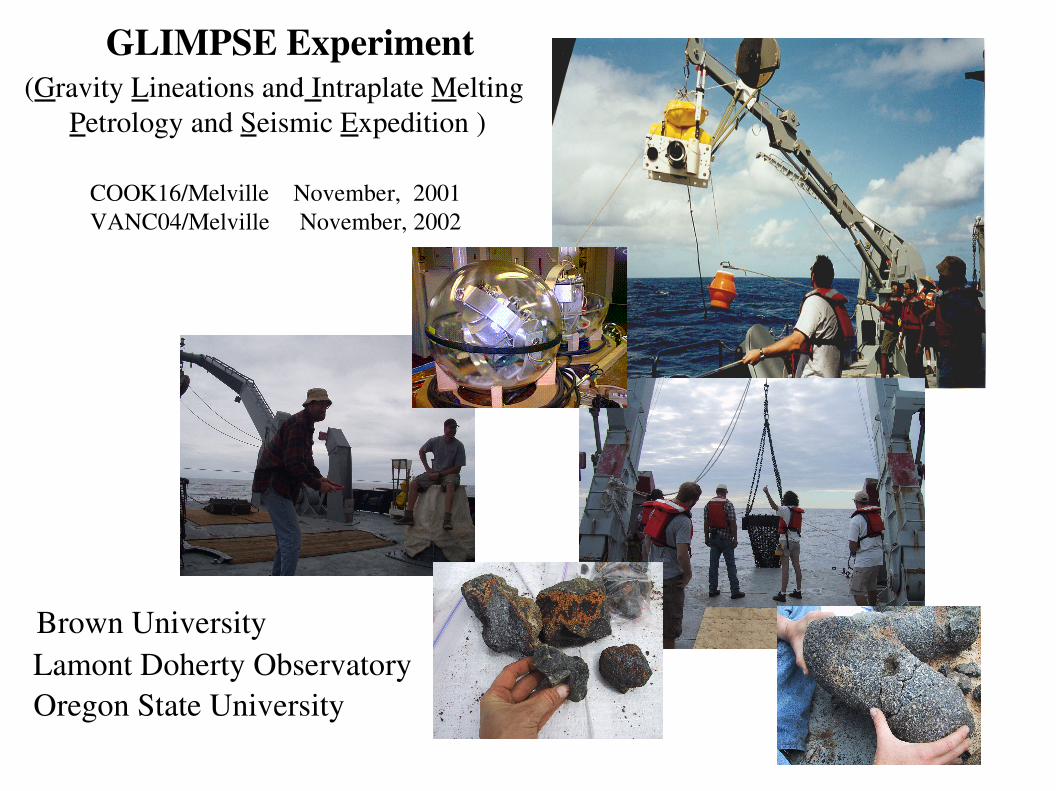
COOK16/Melville November, 2001VANC04/Melville November, 2002
GLIMPSE Experiment
Brown UniversityLamont Doherty ObservatoryOregon State University
(Gravity Lineations and Intraplate Melting Petrology and Seismic Expedition )
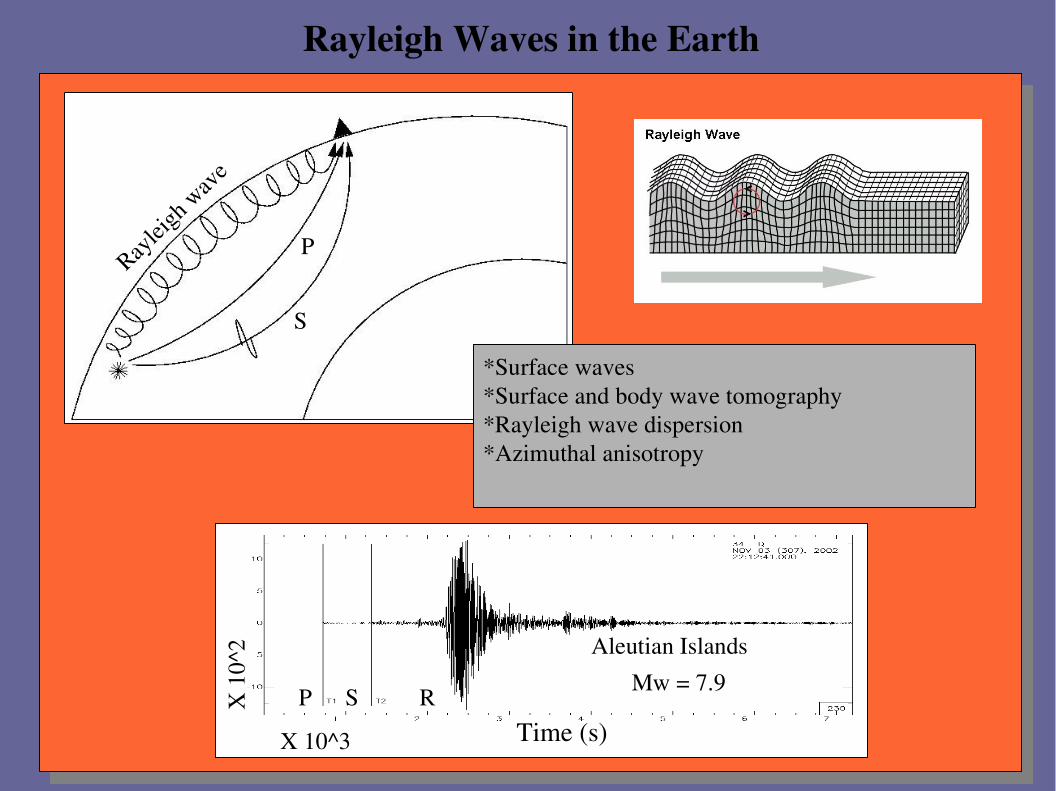
Rayleigh Waves in the Earth
S
PRayl
eigh w
ave
RSP
X 10^3
X 1
0^2
Time (s)
Mw = 7.9Aleutian Islands
*Surface waves *Surface and body wave tomography*Rayleigh wave dispersion*Azimuthal anisotropy
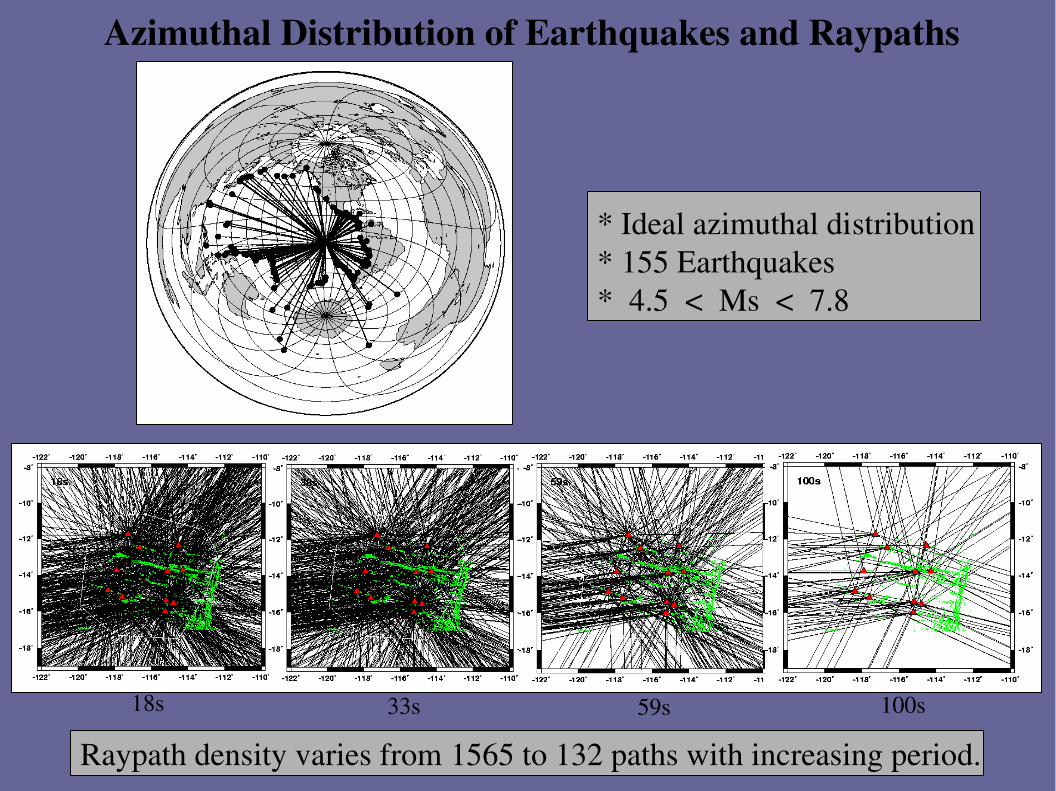
Azimuthal Distribution of Earthquakes and Raypaths
* Ideal azimuthal distribution* 155 Earthquakes * 4.5 < Ms < 7.8
Raypath density varies from 1565 to 132 paths with increasing period.18s 33s 59s 100s
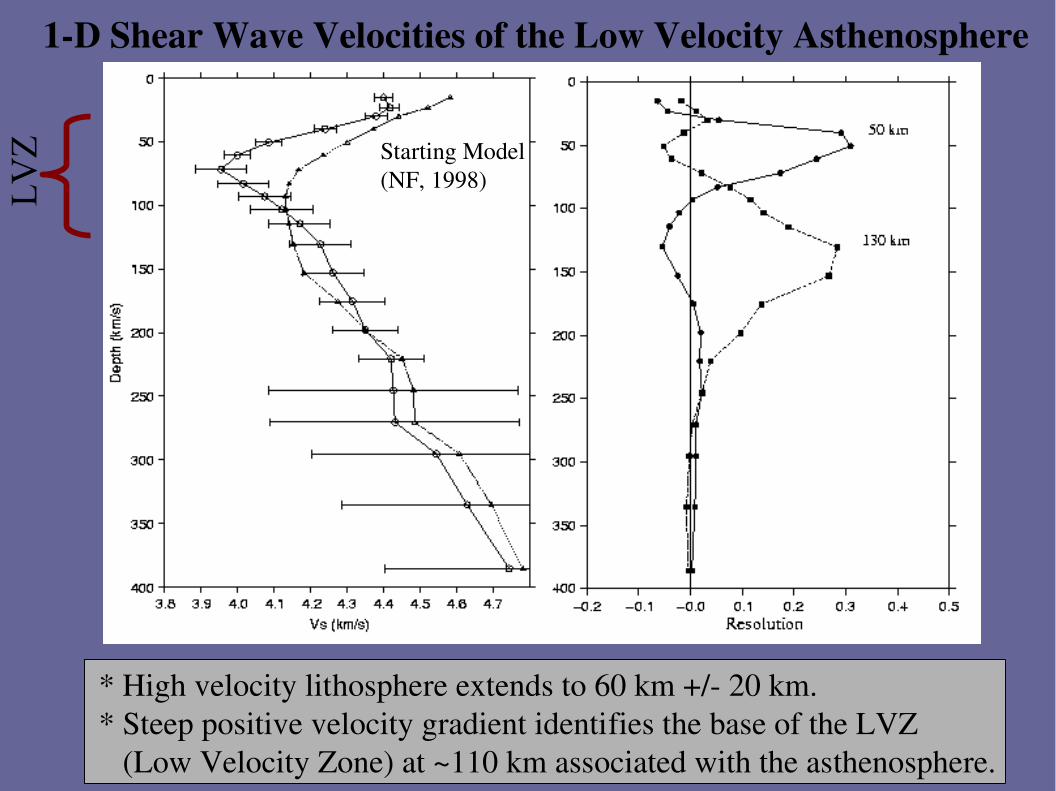
1D Shear Wave Velocities of the Low Velocity Asthenosphere
* High velocity lithosphere extends to 60 km +/ 20 km.* Steep positive velocity gradient identifies the base of the LVZ (Low Velocity Zone) at ~110 km associated with the asthenosphere.
Starting Model(NF, 1998)L
VZ
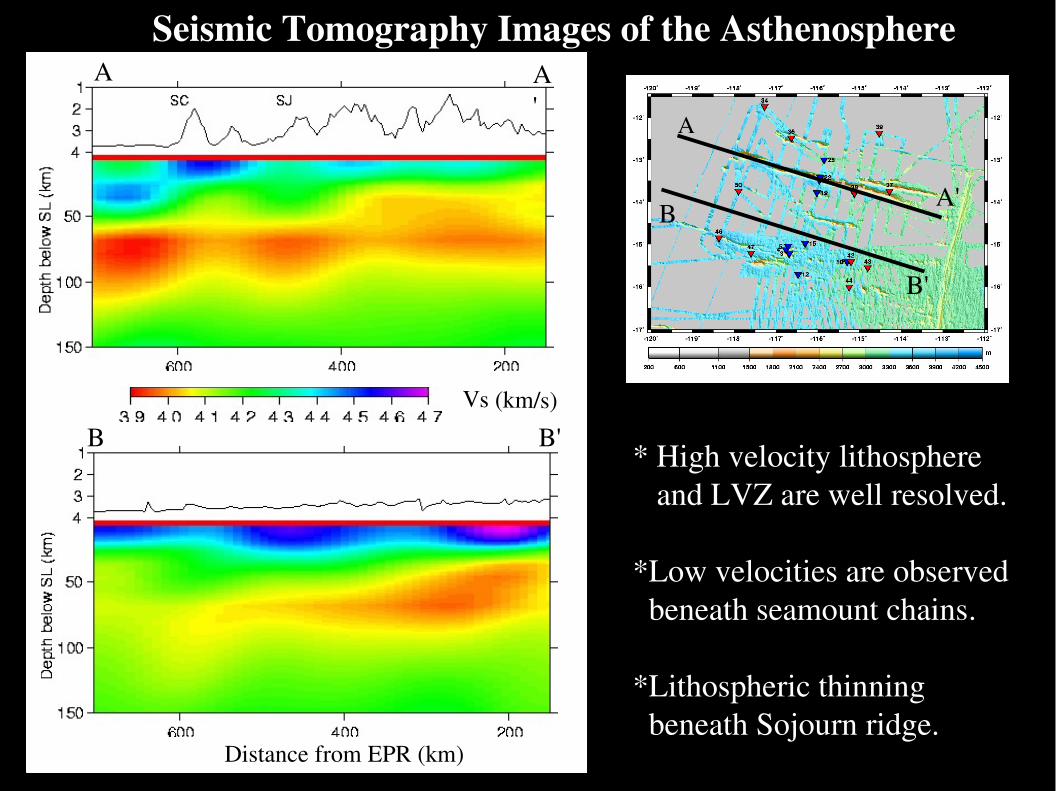
Seismic Tomography Images of the Asthenosphere
* High velocity lithosphere and LVZ are well resolved.
*Low velocities are observed beneath seamount chains.
*Lithospheric thinning beneath Sojourn ridge.
A
A'B
B'
A A'
Distance from EPR (km)
B B'Vs (km/s)

What can Seismic Attenuation tell us?
Seismic attenuation is found to be strongly affected by temperature and volatile content (e.g. Wiens and Smith, 2003).
Small amounts of partial melt, however, have a lesser effect as relaxation occurs at periods outside the seismic frequency band (e.g. Hammond and Humphreys, 2000a).
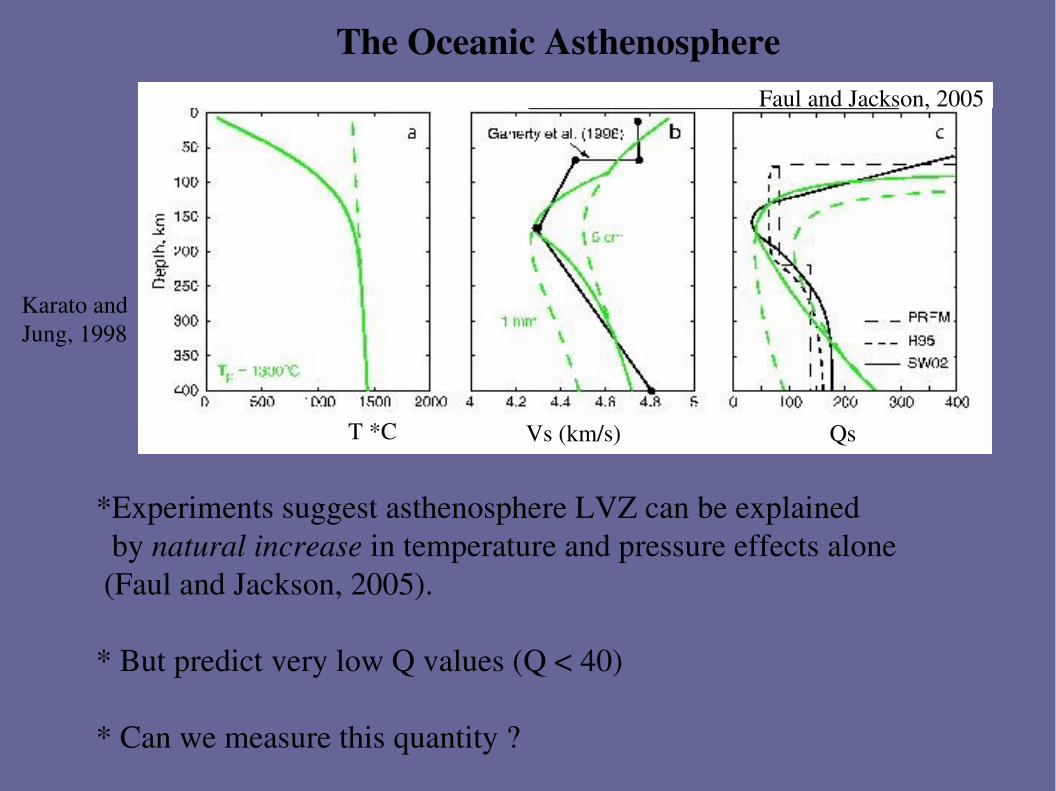
*Experiments suggest asthenosphere LVZ can be explained by natural increase in temperature and pressure effects alone (Faul and Jackson, 2005).
* But predict very low Q values (Q < 40)
* Can we measure this quantity ?
QsVs (km/s)T *C
Faul and Jackson, 2005
Karato and Jung, 1998
The Oceanic Asthenosphere
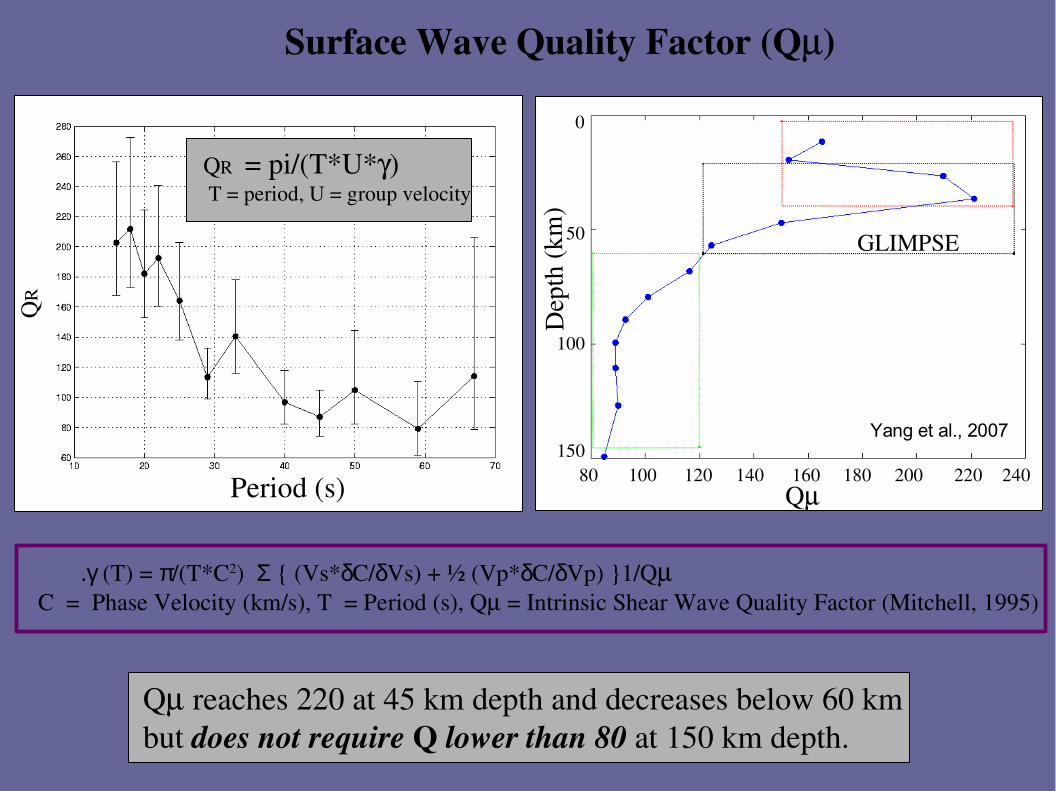
Q reaches 220 at 45 km depth and decreases below 60 km but does not require Q lower than 80 at 150 km depth.
Surface Wave Quality Factor (Q)
Period (s)
QR
QR = pi/(T*U*) T = period, U = group velocity
.γ (T) = π/(T*C2) Σ { (Vs*δC/δVs) + ½ (Vp*δC/δVp) }1/Q C = Phase Velocity (km/s), T = Period (s), Q = Intrinsic Shear Wave Quality Factor (Mitchell, 1995)
Q
Dep
th (k
m)
80 100 120 140 160 180 200 220 240
0
50
100
150
GLIMPSE
Yang et al., 2007
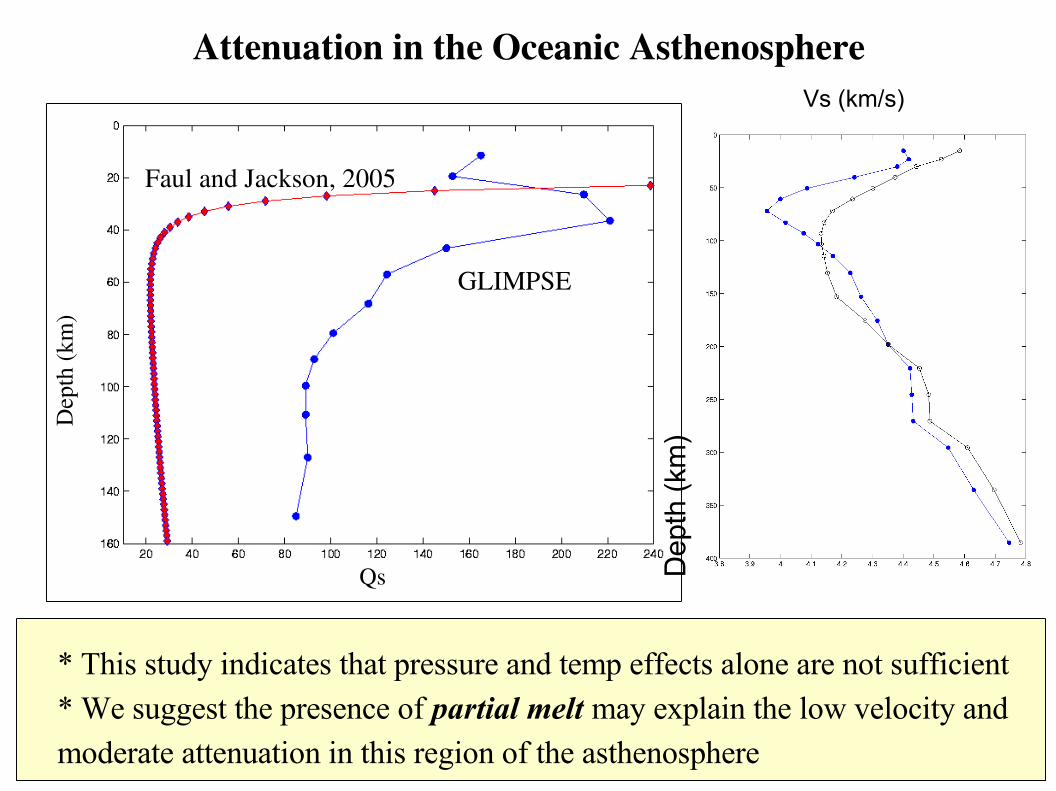
Attenuation in the Oceanic Asthenosphere
Qs
Dep
th (k
m)
GLIMPSE
Faul and Jackson, 2005
Vs (km/s)
Dep
th (
km)
* This study indicates that pressure and temp effects alone are not sufficient
* We suggest the presence of partial melt may explain the low velocity and
moderate attenuation in this region of the asthenosphere

Tectonic Plates: What are They Made of and What Drives Them ?
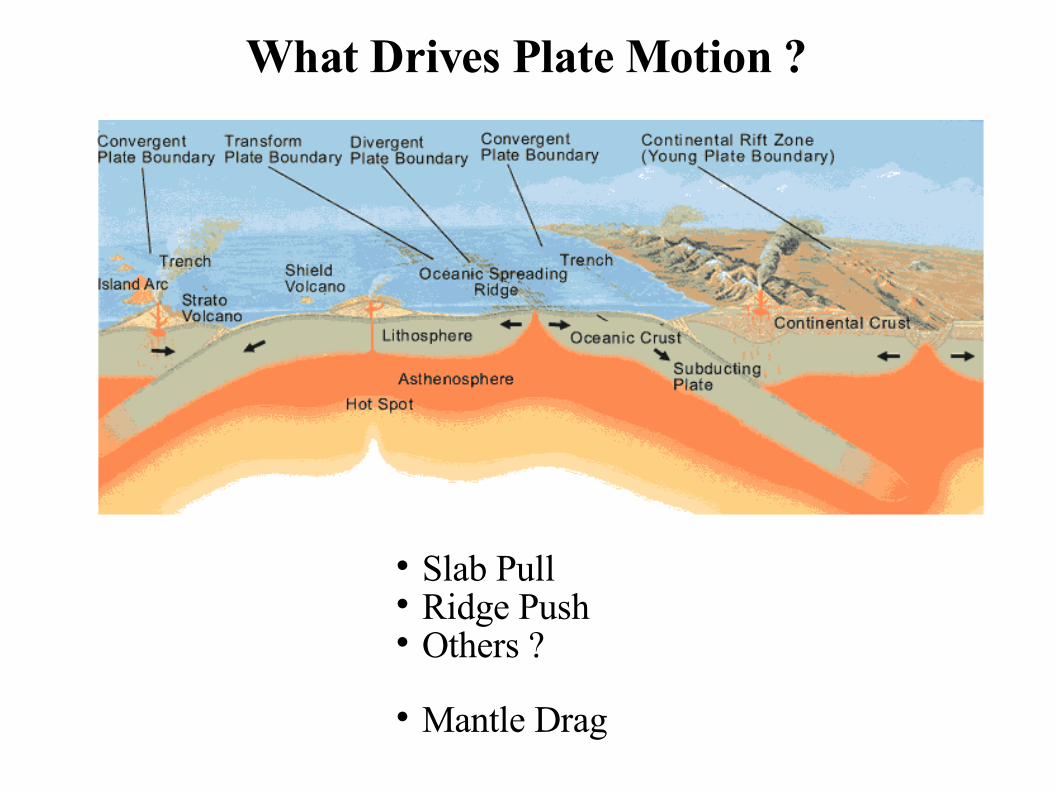
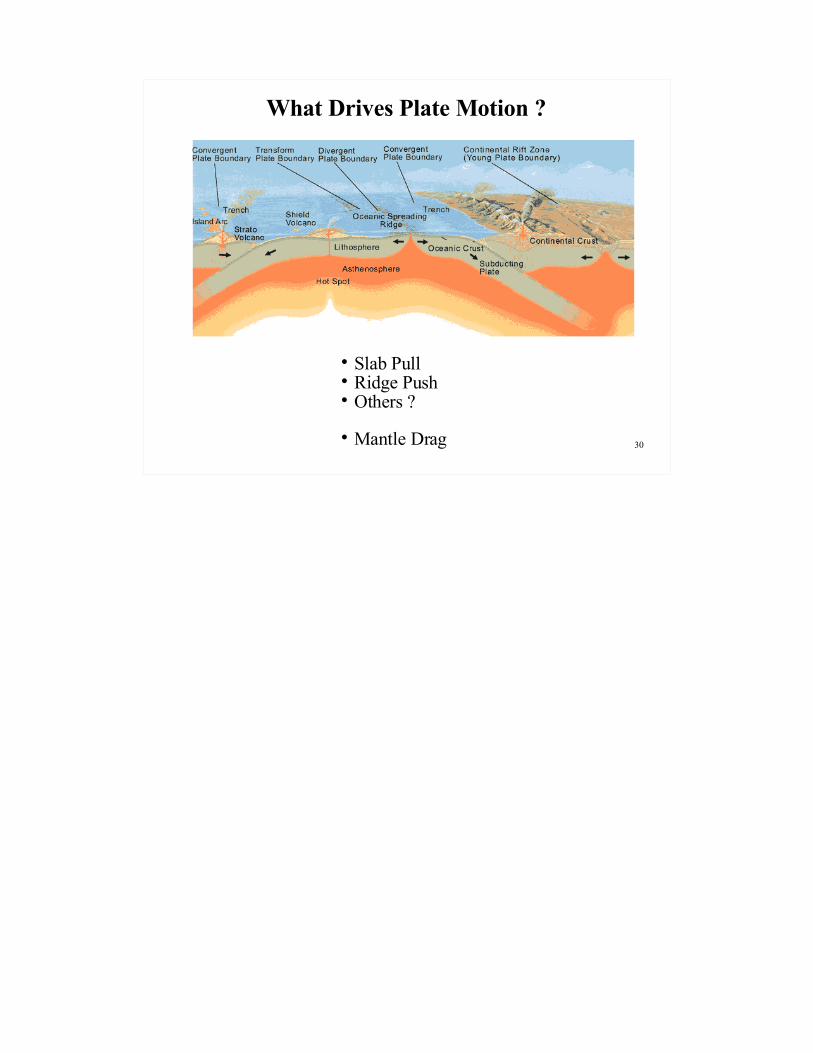
What Drives Plate Motion ?
Slab Pull Ridge Push Others ?
Mantle Drag
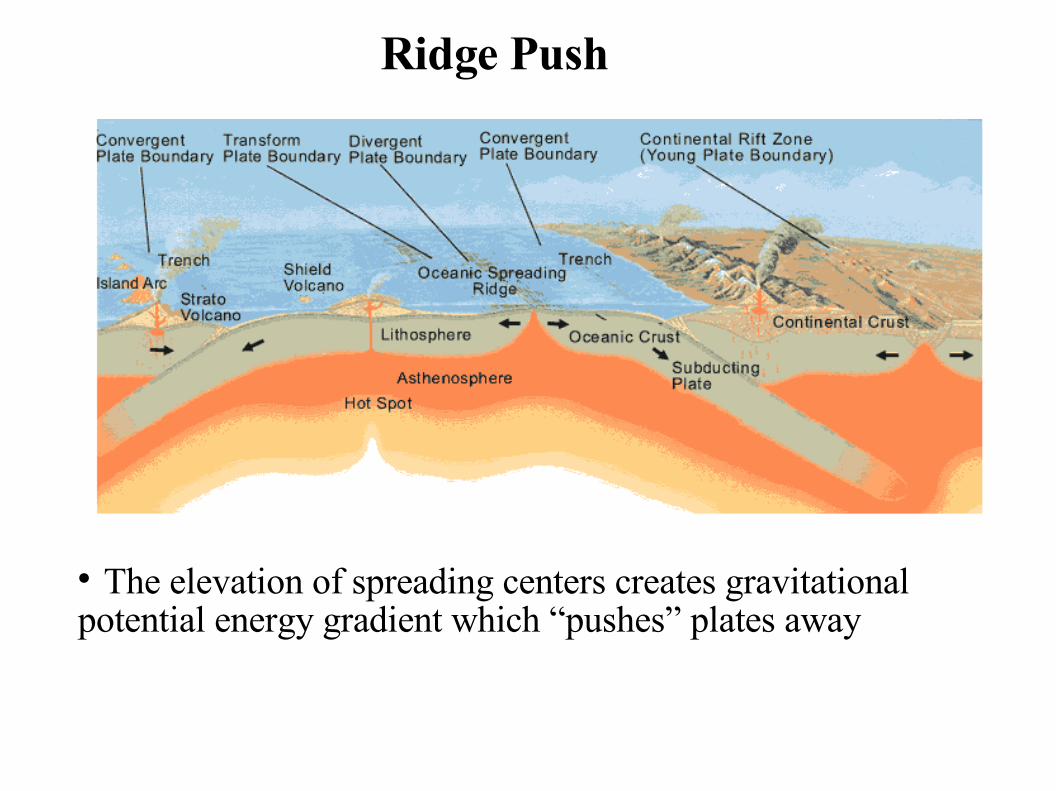
Ridge Push
The elevation of spreading centers creates gravitational potential energy gradient which “pushes” plates away
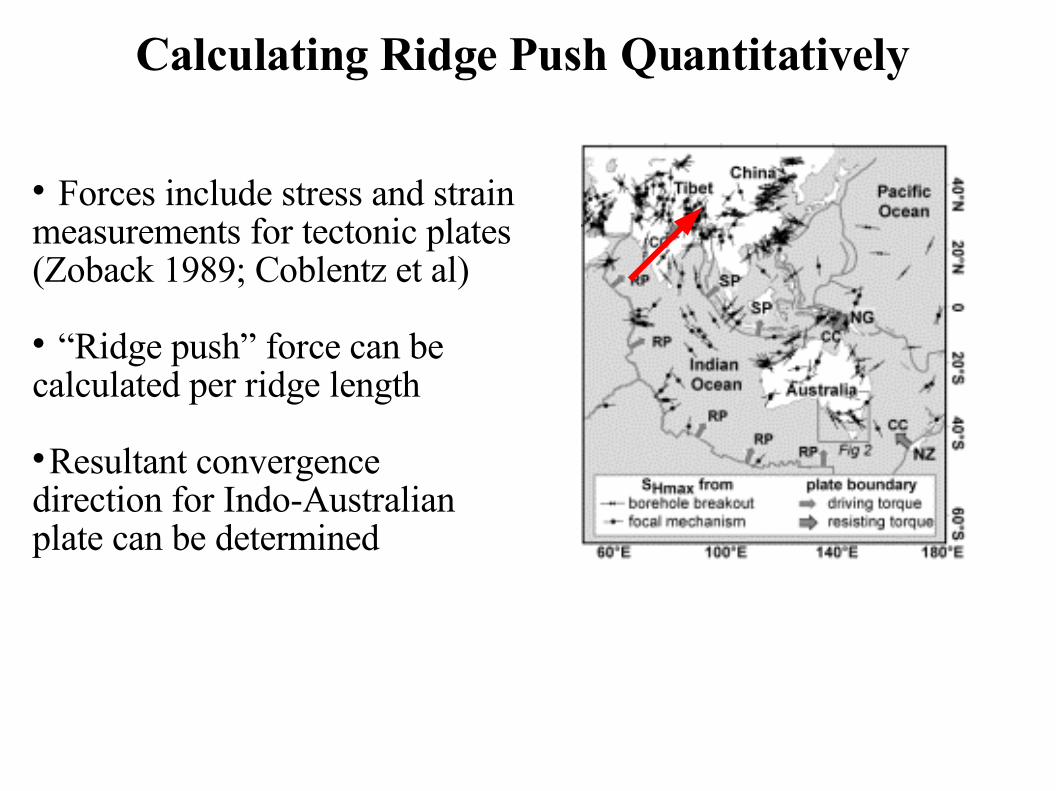
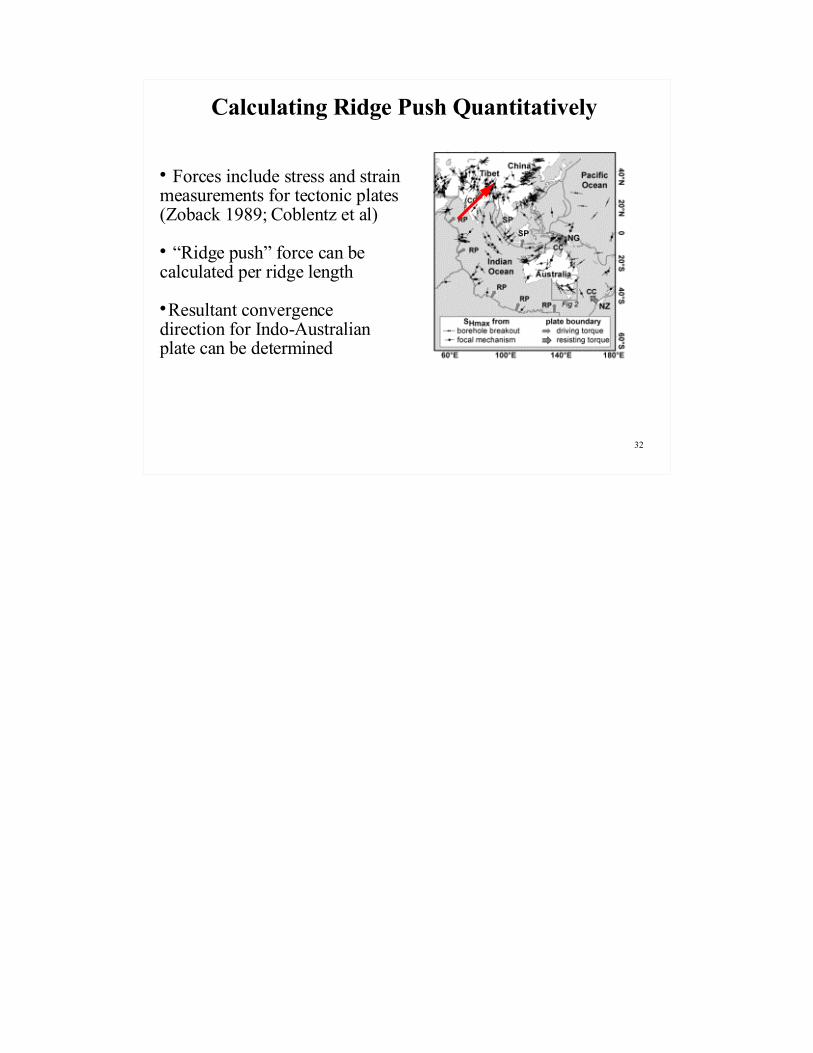
Calculating Ridge Push Quantitatively
Forces include stress and strain measurements for tectonic plates (Zoback 1989; Coblentz et al)
“Ridge push” force can be calculated per ridge length
Resultant convergence direction for Indo-Australian plate can be determined
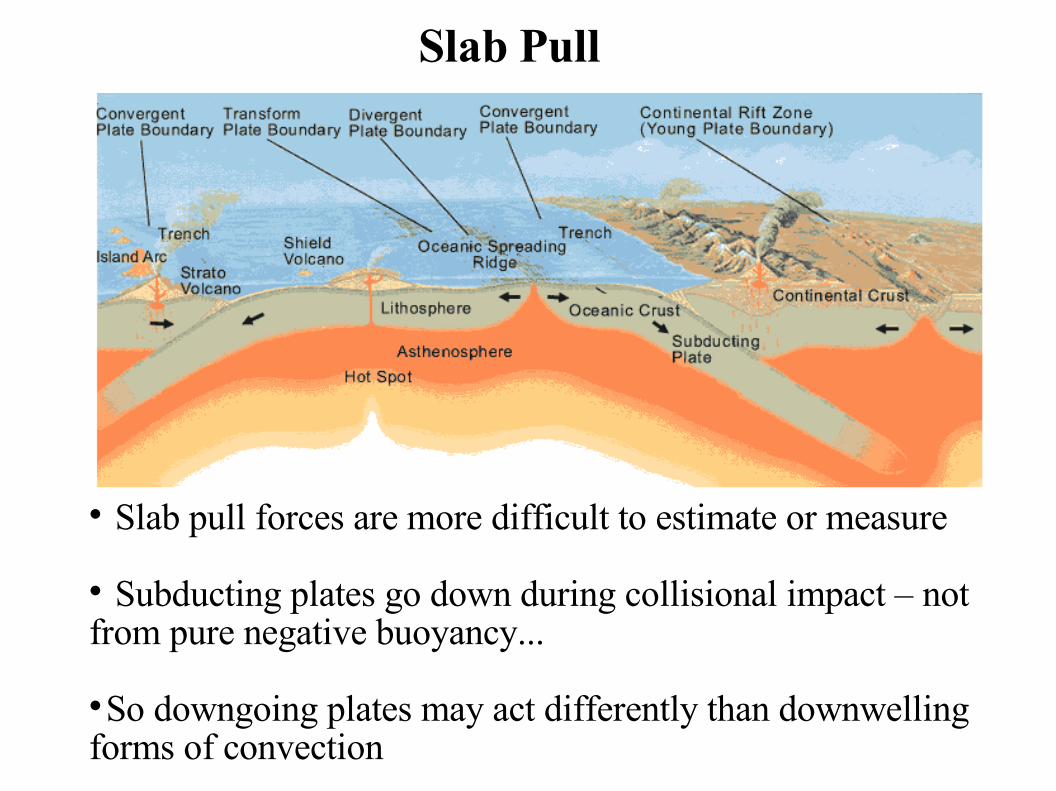
Slab Pull
Slab pull forces are more difficult to estimate or measure
Subducting plates go down during collisional impact – not from pure negative buoyancy...
So downgoing plates may act differently than downwelling forms of convection
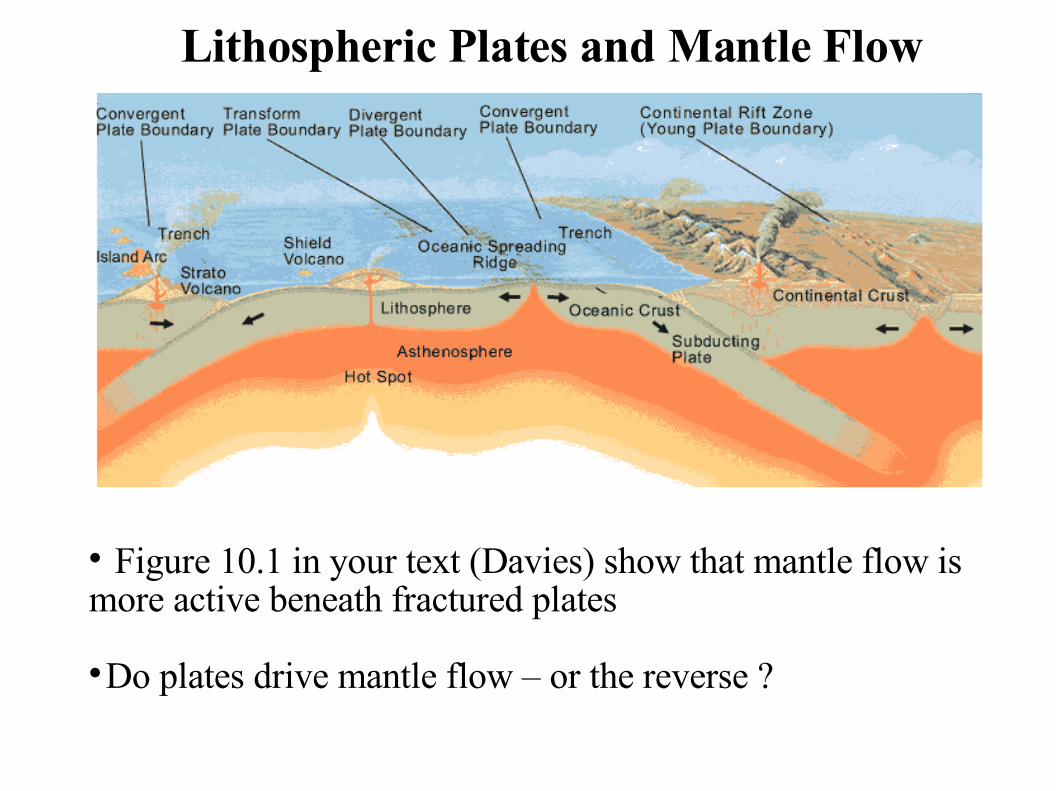
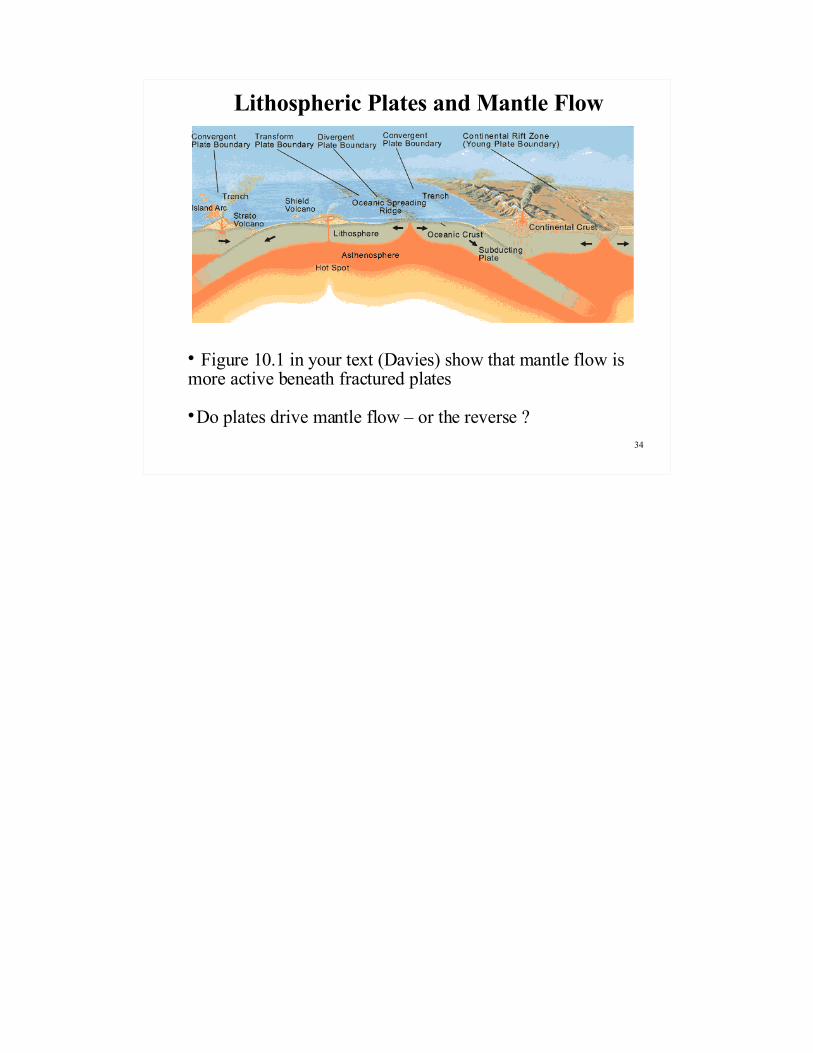
Lithospheric Plates and Mantle Flow
Figure 10.1 in your text (Davies) show that mantle flow is more active beneath fractured plates
Do plates drive mantle flow – or the reverse ?
Introduction to Fourier Transforms
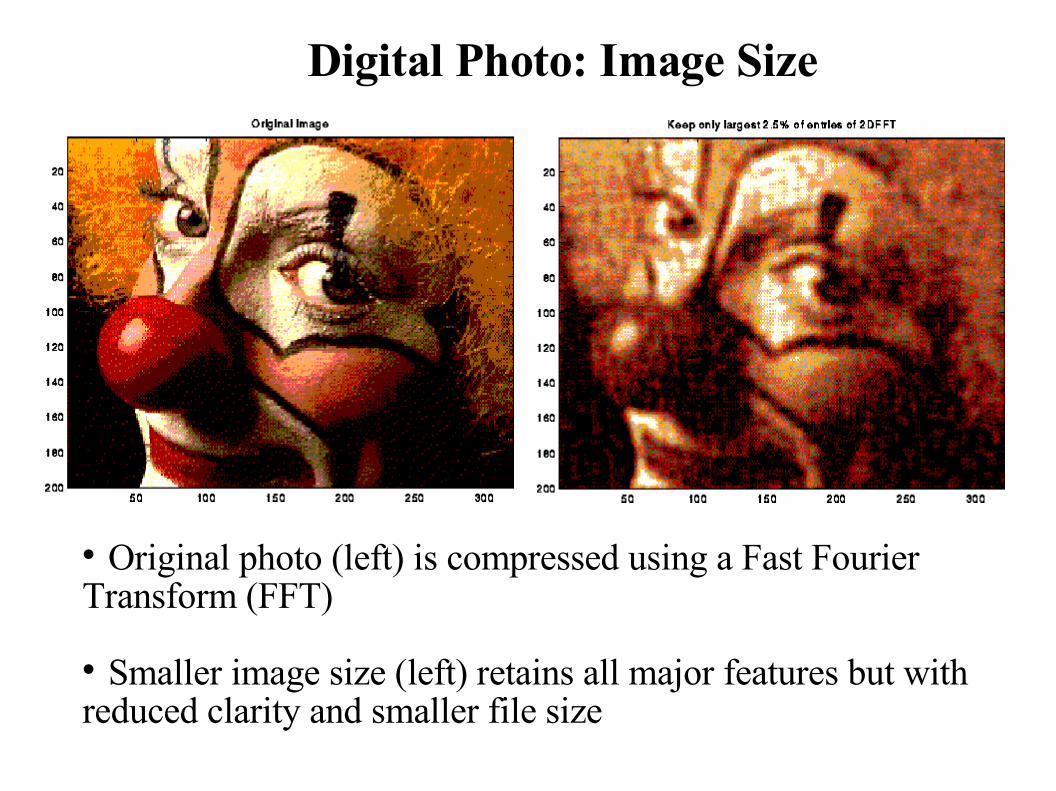
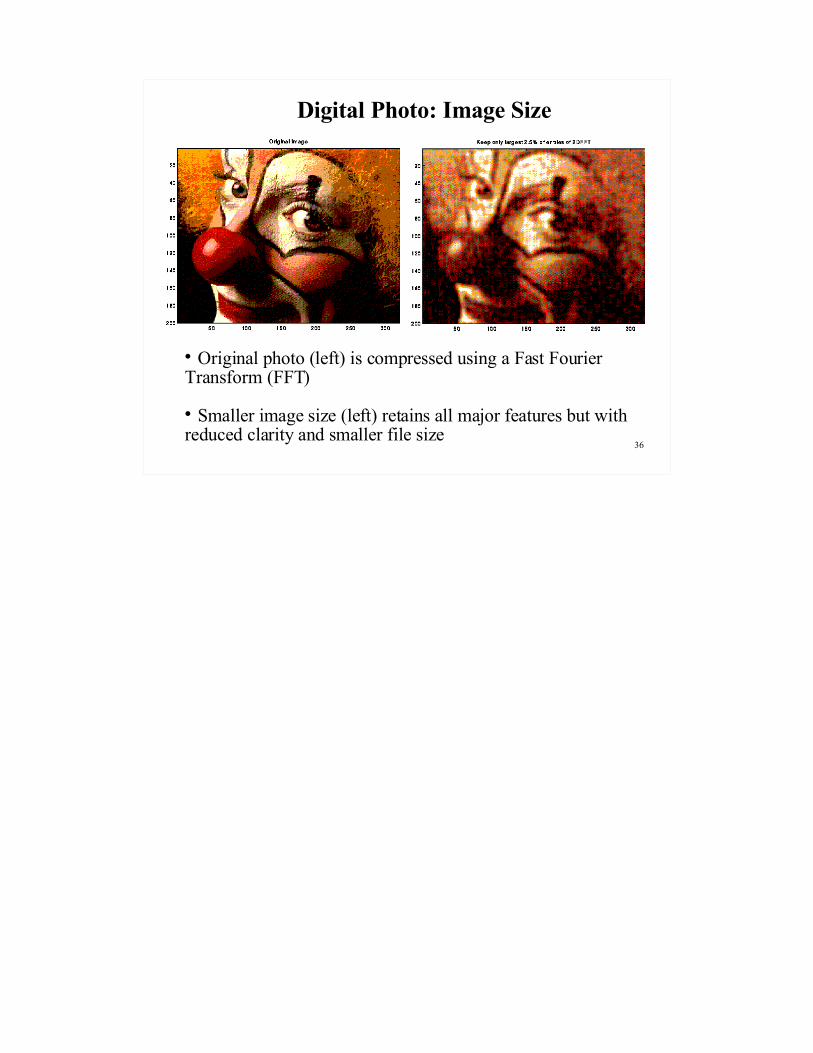
Digital Photo: Image Size
Original photo (left) is compressed using a Fast Fourier Transform (FFT)
Smaller image size (left) retains all major features but with reduced clarity and smaller file size
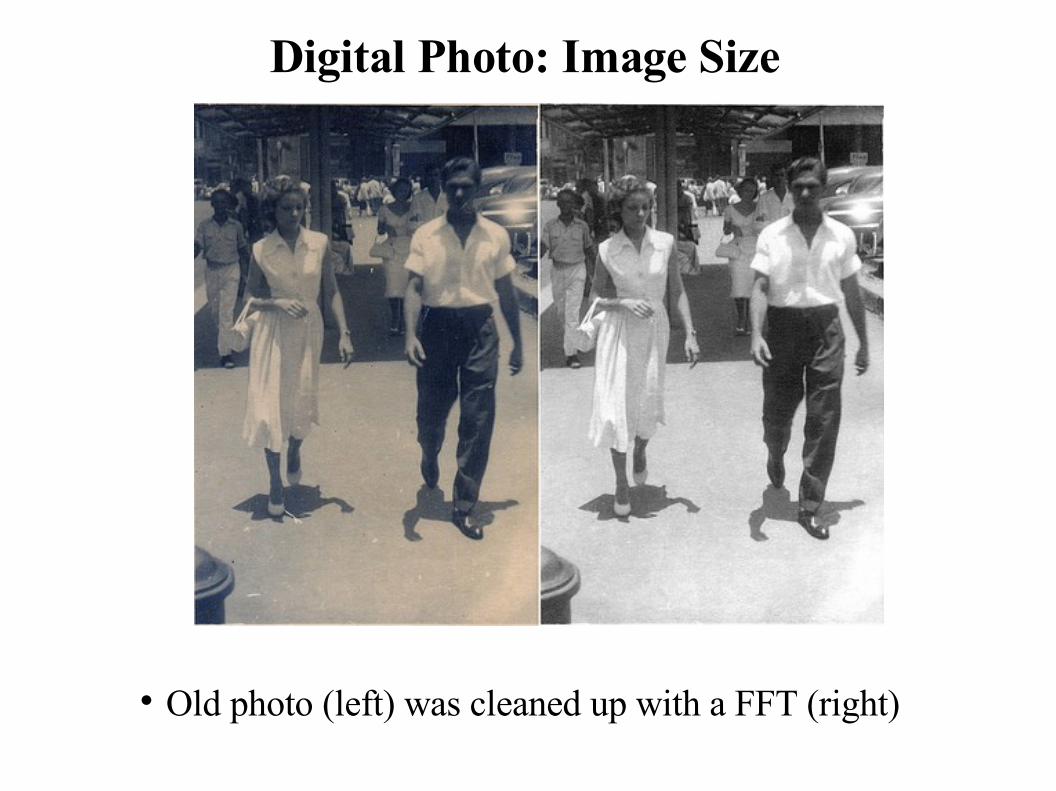
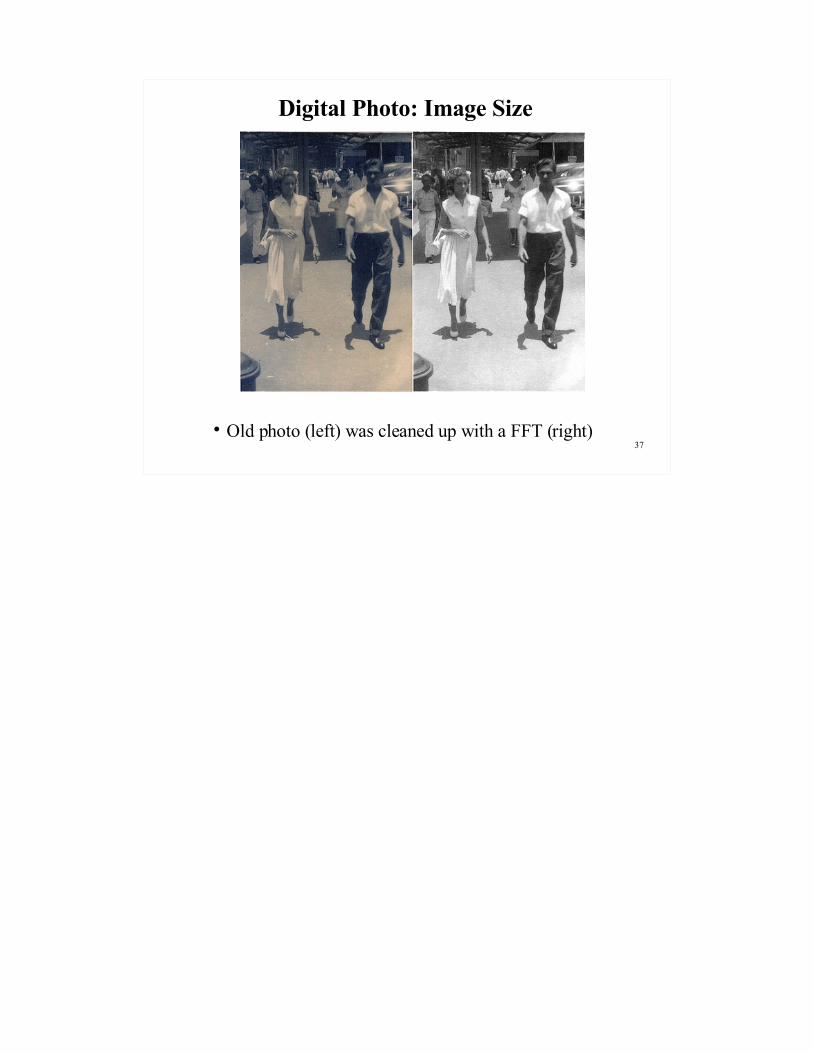
Digital Photo: Image Size
Old photo (left) was cleaned up with a FFT (right)

Introduction to Fourier Transforms
Fourier Transforms can be used- Recover signal from a noisy record- Electrical Filters- Clean a television picture- reduce image size of digital photos
Fourier Transforms can be done analytically (on paper) or computationally (on a computer)
Fourier Transforms
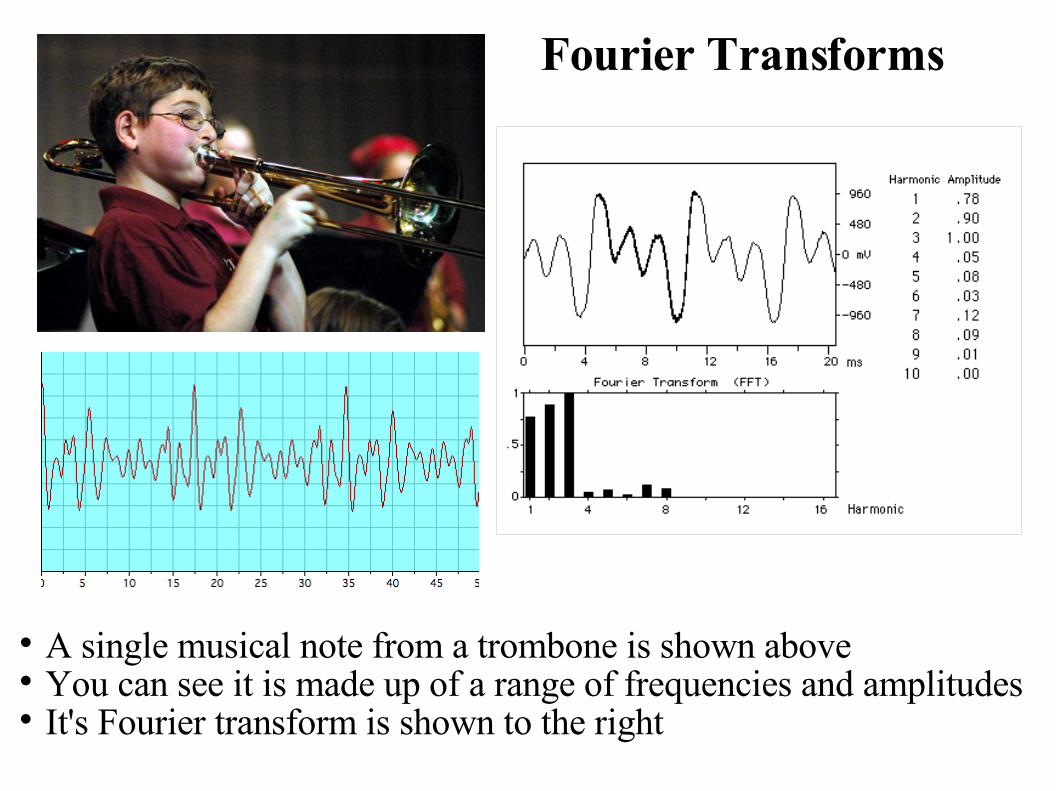
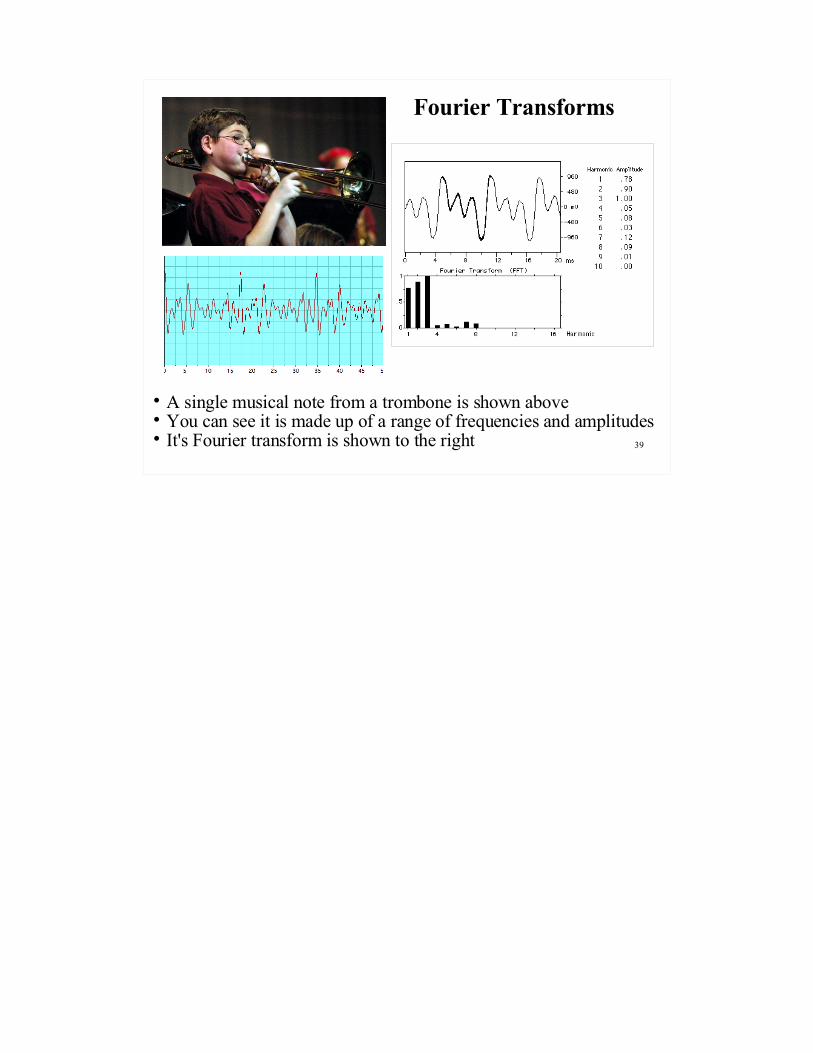
A single musical note from a trombone is shown above You can see it is made up of a range of frequencies and amplitudes It's Fourier transform is shown to the right
Fourier Transforms
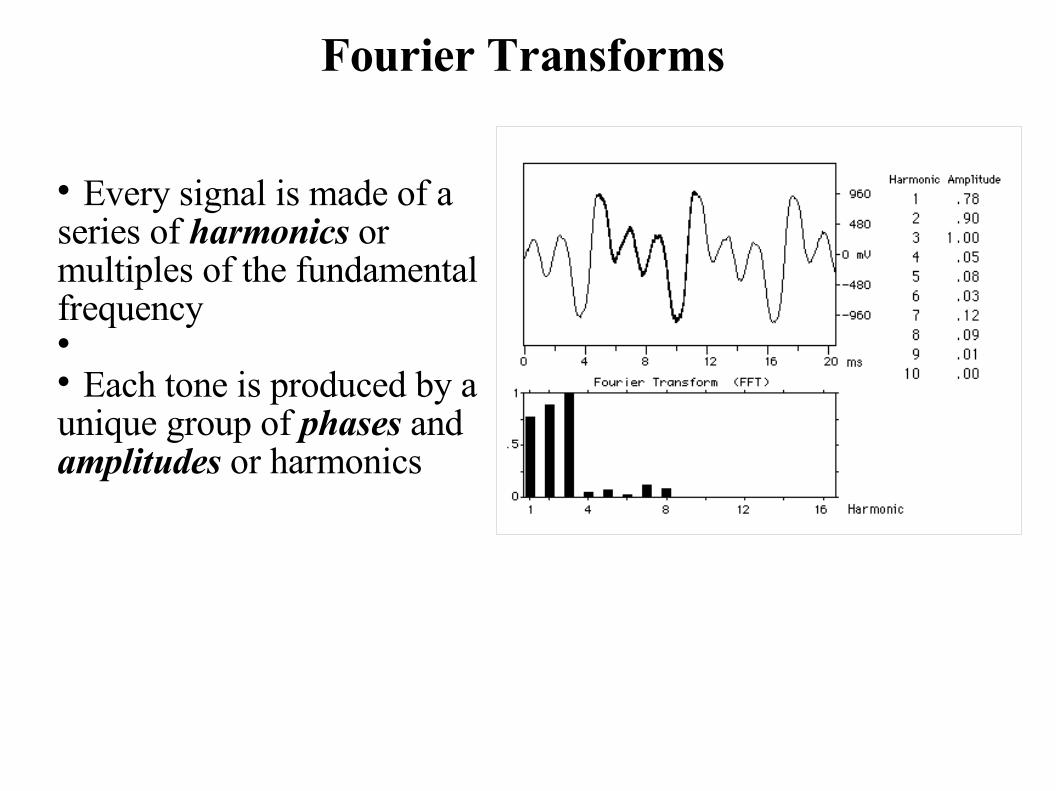
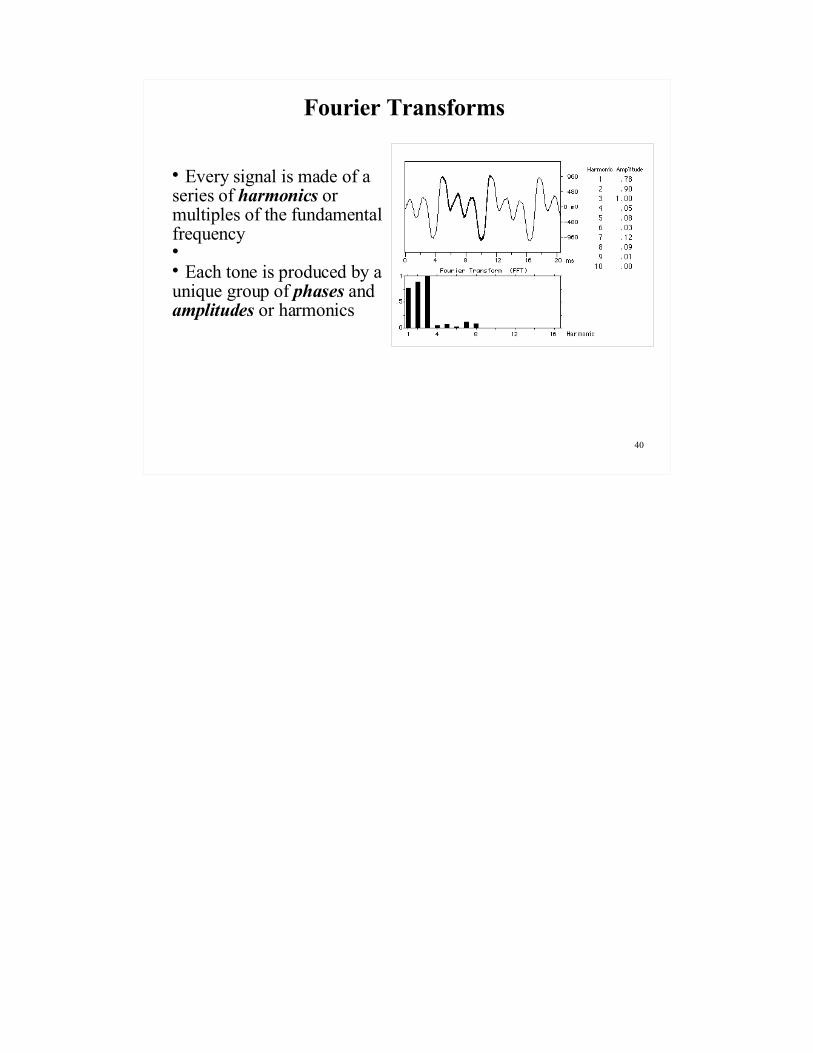
Every signal is made of a series of harmonics or multiples of the fundamental frequency
Each tone is produced by a unique group of phases and amplitudes or harmonics
Fourier Transforms: Amplitudes and Phases
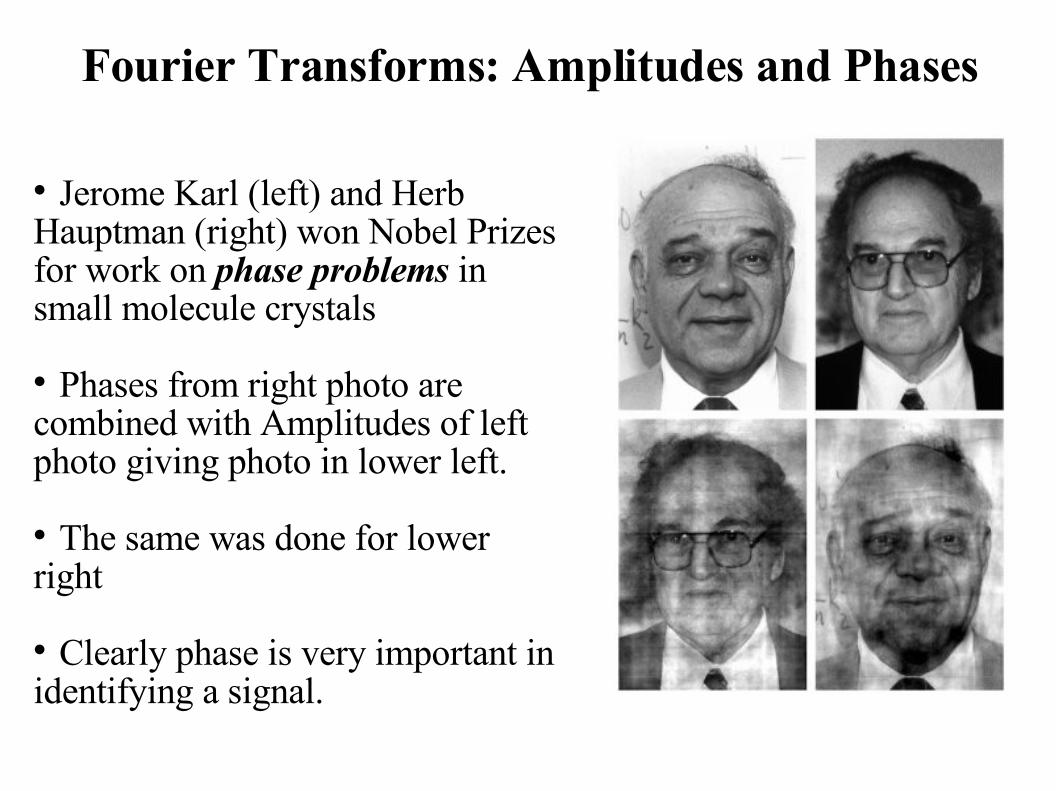
Jerome Karl (left) and Herb Hauptman (right) won Nobel Prizes for work on phase problems in small molecule crystals
Phases from right photo are combined with Amplitudes of left photo giving photo in lower left.
The same was done for lower right
Clearly phase is very important in identifying a signal.
Fourier Analysis
Fourier analysis is used to find the amplitudes and phases which produce a given signal (musical note, seismogram, etc..)
Uses include identification of a valuable violin, detect faulty behavior in an aero-engine, detect heart defect in a cardiogram, detect mantle heterogeneities which produce a seismogram.
Fourier Synthesis
Fourier synthesis is the process used to construct a waveform by adding together a fundamental frequency and other overtones or harmonics (adding various phases and amplitudes)
We combine these harmonics by using cosine and sine terms in a Fourier series.
1
Tectonic Plates: What are They Made of and What Drives Them ?


8
Global Seismic Tomography
Subducting Farallon slab is imaged through seismic tomography extending to at least 2000 km depth
Farallon reaches this depth somewhere beyond the east coast of North America
Grand et al., 2001.


11
Other Seismic Studies of the Continental Lithosphere
Dayanthie S. Weeraratne, Donald W. Forsyth, Andrew A. Nyblade (Brown University and Penn State)
Meters
12
Surface wave tomography methodin the continental upper mantle Tanzanian craton
Ethiopian Plateau
Tanzanian Broadband Experiment
Ethiopian Broadband Experiment
13
50s
2D Phase Velocity Maps
* High phase velocities are observed within craton boundaries.* Low velocities observed beneath the Eastern rift branch.* Disruption of cratonic lithosphere in SE corner.
14
Shear Wave Velocity Cratonic Lithosphere
High velocity cratonic lithosphere observed to 170 km depth.Disruption of lithosphere in SE corner observed at depths 80 150 km.
Disruption of the lithosphere
15
Tectonic Plates on Earth and Other Planets
VenusEarth
The Earth has many tectonic plates Other planets only have one plate, Why ?
16
Tectonic Plates on Earth and Other Planets
VenusEarth Maybe the Earth's lithosphere is weaker and prone to break up ? Any differences in lithospheric thickness, strength ? What allows plates to move ? Do other planets have an asthenosphere ? What is the asthenosphere ?
17
“One-Plate” Planets
Venus “One-plate” planets such as Venus or Mars are thought to have a shell-like lithosphere which surrounds the planet
This lithospheric shell may rotate as a whole if an asthenosphereis present to allow movement.
How could we measure such tectonic plate movement ?


29
Tectonic Plates: What are They Made of and What Drives Them ?
30
What Drives Plate Motion ?
Slab Pull Ridge Push Others ?
Mantle Drag

31
Ridge Push
The elevation of spreading centers creates gravitational potential energy gradient which “pushes” plates away
32
Calculating Ridge Push Quantitatively
Forces include stress and strain measurements for tectonic plates (Zoback 1989; Coblentz et al)
“Ridge push” force can be calculated per ridge length
Resultant convergence direction for Indo-Australian plate can be determined

33
Slab Pull
Slab pull forces are more difficult to estimate or measure
Subducting plates go down during collisional impact – not from pure negative buoyancy...
So downgoing plates may act differently than downwelling forms of convection
34
Lithospheric Plates and Mantle Flow
Figure 10.1 in your text (Davies) show that mantle flow is more active beneath fractured plates
Do plates drive mantle flow – or the reverse ?
35
Introduction to Fourier Transforms
36
Digital Photo: Image Size
Original photo (left) is compressed using a Fast Fourier Transform (FFT)
Smaller image size (left) retains all major features but with reduced clarity and smaller file size
37
Digital Photo: Image Size
Old photo (left) was cleaned up with a FFT (right)
38
Introduction to Fourier Transforms
Fourier Transforms can be used- Recover signal from a noisy record- Electrical Filters- Clean a television picture- reduce image size of digital photos
Fourier Transforms can be done analytically (on paper) or computationally (on a computer)
39
Fourier Transforms
A single musical note from a trombone is shown above You can see it is made up of a range of frequencies and amplitudes It's Fourier transform is shown to the right
40
Fourier Transforms
Every signal is made of a series of harmonics or multiples of the fundamental frequency
Each tone is produced by a unique group of phases and amplitudes or harmonics

41
Fourier Transforms: Amplitudes and Phases
Jerome Karl (left) and Herb Hauptman (right) won Nobel Prizes for work on phase problems in small molecule crystals
Phases from right photo are combined with Amplitudes of left photo giving photo in lower left.
The same was done for lower right
Clearly phase is very important in identifying a signal.
42
Fourier Analysis
Fourier analysis is used to find the amplitudes and phases which produce a given signal (musical note, seismogram, etc..)
Uses include identification of a valuable violin, detect faulty behavior in an aero-engine, detect heart defect in a cardiogram, detect mantle heterogeneities which produce a seismogram.
43
Fourier Synthesis
Fourier synthesis is the process used to construct a waveform by adding together a fundamental frequency and other overtones or harmonics (adding various phases and amplitudes)
We combine these harmonics by using cosine and sine terms in a Fourier series.