tectonic shifts in global energy geopolitics · 2014-07-29 · tectonic shifts in global energy...
TRANSCRIPT

Tectonic Shifts in Global Energy Geopolitics
See Appendix A-1 for Analyst Certification, Important Disclosures and non-US research analyst disclosures Citi Research is a division of Citigroup Global Markets Inc. (the "Firm"), which does and seeks to do business with companies covered in its research reports. As a result, investors should be aware that the Firm may have a conflict of interest that could affect the objectivity of this report. Investors should consider this report as only a single factor in making their investment decision. Certain products (not inconsistent with the author’s published research) are available only on Citi's portals.
July 2014
Eric G Lee Energy Strategist [email protected] +1-212-723-1474

Selected geopolitical risks impacting oil markets Considering a wide range of risks – from lower to higher uncertainty, and medium to high impact – helps prepare a set of supply-demand scenarios, with their price implications; demand/macro risks are important.
2
High
Med
Lower Higher
Impa
ct
Uncertainty
Libya
Iran Iraq
Arctic
Global spread of shale
Venezuela
Mexican reforms
Nigeria
US shale/tight oil
Arab Spring spreads further
Global deepwater regulations
Global shale regulations
Peak oil demand Oil to gas substitution
Income inequality
Non-OPEC supply
Russia/West
OPEC policy/ breakdown
Commodity supercycle
Global macro

Source: Bloomberg, Citi Research
1. “Vox Populi” risk Shifting and more volatile public opinion – Vox Populi – is an increasingly important structural risk that generates uncertainty, including for oil markets
3
● Yearly average of elections, government collapses, mass protests have increased over 50% since 2011, compared to the 2000s
● Large scale protests, facilitated by social media, civil conflict, post-protest new leaders can be weaker, with less political capital; this is particularly affecting resource economies like petrostates
● In middle-income and industrialized countries too: more vocal middle classes, slow economic recovery and austerity, corruption, income inequality, falling trust in elites and public institutions, more fragmented outcomes
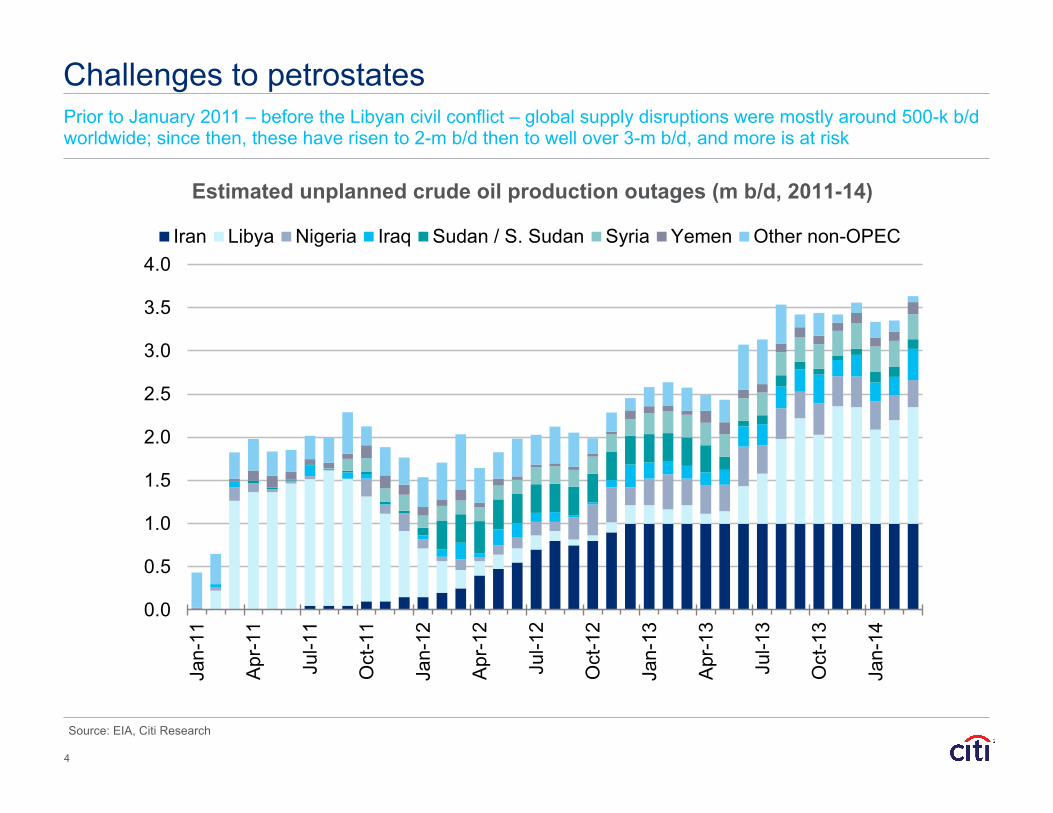
Prior to January 2011 – before the Libyan civil conflict – global supply disruptions were mostly around 500-k b/d worldwide; since then, these have risen to 2-m b/d then to well over 3-m b/d, and more is at risk
Source: EIA, Citi Research
Challenges to petrostates
0.0
0.5
1.0
1.5
2.0
2.5
3.0
3.5
4.0
Jan-
11
Apr
-11
Jul-1
1
Oct
-11
Jan-
12
Apr
-12
Jul-1
2
Oct
-12
Jan-
13
Apr
-13
Jul-1
3
Oct
-13
Jan-
14
Iran Libya Nigeria Iraq Sudan / S. Sudan Syria Yemen Other non-OPEC
Estimated unplanned crude oil production outages (m b/d, 2011-14)
4

Redrawing the map, and the grab for resource rents Post-Spring governance faces challenges of factional divisions among calls for political power sharing, widespread availability of arms, Sunni-Shia divisions, and extremist groups entering the fray in power vacuums.
Source: NYTimes, IIF, Citi Research
5
Tripoli Misrata
Sabha
Benghazi Jabhal Al-Druze
Erbil
Baghdad
Ad Dammam Riyadh
Jeddah Mecca
Sana
Aden
KURDISTAN
SUNNISTAN
SHIITESTAN
ALAWITESTAN SYRIA
SAUDI ARABIA
IRAQ
YEMEN
LIBYA
CYRENAICA
FEZZAN
TRIPOLITANIA N. ARABIA
WAHHABISTAN
EAST ARABIA
WEST ARABIA
SOUTH ARABIA
EAST YEMEN
WEST YEMEN
Fiscal breakeven prices for selected oil exporter countries ($/bbl)
2011 2012 2013 2014Qatar 38 42 46 46 Kuwait 44 49 54 58 Saudi Arabia 77 74 84 88 Oman 78 80 94 104 UAE 92 79 68 67 Libya 183 89 99 100 Iraq 93 95 99 93 Russia 100 115 118 112 Iran 84 130 140 143 Bahrain 111 115 119 117 Algeria 111 120 113 113 Venezuela 140 170 165 156 Yemen 195 237 215 201
● Rentier states engaged in the “grab” for resource rents, but how to distribute? Calls for power/revenue-sharing
● With prices staying flat, or falling, this comes into conflict with petrostates’ high fiscal breakeven oil price needs
● Unstable boundaries – Libya, Iraq, elsewhere? Russia/Ukraine
● Can unlock production too – Kurdish region?
2. “Vox Populi” risks in developed markets too Vox Populi risks have increased in middle-income and industrialized countries too
6
• Lower trust in elites and public institutions, but still tend to express through the ballot box
• “Public license to operate” – oil sands, fracking, deepwater regulation; cross-border pipelines (Keystone XL); US hydrocarbons exports; local politics
• Jobs versus the environment? Affordability of energy? The foreign policy angle after Russia-Ukraine crisis
• Carbon bubble / budget?

3. Russia and China – supplier of energy, supplier of capital
Source: Bloomberg, Citi Research
● Russia’s move from a lumpy European supplier of oil and gas to a global supplier is having significant repercussions on the balance between pipeline and seaborne transportation
● China preference for pipeline sourcing, is impacting not just Central Asian supply lines, but is reinforcing Russia’s move toward tied pipeline transportation
● But China is also becoming a major source of capital in the global upstream, with a different political risk appetite
7
Russia is directing its flows east, even before the Russia-Ukraine crisis created a greater concern for diversifying away from Europe; China ties up pipeline supplies from Central Asia, Russia
Russian westbound crude exports falling sharply (m b/d)
4.4
4.6
4.8
5.0
5.2
5.4
5.6
5.8
6.0
Jan Feb Mar Apr May Jun Jul Aug Sep Oct Nov Dec
2012 2013 2014
…only partially matched by eastbound sales so far (m b/d)

Brent as broken benchmark, although Atlantic Basin deficit fading
Source: EIG, Citi Research
● Crude production growth in the Atlantic Basin (North & South America, Europe, FSU and Africa) is expected to outpace refinery run rate growth which will leave more crude in the Atlantic Basin trying to find a new home. This can add weight to crude prices in the region.
● Crude production growth driven by North America and Latin America can more than offset declines in North Sea production and Russian flows heading away from Europe.
8
-15
-10
-5
0
5
10
2000 2005 2010 2012 2013 2014 2015
North America C&S America EuropeAtlantic Africa Total Med Total Atlantic Basin
A major issue with global oil pricing is that Brent is swayed by local balances; these have been supportive, but are shifting, in an interplay with geopolitics
-‐20%
0%
20%
40%
60%
80%
100%
2011
2012
2013
2014
2015
2016
2017
2018
2019
2020
Share of im
ports v
s. to
tal U
S pe
troleu
m su
pply
Total Crude + Products Products Crude
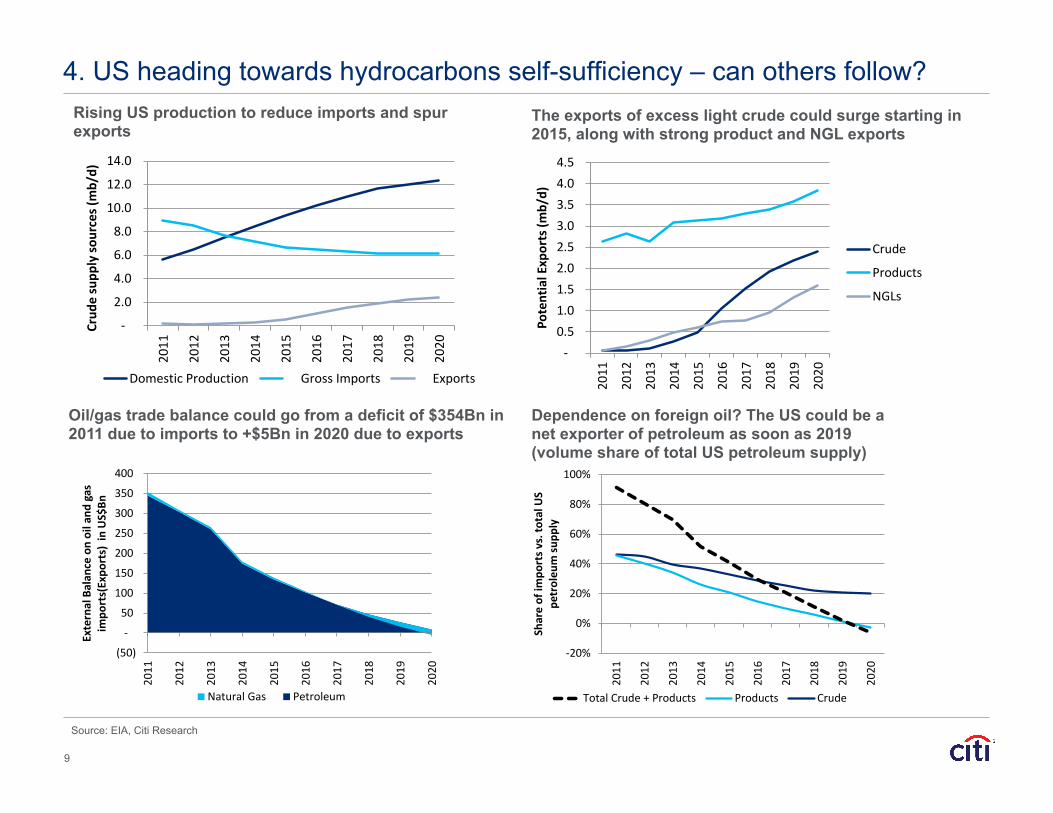
4. US heading towards hydrocarbons self-sufficiency – can others follow?
Source: EIA, Citi Research
Dependence on foreign oil? The US could be a net exporter of petroleum as soon as 2019 (volume share of total US petroleum supply)
Oil/gas trade balance could go from a deficit of $354Bn in 2011 due to imports to +$5Bn in 2020 due to exports
Rising US production to reduce imports and spur exports
The exports of excess light crude could surge starting in 2015, along with strong product and NGL exports
(50)
-‐
50
100
150
200
250
300
350
400
2011
2012
2013
2014
2015
2016
2017
2018
2019
2020
External Balan
ce on oil and
gas
impo
rts(Expo
rts) in US$Bn
Natural Gas Petroleum
-‐ 0.5 1.0 1.5 2.0 2.5 3.0 3.5 4.0 4.5
2011
2012
2013
2014
2015
2016
2017
2018
2019
2020
Potential Exports (m
b/d)
Crude
Products
NGLs
-‐
2.0
4.0
6.0
8.0
10.0
12.0
14.02011
2012
2013
2014
2015
2016
2017
2018
2019
2020
Crud
e supp
ly so
urces (mb/d)
Domestic Production Gross Imports Exports
9

Pre-2005, resources looked concentrated in the Middle East/FSU
…and far from consumption centers
Source: Baker Institute
10

Major North American Shale Plays (~1,930 tcf) European, Latin American, African
and Pacific Shale Plays (~4,670 tcf)
*Over 6,600 tcf of shale according to ARI/EIA report, 2011
The advent of global shale resources could thus be transformative…
…for pricing, trade patterns, geopolitics, industry structure…
Source: Baker Institute
11

Spreading of unconventionals would be geopolitically profound
● Availability of shale could lead countries to rush to develop – this may be happening
● The shale revolution should be sustainable. US shale resources are only ~15% of TRC reserves globally. N. Africa, Ukraine, Saudi Arabia are taking steps. Other major shale resource holders include Mexico, Argentina, Russia, China
● More widespread development could cause a widespread fall in reliance on foreign sources supplies, changing global crude trade flows and the geopolitics of oil.
● Shale production could make net oil importers more self-sufficient. Structurally this means more stable global oil prices with downward pressure.
● US, Canadian supply surge already offset a massive rise in global supply disruptions in the world since Feb. 2011, keeping Brent prices range-bound at the $110 level.
Shale revolution’s spread could have unexpected geopolitical impacts – a turn away from resource nationalism?
Source: EIA, Citi Research
Global map of shale resources
12
US 1161 Russia 75China 1115 US 48Argentina 802 China 32Algeria 707 Argentina 27Canada 573 Libya 26Mexico 545 Australia 18Australia 437 Venezuela 13South Africa 390 Mexico 13Russia 285 Pakistan 9Brazil 245 Canada 9Others 1536 Others 65
Technically Recovarable ReservesShale Gas (Tcf) Shale Oil (Bln Barrels)
Top 10 technically recoverable shale oil and gas reserves

$0
$5
$10
$15
$20
$25
2000 2001 2002 2003 2004 2005 2006 2007 2008 2009 2010 2011 2012 2013
Henry Hub Brent
$/MMBtu
$19.5/MMBtu
$3.5/MMBtu
…driven by switching economics as well as environmental and energy security concerns, and EM economic headwinds and high prices and fuel subsidy reforms
Source: MacKay, Wards Auto, Westport, Ayres-Ayres-Warr, Citi Research
Crude and US natural gas prices have diverged
0
10
20
30
40
50
60
2013
2015
2017
2019
2021
2023
2025
2027
2029
2031
2033
2035
2037
2039
Gas
dem
and
gain
(Bcf
/d)
Base + LR(Base) Complete turnover + TOTAL Slow adoption + LR(Low)
0%
10%
20%
30%
40%
50%
60%
70%
80%
90%
100%
2013
2015
2017
2019
2021
2023
2025
2027
2029
2031
2033
2035
2037
2039
%
Base Complete turnover Slow adoption
Estimated NGVs as % new HDV sales in the US
Projected gas demand in transportation
Diesel’s share of new Class 8 trucks sales in US, 1950-2010
0%
25%
50%
75%
100%
1950 1960 1970 1980 1990 2000 2010
13
Slowing oil demand growth and oil-to-gas substitution, over time

5. Shale revolution putting pressure on government take?
14
Oil prices holding over $100 yet oil industry returns sub-par, and IOCs reining in capex as a result, while the US shale revolution is attracting a growing share of this capex
• Era of shale abundance? Perception? Resource owners around the world may feel more pressure to compete for investment
• Surge in US production stands in stark contrast with flat to declining production in much of the rest of the world; Mexico now opening up, could others follow?
• MENA region starting to feel the pressure as the increased competition for IOC capex is occurring at the same time as above-ground risks are rising. Iraq and Iran and improving on previous terms, Abu Dhabi, Oman EOR in the past
• Incentives for shale development, in particular, including Argentina, Algeria
• Some hold-outs, still: Norway, Kazakhstan, Brazil

Mexican energy reforms promise opportunities across sectors
● Constitutional reform passed December 2013, secondary legislation presented April 2014, which could pass in weeks; reform introduces competition, transforms Pemex’s monopoly, strengthens state authority powers
● Round Zero determines which assets Pemex can (1) retain, (2) seek partners for, (3) relinquish, and could be ruled on by end-2014 ● Pemex likely retains key assets in shallow water, onshore conventional ● JV for technology, operations, capital: Chicontepec horizontal drilling, extra-
heavy oil in shallow water, deepwater Perdido Basin ● What about shale gas in Burgos Basin and elsewhere? And other resources:
numerous small marginal fields, EOR
● Licensing rounds, not direct negotiations, based on single economic variable
● Simple, transparent fiscal regime – royalty, applicable to profit-sharing, producing-sharing, license contracts – specific terms on a round-by-round basis for flexibility
● Local content requirements at 25% by 2025 does not seem too onerous
● Permits for midstream, downstream: natural gas from the US, and within Mexico; importing light sweet crude from the US to optimize domestic refining system
15

16
Appendix
16

Mexico’s energy reforms come at a time of great global shifts…
● Mexico has a chance to revitalize its energy sector
● Challenges from US and Canadian oil supply growth, arriving in the Gulf of Mexico, mean looking towards other markets, particularly Asia
● Upstream opportunities: shale/tight gas and oil, deepwater, extra-heavy oil, marginal fields
● Downstream opportunities: access to US shale gas, light tight oil, and NGLs
● Midstream opportunities
● Services sector opportunities
17
…presenting both challenges and opportunities.
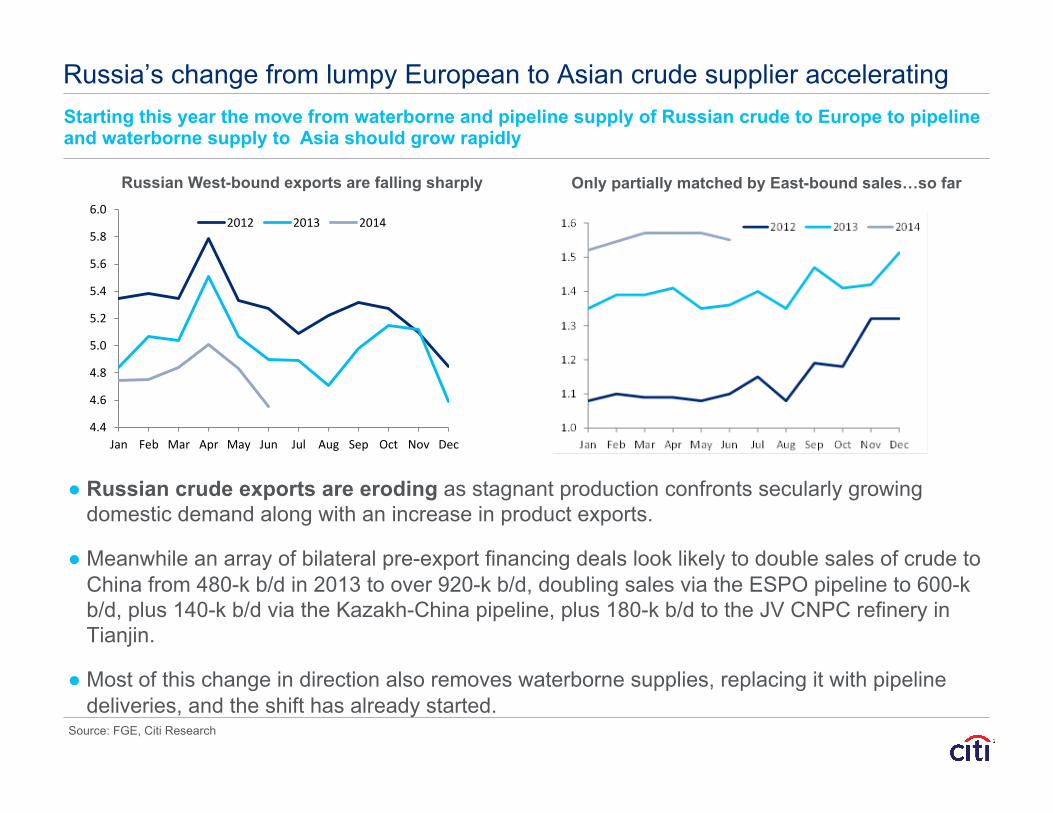
Russia’s change from lumpy European to Asian crude supplier accelerating Starting this year the move from waterborne and pipeline supply of Russian crude to Europe to pipeline and waterborne supply to Asia should grow rapidly
Source: FGE, Citi Research
Russian West-bound exports are falling sharply Only partially matched by East-bound sales…so far
● Russian crude exports are eroding as stagnant production confronts secularly growing domestic demand along with an increase in product exports.
● Meanwhile an array of bilateral pre-export financing deals look likely to double sales of crude to China from 480-k b/d in 2013 to over 920-k b/d, doubling sales via the ESPO pipeline to 600-k b/d, plus 140-k b/d via the Kazakh-China pipeline, plus 180-k b/d to the JV CNPC refinery in Tianjin.
● Most of this change in direction also removes waterborne supplies, replacing it with pipeline deliveries, and the shift has already started.
4.4
4.6
4.8
5.0
5.2
5.4
5.6
5.8
6.0
Jan Feb Mar Apr May Jun Jul Aug Sep Oct Nov Dec
2012 2013 2014

Slowing Chinese demand growth plus pipeline deals lower waterborne imports Bilateral Russian deals and expected ramp-up in Iraqi exports are pushing out other Middle East suppliers from China’s market
Source: China NBS, China Customs, FGE, Citi Research
After rapid growth, China’s waterborne crude imports are plateauing (k b/d, 2008-14)
…while imports from Russia grow (Russian eastward crude exports, m b/d, 2012-14)
● Chinese demand could rise by ~300-350-k b/d in 2014, while Russian sales should growth by 180-k b/d and Iraqi sales could increase by 525-k b/d, depending on how much Iraqi exports can grow this year.
● So far, traditional suppliers to Asia from Latin America, the Middle East and West Africa have not slowed their sales efforts in Asia, but an erosion of sweet-sour spreads, already being fostered by changes in the US Gulf Coast look likely to spread to the Far East this year.
● If Iran is allowed to export more crude in the second half of the year, it could further exacerbate competition for market share this year.
0
100
200
300
400
500
600
700
Jan Feb Mar Apr May Jun Jul Aug Sep Oct Nov Dec
2008
2009
2010
2011
2012
2013
2014

● The deal represent the biggest progress in Russia-China energy trades: – Volume: 38-bcm/yr (~3.7 Bcf/d), but could be expanded to 60-bcm/year (~5.8 Bcf/d) – Route: From East Siberia and be shipped to Northern and Eastern China. – Additional Clauses: China will also make a $20-billion prepayment to Gazprom for the field
and pipeline construction and provide tax benefit for the imported gas.
● The imports price has been the major barrier for the negotiation in the past year. Details on pricing were not released but a $400bn total contract value hints at c$380/mcm, lower than Russia’s export price to Europe but comparable to pipeline imports from central Asia.
The Russia-China 30-year natural gas supply deal
20
“Power of Siberia” gas pipeline
Source: Gazprom, Citi Research

● The current deal with China could be the best outcome possible. – It involves the development of two
giant gas fields Chayanda and Kovykta in Eastern Siberia. It also enables the construction of the “Power of Siberia” gas pipeline and the Vladivostok LNG (“VLNG”) with much better economics.
● Russia depends significantly on gas exports to Europe for government revenues but revenues could continue to fall as exports decline further over time, compounded by lower prices.
● The continued decline of European gas demand and the rise of LNG supply could cut Russian exports to Europe by nearly the same amount that Russia would be getting from exporting to China.
Rationales behind Russia’s Decision
21
Geopolitics, economic development, strategic positioning and economics are all key drivers in getting the gas deal with China completed
European Gas Supply-Demand Balance and Electricity Generation Breakdown
Source: EIA, IEA, Citi Research

1. The reduction in Russia’s reliance on Europe for revenue could be achieved
2. Russian Far East’s gas supply becomes much more competitive.
3. China also gains leverage in gas supply deals, as new gas supply would help to meet demand and diversify supply.
4. With Russia able to ramp up its Eastern Gas Program and China partially reducing its LNG demand growth, global LNG supply could be in further excess, which should be absorbed but at a lower price, affecting LNG developers.
5. Coal demand for power generation could fall further as gas substitutes coal, thereby affecting coal producers.
Far-reaching strategic implications
22
China’s gas pipeline network
Source: IEA, Citi Research

Meanwhile product exports have grown and should continue to grow Russian policies have prompted refinery expansions, higher quality products, with fuel oil falling from 33% of exports to closer to 10%, and gasoil potentially doubling toward 1-m b/d
Source: FGE, Citi Research
Product exports likely to remain mostly West bound But East bound sales could rise with new refineries
● The trend has been toward more product exports, given growing refinery capacity, and have already risen from 2.85-m b/d in 2011 to 3.17-m b/d last year, and could grow to 3.3-m b/d this year
● Meanwhile there should be a growing and dramatic drop in dirty product sales as new refineries yield less fuel oil, and a significantly higher percentage of clean products; the bottom right graph shows the situation if the fuel oil export duty were to be changed in 2014, instead this has been deferred into 2015.
Russian fuel oil surplus and seaborne exports*
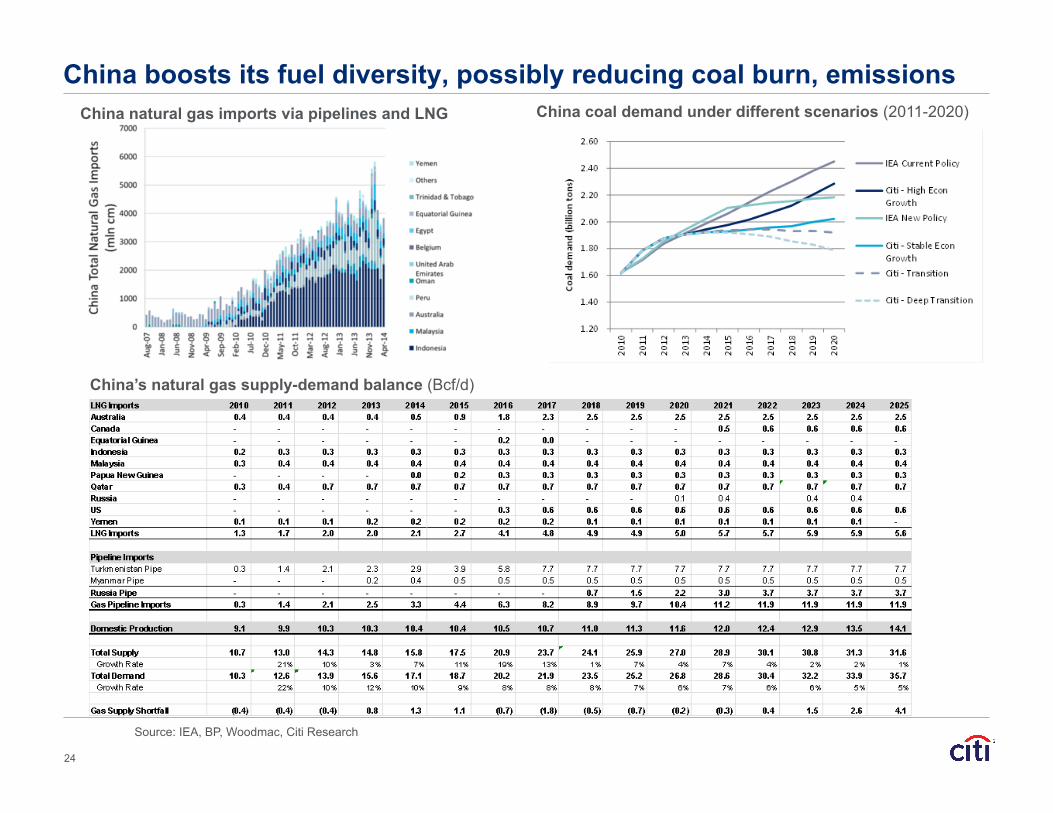
China boosts its fuel diversity, possibly reducing coal burn, emissions
24
China coal demand under different scenarios (2011-2020) China natural gas imports via pipelines and LNG
China’s natural gas supply-demand balance (Bcf/d)
Source: IEA, BP, Woodmac, Citi Research
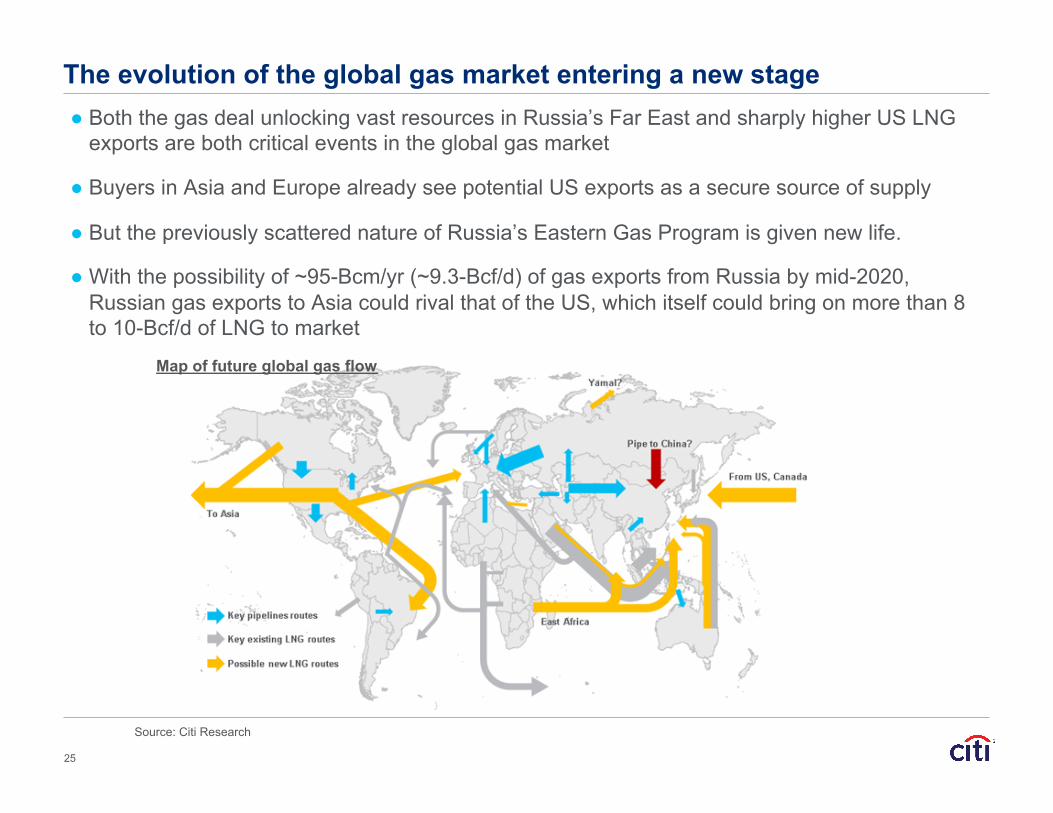
● Both the gas deal unlocking vast resources in Russia’s Far East and sharply higher US LNG exports are both critical events in the global gas market
● Buyers in Asia and Europe already see potential US exports as a secure source of supply
● But the previously scattered nature of Russia’s Eastern Gas Program is given new life.
● With the possibility of ~95-Bcm/yr (~9.3-Bcf/d) of gas exports from Russia by mid-2020, Russian gas exports to Asia could rival that of the US, which itself could bring on more than 8 to 10-Bcf/d of LNG to market
The evolution of the global gas market entering a new stage
25
Source: Citi Research
Map of future global gas flow

North America poised to become one of the largest global gas suppliers
Source: Citi Research
Note: Schematic only; size of arrows not reflective of actual flow; arrow directions indicative only
Map of future global gas flow
US gas exports should reinforce growth of LNG spot market, allow importers supply not sourced in Mid- East or Russia; and pipeline gas exports to Mexico could surge to satisfy the strong demand for gas
US LNG exports could surpass Qatar and Australia by 2020 Possible amount of US LNG exports (2015-2020)
26
-‐
1
2
3
4
5
6
7
8
9
Jan-‐15
May-‐15
Sep-‐15
Jan-‐16
May-‐16
Sep-‐16
Jan-‐17
May-‐17
Sep-‐17
Jan-‐18
May-‐18
Sep-‐18
Jan-‐19
May-‐19
Sep-‐19
Jan-‐20
May-‐20
Sep-‐20
Bcf/d

What a gas spot market will bring
27
There’s nothing like a spot market to unleash market mechanisms, including a forward price market, hub trading, and some significantly flow consequences
1. Lack of destination restrictions, no re-sale prohibitions, means that seasonally low use periods will lead buyers to sell into highest prices short-term market
2. A spot market should ultimately create a global price that would be used to arbitrage transportation differentials around global consumers
3. A global price should create more competitive conditions for sellers, who have enjoyed “OPEC-like” advantages to date
4. LNG from OECD sources should all else equal be seen as more secure and more competitive than other LNG sourced supply
5. Spot trading should create conditions for a trading hub and futures contract, but
• Will the hub likely be in a consumer country (Singapore? China?)
• Or will it naturally emerge in a producer country (US? Qatar?)

28
Putting it all together: a remaking of global energy landscape
Source: BP, EIA, Exxon, IEA, Citi Research
Gas: Rising global supply to meet demand needs Estimates from different forecasters
250
300
350
400
450
500
2010 2015 2020 2025 2030Year
Bcf/d
Citi IEA WEO'12 IEA Golden AgeBP 2012 EIA IEO'11 Exxon'12 (Interpolated)
-
500
1,000
1,500
2,000
2,500
3,000
3,500
4,000
2010
2012
2014
2016
2018
2020
2022
2024
2026
2028
2030
GW
RenewablesNuclearOilCoalGas
Power: Renewables and gas to power rising demand
Coal: Demand should peak, led by China’s slowdown Scenario could follow IEA’s New Policy and Exxon’s cases
Oil: Displacement to slow global demand growth Gas-for-oil substitution in transportation, but substitution in power generation could cut an additional 5-mb/d of demand
60
80
100
120
140
160
180
2010 2015 2020 2025 2030 2035 2040
Inde
x (2
010
= 10
0)
Exxon BP EIAIEA New Policy IEA Current Policy IEA 450 Scenario
0
1000
2000
3000
4000
5000
6000
7000
8000
9000
2013
2015
2017
2019
2021
2023
2025
2027
2029
2031
2033
2035
2037
2039
Oil
dem
and
disp
lace
d (k
b/d)
Base + LR(Base) Complete turnover + TOTAL Slow adoption + LR(Low)

29
Ongoing/potential disruptive trends to remake the energy market
● The last decade saw the emergence of disruptive technology and significant change on the supply side
● How and when new technology emerges is always a surprise but improvements of current technology could be just as impactful – Over the past five decades, the hardware industry built on the semiconductor concept
developed in the 1960s. Improvements in current technology, such as gas plants, can leverage existing infrastructure and be more impactful
– Technology can have a large impact on the market if infrastructure is not a hurdle. Shale gas was able to leverage off the existing network, with incremental improvements elsewhere. Storage technology still has to undergo years of massive commercialization before they will have a market-wide impact.
– But being nimble in response to emerging trends is always a key success factor.

Brent crude oil prices ($/bbl, 2001-2014)
Source: Bloomberg, Citi Research
Crude oil prices have been range-bound for several years Prices have been range-bound with new supply balancing lost supply… but it has been the “wrong” quality of crude in the “wrong” place, unable to get to the most suitable markets.
30
0
20
40
60
80
100
120
140
160
2000 2001 2002 2003 2004 2005 2006 2007 2008 2009 2010 2011 2012 2013 2014
Brent Price 1-Yr Avg Price Yearly Min Price Yearly Max Price
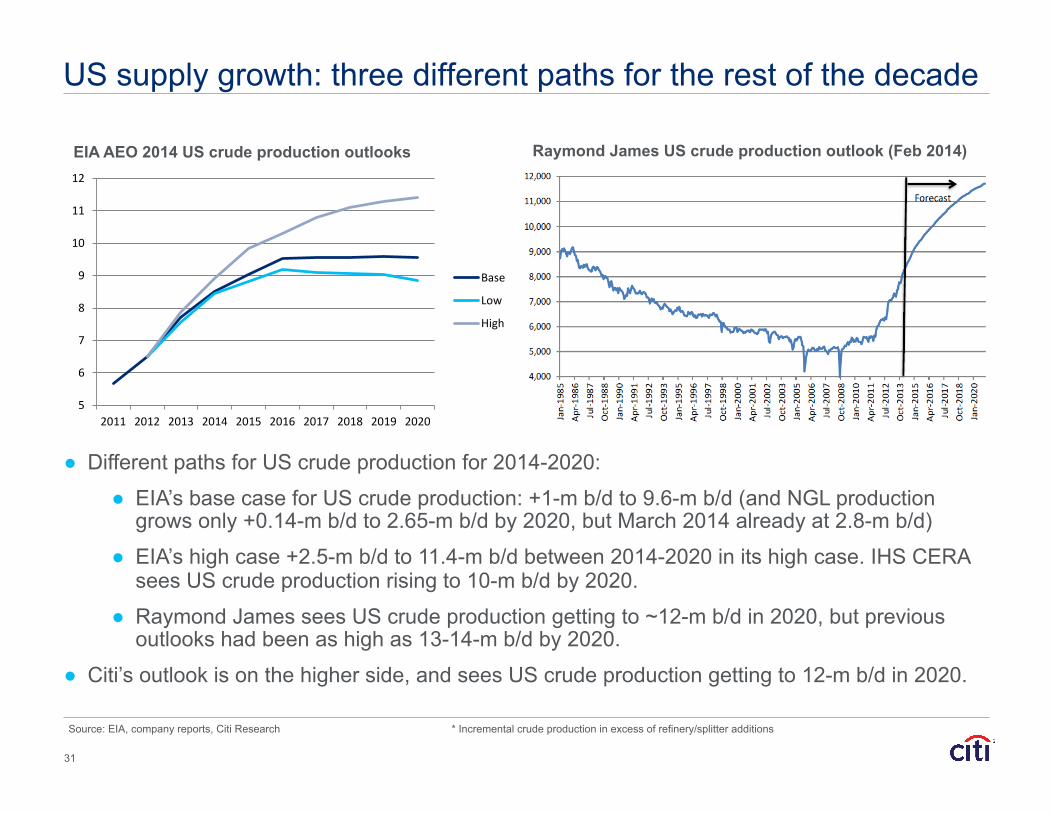
Source: EIA, company reports, Citi Research * Incremental crude production in excess of refinery/splitter additions
EIA AEO 2014 US crude production outlooks Raymond James US crude production outlook (Feb 2014)
31
US supply growth: three different paths for the rest of the decade
5
6
7
8
9
10
11
12
2011 2012 2013 2014 2015 2016 2017 2018 2019 2020
Base
Low
High
● Different paths for US crude production for 2014-2020:
● EIA’s base case for US crude production: +1-m b/d to 9.6-m b/d (and NGL production grows only +0.14-m b/d to 2.65-m b/d by 2020, but March 2014 already at 2.8-m b/d)
● EIA’s high case +2.5-m b/d to 11.4-m b/d between 2014-2020 in its high case. IHS CERA sees US crude production rising to 10-m b/d by 2020.
● Raymond James sees US crude production getting to ~12-m b/d in 2020, but previous outlooks had been as high as 13-14-m b/d by 2020.
● Citi’s outlook is on the higher side, and sees US crude production getting to 12-m b/d in 2020.

Source: NEB, EIA, Wood Mackenzie, Citi Research
Canadian crude production could reach ~5-m b/d this decade (m b/d, 2011-2020)
Mexico’s energy reforms can foster development of offshore deep water supply in the Gulf of Mexico…
32
0.0
1.0
2.0
3.0
4.0
5.0
6.0
2011 2012 2013 2014 2015 2016 2017 2018 2019 2020
Add'l diluent needs
EC light
AB bitumen
AB syncrude
Conventional heavy
Pentanes plus
Conventional light
● Canada and Mexico can contribute to robust North American supply…
● …while the FSU, Brazil, China, and West Africa should also be adding supply this decade too.
Other non-OPEC supply growth
…as well as onshore shale resources

$0
$5
$10
$15
$20
$25
2000 2001 2002 2003 2004 2005 2006 2007 2008 2009 2010 2011 2012 2013
Henry Hub Brent
$/MMBtu
$19.5/MMBtu
$3.5/MMBtu
Eroding the 40-m b/d global motor fuel market – natural gas can substitute for oil in transportation, particularly road vehicles, as shown below, but also for rail and marine transport too
Source: MacKay, Wards Auto, Westport, Ayres-Ayres-Warr, Citi Research
Crude and US natural gas prices have diverged
0
10
20
30
40
50
60
2013
2015
2017
2019
2021
2023
2025
2027
2029
2031
2033
2035
2037
2039
Gas
dem
and
gain
(Bcf
/d)
Base + LR(Base) Complete turnover + TOTAL Slow adoption + LR(Low)
0%
10%
20%
30%
40%
50%
60%
70%
80%
90%
100%
2013
2015
2017
2019
2021
2023
2025
2027
2029
2031
2033
2035
2037
2039
%
Base Complete turnover Slow adoption
Estimated NGVs as % new HDV sales in the US
Projected gas demand in transportation
Diesel’s share of new Class 8 trucks sales in US, 1950-2010
0%
25%
50%
75%
100%
1950 1960 1970 1980 1990 2000 2010
33
Slowing oil demand growth and oil-to-gas substitution, over time

The upshot: Brent range-bound, but could fall precipitously
● An upside breakout is unlikely and the downside is a lot more probable: More disruptions are possible, but so is more production, including more output from Saudi Arabia. Global crude balances imply that only a massive Middle East disruption breaks the range on the upside, and its economic consequences would like limit sustained upward price moves
● Refining margins look likely to soften, except in the US, and new refineries tend to see high throughput, but so far product oversupply hasn’t led to a significant closure of refineries in Asia or Europe
● A downside price breakout is unlikely in 2014, unless there is a rapid growth in production from Libya and Iraq, no new disruption from Nigeria or Venezuela, with new supply focused substantially on North America, but also Atlantic/Pacific Basins
● Refinery capacity build-out in the Middle East and East Asia are turning global flows on their head, potentially reducing Middle East available crude supplies, replacing them with product flows
● OPEC production growth could push market softness out until 2015, with a higher probability of new substantial sustainable flows from Iraq and Libya and possibly Iran
34
Brent stays range-bound for now, but could see a precipitous fall at some point, with indications that long-term prices could be $90 Brent as a ceiling rather than a floor.
3.0
4.0
5.0
6.0
7.0
8.0
9.0
Jan-‐00
Aug-‐00
Mar-‐01
Oct-‐01
May-‐02
Dec-‐02
Jul-‐0
3
Feb-‐04
Sep-‐04
Apr-‐05
Nov-‐05
Jun-‐06
Jan-‐07
Aug-‐07
Mar-‐08
Oct-‐08
May-‐09
Dec-‐09
Jul-‐1
0
Feb-‐11
Sep-‐11
Apr-‐12
Nov-‐12
Jun-‐13 -
10
20
30
40
50
60
70
Jan-0
5Se
p-05
May-0
6Ja
n-07
Sep-0
7Ma
y-08
Jan-0
9Se
p-09
May-1
0Ja
n-11
Sep-1
1Ma
y-12
Jan-1
3Se
p-13
Bcf/d
Non-ShaleShales
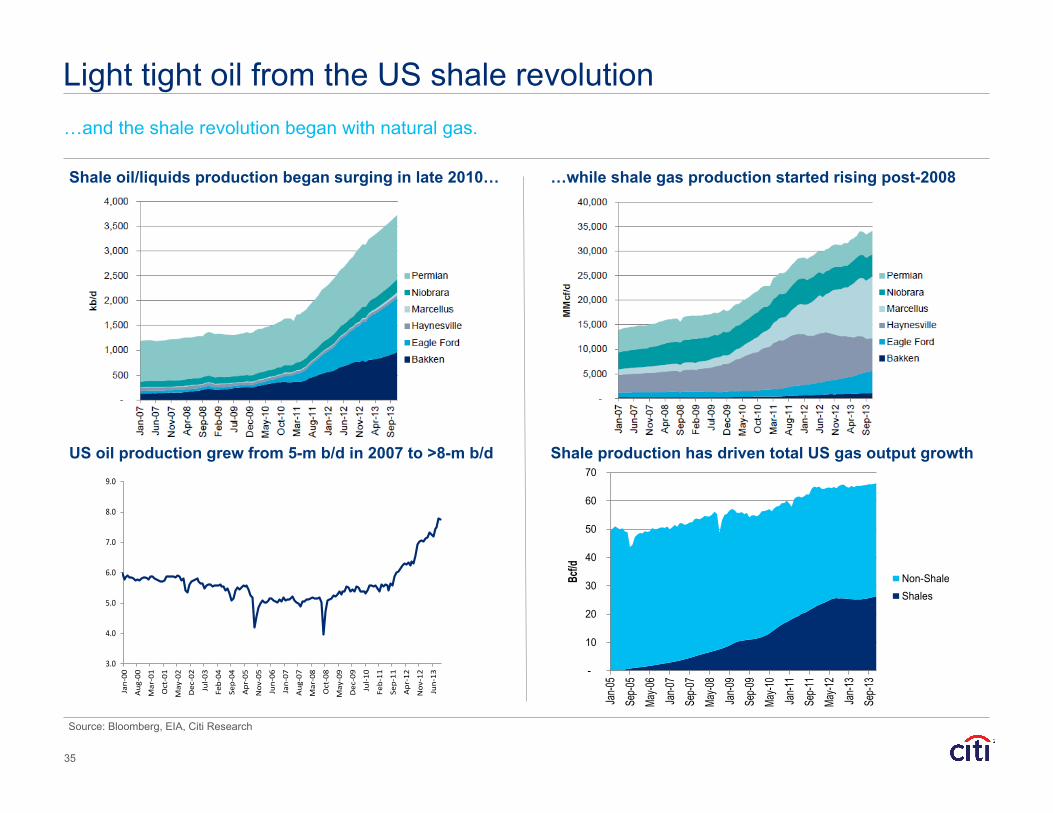
Light tight oil from the US shale revolution
Source: Bloomberg, EIA, Citi Research
Shale oil/liquids production began surging in late 2010… …while shale gas production started rising post-2008
…and the shale revolution began with natural gas.
US oil production grew from 5-m b/d in 2007 to >8-m b/d Shale production has driven total US gas output growth
35

Heavy oil sands supply steadily growing in Canada… …leading to the first WTI-Brent oil price disconnect in 2007-08
Source: NEB, EIA, Bloomberg, Citi Research
0
500
1,000
1,500
2,000
2,500
3,000
3,500
4,000
Jan-0
3Ju
l-03
Jan-0
4Ju
l-04
Jan-0
5Ju
l-05
Jan-0
6Ju
l-06
Jan-0
7Ju
l-07
Jan-0
8Ju
l-08
Jan-0
9Ju
l-09
Jan-1
0Ju
l-10
Jan-1
1Ju
l-11
Jan-1
2Ju
l-12
EC lightWC syncrudeWC bitumenWC conv lightWC conv heavyWC NGLs
k b/d
Canadian oil production by type (2003-2013) showing growth in syncrude, bitumen and “conventional light”, which includes shale oil
US crude imports from Canada, by PADD (k b/d) – Canadian crude production growth has been absorbed by PADD II so far; 2H’14 pipelines should allow more crude to end up in PADD III at the expense of PADD II, while western Canadian production growth continues
36
0
500
1000
1500
2000
2500
3000
Jan-9
3
Jan-9
4
Jan-9
5
Jan-9
6
Jan-9
7
Jan-9
8
Jan-9
9
Jan-0
0
Jan-0
1
Jan-0
2
Jan-0
3
Jan-0
4
Jan-0
5
Jan-0
6
Jan-0
7
Jan-0
8
Jan-0
9
Jan-1
0
Jan-1
1
Jan-1
2
Jan-1
3
Jan-1
4
East Coast (PADD 1) Midwest (PADD 2) Gulf Coast (PADD 3)
Rocky Mountain (PADD 4) West Coast (PADD 5)

TransCanada Keystone Gulf Current: 700,000 b/d Expansion TBD: +130,000 b/d
TransCanada Energy East Q4 2017: 1.1 million b/d
Surging domestic crude oil production has led to reversals and expansions and new-builds of pipelines, as well as increased rail and barge movements, more storage capacity, with huge impacts in 2014-2015
Source: CAPP, Genscape, company reports, Citi Research
Another year of new pipelines brings new waves of oil to the Gulf
37
Tallgrass Pony Express Q3 2014: +230,000 b/d Expansion TBD: +170,000 b/d

…and rail, too, to the Gulf, East, and West Coasts All grades of US Gulf Coast crudes can come under pressure due to growing crude-on-crude competition. Western Canadian, inland US crudes can reach waterborne markets, but limited export options – for now.
Source: DOS, Citi Research
38

0
500
1000
1500
2000
2500
Exports
PADD V
PADD II
PADD I
Pipe PADD II
Source: EIA, Citi Research
PADD III imports: new pipeline inflows from Cushing push out waterborne imports; ~200-k b/d rail inflows additional (k b/d)
PADD III exports: outflows to PADD II have fallen, and waterborne exports are rising; Capline and Mid Valley could provide outlets under extreme conditions (k b/d)
PADD III production driven by Eagle Ford, Permian Basin, US Gulf of Mexico (k b/d, 2005-14)
Refinery runs soaring, recent TX Gulf capacity added, some additions to come (k b/d, 2005-14)
39
0
1000
2000
3000
4000
5000
6000
GoM
TX
NM
MS
LA
AK
AL 0
1000
2000
3000
4000
5000
6000
7000
8000
9000
NM
N LA-‐AR
LA Gulf
TX Gulf
TX Inland
PADD III
0
1000
2000
3000
4000
5000
6000
7000
0
200
400
600
800
1000
1200
1400
Jan-‐20
05
Jan-‐2006
Jan-‐20
07
Jan-‐2008
Jan-‐20
09
Jan-‐2010
Jan-‐20
11
Jan-‐2012
Jan-‐20
13
Jan-‐2014
Barge PADD II
Tanker PADD I
PADD IV
PADD II
PADD I
Imports (RHS)
The crude glut arrives on the Gulf Coast

0
500
1000
1500
2000
2500
3000
3500
4000
4500
1973
1975
1978
1981
1984
1986
1989
1992
1995
1997
2000
2003
2006
2008
2011
Middle East
Latin America
Africa
Canada
US crude oil imports from major region/countries (k b/d, 1973-2014) Latin American crude exports to the US already back down to 1993
levels levels of ~2.3-m b/d, can fall further
Source: EIA, Citi Research
…pushing out crude imports from Africa, Latin America Newfound supply growth from shale oil and Canadian oil sands pushed out African imports, and put price pressure on LatAm and Middle East imports; limited takeaway pipelines for Canada depressed prices there too.
40

0
20
40
60
80
100
120
140
160
180
200 PADD II to III PADD III to I
North American light sweet crude imports backed out first
Source: NEB, EIA, Citi Research
US PADD III / Gulf Coast crude imports by quality (m b/d) US PADD I / East Coast crude imports by quality (m b/d)
…while other crude qualities remain sticky.
Tanker/barge movements include Jones Act movements from the Gulf Coast to to East Coast
Eastern Canada crude imports by quality, vs US crude exports to Canada (k b/d)
41
0.0
1.0
2.0
3.0
4.0
5.0
6.0
7.0Light sweet Light sour Med sweet Med sour Hvy sweet Hvy sour
0.0
0.2
0.4
0.6
0.8
1.0
1.2Light sweet Light sour Med sweet Med sour Hvy sweet Hvy sour
0
100
200
300
400
500
600
700
800
900
1,000
Jan-
10M
ar-1
0M
ay-1
0Ju
l-10
Sep-
10N
ov-1
0Ja
n-11
Mar
-11
May
-11
Jul-1
1Se
p-11
Nov
-11
Jan-
12M
ar-1
2M
ay-1
2Ju
l-12
Sep-
12N
ov-1
2Ja
n-13
Mar
-13
May
-13
Jul-1
3Se
p-13
Nov
-13
Jan-
14
Light Ontario Light QuébecLight Atlantic LightHeavy US crude exports to Canada
k b/d

70
80
90
100
110
120
130
Alberta syncrude LLS Edmonton condensate Eagle Ford condensate$/bbl
-30
-20
-10
0
10
20
30
Jan-13
Feb-13
Mar-13
Apr-13
May-13
Jun-13
Jul-13
Aug-13
Sep-13
Oct-13
Nov-13
Dec-13
Jan-14
Feb-14
Mar-14
Apr-14
May-14
Midland LLS Brent$/bbl
Under pressure: Gulf Coast light sweet crude, condensates
Source: EIA, Bloomberg, Citi Research
Gulf Coast crude oil production (Eagle Ford output plus 50-k b/d of Haynesville and 450-k b/d conventional production) by quality
Permian Basin and regional crude oil production by quality (includes 100-k b/d of non-Permian Basin production)
42
Brent, LLS, Midland differentials to WTI: LLS disconnects from Brent as USGC becomes glutted
Eagle Ford condensate vs. selected NAM crude prices: EF condensate is at a sizeable discount to LLS

Bloated crude oil inventories shifting to the US Gulf Coast Cushing stocks are in a race to the bottom, while PADD III stocks are in a race to the top
Source: EIA, Citi Research
Cushing crude stocks on the way down… …as PADD III crude stocks march upwards with refinery maintenance
43
10
15
20
25
30
35
40
45
50
55
Jan Feb Mar Mar Apr May Jun Jul Aug Sep Oct Nov Dec
2014 2013 2012 2011 2010 2009 2008Cushing stocks (m bbls)
150
170
190
210
230
250
270
Jan Feb Mar Apr May Jun Jul Aug Sep Oct Nov Dec
2014
2013
2012
2011

0
20
40
60
80
100
120
140
2009 2010 2011 2012 2013 2014
Applications
Approvals
Approvals to Canada
Approvals ex-‐Canada
no. of applications
● By end-2014, the US could be exporting another 200-k b/d to Canada (up to 400-k b/d)…
● …another 100-k b/d from Alaska…
● …perhaps 100- to 150-k b/d to Mexico to feed inland and west coast refineries to improve product yields and …
● …some 200-k b/d of re-exports of Canadian crude…
● …and perhaps even 200-k b/d of condensates if reclassified as petroleum products.
Source: EIA, BIS, Citi Research
US: to become a one million barrel per day crude exporter?
0.00
0.05
0.10
0.15
0.20
0.25
0.30
Jan Feb Mar Apr May Jun Jul Aug Sep Oct Nov Dec
Thou
sand
s 2010 2011 2012 2013 2014
US crude export applications and approvals (2014 is year-to-end-Feb)
US crude exports, mostly to Canada (k b/d, 2010-14)
44

0
500
1000
1500
2000
2500
3000
3500
4000
Jan-‐02
Aug-‐02
Mar-‐03
Oct-‐03
May-‐04
Dec-‐04
Jul-‐0
5Feb-‐06
Sep-‐06
Apr-‐07
Nov-‐07
Jun-‐08
Jan-‐09
Aug-‐09
Mar-‐10
Oct-‐10
May-‐11
Dec-‐11
Jul-‐1
2Feb-‐13
Sep-‐13
Total crude exports Crude exports to the US Crude production
● Venezuela already dropped 50% of its US market share, by diverting to South and East Asia
● Mexico has shrunk exports to the US by 15% and increased shipments to Asia and Europe by >100-k b/d; this year expect a surge in Pacific deliveries of up to 100-k b/d via Salinas Cruz and 50-k b/d to Europe
● Saudi Arabia hiking OSPs to the US signals the beginnings of diversion elsewhere
0%
20%
40%
60%
80%
100%
120%
0.0
0.5
1.0
1.5
2.0
2.5
3.0
Total exports Exports to US % US (RHS)m b/d7.5
Source: EIA, JODI, Citi Research
Nigeria and Angola have dropped out of the US crude market…
…while Canada joins three countries in battle for the US Gulf Coast (USGC crude imports by origin, m b/d)
Losing crude oil market share on the US Gulf Coast?
45
Mexico’s total crude exports, exports to the US, and crude production (k b/d, 2002-14)

Crude exports from the Americas increasingly looking to Asia US crude imports from Latin America (k b/d) US crude imports from the GCC (k b/d)
US crude imports from N. and W. Africa (k b/d)
Source: EIA, China Customs, Citi Research
China crude imports from selected countries (k b/d)
0
100
200
300
400
500
600
700
800
2008 2009 2010 2011 2012 2013 2014
Colombia Ecuador Mexico Venezuela Brazil
46

The main sour crude producers prices are linked to LLS on the US Gulf Coast; with LLS moving into a structural discount to Brent, Saudi Arabia, Venezuela, Mexico, others are under a price squeeze
Source: Bloomberg, Poten, Citi Research
Medium sour crudes priced in the US Gulf Coast and Asia – Mars-Dubai, and Arab Medium prices given Mars, Dubai and Saudi OSPs for the two regions ($/bbl, 2010-14) – Arab Medium has priced favorably to be taken by the US since late 2011, but a hike in US OSPs is likely beginning to indicate diversions towards Asia over time
US Gulf Coast crude oil imports from Saudi Arabia by grade (LHS), versus total (RHS) – Arab Light has dwindled, while other grades have stayed robust, even as total imports have fallen
…as sour crude prices come under pressure
47
-‐20.00
-‐15.00
-‐10.00
-‐5.00
0.00
5.00
10.00
Jan-‐10
Apr-‐10
Jul-‐1
0
Oct-‐10
Jan-‐11
Apr-‐11
Jul-‐1
1
Oct-‐11
Jan-‐12
Apr-‐12
Jul-‐1
2
Oct-‐12
Jan-‐13
Apr-‐13
Jul-‐1
3
Oct-‐13
Jan-‐14
Apr-‐14
Arab Med US-‐Arab Med Asia Mars-‐Dubai
● …but the potential for US crude exchanges could mean light sweet crude supply into Mexico’s refineries, boosting high-value light product yields, while allowing US Gulf Coast light sweet crude prices to reconnect with Brent, and putting less pressure on medium and heavy crudes…

Energy reforms promise opportunities across sectors
● Constitutional reform passed December 2013, secondary legislation presented April 2014, which could pass in weeks; reform introduces competition, transforms Pemex’s monopoly, strengthens state authority powers
● Round Zero determines which assets Pemex can (1) retain, (2) seek partners for, (3) relinquish, and could be ruled on by end-2014 ● Pemex likely retains key assets in shallow water, onshore conventional ● JV for technology, operations, capital: Chicontepec horizontal drilling, extra-
heavy oil in shallow water, deepwater Perdido Basin ● What about shale gas in Burgos Basin and elsewhere? And other resources:
numerous small marginal fields, EOR
● Licensing rounds, not direct negotiations, based on single economic variable
● Simple, transparent fiscal regime – royalty, applicable to profit-sharing, producing-sharing, license contracts – specific terms on a round-by-round basis for flexibility
● Local content requirements at 25% by 2025 does not seem too onerous
● Permits for midstream, downstream: natural gas from the US, and within Mexico; importing light sweet crude from the US to optimize domestic refining system
48

49
Source: Pemex preliminary estimates at 12/31/13, CNH
Royalties
Mexican hydrocarbon resources are diverse

Onshore conventional…
Mexican hydrocarbon resources are diverse
…and shallow water, Bay of Campeche area – KMZ, Cantarell
50

Onshore Chicontepec area could benefit from partnering on horizontal drilling
Mexican hydrocarbon resources are diverse
Deepwater Perdido Basin area could benefit from partnerships too
51

Source: Wood Mackenzie, EIA, Citi Research
Map of shale resources
52
● Despite the large resource base, Mexican production has fallen from 3.6-m b/d to 2.5-m b/d, and reserves of oil and gas have fallen even further, while unconventional onshore and deepwater resources provide an unusual opportunity
● Total technically recoverable shale resources in Mexico are estimated as 545-Tcf of natural gas and 13.1-bn bbls of oil. In addition to the estimated TRR in the Burgos Basin (343-Tcf of gas and 6.3-bn bbls of oil, there is favorable geology in the Tampico, Tuxpan and Veracruz basins further south, potentially holding another 28-Tcf of gas and 6.8-bn bbls of oil.
Tapping into them depends on how the current reforms play out
Map of offshoreresources
Mexican shale and deepwater resource potential

53
Eagle Ford play illustrates potential economic benefits
● In the Eagle Ford, on the US side of the border, employment growth in some counties has exceeded 20% per annum since 2010; in poorer rural counties, wages remain lower than average but increases have been robust; wages in the 23 counties in the Eagle Ford area have risen 21% faster than those of the rest of Texas
● Taxable sales in the Eagle Ford started to increase sharply in 2010, rising by 10.5% per annum, vs. 4.1% for Texas as a whole.
There are clear direct gains for employment, government tax receipts, and consumers (especially of natural gas), but indirect benefits are also considerable

US exports of light sweet crude can suit Mexican refineries well
Source: EIA, Citi Research * 50% Pemex, with Shell
54
…and could boost yields of high value products like gasoline and diesel; this is whether on the basis of a straight export, or as an exchange for Mexican heavy crude.
• Cadereyta 275-k b/d
• Ciudad Madero 195-k b/d
• Salamanca 245-k b/d
• Tula 245-k b/d
• Minatitlan 200-k b/d
• Salina Cruz 330-k b/d
• Deer Park 340-k b/d *

Source: Company reports, Bentek, Citi Research
Gas demand requirement is already rather sizeable for selected projects
55
0.0
0.5
1.0
1.5
2.0
2.5
3.0
3.5
4.0
4.5
5.0
Chemicals Petroleum Total
Bcf/d
Projects planned Project construction expected
Gas demand to rise due to higher domestic consumption and exports (2011-2020)
LNG exports projects to drive demand growth Possible amount of US LNG exports (2015-2020)
-‐
1
2
3
4
5
6
7
8
9
Jan-‐15
May-‐15
Sep-‐15
Jan-‐16
May-‐16
Sep-‐16
Jan-‐17
May-‐17
Sep-‐17
Jan-‐18
May-‐18
Sep-‐18
Jan-‐19
May-‐19
Sep-‐19
Jan-‐20
May-‐20
Sep-‐20
Bcf/d
US shale gas boom awaiting a robust demand response

Mexico’s energy reforms come at a time of great global shifts…
● Mexico has a chance to revitalize its energy sector
● Challenges from US and Canadian oil supply growth, arriving in the Gulf of Mexico, mean looking towards other markets, particularly Asia
● Upstream opportunities: shale/tight gas and oil, deepwater, extra-heavy oil, marginal fields
● Downstream opportunities: access to US shale gas, light tight oil, and NGLs
● Midstream opportunities
● Services sector opportunities
56
…presenting both challenges and opportunities.

Source: Citi Research
Onshore projects typically cost $5-100 million, shallow water projects $1-2 billion, and deep water projects $5-8 billion, though equivalent projects in Mexico could eventually see lower levels given labor and regulatory costs.
Johan SverdrupRumailaJubilee Area
Bina BawiZubair
China Domestic GasCampos ExpWest Qurna 1Tempa RossaPNG LNG T3
Gbaran Ubie Ph2Cepu Exp
NgamiaPerlaGoM Tiebacks Majnoon
NE Tupi
ItaipuFrancoWhales Park
CariocaLulaSapinhoa
SkrugardIara
PNG LNG T1-2Hadrian
Yamal Gas
JupiterBig Foot
Trebs TitovSandridge JVADMA
Mozambique LNG Uganda Bl.1,2,3Clair Ph 2 AbsheronVankorBl. 15/06 East
North Alexandria Hub TiberWest Qurna 2 KaskidaCLOVGhana Gas
Laggan/Tormore ZaedyusBlock 32
STL Bakken
Colombia OilChina Domestic Oil
Tanzania LNGWheatstone LNGYamal LNGOXY Bakken APLNG
PSVMIchthys LNGChina Domestic Oil Junin 5Prelude LNG
Bl. 31 SE Gorgon LNGJack-St Malo
DominoSTL Eagle Ford Browse LNGTengiz ExpBolia-Chota
KearlOPL245Aparo-Nsiko
Sunrise Ph 1 Usan
West Canada LNGRDS Unc Gas STL MarcellusFilanovsky
Block 61 OmanBG Haynesville QCLNG
Surmont Ph 2Fort HillsMacKay River
DoverAbadi FLNG
Terre de Grace Kashagan Ph 1Arrow LNGCarmon Creek Joslyn
GLNG
0
10
20
30
40
50
60
70
80
90
100
0 5 10 15 20 25 30 35 402020e Production, Mboe/d
Brea
keve
n, $/
bbl
LNG cost pressures
Pricing-discounts pushing
unconventionals higher up the curve
(2Q writedowns)
Low-cost conventional giants (Brazil & Norway)
remain robust.
Heavy oil expectations being scaled
back
Disappointing pace in Iraq sees industry accept
political risk of Kurdistan
Canadian oil sands
US deep water and tight oil
Where do these prospects sit on the project cost curve?
57

If restrictive export regime stays in place through 2015…
58
4Q'12 1Q'13 2Q'13 3Q'13 4Q'13 1Q'14 2Q'14 3Q'14 4Q'14 2015 2016 2017 2018WCS Cushing-WCS 17 16 8 10 15 11 10 7 7 10 10 10 7Maya-WCS Cushing 15 19 13 6 5 0 0 0 0 0 3 2 1Maya-WCS 32 36 21 16 20 11 10 7 7 10 13 12 8
LLS-WTI 21 20 11 4 1 6 2 1 1 0 3 2 1Brent-LLS 1 -2 -2 0 5 4 6 6 10 15 20 25 30
LLS-Maya 17 11 7 11 8 15 8 8 7 5 5 6 7WTI-WCS 27 27 17 23 27 21 16 14 13 15 15 16 14Brent-WCS 49 45 26 27 33 30 24 21 24 30 38 43 45
Brent 110 113 103 112 105 108 109 111 108 105 95 95 95LLS 110 114 105 110 100 105 103 105 98 90 75 70 65WTI 88 94 94 106 99 99 101 104 97 90 72 68 64Maya 93 103 98 99 92 90 95 97 91 85 70 64 58WCS 61 67 77 83 72 79 85 90 84 75 57 52 50
* *
Source: Bloomberg, Citi Research * Note that in 4Q’13, though Brent-LLS averaged $5, the peak was as much as $14-15;
In 4Q’14, Brent-LLS could average $8, but at times widen to $10-15 or more.

4Q'12 1Q'13 2Q'13 3Q'13 4Q'13 1Q'14 2Q'14 3Q'14 4Q'14 2015 2016 2017 2018WCS Cushing-WCS 17 16 8 10 15 11 10 7 7 10 7 7 7Maya-WCS Cushing 15 19 13 6 5 0 0 0 0 0 3 2 1Maya-WCS 32 36 21 16 20 11 10 7 7 10 10 9 8
LLS-WTI 21 20 11 4 1 6 2 1 1 0 3 2 1Brent-LLS 1 -2 -2 0 5 4 4 3 8 6 6 6 4
LLS-Maya 17 11 7 11 8 15 8 8 7 7 7 7 8WTI-WCS 27 27 17 23 27 21 16 14 13 17 14 14 15Brent-WCS 49 45 26 27 33 30 22 18 22 23 23 22 20
Brent 110 113 103 112 105 108 109 111 108 105 95 90 90LLS 110 114 105 110 100 105 105 108 100 100 89 84 86WTI 88 94 94 106 99 99 103 107 99 100 86 82 85Maya 93 103 98 99 92 90 97 100 93 93 82 77 78WCS 61 67 77 83 72 79 87 93 86 83 72 68 70
Base: some exports, outlets, but lag behind production growth
59
Source: Bloomberg, Citi Research * Note that in 4Q’13, though Brent-LLS averaged $5, the peak was as much as $14-15;
In 4Q’14, Brent-LLS could average $8, but at times widen to $10-15 or more.
* *

If exports are allowed in 2015…
60
4Q'12 1Q'13 2Q'13 3Q'13 4Q'13 1Q'14 2Q'14 3Q'14 4Q'14 2015 2016 2017 2018WCS Cushing-WCS 17 16 8 10 15 11 10 7 7 10 7 7 7Maya-WCS Cushing 15 19 13 6 5 0 0 0 0 0 3 2 1Maya-WCS 32 36 21 16 20 11 10 7 7 10 10 9 8
LLS-WTI 21 20 11 4 1 6 2 1 1 0 3 2 1Brent-LLS 1 -2 -2 0 5 4 4 3 8 2 2 2 2
LLS-Maya 17 11 7 11 8 15 8 8 7 10 10 10 10WTI-WCS 27 27 17 23 27 21 16 14 13 20 17 17 17Brent-WCS 49 45 26 27 33 30 22 18 22 22 22 21 20
Brent 110 113 103 112 105 108 109 111 108 105 95 85 85LLS 110 114 105 110 100 105 105 108 100 103 93 83 83WTI 88 94 94 106 99 99 103 107 99 103 90 81 82Maya 93 103 98 99 92 90 97 100 93 93 83 73 73WCS 61 67 77 83 72 79 87 93 86 83 73 64 65
* *
Source: Bloomberg, Citi Research * Note that in 4Q’13, though Brent-LLS averaged $5, the peak was as much as $14-15;
In 4Q’14, Brent-LLS could average $8, but at times widen to $10-15 or more.

61
Appendix A-1
Analyst Certification The research analyst(s) primarily responsible for the preparation and content of this research report are named in bold text in the author block at the front of the product except for those sections where an analyst's name appears in bold alongside content which is attributable to that analyst. Each of these analyst(s) certify, with respect to the section(s) of the report for which they are responsible, that the views expressed therein accurately reflect their personal views about each issuer and security referenced and were prepared in an independent manner, including with respect to Citigroup Global Markets Inc and its affiliates. No part of the research analyst's compensation was, is, or will be, directly or indirectly, related to the specific recommendation(s) or view(s) expressed by that research analyst in this report. IMPORTANT DISCLOSURES Analysts' compensation is determined based upon activities and services intended to benefit the investor clients of Citigroup Global Markets Inc. and its affiliates ("the Firm"). Like all Firm employees, analysts receive compensation that is impacted by overall firm profitability which includes investment banking revenues. For important disclosures (including copies of historical disclosures) regarding the companies that are the subject of this Citi Research product ("the Product"), please contact Citi Research, 388 Greenwich Street, 28th Floor, New York, NY, 10013, Attention: Legal/Compliance [E6WYB6412478]. In addition, the same important disclosures, with the exception of the Valuation and Risk assessments and historical disclosures, are contained on the Firm's disclosure website at https://www.citivelocity.com/cvr/eppublic/citi_research_disclosures. Valuation and Risk assessments can be found in the text of the most recent research note/report regarding the subject company. Historical disclosures (for up to the past three years) will be provided upon request. NON-US RESEARCH ANALYST DISCLOSURES Non-US research analysts who have prepared this report (i.e., all research analysts listed below other than those identified as employed by Citigroup Global Markets Inc.) are not registered/qualified as research analysts with FINRA. Such research analysts may not be associated persons of the member organization and therefore may not be subject to the NYSE Rule 472 and NASD Rule 2711 restrictions on communications with a subject company, public appearances and trading securities held by a research analyst account. The legal entities employing the authors of this report are listed below: Citigroup Global Markets Inc Eric G Lee OTHER DISCLOSURES
For securities recommended in the Product in which the Firm is not a market maker, the Firm is a liquidity provider in the issuers' financial instruments and may act as principal in connection with such transactions. The Firm is a regular issuer of traded financial instruments linked to securities that may have been recommended in the Product. The Firm regularly trades in the securities of the issuer(s) discussed in the Product. The Firm may engage in securities transactions in a manner inconsistent with the Product and, with respect to securities covered by the Product, will buy or sell from customers on a principal basis. Securities recommended, offered, or sold by the Firm: (i) are not insured by the Federal Deposit Insurance Corporation; (ii) are not deposits or other obligations of any insured depository institution (including Citibank); and (iii) are subject to investment risks, including the possible loss of the principal amount invested. Although information has been obtained from and is based upon sources that the Firm believes to be reliable, we do not guarantee its accuracy and it may be incomplete and condensed. Note, however, that the Firm has taken all reasonable steps to determine the accuracy and completeness of the disclosures made in the Important Disclosures section of the Product. The Firm's

62
research department has received assistance from the subject company(ies) referred to in this Product including, but not limited to, discussions with management of the subject company(ies). Firm policy prohibits research analysts from sending draft research to subject companies. However, it should be presumed that the author of the Product has had discussions with the subject company to ensure factual accuracy prior to publication. All opinions, projections and estimates constitute the judgment of the author as of the date of the Product and these, plus any other information contained in the Product, are subject to change without notice. Prices and availability of financial instruments also are subject to change without notice. Notwithstanding other departments within the Firm advising the companies discussed in this Product, information obtained in such role is not used in the preparation of the Product. Although Citi Research does not set a predetermined frequency for publication, if the Product is a fundamental research report, it is the intention of Citi Research to provide research coverage of the/those issuer(s) mentioned therein, including in response to news affecting this issuer, subject to applicable quiet periods and capacity constraints. The Product is for informational purposes only and is not intended as an offer or solicitation for the purchase or sale of a security. Any decision to purchase securities mentioned in the Product must take into account existing public information on such security or any registered prospectus. Investing in non-U.S. securities, including ADRs, may entail certain risks. The securities of non-U.S. issuers may not be registered with, nor be subject to the reporting requirements of the U.S. Securities and Exchange Commission. There may be limited information available on foreign securities. Foreign companies are generally not subject to uniform audit and reporting standards, practices and requirements comparable to those in the U.S. Securities of some foreign companies may be less liquid and their prices more volatile than securities of comparable U.S. companies. In addition, exchange rate movements may have an adverse effect on the value of an investment in a foreign stock and its corresponding dividend payment for U.S. investors. Net dividends to ADR investors are estimated, using withholding tax rates conventions, deemed accurate, but investors are urged to consult their tax advisor for exact dividend computations. Investors who have received the Product from the Firm may be prohibited in certain states or other jurisdictions from purchasing securities mentioned in the Product from the Firm. Please ask your Financial Consultant for additional details. Citigroup Global Markets Inc. takes responsibility for the Product in the United States. Any orders by US investors resulting from the information contained in the Product may be placed only through Citigroup Global Markets Inc. Important Disclosures for Bell Potter Customers: Bell Potter is making this Product available to its clients pursuant to an agreement with Citigroup Global Markets Australia Pty Limited. Neither Citigroup Global Markets Australia Pty Limited nor any of its affiliates has made any determination as to the suitability of the information provided herein and clients should consult with their Bell Potter financial advisor before making any investment decision. The Citigroup legal entity that takes responsibility for the production of the Product is the legal entity which the first named author is employed by. The Product is made available in Australia through Citigroup Global Markets Australia Pty Limited. (ABN 64 003 114 832 and AFSL No. 240992), participant of the ASX Group and regulated by the Australian Securities & Investments Commission. Citigroup Centre, 2 Park Street, Sydney, NSW 2000. The Product is made available in Australia to Private Banking wholesale clients through Citigroup Pty Limited (ABN 88 004 325 080 and AFSL 238098). Citigroup Pty Limited provides all financial product advice to Australian Private Banking wholesale clients through bankers and relationship managers. If there is any doubt about the suitability of investments held in Citigroup Private Bank accounts, investors should contact the Citigroup Private Bank in Australia. Citigroup companies may compensate affiliates and their representatives for providing products and services to clients. The Product is made available in Brazil by Citigroup Global Markets Brasil - CCTVM SA, which is regulated by CVM - Comissão de Valores Mobiliários, BACEN - Brazilian Central Bank, APIMEC - Associação dos Analistas e Profissionais de Investimento do Mercado de Capitais and ANBID - Associação Nacional dos Bancos de Investimento. Av. Paulista, 1111 - 11º andar - CEP. 01311920 - São Paulo - SP. If the Product is being made available in certain provinces of Canada by Citigroup Global Markets (Canada) Inc. ("CGM Canada"), CGM Canada has approved the Product. Citigroup Place, 123 Front Street West, Suite 1100, Toronto, Ontario M5J 2M3. This product is available in Chile through Banchile Corredores de Bolsa S.A., an indirect subsidiary of Citigroup Inc., which is regulated by the Superintendencia de Valores y Seguros. Agustinas 975, piso 2, Santiago, Chile. The Product is distributed in Germany by Citigroup Global Markets Deutschland AG ("CGMD"), which is regulated by Bundesanstalt fuer Finanzdienstleistungsaufsicht (BaFin). CGMD, Reuterweg 16, 60323 Frankfurt am Main. Research which relates to "securities" (as defined in the Securities and Futures Ordinance (Cap. 571 of the Laws of Hong Kong)) is issued in Hong Kong by, or on behalf of, Citigroup Global Markets Asia Limited which takes full responsibility for its content. Citigroup Global Markets Asia Ltd. is regulated by Hong Kong Securities and Futures Commission. If the Research is made available through Citibank, N.A., Hong Kong Branch, for its clients in Citi Private Bank, it is made available by Citibank N.A., Citibank Tower, Citibank Plaza, 3 Garden Road, Hong Kong. Citibank N.A. is regulated by the Hong Kong Monetary Authority. Please contact your Private Banker in Citibank N.A., Hong Kong, Branch if you have any queries on or any matters arising from or in connection with this

63
document. The Product is made available in India by Citigroup Global Markets India Private Limited, which is regulated by Securities and Exchange Board of India. FIFC, 1202, 14th Floor, G-Block, BKC, Bandra East, Mumbai - 400051. The Product is made available in Indonesia through PT Citigroup Securities Indonesia. 5/F, Citibank Tower, Bapindo Plaza, Jl. Jend. Sudirman Kav. 54-55, Jakarta 12190. Neither this Product nor any copy hereof may be distributed in Indonesia or to any Indonesian citizens wherever they are domiciled or to Indonesian residents except in compliance with applicable capital market laws and regulations. This Product is not an offer of securities in Indonesia. The securities referred to in this Product have not been registered with the Capital Market and Financial Institutions Supervisory Agency (BAPEPAM-LK) pursuant to relevant capital market laws and regulations, and may not be offered or sold within the territory of the Republic of Indonesia or to Indonesian citizens through a public offering or in circumstances which constitute an offer within the meaning of the Indonesian capital market laws and regulations. The Product is made available in Israel through Citibank NA, regulated by the Bank of Israel and the Israeli Securities Authority. Citibank, N.A, Platinum Building, 21 Ha'arba'ah St, Tel Aviv, Israel. The Product is made available in Italy by Citigroup Global Markets Limited, which is authorised by the PRA and regulated by the FCA and the PRA. Via dei Mercanti, 12, Milan, 20121, Italy. The Product is made available in Japan by Citigroup Global Markets Japan Inc. ("CGMJ"), which is regulated by Financial Services Agency, Securities and Exchange Surveillance Commission, Japan Securities Dealers Association, Tokyo Stock Exchange and Osaka Securities Exchange. Shin-Marunouchi Building, 1-5-1 Marunouchi, Chiyoda-ku, Tokyo 100-6520 Japan. If the Product was distributed by SMBC Nikko Securities Inc. it is being so distributed under license. In the event that an error is found in an CGMJ research report, a revised version will be posted on the Firm's Citi Velocity website. If you have questions regarding Citi Velocity, please call (81 3) 6270-3019 for help. The Product is made available in Korea by Citigroup Global Markets Korea Securities Ltd., which is regulated by the Financial Services Commission, the Financial Supervisory Service and the Korea Financial Investment Association (KOFIA). Citibank Building, 39 Da-dong, Jung-gu, Seoul 100-180, Korea. KOFIA makes available registration information of research analysts on its website. Please visit the following website if you wish to find KOFIA registration information on research analysts of Citigroup Global Markets Korea Securities Ltd. http://dis.kofia.or.kr/fs/dis2/fundMgr/DISFundMgrAnalystPop.jsp?companyCd2=A03030&pageDiv=02. The Product is made available in Korea by Citibank Korea Inc., which is regulated by the Financial Services Commission and the Financial Supervisory Service. Address is Citibank Building, 39 Da-dong, Jung-gu, Seoul 100-180, Korea. The Product is made available in Malaysia by Citigroup Global Markets Malaysia Sdn Bhd (Company No. 460819-D) (“CGMM”) to its clients and CGMM takes responsibility for its contents. CGMM is regulated by the Securities Commission of Malaysia. Please contact CGMM at Level 43 Menara Citibank, 165 Jalan Ampang, 50450 Kuala Lumpur, Malaysia in respect of any matters arising from, or in connection with, the Product. The Product is made available in Mexico by Acciones y Valores Banamex, S.A. De C. V., Casa de Bolsa, Integrante del Grupo Financiero Banamex ("Accival") which is a wholly owned subsidiary of Citigroup Inc. and is regulated by Comision Nacional Bancaria y de Valores. Reforma 398, Col. Juarez, 06600 Mexico, D.F. In New Zealand the Product is made available to ‘wholesale clients’ only as defined by s5C(1) of the Financial Advisers Act 2008 (‘FAA’) through Citigroup Global Markets Australia Pty Ltd (ABN 64 003 114 832 and AFSL No. 240992), an overseas financial adviser as defined by the FAA, participant of the ASX Group and regulated by the Australian Securities & Investments Commission. Citigroup Centre, 2 Park Street, Sydney, NSW 2000. The Product is made available in Pakistan by Citibank N.A. Pakistan branch, which is regulated by the State Bank of Pakistan and Securities Exchange Commission, Pakistan. AWT Plaza, 1.1. Chundrigar Road, P.O. Box 4889, Karachi-74200. The Product is made available in the Philippines through Citicorp Financial Services and Insurance Brokerage Philippines, Inc., which is regulated by the Philippines Securities and Exchange Commission. 20th Floor Citibank Square Bldg. The Product is made available in the Philippines through Citibank NA Philippines branch, Citibank Tower, 8741 Paseo De Roxas, Makati City, Manila. Citibank NA Philippines NA is regulated by The Bangko Sentral ng Pilipinas. The Product is made available in Poland by Dom Maklerski Banku Handlowego SA an indirect subsidiary of Citigroup Inc., which is regulated by Komisja Nadzoru Finansowego. Dom Maklerski Banku Handlowego S.A. ul.Senatorska 16, 00-923 Warszawa. The Product is made available in the Russian Federation through ZAO Citibank, which is licensed to carry out banking activities in the Russian Federation in accordance with the general banking license issued by the Central Bank of the Russian Federation and brokerage activities in accordance with the license issued by the Federal Service for Financial Markets. Neither the Product nor any information contained in the Product shall be considered as advertising the securities mentioned in this report within the territory of the Russian Federation or outside the Russian Federation. The Product does not constitute an appraisal within the meaning of the Federal Law of the Russian Federation of 29 July 1998 No. 135-FZ (as amended) On Appraisal Activities in the Russian Federation. 8-10 Gasheka Street, 125047 Moscow. The Product is made available in Singapore through Citigroup Global Markets Singapore Pte. Ltd. (“CGMSPL”), a capital markets services license holder, and regulated by Monetary Authority of Singapore. Please contact CGMSPL at 8 Marina View, 21st Floor Asia Square Tower 1, Singapore 018960, in respect of any matters arising from, or in connection with, the analysis of this document. This report is intended for recipients who are accredited, expert and institutional investors as defined under the Securities and Futures Act (Cap. 289). The Product is made available by The Citigroup Private Bank in Singapore through Citibank,

64
N.A., Singapore Branch, a licensed bank in Singapore that is regulated by Monetary Authority of Singapore. Please contact your Private Banker in Citibank N.A., Singapore Branch if you have any queries on or any matters arising from or in connection with this document. This report is intended for recipients who are accredited, expert and institutional investors as defined under the Securities and Futures Act (Cap. 289). This report is distributed in Singapore by Citibank Singapore Ltd ("CSL") to selected Citigold/Citigold Private Clients. CSL provides no independent research or analysis of the substance or in preparation of this report. Please contact your Citigold//Citigold Private Client Relationship Manager in CSL if you have any queries on or any matters arising from or in connection with this report. This report is intended for recipients who are accredited investors as defined under the Securities and Futures Act (Cap. 289). Citigroup Global Markets (Pty) Ltd. is incorporated in the Republic of South Africa (company registration number 2000/025866/07) and its registered office is at 145 West Street, Sandton, 2196, Saxonwold. Citigroup Global Markets (Pty) Ltd. is regulated by JSE Securities Exchange South Africa, South African Reserve Bank and the Financial Services Board. The investments and services contained herein are not available to private customers in South Africa. The Product is made available in the Republic of China through Citigroup Global Markets Taiwan Securities Company Ltd. ("CGMTS"), 14 and 15F, No. 1, Songzhi Road, Taipei 110, Taiwan and/or through Citibank Securities (Taiwan) Company Limited ("CSTL"), 14 and 15F, No. 1, Songzhi Road, Taipei 110, Taiwan, subject to the respective license scope of each entity and the applicable laws and regulations in the Republic of China. CGMTS and CSTL are both regulated by the Securities and Futures Bureau of the Financial Supervisory Commission of Taiwan, the Republic of China. No portion of the Product may be reproduced or quoted in the Republic of China by the press or any third parties [without the written authorization of CGMTS and CSTL]. If the Product covers securities which are not allowed to be offered or traded in the Republic of China, neither the Product nor any information contained in the Product shall be considered as advertising the securities or making recommendation of the securities in the Republic of China. The Product is for informational purposes only and is not intended as an offer or solicitation for the purchase or sale of a security or financial products. Any decision to purchase securities or financial products mentioned in the Product must take into account existing public information on such security or the financial products or any registered prospectus. The Product is made available in Thailand through Citicorp Securities (Thailand) Ltd., which is regulated by the Securities and Exchange Commission of Thailand. 399 Interchange 21 Building, 18th Floor, Sukhumvit Road, Klongtoey Nua, Wattana ,Bangkok 10110, Thailand. The Product is made available in Turkey through Citibank AS which is regulated by Capital Markets Board. Tekfen Tower, Eski Buyukdere Caddesi # 209 Kat 2B, 23294 Levent, Istanbul, Turkey. In the U.A.E, these materials (the "Materials") are communicated by Citigroup Global Markets Limited, DIFC branch ("CGML"), an entity registered in the Dubai International Financial Center ("DIFC") and licensed and regulated by the Dubai Financial Services Authority ("DFSA") to Professional Clients and Market Counterparties only and should not be relied upon or distributed to Retail Clients. A distribution of the different Citi Research ratings distribution, in percentage terms for Investments in each sector covered is made available on request. Financial products and/or services to which the Materials relate will only be made available to Professional Clients and Market Counterparties. The Product is made available in United Kingdom by Citigroup Global Markets Limited, which is authorised by the Prudential Regulation Authority (“PRA”) and regulated by the Financial Conduct Authority (“FCA”) and the PRA. This material may relate to investments or services of a person outside of the UK or to other matters which are not authorised by the PRA nor regulated by the FCA and the PRA and further details as to where this may be the case are available upon request in respect of this material. Citigroup Centre, Canada Square, Canary Wharf, London, E14 5LB. The Product is made available in United States by Citigroup Global Markets Inc, which is a member of FINRA and registered with the US Securities and Exchange Commission. 388 Greenwich Street, New York, NY 10013. Unless specified to the contrary, within EU Member States, the Product is made available by Citigroup Global Markets Limited, which is authorised by the PRA and regulated by the FCA and the PRA. Pursuant to Comissão de Valores Mobiliários Rule 483, Citi is required to disclose whether a Citi related company or business has a commercial relationship with the subject company. Considering that Citi operates multiple businesses in more than 100 countries around the world, it is likely that Citi has a commercial relationship with the subject company. Many European regulators require that a firm must establish, implement and make available a policy for managing conflicts of interest arising as a result of publication or distribution of investment research. The policy applicable to Citi Research's Products can be found at https://www.citivelocity.com/cvr/eppublic/citi_research_disclosures. Compensation of equity research analysts is determined by equity research management and Citigroup's senior management and is not linked to specific transactions or recommendations. The Product is not to be construed as providing investment services in any jurisdiction where the provision of such services would not be permitted. Subject to the nature and contents of the Product, the investments described therein are subject to fluctuations in price and/or value and investors may get back less than originally invested. Certain high-volatility investments can be subject to sudden and large falls in value that could equal or exceed the amount invested. Certain investments

65
contained in the Product may have tax implications for private customers whereby levels and basis of taxation may be subject to change. If in doubt, investors should seek advice from a tax adviser. The Product does not purport to identify the nature of the specific market or other risks associated with a particular transaction. Advice in the Product is general and should not be construed as personal advice given it has been prepared without taking account of the objectives, financial situation or needs of any particular investor. Accordingly, investors should, before acting on the advice, consider the appropriateness of the advice, having regard to their objectives, financial situation and needs. Prior to acquiring any financial product, it is the client's responsibility to obtain the relevant offer document for the product and consider it before making a decision as to whether to purchase the product. Citi Research generally disseminates its research to the Firm’s global institutional and retail clients via both proprietary (e.g., Citi Velocity and Citi Personal Wealth Management) and non-proprietary electronic distribution platforms. Certain research may be disseminated only via Citi’s proprietary distribution platforms; however such research will not contain changes to earnings forecasts, target price, investment or risk rating or investment thesis or be otherwise inconsistent with the author’s previously published research. Certain research is made available only to institutional investors to satisfy regulatory requirements. Individual Citi Research analysts may also opt to circulate published research to one or more clients by email; such email distribution is discretionary and is done only after the research has been disseminated. The level and types of services provided by Citi Research analysts to clients may vary depending on various factors such as the client’s individual preferences as to the frequency and manner of receiving communications from analysts, the client’s risk profile and investment focus and perspective (e.g. market-wide, sector specific, long term, short-term etc.), the size and scope of the overall client relationship with Citi and legal and regulatory constraints. Citi Research product may source data from dataCentral. dataCentral is a Citi Research proprietary database, which includes Citi estimates, data from company reports and feeds from Thomson Reuters. © 2014 Citigroup Global Markets Inc. Citi Research is a division of Citigroup Global Markets Inc. Citi and Citi with Arc Design are trademarks and service marks of Citigroup Inc. and its affiliates and are used and registered throughout the world. All rights reserved. Any unauthorized use, duplication, redistribution or disclosure of this report (the “Product”), including, but not limited to, redistribution of the Product by electronic mail, posting of the Product on a website or page, and/or providing to a third party a link to the Product, is prohibited by law and will result in prosecution. The information contained in the Product is intended solely for the recipient and may not be further distributed by the recipient to any third party. Where included in this report, MSCI sourced information is the exclusive property of Morgan Stanley Capital International Inc. (MSCI). Without prior written permission of MSCI, this information and any other MSCI intellectual property may not be reproduced, redisseminated or used to create any financial products, including any indices. This information is provided on an "as is" basis. The user assumes the entire risk of any use made of this information. MSCI, its affiliates and any third party involved in, or related to, computing or compiling the information hereby expressly disclaim all warranties of originality, accuracy, completeness, merchantability or fitness for a particular purpose with respect to any of this information. Without limiting any of the foregoing, in no event shall MSCI, any of its affiliates or any third party involved in, or related to, computing or compiling the information have any liability for any damages of any kind. MSCI, Morgan Stanley Capital International and the MSCI indexes are services marks of MSCI and its affiliates. The Firm accepts no liability whatsoever for the actions of third parties. The Product may provide the addresses of, or contain hyperlinks to, websites. Except to the extent to which the Product refers to website material of the Firm, the Firm has not reviewed the linked site. Equally, except to the extent to which the Product refers to website material of the Firm, the Firm takes no responsibility for, and makes no representations or warranties whatsoever as to, the data and information contained therein. Such address or hyperlink (including addresses or hyperlinks to website material of the Firm) is provided solely for your convenience and information and the content of the linked site does not in anyway form part of this document. Accessing such website or following such link through the Product or the website of the Firm shall be at your own risk and the Firm shall have no liability arising out of, or in connection with, any such referenced website. ADDITIONAL INFORMATION IS AVAILABLE UPON REQUEST