tejas network limited - hdfcsec.com network limited ipo note... · tejas network limited ......
TRANSCRIPT

IPO Note 14 June 2017
Tejas Network Limited
RETAIL RESEARCH P a g e | 1
RETAIL RESEARCH
Background & Operations: Tejas Network Ltd (TNL) is an India-based optical and data networking products company with customers in over 60 countries. It designs, develops and sells high-performance and cost-competitive products to telecommunications service providers, internet service providers, utility companies, defence companies and government entities (collectively, “Communication Service Providers”). Its products are used to build high-speed communication networks that carry voice, data and video traffic from fixed line, mobile and broadband networks over optical fibre: Its products utilise programmable software-defined hardware architecture with a common software code-base that delivers an app-like ease of development and upgrades of new features and technology standards. Currently, India is its largest geographic segment (in terms of revenue) and it is well-positioned to take advantage of the growth opportunities arising out of the Digital India and the Make-in-India programs of the Indian Government TNL has invested heavily in research and development in order to grow through multiple technology cycles and are well-positioned to capitalize on the expected growth in optical capital expenditure globally. For the year ended March 31, 2016, it was the second largest optical networking products company in terms of market share in India, with a market share of 15% in the overall optical networking market. Its current product portfolio targets access (i.e., the outer perimeter of a telecommunications network which connects to the end consumers), metro (i.e., networks that aggregate and distribute traffic collected from access networks within a large city or region) and long-haul (i.e., networks that interconnect metro networks using high bandwidth transmission) networks. As of April 30, 2017 it has filed 333 patent applications, with 203 filings in India, 89 filings in the United States and 6 filings in Europe, out of which 56 patents have been granted and has also filed 35 patent applications under the Patent Cooperation Treaty. TNL outsources most of its manufacturing to reputed electronics manufacturing services (“EMS”) companies. This allows it to stay asset-light and enables it to scale-up production without requiring a corresponding increase in capital expenditure towards its own manufacturing operations. Further, its business model with operations substantially located in India, gives significant cost advantage in research and development, product development, sales, marketing, customer support and manufacturing. Its India-based operations also allow TNL to design, develop, manufacture and sell high-performance and cost-competitive products in India and globally. It sells its products predominantly through a combination of direct sales to Communication Service Providers as well as by leveraging its strong relationships with leading global optical vendors as well as integrated solution providers as original equipment manufacturer (“OEMs”). TNL has a history of high customer retention and its top five revenue generating customers (except two customers) for each of financial years 2017, 2016 and 2015 have been continuing to use its products for over a decade. Its strategic OEM relationships enable it to gain access to their customers, especially in North America and Europe and grow international business in these geographies.
Objects of Issue: The Offer comprises the Fresh Issue and the Offer for Sale. TNL will not receive any proceeds from the Offer for Sale. The Company proposes to utilize the Net Proceeds towards funding the following objects: Capital expenditure towards payment of salaries and wages of research & development
team; Working capital requirement; and General corporate purposes.
Issue Snapshot:
Issue Open: June 14 - June 16 2017
Price Band: Rs. 250 – 257 Issue Size: 30,221,333* Equity Shares (including Fresh issue of 17,509,728 Equity Shares + Offer for sale 12,711,605 equity shares)
Offer Size: Rs.755.53 crs - 776.69 crs
QIB atleast 75% eq sh Retail upto 10% eq sh Non Institutional upto 15% eq sh
Face Value: Rs 10
Book value: Rs 70.78 (March 31, 2017) Bid size: - 55 equity shares and in multiples thereof
100% Book built Issue
Capital Structure: Pre Issue Equity: Rs. 72.04 cr Post issue Equity: Rs. 89.55 cr* Listing: BSE & NSE
Book Running Lead Manager: Axis Capital Limited, Citigroup Global Markets India Private Limited, Edelweiss Financial Services Limited, Nomura Financial Advisory and Securities (India) Private Limited
Registrar to issue: Link Intime India Pvt Ltd
Shareholding Pattern
Shareholding Pattern
Pre
issue %
Post
issue %
Public (incl institutions
& employees) 100.0 100.0
Total 100.0 100.0
*= assuming pricing at the higher end of price band Source of this note: RHP
RETAIL RESEARCH
RETAIL RESEARCH P a g e | 2
In addition, TNL expects to achieve the benefits of listing of the Equity Shares on the Stock Exchanges which will result in the enhancement of Company’s brand and creation of a public market for its Equity Shares in India.
Utilization of Net Proceeds (Rs in million) Particulars Amount
Capital expenditure towards payment of salaries and wages of research and development team 452.86
Working capital requirement 3,030.00
General corporate purposes *
Total *
Competitive Strengths: End-to-End portfolio of optical networking products positions TNL well to take advantage of the expected industry growth: Global trends such as the evolution of new high-speed internet technologies, the proliferation of affordable smart phones and smart TVs, growth in enterprise services and data centres, and increasing consumption of video content are driving rapid growth in global data consumption. These trends necessitate significant growth in optical capital expenditure by both telecommunications companies and government entities, which TNL is well placed to capitalize on. The company has an end-to-end portfolio of optical networking products for access, metro and long-haul networks and are therefore well positioned to capitalize on the expected growth in optical capital expenditure by Communication Service Providers in the private sector, government entities and Public Sector Undertakings (“PSUs”). TNL is ranked as the sixth largest supplier in the Global Optical aggregation segment, and it is growing faster than the market. TNL is able to leverage its long-standing customer relationships in India and in the international markets, as well as its strong global OEM partnerships to capitalize on the expected growth in the optical capital expenditure. Leadership in the fast growing Indian optical equipment market: In India, TNL had the second largest market share in the overall optical networking market (which included multinational competitors) during the year ended March 31, 2016. It has been consistently ranked in the top three in the last three years in terms of market share in the optical networking market. The company is benefiting from increased optical capital expenditure in India, which is driven by rapid adoption of smartphones, increased data usage and several large government initiatives aimed at increasing broadband access in the country. Government investment in the telecommunications infrastructure through projects such as the National Optical Fibre Network (“NOFN”), the National Knowledge Network (“NKN”) and Smart Cities, will provide significant business growth opportunities. In addition, it stands to benefit from Government policies such as Make in India and the Preferential Market Access (“PMA”) Policy, which are targeted towards encouraging indigenous technology/product development and manufacturing TNL has an established local presence in India with four sales offices and 15 support centres around the country, which enable it to provide high quality customer support. Its products have been deployed by leading telecommunications operators in India, such as Bharti Airtel Limited, Tata Communications, Aircel Limited and Bharat Sanchar Nigam Limited, with whom it has long-standing customer relationships. Further, the optical and data networking products business is characterized by a high-entry barrier because of the initial investment required in research and development, demand for skilled professionals across multiple domains and the up-front time taken to successfully develop the networking products and solutions. Due to its extensive history of operations in India and incumbency with key customers, it stands to benefit from the high entry barrier against domestic competition. Track record and culture of innovation leading to product and technology leadership: TNL has made consistent investments in research and development over the years, primarily in relation to optical networking products. For Fiscal Years 2017, 2016 and 2015, its gross research and development expenses amounted to Rs.730.17 million, Rs.644.21 million and Rs.489.58 million respectively. Out of these amounts, in line with its accounting policies, it capitalized Rs.400.91 million, Rs.346.81 million and Rs.323.34 million. As of May 15, 2017 approximately 51.57% of its employees work in research and development functions. It is a differentiated technology company and has demonstrated the ability to keep pace across technology cycles (from 2G to 3G to 4G) because of its early research and development efforts. It has consistently upgraded or launched new products in anticipation of changing technologies, adoption of faster speed networks and transformation from legacy to new generation networks. TNL endeavours to design its products to ensure they are “future ready”, by using programmable software defined hardware architecture which enables it to adapt to changes in technologies, new standards and customer requirements. In addition, it is tracking and driving emerging international standards in 5G and optical networking through leadership in the Telecommunications Standards Development Society, India (“TSDSI”). TNL is an active member of TSDSI and regularly contribute by participating and leading technical working groups in the wireless and optical domains. Software-defined hardware with ease of use: TNL products are characterized by flexible architecture based around a proprietary software base and a common hardware platform. It has a portfolio of re-usable “building blocks” of hardware as well as software, which enables it to develop cost-effective and highly customizable products and also provides a time-to-market advantage. TNL is able to help Communication

RETAIL RESEARCH
RETAIL RESEARCH P a g e | 3
Service Providers manage costs by enabling them to extend the life of installed systems through regular software upgrades which help them transition across technology changes in their networks, without having to invest in new hardware purchases. Its software led approach also enables it to sell the same product globally by making country specific adaptations. Scalable, re-programmable and re-usable products allow reduction in total cost of ownership for TNL’s customers and improve the overall efficiencies of their network and operations. Cost and capital efficient business model: TNL’s business model is based on locating substantially all of its operations in India, except for international sales and support, which results in significantly lower operating expenses as compared to its global competitors. Further, since all its research and development is based in India, it is able to develop state-of-the-art products and is able to generate significantly better returns on its research and development investments, by leveraging the availability of qualified and cost-effective engineering talent in India. It has an in-house manufacturing facility focused on final integration, testing and quality control in order to ensure only high quality products are delivered to its customers. Further, TNL hasan experienced sales and customer support team. For its international sales, it leverages its partnerships with leading global optical and integrated systems vendors as OEMs to sell in the global markets. This allows it to keep its sales costs low while selling to the OEMs' customers that may otherwise not be accessible to it. Long standing customer relationships with strong repeat business: TNL’s end-to-end product portfolio has helped it forge strong relationships with its major clients. It sells its products predominantly through a combination of direct sales to Communication Service Providers as well as by leveraging its strong relationships with OEMs. Its products have been deployed by leading telecommunications companies and it also has PSUs, who offer telecommunication services, as its clients. In addition, the company has utility companies such as railways, electricity and oil and gas companies as its clients, who use its products to build optical communication networks for their internal use to reliably carry monitoring and control traffic from/to their field systems over long distances. TNL has a history of high client retention from both private and public sector clients and derive a significant proportion of its revenues from repeat business (defined as repeat business generated from a customer in the past five financial years) built on its successful execution of prior engagements. In Financial Years 2015, 2016 and 2017, it generated 94.06%, 96.16% and 88.47%, respectively, of its revenue from operations (net) from existing clients. In addition, its top five revenue generating customers (except two customers) for each of the financial years 2017, 2016 and 2015 have been continuing to use its products for over a decade. It has also increased the product portfolio provided to its clients over periods of time. For instance, it introduced GPON products in 2016. While its sales and account managers assist its clients in day-to-day account management, members of its technology team also help manage strategic client accounts. These relationships has helped to better understand its clients' business needs and enabled it to provide effective solutions to meet these needs. Strong professionally managed team with significant industry experience: TNL has a strong and experienced management team which provides with a competitive advantage. Its key management personnel comprising its Chief Executive Officer, Chief Technology Officer and President - Optical Products have advanced degrees in engineering from its universities and have an average of over 25 years of global experience. It has built its leadership team to include personnel with experience in optical communication systems, networking protocols, FPGA design, embedded system software, application software, high-speed PCB design, thermal and mechanical design, product management, quality and test engineering and reliability engineering- working both in India as well as internationally. Business Strategy: Continue investments in innovations focused on the high growth optical networking segments: TNL has an end-to-end portfolio of networking products for access, metro and long-haul networks. It aims to continue investing in research and development and expand its product portfolio with a particular focus on the high growth segments of the optical communications market. It also intends to continue its investments in the above segments and develop new products such as CPO, PTN and DWDM products with 100 Gbps/200 Gbps/400 Gbps interfaces, CPO and DWDM products with ROADM functionalities and OTN switches, which will strengthen its solutions in these segments. It intends to leverage its re-usable hardware and software building blocks to shorten its product development cycles. Expand into newer and adjacent product areas: TNL intends to expand its product portfolio into new and adjacent product areas which serve the requirements of its existing and targeted customer base. It intends to leverage its incumbency and relationships in the Indian market as well as with customers in other international markets to sell from its expanded product portfolio. In addition, it also aims to sell its new products to new customers (such as its LTE products to fixed wireless operators and Ethernet switches to large enterprises for their campus switch requirements). It intends to leverage its incumbency and relationships in the Indian market as well as with customers in other international markets to sell from its expanded product portfolio. In addition, it also aims to sell its new products to new customers (such as its LTE products to fixed wireless operators and Ethernet switches to large enterprises for their campus switch requirements). Continue to strengthen leadership position in India: TNL has a strong incumbent advantage in India and it will continue to invest in sales efforts to increase its market share in the expanding Indian market. In relation to private Communications Service Providers, TNL intends to leverage its relationships across customer organizations (from the senior management down to the operations teams) to capture a larger portion of their optical and data networking spend. It also intends to sell add-on upgrades on its existing deployed products, based on
RETAIL RESEARCH
RETAIL RESEARCH P a g e | 4
existing as well as new technologies. Further, it aims to win repeat business from its customers as they increase their overall expenditure to expand their optical network footprint and upgrade their network capacities for higher data traffic. It intends to utilize the benefits of PMA policy to gain a large share of government procurements in the telecommunication sector and build on successful track record in executing projects for PSU customers to get repeat business. Further, it is also expanding its product portfolio to meet the technical requirements of large upcoming government projects. Lastly, TNL expects to benefit from government projects (such as Smart City, NOFN, NFS, NKN, Digital India and Make in India) that will require significant capital expenditure by the Government.
Expand global sales network in emerging and selected developed markets: TNL intends to build customer relationships both in high-growth emerging markets as well as in certain developed countries, where it has a significant advantage compared to its competitors. Accordingly, it aims to strengthen sales operations in these geographies, by adding more sales and customer support personnel, leveraging its existing customer relationships and market position to capture larger proportion of customer spend and increasing direct sales focus on new countries in emerging markets. Further, it expect to benefit from the Government of India's focus on promotion of telecom project exports to SE Asia and African countries. In relation to developed markets, it intends to expand its existing OEM relationships with Ciena Corporation, NEC Corporation and RAD Data Communications Ltd and also explore other potential partnerships. TNL provides complementary products to its OEM partners, who in turn integrate its products with their own product offerings, to provide a comprehensive solution to their service provider relationships Furthermore, TNL intends to increase its international sales and market share by leveraging the efforts of the Telecom Export Promotion Council (“TEPC”) and by becoming a part of large telecom export projects that the Government of India may secure using government-to-government line of credit and sovereign loans from EXIM Bank of India.
Industry: Overview of a telecommunications network Telecommunication networks are built by broadly two types of entities: telecommunications carriers and enterprises. Telecommunications carriers that build telecommunications networks include: communications service providers (“CSPs”), carrier-neutral providers (“CNPs”) and internet content providers (“ICPs”). Fixed CSPs are companies or business units within companies engaged in the provision of telecommunications services delivered over a largely wire- or fibre-based network. Mobile CSPs are companies or business units within companies engaged in the provision of telecommunications services delivered over a largely wireless network, commonly known as “cellular” carriers in some regions. CNPs are companies with data centre, fibre and/or cell tower networks that sell or rent capacity or services to CSPs, ICPs and other providers. (Source: Optical Networks Forecast Report: 2015–20 published in February 2016 by Ovum) ICPs are companies whose primary business is the creation, storage and dissemination of digital information. Enterprises use active network equipment (such as routers and switches), communication devices (such as desk phones and audio/video conferencing systems) and structured cabling systems (such as optical fibre cables), across wired and wireless local area network (“LAN”). Ethernet is a popular networking LAN technology utilised by enterprises. Ethernet-based LAN equipment are further categorised into switches and routers. A typical telecommunications network comprises passive infrastructure (such as telecommunications towers and cables), active infrastructure (such as wireless switches, controllers and gateway equipment, as well as wireline optical transmission equipment) and user equipment (such as smart phones, tablets and laptops, used by end users to access telecommunications networks). According to Ovum, in 2015, telecommunications expenditure by CSPs accounted for over 80% of the global capital expenditure in optical networking industry. During the first quarter of 2016, the annualised global capital expenditure by CSPs amounted to approximately US$ 343 billion. A telecommunications network typically comprises access, metro and long-haul networks Access network An access network is a wireless or a wireline network on the outer perimeter of a telecommunications network, connecting a residential or a business premise to the service provider's network. Whilst traditionally copper cables were used in the access network, with increasing data speed, the current trend is to use optical fibre. Metro network A metro network aggregates and distributes traffic collected from numerous access networks. A network of a city or a state (where distances are less than 1,000 km) can typically be categorised as a metro network. Long-haul network A long-haul or a core network interconnects metro networks using high bandwidth transmission media and is typically used for transmissions over very long distances, such as between cities or from coast to coast, often exceeding 1,000 km in total transmission length Trends driving data consumption in telecommunications networks globally
RETAIL RESEARCH
RETAIL RESEARCH P a g e | 5
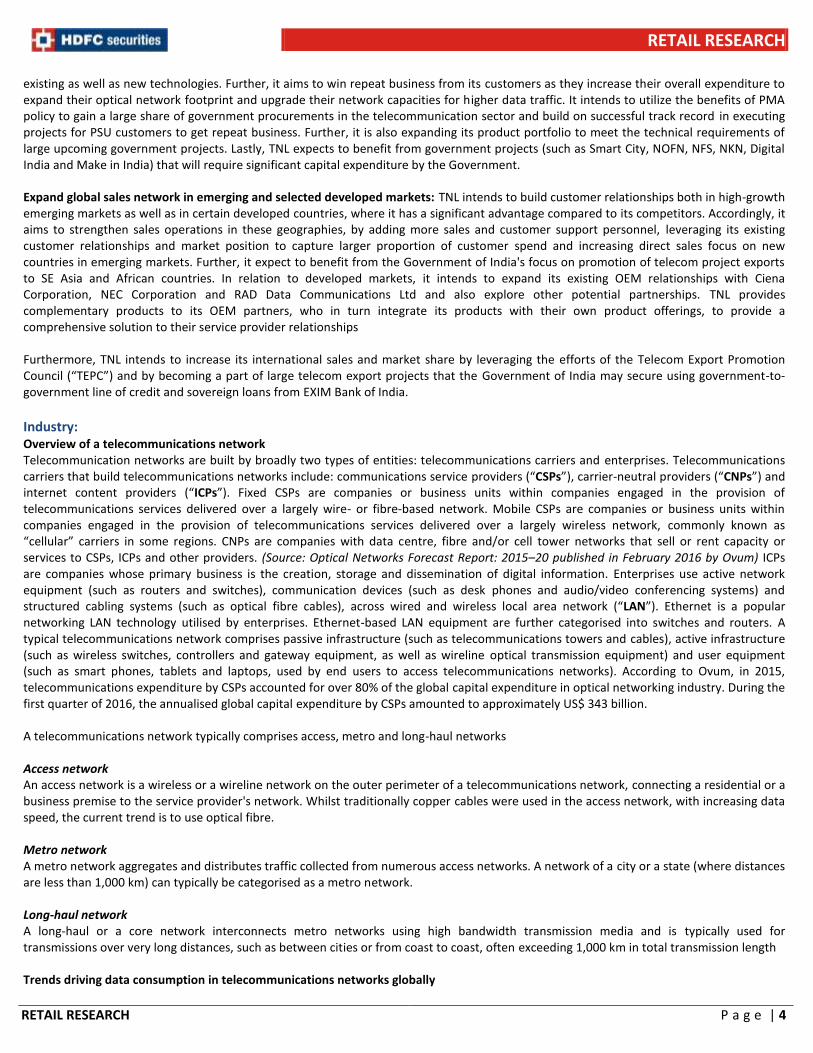
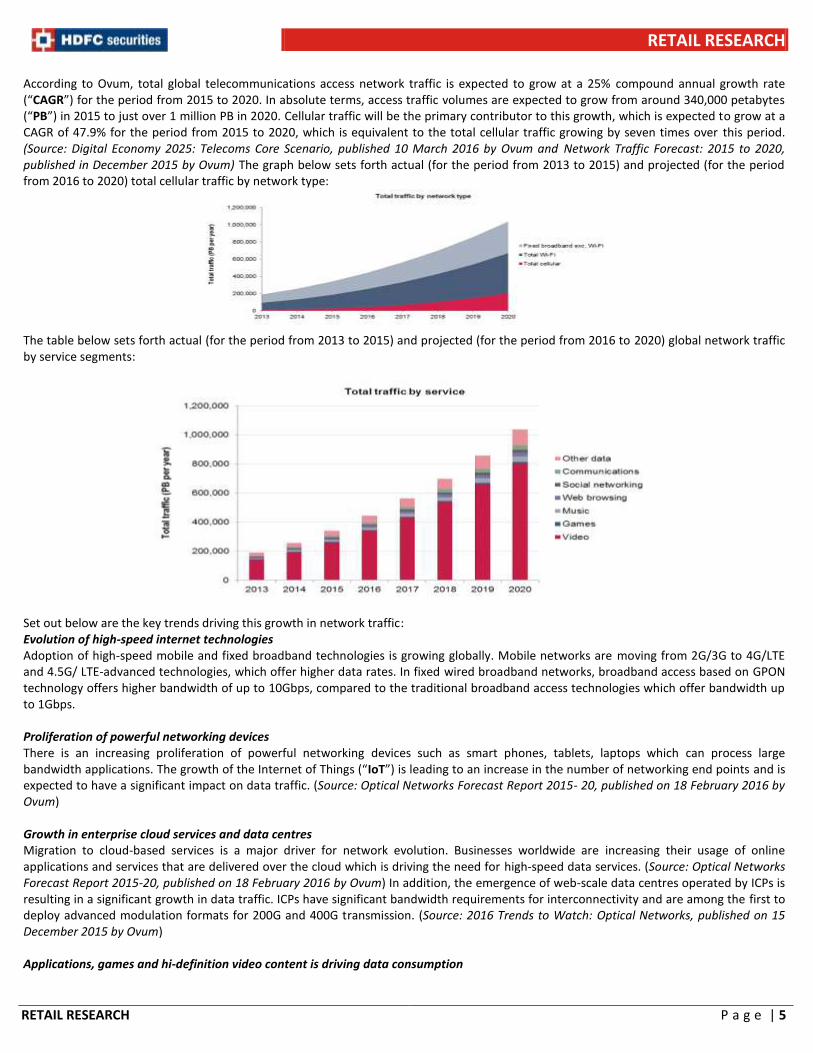
According to Ovum, total global telecommunications access network traffic is expected to grow at a 25% compound annual growth rate (“CAGR”) for the period from 2015 to 2020. In absolute terms, access traffic volumes are expected to grow from around 340,000 petabytes (“PB”) in 2015 to just over 1 million PB in 2020. Cellular traffic will be the primary contributor to this growth, which is expected to grow at a CAGR of 47.9% for the period from 2015 to 2020, which is equivalent to the total cellular traffic growing by seven times over this period. (Source: Digital Economy 2025: Telecoms Core Scenario, published 10 March 2016 by Ovum and Network Traffic Forecast: 2015 to 2020, published in December 2015 by Ovum) The graph below sets forth actual (for the period from 2013 to 2015) and projected (for the period from 2016 to 2020) total cellular traffic by network type:
The table below sets forth actual (for the period from 2013 to 2015) and projected (for the period from 2016 to 2020) global network traffic by service segments:
Set out below are the key trends driving this growth in network traffic: Evolution of high-speed internet technologies Adoption of high-speed mobile and fixed broadband technologies is growing globally. Mobile networks are moving from 2G/3G to 4G/LTE and 4.5G/ LTE-advanced technologies, which offer higher data rates. In fixed wired broadband networks, broadband access based on GPON technology offers higher bandwidth of up to 10Gbps, compared to the traditional broadband access technologies which offer bandwidth up to 1Gbps. Proliferation of powerful networking devices There is an increasing proliferation of powerful networking devices such as smart phones, tablets, laptops which can process large bandwidth applications. The growth of the Internet of Things (“IoT”) is leading to an increase in the number of networking end points and is expected to have a significant impact on data traffic. (Source: Optical Networks Forecast Report 2015- 20, published on 18 February 2016 by Ovum) Growth in enterprise cloud services and data centres Migration to cloud-based services is a major driver for network evolution. Businesses worldwide are increasing their usage of online applications and services that are delivered over the cloud which is driving the need for high-speed data services. (Source: Optical Networks Forecast Report 2015-20, published on 18 February 2016 by Ovum) In addition, the emergence of web-scale data centres operated by ICPs is resulting in a significant growth in data traffic. ICPs have significant bandwidth requirements for interconnectivity and are among the first to deploy advanced modulation formats for 200G and 400G transmission. (Source: 2016 Trends to Watch: Optical Networks, published on 15 December 2015 by Ovum) Applications, games and hi-definition video content is driving data consumption
RETAIL RESEARCH
RETAIL RESEARCH P a g e | 6
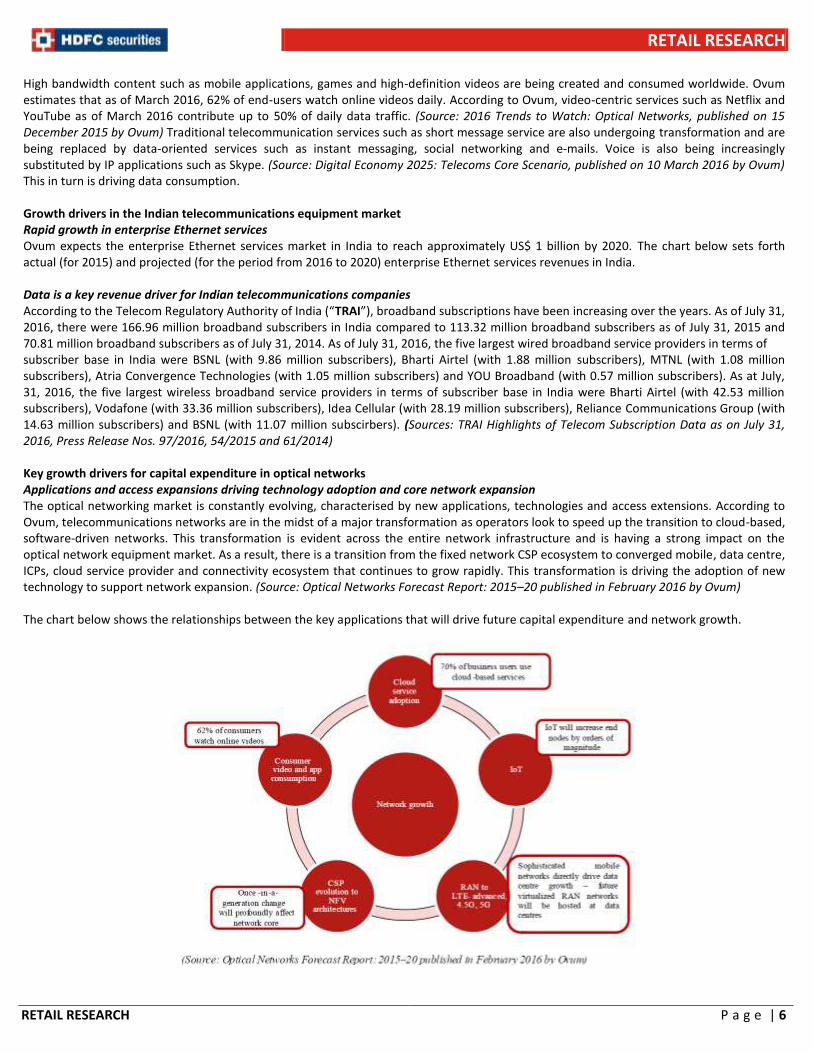
High bandwidth content such as mobile applications, games and high-definition videos are being created and consumed worldwide. Ovum estimates that as of March 2016, 62% of end-users watch online videos daily. According to Ovum, video-centric services such as Netflix and YouTube as of March 2016 contribute up to 50% of daily data traffic. (Source: 2016 Trends to Watch: Optical Networks, published on 15 December 2015 by Ovum) Traditional telecommunication services such as short message service are also undergoing transformation and are being replaced by data-oriented services such as instant messaging, social networking and e-mails. Voice is also being increasingly substituted by IP applications such as Skype. (Source: Digital Economy 2025: Telecoms Core Scenario, published on 10 March 2016 by Ovum) This in turn is driving data consumption. Growth drivers in the Indian telecommunications equipment market Rapid growth in enterprise Ethernet services Ovum expects the enterprise Ethernet services market in India to reach approximately US$ 1 billion by 2020. The chart below sets forth actual (for 2015) and projected (for the period from 2016 to 2020) enterprise Ethernet services revenues in India. Data is a key revenue driver for Indian telecommunications companies According to the Telecom Regulatory Authority of India (“TRAI”), broadband subscriptions have been increasing over the years. As of July 31, 2016, there were 166.96 million broadband subscribers in India compared to 113.32 million broadband subscribers as of July 31, 2015 and 70.81 million broadband subscribers as of July 31, 2014. As of July 31, 2016, the five largest wired broadband service providers in terms of subscriber base in India were BSNL (with 9.86 million subscribers), Bharti Airtel (with 1.88 million subscribers), MTNL (with 1.08 million subscribers), Atria Convergence Technologies (with 1.05 million subscribers) and YOU Broadband (with 0.57 million subscribers). As at July, 31, 2016, the five largest wireless broadband service providers in terms of subscriber base in India were Bharti Airtel (with 42.53 million subscribers), Vodafone (with 33.36 million subscribers), Idea Cellular (with 28.19 million subscribers), Reliance Communications Group (with 14.63 million subscribers) and BSNL (with 11.07 million subscirbers). (Sources: TRAI Highlights of Telecom Subscription Data as on July 31, 2016, Press Release Nos. 97/2016, 54/2015 and 61/2014) Key growth drivers for capital expenditure in optical networks Applications and access expansions driving technology adoption and core network expansion The optical networking market is constantly evolving, characterised by new applications, technologies and access extensions. According to Ovum, telecommunications networks are in the midst of a major transformation as operators look to speed up the transition to cloud-based, software-driven networks. This transformation is evident across the entire network infrastructure and is having a strong impact on the optical network equipment market. As a result, there is a transition from the fixed network CSP ecosystem to converged mobile, data centre, ICPs, cloud service provider and connectivity ecosystem that continues to grow rapidly. This transformation is driving the adoption of new technology to support network expansion. (Source: Optical Networks Forecast Report: 2015–20 published in February 2016 by Ovum) The chart below shows the relationships between the key applications that will drive future capital expenditure and network growth.
RETAIL RESEARCH
RETAIL RESEARCH P a g e | 7
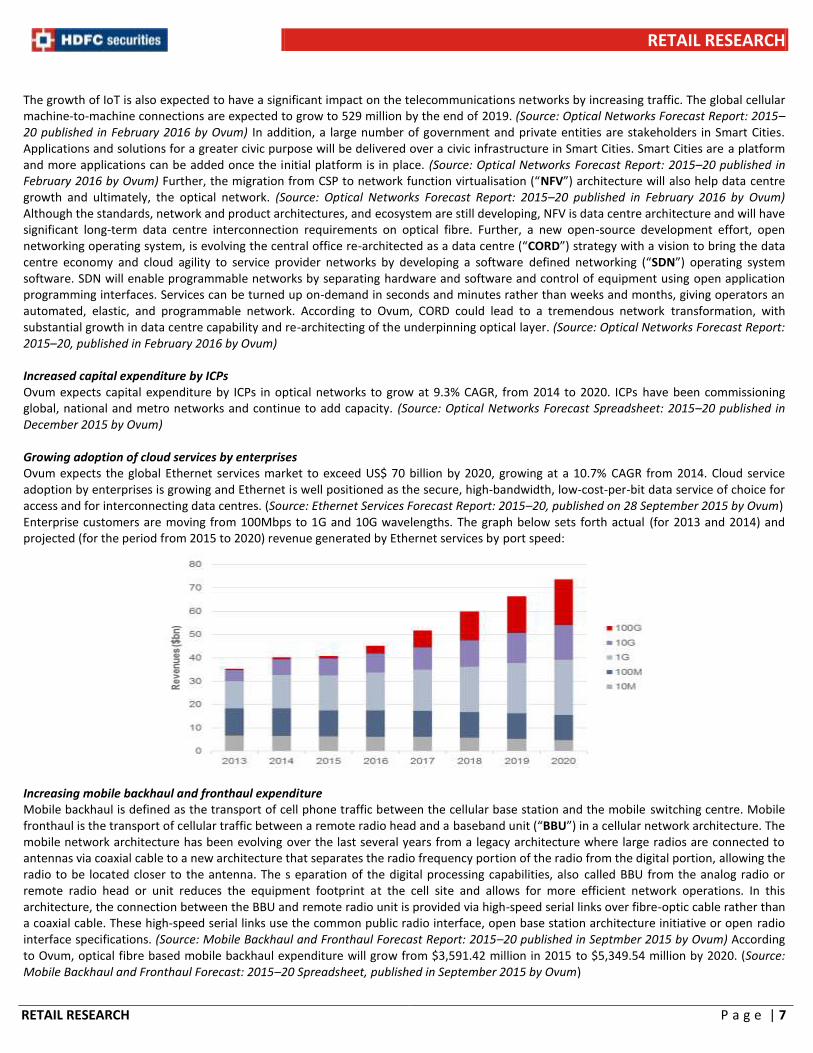
The growth of IoT is also expected to have a significant impact on the telecommunications networks by increasing traffic. The global cellular machine-to-machine connections are expected to grow to 529 million by the end of 2019. (Source: Optical Networks Forecast Report: 2015–20 published in February 2016 by Ovum) In addition, a large number of government and private entities are stakeholders in Smart Cities. Applications and solutions for a greater civic purpose will be delivered over a civic infrastructure in Smart Cities. Smart Cities are a platform and more applications can be added once the initial platform is in place. (Source: Optical Networks Forecast Report: 2015–20 published in February 2016 by Ovum) Further, the migration from CSP to network function virtualisation (“NFV”) architecture will also help data centre growth and ultimately, the optical network. (Source: Optical Networks Forecast Report: 2015–20 published in February 2016 by Ovum) Although the standards, network and product architectures, and ecosystem are still developing, NFV is data centre architecture and will have significant long-term data centre interconnection requirements on optical fibre. Further, a new open-source development effort, open networking operating system, is evolving the central office re-architected as a data centre (“CORD”) strategy with a vision to bring the data centre economy and cloud agility to service provider networks by developing a software defined networking (“SDN”) operating system software. SDN will enable programmable networks by separating hardware and software and control of equipment using open application programming interfaces. Services can be turned up on-demand in seconds and minutes rather than weeks and months, giving operators an automated, elastic, and programmable network. According to Ovum, CORD could lead to a tremendous network transformation, with substantial growth in data centre capability and re-architecting of the underpinning optical layer. (Source: Optical Networks Forecast Report: 2015–20, published in February 2016 by Ovum) Increased capital expenditure by ICPs Ovum expects capital expenditure by ICPs in optical networks to grow at 9.3% CAGR, from 2014 to 2020. ICPs have been commissioning global, national and metro networks and continue to add capacity. (Source: Optical Networks Forecast Spreadsheet: 2015–20 published in December 2015 by Ovum) Growing adoption of cloud services by enterprises Ovum expects the global Ethernet services market to exceed US$ 70 billion by 2020, growing at a 10.7% CAGR from 2014. Cloud service adoption by enterprises is growing and Ethernet is well positioned as the secure, high-bandwidth, low-cost-per-bit data service of choice for access and for interconnecting data centres. (Source: Ethernet Services Forecast Report: 2015–20, published on 28 September 2015 by Ovum) Enterprise customers are moving from 100Mbps to 1G and 10G wavelengths. The graph below sets forth actual (for 2013 and 2014) and projected (for the period from 2015 to 2020) revenue generated by Ethernet services by port speed:
Increasing mobile backhaul and fronthaul expenditure Mobile backhaul is defined as the transport of cell phone traffic between the cellular base station and the mobile switching centre. Mobile fronthaul is the transport of cellular traffic between a remote radio head and a baseband unit (“BBU”) in a cellular network architecture. The mobile network architecture has been evolving over the last several years from a legacy architecture where large radios are connected to antennas via coaxial cable to a new architecture that separates the radio frequency portion of the radio from the digital portion, allowing the radio to be located closer to the antenna. The s eparation of the digital processing capabilities, also called BBU from the analog radio or remote radio head or unit reduces the equipment footprint at the cell site and allows for more efficient network operations. In this architecture, the connection between the BBU and remote radio unit is provided via high-speed serial links over fibre-optic cable rather than a coaxial cable. These high-speed serial links use the common public radio interface, open base station architecture initiative or open radio interface specifications. (Source: Mobile Backhaul and Fronthaul Forecast Report: 2015–20 published in Septmber 2015 by Ovum) According to Ovum, optical fibre based mobile backhaul expenditure will grow from $3,591.42 million in 2015 to $5,349.54 million by 2020. (Source: Mobile Backhaul and Fronthaul Forecast: 2015–20 Spreadsheet, published in September 2015 by Ovum)
RETAIL RESEARCH
RETAIL RESEARCH P a g e | 8
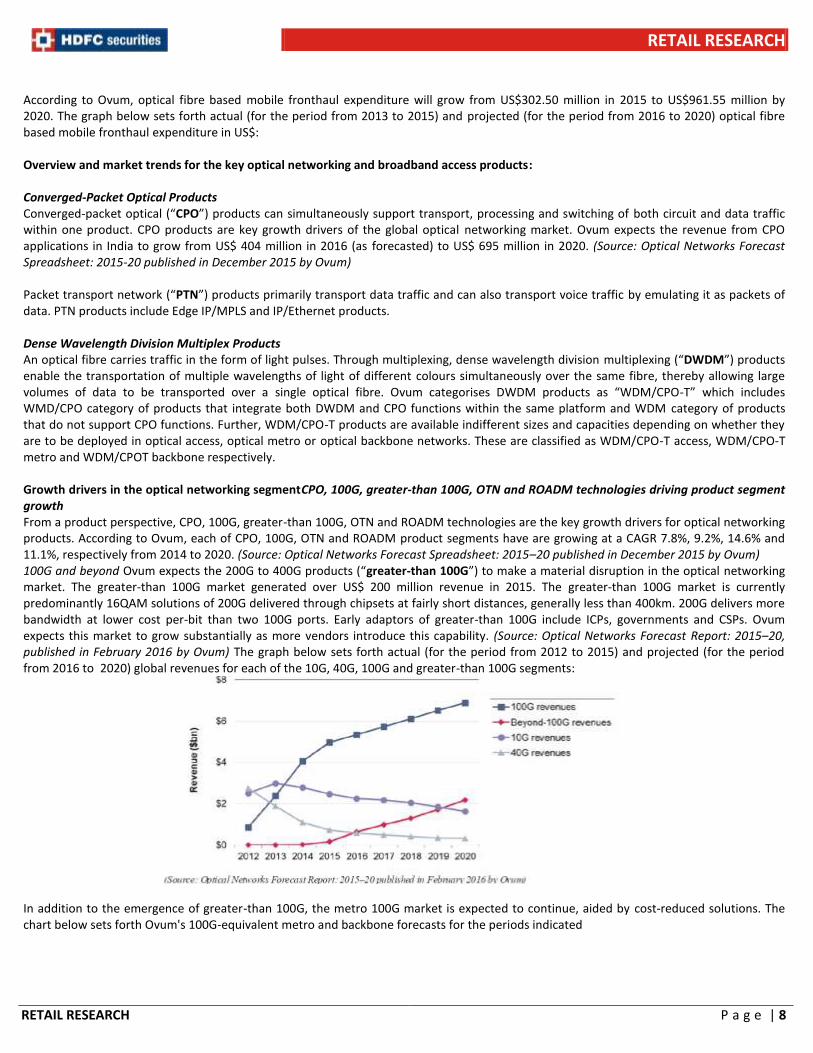
According to Ovum, optical fibre based mobile fronthaul expenditure will grow from US$302.50 million in 2015 to US$961.55 million by 2020. The graph below sets forth actual (for the period from 2013 to 2015) and projected (for the period from 2016 to 2020) optical fibre based mobile fronthaul expenditure in US$: Overview and market trends for the key optical networking and broadband access products: Converged-Packet Optical Products Converged-packet optical (“CPO”) products can simultaneously support transport, processing and switching of both circuit and data traffic within one product. CPO products are key growth drivers of the global optical networking market. Ovum expects the revenue from CPO applications in India to grow from US$ 404 million in 2016 (as forecasted) to US$ 695 million in 2020. (Source: Optical Networks Forecast Spreadsheet: 2015-20 published in December 2015 by Ovum) Packet transport network (“PTN”) products primarily transport data traffic and can also transport voice traffic by emulating it as packets of data. PTN products include Edge IP/MPLS and IP/Ethernet products. Dense Wavelength Division Multiplex Products An optical fibre carries traffic in the form of light pulses. Through multiplexing, dense wavelength division multiplexing (“DWDM”) products enable the transportation of multiple wavelengths of light of different colours simultaneously over the same fibre, thereby allowing large volumes of data to be transported over a single optical fibre. Ovum categorises DWDM products as “WDM/CPO-T” which includes WMD/CPO category of products that integrate both DWDM and CPO functions within the same platform and WDM category of products that do not support CPO functions. Further, WDM/CPO-T products are available indifferent sizes and capacities depending on whether they are to be deployed in optical access, optical metro or optical backbone networks. These are classified as WDM/CPO-T access, WDM/CPO-T metro and WDM/CPOT backbone respectively. Growth drivers in the optical networking segmentCPO, 100G, greater-than 100G, OTN and ROADM technologies driving product segment growth From a product perspective, CPO, 100G, greater-than 100G, OTN and ROADM technologies are the key growth drivers for optical networking products. According to Ovum, each of CPO, 100G, OTN and ROADM product segments have are growing at a CAGR 7.8%, 9.2%, 14.6% and 11.1%, respectively from 2014 to 2020. (Source: Optical Networks Forecast Spreadsheet: 2015–20 published in December 2015 by Ovum) 100G and beyond Ovum expects the 200G to 400G products (“greater-than 100G”) to make a material disruption in the optical networking market. The greater-than 100G market generated over US$ 200 million revenue in 2015. The greater-than 100G market is currently predominantly 16QAM solutions of 200G delivered through chipsets at fairly short distances, generally less than 400km. 200G delivers more bandwidth at lower cost per-bit than two 100G ports. Early adaptors of greater-than 100G include ICPs, governments and CSPs. Ovum expects this market to grow substantially as more vendors introduce this capability. (Source: Optical Networks Forecast Report: 2015–20, published in February 2016 by Ovum) The graph below sets forth actual (for the period from 2012 to 2015) and projected (for the period from 2016 to 2020) global revenues for each of the 10G, 40G, 100G and greater-than 100G segments:
In addition to the emergence of greater-than 100G, the metro 100G market is expected to continue, aided by cost-reduced solutions. The chart below sets forth Ovum's 100G-equivalent metro and backbone forecasts for the periods indicated

RETAIL RESEARCH
RETAIL RESEARCH P a g e | 9
Capital expenditure trends in the global telecommunications and optical networks Globally, capital expenditure in fixed and mobile networks is expected to remain relatively unchanged from 2014 to 2020. Telecommunications capital expenditure in India, North America and the Middle East and Africa region is projected to grow at CAGRs of 7.7%, 2.1%, and 1.1%, respectively from 2014 to 2020. While the other regions of the world are expected to reduce their capital expenditure, with Japan, China, Latin America and Europe projected to reduce their capital expenditure by 0.3%, 2.6%, 4.3%, and 4.6%, respectively from 2014 to 2020. Capital expenditure in optical networks, as a proportion of the total telecommunications capital expenditure differs in different economies around the world. India, China and Asia and Oceania region were forecasted to spend 7.2%, 6.3%, and 5.3%, respectively of their telecommunications capital expenditure budgets on optical networks in 2015, projecting a growth in investment and development of this market. Europe, Latin America, Japan and the Middle East and Africa region were forecasted to spend 3.3%, 3.2%, 2.7% and 2.4%, respectively of their total budgeted telecommunications capital expenditure on optical networks in 2015. The low optical network expenditure exhibits either of the two trends: (i) limited business and consumer market; or (ii) mature, low-growth markets with limited and maintenance-type investments. For instance, in North America, the optical network capital expenditure was forecasted to be 4.9% of the total telecommunications capital expenditure budget in 2015, reflective of healthy communications service provider fibre extension projects and large-scale internet content provider investment in optical network. (Sources: Optical Networks Forecast Spreadsheet: 2015-20 published in December 2015, and Optical Networks Forecast Report: 2015–20 published in February 2016 by Ovum) The graph below sets forth the key players in the aggregation product segment globally, and their market share during the third quarter of 2015 to the second quarter of 2016 Global Aggregation Product Segment 3Q15–2Q16: US$ 2.5 billion market

RETAIL RESEARCH
RETAIL RESEARCH P a g e | 10
Global growth projections for optical networking market The optical networking market grows in three fundamental ways: geographic extension, capacity expansion and interconnection among CSPs and others. Network investment continues despite uneven macroeconomic and geopolitical conditions. The global optical network market is projected to grow at a 4.1% CAGR, from 2014 to 2020. India has exhibited strong growth prospects due to renewed mobile network growth and data centre construction. India's optical networking market is expected to grow at a 14.2% CAGR, from 2014 to 2020. China, with growth been driven by Smart Cities, FTTx, mobile and long-haul DCI, is projected to grow at a 5.7% CAGR, from 2014 to 2020. The Asia and Oceania region, driven by the growth in India and China, is projected to grow at a 5.2% CAGR, from 2014 to 2020. North America's optical networking market is projected to grow at a 3.0% CAGR, from 2014 to 2020 based on a renewed focus on high-performance business services, cloud
adoption and DCI. (Source: Optical Networks Forecast Report: 2015–20 published in February 2016 by Ovum)
Government Initiatives Set forth below are some of the key government initiatives generally affecting telecommunications industry. Make in India Make in India is a Government of India initiative devised to transform India into a global design and manufacturing hub. Electronics systems are a focus sector for the Make in India initiative and the Government of India provides various financial incentives to support domestic manufacturing in this sector. Digital India The Digital India programme is a flagship programme of the Government of India with a vision to transform India into a digitally empowered society and knowledge economy. Digital India is to be implemented by the entire Government with overall coordination being done by the Department of Electronics and Information Technology. Digital India aims to encourage broadband highways, universal access to mobile connectivity, public internet access programme, e-governance: reforming government through technology, e-kranti -electronic delivery of services, information for all, electronics manufacturing, it for jobs and early harvest programmes. Each of these areas is a complex programme in itself and involves multiple Ministries and Departments National Optical Fibre Network (Bharatnet) (“NOFN (Bharatnet)”) NOFN (Bharatnet) is a rural connectivity project of the Government of India which seeks to link of India through broadband optical fibre network of the order of 1.7 million kilometers. A special purpose vehicle, Bharat Broadband Network Limited has been incorporated for the establishment, management and operation of the project. NOFN (Bharatnet) will extend the optical fibre network to 250,000 gram panchayats (which are local self-government bodies in villages or smaller town in India) in India to enable service providers both in the government as well as the private sector to create last mile connectivity and provide e-Education, e-Health and e-Governance services to rural users. The NOFN (Bharatnet) project is being implemented by three central public sector undertakings, Bharat Sanchar Nigam Limited, PowerGrid Corporation of India Limited and Railtel India Limited. A key feature of the project that the GPON equipment used in the project has been designed, developed and manufactured in India National Knowledge Network (“NKN”) NKN project is aimed at establishing a strong and robust Indian network which will be capable of providing secure and reliable connectivity. NKN, with its multi-gigabit capability aims to connect all universities, research institutions, libraries, laboratories, healthcare and agricultural institutions across India to enable multidisciplinary and collaborative research and innovation. The leading mission oriented agencies in the fields of nuclear, space and defence research are also part of NKN. Smart Cities The Smart Cities Mission of the Government of India intends to promote cities that provide sustainable and inclusive development.
Key Concerns Results of operations are subject to significant fluctuations and seasonality: TNL’s results of operations are also subject to seasonal fluctuations as it realise a significant portion of its revenues in the second half of the Fiscal Year. Further, as its budgeted expense levels depend in part on its anticipated future revenues and given the fixed nature of a large part of its operating expenses, any substantial reduction of revenue may adversely impact the profitability.
A significant portion of the revenue is generated from limited number of large customers: For Fiscal Years 2015, 2016 and 2017, TNL’s gross revenue from the sale of products and services (excluding sales to EMS vendors on a pass-through basis) to its top five customers amounted to 56.56%, 67.79% and 58.81%, respectively of its consolidated revenue from operations (gross). It is expected that in the future a limited number of large customers will continue to comprise a large percentage of its revenue. Consequently, if it is unable to expand its
RETAIL RESEARCH
RETAIL RESEARCH P a g e | 11
sales volumes to existing customers, maintain relationship with its key customers or diversify its customer base or if OEM and reseller customers are unable to sell its products to end-customers or diversify their customer base, it may experience material fluctuations or decline in its revenue and reduction in its operating margins, as a result of which financial condition and results of operations could be materially and adversely affected. Many of TNL’s key customers are large Communications Service Providers that have substantial purchasing power and leverage in negotiating contractual arrangements with it. These customers have and may continue to seek advantageous pricing and other commercial terms and may require developing additional features in the products it sells to them. If it is unable address these pricing pressures or offset the increase in its average costs due to a reduction in pricing with increased sales volumes and reduced production costs, or if it fails to develop and introduce new products and enhancements on a timely basis, its operating results would be negatively affected.
The networking equipment market is characterised by rapid technological changes: The networking equipment market is characterised by rapid technological changes, with new product introductions, technology enhancements and evolving industry standards with respect to the protocols used in data communication and telecommunication networks. TNL’s future performance will depend on the successful development, introduction and market acceptance of new and enhanced products that address these changes as well as current and potential customer requirements. New products based on new or improved technologies may render existing products obsolete. In addition, a slowdown in demand for existing products ahead of a new product introduction could result in a write-down in the value of inventory on hand related to existing products and/or a charge for the impairment of long-lived assets related to such products. If its customers defer or cancel orders for existing products due to a slowdown in demand or in the expectation of a new product release or if there is any delay in development or introduction of the new products or enhancements of its products, its operating results would be adversely affected. Changes in market demand or investment priorities may also cause TNL to discontinue existing or planned development for new products or features, which can have an adverse effect on its relationships with customers. If it fails to make the right investments or fail to make them at the right time, its business, reputation and financial condition could be materially and adversely affected.
The market for networking equipment is highly competitive, and if TNL is unable to compete effectively, its business, prospects and results of operations may be materially and adversely affected: The networking equipment market is highly competitive, rapidly evolving and is characterised by frequent introductions of new and improved solutions, applications and technologies. Its competitors are large global companies. In addition, its OEM customers, who sell its products to end-customers, also operate in a highly competitive environment and may need to reduce the prices they charge for its products in order to maintain or expand their market share. Its competitors may also have a larger product portfolio than it, which may enable them to cross subsidise their product development costs and exert competitive pricing pressure on its products. As a result, TNL may experience price reductions for its products, order cancellations and increased expenses. In addition, its larger competitors may have stronger balance sheet and Government support, enabling them to provide long-term finance to their customers which it may not be able to do and which may result in a loss of business for it. Accordingly, business, prospects and results of operations may be materially and adversely affected.
TNL relies on a limited number of third party suppliers and EMS companies for its key components and products: TNL rely on a limited number of component suppliers whose components are an integral part of its products. Further, some of such suppliers are the sole sources for procuring such components. It procures its components from these suppliers on a purchase order basis and do not have long-term contracts with them. The use of such third party components also exposes its products to any defects inherent in these components, which may affect the quality and functionality of its products. If TNL is unable to deliver reliable and high quality products or timely resolve any issues relating to its products, confidence in its optical networking products could be undermined and it may be unable to expand or maintain its customer base and market share. Further, TNL may also be unable to realise any results from its research and development efforts undertaken to develop those products and recognise any revenue from the sales of those products in a timely manner, or at all. If any of these eventualities materialise, its business, reputation, financial condition and profitability could be materially and adversely affected.
If TNL is unable to successfully execute growth strategies, its business, prospects and results of operations could be materially and adversely affected: TNL propose to expand its business by adopting a series of strategies. Its growth depends on the continued growth of the telecommunications industry, and to a large extent, the optical networking segment, and any adverse developments in the telecommunications industry and the optical networking segment could materially and adversely affect the growth prospects. Its growth is also dependent on its ability to expand market share and its inability to do so may adversely affect growth prospects. TNL’s growth strategies could place significant demand on its management and its administrative, operational and financial infrastructure. It could also encounter difficulties and delays in executing growth strategies due to a number of factors, including, without limitation, delays in implementation, lack of appropriate infrastructure, unavailability of human and capital resources, or any other risks that it may or may not have foreseen. Additionally, expansion into new geographic regions, including new regions in India and international markets will subject TNL to various challenges, including those relating to its lack of familiarity with the social, political, economic and cultural conditions of these new regions, language barriers, difficulties in staffing and managing such operations and the lack of brand recognition and reputation in such regions. It

RETAIL RESEARCH
RETAIL RESEARCH P a g e | 12
may also encounter other additional anticipated risks and significant competition in such markets. If TNL is unable to successfully execute its growth strategies, its business, prospects and results of operations could be materially and adversely affected.
The sales and deployment cycles for products are variable in nature and are likely to cause quarterly revenues to fluctuate materially:
TNL’s products have a lengthy sales cycle, which can extend up to 24 months and may take even longer for prospective customers in emerging international markets. Additionally, the deployment by telecommunications carriers of necessary infrastructure typically occurs in stages. Operators will typically make significant initial investments for new equipment to ensure that new services facilitated by such equipment are available to end-users throughout the operator's network. Its prospective customers also conduct significant evaluation, testing, implementation and acceptance procedures before they purchase its products. It incurs substantial up-front sales and marketing expenses and expends significant management effort during this time, regardless of whether it makes a sale. As a result, it is difficult for TNL to accurately predict the timing of future purchases by its prospective customers. In addition, product purchases are frequently subject to budget constraints, multiple approvals and unplanned administrative, processing and other delays. If sales expected from customers for a particular quarter are not realized in that quarter or at all, its revenue will be negatively impacted.
The average selling price of the products may decrease, which may materially and adversely affect the results of operations and
profitability: The average selling prices of TNL’s products may decrease in the future in response to pricing pressures from customers, competitive pricing pressures, excess inventories, increased sales discounts, technological changes and new product introductions by it or its competitors. It has lowered its prices in the past as a result of this downward pressure, and it may have to further reduce prices of its existing products in the future. This reduction in prices impacts the average selling price of its products. TNL expect to devote more capital to its research and development activities in order to develop future products and increase spending on its sales and marketing efforts. This continued spending will have an adverse impact on its results of operations if its net revenue does not continue to grow faster than its cost of revenue or expenses.
Relationship with PSU customers in India exposes TNL to risks inherent in doing business with these customers, which may adversely
affect the profitability: During Fiscal Years 2015, 2016 and 2017, TNL generated 29.02%, 43.29% and 45.12%, respectively of its consolidated gross revenue from operations from PSU customers in India. It is exposed to various risks inherent in doing business with PSU customers, which may affect the profitability.
If TNL is unable to collect its dues and receivables from its customers, its results of operations and cash flows could be materially and
adversely affected: TNL’s business depends on its ability to successfully obtain payment from its customers of the amounts they owe it for work performed. TNL evaluate the financial condition of its customers and usually bill and collect on relatively short cycles. It maintains provisions against receivables. Actual losses on customer balances could differ from those that it currently anticipates and as a result it might need to adjust its provisions. Timely collection of fees for customer services also depends on its ability to complete its contractual commitments and subsequently bill for and collect its contractual service fees. If TNL is unable to meet its contractual obligations, it might experience delays in the collection of, or be unable to collect, its customer balances, and if this occurs, TNL’s results of operations and cash flows could be adversely affected. In addition, if TNL experience delays in billing and collection for its services, its cash flows could be adversely affected.
Majority of customers operate in the telecommunications networking industry: TNL derives a large proportion of its revenues from customers that operates in the telecommunications networking industry. Any significant decrease in product spending by clients in this industry or other industries from which it derives significant revenues in the future may reduce the demand for its products. In addition, as fewer customers gain control of the telecommunications networking industry as a result of consolidation, pricing pressure is likely to increase and a change of ownership of its customers resulting from such consolidation could also result in the loss of its current customers if the new owners select another networking equipment vendor over it.
Breaches of cyber security systems could adversely affect the ability to conduct business operations and deliver products: In the ordinary course of business, TNL store sensitive data, including intellectual property, its proprietary business information and that of its customers, suppliers and business partners on its networks. The secure maintenance of this information is critical to its operations and business strategy. Increasingly, companies, including its, are subject to a wide variety of attacks on their networks on an ongoing basis. Despite security measures, its information technology and infrastructure may be vulnerable to penetration or attacks by computer programmers and hackers, or breached due to employee error, malfeasance or other disruptions. Any such breach could compromise its networks, creating system disruptions or slowdowns and exploiting security vulnerabilities of its products and the embedded software, and the information stored on its networks could be accessed, publicly disclosed, lost or stolen, which could subject TNL to liability to its customers, suppliers, business partners and others, and cause it reputational and financial harm.

RETAIL RESEARCH
RETAIL RESEARCH P a g e | 13
Wage pressures and increases in operating costs in India may prevent from sustaining its competitive advantage and may reduce the
profit margins: Wage costs as well, as operating costs such as real estate and utilities, in India have historically been significantly lower than wage costs and operating costs in the United States, Europe and other developed economies; and these reduced costs have been one of the sources of its competitive strengths. However, wage and operating expense increases in India may prevent from sustaining this competitive advantage and may negatively affect the profit margins. Additionally, the cost of real estate and other utilities and operating expenses is also increasing as India continues to grow. Compensation increases manifest a hike in operational costs which may result in a material adverse effect on the business and financial condition and result of operations. Fluctuations in currency exchange rates may have an adverse effect on the results of operations and cash Flows: Although TNL functional currency is the Indian Rupee, it transacts a significant portion of its business in several other currencies, particularly in US dollars. As of Fiscal Years 2015, 2016 and 2017, its US dollar-denominated revenues represented 57.66%, 30.23% and 33.65% of its total revenues, respectively. TNL’s exchange rate risk primarily arises from its foreign currency revenues, receivables, payables and other foreign currency assets and liabilities and a decrease in the - US dollar to Indian Rupee exchange rate will negatively impact its results of operations and cash flows.
TNL is subject to export and import controls that could adversely impact the business: TNL is subject to export and import control laws that limit which products it sells and where and to whom, and which could result in postponements or cancellations of product orders. In addition, various countries regulate the import of certain technologies and have enacted laws that could limit its ability to distribute its products or could limit its customers' ability to implement the products in those countries. Any change in export or import regulations or related legislation, shift in approach to the enforcement or scope of existing regulations, or change in the countries, persons or technologies targeted by such regulations, could result in decreased use of its products by, or in its decreased ability to export or sell its products to, existing or potential customers with international operations. TNL may also be unable to secure components or software due to export control laws, as a result of which, its supply chain may be disrupted and it may be unable to provide its products and services to customers, which can result in a loss of business for it.
Business is dependent on obtaining and maintaining necessary governmental licenses and approvals: TNL’s business is dependent on obtaining and maintaining necessary governmental licenses and approvals and it is required to obtain and maintain a number of statutory and regulatory permits and approvals under central, state and local government rules in India, generally for carrying out its business and for production facility. A majority of these approvals are granted for a limited duration and require renewal. If there is any failure by TNL to comply with the applicable regulations or if the regulations governing its business are amended, it may incur increased costs, be subject to penalties, have its approvals and permits revoked or suffer a disruption in operations, any of which could adversely affect the business. If TNL fails to obtain such approvals, licenses, registrations and permissions, in a timely manner or at all, its business, results of operations, cash flows and financial condition may be adversely affected. Changing laws, rules and regulations and legal uncertainties, including adverse application of tax laws and regulations, may adversely affect the business and financial performance: TNL’s business and financial performance could be adversely affected by changes in law, or interpretations of existing laws, rules and regulations, or the promulgation of new laws, rules and regulations in India, applicable to it and its business. The regulatory environment in which it operates is subject to change both in the form of gradual evolution over time and also in form of significant reforms from time to time. Any such change in the future may require TNL to commit significant management resources and may require significant changes to its business practices and could have a material adverse effect on the business, financial condition, results of operations and prospects. Additionally, the General Anti Avoidance Rules (“GAAR”) are proposed to be effective from April 1, 2017. The tax consequences of the GAAR provisions being applied to an arrangement could result in denial of tax benefits among other consequences. In the absence of any precedents on the subject, the application of these provisions is uncertain. If the GAAR provisions are made applicable to their Company, it may have an adverse tax impact on TNL.
Profit & Loss Rs in million
Particulars FY17 FY16 FY15 FY14
Revenue from Operations 8782.0 6274.6 3868.3 4230.6
Other Income 86.8 35.2 91.4 96.4
Total Income 8868.8 6309.7 3959.6 4326.9
Total Expenditure 7039.7 5144.1 3183.1 3280.9
Cost of materials consumed 5140.5 3506.6 1981.3 2085.3
Employee benefits expense 763.2 665.3 495.1 449.0
Other expenses 1135.9 972.3 706.6 746.6
PBIDT 1829.1 1165.6 776.6 1046.1
Interest 315.2 493.2 469.6 459.8
RETAIL RESEARCH
RETAIL RESEARCH P a g e | 14
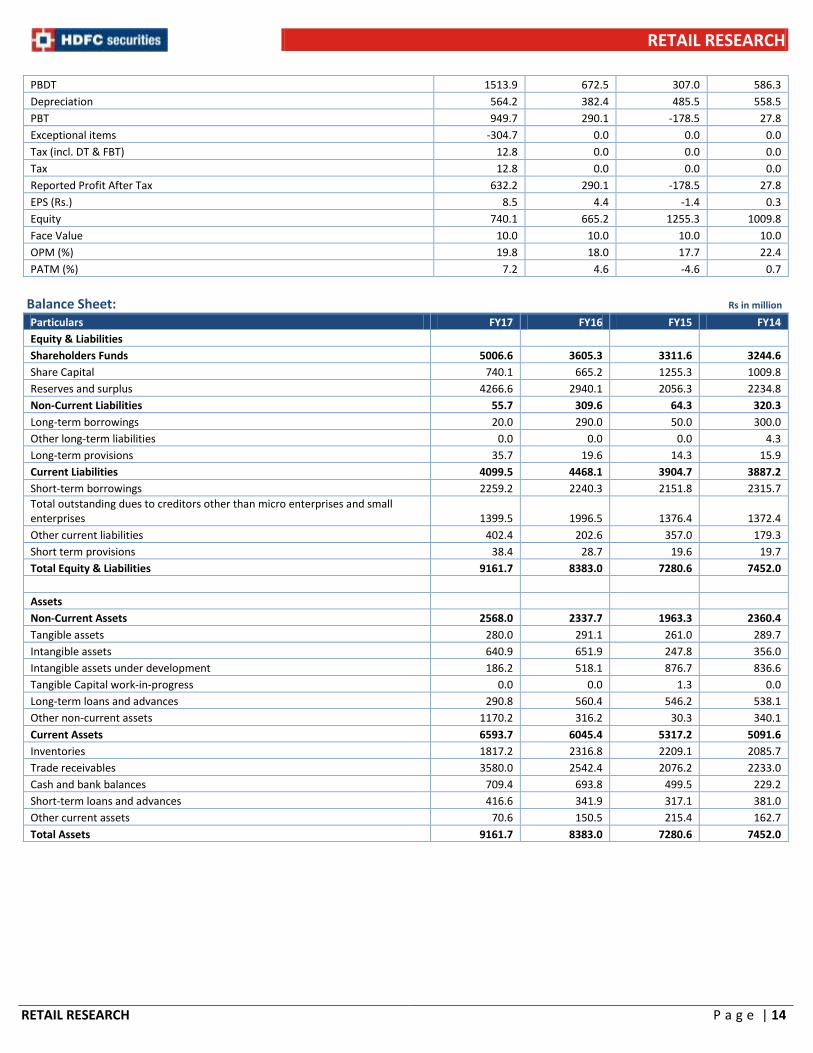
PBDT 1513.9 672.5 307.0 586.3
Depreciation 564.2 382.4 485.5 558.5
PBT 949.7 290.1 -178.5 27.8
Exceptional items -304.7 0.0 0.0 0.0
Tax (incl. DT & FBT) 12.8 0.0 0.0 0.0
Tax 12.8 0.0 0.0 0.0
Reported Profit After Tax 632.2 290.1 -178.5 27.8
EPS (Rs.) 8.5 4.4 -1.4 0.3
Equity 740.1 665.2 1255.3 1009.8
Face Value 10.0 10.0 10.0 10.0
OPM (%) 19.8 18.0 17.7 22.4
PATM (%) 7.2 4.6 -4.6 0.7
Balance Sheet: Rs in million
Particulars FY17 FY16 FY15 FY14
Equity & Liabilities Shareholders Funds 5006.6 3605.3 3311.6 3244.6
Share Capital 740.1 665.2 1255.3 1009.8
Reserves and surplus 4266.6 2940.1 2056.3 2234.8
Non-Current Liabilities 55.7 309.6 64.3 320.3
Long-term borrowings 20.0 290.0 50.0 300.0
Other long-term liabilities 0.0 0.0 0.0 4.3
Long-term provisions 35.7 19.6 14.3 15.9
Current Liabilities 4099.5 4468.1 3904.7 3887.2
Short-term borrowings 2259.2 2240.3 2151.8 2315.7
Total outstanding dues to creditors other than micro enterprises and small enterprises 1399.5 1996.5 1376.4 1372.4
Other current liabilities 402.4 202.6 357.0 179.3
Short term provisions 38.4 28.7 19.6 19.7
Total Equity & Liabilities 9161.7 8383.0 7280.6 7452.0
Assets Non-Current Assets 2568.0 2337.7 1963.3 2360.4
Tangible assets 280.0 291.1 261.0 289.7
Intangible assets 640.9 651.9 247.8 356.0
Intangible assets under development 186.2 518.1 876.7 836.6
Tangible Capital work-in-progress 0.0 0.0 1.3 0.0
Long-term loans and advances 290.8 560.4 546.2 538.1
Other non-current assets 1170.2 316.2 30.3 340.1
Current Assets 6593.7 6045.4 5317.2 5091.6
Inventories 1817.2 2316.8 2209.1 2085.7
Trade receivables 3580.0 2542.4 2076.2 2233.0
Cash and bank balances 709.4 693.8 499.5 229.2
Short-term loans and advances 416.6 341.9 317.1 381.0
Other current assets 70.6 150.5 215.4 162.7
Total Assets 9161.7 8383.0 7280.6 7452.0

RETAIL RESEARCH
RETAIL RESEARCH P a g e | 15
HDFC securities Limited, I Think Techno Campus, Building - B, "Alpha", Office Floor 8, Near Kanjurmarg Station, Opp. Crompton Greaves, Kanjurmarg (East), Mumbai 400 042 Phone: (022) 3075 3400 Fax: (022) 2496 5066 Compliance Officer: Binkle R. Oza Email: [email protected] Phone: (022) 3045 3600 HDFC Securities Limited (HSL) is a SEBI Registered Research Analyst having registration no. INH000002475. Disclaimer: This report has been prepared by HDFC Securities Ltd and is meant for sole use by the recipient and not for circulation. The information and opinions contained herein have been compiled or arrived at, based upon information obtained in good faith from sources believed to be reliable. Such information has not been independently verified and no guaranty, representation of warranty, express or implied, is made as to its accuracy, completeness or correctness. All such information and opinions are subject to change without notice. This document is for information purposes only. Descriptions of any company or companies or their securities mentioned herein are not intended to be complete and this document is not, and should not be construed as an offer or solicitation of an offer, to buy or sell any securities or other financial instruments. This report is not directed to, or intended for display, downloading, printing, reproducing or for distribution to or use by, any person or entity who is a citizen or resident or located in any locality, state, country or other jurisdiction where such distribution, publication, reproduction, availability or use would be contrary to law or regulation or what would subject HSL or its affiliates to any registration or licensing requirement within such jurisdiction. If this report is inadvertently send or has reached any individual in such country, especially, USA, the same may be ignored and brought to the attention of the sender. This document may not be reproduced, distributed or published for any purposes without prior written approval of HSL. Foreign currencies denominated securities, wherever mentioned, are subject to exchange rate fluctuations, which could have an adverse effect on their value or price, or the income derived from them. In addition, investors in securities such as ADRs, the values of which are influenced by foreign currencies effectively assume currency risk. It should not be considered to be taken as an offer to sell or a solicitation to buy any security. HSL may from time to time solicit from, or perform broking, or other services for, any company mentioned in this mail and/or its attachments. HSL and its affiliated company(ies), their directors and employees may; (a) from time to time, have a long or short position in, and buy or sell the securities of the company(ies) mentioned herein or (b) be engaged in any other transaction involving such securities and earn brokerage or other compensation or act as a market maker in the financial instruments of the company(ies) discussed herein or act as an advisor or lender/borrower to such company(ies) or may have any other potential conflict of interests with respect to any recommendation and other related information and opinions. HSL, its directors, analysts or employees do not take any responsibility, financial or otherwise, of the losses or the damages sustained due to the investments made or any action taken on basis of this report, including but not restricted to, fluctuation in the prices of shares and bonds, changes in the currency rates, diminution in the NAVs, reduction in the dividend or income, etc. HSL and other group companies, its directors, associates, employees may have various positions in any of the stocks, securities and financial instruments dealt in the report, or may make sell or purchase or other deals in these securities from time to time or may deal in other securities of the companies / organizations described in this report. HSL or its associates might have managed or co-managed public offering of securities for the subject company or might have been mandated by the subject company for any other assignment in the past twelve months. HSL or its associates might have received any compensation from the companies mentioned in the report during the period preceding twelve months from t date of this report for services in respect of managing or co-managing public offerings, corporate finance, investment banking or merchant banking, brokerage services or other advisory service in a merger or specific transaction in the normal course of business. HSL or its analysts did not receive any compensation or other benefits from the companies mentioned in the report or third party in connection with preparation of the research report. Accordingly, neither HSL nor Research Analysts have any material conflict of interest at the time of publication of this report. Compensation of our Research Analysts is not based on any specific merchant banking, investment banking or brokerage service transactions. HSL may have issued other reports that are inconsistent with and reach different conclusion from the information presented in this report. Research entity has not been engaged in market making activity for the subject company. Research analyst has not served as an officer, director or employee of the subject company. We have not received any compensation/benefits from the subject company or third party in connection with the Research Report. This report is intended for non-Institutional Clients only. The views and opinions expressed in this report may at times be contrary to or not in consonance with those of Institutional Research or PCG Research teams of HDFC Securities Ltd. and/or may have different time horizons. HDFC Securities Limited, SEBI Reg. No.: NSE-INB/F/E 231109431, BSE-INB/F 011109437, AMFI Reg. No. ARN: 13549, PFRDA Reg. No. POP: 04102015, IRDA Corporate Agent License No.: HDF 2806925/HDF C000222657, SEBI Research Analyst Reg. No.: INH000002475, CIN - U67120MH2000PLC152193 Mutual Funds Investments are subject to market risk. Please read the offer and scheme related documents carefully before investing.