teks/staar-based lessons - teksing toward...
TRANSCRIPT

TEKSING TOWARD STAAR © 2014
TEKS/STAAR-BASED
LESSONS
TEACHER GUIDE
®MATHEMATICS
TEKSING TOWARD STAAR

Scope and SequenceSix Weeks 1

TEKSING TOWARD STAAR SCOPE AND SEQUENCEGrade 8 Mathematics
TEKSING TOWARD STAAR 2014 Page 1
SIX WEEKS 1
Lesson TEKS-BASED LESSONSTAAR
CategoryStandard
SpiraledPractice
StudentActivity
ProblemSolving
Skills andConceptsHomework
Lesson 1____ days
8.2A/extend previous knowledge of sets and subsets using avisual representation to describe relationships between sets ofreal numbers.
Category 1Supporting
SP 1SP 2
SA 1SA 2
PS 1PS 2
Homework 1Homework 2
Lesson 2____ days
8.2B/approximate the value of an irrational number, including and square roots of numbers less than 225, and locate that
rational number approximation on a number line
Category 1Supporting
SP 3SP 4
SA 1SA 2
PS 1PS 2
Homework 1Homework 2
Lesson 3____ days
8.2D/order a set of real numbers arising from mathematical andreal-world contexts
Category 1Readiness
SP 5SP 6
SA 1SA 2
PS 1 Homework 1Homework 2
Lesson 4____ days
8.10A/ generalize the properties of orientation and congruenceof ….dilations of two-dimensional shapes on a coordinate plane
8.8D/use informal arguments to establish facts about …theangle-angle criterion for similarity of triangles
8.3A/generalize the ratio of corresponding sides of similarshapes are proportional, including a shape and its dilation
Category 3Supporting
Category 3Supporting
Category 3Supporting
SP 7SP 8
SA 1SA 2SA 3
PS 1PS 2
Homework 1Homework 2
Lesson 5____ days
8.8A/write one-variable equations and inequalities withvariables on both sides that represent problems using rationalnumber coefficients and constants
8.8C/model and solve one-variable equations with variables onboth sides that represent mathematical and real-world problemsusing rational number coefficients and constants
Category 2Supporting
Category 2Readiness
SP 9SP 10SP 11
SA 1SA 2SA 3
PS 1PS 2
Homework 1Homework 2
Lesson 6____ days
8.6A/describe the volume formula V Bh of a cylinder in termsof its bases area and its height
8.6B/model the relationship between the volume of a cylinderand a cone having both congruent bases and heights and connectthe relationship to the formula
8.7A/solve problems involving the volume of cylinders, cones…
Category 3Supporting
NOTTESTED
Category 3Readiness
SP 12SP 13
SA 1SA 2SA 3
PS 1PS 2PS 3
Homework 1Homework 2
TEKSING TOWARD STAAR SCOPE AND SEQUENCEGrade 8 Mathematics
TEKSING TOWARD STAAR 2014 Page 2
SIX WEEKS 1
Lesson TEKS-BASED LESSONSTAAR
CategoryStandard
SpiraledPractice
StudentActivity
ProblemSolving
Skills andConceptsHomework
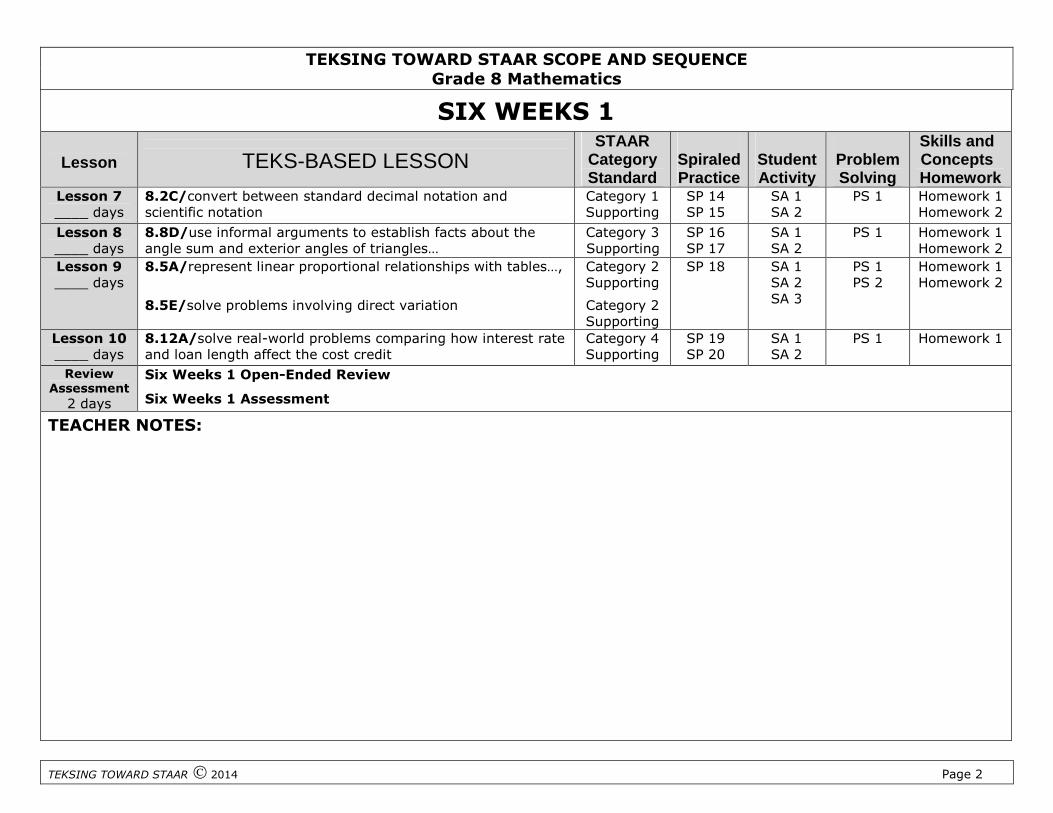
Lesson 7____ days
8.2C/convert between standard decimal notation andscientific notation
Category 1Supporting
SP 14SP 15
SA 1SA 2
PS 1 Homework 1Homework 2
Lesson 8____ days
8.8D/use informal arguments to establish facts about theangle sum and exterior angles of triangles…
Category 3Supporting
SP 16SP 17
SA 1SA 2
PS 1 Homework 1Homework 2
Lesson 9____ days
8.5A/represent linear proportional relationships with tables…,
8.5E/solve problems involving direct variation
Category 2Supporting
Category 2Supporting
SP 18 SA 1SA 2SA 3
PS 1PS 2
Homework 1Homework 2
Lesson 10____ days
8.12A/solve real-world problems comparing how interest rateand loan length affect the cost credit
Category 4Supporting
SP 19SP 20
SA 1SA 2
PS 1 Homework 1
ReviewAssessment
2 days
Six Weeks 1 Open-Ended Review
Six Weeks 1 Assessment
TEACHER NOTES:

Materials List

GRADE 8 MATERIALS LIST - SIX WEEKS 1
TEKSING TOWARD STAAR2012
SIXWEEKS
LESSON ITEM QUANTITY
1 1 Math Notes PageProblem-Solving PlanProblem-Solving Questions Page
1 per student1 per student1 per student
1 2 Irrational Number Cards (copy oncardstock. Cut apart and putIrrational Number Cards in one zippergallon plastic bag and w the 0, -10and 10 cards in a snack size bag).
Adding machine tape or blue paintertape
1 set
15-20 feet
1 3 Real Number Cards and Blank NumberCards (copy on cardstock, cut out, andlaminate.) Put in a baggie.
Wide blue painter’s tape line.
Ticky tack or tape to tape numbercards on number line
1 set
15-20 feet
2 per pair of students
1 4 protractorruler1
4-inch grid paper
colored pens or pencils
1 per student1 per student1 per student
1 set per pair of student
1 5 Equation Cards (copy on cardstock cutapart and put in baggieSolution Set Cards (copy on cardstock,cut apart and put in baggie.white paper
1 set per Group of 4students
1 set per pair of students1-2 sheets per pair ofstudents
1 6 No Materials Needed
1 7 Scissorsglue stickscolored construction paper (11 by 18)collection of newspapers, magazines,and old science books that may be cutup
1 per group of 4 students1 per group of 4 students1 per group of 4 students1 per group of 4 students
1 8 Protractor 1 per student

GRADE 8 MATERIALS LIST - SIX WEEKS 1
TEKSING TOWARD STAAR2012
1 9 Table Cards (copy on cardstock, cutapart and put in a baggie)
Equation Cards (copy on cardstock,cut apart and put in a baggie)
calculator
1 set per pair of students
1 set per pair of students
1 per student
1 10 No materials needed

Mini-AssessmentAnswer Key
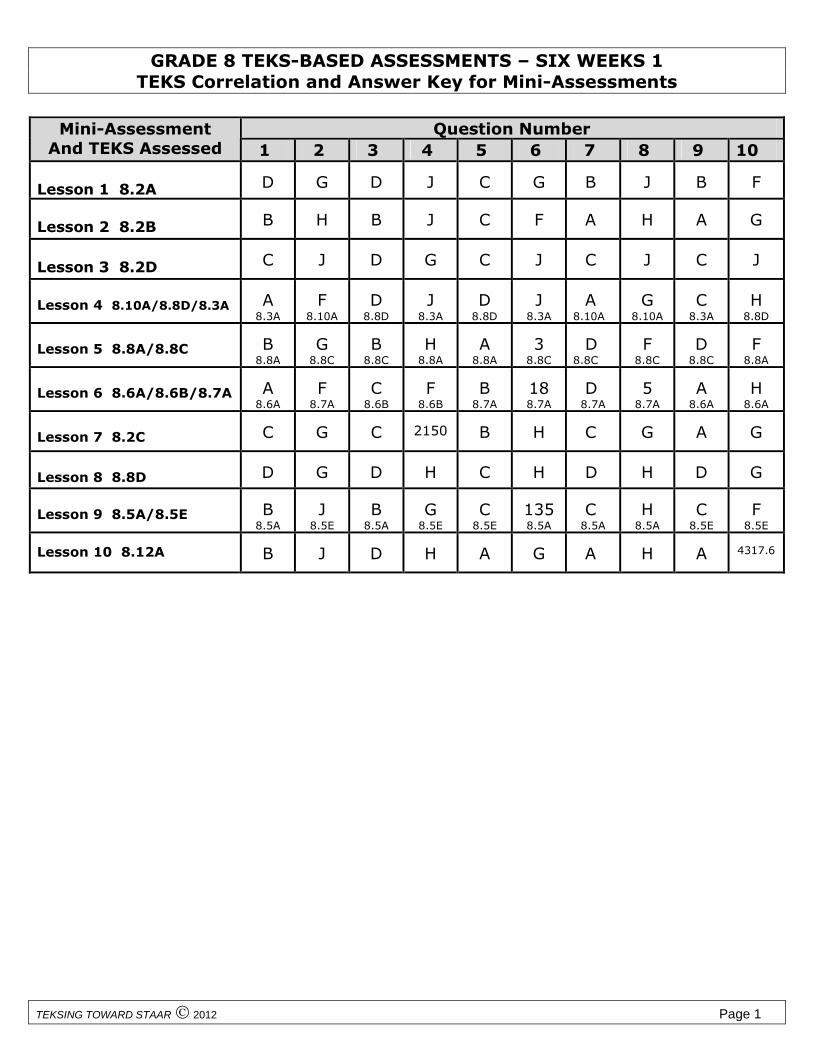
GRADE 8 TEKS-BASED ASSESSMENTS – SIX WEEKS 1TEKS Correlation and Answer Key for Mini-Assessments
TEKSING TOWARD STAAR 2012 Page 1
Question NumberMini-AssessmentAnd TEKS Assessed 1 2 3 4 5 6 7 8 9 10
Lesson 1 8.2A D G D J C G B J B F
Lesson 2 8.2B B H B J C F A H A G
Lesson 3 8.2D C J D G C J C J C J
Lesson 4 8.10A/8.8D/8.3A A8.3A
F8.10A
D8.8D
J8.3A
D8.8D
J8.3A
A8.10A
G8.10A
C8.3A
H8.8D
Lesson 5 8.8A/8.8C B8.8A
G8.8C
B8.8C
H8.8A
A8.8A
38.8C
D8.8C
F8.8C
D8.8C
F8.8A
Lesson 6 8.6A/8.6B/8.7A A8.6A
F8.7A
C8.6B
F8.6B
B8.7A
188.7A
D8.7A
58.7A
A8.6A
H8.6A
Lesson 7 8.2C C G C 2150 B H C G A G
Lesson 8 8.8D D G D H C H D H D G
Lesson 9 8.5A/8.5E B8.5A
J8.5E
B8.5A
G8.5E
C8.5E
1358.5A
C8.5A
H8.5A
C8.5E
F8.5E
Lesson 10 8.12A B J D H A G A H A 4317.6

Six Weeks 1Lesson 1

STAAR Category 1 Grade 8 Mathematics TEKS 8.2A
TEKSING TOWARD STAAR © 2014 Page 1
8.2A Lesson and Assessment
Lesson Focus
For TEKS 8.2A, students should be able to demonstrate an understanding of how to representand manipulate numbers and expressions. Students are expected to apply mathematicalprocess standards to represent and use real numbers in a variety of forms.
Students are also expected to extend previous knowledge of sets and subsets using a visualrepresentation to describe relationships between sets of real numbers.
Process Standards Incorporated Into Lesson
8.1B Use a problem-solving model that incorporates analyzing given information,formulating a plan or strategy, determining a solution, justifying the solution, andevaluating the problem-solving process and the reasonableness of the solution
8.1D Communicate mathematical ideas, reasoning and their implications using multiplerepresentations, including symbols, diagrams, graphs, and language as appropriate
8.1F Analyze mathematical relationships to connect and communicate mathematical ideas
Materials Needed for Lesson
1. Math BackgroundPer Student: 1 Math Notes page
2. Problem Solving 1Per Student: 1 copy of Problem-solving Plan for math notebook, 1 copy of Problem-solvingQuestions
3. Per Student: 1 copy of all pages for student activities for this lesson, Skills and ConceptsHomework, and mini-assessment for this lesson
Math Background-Understanding Real Numbers
A group of items or numbers is called a set. A part of that set is called a subset. The set of numberswe use in our every day lives is the set of real numbers. These are the numbers that are located on anumber line. One subset of the real numbers is the set of whole numbers. Whole numbers are thenumbers 0, 1, 2, 3, 4… Each of these numbers has an opposite 0, -1, -2, -3, -4… When the wholenumbers and their opposites are joined together the set of integers is created.
The set of integers are indicated in set notation as {…-4, -3, -2, -1, 0, 1, 2, 3, 4…}.
If zero is removed from the set of whole numbers, the set of natural numbers or counting numbers
is created. The natural numbers can be indicated in set notation as 1, 2, 3, 4, 5, 6, 7,... .
The whole numbers, counting numbers, and integers are all subsets of a larger set called the rational
numbers. When a number of the forma
bis created where a and b are both integers but 0b , then

STAAR Category 1 Grade 8 Mathematics TEKS 8.2A
TEKSING TOWARD STAAR © 2014 Page 2
the set of rational numbers is created. For example, the ratio of 3 to 5 creates3
5, so
3
5is a rational
number. The ratio of 20 to 2 creates20
or 102
which is a whole number as well as a rational number.
A mixed number like 51
2is a rational number because it can be rewritten as an improper fraction,
11
2,
which is the ratio of two integers.
The real numbers, which are all the numbers on a number line, are divided into 2 large subsets. Therational numbers and the irrational numbers.
The irrational numbers are made up all numbers that CANNOT be expressed as a ratio of two integers.
Some irrational numbers are numbers like 2, 3, 5 and . Any decimal that does NOT terminate
and does NOT repeat is an irrational numbers. For example, 5.123456… is an irrational decimal. Arepeating decimal has a block of one or more digits that repeats indefinitely. These decimals, such as0.3333333…. or 4.1212121212….are rational decimals.
The relationship between these sets of subsets of the real numbers can be shown with a Venn diagram.
This diagram shows that the rational numbers and the irrational number are disjointed. They do NOTshare any numbers. The prefix Ir means “not” so irrational means not rational.
In determining if a radical number such as a is an irrational number or a rational number, be sure to
simplify it first. If the number a is a perfect square number, then the radical will simplify into an
integer. For example, if 2b a and b is an integer, then a is a perfect square number and a = b and
a b .
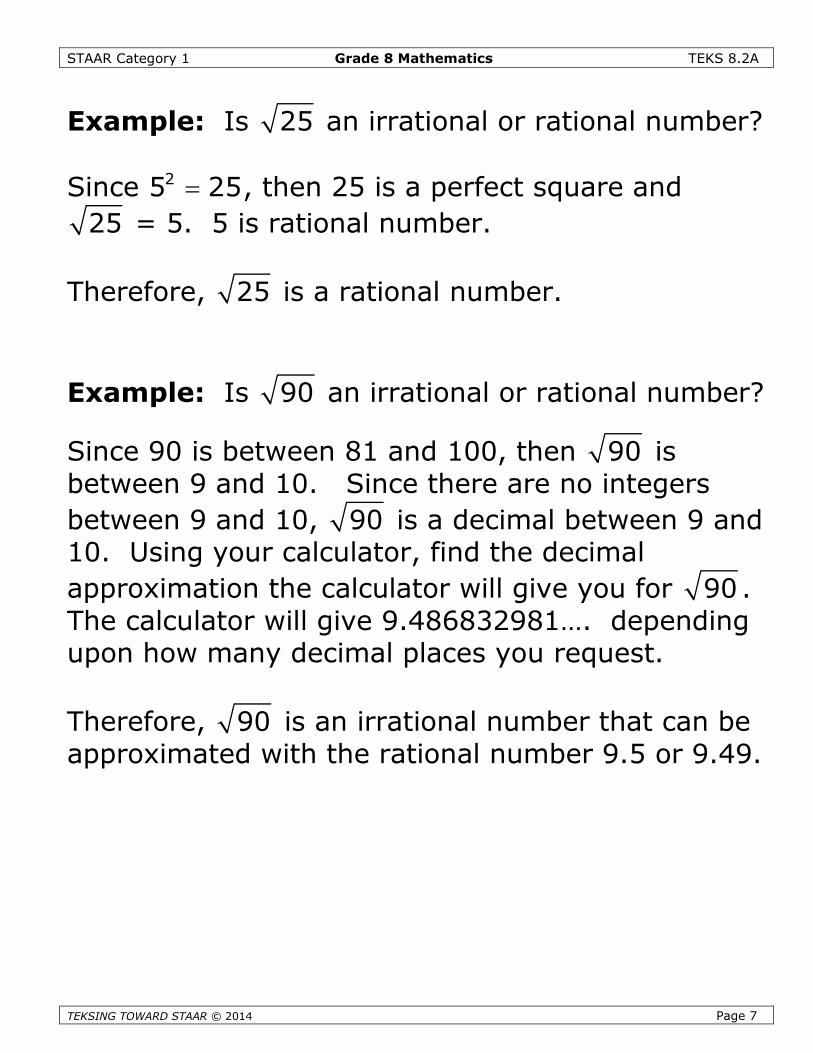
Example: Is 25 an irrational or rational number?
Since 25 25 , then 25 is a perfect square and 25 = 5. 5 is rational number.
Therefore, 25 is a rational number.
Example: Is 90 an irrational or rational number?
Since 90 is between 81 and 100, then 90 is between 9 and 10. Since there are no integers between
9 and 10, 90 is a decimal. Using your calculator, find the decimal approximation the calculator will
give you for 90 . The calculator will give 9.486832981…. depending upon how many decimal places
you request.
Rational numbers
Integers
Whole numbers
Counting numbers
Irrationalnumbers
REAL NUMBERS

STAAR Category 1 Grade 8 Mathematics TEKS 8.2A
TEKSING TOWARD STAAR © 2014 Page 3
Therefore, 90 is an irrational number that can be approximated with the rational number 9.5 or 9.49.
Identifying Number Sets Used in Real-World Situations
Numbers used in real-world situations can be rational numbers or irrational numbers.
Example: The number of dollar bills in a person’s wallet
Whole numbers This set best describes the number of dollar bills because the person may have 0, 1, 2,3, … dollar bills in his wallet.
Example: The length of a side of a square with an area of 25 square feet
Whole Number Since the formula for the area of a square is 2s = A , then s A (take square root
of both sides but use only the positive or principal root since length has to be positive.)
25 5s and 5 is a whole number.
Example: The length of a side of a square with an area of 40 square feet
Irrational number Since the formula for the area of a square is 2s = A , then s A (take square
root of both sides but use only the positive or principal root since length has to be positive.) Since 40
is between the perfect squares 36 and 49, 40 will be a decimal between 6 and 7. There is NOT a
terminating or repeating decimal that when multiplied times itself will have a product of 40. 40 can
be approximated with a rational number such as 6.3.
If the square root of a whole number is rational, then its prime factorization can be divided into twoequal sets.
Example: 144 is rational because the prime factorization of 144 is (3 2 2)(3 2 2) . Since the
two sets are identical, the 144 =3 2 2 12 , which is a whole number and thus rational.

STAAR Category 1 Grade 8 Mathematics TEKS 8.2A
TEKSING TOWARD STAAR © 2014 Page 4
Understanding Real Numbers
A group of items or numbers is called a set. A partof that set is called a subset. The set of numberswe use in our every day lives is the set of realnumbers. These are the numbers that are locatedon a number line. One subset of the real numbersis the set of whole numbers. Whole numbers arethe numbers 0, 1, 2, 3, 4… Each of these numbershas an opposite 0, -1, -2, -3, -4… When the wholenumbers and their opposites are joined togetherthe set of integers is created.
The set of integers are indicated in set notation as{…-4, -3, -2, -1, 0, 1, 2, 3, 4…}.
If zero is removed from the set of whole numbers,the set of natural numbers or countingnumbers is created. The natural numbers can beindicated in set notation as 1, 2, 3, 4, 5, 6, 7,... .
The whole numbers, counting numbers, andintegers are all subsets of a larger set called the
rational numbers. When a number of the forma
bis
created where a and b are both integers but 0b ,then the set of rational numbers is created. For
example, the ratio of 3 to 5 creates3
5, so
3
5is a

STAAR Category 1 Grade 8 Mathematics TEKS 8.2A
TEKSING TOWARD STAAR © 2014 Page 5
rational number. The ratio of 20 to 2 creates
20or 10
2which is a whole number and also a
rational number.
A mixed number like 51
2is a rational number
because it can be rewritten as an improper fraction,11
2, which is the ratio of two integers.
The real numbers, which are all the numbers on anumber line, are divided into 2 large subsets. Therational numbers and the irrational numbers.
The irrational numbers are made up all numbersthat CANNOT be expressed as a ratio of twointegers. Some irrational numbers are numbers
like 2, 3, 5 and . Any decimal that does NOT
terminate and does NOT repeat is an irrationalnumbers. For example, 5.123456… is an irrationaldecimal.
A repeating decimal has a block of one or moredigits that repeats indefinitely. Those decimals,such as 0.3333333…. or 4.1212121212….arerational decimals.

STAAR Category 1 Grade 8 Mathematics TEKS 8.2A
TEKSING TOWARD STAAR © 2014 Page 6
The relationship between these sets of subsets ofthe real numbers can be shown with a Venndiagram.
This diagram shows that the rational numbers andthe irrational number are disjointed. They do NOTshare any numbers. The prefix Ir means “not” soirrational means “not rational”.
In determining if a radical number such as a is anirrational number or a rational number, be sure tosimplify it first. If the number a is a perfect squarenumber, then the radical will simplify into an
integer. For example, if 2b a and b is an integer,
then a is a perfect square number and a= b and
a b . a= b is called the principal root.
Rational numbers
Integers
Whole numbers
Counting numbers
Irrationalnumbers
REAL NUMBERS
STAAR Category 1 Grade 8 Mathematics TEKS 8.2A
TEKSING TOWARD STAAR © 2014 Page 7
Example: Is 25 an irrational or rational number?
Since 25 25 , then 25 is a perfect square and
25 = 5. 5 is rational number.
Therefore, 25 is a rational number.
Example: Is 90 an irrational or rational number?
Since 90 is between 81 and 100, then 90 isbetween 9 and 10. Since there are no integers
between 9 and 10, 90 is a decimal between 9 and10. Using your calculator, find the decimal
approximation the calculator will give you for 90 .The calculator will give 9.486832981…. dependingupon how many decimal places you request.
Therefore, 90 is an irrational number that can beapproximated with the rational number 9.5 or 9.49.

STAAR Category 1 Grade 8 Mathematics TEKS 8.2A
TEKS
Problem-Solving Model
Step Description of Step1 Analyze the given information.
Summarize the problem in your own words. Describe the main idea of the problem. Identify information needed to solve the problem.
2 Formulate a plan or strategy. Draw a picture or diagram. Guess and check. Find a pattern. Act it out. Create or use a chart or table. Work a simpler problem. Work backwards. Make an organized list. Use logical reasoning. Brainstorm. Write a number sentence or an equation
3 Determine a solution. Estimate the solution to the problem. Solve the problem.
4 Justify the solution. Explain why your solution solves the problem.
ING TOWARD STAAR © 2014 Page 8
5 Evaluate the process and the reasonablenessof your solution. Make sure the solution matches the problem. Solve the problem in a different way.

STAAR Category 1 Grade 8 Mathematics TEKS 8.2A
TEKSING TOWARD STAAR © 2014 Page 9
Problem-Solving Questions
Directions:
Work with a partner.
Write your answers on notebook paper.
Answer questions 1-3.
Complete the solution to the problem(s).
Answer questions 4-10.
1. What is the main idea of this problem?
2. What are the supporting details in this problem?
3. What skills, concepts, and understanding of math vocabulary areneeded to be able to answer this problem?
4. Did this problem involve mathematics arising in everyday life, society,or the work place?
5. What is a good problem solving strategy for this problem?
6. Can you explain how you used any math tools, mental math,estimation, or number sense to solve this problem?
7. Did this problem involve using multiple representations (symbols,diagrams, graphs, math language)?
8. Did you use any relationships to solve this problem?
9. How can you justify your solution to the problem?
10. How can you check for reasonableness of your solution to thisproblem?
STAAR Category 1 Grade 8 Mathematics TEKS 8.2A
TEKSING TOWARD STAAR © 2014
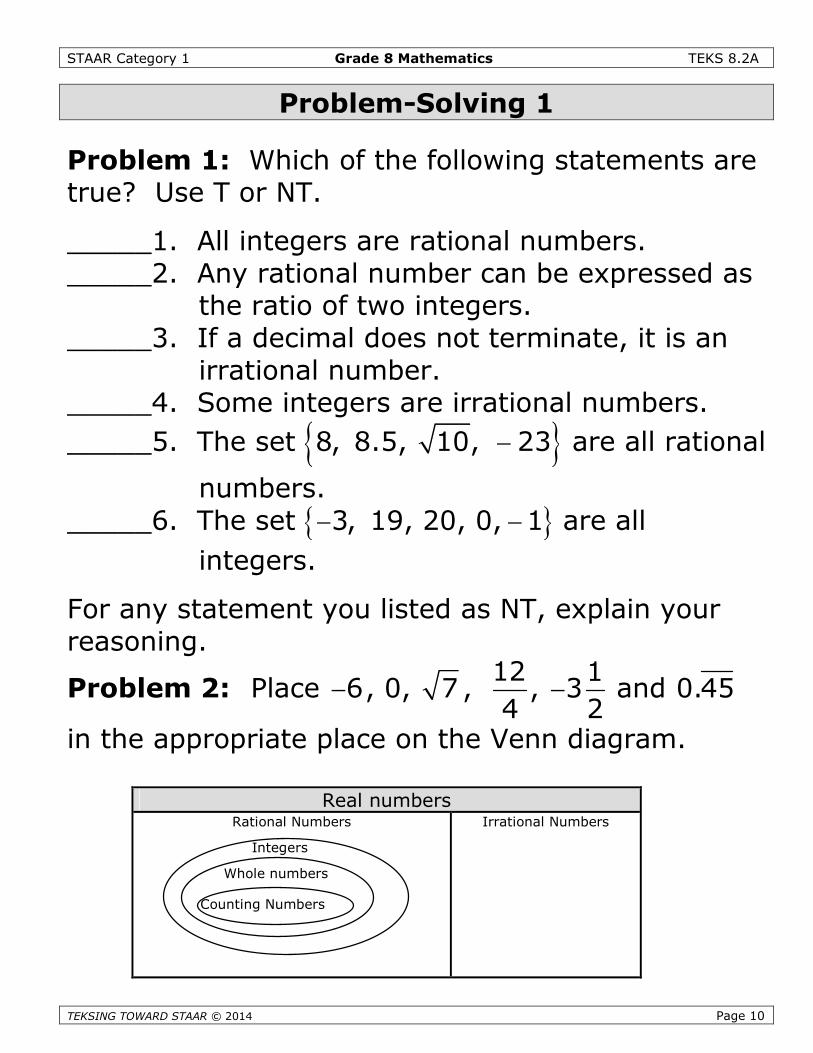
Problem-Solving 1
Problem 1: Which of the following statements aretrue? Use T or NT.
_____1. All integers are rational numbers._____2. Any rational number can be expressed as
the ratio of two integers._____3. If a decimal does not terminate, it is an
irrational number._____4. Some integers are irrational numbers.
_____5. The set 8, 8.5, 1 0, 23 are all rational
numbers._____6. The set 3, 19, 20, 0, 1 are all
integers.
For any statement you listed as NT, explain yourreasoning.
Problem 2: Place 6 , 0, 7 ,12
4,
13
2 and 0.45
in the appropriate place on the Venn diagram.
Rational Num
Integers
Whole numbe
Counting Number
Real numbers
Page 10
bers
rs
s
Irrational Numbers

STAAR Category 1 Grade 8 Mathematics TEKS 8.2A
TEKSING
Student Activity 1
Work with your partner to answer the following questions.
Problem 1: Complete the following statements by filling in the blank with an appropriate word orwords.
A set of numbers is a __________ of numbers.
A subset is a ___________ of a set.
The set {1, 2, 3, 4, 5, 6, …} is called the set of ______________ ____________.
The set {…-6, -5, -4, -3, -2, -1, 0, 1, 2, 3, 4, 5, 6, …} is called the set of ______________.
The set of numbers that can be expressed as the ratio of two integers is the set of ___________numbers.
A non-terminating, non-repeating decimal is a(n) ____________________ number.
A repeating decimal is a decimal that ________________________ and is a(n) _________ number.
4.01020304…. is a ____________________, _________________ decimal and is a __________number.
Problem 2: Place a √ in each column that names a set the given number belongs to.
IrrationalNumber
RationalNumber
IntegerWhole
NumberCountingNumber
16
0
1.5
21
4
42
235
3
1,250
0.12
3.11121314…
TOWARD STAAR © 2014 Page 11
8.4
STAAR Category 1 Grade 8 Mathematics TEKS 8.2A
TEKSING TOWARD STAAR © 2014 Page 12
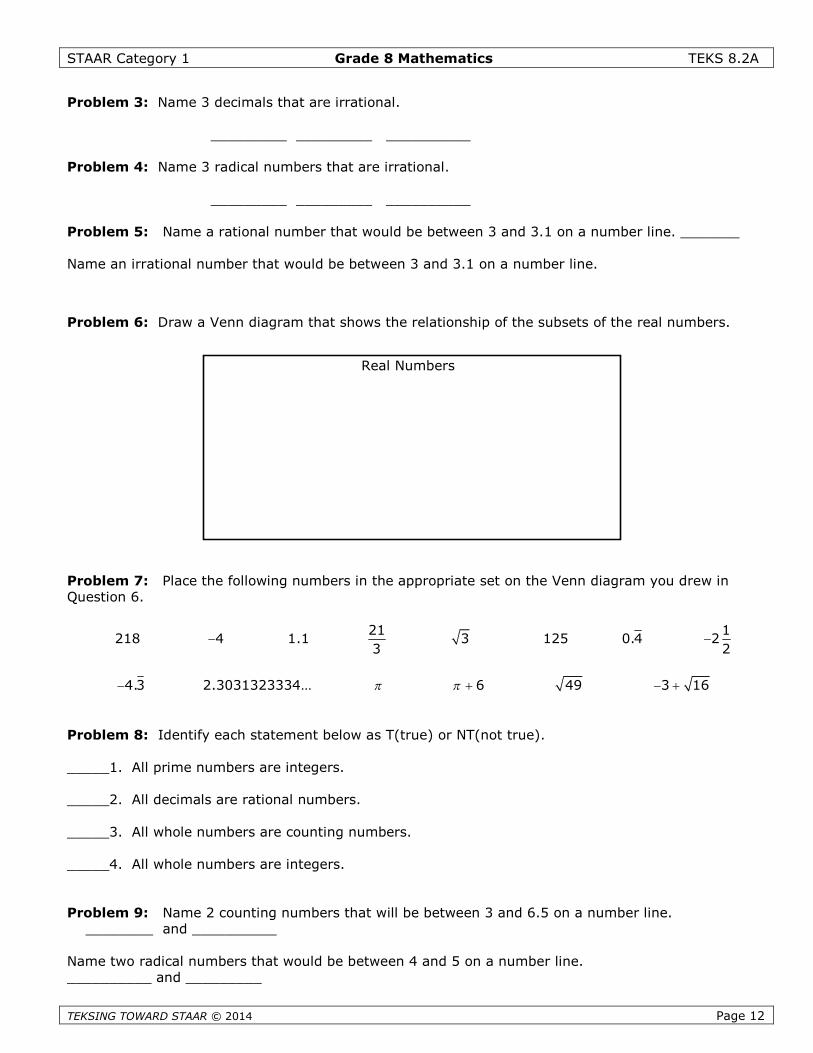
Problem 3: Name 3 decimals that are irrational.
_________ _________ __________
Problem 4: Name 3 radical numbers that are irrational.
_________ _________ __________
Problem 5: Name a rational number that would be between 3 and 3.1 on a number line. _______
Name an irrational number that would be between 3 and 3.1 on a number line.
Problem 6: Draw a Venn diagram that shows the relationship of the subsets of the real numbers.
Problem 7: Place the following numbers in the appropriate set on the Venn diagram you drew inQuestion 6.
218 4 1.121
3 3 125 0.4
12
2
4.3 2.3031323334… 6 49 3 1 6
Problem 8: Identify each statement below as T(true) or NT(not true).
_____1. All prime numbers are integers.
_____2. All decimals are rational numbers.
_____3. All whole numbers are counting numbers.
_____4. All whole numbers are integers.
Problem 9: Name 2 counting numbers that will be between 3 and 6.5 on a number line.________ and __________
Name two radical numbers that would be between 4 and 5 on a number line.__________ and _________
Real Numbers

STAAR Category 1 Grade 8 Mathematics TEKS 8.2A
TEKSING TOWARD STAAR © 2014 Page 13
Problem 10: Using a C for counting numbers, W for whole numbers, I for integers, R for rationalnumbers, and IR for irrational numbers identify all the sets of numbers that have members in the givenset.
1, 3, 14, 13 ___________________
22, 3.14, 41, 0
7
___________________
420, 1.1, , 3, 2.121121112...
3
________________
Problem 11: Read each statement below. Decide if the statement is true or false. If it is false, givean explanation for your decision.
If a number is negative, it is an integer.______________________________________________
______________________________________________________________________________.
If a decimal is irrational, it can not be written exact. ____________________________________
______________________________________________________________________________.
Problem 12: Place the following numbers on the number line below.
2 2 114, 3 , 6, 2.5, ,
3 5 3
Problem 13: Place the following numbers on the number line below.
1 1 122, 1 , 16, 24, ,
3 4 3

STAAR Category 1 Grade 8 Mathematics TEKS 8.2A
TEKSING TOWARD STAAR © 2014 Page 14
Understanding Number Sets in Real-World Situations
Numbers used in real-world situations can berational numbers or irrational numbers. However,irrational numbers are often approximated with arational number to do calculations. For example, ifthe circumference of a circle is 16 inches, acarpenter would approximate it by using a rationalsubstitution for . Depending on the accuracyneeded, he could use 3 or 3.14 or 3.14156.
Example: The number of dollar bills in a person’swallet
Whole numbers This set best describes the numberof dollar bills because the person may have 0, 1, 2,3, … dollar bills in his wallet.
Example: The length of a side of a square with anarea of 25 square feet
Whole Number Since the formula for the area of
a square is 2s = A , then s A (take square rootof both sides but use only the positive or principalroot since length has to be positive.)
25 5s and 5 is a whole number.

STAAR Category 1 Grade 8 Mathematics TEKS 8.2A
TEKSING TOWARD STAAR © 2014 Page 15
Example: The length of a side of a square with anarea of 40 square feet
Irrational number Since the formula for the area
of a square is 2s = A , then s A (take squareroot of both sides but use only the positive orprincipal root since length has to be positive.)
40s . Since 40 is between the perfect squares
36 and 49, 40 will be a decimal between 6 and 7.There is NOT a terminating or repeating decimalthat when multiplied times itself will have a product
of 40. 40 can be approximated with a rationalnumber such as 6.3.
If the square root of a whole number is rational,then its prime factorization can be divided into twoequal sets.
Example: 144 is rational because the primefactorization of 144 is (3 2 2)(3 2 2) . Since the
two sets are identical, the 144 = 3 2 2 12 ,which is a whole number and thus rational.

STAAR Category 1 Grade 8 Mathematics TEKS 8.2A
TEKSING TOWARD STAAR © 2014 Page 16
Problem-Solving 2
Problem 1: Identify the set(s) of numbers thatbest describe the situations below.
Numbers used in an area code______________
Score for the home team in soccer_______________
Length of a side of a square with area A_______________
Problem 2: Place the square root of each countingnumber 1-18 on the Venn diagram below.
Square Roots of Counting Numbers 1-18
Irrational Rationalnumbers numbers
Real Numbers
W
STAAR Category 1 Grade 8 Mathematics TEKS 8.2A
TEKSING TOWARD STAAR © 2014 Page 17
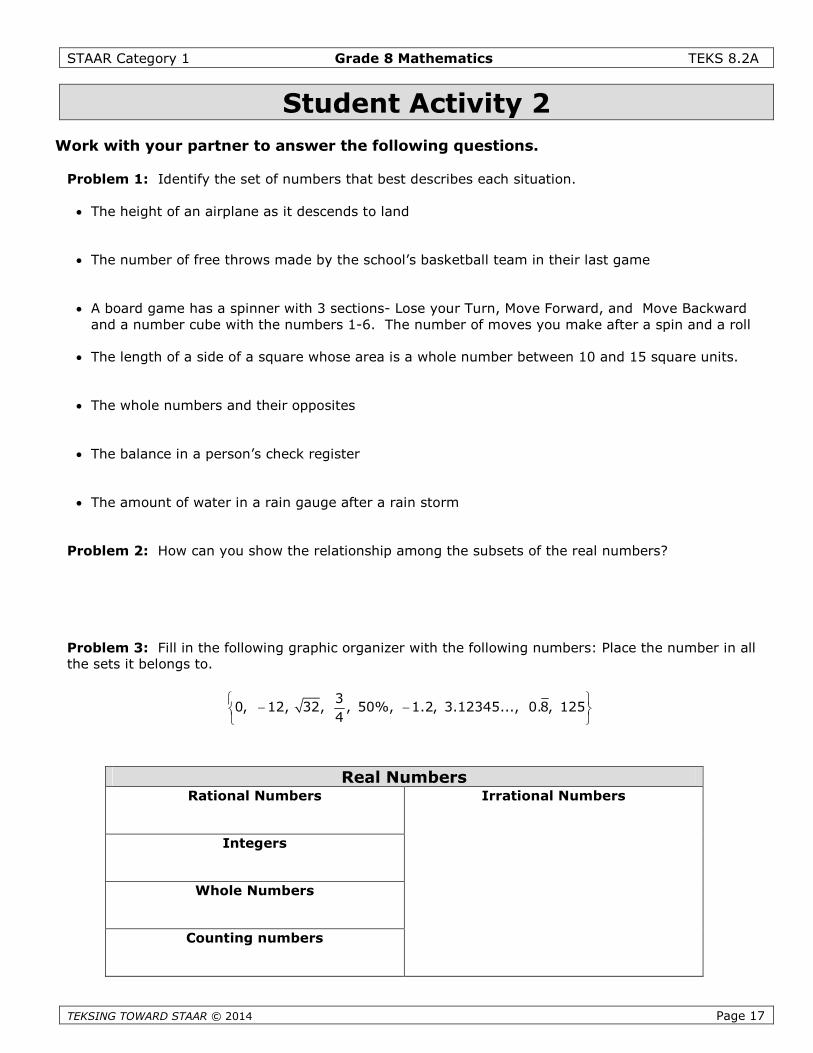
Student Activity 2
ork with your partner to answer the following questions.
Problem 1: Identify the set of numbers that best describes each situation.
The height of an airplane as it descends to land
The number of free throws made by the school’s basketball team in their last game
A board game has a spinner with 3 sections- Lose your Turn, Move Forward, and Move Backwardand a number cube with the numbers 1-6. The number of moves you make after a spin and a roll
The length of a side of a square whose area is a whole number between 10 and 15 square units.
The whole numbers and their opposites
The balance in a person’s check register
The amount of water in a rain gauge after a rain storm
Problem 2: How can you show the relationship among the subsets of the real numbers?
Problem 3: Fill in the following graphic organizer with the following numbers: Place the number in allthe sets it belongs to.
30, 12, 32, , 50%, 1.2, 3.12345..., 0.8, 125
4
Real NumbersRational Numbers
Integers
Whole Numbers
Counting numbers
Irrational Numbers

STAAR Category 1 Grade 8 Mathematics TEKS 8.2A
TEKSING TOWARD STAAR © 2014 Page 18
Problem 4: Name a negative number that is not an integer. ______________________
Problem 5: Name a negative number that is irrational.
Problem 6: What do you think the repeating decimal 0.999999…. represents?
Problem 7: Circle the irrational numbers below.
64 1.213141 1.213141…
72 8.1 3
0.1234... 3
24
Problem 8: To find the ratio of integers that a repeating decimal represents, look at the steps below.
Find the ratio of integers to represent 0.12121212….
Let 0.12121212...x Since there are two repeating digits, we multiply both sides by 100.
100 12.121212...x
100 12.12121212....
0.12121212...
x
x
Then we subtract the first equation from the second.
99 12x Divide both sides by 99
99 12 4
99 99 33
x 0.121212…… represents the rational number
4
33.
Following those steps find the ratio of integers that represents 0.10101010…

STAAR Category 1 Grade 8 Mathematics TEKS 8.2A
TEKSING
NAME___________________ DATE_____________________ SCORE ___/5
8.2A Skills and Concepts Homework 1
1. Draw a Venn diagram or graphic organizer to show the relationship of the subsets of the realnumbers.
2. Place a √ in each column that the given number belongs to.
3. Nam
4. Nam
5. Namkno
IrrationalNumber
RationalNumber
Integer WholeNumber
CountingNumber
32
8.123
103
53
8
0.343434...
7
1.213141…
TOWARD STAAR © 2014 Page 19
e a whole number that is NOT a counting number. ________
e 3 rational numbers that are NOT positive and are NOT integers.
___________ ___________ _________
e a irrational number that is located between 31.5 and 31.6 on a number line. How do youw it is irrational?
0
STAAR Category 1 Grade 8 Mathematics TEKS 8.2A
TEKSING TOWARD STAAR © 2014 Page 20
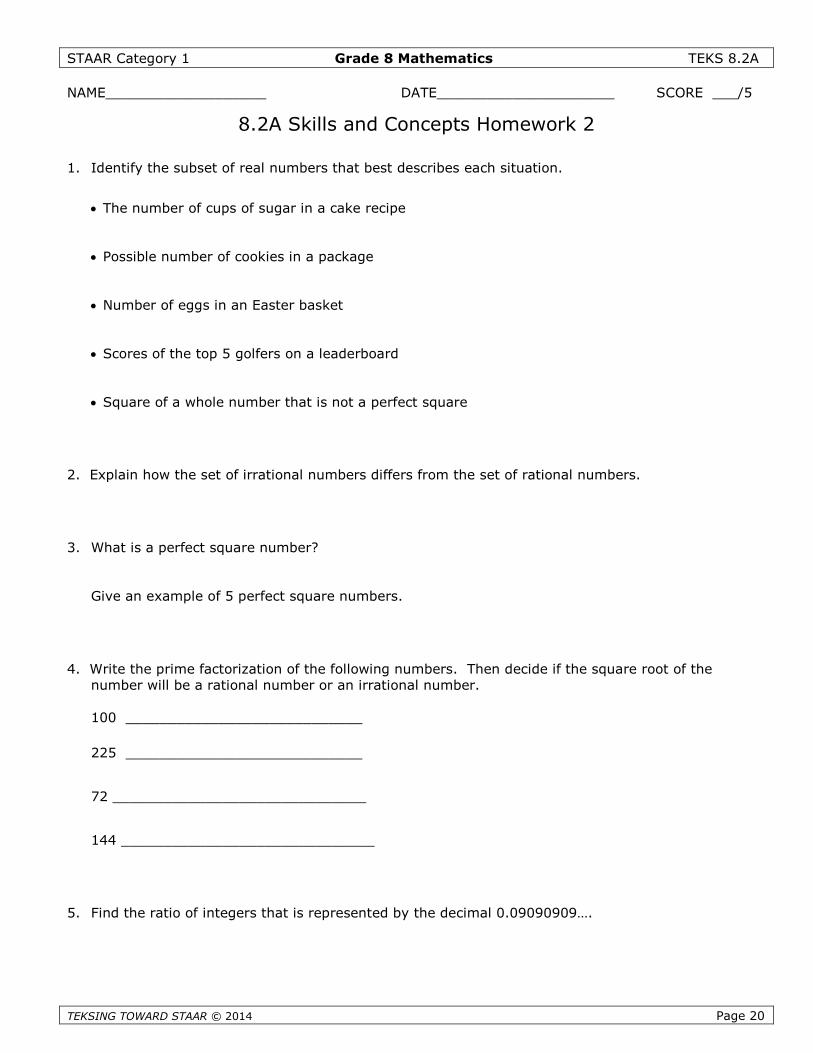
NAME___________________ DATE_____________________ SCORE ___/5
8.2A Skills and Concepts Homework 2
1. Identify the subset of real numbers that best describes each situation.
The number of cups of sugar in a cake recipe
Possible number of cookies in a package
Number of eggs in an Easter basket
Scores of the top 5 golfers on a leaderboard
Square of a whole number that is not a perfect square
2. Explain how the set of irrational numbers differs from the set of rational numbers.
3. What is a perfect square number?
Give an example of 5 perfect square numbers.
4. Write the prime factorization of the following numbers. Then decide if the square root of thenumber will be a rational number or an irrational number.
100 ____________________________
225 ____________________________
72 ______________________________
144 ______________________________
5. Find the ratio of integers that is represented by the decimal 0.09090909….

STAAR Category 1 Grade 8 Mathematics TEKS 8.2A
TEKSING TOWARD STAAR © 2014 Page 21
NAME___________________ DATE_____________________ SCORE ___/10
Mini-Assessment 8.2A
1. Which number is an irrational number?
A 9
B 49
C 100
D 120
2. Which represents a rational number?
F 110
G 324
H 65
J 80
3. Which statement is NOT true?
A Every rational number is a real number.
B Every counting number is a whole number.
C Every integer is a rational number.
D Every decimal number is an irrational number.
4. A square has an area of x square units. x is a whole number between 20 and 24. What set ofnumber best describes the length of the side of the square?
F Rational numbers
G Counting numbers
H Integers
J Irrational numbers

STAAR Category 1 Grade 8 Mathematics TEKS 8.2A
TEKSING TOWARD STAAR © 2014 Page 22
5. Which of the following represents a set of irrational numbers?
A 3, 4, 6, 5
B 1.1, 1.234..., 35,
C11 2
, , 1.121314..., 34 4
D Not Here
6. This diagram shows the relationship of the subsets of the real number system.
Which of the following sets contain only numbers that are NOT integers?
F 6, 5, 1.25
G3
, 4.5, 0.35
H 8, 4, 1 3, 25
J16
, 8, 7, 94
7. Which statement is NOT true?
A 0.121212… is a rational number.
B 0.34353637 is an irrational number.
C 8.14 is a rational number.
D 5.12345… is an irrational number.
Real Numbers
Rational Numbers
Integers
Whole Numbers
Natural Numbers
IrrationalNumbers

STAAR Category 1 Grade 8 Mathematics TEKS 8.2A
TEKSING TOWARD STAAR © 2014 Page 23
8. Which of the following is NOT a subset of the rational numbers?
F Integers
G Whole Numbers
H Perfect square integers
J Irrational numbers
9. Margaret was asked to write 4 irrational numbers. Her list included the following numbers:
1.212223… 30 3 2
2
Which of the numbers Margaret wrote are irrational numbers?
A None of them
B All of them
C 1.212223… and 30 only
D 30 and 3 and 2
2only
10. Marian was asked to create a set of numbers so that 2 were integers, 2 were rational numbers thatwere not integers, and 2 were irrational numbers. Which of the following sets would satisfy thecriteria for Marian’s set?
F5
11, , -3, 4, 1.5,12
G20
9, 100, 1.1111..., , -6,3
H24
5 2, 3 , 3, -14, 3.5,12
J1
20, 12.3456..., 9, -14, 28, 42

Six Weeks 1Review andAssessment

STAAR Category 1, 2, 3, 4 Grade 8 Mathematics Six Weeks 1
TEKSING TOWARD STAAR © 2014 Page 1
Six Weeks 1 Review
This review can be used in the same manner as a Student Activity from the lessons. Notes can be usedto complete the review and they can work with a partner. You can assign different portions to differentpartner pairs to be responsible for debriefing for the entire class. Students can complete any answersthey did not get before the debriefing. They just need to use a different color to record any additionalanswers.
It can be completed entirely in class, or it can be taken home to be completed and then debriefed inclass prior to the six week assessment.

STAAR Category 1, 2, 3, 4 Grade 8 Mathematics Six Weeks 1
TEKSING TO
Six Weeks 1 Review
Lesson 1: 8.2A
1. Place a √ in each column that the given number belongs to.
2. What t
3. What t
Lesson 2
1. What i
Graph
2. Betwe
Which
Lesson 3
1. Order
IrrationalNumber
RationalNumber
Integer WholeNumber
CountingNumber
14
2.6
113
5
8
WARD STAAR © 2014 Page 2
ype of decimals are irrational numbers?
ype of decimals are rational numbers?
: 8.2B
s a good rational approximation for 20 ?
20 on the number line below.
en what two counting numbers is 75 located on a number line?
counting number is it closer to? Why?
: 8.2D
the following sets of real numbers from least to greatest.
4 3.8 1 5 1 7
4 2 6 5 3 1 7
3
4 4.5 5 5.5 6

STAAR Category 1, 2, 3, 4 Grade 8 Mathematics Six Weeks 1
TEKSING TOWARD STAAR © 2014 Page 3
2. Place an inequality symbol between the following pairs of numbers to make a true statement.
1
4 _______ 1 72
3.2_______ 8
Lesson 4: 8.10A 8.8D 8.3A
T or F
1. Two dilated figures in a coordinate plane with the origin as the center of dilation will always besimilar. _________
2. Two dilated figures in a coordinate plane with the origin as the center of dilation will always havethe same orientation in the plane. __________
3. An image is always larger than the preimage. __________
How many pairs of angles in two triangles must be congruent before you know the triangles aresimilar? ___________
Triangle 1 has two interior angles that measure 37° and 79°. Triangle 2 has two interior angles thatmeasure 37° and 64°. Are the two triangles similar? Explain your answer.
If triangle ABC is similar to triangle FGH, write the three ratios that must be equal.
Lesson 5: 8.8A 8.8C
1. The school choir is selling fruit cakes to earn money for new robes. The fruit cakes sell for $30each. The company charges a $125 delivery fee and $9 per cake. Write an inequality that can beused to determine the number of cakes the choir must sell to make a profit.
2. If these two figures have the same perimeter, what is the perimeter of each figure?
7x
12x 10x 1x
15x

STAAR Category 1, 2, 3, 4 Grade 8 Mathematics Six Weeks 1
TEKSING TOWARD STAAR © 2014 Page 4
Lesson 6: 8.6A 8.6B 8.7A
1. Write the expression that represents the volume of a cylinder if its radius is 7 inches and its heightis 12 inches.
2. A cone and a cylinder have congruent bases and heights. The volume of the cone is approximately20 cubic inches. What is the approximate volume of the cylinder?
3. A cone has a diameter of 12 inches and a height of 10 inches. Draw and label a model of the cone.Find the volume of the cone.
The cylinder at the left has a radius of 6 inches and a height of 14inches. What is the volume of the cylinder?
If the cylinder at the left has a volume of 300 cubic inches and a
height of 12 inches, what is the radius of the cylinder?
What is the diameter of the cylinder?
Lesson 7: 8.2C
1. Write the following numbers in scientific notation.
36, 200 0.0045 12 billion
2. Write the following numbers in standard decimal notation.
34.13 10 47.1 10 58.423 10

STAAR Category 1, 2, 3, 4 Grade 8 Mathematics Six Weeks 1
TEKSING TOWARD STAAR © 2014 Page 5
Lesson 8: 8.8D
1. The angles of a triangle measures of 88°, 53° and 39°. What are the measures of the three
exterior angles.
2. What is the sum of the measures of the three angles of any triangle?
3. If two angles of a triangle measure 54° and 72°. What is the measure of the third angle of thetriangle?
True or false: One exterior angle of the triangle will measure 126°.
Lesson 9: 8.5A 8.5E
1. In a linear proportional relationship, what is the constant of proportionality?
2. If ( 5, 10) belongs to a linear proportional relationship, name two more ordered pairs that wouldbelong to the relationship.
3. If y varies directly with x and y = 20 when x = 4, what is the value of y when x = 20?
The graph of a direct variation will be a ___________ that passes through the _________.
Lesson 10: 8.12A
1. What does APR stand for?
Why is it important to know the APR when borrowing money or using a credit card?
2. Joseph can get a bank loan for $5,000 at 8% for 2 years with a monthly payment of $226.14. Hecan also borrow the money from an uncle who will charge him 8% but he wants to term of theloan to be 18 months. His monthly payment to the uncle would be $295.70.
a. What is the payoff amount if he borrows the money from the bank?
b. What is the payoff amount if he borrows the money from his uncle?
c. Which will have the smaller payoff amount? How much less?
d. If he figures the largest monthly payment he can afford is $300, which loan should he take?

GRADE 8 MATHEMATICS
TEKSING TOWARD STAAR © 2014 Page 1
TEKS/STAAR Six Weeks 1 Assessment
Make 1 copy of the Six Weeks Assessment for each student. Students answer thesequestions individually. Record class performance on the Class Profile Sheet andindividual student performance on the Individual Student Profile Sheet.
Answer Key: STAAR Category/TEKS
1. G Category 1/8.2A
2. H Category 1/8.2B
3. C Category 1/8.2D
4. J Category 3/8.8D
5. B Category 3/8.3A
6. F Category 2/8.8C
7. D Category 3/8.7A
8. G Category 3/8.10A
9. B Category 1/8.2C
10. H Category 3/8.8D
11. C Category 2/8.5A
12. 811.08 Category 4/8.12A
13. C Category 2/8.5E
14. G Category 3/8.7A
15. C Category 1/8.2D
16. F Category 1/8.6B
17. C Category 2/8.5E
18. J Category 1/8.2C
19. A Category 2/8.8C
20. G Category 2/8.8A

GRADE 8 MATHEMATICS
TEKSING TOWARD STAAR © 2014 Page 2
TEKS/STAAR Six Weeks 1 Assessment
1. This Venn diagram shows the relationship of the subsets of the real number system.
Which of the following sets contain only irrational numbers?
A 7, 3, 17
B 4.1121314..., 3, 0.6
C 5 2, 14.3456..., , 125
D24
, 3 , 17.616116111..., 298
2. Which of the following is the best approximation for 38 ?
F 19
G 5.9
H 6.2
J 6.6
Rational Numbers
Integers
Whole Numbers
Counting Numbers
Real Numbers
IrrationalNumbers

GRADE 8 MATHEMATICS
TEKSING TOWARD STAAR © 2014 Page 2
3. Which rational number is between2
63
and 48 ?
A 6.3
B 6.5
C 6.7
D 7
4. The following pairs of angle measures are the measures of two angles of two triangles. Which pairof triangles would be similar because they have two pair of congruent angles?
F 51° and 30°; 109° and 30° H 58° and 30°; 90° and 58°
G 92° and 70°; 28° and 70° J 35° and 82°; 82° and 63°
5. Look at the triangles on the grid below. A B C is a dilation of ABC with the origin as the center
of dilation.
Which statement is NOT true?
AA B B C
AB BC
BA C BC
AC B C
CA B A C
AB AC
DB C BC
A C AC
x
y
-9 -8 –7 -6 -5 -4 -3 -2 -1 1 2 3 4 5 6 7 8 9
9
8
7
6
5
4
3
2
1
-1
-2
-3
-4
-5
-6
-7
-8
-9
A
B
C
Bʹ
C′
A′

GRADE 8 MATHEMATICS
TEKSING TOWARD STAAR © 2014 Page 3
6. Jules has $1,000 and is spending $40 per week. Kelsey has $400 and is saving $20 a week. Inhow many weeks, will Jules and Kelsey have the same amount of money?
F 10
G 12
H 20
J 15
7. A cone has a radius that is 10 inches long and a height of 15 inches. What is the volume of thecone?
A 81 cubic inches
B 480 cubic inches
C 320 cubic inches
D 500 cubic inches
8. David is listing the properties of orientation and congruence about a figure and its dilation in acoordinate plane with the origin as the center of dilation. His list is:
a. The preimage and image will be similar.b. The preimage and image will have the same orientation in the plane.c. The preimage will always be smaller than the image.d. The preimage and the image will have corresponding angles congruent.
Which of David’s statements are correct?
F a and b only
G a, b, and d only
H a and d only
J All of the above
9. Which expression represents a number that is larger than 5,000 but smaller than 50,000?
A 46.0 10
B 36.0 10
C 45.8 10
D 25.8 10

GRADE 8 MATHEMATICS
TEKS
10. Triangle ABC has two interior angles with measures of 102° and 43°. Which of the following could
NOT be the measure of an exterior angle of triangle ABC?
F 78°
G 137°
H 88°
J 145°
11. The table below shows the relationship between the number of hours worked and the amountearned by Mr. Johnson.
12.
Number of Hours, h 1 3 6 8
ING TOWARD STAAR © 2014
Which statement is NOT true about the proportional relationship represented in the table?
A Mr. Johnson earns $11 per hour.
B The constant of proportionality is 11.
C 11h e
D Mr. Johnson will earn $110 for 10 hours of work.
Mr. James is going to buy a car for $12,000. He can finance with the car dealer for 3 years at 12%or he can borrow the money at the bank for 3 years at 8%.
What is the difference in the am
Record your answer on the grid
Amount earned, e $11 $33 $66 $88
Amount Term
$12,000 3 yr
$12,000 3 yr
Loan CalculationsInterest Rate Monthly Payment
12% $398.57
Page 4
ount of interest he will pay at 12% for 3 years and 8% for 3 years?
below. Be sure to use the correct place value.
8% $376.04
0 0 0 0 0 0
1 1 1 1 1 1
2 2 2 2 2 2
3 3 3 3 3 3
4 4 4 4 4 4
5 5 5 5 5 5
6 6 6 6 6 6
7 7 7 7 7 7
8 8 8 8 8 8
9 9 9 9 9 9
+
-
.
GRADE 8 MATHEMATICS
TEKSING TOWARD STAAR © 2014 Page 5
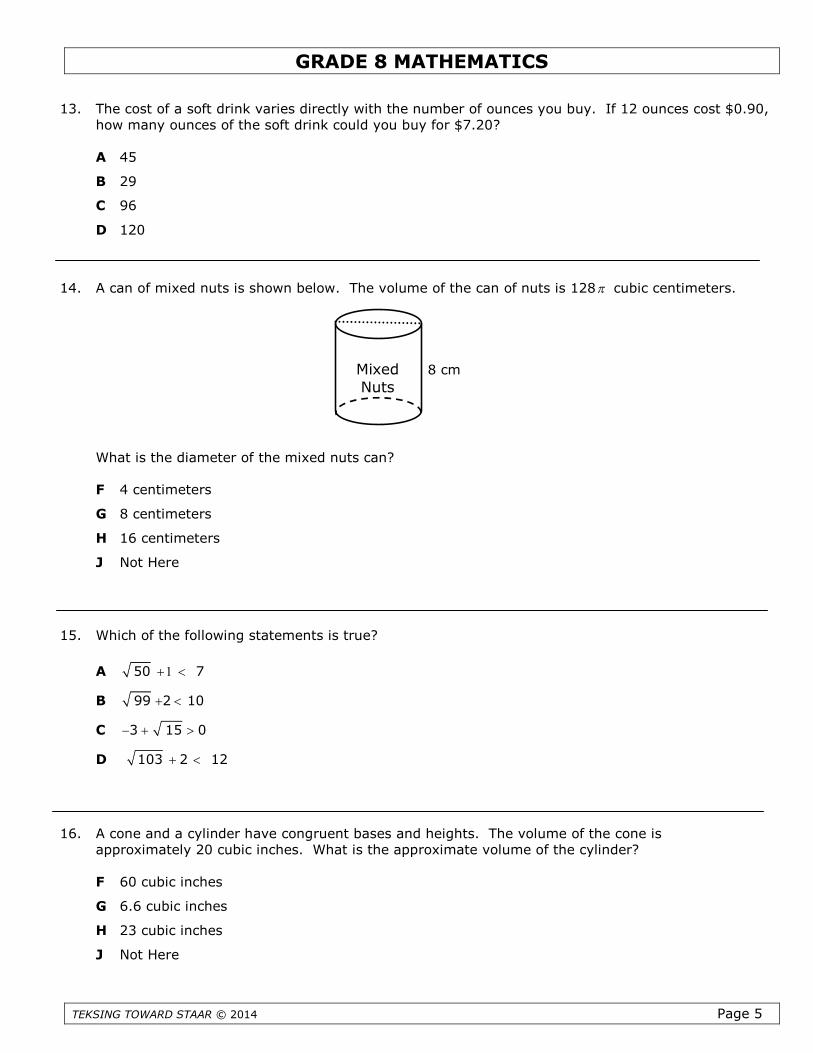
13. The cost of a soft drink varies directly with the number of ounces you buy. If 12 ounces cost $0.90,how many ounces of the soft drink could you buy for $7.20?
A 45
B 29
C 96
D 120
14. A can of mixed nuts is shown below. The volume of the can of nuts is 128 cubic centimeters.
What is the diameter of the mixed nuts can?
F 4 centimeters
G 8 centimeters
H 16 centimeters
J Not Here
15. Which of the following statements is true?
A 50 7
B 99 2 1 0
C 3 15 0
D 103 2 1 2
16. A cone and a cylinder have congruent bases and heights. The volume of the cone isapproximately 20 cubic inches. What is the approximate volume of the cylinder?
F 60 cubic inches
G 6.6 cubic inches
H 23 cubic inches
J Not Here
8 cmMixedNuts

GRADE 8 MATHEMATICS
TEKSING TOWARD STAAR © 2014 Page 6
17. If y varies directly with x and 8y when 12x , what will be the value of y when 15x ?
A 12
B 22.5
C 10
D 6.4
18. In Canada in 1998 the estimated number of households that owned 2 or more vehicles was63.939 10 . How is this number written in standard decimal notation?
F 3,939,000,000
G 393,900
H 39,390,000
J 3,939,000
19. A square and a rectangle have the same perimeter. The square has a side length of 6x units. Therectangle has a length of (5 8)x and a width of 6 units. For what value of x, will the square and
rectangle have the same perimeter?
A 2
B 4
C 5
D 3
20. Eight less than four times a number is the same as three times the number, x, increased by 24.Which equation describes this situation?
F 8 4 24 3x x
G 4 8 3 24x x
H 8 4 3 24x x
J 4 8 3 24x x
Scope and SequenceSix Weeks 3

TEKSING TOWARD STAAR SCOPE AND SEQUENCEGrade 8 Mathematics
TEKSING TOWARD STAAR 2014 Page 1
SIX WEEKS 3
Lesson TEKS-BASED LESSONSTAAR
CategoryStandard
SpiraledPractice
StudentActivity
ProblemSolving
Skills andConceptsHomework
Lesson 1____ days
8.5B/represent non-proportional linear relationships using …graphs, and equations that simplify to the form
, 0y mx b b .
8.5F/distinguish between proportional and non-proportionalsituations using graphs, and equations in the form y kx or
, 0y mx b b
Category 2Supporting
Category 2Supporting
SP 41SP 42SP 43
SA 1SA 2SA 3
PS 1PS 2
Homework 1Homework 2
Lesson 2____ days
8.5C/contrast bivariate sets of data that suggest a linearrelationship with bivariate sets of data that do not suggest aline relationship from a graphical representation
8.5D/use a trend line that approximates the linear relationshipbetween bivariate sets of data to make predictions
Category 4Supporting
Category 4Readiness
SP 44SP 45SP 46
SA 1SA 2
PS 1PS 2
Homework 1Homework 2
Lesson 3____ days
8.5I/write an equation in the form , 0y mx b b to model
a linear relationship between two quantities using ….tabular,and graphical representations
Category 2Readiness
SP 47SP 48
SA 1SA 2
PS 1PS 2
Homework 1Homework 2
Lesson 4____ days
8.5G/identify functions using sets of … mappings and graphs Category 2Readiness
SP 49SP 50
SA 1SA 2
PS 1PS 2
Homework 1Homework 2
Lesson 5____ days
8.6C/use models and diagrams to explain the PythagoreanTheorem
8.7C/use the Pythagorean Theorem and its converse to solveproblems
8.7D/determine the distance between two points on acoordinate plane using the Pythagorean Theorem
Category 3Supporting
Category 3Readiness
Category 3Supporting
SP 51SP 52SP 53
SA 1SA 2SA 3
PS 1PS 2PS 3
Homework 1Homework 2Homework 3
Lesson 6____ days
8.7A/solve problems involving the volume of…. spheres Category 3Readiness
SP 54SP 55SP 56
SA 1SA 2
PS 1PS 2
Homework 1Homework 2
TEKSING TOWARD STAAR SCOPE AND SEQUENCEGrade 8 Mathematics
TEKSING TOWARD STAAR 2014 Page 2
SIX WEEKS 3
Lesson TEKS-BASED LESSONSTAAR
CategoryStandard
SpiraledPractice
StudentActivity
ProblemSolving
Skills andConceptsHomework
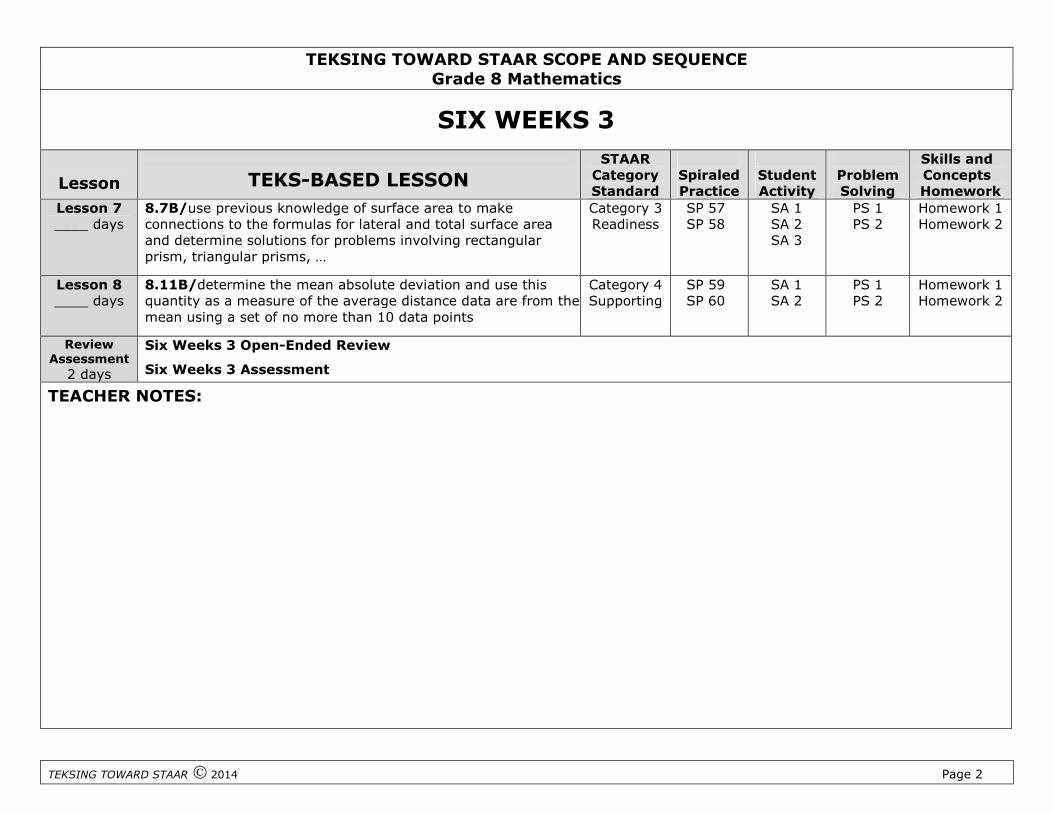
Lesson 7____ days
8.7B/use previous knowledge of surface area to makeconnections to the formulas for lateral and total surface areaand determine solutions for problems involving rectangularprism, triangular prisms, …
Category 3Readiness
SP 57SP 58
SA 1SA 2SA 3
PS 1PS 2
Homework 1Homework 2
Lesson 8____ days
8.11B/determine the mean absolute deviation and use thisquantity as a measure of the average distance data are from themean using a set of no more than 10 data points
Category 4Supporting
SP 59SP 60
SA 1SA 2
PS 1PS 2
Homework 1Homework 2
ReviewAssessment
2 days
Six Weeks 3 Open-Ended Review
Six Weeks 3 Assessment
TEACHER NOTES:
Materials List

GRADE 8 MATERIALS LIST - SIX WEEKS 3
TEKSING TOWARD STAAR © 2014 Page 1
SIX WEEKS LESSON ITEM QUANTITY
3 1 Graphing Calculator 1 per student
3 2 Graphing Calculator 1 per student3 3 Graphing Calculator 1 per student
3 4 Graphing Calculator 1 per student
3 5 Graphing Calculator
sheets of patty paperrulersscissorscolored pencilsPythagorean Theorem Patty PaperProof for projection
1 per student4-5 per student1 per student1 pair per student2 per student1
3 6 calculator 1 per student
3 7 rectangular prism,metric ruler,centimeter grid papercalculator
1 Per Pair of Students
1 Per Pair of Students
1 Per Student
1 Per Student
3 8 1-6 number cubes,calculatora markerClass Data Sheet
1 per student1 per student1 per pair of students1

Mini-AssessmentAnswer Key

GRADE 8 TEKS-BASED ASSESSMENTS – SIX WEEKS 3TEKS Correlation and Answer Key for Mini-Assessments
TEKSING TOWARD STAAR 2012 Page 1
Question NumberMini-AssessmentAnd TEKS Assessed 1 2 3 4 5 6 7 8 9 10
Lesson 1 8.5B/8.5F B8.5F
H8.5F
C8.5B
J8.5B
C8.5B
F8.5F
B8.5F
J8.5B
D8.5F
H8.5B
Lesson 2 8.5C/8.5D B8.5D
H8.5D
C8.5C
J8.5D
B8.5D
J8.5C
A8.5C
G8.5D
C8.5D
J8.5D
Lesson 3 8.5I C G D J B G A H B H
Lesson 4 8.5G D G C J D J A H D F
Lesson 5 8.6C/8.7C/8.7D C8.6C
G8.7D
A8.7C
J8.6C
B8.7C
F8.7D
A8.7C
F8.7D
D8.7C
H8.7C
Lesson 7 8.7A C G A J C 5425.9 B 103 B G
Lesson 8 8.7B A 204 B G C J B 448 C J
Lesson 9 8.11B B G C G A G D H A H

Six Weeks 3Lesson 8

STAAR Category 4 Grade 8 Mathematics TEKS 8.11B
TEKSING TOWARD STAAR © 2014 Page 1
8.11B Lesson and Assessment
Lesson Focus
For TEKS 8.11B, students should be able to demonstrate an understanding of how torepresent and analyze data. Students are expected to apply mathematical process standardsto use statistical procedures to describe data.
Students are expected to determine the mean absolute deviation and use this quantity as ameasure of the average distance data points are from the mean using a data set of no morethan 10 data points.
Process Standards Incorporated Into Lesson
8.1B Use a problem-solving model that incorporates analyzing given information,formulating a plan or strategy, determining a solution, justifying the solution, andevaluating the problem-solving process and the reasonableness of the solution
8.1C Select tools, including real objects, manipulatives, paper and pencil, and technology asappropriate, and techniques, including number sense as appropriate, to solveproblems.
8.1E Create and use representations to organize, record, and communicate mathematicalideas.
Materials Needed for Lesson
1. Per Student: 1 copy of all pages for student activities for this lesson, Skills and ConceptsHomework, and mini-assessment for this lesson
2. Per Student: Graphing Calculator
3. Student Activity 2: Per group of 2 students: 2 1-6 number cubes, 2 calculators, a marker
Math Background- Determining the Mean Absolute Deviation
A measure of center of data is a single number. One measure of center is the median (center datapoint). Another measure of center of data is the mean. The mean is the average of the data points.To find the mean, sum the data points and divide by the number of data points. The mean and mediando not have to be a data point in the data set.
A measure of variability is a single number that is used to describe the spread of the data. Themeasure of variability we have already studied is the range of the data. Another measure of variabilitythat we will study in this lesson is the mean absolute deviation. This value is often referred to asthe MAD, which is the mean distance between each value of the data set and the mean of the data set.
The steps to find the mean absolute deviation of a data set are:
1. Find the mean of the data set. (Sum the data points and divide by the number of data points.)
2. Find the distance each data point is from the mean. (A table might be helpful for this step.)
3. Find the mean of these distances. (Use your calculator and round to the nearest tenth.)
A larger mean absolute deviation number tells you that the data is more spread out.

STAAR Category 4 Grade 8 Mathematics TEKS 8.11B
TEKSING TOWARD STAAR © 2014 Page 2
The smaller mean absolute deviation number tells you the values are all closer to the mean of the dataset.
An outlier in your set can affect your MAD because it will be farther from the mean than the other datapoints.
Example: Find the mean deviation number for the set of values below. The values represent thenumber of blue marbles in various bags of marbles.
Data Set: 6, 8, 5, 2, 7, 7, 4, 6, 7, 8
Find the mean:6 8 5 2 7 7 4 6 7 8 60
610 10
Find the distance each data point is from the mean.
Find the mean of the distances.
0 2 1 4 1 1 2 0 1 2 141.4
10 10
The MAD is 1.4. This is a small mean deviation number, but if the data point 2 had been a numbercloser to 6, the MAD would have been even smaller.
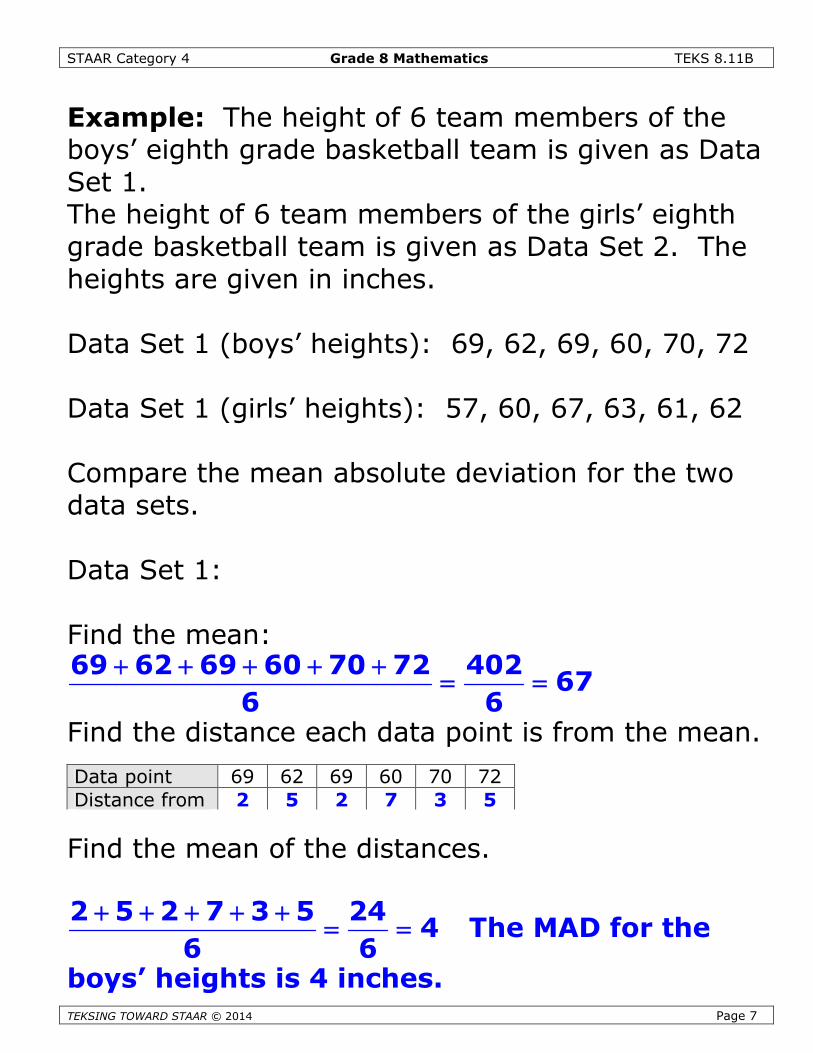
Example: The height of 6 team members of the boys’ eighth grade basketball team is given as DataSet 1.The height of 6 team members of the girls’ eighth grade basketball team is given as Data Set 2.The heights are given in inches.
Data Set 1 (boys’ heights): 69, 62, 69, 60, 70, 72 Data Set 1 (girls’ heights): 57, 60, 67, 63, 61, 62
Compare the mean absolute deviation for the two data sets.
Data Set 1:
Find the mean:69 62 69 60 70 72 402
676 6
Find the distance each data point is from the mean.
Find the mean of the distances.
2 5 2 7 3 5 244
6 6
The MAD for the boys’ heights is 4 inches.
Data point 6 8 5 2 7 7 4 6 7 8
Distance from mean 0 2 1 4 1 1 2 0 1 2
Data point 69 62 69 60 70 72
Distance from mean 2 5 2 7 3 5

STAAR Category 4 Grade 8 Mathematics TEKS 8.11B
TEKSING TOWARD STAAR © 2014 Page 3
Data Set 2:
Find the mean:57 60 67 63 62 61 370
61.76 6
Find the distance each data point is from the mean.
Find the mean of the distances.
4.7 1.7 5.3 1.3 .3 .7 142.3
6 6
The MAD for the girls’ heights is 2.3 inches.
The MAD for the girls’ heights is smaller than the MAD for the boys’ heights. The girls’ height has lessdeviation in their heights. The heights of these six girls are closer to the mean of the data than theheights of the six boys to the mean of their data.
Data point 57 60 67 63 62 61
Distance from mean 4.7 1.7 5.3 1.3 0.3 0.7

STAAR Category 4 Grade 8 Mathematics TEKS 8.11B
TEKSING TOWARD STAAR © 2014 Page 4
Determining the Mean Absolute Deviation
A measure of center of data is a single number.One measure of center is the median (center datapoint). Another measure of center of data is themean. The mean is the average of the data points.To find the mean, sum the data points and divideby the number of data points. The mean andmedian do not have to be a data point in the dataset.
A measure of variability is a single number that isused to describe the spread of the data. Themeasure of variability we have already studied isthe range of the data. Another measure ofvariability that we will study in this lesson is themean absolute deviation. This value is oftenreferred to as the MAD, which is the mean distancebetween each value of the data set and the meanof the data set.

STAAR Category 4 Grade 8 Mathematics TEKS 8.11B
TEKSING TOWARD STAAR © 2014 Page 5
The steps to find the mean absolute deviation of adata set are:
1. Find the mean of the data set. (Sum the datapoints and divide by the number of data points.)
2. Find the distance each data point is from themean. (A table might be helpful for this step.)
3. Find the mean of these distances. (Use yourcalculator and round to the nearest tenth.)
A larger mean absolute deviation number tells youthat the data is more spread out.
The smaller mean absolute deviation number tellsyou the values are all closer to the mean of thedata set.
An outlier in your set can affect your MAD becauseit will be farther from the mean than the other datapoints.

STAAR Category 4 Grade 8 Mathematics TEKS 8.11B
TEKSING TOWARD STAAR © 2014 Page 6
Example: Find the mean deviation number for theset of values below. The values represent thenumber of blue marbles in various bags of marbles.
Data Set: 6, 8, 5, 2, 7, 7, 4, 6, 7, 8
Find the mean:6 8 5 2 7 7 4 6 7 8 60
610 10
Find the distance each data point is from the mean.
Find the mean of the distances.
0 2 1 4 1 1 2 0 1 2 141.4
10 10
The MAD is 1.4. This is a small meandeviation number, but if the data point 2 hadbeen a number closer to 6, the MAD wouldhave been even smaller.
Data point 6 8 5 2 7 7 4 6 7 8Distance from mean 0 2 1 4 1 1 2 0 1 2
STAAR Category 4 Grade 8 Mathematics TEKS 8.11B
TEKSING TOWARD STAAR © 2014 Page 7
Example: The height of 6 team members of theboys’ eighth grade basketball team is given as DataSet 1.The height of 6 team members of the girls’ eighthgrade basketball team is given as Data Set 2. Theheights are given in inches.
Data Set 1 (boys’ heights): 69, 62, 69, 60, 70, 72
Data Set 1 (girls’ heights): 57, 60, 67, 63, 61, 62
Compare the mean absolute deviation for the twodata sets.
Data Set 1:
Find the mean:69 62 69 60 70 72 402
676 6
Find the distance each data point is from the mean.
Find the mean of the distances.
2 5 2 7 3 5 244
6 6
The MAD for the
boys’ heights is 4 inches.
Data point 69 62 69 60 70 72Distance from 2 5 2 7 3 5

STAAR Category 4 Grade 8 Mathematics TEKS 8.11B
TEKSING TOWARD STAAR © 2014 Page 8
Data Set 2:
Find the mean:
57 60 67 63 62 61 37061.7
6 6
Find the distance each data point is from the mean.
Find the mean of the distances.
4.7 1.7 5.3 1.3 0.3 0.7 142.3
6 6
The
MAD for the girls’ heights is 2.3 inches.
The MAD for the girls’ heights is smaller thanthe MAD for the boys’ heights. The girls’height has less deviation, or variation, in theirheights. The heights of these six girls arecloser to the mean of the data than theheights of the six boys to the mean of theirdata.
Data point 57 60 67 63 62 61Distance from 4.7 1.7 5.3 1.3 0.3 0.7
STAAR Category 4 Grade 8 Mathematics TEKS 8.11B
TEKSING TOWARD STAAR © 2014 Page 9
Problem-Solving 1
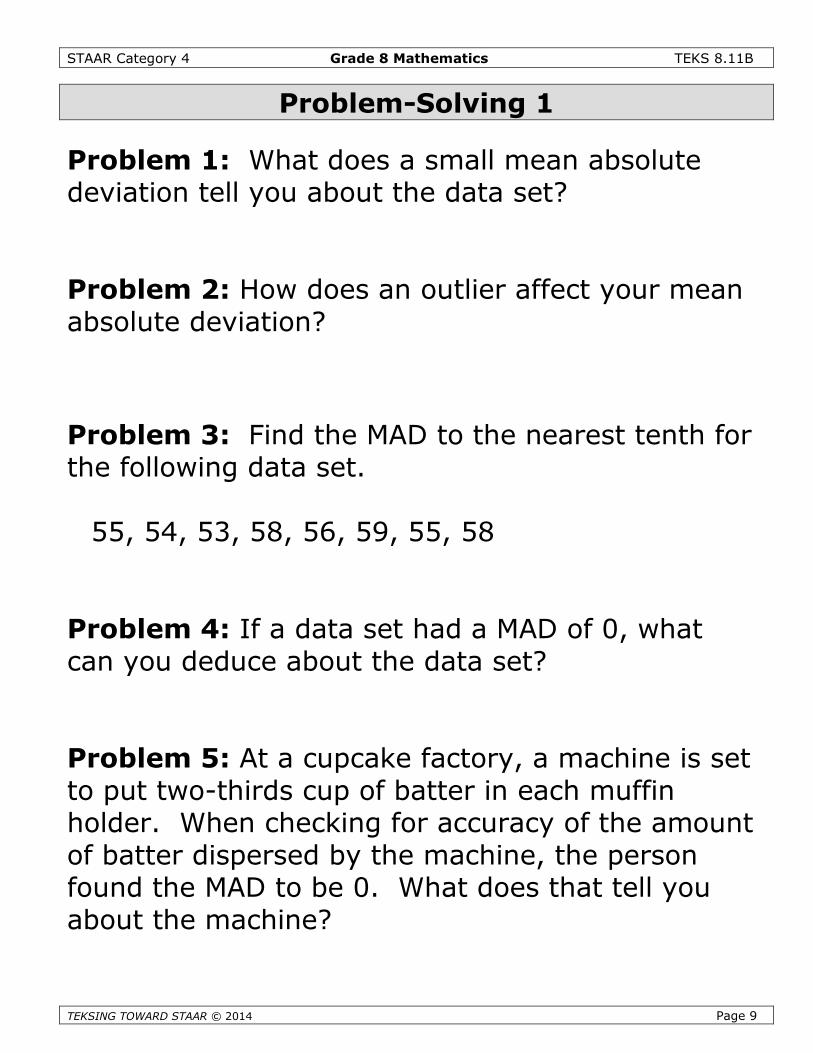
Problem 1: What does a small mean absolutedeviation tell you about the data set?
Problem 2: How does an outlier affect your meanabsolute deviation?
Problem 3: Find the MAD to the nearest tenth forthe following data set.
55, 54, 53, 58, 56, 59, 55, 58
Problem 4: If a data set had a MAD of 0, whatcan you deduce about the data set?
Problem 5: At a cupcake factory, a machine is setto put two-thirds cup of batter in each muffinholder. When checking for accuracy of the amountof batter dispersed by the machine, the personfound the MAD to be 0. What does that tell youabout the machine?

STAAR Category 4 Grade 8 Mathematics TEKS 8.11B
TEKSING TOWARD STAAR © 2014 Page 10
Student Activity 1
Work with your partner to answer the following questions.
Problem 1: Explain how you determine the mean of a data set.
Explain how you determine the distance each data point is from the mean.
Explain how you determine the mean of the distances the data points are from the mean.
What is the mean of the distances the data points are from the mean called?
What does a small mean absolute deviation tell you about the data set?
Problem 2: Seven friends’ scores on their unit test in math class are:
83, 85, 88, 85, 85, 87, 88
What is the mean absolute deviation of the data set?
1. Find the mean of the set.
2. Find the distance each data point is from the mean.
3. Find the mean of the distances.
What does the MAD tell you?
Does the data set support that conclusion?

STAAR Category 4 Grade 8 Mathematics TEKS 8.11B
TEKSING TOWARD STAAR © 2014 Page 11
Problem 3: A data set has a mean of 55 and a MAD of 0.75. What do you know about the data set?
Problem 4: A data set has a mean of 105 and a MAD of 10. What do you know about the data set?
Problem 5: Compare the mean absolute deviations of the following two data sets.
Data Set 1: 12, 12, 14, 15, 11, 13, 10, 15 Data Set 2: 32, 35, 20, 31, 33, 33, 34, 35
Data Set 1:1. Find the mean of the set.
2. Find the distance each data point is from the mean.
3. Find the mean of the distances.
Data Set 2:1. Find the mean of the set.
2. Find the distance each data point is from the mean.
3. Find the mean of the distances.
What conclusion can you make about the two data sets based on the comparison of the MADs?
Problem 6: A history teacher compared scores for her first period class for the pretest and posttestfor a unit. She found a mean of 65 and a MAD of 5.6 for the pretest and a mean of 85 and a MAD of 2.3for the posttest. What conclusion can she make about the scores?

STAAR Category 4 Grade 8 Mathematics TEKS 8.11B
TEKSING TOWARD STAAR © 2014 Page 12
Teacher Notes for Student Activity 2
MATERIALS: Per group of 2 students: 2 1-6 number cubes, calculator, a marker to record their dataon the class projection page
PROCEDURE:
Students complete Student Activity 2 in groups of 2. Assign each student group a group number. Students generate a data set of 10 data points. They calculate the mean absolute deviation. Each
group will post their data set and MAD on the projection page. The goal is have the smallest MAD.
Distribute the materials for Student Activity 2 and before students begin working, ask thefollowing questions:
Can each group create their data set as described on their student page?
During Student Activity 2, roam the room and listen for the following:
Can the students correctly find the mean?
During Student Activity 2, roam the room and look for the following:
Can the students correctly find the distance from the mean for each data point?
Can the students correctly find the mean of the distances?
TAKS
Answers to these questions can be used to support decisions related to furtherwhole class instruction or group and individual student instruction during tutorialsettings.

STAAR Category 4 Grade 8 Mathematics TEKS 8.11B
TEKSING TOWARD STAAR © 2014 Page 13
Student Activity 2
Problem: Did we create a data set with a small mean absolute deviation?
Materials: 1 graphing calculator per student, 2 1-6 number cubes per 2 students, a marker pergroup of 2
Procedure: Work in groups of 2 for this activity. Decide who will be Student 1. Decide who willStudent 2. The teacher will assign you a group number.
Part I:Round 1: Each student will roll the two number cubes.
Student 1 rolls the 2 number cubes and finds the sum of the two numbers. Both students record thesum on the data point table as data point 1.
Student 2 rolls the 2 number cubes and finds the product of the two numbers. Both students recordthe product of the data point table as data point 2.
Round 2:
Student 1 rolls the 2 number cubes and finds the product of the two numbers. Both students recordthe product on the data point table as data point 3.
Student 2 rolls the 2 number cubes and finds the sum of the two numbers. Both students record thesum of the data point table as data point 4.
Round 3: Student 1 rolls the 2 number cubes and finds the sum of the two numbers. Both students record the
sum on the data point table as data point 5.
Student 2 rolls the 2 number cubes and finds the product of the two numbers. Both students recordthe product of the data point table as data point 6.
Round 4:
Student 1 rolls the 2 number cubes and finds the product of the two numbers. Both students recordthe product on the data point table as data point 7.
Student 2 rolls the 2 number cubes and finds the sum of the two numbers. Both students record thesum of the data point table as data point 8.
Round 5:
Student 1 rolls the 2 number cubes and finds the sum of the two numbers. Both students record thesum on the data point table as data point 9.
Student 2 rolls the 2 number cubes and finds the product of the two numbers. Both students recordthe product of the data point table as data point 10.
Data Points
DataPoint 1
DataPoint 2
DataPoint 3
DataPoint 4
DataPoint 5
DataPoint 6
DataPoint 7
DataPoint 8
DataPoint 9
DataPoint 10
STAAR Category 4 Grade 8 Mathematics TEKS 8.11B
TEKSING TOWARD STAAR © 2014 Page 14
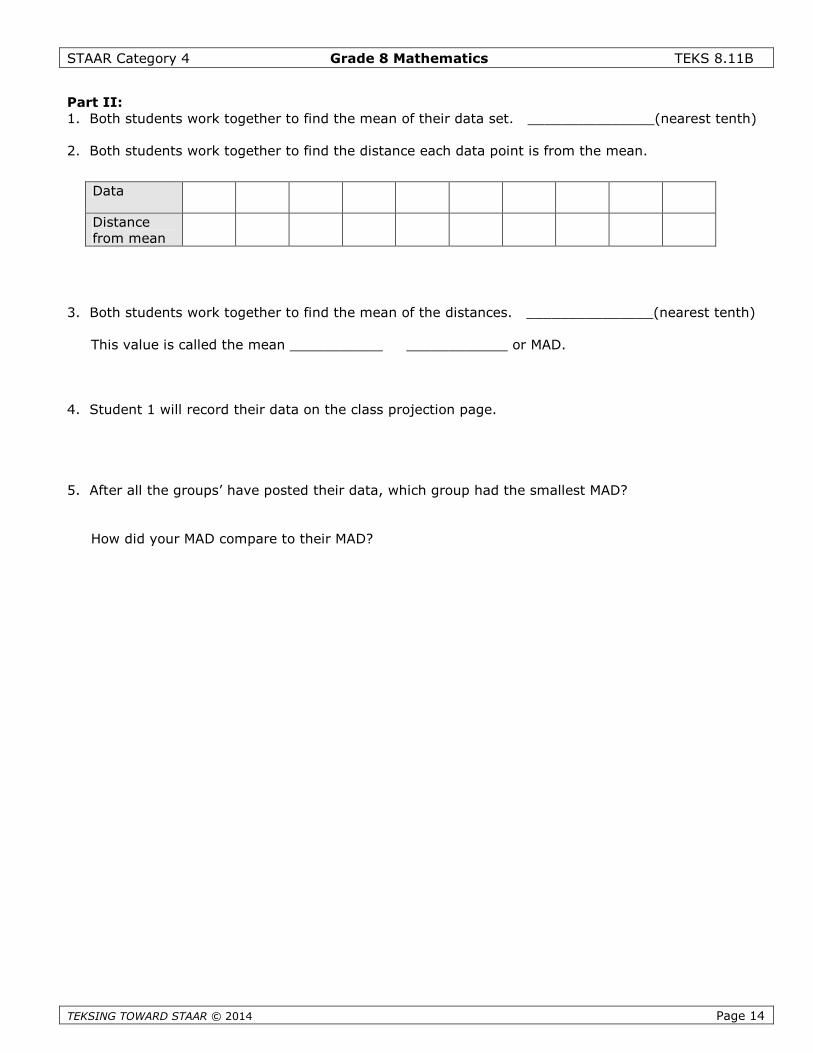
Part II:1. Both students work together to find the mean of their data set. _______________(nearest tenth)
2. Both students work together to find the distance each data point is from the mean.
3. Both students work together to find the mean of the distances. _______________(nearest tenth)
This value is called the mean ___________ ____________ or MAD.
4. Student 1 will record their data on the class projection page.
5. After all the groups’ have posted their data, which group had the smallest MAD?
How did your MAD compare to their MAD?
Data
Distancefrom mean
STAAR Category 4 Grade 8 Mathematics TEKS 8.11B
TEKSING TOWARD STAAR © 2014 Page 15
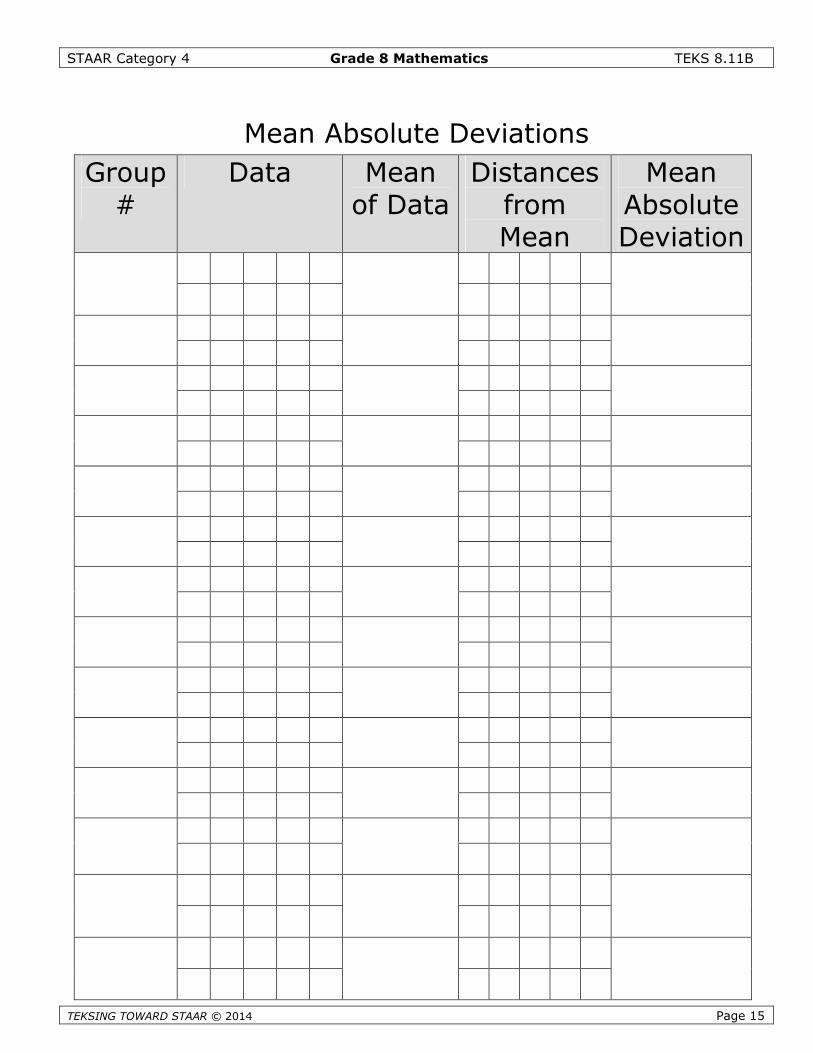
Mean Absolute Deviations
Group#
Data Meanof Data
DistancesfromMean
MeanAbsoluteDeviation

STAAR Category 4 Grade 8 Mathematics TEKS 8.11B
TEKSING TOWARD STAAR © 2014 Page 16
NAME___________________ DATE_____________________ SCORE ___/5
8.11B Skills and Concepts Homework 1
1. What are the measures of center?
2. What are the measures of variability or spread?
3. Find the mean absolute deviation for the following set of data:
Calories in energy bars: 125, 90, 150, 100, 100, 125, 125, 110, 100, 100
Step 1:
Step 2:
Step 3:
4. What does a small MAD tell you about your data?
5. Which group of data has the smaller MAD?
Group 1: 10, 12, 15, 12, 12, 16Group 2: 22, 23, 24, 35, 25, 24

STAAR Category 4 Grade 8 Mathematics TEKS 8.11B
TEKSING TOWARD STAAR © 2014 Page 17
NAME___________________ DATE_____________________ SCORE ___/5
8.11B Skills and Concepts Homework 2
1. What is the mean of this data set (nearest tenth)? {160, 158, 172, 140, 160}
How far is 160 from the mean? _________ unitsHow far is 158 from the mean? _________unitsHow far is 172 from the mean? _________ unitsHow far is 140 from the mean? _________unitsHow far is 160 from the mean? _________ units
What is the average of these distances? _________ 5 = ______
2. What is the mean of this data set (nearest tenth)? {50, 52, 48, 51, 55, 50}
How far is 50 from the mean? _________ unitsHow far is 52 from the mean? _________unitsHow far is 48 from the mean? _________ unitsHow far is 51 from the mean? _________unitsHow far is 55 from the mean? _________ unitsHow far is 50 from the mean? _________ units
What is the average of these distances? _________ 6 = ______
3. Look at the table below. It shows a data set of 8 points. Find the mean and the fill in the secondrow of the table.
What is the mean of the distances?
Data 0 0.5 1 1 3 3.5 4 4.5
Distance fromMean
STAAR Category 4 Grade 8 Mathematics TEKS 8.11B
TEKSING TOWARD S
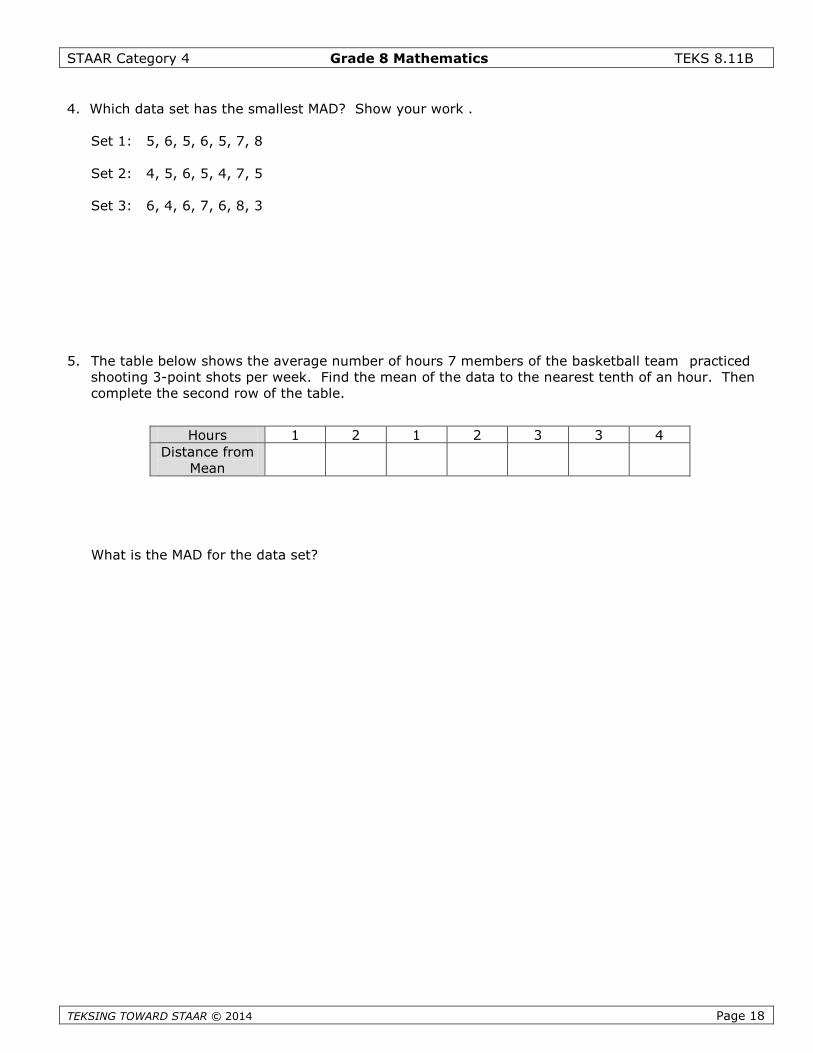
4. Which data set has the smallest MAD? Show your work .
Set 1: 5, 6, 5, 6, 5, 7, 8
Set 2: 4, 5, 6, 5, 4, 7, 5
Set 3: 6, 4, 6, 7, 6, 8, 3
5. The table below shows the average number of hours 7 members of the basketball team practicedshooting 3-point shots per week. Find the mean of the data to the nearest tenth of an hour. Thencomplete the second row of the table.
What is the M
Dis
Hours 1 2 1 2 3 3 4
TAAR © 2014 Page 18
AD for the data set?
tance fromMean

STAAR Category 4 Grade 8 Mathematics TEKS 8.11B
TEKSING TOWARD STAAR © 2014 Page 19
NAME___________________ DATE_____________________ SCORE ___/10
Mini-Assessment 8.11B
1. The chart below shows the perimeters of six parallelograms the class created for a class project.
What is the mean of the data?
A 48 in.
B 47 in.
C 49 in.
D 48.5 in.
2. What is the mean absolute deviation of the data in the table in Question 1?
F 3.6 in.
G 4 in.
H 3 in.
J 2.5 in.
3. Look at the data plotted on the line below.
Which describes the mean absolute deviation of the data?
A 6
B 5.25
C 5.6
D 6.1
Perimeters of Parallelograms
50 inches 48 inches 40 inches
54 inches 48 inches 42 inches
25 30 35 40 45
X X X X X X X X X X

STAAR Category 4 Grade 8 Mathematics TEKS 8.11B
TEKSING TOWARD STAAR © 2014 Page 20
4. Look at the two data sets below.
Which statement is true about the two sets?
F Set A has a mean that is 1 unit larger than the mean of Set B.
G Set B has a mean absolute deviation that is 2.2 units larger than the mean absolute deviation ofSet A.
H The two sets have the same mean absolute deviation.
J Set B has a mean absolute deviation that is twice as large as the mean absolute deviation of Set A.
5. Which statement is true in describing the mean absolute deviation for a data set?
A If the data points are close together, then the mean absolute deviation will be small.
B The mean absolute deviation is not affected by an outlier data point.
C The mean absolute deviation is the average distance each data point is from the mode of thedata set.
D It is not possible for the mean absolute deviation to be less than 1.
6. The data set below lists the heights of six friends. The heights are in inches.
{63, 67, 68, 72, 75, 69}
Which statement is true about the data?
F The mean of the data is 68 inches. The mean absolute deviation is 3.5 inches.
G The mean of the data is 69 inches. The mean absolute deviation is 3 inches.
H The mean of the data is 67 inches. The mean absolute deviation is 3.6 inches.
J The mean of the data is 68 inches. The mean absolute deviation is 3.6 inches.
7. During geography class students listed the number of countries outside the USA they had visited.The responses were:
1, 1, 3, 3, 4, 0, 2, 1, 2, 1
What is the mean for the data set?
A 3.2 countries
B 2 countries
C 2.5 countries
D 1.8 countries
Set A Set B
36 25 33 39 32 35 20 36 39 40

STAAR Category 4 Grade 8 Mathematics TEKS 8.11B
TEKSING TOWARD STAAR © 2014 Page 21
8. If a data set has a mean of 40 and a mean absolute deviation of 6, which statement must be true?
F Half of the data points must be less than 40 and half of the data points must be greater than 40.
G The middle data point is 40.
H The average distance between 40 and each data point is 6 units.
J There must be at least 6 data points.
9. If a data set has a mean absolute deviation that is between 0 and 1, what do you know about thedata set?
A The data set must have data points that are close to the mean.
B The data set must have data points that are close to 1.
C The data set must have data points close to 0.
D The data set must have outlier points.
10. Which data set has a mean of 12 and a mean absolute deviation less than 1?
F {1, 14, 12, 21}
G {9, 10, 17, 12}
H {12, 13, 12, 11}
J {15, 9, 12, 12}
Six Weeks 3Review andAssessment

STAAR Category 2, 3, 4 Grade 8 Mathematics Six Weeks 3
TEKSING TOWARD STAAR © 2014 Page 1
Six Weeks 3 Review
This review can be used in the same manner as a Student Activity from the lessons. Notes can be usedto complete the review and they can work with a partner. You can assign different portions to differentpartner pairs to be responsible for debriefing for the entire class. Students can complete any answersthey did not get before the debriefing. They just need to use a different color to record any additionalanswers.
It can be completed entirely in class, or it can be taken home to be completed and then debriefed inclass prior to the six week assessment.
STAAR Category 2, 3, 4 Grade 8 Mathematics Six Weeks 3
TEKSING TOWARD STAAR © 2014 Page 2
Six Weeks 3 Review
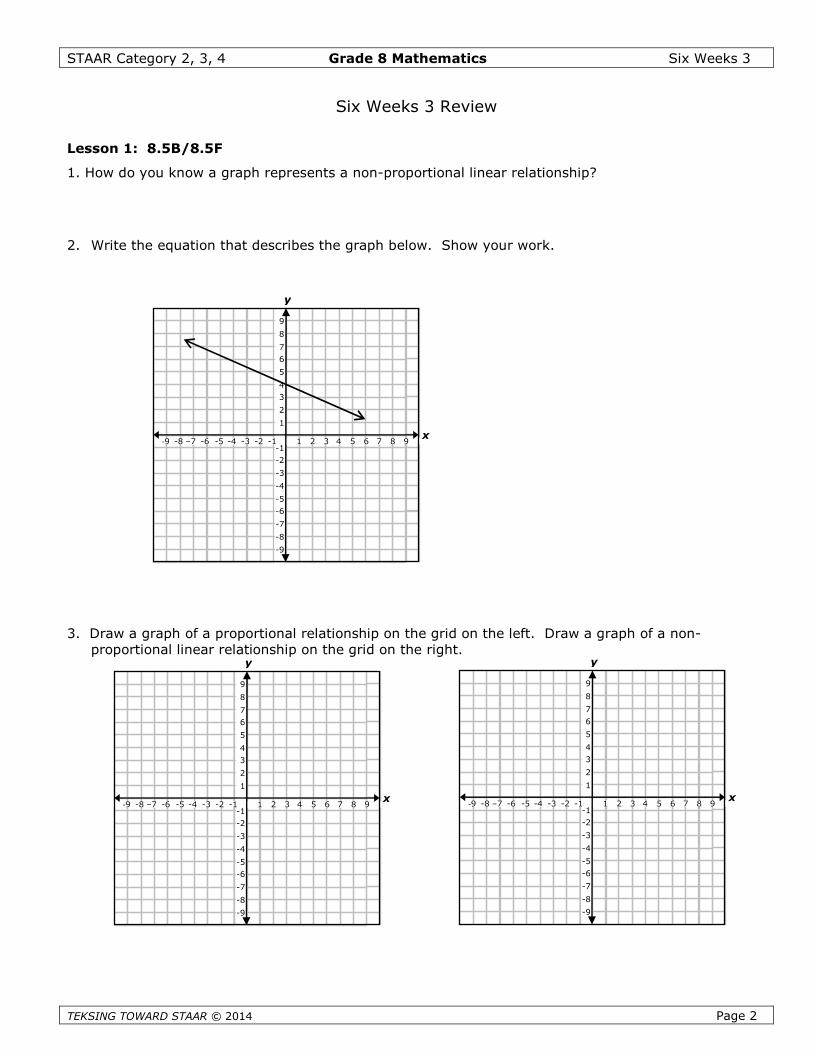
Lesson 1: 8.5B/8.5F
1. How do you know a graph represents a non-proportional linear relationship?
2. Write the equation that describes the graph below. Show your work.
3. Draw a graph of a proportional relationship on the grid on the left. Draw a graph of a non-proportional linear relationship on the grid on the right.
x
y
-9 -8 –7 -6 -5 -4 -3 -2 -1 1 2 3 4 5 6 7 8 9
9
8
7
6
5
4
3
2
1
-1
-2
-3
-4
-5
-6
-7
-8
-9
x
y
-9 -8 –7 -6 -5 -4 -3 -2 -1 1 2 3 4 5 6 7 8 9
9
8
7
6
5
4
3
2
1
-1
-2
-3
-4
-5
-6
-7
-8
-9
x
y
-9 -8 –7 -6 -5 -4 -3 -2 -1 1 2 3 4 5 6 7 8 9
9
8
7
6
5
4
3
2
1
-1
-2
-3
-4
-5
-6
-7
-8
-9
STAAR Category 2, 3, 4 Grade 8 Mathematics Six Weeks 3
TEKSING TOWARD STAAR © 2014 Page 3
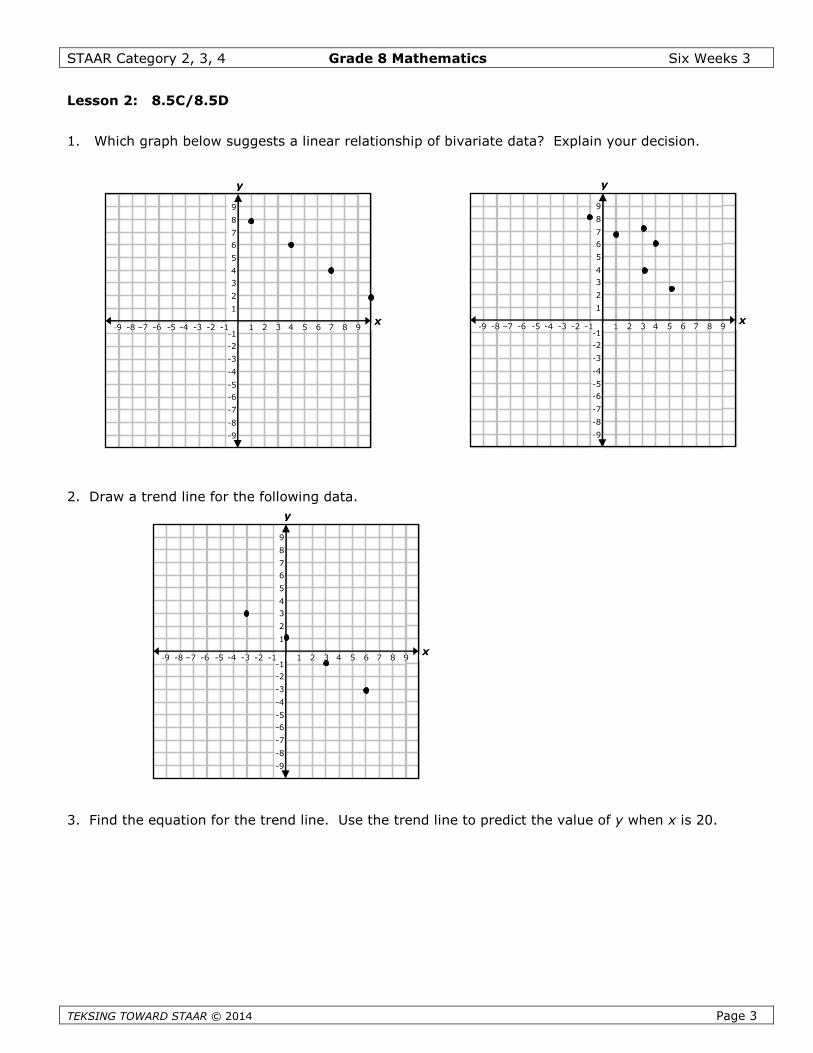
Lesson 2: 8.5C/8.5D
1. Which graph below suggests a linear relationship of bivariate data? Explain your decision.
2. Draw a trend line for the following data.
3. Find the equation for the trend line. Use the trend line to predict the value of y when x is 20.
x
y
-9 -8 –7 -6 -5 -4 -3 -2 -1 1 2 3 4 5 6 7 8 9
9
8
7
6
5
4
3
2
1
-1
-2
-3
-4
-5
-6
-7
-8
-9
x
y
-9 -8 –7 -6 -5 -4 -3 -2 -1 1 2 3 4 5 6 7 8 9
9
8
7
6
5
4
3
2
1
-1
-2
-3
-4
-5
-6
-7
-8
-9
x
y
-9 -8 –7 -6 -5 -4 -3 -2 -1 1 2 3 4 5 6 7 8 9
9
8
7
6
5
4
3
2
1
-1
-2
-3
-4
-5
-6
-7
-8
-9

STAAR Category 2, 3, 4 Grade 8 Mathematics Six Weeks 3
TEKSING TOWARD S
Lesson 3: 8.5I
1. Look at the graph below. Determine the equation that describes the data.
2. Find the equation of the line that describes the table of values shown below. Show your work.
Lesson 4: 8.5G
1. Explain what
2. Explain what
3. Look at the d
x
y
1 2 3 4 5 6 7 8 9 10 11 12 13 14 15 16
16
15
14
13
12
11
10
9
8
7
6
5
4
3
2
1
x 2 3 5 7
TAAR © 2014 Page 4
to look for in a graph to determine if the graph represents a function.
to look for in a mapping that describes a function.
omain and range represented below. Create a mapping that is a function.
y 4 7 14 19
x y
01235
89101113

STAAR Category 2, 3, 4 Grade 8 Mathematics Six Weeks 3
TEKSING TOWARD STAAR © 2014 Page 5
4. Look at the domain and range represented below. Create a mapping that is NOT a function.
Lesson 5: 8.6C/8.7C/8.7D
1. Draw a model that geometrically represents the Pythagorean Theorem.
2. State the Pythagorean Theorem as an equation.______ + _______ = ________
3. What is a set of Pythagorean triples?
4. Find the missing side in the following right triangles. Use your calculator and round to the nearesttenth unit when necessary. Show your work.
5. Decide if the following lengths could be the side lengths of a right triangle. Show work to supportyour answer.
________ 5, 13, and 18
x y
01235
7891012
9
12
? 30
12
?
STAAR Category 2, 3, 4 Grade 8 Mathematics Six Weeks 3
TEKSING TOWARD STAAR © 2014 Page 6
_________ 13, 12, and 5
_________ 24, 30, and 40
6. Find the distance between (2, 5) and (6, 8). Find the distance between ( −1, 5) and (6, −8).
Lesson 6: 8.7A
1. What is a sphere?
2. Draw a sphere and label the center, radius, great circle, and circumference
3. What is the volume of a sphere with a radius of 8 inches (to the nearest cubic inch)? Show yourwork.
4. What is the radius of a sphere with a volume of 4500 cubic inches? Show your work.
x
y
-9 -8 –7 -6 -5 -4 -3 -2 -1 1 2 3 4 5 6 7 8 9
9
8
7
6
5
4
3
2
1
-1
-2
-3
-4
-5
-6
-7
-8
-9
x
y
-9 -8 –7 -6 -5 -4 -3 -2 -1 1 2 3 4 5 6 7 8 9
9
8
7
6
5
4
3
2
1
-1
-2
-3
-4
-5
-6
-7
-8
-9

STAAR Category 2, 3, 4 Grade 8 Mathematics Six Weeks 3
TEKSING TOWARD STAAR © 2014 Page 7
Lesson 7: 8.7B
1. Find the total surface area of a rectangular prism with dimensions 4, 5, and 12 units.
2. A triangular prism has base edges of 3, 4, and 5 units. What is the lateral area and total surfacearea of the prism? (What kind of triangle is the base?)
Lesson 8: 8.11B
1. How do you find the mean of a set of data?
2. What is the mean absolute deviation of a set of data?
3. List the steps in finding the MAD for a data set.
4. What is the MAD of the data set below? Round to nearest tenth of a unit.
12, 15, 16, 18, 15, 20, 13, 18
5. What does a small MAD indicate for the data set?

GRADE 8 MATHEMATICS
TEKSING TOWARD STAAR © 2014 Page 0
TEKS/STAAR Six Weeks 3 Assessment
Make 1 copy of the Six Weeks Assessment for each student. Students answer thesequestions individually. Record class performance on the Class Profile Sheet andindividual student performance on the Individual Student Profile Sheet.
Answer Key: STAAR Category/TEKS
1. A Category 2/8.5B
2. H Category 4/8.5C
3. D Category 2/8.5I
4. F Category 3/8.7C
5. A Category 2/8.5G
6. G Category 3/8.6C
7. C Category 3/8.7D
8. H Category 3/8.7A
9. B Category 2/8.5I
10. H Category 3/8.7B
11. A Category 4/8.11B
12. 252 Category 3/8.7B
13. C Category 2/8.5G
14. G Category 3/8.7C
15. C Category 4/8.5D
16. H Category 3/8.7A
17. B Category 2/8.5F
18. 522 Category 3/8.7B
19. A Category 2/8.5B
20. J Category 3/8.6C

GRADE 8 MATHEMATICS
TEKSING TOWARD STAAR © 2014 Page 1
TEKS/STAAR Six Weeks 3 Assessment
1. The graph on the grid below shows the number of pages Billy has read in his history book. Hestarted on page 16 and continued to read.
Which equation represents this situation?
A 2.4 16y x C 16y x
B2
163
y x D 16y x
2. Which graph below suggests a linear relationship between x and y?
y
5 10 15 20 25 30 35 40
64
60
56
52
48
44
40
36
32
28
24
20
16
12
8
40
0
Pages
x
Minutes
x
y
-5 -4 -3 -2 -1 1 2 3 4 5
5
4
3
2
1
-1
-2
-3
-4
-5
x
y
-5 -4 -3 -2 -1 1 2 3 4 5
5
4
3
2
1
-1
-2
-3
-4
-5
x
y
-5 -4 -3 -2 -1 1 2 3 4 5
5
4
3
2
1
-1
-2
-3
-4
-5
x
y
-5 -4 -3 -2 -1 1 2 3 4 5
5
4
3
2
1
-1
-2
-3
-4
-5
F
G
H
J

GRADE 8 MATHEMATICS
TEKSING TOWARD
3. The table below represents a linear relationship.
Which equa
A 5y x
B 5y x
C 3y x
D 2y x
4. Marcie left hmiles from h
F 11.7 mi
G 16 mi
H 10 mi
J 12.3 mi
5. Look at the
x
x
0
1
3
0
1
3
A
B
x 0 3 5 7
STAAR © 2014 Page 2
tion represents the relationship?
2
5
5
er home and drove 6 miles north, then she drove 10 miles east. About how manyer home was she then?
mappings below. Which mapping is NOT a function?
y 5 11 15 19
6 mi
10 mi
x mi
yx y
y x y
0
1
3
0
1
3
4
5
7
4
5
7
4
5
7
5
C
D

GRADE 8 MATHEMATICS
TEKSING TOWARD STAAR © 2014 Page 3
6. The area of Square 2 is 49 square units and the area of Square 1 is 121 square units.
Which area for Square 3 will make the model a correct representation of the Pythagorean Theorem?
F 21 square units
G 72 square units
H 27 square units
J 31 square units
7. A rectangle is graphed on the coordinate grid.
Which best describes the length of the diagonal AC of the rectangle?
A 14 units
B 12.8 units
C 15.3 units
D 16.8 units
Square2
Square1
Square3
x
y
-9 -8 –7 -6 -5 -4 -3 -2 -1 1 2 3 4 5 6 7 8 9
9
8
7
6
5
4
3
2
1
-1
-2
-3
-4
-5
-6
-7
-8
-9
A
B C
D

GRADE 8 MATHEMATICS
TEKSING TOWARD STAAR © 2014 Page 4
8. A sphere has a radius of 4 meters. Which expression can be used to determine the approximatevolume of the sphere?
F 34 3.14
G 244 3.14
3
H 344 3.14
3
J 344
3
9. Which graph represents a function?
10. What is the total surface area of a rectangular prism with dimensions of 6 inches, 9 inches, and 10inches?
F 408 square inches
G 288 square inches
H 540 square inches
J 428 square inches
A
B
x
y
-5 -4 -3 -2 -1 1 2 3 4 5
5
4
3
2
1
-1
-2
-3
-4
-5
x
y
-5 -4 -3 -2 -1 1 2 3 4 5
5
4
3
2
1
-1
-2
-3
-4
-5
x
y
-5 -4 -3 -2 -1 1 2 3 4 5
5
4
3
2
1
-1
-2
-3
-4
-5
x
y
-5 -4 -3 -2 -1 1 2 3 4 5
5
4
3
2
1
-1
-2
-3
-4
-5
C
D

GRADE 8 MATHEMATICS
TEKSING TOWARD STAAR © 2014 Page 5
11. Look at the data set below. It represents the number of hours 5 students studied for a final exam.
{4, 6, 5, 4, 1}
What is the mean absolute deviation for the data set?
A 1 hour
B 1.5 hours
C 1.2 hours
D 2 hours
12. Look at the triangular prism below.
What is the lateral surface area of the prism?
Record your answer on the grid below. Be sure to use the correct place value.
6 cm
6 cm6 cm
14 cm
0 0 0 0 0 0
1 1 1 1 1 1
2 2 2 2 2 2
3 3 3 3 3 3
4 4 4 4 4 4
5 5 5 5 5 5
6 6 6 6 6 6
7 7 7 7 7 7
8 8 8 8 8 8
9 9 9 9 9 9
+
-
.
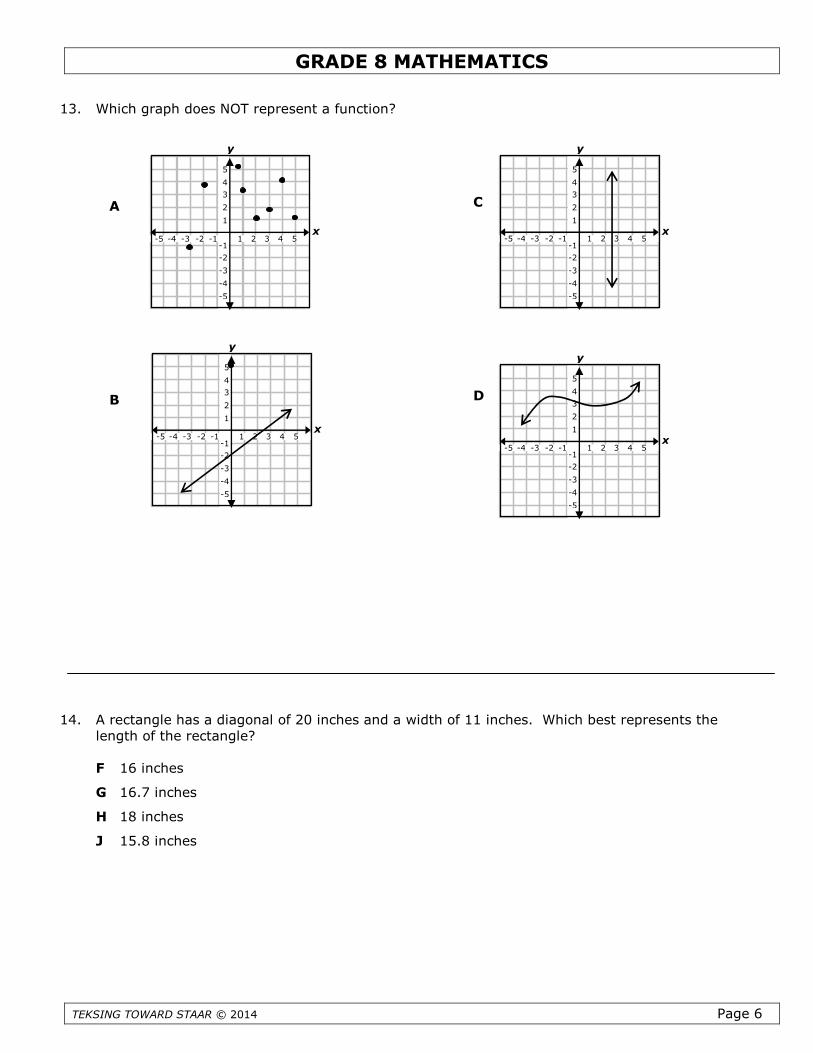
GRADE 8 MATHEMATICS
TEKSING TOWARD STAAR © 2014 Page 6
13. Which graph does NOT represent a function?
14. A rectangle has a diagonal of 20 inches and a width of 11 inches. Which best represents thelength of the rectangle?
F 16 inches
G 16.7 inches
H 18 inches
J 15.8 inches
x
y
-5 -4 -3 -2 -1 1 2 3 4 5
5
4
3
2
1
-1
-2
-3
-4
-5
x
y
-5 -4 -3 -2 -1 1 2 3 4 5
5
4
3
2
1
-1
-2
-3
-4
-5
x
y
-5 -4 -3 -2 -1 1 2 3 4 5
5
4
3
2
1
-1
-2
-3
-4
-5
C
D
A
B
x
y
-5 -4 -3 -2 -1 1 2 3 4 5
5
4
3
2
1
-1
-2
-3
-4
-5

GRADE 8 MATHEMATICS
TEKSING TOWARD STAAR © 2014 Page 7
15. The graph below shows the number of students who wore shorts to school at differenttemperatures. A trend line for the scatter plot is shown on the grid.
Using the trend line, what is the best prediction of the number of students who will wear shorts toschool when the temperature is 91°F?
A 400 C 320
B 380 D 340
16. The circumference of the great circle of a sphere is 24 units. What is the volume of the sphere?
F 288 cubic units
G 192 cubic units
H 2,304 cubic units
J Not Here
17. Look at the list of equations below.
a. 3 5y x b. 1y x c.5
8y x d. 2xy
Which equations in the list represent a proportional linear relationship?
A a only
B c only
C a and b only
D None of the above
80° 85° 90° 95°
Temperature (°F)
x
y
320
300
280
260
240
220
200
180
160
140
120
100
80
60
40
20
Shorts at School
Num
ber
of
Stu
dents

GRADE 8 MATHEMATICS
TEKSING TOWARD STAAR © 2014 Page 8
18. Look at the rectangular prism shown below. The base of the prism is shaded.
What is the lateral surface area of the prism in square inches?
Record your answer on the grid below. Be sure to use the correct place value.
19. Which graph represents a non-proportional linear relationship?
22.5 inches
6.5 inches
9 inches
0 0 0 0 0 0
1 1 1 1 1 1
2 2 2 2 2 2
3 3 3 3 3 3
4 4 4 4 4 4
5 5 5 5 5 5
6 6 6 6 6 6
7 7 7 7 7 7
8 8 8 8 8 8
9 9 9 9 9 9
+
-
.
x
y
-5 -4 -3 -2 -1 1 2 3 4 5
5
4
3
2
1
-1
-2
-3
-4
-5
x
y
-5 -4 -3 -2 -1 1 2 3 4 5
5
4
3
2
1
-1
-2
-3
-4
-5
x
y
-5 -4 -3 -2 -1 1 2 3 4 5
5
4
3
2
1
-1
-2
-3
-4
-5
x
y
-5 -4 -3 -2 -1 1 2 3 4 5
5
4
3
2
1
-1
-2
-3
-4
-5
C
D
A
B

GRADE 8 MATHEMATICS
TEKSING TOWARD STAAR © 2014 Page 9
20. Which of the triangles below is NOT a right triangle?
5 in.
6 in.
61 in.3 in.
5 in.
6 in. 4.5 in.
7.5 in.
5 in.
12 in.
15 in.
F
G
H
J
34 in.