tema - core.ac.uk · 142 - tema journal of land use mobility and environment 2 (2013) planning and...
TRANSCRIPT


TeMA Journal of Land Use, Mobility and Environment
141 - TeMA Journal of Land Use Mobility and Environment 2 (2013)
SMART CITIES: RESEARCHES, PROJECTS AND GOOD PRACTICES FOR BUILDINGS
2 (2013) Published by Laboratory of Land Use Mobility and Environment DICEA - Department of Civil, Architectural and Environmental Engineering University of Naples "Federico II" TeMA is realised by CAB - Center for Libraries at “Federico II” University of Naples using Open Journal System Editor-in-chief: Rocco Papa print ISSN 1970-9889 | on line ISSN 1970-9870 Lycence: Cancelleria del Tribunale di Napoli, n° 6 of 29/01/2008 Editorial correspondence Laboratory of Land Use Mobility and Environment DICEA - Department of Civil, Architectural and Environmental Engineering University of Naples "Federico II" Piazzale Tecchio, 80 80125 Naples web: www.tema.unina.it e-mail: [email protected]

TeMA Journal of Land Use, Mobility and Environment
142 - TeMA Journal of Land Use Mobility and Environment 2 (2013)
TeMA - Journal of Land Use, Mobility and Environment offers researches, applications and contributions with a unified approach to planning and mobility and publishes original inter-disciplinary papers on the interaction of transport, land use and Environment. Domains include: engineering, planning, modeling, behavior, economics, geography, regional science, sociology, architecture and design, network science, and complex systems.
The Italian National Agency for the Evaluation of Universities and Research Institutes (ANVUR) classified TeMA as one of the most highly regarded scholarly journals (Category A) in the Areas ICAR 05, ICAR 20 and ICAR21. TeMA Journal has also received the Sparc Europe Seal for Open Access Journals released by Scholarly Publishing and Academic Resources Coalition (SPARC Europe) and the Directory of Open Access Journals (DOAJ). TeMA publishes online under a Creative Commons Attribution 3.0 License and is blind peer reviewed at least by two referees selected among high-profile scientists. TeMA is a four-monthly journal. TeMA has been published since 2007 and is indexed in the main bibliographical databases and it is present in the catalogues of hundreds of academic and research libraries worldwide.
EDITOR- IN-CHIEF
Rocco Papa, Università degli Studi di Napoli Federico II, Italy
EDITORIAL ADVISORY BOARD
Luca Bertolini, Universiteit van Amsterdam, Netherlands Virgilio Bettini, Università Iuav di Venezia, Italy Dino Borri, Politecnico di Bari, Italy Enrique Calderon, Universidad Politécnica de Madrid, Spain Roberto Camagni, Politecnico di Milano, Italy Robert Leonardi, London School of Economics and Political Science, United Kingdom Raffaella Nanetti, College of Urban Planning and Public Affairs, United States Agostino Nuzzolo, Università degli Studi di Roma Tor Vergata, Italy Rocco Papa, Università degli Studi di Napoli Federico II, Italy
EDITORS
Agostino Nuzzolo, Università degli Studi di Roma Tor Vergata, Italy Enrique Calderon, Universidad Politécnica de Madrid, Spain Luca Bertolini, Universiteit van Amsterdam, Netherlands Romano Fistola, Dept. of Engineering - University of Sannio - Italy, Italy Adriana Galderisi, Università degli Studi di Napoli Federico II, Italy Carmela Gargiulo, Università degli Studi di Napoli Federico II, Italy Giuseppe Mazzeo, CNR - Istituito per gli Studi sulle Società del Mediterraneo, Italy
EDITORIAL SECRETARY
Rosaria Battarra, CNR - Istituito per gli Studi sulle Società del Mediterraneo, Italy Andrea Ceudech, TeMALab, Università degli Studi di Napoli Federico II, Italy Rosa Anna La Rocca, TeMALab, Università degli Studi di Napoli Federico II, Italy Enrica Papa, Università degli Studi di Roma Tor Vergata, Italy ADMISTRATIVE SECRETARY Stefania Gatta, Università degli Studi di Napoli Federico II, Italy

TeMA Journal of Land Use, Mobility and Environment
TeMA Journal of Land Use Mobility and Environment 2 (2013)
SMART CITIES: RESEARCHES, PROJECTS, AND GOOD PRACTICES FOR BUILDINGS 2 (2013) Contents
EDITORIALE Rocco Papa 143 EDITORIAL PREFACE
Rocco Papa
FOCUS FOCUS
Resources and Energy Management The Case of the Agropoli Urban Plan
Francesco Domenico Moccia
145 Resources and Energy Management: the Case of the Agropoli Urban Plan Francesco Domenico Moccia
Urban Planners with Renewable Energy Skills. Training Description Arto Nuorkivi, Anna-Maija-Ahonen
159
Urban Planners with Renewable Energy Skills. Training Description Arto Nuorkivi, Anna-Maija-Ahonen
LAND USE, MOBILITY AND ENVIRONMENT LAND USE, MOBILITY AND
ENVIRONMENT
Walkability of School Surroundings and Its Impacts on Pedestrian Behavior
Lina Shbeeb, Wael Awad
171 Walkability of School Surroundings and Its Impacts on Pedestrian Behavior Lina Shbeeb, Wael Awad
The Spatio-Temporal Modeling of Urban Growth. Case Study: Mahabad, Iran
AlÌ Soltani, Davoud Karimzadeh 189
The Spatio-Temporal Modeling of Urban Growth. Case Study: Mahabad, Iran AlÌ Soltani, Davoud Karimzadeh

TeMA Journal of Land Use, Mobility and Environment
TeMA Journal of Land Use Mobility and Environment 2 (2013)
Tourism and City. Reflections About Tourist Dimension of Smart City
Rosa Anna La Rocca 201
Tourism and City. Reflections About Tourist Dimension of Smart City Rosa Anna La Rocca
Informazioni dirette ed indirette nell’organizzazione dello spazio urbano
Alessandro Bove, Carlo Ghirardelli 215
Direct and Indirect Information in Urban Space Planning Alessandro Bove, Carlo Ghirardelli
Modeling the Travel Behavior Impacts of Micro-Scale Land Use and Socio-
Economic Factors Houshmand E. Masoumi
235 Modeling the Travel Behavior Impacts of Micro-Scale Land Use and Socio-Economic Factors Houshmand E. Masoumi
Resilience in the Transition Towns Movement. Towards a New Urban
Governance Grazia Brunetta, Valeria Baglione
251 Resilience in the Transition Towns Movement. Towards a New Urban Governance Grazia Brunetta, Valeria Baglione
OSSERVATORI Laura Russo, Floriana Zucaro, Valentina Pinto,
Gennaro Angiello, Gerardo Carpentieri 265
REVIEW PAGES Laura Russo, Floriana Zucaro, Valentina Pinto, Gennaro Angiello, Gerardo Carpentieri

TeMA Journal of Land Use, Mobility and Environment
TeMA 2 (2013) 171-188 print ISSN 1970-9889, e- ISSN 1970-9870 DOI: 10.6092/1970-9870/1608 review paper. received 24 May 2013, accepted 15 June 2013 Licensed under the Creative Commons Attribution – Non Commercial License 3.0 www.tema.unina.it
WALKABILITY OF SCHOOL SURROUNDINGS
AND ITS IMPACT ON PEDESTRIAN BEHAVIOR
ABSTRACT Pedestrian safety due to traffic accidents is seen as a serious problem in Jordan. It is believed that walking environment is a contributory factor. This study looks into pedestrian environment in schools’ vicinity. Seventeen schools were selected and 231 students were followed from school to home. Pedestrian walking environment for each student trip was assessed by considering the sidewalk and crossing facilities; driver and pedestrian behavior; attractiveness and school location. Analysis indicated that pedestrian environment is rather poor and very few walking paths are in good conditions. Behavior of each pedestrian was observed by considering the trip time; walking time on sidewalk and on pavement; crossing time; number of crossings; and involvement of conflicts. Results showed that 15% of observed subjects were involved in conflicts. Average walking time is 17 minutes; almost half of this time is spent either by walking on street or crossing. On average, children cross two junctions on their way back from school. Females are involved in less conflict and they spend less time in traffic. Drivers give priority to pedestrian in one-thirds of all observed crossings with preference to males.
KEYWORDS: Pedestrians, walking behavior, pedestrian safety, school routes, children accidents.
LINA SHBEEBa, WAEL AWADb
aDept. of Civil Engineering, Faculty of Engineering, Al-Ahliyya Amman University e-mail: [email protected]
URL: www.ammanu.edu.jo
bFaculty of Engineering, Al-Ahliyya Amman University, Al Balqa Applied University e-mail: [email protected]
URL: www.ammanu.edu.jo

L. Shbeeb, W. Awad – Walkability of school Surroundings and its Impact on Pedestrian Behavior
172 - TeMA Journal of Land Use Mobility and Environment 2 (2013)
1 INTRODUCTION Worldwide and for many years, road accident fatalities and injuries were major life threats for humanity
(WHO, 2009). In Jordan, road accident fatalities and injuries were increasing with no sign of being under
control but not after 2007, when a set of firm measures were considered. In 2007, a total of 110,630
crashes were reported by police compared to 140,014 in 2010, which mounts up to an increase of 8.1%.
The deaths, on the other hand, reduced in 2007 from 992 (17.3 deaths per 100,000 inhabitant) to 670 (11
deaths per 100,000 inhabitant) in 2010 (JTI, 2010). Pedestrian accidents that compose 6% of all accidents
lead to 33% of all deaths in traffic (3.57 deaths per 100,000 inhabitants). Half of death toll in traffic was
among children under age of 15 years (4.55 deaths per 100,000 inhabitants). Pedestrian children are
considered a high risk group. Globally, over 400,000 pedestrians are dying every year (Naci et. al., 2009).
This may be due to children understanding and perception of traffic situations, which is not always well
developed (Gibby, Ferrara, 2001). Children are not young adults and it is important to understand their
limitations in understanding traffic as mainly they have a limited sense of danger. Children are described as
impatient and impulsive, concentrating on only one thing at a time. They have a narrower field of vision than
adults, about 1/3 less; they cannot easily judge the speed and distance of approaching vehicles, assuming
that if they can see a vehicle, the driver must be able to see them.
In general, pedestrians are facing higher risks in urban areas where more pedestrians and vehicular
activities take place (Zegeer, Bushell, 2012). A study in Montreal, Canada revealed that children pedestrian
accidents are more likely to happen at mid-block in residential areas (David, Rice, 1994), male children
between the ages 5 to 8 are the main victims. Cheng (1991) investigated the trend of Utah’s pedestrian
accident rate and discussed factors involved. His study produced similar results to David and Rice (1994).
Jordan (1998) analyzed 2,167 pedestrian accidents in Philadelphia. He found that more children are injured
in route to/or from school, but not near the school. A greater number of children are injured while playing
after returning home from school rather than during their trips to/or from school. In Netherlands, 90% of
children accidents occurred on foot or on bicycles are within built-up areas (Westdijk, 2001).
Walkability is a measure of how friendly an area is to walking. Walkability takes into account the quality of
pedestrian facilities, roadway conditions, land use patterns, community support, security and comfort for
walking (VTPI, 2012). Bikeability is also a term for the extent to which an environment is friendly for
bicycling. Moudon and Lee (2003) reviewed existing environmental audit instruments used to capture the
walkability and bikability of environments and to provide an understanding of the essential aspects of
environments influencing walking and bicycling for both recreational and transportation purposes.
Zegeer and Bushell (2012) suggested a set of actions to improve traffic safety for pedestrians; eight actions
were recommended covering engineering; education; and enforcement treatments. A cross-sectional study
(Zhu, Lee, 2008) examined disparities in the environmental support for walking around 73 public elementary
schools in Austin – Texas. Field audits were conducted to assess the street-level walkability and GIS was
used to measure the neighborhood-level of walkability and safety. The study showed that economic and
ethnic disparities exist in the environmental support for walking, suggesting the need for tailored
interventions in promoting active living. Children in low income areas are more likely to live in unsafe areas
with poor street environments but with some favorable neighborhood-level conditions (Zhu, Lee, 2008). Safe
route to school program in El Paso was introduced in 90 elementary schools (Schatz et al., 2009). The
program addressed the 5 E’s (Education, Encouragement, Engineering, Enforcement, and Evaluation). The
study looked into the perception of parents and children based on before and after field survey.

L. Shbeeb, W. Awad – Walkability of school Surroundings and its Impact on Pedestrian Behavior
173 - TeMA Journal of Land Use Mobility and Environment 2 (2013)
Committee on injury, violence, and poison prevention of American Academy of Paediatrics (Pediatrics, 2009)
reviewed the contributory factors that lead to high death toll among pediatric pedestrians younger than 19
years, which include lack of playground in low income areas and the high speed.
In Jordan, children pedestrian accidents and behavior have been investigated to some extent (Shbeeb,
Mujahed, 2002). The pilot study looked into school environment and its walkability. Ten schools in Amman,
the capital City of Jordan were selected and a sample of 200 students is selected to assess their level of
traffic safety education. The study revealed that the school plays minor role in educating children and their
families are the main source of information in this regard. The study looked also into pedestrian behavior on
their way back home from school and examined the surroundings environment. The study indicated that
pedestrians are exposed to frequent hazardous situations. Walking environment is relatively poor. Pedestrian
facilities are lacking in most locations, and they are not used for pedestrian crossing when such facilities
exist. If pedestrian crossings are provided, pedestrians are rarely given priority.
This paper further looks into pedestrians' behavior in Jordan and is a continuation of the pilot study made to
assess school surroundings from pedestrians' perspective. The environment that surrounds schools is
assessed with regard to its walkability. The size of observed sample is enlarged to provide better
understanding of pedestrians' behavior within school vicinities. Particular emphasis is given to children (age
of 18 years or less). The outcome of this study is expected to provide insight into the local environment of
deficiencies facing walkability, which should be treated in the future, where safer routes to school must be
provided through introducing a set of guidelines to select school locations, and develop procedure for safety
auditing in the surrounding roads.
2 RESEARCH OBJECTIVES This research paper main goal is to explore pedestrians' behavior in traffic on their way back home from
school. The way back home has been proven in literature to be more hazardous than the way to school, in
addition to that justification, data collection would be very difficult to track students in their way to school
due to spatial distribution of homes and to the temporal variation in trip time from one student to another.
Two other objectives are required to fulfill the main goal: first to analyze accident data to identify the nature
and size of pedestrians' accident problem with emphasis on children. And second to appraise school route
environment from pedestrian children safety perspective.
3 METHODOLOGIY Police reported accident data in Jordan in 2010 and 2011 were reviewed and analyzed. Observations of
children behavior while walking and crossing roads were analyzed to assess their actual behavior. Inventory
of routes leading to school were made to assess how friendly their environment is to students? The school
surrounding is the area that includes all streets within 1-2 km radius from the school site. The observations
were completed by examining behavioral actions and physical conditions, such as pavement conditions;
characteristics of pedestrians’ crossing; behavior at crossings (drivers and pedestrians); whether users
comply with traffic rules or not? The next paragraphs describe the nature of observations.
Routes pavement condition were assessed in terms of width, maintenance conditions, continuity,
slipperiness, usage for other purposes [vendors, parked cars] and the existing of light and advertisements
poles. Pedestrian crossing areas were checked; the checked items covers looking into pedestrian crossing
marking and if appropriate road signs were provided. Road environment in the crossing vicinity was
assessed [wide road, high speed traffic; parked vehicle or trees that obscured the view]. Observations
include checking if traffic calming devices ahead of the crossing were installed. Streets were considered
L. Shbeeb, W. Awad – Walkability of school Surroundings and its Impact on Pedestrian Behavior
174 - TeMA Journal of Land Use Mobility and Environment 2 (2013)
wide, if pedestrians need to cross more than one lane per direction. High traffic speed is defined as high if it
exceeds 30 km/h. Observers are trained to assess if speed exceeds such a threshold.
Driver behavior on pedestrian crossing [if available] included driver speed at crossing and whether drivers
comply with the traffic rule of giving pedestrians the priority on the crossing? Also, pedestrian ability to
comply with traffic rules; such as stopping safely at the pavement adjacent to the crossing? Is he/ she
visible to drivers; are crossings designed in such a way to allow pedestrians to visually search before
crossing? School location was characterized by answering questions like is the school located on a main road
with high speeds; is school main entrance on a minor road? Has the site been provided with the necessary
marking, signing, and if speed humps are present? The attractiveness of the routes for walking was explored
by answering questions like is the road lit? Are plants grown on road side? Have benches been provided? Are
shops available on road sides? Are roads and pavements clean?
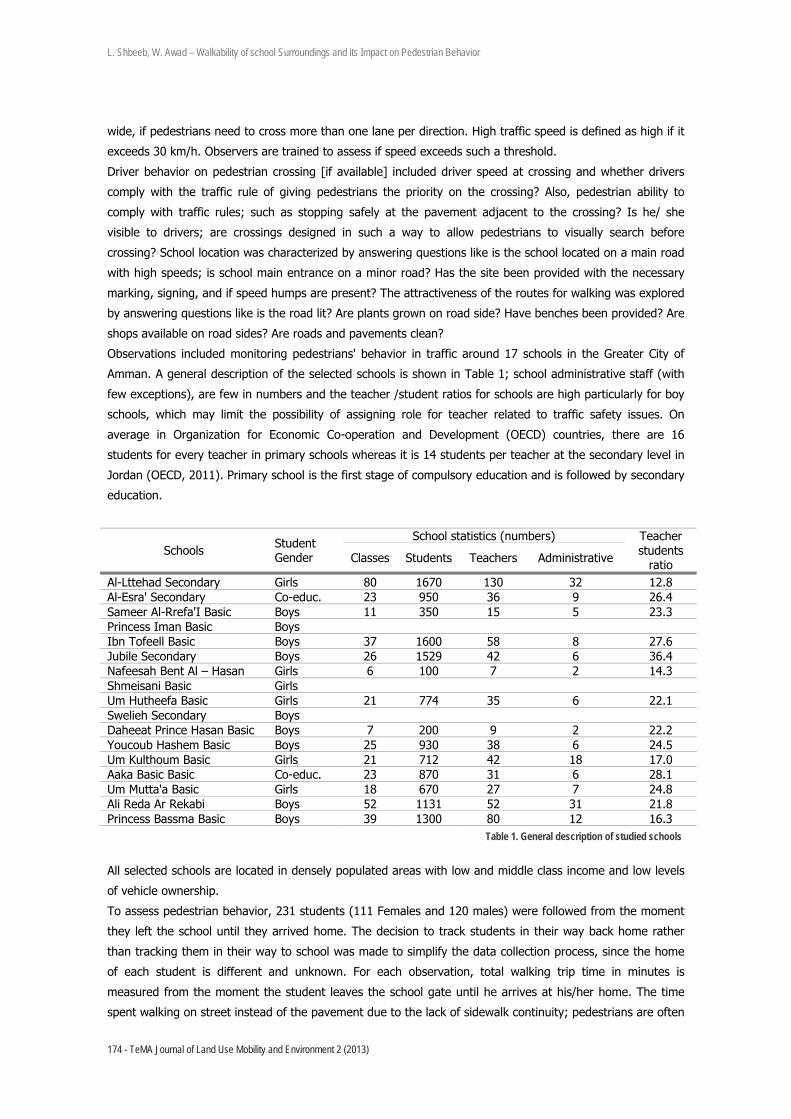
Observations included monitoring pedestrians' behavior in traffic around 17 schools in the Greater City of
Amman. A general description of the selected schools is shown in Table 1; school administrative staff (with
few exceptions), are few in numbers and the teacher /student ratios for schools are high particularly for boy
schools, which may limit the possibility of assigning role for teacher related to traffic safety issues. On
average in Organization for Economic Co-operation and Development (OECD) countries, there are 16
students for every teacher in primary schools whereas it is 14 students per teacher at the secondary level in
Jordan (OECD, 2011). Primary school is the first stage of compulsory education and is followed by secondary
education.
Schools Student Gender
School statistics (numbers) Teacher students
ratio Classes Students Teachers Administrative
Al-Lttehad Secondary Girls 80 1670 130 32 12.8 Al-Esra' Secondary Co-educ. 23 950 36 9 26.4 Sameer Al-Rrefa'I Basic Boys 11 350 15 5 23.3 Princess Iman Basic Boys Ibn Tofeell Basic Boys 37 1600 58 8 27.6 Jubile Secondary Boys 26 1529 42 6 36.4 Nafeesah Bent Al – Hasan Girls 6 100 7 2 14.3 Shmeisani Basic Girls Um Hutheefa Basic Girls 21 774 35 6 22.1 Swelieh Secondary Boys Daheeat Prince Hasan Basic Boys 7 200 9 2 22.2 Youcoub Hashem Basic Boys 25 930 38 6 24.5 Um Kulthoum Basic Girls 21 712 42 18 17.0 Aaka Basic Basic Co-educ. 23 870 31 6 28.1 Um Mutta'a Basic Girls 18 670 27 7 24.8 Ali Reda Ar Rekabi Boys 52 1131 52 31 21.8 Princess Bassma Basic Boys 39 1300 80 12 16.3
Table 1. General description of studied schools
All selected schools are located in densely populated areas with low and middle class income and low levels
of vehicle ownership.
To assess pedestrian behavior, 231 students (111 Females and 120 males) were followed from the moment
they left the school until they arrived home. The decision to track students in their way back home rather
than tracking them in their way to school was made to simplify the data collection process, since the home
of each student is different and unknown. For each observation, total walking trip time in minutes is
measured from the moment the student leaves the school gate until he arrives at his/her home. The time
spent walking on street instead of the pavement due to the lack of sidewalk continuity; pedestrians are often

L. Shbeeb, W. Awad – Walkability of school Surroundings and its Impact on Pedestrian Behavior
175 - TeMA Journal of Land Use Mobility and Environment 2 (2013)
forced to step-down from the sidewalk and walk on street. The observers were asked to measure the time
once the pedestrian step-down until s/he comes back to the sidewalk. In addition, observers were instructed
to write down number of times pedestrians are forced to leave the sidewalk.
The crossing behavior pattern was investigated by reporting the number of crossings, where the observers
are instructed to count how many streets the pedestrian needs to cross during their trip from school to
home. The crossing time is the time (minutes) spent from the moment the pedestrian begins to wait by the
curb or edge of the street (if there is no curb) to cross the street to the moment he reached the other side
of the street, including the waiting time by the median, if any. The observers were also asked to identify the
type of crossing locations; the observation forms list five crossing types (un-marked crossing at intersection
or at mid-block, marked crossing at intersection or at mid-block of crossing, mid-block with hump in place,
signalized intersection, and footbridge).
In addition, the observers were asked to identify pedestrian crossing style and it is defined by speed. Two
options are given in the observation form (normal walking speed (≤ 1.8 m/s) or running speed (≥ 3 m/s).
Huang, Yang and Eklund (2006) compared pedestrian walking speed to running speed. The average 15th,
50th and 85th normal walking speeds in their study are found to be 1.33, 1.55 and 1.85 m/s. The
corresponding 15th, 50th and 85th pedestrian running speeds are 3.11, 3.8 and 4.5 m/s. For the purpose of
this study, the observers were trained to differentiate between normal walking speed and the running speed
but during the observations, observers were not asked to measure the speed during crossings.
Visual search involved looking for vehicles before and during the crossing manoeuvre in order to avoid a
possible collision, the observer is supposed to check one of two options of each observation: whether the
pedestrian is looking or not looking for vehicles before crossing. Pedestrians can rely on their hearing ability
to look for traffic, but this is hard to observe besides it can’t be the only sense used by pedestrian before
crossing. Visual search and eye contact give the pedestrian the confident to perform the crossing.
The Highway Code in Jordan obligates motorists to give pedestrians priority. If a pedestrian is crossing the
street or waiting by the curb at pedestrian crossing, the driver is expected to yield for the pedestrian and
give him/ her priority. The observers were asked to identify driver interaction with pedestrian (slowing down
or stopping to let the pedestrian crossing or continue driving at the same speed).
Traffic conflict involvement: A traffic conflict is an observable situation in which two or more moving road
users approach each other in space and time to such an extent that a collision course is imminent if their
movements remained unchanged (Amundsen, Hydén, 1977). The observers were trained to detect if there is
a collision course, evasive action type and urgency. During the survey, observers were asked to detect the
conflict occurrence during the crossing.
The walking environment for each trip was assessed according to the above listed items. The survey involves
two observers for each pedestrian trip. The first observe rate trip walkability environment while the other
record the pedestrian behavior.
To rate the safety impacts of the inspected items that has been used to assess the walkability environment
of the school surrounding, a questionnaire was prepared and distributed among a group of highway and
traffic experts (engineers working in highway design and traffic with at least five years of experience). The
experts were asked to rate the impact of each variable on pedestrian safety that is used to assess the
walking environment on scale from 1 to 5. The lower scale (1) is used if the tested item has no effect. In
total, 16 experts participated in the rating. The sample includes academician, practitioners from public and
private sectors.
In addition to the field survey that was completed in this study, a questionnaire was prepared and
distributed for each selected school. The principal in the selected schools were asked to fill in the

L. Shbeeb, W. Awad – Walkability of school Surroundings and its Impact on Pedestrian Behavior
176 - TeMA Journal of Land Use Mobility and Environment 2 (2013)
questionnaire that was formulated to investigate safety conditions in the school area. Only 14 duly filled in
forms and returned back, which composes 82% of total distributed forms.
4 ANALYSIS AND RESULTS
4.1 PEDESTRIA ACCIDENTS IN JORDAN
The road safety in Jordan in relation to countries was compared by considering pedestrian fatality
population-based rates. The analysis is based on police reported accident data. Accident reporting system
falls under police authority. In every hospital, there is a police officer who will be notified about any case
admitted to the hospital or treated in the emergency unit if it related to road accidents. The insurance
company will not process any claim unless police report is attached. A study is made to assess the under-
reporting indicated that all fatal accidents are reported to police and only 5% of injury accidents are not
reported (Shbeeb et. al., 2004).
Road accident fatality population-based rate of Jordan compared to 29 countries that contribute data to
IRTAD shows that Jordan appears to perform rather poor and it is ranked the worst among the listed
countries using pedestrian fatality-population scale, as it has the highest rate (Figure 1). In 2010, pedestrian
fatality rate in Sweden was 0.34 per 100,000 inhabitants while it was in Jordan 3.57 fatality per 100,000
inhabitants, which almost 11 folds the rate in Sweden.
Figure 1. Pedestrian fatality rate-population based (2010)-IRTAD and JTI.
Pedestrian fatalities compose a considerable proportion of road fatalities in developing countries and smaller
proportion in developed countries. In Jordan, pedestrian accidents accounts for 33% of all fatalities
compared to only 9% in New Zealand (Figure 2). Comparing the road fatalities in Jordan with other
countries indicated that fatality rate for the age group 0-15 is three to five times as high as in the
industrialized countries. The risk of being involved in fatal accident of elderly pedestrian is half that of
corresponding rate in the industrialized countries. Of course, that is partially due to differences in exposure
and to the proportions of elderly in the society. Figure 3 indicates that the fatality rate for road-user of
young age group (15-24) is within the rates reported for a number of industrialized countries, but tends to
fall within the upper range of fatality rates. Fatality rate of age group 25-64 falls in the lower range of
industrial countries fatality rates.

L. Shbeeb, W. Awad – Walkability of school Surroundings and its Impact on Pedestrian Behavior
177 - TeMA Journal of Land Use Mobility and Environment 2 (2013)
Figure 2. Road accident fatality proportion by mode of transport (2010)-IRTAD and JTI.
4.2 CHILD PEDESTRIAN ACCIDENTS
For the purpose of this comparison, children were defined as those under the age of 15 years. They were
further subdivided into three groups [<5, 6-9, and 11-14]. Children were 49% of all pedestrian fatalities in
2010 (JTI, 2010). Females constitute only 19% of all fatalities. This may be a reflection of the fact that
females are not equally represented in traffic as males. The highest pedestrian fatality rate is among children
under age of 5 years. The highest injury rate is reported also for the same age group (Figure 4). Fatality
rates for the age groups of less than 5 years old are higher than the corresponding rate for all age groups
(approximately two folds). Serious injuries rate for all age groups is lower than that of the three age groups
of children. This is an indicative that such groups are at a high risk of being killed in traffic. Children are
often left unaccompanied in traffic. A study was made to assess the effectiveness of safety measures in
school vicinity showed that only 30% of children are accompanied by one of their family members (Shbeeb,
Awad, 2012). Pedestrians are one of the most vulnerable groups in traffic. If they are involved in an
accident, the consequences are serious.

L. Shbeeb, W. Awad – Walkability of school Surroundings and its Impact on Pedestrian Behavior
178 - TeMA Journal of Land Use Mobility and Environment 2 (2013)
Figure 3. Road fatalities by age group for a number of Countries (IRTAD, 2010 and JTI, 2010).
Figure 4. Child pedestrian injury / fatality rate by age group (JTI, 2010).
4.3 SCHOOL ENVIRONMENT ASSESSMENT
The principals were asked to state what kinds of measures were taken to regulate student movements to
and from the schools (Figure 5). Around one-third of the principles reported that no measure is taken as
there is no safety problem. Traffic warders, who have been trained to regulate traffic in school vicinity, are
assigned to help colleague students in only three schools of the studied schools.
The surroundings were assessed by a trained person who was asked to check the routes leading to each
school. The training covered all aspects included in the study (speed assessment, conflict detection, etc.) A
surrounding area with a radius of 2 km was considered for this purpose. The survey showed that 36% of the

L. Shbeeb, W. Awad – Walkability of school Surroundings and its Impact on Pedestrian Behavior
179 - TeMA Journal of Land Use Mobility and Environment 2 (2013)
schools’ entrances are directly on main roads. Humps have been installed nearby 12 out of the 17 selected
schools (70%). Traffic light signals have been installed in the surrounding areas of five schools. Proper
signing has been provided at only 8 schools to indicate the presence of a school. Fifty percent of the
principals reported that there is a speeding problem in the school vicinity.
Figure 5. Measures taken to regulate traffic in the vicinity of studied schools.
One-third of the principle indicated that there is a safety problem in the surrounding area of the schools.
According to Table 2, high proportions of students are walking to and from schools. One of the selected
schools is a private school that provides bus school service and most of its students arrive with buses.
School Name Ownership Walking School Bus Public Bus Taxi Private
Automobile Al-Lttehad Secondary Private 3 95 2 Al-Esra' Secondary Public 70 20 10 Sameer Al-Rrefa'I Basic Public 30 70 Princess Iman Basic Public Ibn Tofeel Basic Public 70 10 10 5 5 Jubile Secondary Public 90 10 Nafeesah Bent Al – Hasan Public 97 3 Shmeisani Basic Public Um Hutheefa Basic Public 80 16 4 Swelieh Secondary Public Daheeat Prince Hasan Basic Public 90 10 Youcoub Hashem Basic Public 70 30 Um Kulthoum Basic Public 90 10 Aaka Basic Basic Public 25 50 25 Um Mutta'a Basic Public 70 10 20 Ali Reda Ar Rekabi Public 80 15 5 Princess Bassma Basic 70 20 10
Table 2. Mode of transport to and from school by ownership.
For the purpose of assessing the walkability of streets leading to schools, six aspects were considered (Table
3). The evaluation was done in two methods, the first method assuming equally weight (without weight)
assigned binary score (0 if conditions contribute negatively to safety, and 1 if the existing conditions
contribute positively to safety). The second method (with weight) introduced a safety scale (1 to 5), where
one for little impact on safety and 5 for high impact on safety.

L. Shbeeb, W. Awad – Walkability of school Surroundings and its Impact on Pedestrian Behavior
180 - TeMA Journal of Land Use Mobility and Environment 2 (2013)
Assessment aspect Assigned points (maximum)
Sidewalk conditions 8 Pedestrian crossing conditions 8 Driver behavior at pedestrian crossing 5 Pedestrian ability to comply with traffic rules 4 The attractiveness of streets for walking 6 The general location of the schools 4 Total 35
Table 3. Maximum points assigned by assessment aspect.
Streets have been appraised according to the above six aspects. The maximum point on the scale summed
to 35 points. Sidewalk conditions have been assigned 8 points on this scale. Same points were given to
crossing conditions. Six points were allocated to attractiveness and 4 points for school location. Driver
behavior at crossing was given 5 points while pedestrian compliance with the rules received 4 points. For
each aspect, a set of variables were identified and tested. To cross examine the proposed rating scheme,
each aspect was weighted according to the average weight given to each tested variable as viewed by a
group of experts in the country (Table 4). The total weights add up to 97.3. The overall rate given to each
case was adjusted to be 100.
Aspect Tested variable Average Weight Group Tested variable Average
Weight
Side
wal
k
Sidewalk Width 2.94
Pede
stria
n be
havi
or
Pedestrian is visible and cars are visible to him/her 2.53
Sidewalk maintenance 2.19 Safe to walk on the sidewalk 4.00
Sidewalk continuity 3.00 If there is no side walk, still it is safe to walk against traffic 3.00
Sidewalk used for vending machine 2.44 Use Well marked and guided
pedestrian crossing 2.31
Sidewalk is used for parking 2.13
Attr
activ
enes
s
Lit street 2.80 Sidewalk is occupied with trees and advertisement pole
2.94 Street with flowers 2.56
Sidewalk with skid surface 2.25 Benches are available 2.75 No sidewalk 2.53 Clean sidewalk and streets 3.00
Cros
sing
Marking for pedestrian crossing 2.50 No gang or bad people 2.20
Signing for pedestrian crossing 2.70 Attractive shops 3.13
Street width 4.50
Loca
tion
School at high speed street 3.25
Traffic speed 3.00 School at high speed street but not the entrance 3.00
Long delay at signals 2.50 Humps are available the school vicinity 2.81
Parked vehicle obscure the view 2.40 The school is well marked and signed. 2.75
Tress on crossing 2.90
Scale: 1for little impact on safety 5 for high impact on safety
Hump existence 2.80
Driv
er b
ehav
ior
Ignoring pedestrian and maintain speed 2.80
Giving way to pedestrian 2.60 Reversing without being attention to pedestrian 2.60
Speed at pedestrian crossing 2.50
Comply with rules 3.00

L. Shbeeb, W. Awad – Walkability of school Surroundings and its Impact on Pedestrian Behavior
181 - TeMA Journal of Land Use Mobility and Environment 2 (2013)
Table 4. Weights Given to Each Tested Aspect to Evaluate School Environment Walkability. The average weight of all tested aspects within each category was calculated. Figure 6 show that experts
give more weight to school location and pedestrian behavior and less weight to driver behavior and
sidewalk.
Figure 6. Road expert average weight by investigated aspects used to rate school zone walkability.
Scores of tested aspects were classified into five categories (Table 5) from very poor atmosphere to
excellent atmosphere. Considering the two methods of evaluation (with and without weight), Table 5 shows
that about 56% of the cases are rated as poor or very poor if weights are not considered, while the ratio is
changed to 34% if the weights are considered.
The observations made include collecting data on conflicts that may involve the observed subjects. The total
number of conflicts observed is correlated to the overall rating giving for walkability with and without
weighting. The results indicated that a negative relation (r = - 0.126 (with weight) and r = - 0.141 (without
weight)). Although the correlation is low, the level of significant is marginal (p=0.05).
Evaluation Method Excellent
atmosphere
Very Good
atmosphere
Good
atmosphere
Fair
atmosphere
Poor
atmosphere
Very poor
atmosphere
Without
weight
Range 30-35 27-29 23-26 19-22 15-18 <15
Number 1 7 22 72 101 28
% 0.4 3.0 9.5 31.0 44.0 12.0
With weight Range >80 70-80 60-<70 50-<60 40-<50 <40
Number 4 20 32 97 63 15
% 2.0 9.0 14.0 42.0 27.0 7.0
Table 5. Rating walkability of school surroundings.
The average rating for each school is calculated to examine the overall walkability. The analysis was
completed for with and without weighting. Table 6 shows the without weighing case and illustrate the rank
of each school for each assessment aspect.
Table 6 shows that an agreement seems to exist between raking of the site according to how attractive they
are or pedestrian ability to comply with traffic rules and the overall rating giving to each school. The
correlation analysis yield a significant relation between the overall evaluation with attractiveness (r = 0.75,
p=0.001) and pedestrian ability to comply with traffic rules (r = 0.65, p=0.005). Table 6 shows that the
schools that have not taken any measure to regulate traffic in their vicinity have poor ranking. Table 6 also
shows a good agreement (r = 0.96, p=000) between the overall rating (with weight) and the overall rating
(without weight).

L. Shbeeb, W. Awad – Walkability of school Surroundings and its Impact on Pedestrian Behavior
182 - TeMA Journal of Land Use Mobility and Environment 2 (2013)
School Sidewalk Crossing Driver
behavior
Pedestrian
Behavior
Attracti-
veness Location
Overall Regulation
Measure Without
Weight
With
Weight
Al-Lttehad Secondary 17 11 7 1 6 2 1 2
Al-Esra' Secondary 16 5 15 2 1 4 2 1 No measure
Sameer Al-Rrefa'I Basic 13 6 16 3 5 14 3 3
Princess Iman Basic 5 16 3 5 7 8 4 4
Ibn Tofeell Basic 10 7 5 9 2 10 5 5
Jubile Secondary 7 13 4 14 4 7 6 6 No measure
Nafeesah Bent Al – Hasan 9 17 1 11 8 11 7 7
Shmeisani Basic 6 15 8 7 12 13 8 9
Um Hutheefa Basic 12 8 9 13 15 1 9 10
Swelieh Secondary 3 4 14 12 3 12 10 11
Daheeat Prince Hasan Basic 4 12 2 8 10 6 11 8 No measure
Youcoub Hashem Basic 1 3 6 4 11 5 12 12
Um Kulthoum Basic 13 14 13 16 14 15 13 15 No measure
Aaka Basic Basic 2 9 11 6 16 9 14 13
Um Mutta'a Basic 8 2 12 10 9 17 15 16
Ali Reda Ar Rekabi 11 10 10 15 13 16 16 17 No measure
Princess Bassma Basic 15 1 17 17 17 3 17 14
Table 6. Rating of the Suitability of School Environments for Walking Based on the Six Aspects.
4.4 PEDESTRIAN BEHAVIOR
To provide insight into the interaction of pedestrians and the environment, pedestrian behavior on some of
routes that lead to the selected school were further examined. Pedestrians were followed from when they
left school until they reached home and the time they spent walking on the pavement or the road was
recorded. Their crossing behavior was closely observed. On average, children cross two junctions during
their trips (Figure 7). There is no significance difference in the number of junctions crossed by students due
to gender (t = 0.55, p = 0.58).
Figure 7. Number of crossing by gender.
Observations made showed that 8% of all crossings tasks were completed with no interaction with vehicles
(No vehicle presents on the street at the moment of crossing). The results showed that a slightly above two-
thirds of the crossings were made on un-marked crossing (mid-block). Only 2.3% of all crossings were made

L. Shbeeb, W. Awad – Walkability of school Surroundings and its Impact on Pedestrian Behavior
183 - TeMA Journal of Land Use Mobility and Environment 2 (2013)
near humps, even though humps were installed in the vicinity of 12 of the schools included in the study
(Figure 8).
Figure 8. Proportion of crossings by type of traffic control device. Looking into pedestrian crossing style shows that 26% of males were running compared to 16% of females
who were running while crossing (Figure 9). Nevertheless, there is no significant difference in their behavior
(χ2=2.44 p=0.1183).
Figure 9. Crossing style by gender: crossing speed. The visual search when crossing the streets was closely observed. The ratio of number of crossings that was
preceded by visual search to number of all crossings made is calculated by gender. The results indicated that
male performed visual search more often than female did (Figure 10). However, no significant difference
was detected (t = -1.71, p = 0.088). Around one-fourth of all crossings were made without any visual
search.

L. Shbeeb, W. Awad – Walkability of school Surroundings and its Impact on Pedestrian Behavior
184 - TeMA Journal of Land Use Mobility and Environment 2 (2013)
Figure 10. Ratio of number of positive visual search crossings to all observed crossings by gender.
Driver interaction with pedestrian was investigated. Crossing priority was given to pedestrians in 34% of all
observed situations. Crossing priority was more frequently given to male children than female children
(Figure 11). The study indicated that there is significant difference in driver behavior towards pedestrian
gender (χ2 = 8.85, p = 0.0029).
Figure 11. Pedestrian given priority by gender.
Pedestrians were involved in 34 conflicts on their back home trip (15%). Figure 12 shows that females were
less involved in conflicts (12%) compared to male (18%). However, there is no significant difference
between number of conflicts due to gender (t = 0.54, p = 0.59).

L. Shbeeb, W. Awad – Walkability of school Surroundings and its Impact on Pedestrian Behavior
185 - TeMA Journal of Land Use Mobility and Environment 2 (2013)
Figure 12. Involvements in conflicts by gender.
The mean time spent by the 232 pedestrians walking was 17.4 (Std = 9.2 minutes). The pedestrians spent
52% of their time walking on the pavement, 32% along the road, and 16% of their time crossing. This
clearly shows that they are over exposed to traffic which increases the likelihood of being involved in an
accident (Table 7). There was no significant difference between average times of trips, on-street walking
time or crossing times due to gender (t-test at 5% level of confidence). Table 7 shows that male children
walk along the road longer than female children. In general, male walk longer with an average of 20.1
minutes while female walk for 14.8 minutes.
Indicator
All Female Male
t-test N Mean Std.
Deviation N Mean Std. Deviation N Mean
Std. Deviatio
n Total Walking Trip Time (minutes) 232 17.4 9.2 108 14.8 8.1 119 20.1 9.4 t=-4.61
P=0.001 On Street Walking Time (minutes) 232 5.7 5.0 108 4.5 4.4 119 6.8 5.4 t=-3.43
P=0.01 Street Crossing Time (minutes) 225 2.4 1.6 104 2.1 1.4 119 2.7 1.6 t=-2.88
P=0.04 Proportion of time spent walking on Street Time/ Trip Time (%)
229 0.32 0.2 108 0.30 0.2 119 0.34 0.21 t=-1.32 P=0.19
Street Crossing Time/ Walking Trip Time (%)) 224 0.16 0.1 108 0.18 0.1 119 0.15 0.10 t=2.02
P=0.045
Table 7. Walking trip time (minutes) characteristics.
5 DISCUSSION OF RESULTS The study indicated that pedestrians in Jordan are at a high risk of being involved in a traffic accident when
compared to reported risk in a number of industrial countries. Children under the age 15 years [40% of
Jordan’s population] suffer the most. Children under five years old are subjected to the highest risk of being
killed in traffic compared to other age group. Pedestrian environment is a contributory factor that needs to
be assessed. Pedestrian facilities are of poor standards and this study looked into the facilities provided in
the vicinity of 17 schools indicated that the surrounding environment is poor. The study showed that
pedestrian compliance with traffic rules is better in areas that are characterized as attractive for pedestrians
to walk through. The correlation analysis yield a significant relation between the overall evaluation and the

L. Shbeeb, W. Awad – Walkability of school Surroundings and its Impact on Pedestrian Behavior
186 - TeMA Journal of Land Use Mobility and Environment 2 (2013)
pedestrian ability to comply with traffic rules (r = 0.65). As a result, there are more traffic conflicts in the
vicinity of schools with poor walkability.
Observing pedestrian behavior indicated that they spend half of their walking trip time either by crossing or
walking on the street instead of pavements. On average, children cross two junctions on their way back from
or to school. One-fourth of male children tends to run when walk back from school. The proportion of female
who walk fast is slightly lowers (16%). Running or jogging combined with crossing more than one junction
may increase the risk of subjecting the children to conflicts or crashes. Combing poor environment condition
with impropriate behavior makes walking hazardous progression. The results showed female walk less but
there was significant difference in their involvement in conflicts. Male involvement in conflict is more than
female involvement in conflict, despite the fact that male children were given more priority in traffic
compared to female children. On the other hand, the results also indicated a lower proportion of female
pedestrian made visual search ahead of their crossing, which may induce them to more hazardous situation
because they are not always given the priority.
Internationally, the application of active transportation concept is not widely spreading in Jordan within the
given context. Active travel has been positively associated with higher daily levels of physical activities
(Rosenberg et. al. 2006 & Cooper et. al. 2006) and higher fitness levels (Andersen et. al., 2009; Voss,
Sandercock, 2010). Although, rates of active transportation to schools have declined during the past years
(McDonald, 2007), and many initiatives took place as a response to such decline (e.g. Safe Routes to School
(SRTS) and the Walk to School (WTS) program).
Active transportation concepts would require providing walkable environment that encourage walking, as
safe mode of transport to and from school. The study clearly shows that the surroundings of the selected
school are in large not a friendly walking environment. Guidelines ought to be developed to meet
pedestrians’ needs and safety requirements around schools.
REFERENCES
Amundsen, F.; Hyden C. (1977), “The Swedish traffic conflict technique”. Proceedings of First Workshop on Traffic Conflicts, Institute of Transport Economics, Oslo, 1-5.
Andersen, L.B.; Lawlor, D.A.; Cooper A.R.; Froberg, K.; Anderssen S.A. (2009), “Physical fitness in relation to transport to school in adolescents: the Danish youth and sports study”, Scandinavian journal of medicine & science in sports 19(3), 406-411.
Blue, J.; Reed Gibby,A.; Ferrara, T.C. (2001), Traffic Operations Program, and California State University, Chico. California Public Works Studies Program. Final Report, Evaluation of Pedestrian Safety Policies and Practices on California State Highways. California Department of Transportation, Traffic Operations Program.
Cheng, EY-C. (1991), “Pedestrian Accidents in Utah”, Transportation Research Record, 1325.
Committee on injury, violence, and poison prevention of American Academy of Pediatrics (2009), “Policy Statement - Pedestrian Safety”, Pediatrics, 124, 802–812.
Cooper, A.R.; Wedderkopp, N.; Wang, H.A.N.;Andersen L.B.; Froberg, K.; Page, A.S. (2006), “Active travel to school and cardiovascular fitness in Danish children and adolescents”, Medicine and science in sports and exercise 38(10), 1724.
Huang, S. N., J. K. Yang, and F. Eklund. (2006). Analysis of Car-Pedestrian Impact Scenarios for the Evaluation of a Pedestrian Sensor System Based on the Accident Data from Sweden. Bundesanstalt für Straßenwesen. Die Reihe: 136.
International Road Traffic and Accident Database (IRTAD), Available at: http:www.irtad.net/.
Jordan, G. (1998), “Child pedestrian-car crashes near schools are a small percentage of total child pedestrian crashes in Philadelphia”, Transportation Research Record: Journal of the Transportation Research Board 1636(1), 132-137.

L. Shbeeb, W. Awad – Walkability of school Surroundings and its Impact on Pedestrian Behavior
187 - TeMA Journal of Land Use Mobility and Environment 2 (2013)
JTI-Jordan Traffic Institute; PSD-Public security Directorate(2010), Traffic accidents in Jordan, Annual Report, Jordan Traffic Institute.
Kupferberg‐Ben David, N.; Rice R.G. (1994), “The role of the physical environment in child pedestrian accidents”, Journal of advanced transportation, 28(2), 171-187.
McDonald, N.C. (2007), “Active transportation to school: trends among US schoolchildren, 1969–2001”, American journal of preventive medicine, 32(6), 509-516.
Moudon, A.V.; Chanam L. (2003), “Walking and bicycling: an evaluation of environmental audit instruments”, American Journal of Health Promotion, 18(1), 21-37.
Naci, H.; Chisholm, D.; Baker, T.D. (2009), “Distribution of road traffic deaths by road user group: a global comparison”, Injury prevention, 15(1), 55-59.
Organisation for Economic Co-operation and Development (OECD) (2011), Education at a Glance, Available at: www.oecd.org/edu/eag2011.
Rosenberg, D.E.; Sallis, J.F.; Conway, T.L.; Cain, K.L.; McKenzie, T.L. (2006), “Active transportation to school over 2 years in relation to weight status and physical activity”, Obesity, 14(10), 1771-1776.
Schatz, G.W.; Cardenas, L.; Williams, C. (2009), “Safe Routes to Schools in El Paso, Texas”. ITE 2009 Annual Meeting and Exhibit.
Shbeeb, L.I.; Awad, W. (2012), “Evaluation of School Zone Improvement Scheme”, 6th Traffic Safety Conference, Amman, Jordan, November 19-20/2012, Jordan Traffic Institute.
Shbeeb, L.I.; Awad, W.; Suliman, H.M.R.; Saleem, J. (2004), “Under Reporting of Road Traffic Accidents in Jordan”, Conference proceedings, Jordan International Conference on Sustainable Development of Transportation Systems, Amman, Jordan, April 12-15.
Shbeeb, L.I.; Mujahed, J. (2002), “A study into Pedestrian Safety Problem in Jordan”, Extra ICTCT workshop Vancouver Canada.
Voss, C.; Sandercock, G. (2010), “Aerobic fitness and mode of travel to school in English schoolchildren”, Med Sci Sports Exerc, 42(2), 281-287.
VTPI-Victoria Transport Policy Institute (2012), Transport Demand Management Encyclopedia.
Westdijk, E.C. (2001), “Designing a safe residential environment for children”, International Conference: Traffic Safety on Three Continents, no. VTI Konferens 18A.
World Health Organization (2009), Global status report on road safety: time for action, Geneve.
Zegeer, C.V.; Bushell, M. (2012), “Pedestrian crash trends and potential countermeasures from around the world”. Accident Analysis & Prevention, 44(1), 3-11.
Zhu, X.; Lee, C. (2008), “Walkability and safety around elementary schools”, American journal of preventive medicine, 34(4), 282-290.
Zhu, X.; Lee, C. (2009), “Correlates of walking to school and implications for public policies: survey results from parents of elementary school children in Austin, Texas”, Journal of Public Health Policy, S177-S202.
IMAGES SOURCES
All the images are from the authors.

L. Shbeeb, W. Awad – Walkability of school Surroundings and its Impact on Pedestrian Behavior
188 - TeMA Journal of Land Use Mobility and Environment 2 (2013)
AUTHORS’ PROFILE
Lina I. Shbeeb Assistant professor at the faculty of engineering/ Al-Ahliyya Amman University since 2011, she is a senior traffic and transport engineer with over 25 years experience in the traffic and transportation engineering sectors. Experience includes traffic safety, human behavior, transportation network planning, forecasts and computer applications in traffic and transportation planning, traffic survey and studies, traffic impact, pavement design and evaluation, and economic evaluation. Wael Awad Dean of Engineering at Al-Ahliyya Amman University, on Sabbatical leave from Al Balqa' Applied University. Dr. Awad is a senior traffic and transportation expert with more than 25 years of experience in traffic and traffic safety. Areas of expertise in addition to traffic and traffic safety include traffic simulation, human behavior, artificial intelligence applications in transportation, feasibility studies, traffic impact studies, engineering economy, and applied statistics.