temporal analysis of the use and vegetal … · and quantitative analyses of the pollen grains were...
TRANSCRIPT
TEMPORAL ANALYSIS OF THE USE AND VEGETAL COVERAGEAND THE HONEY POLLEN DIVERSITY IN CÁCERES (MT)
Milaine Fernandes dos SANTOS1
Carla GALBIATI2
Sandra Mara Alves da Silva NEVES3
Elaine Maria LOUREIRO4
Abstract
This study was conducted to evaluate the influence of the use dynamics and the vegetationcover during the years 2005, 2006, 2008 and 2009 on vegetal diversity as well as its influence onpollen types found in honey of Apis mellifera during two periods, in Cáceres- Mato Grosso State.The use and vegetation cover were analyzed, using the software SPRING and ArcGIS. The collectionof both honey and flowers were monthly sampled during the periods from July/2005 to June/2006and January/2008 to October/2009 in a commercial apiary located in Cáceres. Both qualitativeand quantitative analyses of the pollen grains were accomplished in 98 honey slides. The diversityof the pollens was compared between crop and non-crop cycles, using the similarity coefficient.The honey samples were similar between crop cycles/2008 and crop/2005 (Ss=0,29) and betweenthe crops cycles and crop/2008 (Ss=0,35). The crop/2009 was not similar to other periods. Theimportant species for honey were Cecropia pachystachya, Mimosa pudica and Myracrodruonurundeuva, which were not affected both by the use dynamics and vegetation cover. The temporaldynamics of the use and vegetation cover caused low variation in the human-affected and Savannahareas, unlike pollen diversity of the honey which was similar in this research.
Key words: Apis mellifera. Vegetation species. Temporality. Geographic Information System.Geo-Technologies.
1 Pós-Graduação em Ciências Ambientais � UNEMAT/Bolsista Capes. CELBE - Cidade Universitária. Bloco II.CEP: 78200-000 Cáceres/Mato Grosso-MT, Brazil. E-mail: [email protected]
2 Universidade do Estado do Mato Grosso. Docente/Departamento de Agronomia � UNEMAT. Avenida SãoJoão, s/n. B: Cavalhada. Campus Universitário de Cáceres. CEP: 78200-000 Cáceres/Mato Grosso-MT,Brazil. E-mail: [email protected]
3 Universidade do Estado do Mato Grosso. Docente/Laboratório de Geotecnologias � UNEMAT. AvenidaSantos Dumont, s/n. B: DNER. Cidade Universitária, Bloco I, sala I. CEP: 78200-000 Cáceres/Mato Grosso,Brazil. E-mail: [email protected]
4 Universidade do Estado do Mato Grosso. Laboratório Cetapis � UNEMAT. Bolsista CNPq. Avenida São João,s/n. B: Cavalhada. Campus Universitário de Cáceres. CEP: 78200-000 Cáceres/Mato Grosso-MT, Brazil.E-mail: [email protected]
GEOGRAFIA, Rio Claro, v. 36, Número Especial, p. 73-83, jun. 2011.

74 GEOGRAFIATemporal analysis of the use and vegetal coverage and the
honey pollen diversity in Cáceres (MT)
Resumo
Análise temporal do uso e cobertura vegetal e a diversidadepolínica do mel em Cáceres (MT)
Objetivou-se avaliar a influência da dinâmica do uso e a cobertura vegetal nos anos de2005, 2006, 2008 e 2009 sobre a diversidade de plantas e a influência de ambos sobre os tipospolínicos encontrados no mel de Apis mellifera L. em dois períodos em Cáceres (MT). O uso ecobertura vegetal foi realizado por meio da utilização dos SIGs SPRING e ArcGIS. As coletas deméis e flores foram amostradas mensalmente em um apiário comercial em Cáceres, de julho/2005a junho/2006, janeiro/2008 a outubro/2009. As análises qualitativas e quantitativas dos grãosde pólen foram realizadas em 98 lâminas de méis. A diversidade de pólens foi comparada entresafra e entressafra por meio do índice de similaridade. A similaridade nos méis ocorreu entre asafra/2005 e a entressafra/2006 (Ss=0,29) e entre a entressafra e a safra/2008 (Ss=0,35). Asafra/2009 não foi similar aos outros períodos. As espécies importantes para o mel foram Cecropiapachystachya, Mimosa pudica e Myracrodruon urundeuva, as quais não foram influenciadas peladinâmica do uso e a cobertura vegetal. A dinâmica temporal do uso e cobertura vegetal ocasionoupouca variação nas áreas antrópicas e de Savana, ao contrário da diversidade polínica do melque foi similar nessa pesquisa.
Palavras-chave: Apis mellifera. Espécies vegetais. Temporalidade. Sistema de informaçãogeográfica. Geotecnologias.
INTRODUCTION
The disordered occupation processes of the landscape cause significant changes inecosystems, such as the loss of native vegetation areas (WANG et al., 2010, p. 973)reducing the floristic diversity of the natural areas (BARBOSA et al., 2006, p. 189). Accordingto Figueiredo et al. (2005, p. 572), the agricultural sector in the State of Mato Grossopresents a relevant economical potential, which reflects negatively on local biodiversity,since it promotes alterations in the natural landscapes.
According to Santos-Filho et al. (2008, p. 636), the habitat fragmentation provokesthe decrease of the wealth and abundance of small mammals. The changes caused in thevegetation cover can also reduce the species with apicultural potential. According to Bastoset al. (2003, p. 599), the diversity of the apicultural species occurring in the Savannahfragments are related to the preservation level of the vegetation cover in surroundings ofthe apiaries, which are the source for the maintenance of the beehives.
In this sense, the honey can be used as an indicator of the vegetal species found inphyto-physiognomies around apiaries. Hjelle (1997, p. 5) showed that the pollen analysisreflects the occurrence of the local vegetation in landscapes that were exposed to humanactivities such as the pollen types Asteraceae, Poaceae, Oxalis, Polygala.
The species Astronium sp., Alternanthera sp., Schinus sp., Serjanea sp. (BASTOS, etal., 2003, p. 599) and Cissus simsiana, Melochia tomentosa, Portulaca elatior (CARVALHO eMARCHINI, 1999, p. 338) can be mentioned as indicative for both Savannah and Thornforest fragments in the boundaries of the apiaries.
According to Souza (2004, p. 70, 71), the honey production is related to ecologicalconditions of the place where apiaries are set up, namely to variables such as presence ofgood flowering and water availability. According to Raffo and Paula (2009, p. 6, 10), the useof the Geographical Information Systems (GIS) can be helpful for the evaluation of land use/land cover, and as a tool to choose those places for the implantation of apiaries with theavailability of apicultural floral resources. So GIS can be used to determine the places forinstallation of apiaries with minimum presence of native vegetation.
75Santos, M. F. dos / Galbiati, C. /
Neves, S. M. A. da S. / Loureiro, E. M.v. 36, Número Especial jun. 2011
The use of geo-technologies as a tool for environmental analysis has also been usedin several studies contemplating the area of planning applied to the environment and themanagement of natural resources (DONHA, et al., 2006, p. 176; ZURLINI, et al., 2006, p.122; GRAYMORE et al., 2009, p. 455; AMARAL, et al., 2009, p. 317).
In Mato Grosso State, the beekeeping has acquired an important role as an alternativesource of income. It is the second highest producer of honey of Brazilian Central-Westregion, with approximately 494 t in 2008 (IBGE, 2008, p. 26). The use of geo-technologiesfor the vegetal cover mapping helps the installation of apiaries in places presenting vegetaldiversity, which locally contributes to the apicultural activity in the municipality of Cáceres.The replacement of native vegetation areas by a human-altered one can reduce the apiculturalfloral resource.
Thus this study was carried out to evaluate the influence of the dynamics of landuse/land cover in the years 2005, 2006, 2008 and 2009 on the diversity of plants as well asthe influence of both on the pollen types found in the honey of Apis mellifera L. during twoperiods in Cáceres (Mato Grosso State) municipality.
METHODOLOGY
AREA UNDER STUDY
This study was carried out in a commercial apiary located at coordinates S 16o 04'52 �� and W 57o 36' 56 �� on dry land at Girau Farm, in the municipality of Cáceres, SW MatoGrosso State.
GENERATION OF THEMATIC MAPS
The land use/land cover was analyzed considering a 3km ray around the Girau apiary.The procedures for elaborating the thematic maps of land use/land cover began with geo-referencing from bands 3, 4 and 5 of the Landsat 5 TM images, Orbit/Point 227/71, with 30mspatial resolution, referring to the dry period of the years 2005, 2006, 2008 and 2009, usingcontrol points obtained in the field survey and processed with software SPRING. A second-grade polynomial transformation and the next neighbor pixel re-sampling technique wereapplied for geometric correction of the images (NEVES, 2006, p. 56).
To accomplish the segmentation of the image from the area under study, some testswere made to define the similarity values that delimit better the types of land use/landcover and concomitantly would not cause high fragmentation in these areas. It was verifiedthat the value 10/25 is more acceptable, since it correctly separated the visually differentgray levels.
The segmentation was followed by the creation of the context file, region extraction,training using the Bhattacharya classifier, and by the procedure for mapping the classes andprepare a thematic map. The elaboration of the layouts of the thematic maps and thequantifications were accomplished in ArcGis.
The toponymy (highways, rivers, localities, etc.) used as references in theinterpretation process were compiled from the topographical map Cáceres (Sheet SE. 21-V-B-II) elaborated by the Cartography Service from the Army (Diretoria do Serviço Cartográfico
76 GEOGRAFIATemporal analysis of the use and vegetal coverage and the
honey pollen diversity in Cáceres (MT)
do Exército), at scale 1:100,000. This map was digitized, vectored and its information wasassociated to the geographical database in ArcGis.
The field works allowed the identification land use/land cover in the apiary surroundings,applying the methodology described in the technical manuals referring to it, elaborated byIBGE (1992, p. 26 and 1996, p. 27, 29, 32, 35). In this stage, the information contained inthe Conservation Plan for the Upper Paraguay Basin (Plano de Conservação da Bacia do AltoParaguai- PCBAP,1997, p. 18) were also used as a reference.
COLLECTION OF HONEY AND PLANTS
The flowery species and the honeys were monthly collected during the time-spanfrom July/2005 to June/2006 and from January /2008 to September/2009 in the municipalityof Cáceres.
The flowery species were collected observing a radius of 3km around apiaries, adistance corresponding to twice the performance area of the bees (SANDE et al., 2009, p.2704). The honeys were collected in three fixed beehives of A. mellifera type Langstroth inthe chosen apiary.
The species of the collected plants were botanized, identified according to POTT &POTT (1994, p. 21 to 311) and by a specialist. They were deposited in the referencecollection of the CETApis Laboratory, in the University Campus of the Mato Grosso StateUniversity (UNEMAT) in Cáceres. The list of plants obtained was adapted to that one presentedby Cronquist (1981, p. 268).
For the identification of the pollen types in the honey, some honey slides weremounted, adopting the fresh-preparation method, following the technique developed byLouveaux et al. (1970, p. 125, 138). The flowery plants were used to make floral buds,removing pollen from the closed stigma.
Qualitative and quantitative analysis of the pollen grains in the honey slides weremade. The qualitative analysis was done by taxonomic identification of the pollen types atfamily and gender levels, as well as at specie level when possible, using the slides of thefloral buds and specialized literature (BARTH; MELHEM, 1988, p. 11, 63, 69, 73; ERDTMAN,1952, p. 11, 25; ROUBIK; MORENO, 1991, p. 43, 61, 77, 99).
The quantitative analysis was accomplished, by observing the frequency at whicheach pollen type occurs in the honey samples. The pollens were classified as dominant(frequency above 45%), accessory (frequency from 15% to 45%) and isolate (frequencylower than 15%) (BARTH, 1989, p. 13, 14, 16). The classification of the pollen types allowsthe determination of the vegetal species that are important for honey production.
The quantification of the vegetation diversity was based on the number of vegetalspecies found annually. To classify monthly the frequency of the pollen types in honey, theaverage of the quantitative analysis result of two honey slides was used. The seasonalfrequency of the pollen types was accomplished during the periods of crop cycle (Novemberto April) and crop (May to October), following the method previously described.
The analyses done during the periods of crop cycle and crop were the possiblecomparisons for the honeys collected in this study. The similarity of the vegetal speciesfound in honey were compared between the crop cycle/2006 (November/2005 to April /2006) and 2008 (November/2008 to April/2009) and the period of crop/2005 (July to October),2008 (May to October) and 2009 (May to October). The comparison was made using thedistance coefficient that was obtained by the Sorensen similarity index (Ss), which considered
77Santos, M. F. dos / Galbiati, C. /
Neves, S. M. A. da S. / Loureiro, E. M.v. 36, Número Especial jun. 2011
both presence and absence of vegetal species. The distance coefficient was analyzed forthe variation of the data to zero value (KREBS, 1998, p. 379).
The similarity analysis of the apicultural flora was done, using the Genes software(CRUZ, 2001).
RESULTS AND DISCUSSION
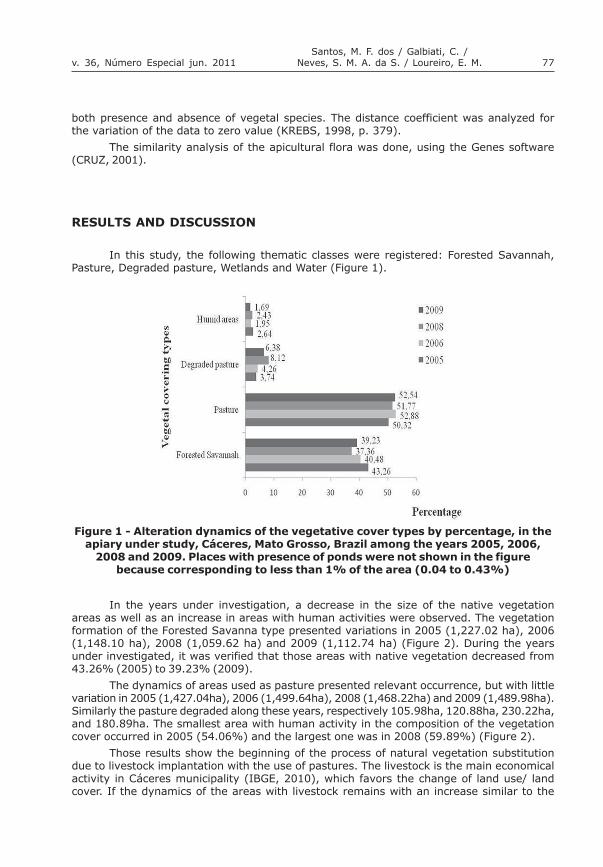
In this study, the following thematic classes were registered: Forested Savannah,Pasture, Degraded pasture, Wetlands and Water (Figure 1).
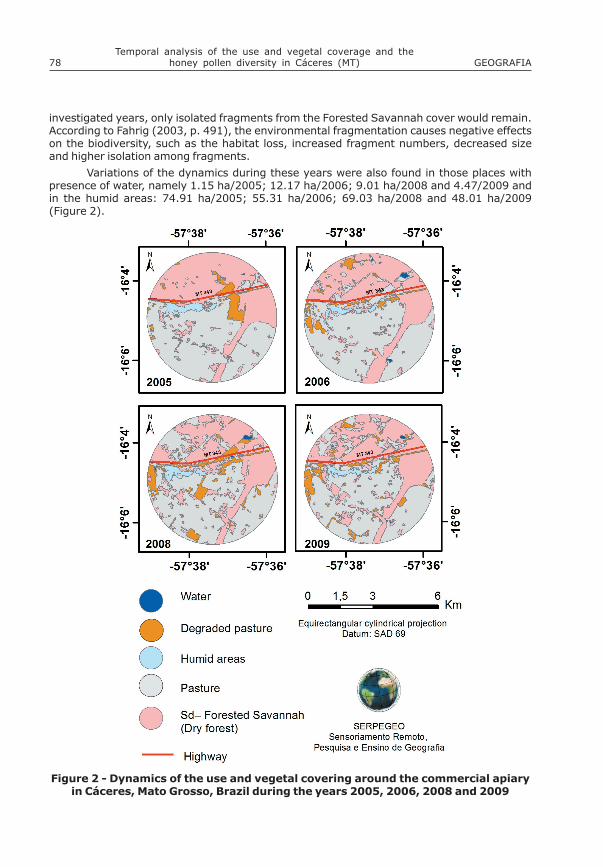
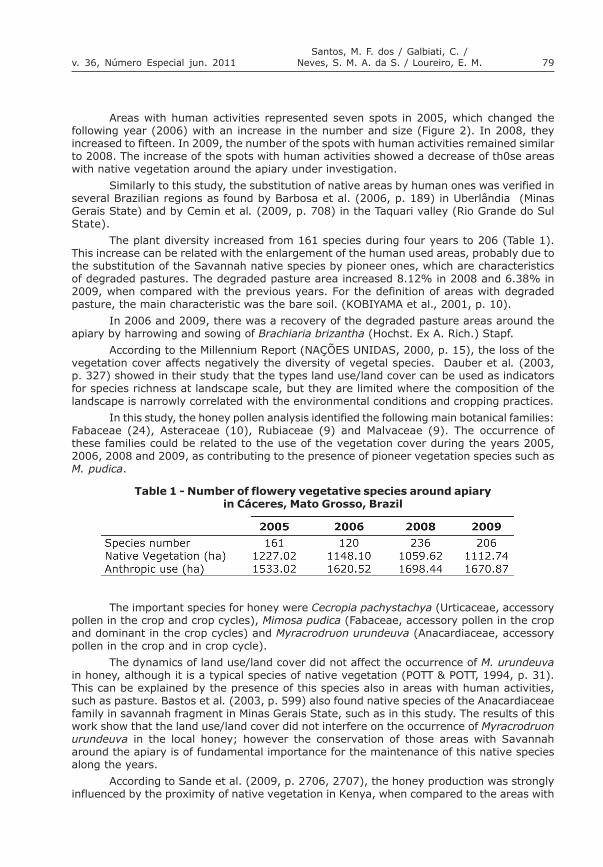
In the years under investigation, a decrease in the size of the native vegetationareas as well as an increase in areas with human activities were observed. The vegetationformation of the Forested Savanna type presented variations in 2005 (1,227.02 ha), 2006(1,148.10 ha), 2008 (1,059.62 ha) and 2009 (1,112.74 ha) (Figure 2). During the yearsunder investigated, it was verified that those areas with native vegetation decreased from43.26% (2005) to 39.23% (2009).
The dynamics of areas used as pasture presented relevant occurrence, but with littlevariation in 2005 (1,427.04ha), 2006 (1,499.64ha), 2008 (1,468.22ha) and 2009 (1,489.98ha).Similarly the pasture degraded along these years, respectively 105.98ha, 120.88ha, 230.22ha,and 180.89ha. The smallest area with human activity in the composition of the vegetationcover occurred in 2005 (54.06%) and the largest one was in 2008 (59.89%) (Figure 2).
Those results show the beginning of the process of natural vegetation substitutiondue to livestock implantation with the use of pastures. The livestock is the main economicalactivity in Cáceres municipality (IBGE, 2010), which favors the change of land use/ landcover. If the dynamics of the areas with livestock remains with an increase similar to the
Figure 1 - Alteration dynamics of the vegetative cover types by percentage, in theapiary under study, Cáceres, Mato Grosso, Brazil among the years 2005, 2006,
2008 and 2009. Places with presence of ponds were not shown in the figurebecause corresponding to less than 1% of the area (0.04 to 0.43%)
78 GEOGRAFIATemporal analysis of the use and vegetal coverage and the
honey pollen diversity in Cáceres (MT)
investigated years, only isolated fragments from the Forested Savannah cover would remain.According to Fahrig (2003, p. 491), the environmental fragmentation causes negative effectson the biodiversity, such as the habitat loss, increased fragment numbers, decreased sizeand higher isolation among fragments.
Variations of the dynamics during these years were also found in those places withpresence of water, namely 1.15 ha/2005; 12.17 ha/2006; 9.01 ha/2008 and 4.47/2009 andin the humid areas: 74.91 ha/2005; 55.31 ha/2006; 69.03 ha/2008 and 48.01 ha/2009(Figure 2).
Figure 2 - Dynamics of the use and vegetal covering around the commercial apiaryin Cáceres, Mato Grosso, Brazil during the years 2005, 2006, 2008 and 2009
79Santos, M. F. dos / Galbiati, C. /
Neves, S. M. A. da S. / Loureiro, E. M.v. 36, Número Especial jun. 2011
Areas with human activities represented seven spots in 2005, which changed thefollowing year (2006) with an increase in the number and size (Figure 2). In 2008, theyincreased to fifteen. In 2009, the number of the spots with human activities remained similarto 2008. The increase of the spots with human activities showed a decrease of th0se areaswith native vegetation around the apiary under investigation.
Similarly to this study, the substitution of native areas by human ones was verified inseveral Brazilian regions as found by Barbosa et al. (2006, p. 189) in Uberlândia (MinasGerais State) and by Cemin et al. (2009, p. 708) in the Taquari valley (Rio Grande do SulState).
The plant diversity increased from 161 species during four years to 206 (Table 1).This increase can be related with the enlargement of the human used areas, probably due tothe substitution of the Savannah native species by pioneer ones, which are characteristicsof degraded pastures. The degraded pasture area increased 8.12% in 2008 and 6.38% in2009, when compared with the previous years. For the definition of areas with degradedpasture, the main characteristic was the bare soil. (KOBIYAMA et al., 2001, p. 10).
In 2006 and 2009, there was a recovery of the degraded pasture areas around theapiary by harrowing and sowing of Brachiaria brizantha (Hochst. Ex A. Rich.) Stapf.
According to the Millennium Report (NAÇÕES UNIDAS, 2000, p. 15), the loss of thevegetation cover affects negatively the diversity of vegetal species. Dauber et al. (2003,p. 327) showed in their study that the types land use/land cover can be used as indicatorsfor species richness at landscape scale, but they are limited where the composition of thelandscape is narrowly correlated with the environmental conditions and cropping practices.
In this study, the honey pollen analysis identified the following main botanical families:Fabaceae (24), Asteraceae (10), Rubiaceae (9) and Malvaceae (9). The occurrence ofthese families could be related to the use of the vegetation cover during the years 2005,2006, 2008 and 2009, as contributing to the presence of pioneer vegetation species such asM. pudica.
The important species for honey were Cecropia pachystachya (Urticaceae, accessorypollen in the crop and crop cycles), Mimosa pudica (Fabaceae, accessory pollen in the cropand dominant in the crop cycles) and Myracrodruon urundeuva (Anacardiaceae, accessorypollen in the crop and in crop cycle).
The dynamics of land use/land cover did not affect the occurrence of M. urundeuvain honey, although it is a typical species of native vegetation (POTT & POTT, 1994, p. 31).This can be explained by the presence of this species also in areas with human activities,such as pasture. Bastos et al. (2003, p. 599) also found native species of the Anacardiaceaefamily in savannah fragment in Minas Gerais State, such as in this study. The results of thiswork show that the land use/land cover did not interfere on the occurrence of Myracrodruonurundeuva in the local honey; however the conservation of those areas with Savannaharound the apiary is of fundamental importance for the maintenance of this native speciesalong the years.
According to Sande et al. (2009, p. 2706, 2707), the honey production was stronglyinfluenced by the proximity of native vegetation in Kenya, when compared to the areas with
Table 1 - Number of flowery vegetative species around apiaryin Cáceres, Mato Grosso, Brazil

80 GEOGRAFIATemporal analysis of the use and vegetal coverage and the
honey pollen diversity in Cáceres (MT)
agricultural activities. For Coulson et al. (2005, p. 101) the environmental heterogeneityfavors the supply of food resources to communities of bees, which influences positively thehoney production. Féon et al. (2010, p. 148) shows that the abundance and wealth of thebee� communities decreases with the intensive management of the landscape.
The species C. pachystachya and M. pudica are also relevant for the maintenance ofthe apicultural activity in the area under study, because important pollen was found in thehoney. C. pachystachya and M. pudica are considered as pioneers, as colonizers of clearingspresenting a fast growth, which are very important for the regeneration of human-influencedregions (POTT; POTT, 1994, p. 77; EMMONS, 2005, p. 351) such as the degraded pastureareas mentioned.
The similarity among the honeys was divided in three groups. The first similar groupwas composed by the crop /2005 and the crop cycle/2006 (Ss = 0.29) (Figure 3). Thesecond group was composed by the crop cycle and crop 2008 (Ss=0.35). The crop/2009(Ss=0.44) was not similar to the two groups formed, because it presented a higher diversityof pollen types (Figure 3). However, the similarity of the pollen types probably occurred dueto the proximity of the years under investigation, but it is not related to the periods of cropand crop cycle, which indicates that the flowering of the species can be biannual.
The dynamics of the Forested Savannah and human-influenced areas probablycontributed to the similarity of the pollen types in the periods under study, since the landuse/land cover presented few variations over this period, with reduction of the nativevegetation and an increase of those areas with human activities.
Figure 3 - Similarity dendogram of the vegetal species between the crop and cropcycle periods. 1 = Crop cycle /2006; 2 = Crop/2005; 3 = Crop cycle /2008;
4 = Crop/2008; 5 = Crop/2009
CONCLUSION
The use of geo-technologies by Geographic Information System (GIS) showed thatthe native vegetation areas decreased along the years, but id did not endanger the presenceof native species in honey.
During the years 2005, 2006, 2008 and 2009, those areas with human activities andthe Forested Savannah presented few variations. This did not interfere into similarity of thepollen types found in honey and neither in the important apicultural vegetal species, thereforeindicating the compatibility between the economical activities of livestock and beekeeping.
The important species for honey, Cecropia pachystachya, Mimosa pudica andMyracrodruon urundeuva are not related to temporary changes of land use/land cover.
81Santos, M. F. dos / Galbiati, C. /
Neves, S. M. A. da S. / Loureiro, E. M.v. 36, Número Especial jun. 2011
Although the variation of land use/land cover was not sufficiently significant toinfluence the similarity of the pollen types found in honey, the dynamics of occupation in thenext years will probably interfere in the apicultural activity.
ACKNOWLEDGEMENTS
To Coordenação de Aperfeiçoamento de Pessoal de Nível Superior �CAPES and toConselho Nacional de Desenvolvimento Científico e Tecnológico - CNPq for the grant ofscholarships for the Master of Sciences course and Extension.
REFERENCES
AMARAL, M. V. F.; SOUZA, A. L. S.; SOARES, V. P.; SOARES, C. P. B.; MARTINS, S. V.; LEITE,H. G.; INÁCIO-FILHO, E.; GASPAR, R. O. Dinâmica da cobertura vegetal (1980-2004) em umprojeto de produção florestal, nos municípios de Bugre e Ipaba, MG. Revista Árvore, v. 33,n. 2, p. 315-325, 2009.
BARBOSA, J. M.; BUENO, R. M.; ROCHA, H. H. S.; REZENDE, D. M.; COSTA, M. V. C. V.Mudanças na paisagem e uso do solo na área rural de Sobradinho, Uberlândia, MG. Caminhosde Geografia, v. 7, n. 7, p. 180-191, 2006.
BARTH, O. M.; MELHEM, T. S. Glossário Ilustrado de Palinologia. Campinas: UNICAMP,1988. 75 p.
BARTH, O. M. O pólen no mel Brasileiro. Instituto Oswaldo Cruz. Rio de Janeiro: Luxor,1989. 150 p.
BASTOS, E. M. A. F.; SILVEIRA, V. M; SOARES, A. E. E. Pollen spectrum of honey produced incerrado areas of Minas Gerais state (Brazil). Revista Brasileira de Biologia, v. 63, n. 4, p.599-615, 2003.
BHATTACHARYA, C. G. A. Simple method of resolution of a distribuition into Gaussiancomponents. Biometrics, v. 23, p. 115-135, 1967.
CARVALHO, C. A. L.; MARCHINI, L. C. Plantas visitadas por Apis mellifera L. no vale do rioParaguaçu, Município de Castro Alves, Bahia. Revista Brasileira de Botânica, v. 22, n. 2,p. 333-338, 1999.
CEMIN, G.; PERICO, E.; REMPEL. C. Composição e configuração da paisagem da Sub-Baciado Arroio Jacaré, Vale do Taquari, RS, com ênfase nas áreas de florestas. Revista Árvore,v. 33, n. 4, p. 705-711, 2009.
COULSON, R. N.; PINTO, M. A.; TCHAKERIAN, M. D.; BAUM, K. A.; RUBINK, W. L.; JOHNSTON,S. Feral honey bees in pine forest landscapes of east Texas. Forest Ecology andManagement, v. 215, p. 91�102, 2005.
CRONQUIST, A. An integrated system of classification of flowering plants. New York:Columbia University Press, 1981, 1262 p.
CRUZ, C. D. Programa Genes: Aplicativo computacional em genética e estatística. Viçosa:UFV, 2001, 648p.
DAUBER, J.; HIRSCH, M.; SIMMERING, D.; WALDHARDT, R.; OTTE, A.; WOLTERS, V. Landscapestructure as an indicator of biodiversity: matrix effects on species richness. Agriculture,Ecosystems and Environment, v. 98, p. 321�329, 2003.

82 GEOGRAFIATemporal analysis of the use and vegetal coverage and the
honey pollen diversity in Cáceres (MT)
DONHA, A. G.; SOUZA, L. C. P.; SUGAMOSTO, M. L. Determinação da fragilidade ambientalutilizando técnicas de suporte à decisão e SIG. Revista Brasileira de Engenharia Agrícolae Ambiental, v. 10, n. 1, p. 175-181, 2006.
EMMONS, C. L. Mimosa pudica as an experimental organism for Botany Lab. ABLE Proceedings,v. 27, p. 351-353, 2005.
ERDTMAN, G. Pollen morphology and plant taxonomy. Almqvist & Wiksell. The ChronicaBotanica, 1952. 539 p.
FAHRIG, L. Effects of habitat fragmentation on biodiversity. Revista Ecology, Evolution,and Systematics, v. 34, p. 487�515, 2003.
FÉON, V. L.; SCHERMANN-LEGIONNET, A.; DELETTRE, Y.; AVIRON, S.; BILLETER, R.; BUGTER,R.; HENDRICKX, F.; BUREL, F. Intensification of agriculture, landscape composition and wildbee communities: A large scale study in four European countries. Agriculture, Ecosystemsand Environment, v. 137, p. 143�150, 2010.
FIGUEIREDO, M. G.; BARROS, A. L. M.; GUILHOTO, J. J. M. Relação Econômica dos setoresagrícolas do Estado do Mato Grosso com os demais setores pertencentes tanto ao Estadoquanto ao restante do Brasil. Revista de Economia e Sociologia Rural, v. 43, p. 557-576,2005.
GRAYMORE, M. L. M.; WALLIS, A. M.; RICHARDS, A. J. An Index of Regional Sustainability: AGIS-based multiple criteria analysis decision support system for progressing sustainability.Ecological Complexity, v. 6, n. 4, p. 453-462, 2009.
HJELLE, K. L. Relationships between pollen and plants in human-influenced vegetation typesusing presence-absence data in western Norway. Review of Palaeobotany and Palynology,v. 99, p. 1-16, 1997.
IBGE. Manual Técnico da Vegetação Brasileira. Departamento de Recursos Naturais eEstudos Ambientais, Rio de Janeiro, n. 1, 1992. 92 p.
IBGE. Manual Técnico de Uso da Terra. 2ª ed. Departamento de Recursos Naturais eEstudos Ambientais, Rio de Janeiro, n. 7, 1996. 91 p.
IBGE. Produção da Pecuária Municipal 2008. Ministério do Planejamento, Orçamento eGestão. Rio de Janeiro, v. 36, p. 1-55, 2008.
IBGE. Cidades: Descrição e fontes. 2010. Available at: http://www.ibge.gov.br/cidadesat/painel/painel.php?codmun=510250#. Access in 12 de outubro de 2010.
KOBIYAMA, M.; MINELLA, J. P. G.; FABRIS, R. Áreas degradadas e sua recuperação. InformeAgropecuário, v. 22, n. 210, p. 10-17, 2001.
KREBS, C. J. Ecological Methodology. Addison Wesley Longman. 5ª ed, 1998. 581 p.
LOUVEAUX, J., MAURIZIO, A. VORWOHL, G. Methods of melissopalynology. Bee World, Cardiff,v. 51, p. 125-138, 1970.
NAÇÕES UNIDAS. Relatório-Síntese da Avaliação Ecossistêmica do Milênio, 2000. 57 p.
NEVES, S. M. A. S. Modelagem de um banco de dados geográficos do Pantanal deCáceres/MT: estudo aplicado ao turismo. 2006. 284 f. Tese (Doutorado em Geografia) -Instituto de Geociências, Universidade Federal do Rio de Janeiro, Rio de Janeiro, 2006.
PCBAP. Plano de conservação da Bacia do Alto Paraguai (Pantanal). Programa Nacionaldo Meio Ambiente. Brasília: PNMA, v. 2, t. 3, 1997. 179 p.
POTT, A.; POTT, V. J. Plantas do Pantanal. Empresa Brasileira de Pesquisa Agropecuária/Centro de Pesquisa Agropecuária do Pantanal. Corumbá: EMBRAPA - SPI, 1994. 320 p.

83Santos, M. F. dos / Galbiati, C. /
Neves, S. M. A. da S. / Loureiro, E. M.v. 36, Número Especial jun. 2011
RAFFO, J. G.; PAULA, R. V. Planejamento de Apicultura sustentável num assentamento ruralusando SIG: caso do assentamento Padre Josimo Tavares � PA. In: XIX ENCONTRO NACIONALDE GEOGRAFIA AGRÁRIA, São Paulo, 2009, Anais, São Paulo, 2009. p. 1-11.
ROUBIK, D. W.; MORENO, J. E. P. Pollen and Spores of Barro Colorado Island. Monographsin Systematic Botany/Missouri Botanical Garden, v. 36, 1991. 268 p.
SANDE, S. O.; CREWE, R. M.; RAINA, S. K.; NICOLSON, S. W.; GORDON, I. Proximity to aforest leads to higher honey yield: Another reason to conserve. Biological Conservation,v. 142, p. 2703-2709, 2009.
SANTOS-FILHO, M.; DA SILVA, D. J.; SANAIOTTI, T. M. Edge effects and landscape matrixuse by a small mammal community in fragments of semi-deciduous sub-montane forest inMato Grosso, Brazil. Brazilian Journal of Biology, v. 68, n. 4, p. 631 - 637, 2008.
SOUZA, D. C. (Org.). Apicultura: manual do agente de desenvolvimento rural. Brasília:Sebrae, 2004. 100 p.
WANG, H.; SORKB, V. L.; WU, J.; GEA, J. Effect of patch size and isolation on matingpatterns and seed production in an urban population of Chinese pine (Pinus tabulaeformisCarr.). Forest Ecology and Management, v. 260, p. 965�974, 2010.
ZURLINI, G.; RIITTERS, K.; ZACCARELLI, N.; PETROSILLO, I.; JONES, K. B.; ROSSI, L.Disturbance patterns in a socio-ecological system at multiple scales. Ecological Complexity,v. 3, p. 119-128, 2006.
