temporary employment
DESCRIPTION
HRD process ih hiring temporary staff in the organisationTRANSCRIPT

1
Temporary Employment Contracts, Workers’ Well-
Being and Behaviour: Evidence from the UK.1
By
David Guest
Michael Clinton
Department of ManagementKing’s College, London
150 Stamford StreetLondon SE1 9NH
[email protected]: tel 0207 848 [email protected]: tel 0207 848 3472
January 2006
Department of Management Working Paper No. 38
1 This study was supported by the European Union under the Fifth Framework Programme (HPSE-CT-2002-00121)

2
Temporary Employment Contracts, Workers’ Well-Being andBehaviour: Evidence from the UK
Summary
1. There has been pressure from Europe to protect and enhance the rights ofworkers on temporary or fixed-term employment contracts on the grounds thatsuch workers represent a disadvantaged group whose well-being suffers fromtheir precarious employment status.
2. This conflicts with the desire of the UK government for a flexible economy,facilitated by a flexible workforce.
3. Academics have suggested that temporary workers should not be viewed as ahomogeneous group. They are likely to vary, in particular, according to theirskill level in a world where knowledge workers in high demand may prefer tomaintain contract flexibility. We can therefore distinguish temporary workersaccording to skill level and the extent to which they are employed on theircontract of choice. It is therefore likely to be those in low skill jobs and whowould prefer permanent employment whose well-being is likely to suffer.
4. These propositions were tested on a sample of 642 UK workers from 19organizations. 25 per cent had temporary contracts of various sorts. Data werecollected on a large number of background variables and indicators of well-being, health, work attitudes and behaviour.
5. Measure of well-being covered depression, anxiety, irritation, general health,life satisfaction and the influence of work at home. Attitudes included jobsatisfaction, organizational commitment and intention to quit. Behavioursincluded absence, sickness presence, accidents and harassment and violence aswell as self-rated performance.
6. Contrary to expectation, workers on temporary contracts reported better well-being, better general health, more positive attitudes towards work and betterwork behaviour than their permanent counterparts. This was found forvirtually all the measures. The differences remain after controlling for a rangeof individual and organizational background variables.
7. High skill temporary workers who wanted temporary contracts had the mostpositive attitudes. However even low skill temporary workers who preferredpermanent employment reported more positive attitudes than workers withpermanent contracts. They also reported the highest levels of well-being.
8. Temporary workers reported higher levels of job insecurity than permanentworkers. However their insecurity did not have a major impact on their well-being or work attitudes and behaviour.

3
9. A majority of temporary workers would have preferred permanent jobs butthis too did not have a major impact on their well-being, work attitudes andbehaviour.
10. Temporary workers reported clearer job roles and less work overload. Thishas a modest positive impact on their outcomes.
11. Temporary workers reported a much more positive state of their psychologicalcontract –the perception of the employment relationship and the obligationsimplied in that relationship. In particular, they reported less violation by theorganization of the promises and commitments made to them and also fairertreatment and more trusting relations with the organization than theirpermanent counterparts. This provides some of the explanation for the morepositive outcomes reported by temporary workers.
12. Even after taking account of all the possible explanations including insecurity,job content and the state of the psychological contract, temporary workers arestill generally more positive about their experience in their current work thanpermanent workers.
13. A possible explanation lies in the deterioration of permanent jobs. Manypermanent workers report high levels of work overload, relatively high levelsof irritation, anxiety and depression and a strong interference of work with lifeat home. Temporary work may have drawbacks; but for many people inpermanent contracts, the experience of work is markedly more negative.
14. This research was undertaken as part of a European-wide project. The resultsin the other countries, including Germany, Spain, Belgium, The Netherlandsand Sweden, some of which have different levels of unemployment anddifferent experiences with temporary employment, were very similar.
15. The findings suggest that it would be better to focus legislation and policy onimproving the quality of the experience of work for all workers rather thanseeking to legislate on flexible employment.

4
Temporary Employment Contracts, Workers’ Well-Being and
Behaviour: Evidence from the UK.
Introduction
British Governments have for some time proclaimed the advantages of a flexible
economy and a flexible workforce. There are a number of dimensions to the concept
of a flexible workforce and Beatson (1995) among others has distinguished numerical,
functional and reward flexibility. Much attention has recently focussed on numerical
flexibility and it is a form of this, temporary employment contracts, that provides the
subject of this paper.
Some other European countries have been more sceptical than the UK about the
benefits to society of a flexible workforce. European Union reflects a desire in a
pluralist society to accommodate the competing concerns of the social partners and
therefore to protect workers against the potential excesses of flexible employment.
This is already reflected in restrictions on working hours and the current issues for
discussion and legislation concern the employment rights of workers on non-
permanent contracts. It is this group with which the present study is concerned. The
proportion of workers on non-permanent employment contracts varies quite widely
across Europe and reflects different traditions of employment. The UK has a
relatively low proportion of workers falling into these categories. Indeed, the
proportion reached a peak of about 8 per cent in 1997 and has fallen back to about 6
per cent since 2003 (OECD, 2002; Office of National Statistics, 2005).
The reason why workers on non-permanent employment contracts have been the
focus of European legislation is that they are viewed as a disadvantaged minority on
the margins of employment. Without permanent jobs, their position is precarious and
insecure and this is likely to be damaging to their financial and emotional well-being.
In these circumstances, they need protection. This is a view that has the strong
support of trade unions across Europe and in the UK the TUC has been campaigning
in favour of legislation by highlighting cases of the abuse of temporary workers2.
This analysis leads to the straightforward proposition that workers on non-permanent
2 TUC web pages

5
contracts are disadvantaged compared with permanent workers and this will be
reflected in lower work satisfaction and general well-being.
Not everyone accepts that the picture is so straightforward. For a start, there are a
number of different types of non-permanent employment, including fixed-term
contracts, work with employment agencies, seasonal work and consultancy-style
assignments for people classified as self-employed, to name a few. There are also
some groups in employment, including students, those in training, those who are
exploring the labour market to improve their employability and those who have heavy
domestic responsibilities who may prefer the more limited commitments that are
sometimes associated with non-permanent work. This leads to the proposition that
those who are on their employment contract of choice and who prefer to be in non-
permanent employment will not feel disadvantaged. Lower levels of satisfaction and
well-being will only be found among those who would prefer to be in permanent
employment.
A further element of complexity can be added by taking into account the type of work
in which non-permanent workers are engaged. For example, some UK researchers
have found evidence that the roles of temporary workers are more circumscribed and
non-participative than those with permanent contracts (Millward and Brewerton,
1999; Parker et al., 2002). However, UK commentators such as Handy (1989),
writing about portfolio workers and Knell (2000), describing the growth of “free”
workers have argued that a growing body of knowledge workers who are in high
demand in industry may prefer to manage their own employment contracts. Further
support for this comes from American writes such as Barley and Kunda (2004) who
have looked at the careers of engineers. In the UK, the Recruitment and Employment
Confederation, a pressure group made up of a mix of corporate and individual
members, have used their own large surveys to argue that the profile of temporary
workers has changed to reflect the growing numbers of knowledge workers in their
ranks, to extol the benefits of temporary employment and to argue against any need
for legislation to protect or promote their rights3. These arguments lead to the
3 Ref to their report
6
proposition that an increasing proportion of the workforce may actually gain higher
levels of satisfaction and well-being from being in temporary contracts.
Marler, Barringer and Milkovich (2002) have suggested that the picture is more
complex and that in seeking to understand the consequences for workers of temporary
employment contracts, we need to distinguish between high and low skill workers and
between those who are and are not on their contract of choice. This leads to the
proposition that those who have most to gain are high skill knowledge and
professional workers who opt for temporary employment as their contract of choice
while those most disadvantaged will be low skill workers who have not sought
temporary employment. It is concern about the well-being of this second group that
has provided the case for protective legislation in Europe.
A further line of analysis, presented by writers such as Capelli (2000) and Smith
(2001) is that the changing nature of employment is rendering even permanent jobs at
risk. This possibility has been explored in the literature on job insecurity (Heery and
Salmon, 2000; Burchell, Lapido and Wilkinson, 2002; De Witte, 2005). Unsuccessful
but also visibly successful firms can be subject to takeover and to sudden change in
employment fortunes. Some have suggested that the psychological contract has
changed as a result of this constant uncertainty. In a world where we are all
vulnerable, it is no great advantage to have a permanent job. This leads to the final
proposition, namely that there will be no difference in the satisfaction and well-being
of workers in permanent and temporary contracts.
This paper reports a study that investigates these issues by comparing the experiences,
attitudes and work behaviour of workers on temporary and permanent contracts in
jobs requiring a range of knowledge and skill. The next section outlines the analytic
framework for the study.
The Analytic Framework of the Study
The core aim of the study was to explore the impact of temporary and permanent
employment contracts employment contracts on employee experiences, attitudes and
behaviour and in particular on comparing employee well-being. Building on the

7
analysis of Marler, Barringer and Milkovich (2002) we need to take into account the
skills and knowledge and the extent to which workers are on their employment
contract of choice. We also need to explore whether various types of temporary
contract, ranging from agency-linked to fixed-term and seasonal contracts are
associated in different ways with employee well-being. These three factors –skill
level, contract of choice and type of temporary contract - can therefore be considered
as broader independent variables providing potentially greater diversity across
employment contracts. These variables in turn are likely to be shaped in part by a
range of individual and organizational background factors that can serve as control
variables.
Based on the existing literature (see Connelly and Gallagher, 2004 and Guest, 2004
for reviews) we expect that the link between employment contract and outcomes to be
mediated by at least three sets of factors. The first will be the allocation of tasks and
in particular the extent to which temporary workers are given the same levels of
responsibility, autonomy and workload as permanent workers in similar roles; the
second will be the extent to which the current experience of work lives up to
expectations. This is captured by the concept of the psychological contract which can
be defined as “the perceptions of both parties to the employment relationship,
organization and individual, of the obligations implied in the relationship” (Herriot
and Pemberton, 1995). There are two arguments in the literature. One is that
temporary workers will have psychological contracts that are more limited and more
explicit or transactional in scope; and secondly, that managers will feel less compelled
to keep their promises to temporary as opposed to permanent workers. There may
therefore be differences in perceptions of fairness of treatment and levels of trust in
management which could affect outcomes. The third mediating variable concerns
perceptions of the external labour market and in particular views on the ease of
finding alternative employment and feelings of insecurity. The assumption in the
literature is that those who believe that there are attractive employment alternatives
and report low levels of job insecurity will report higher levels of satisfaction and
well-being, and further that high employability and low insecurity are more likely to
be found among permanent workers. Put another way, if we find more negative
outcomes among workers on temporary contracts, possible explanations for this could

8
be that temporary workers have greater job insecurity, poorer psychological contracts
and/or lower levels of responsibility and autonomy within their job roles.
The primary research question addresses the impact of temporary contracts on well-
being, work attitudes and behaviour and these therefore formed the main dependent
variables. Well-being was assessed through self-report measures of anxiety,
depression, irritation, physical health, work-life overlap, self-efficacy, job satisfaction
and life satisfaction. Because there are arguments about the extent to which
temporary workers will be as committed to the organization as permanent workers,
we included attitudinal questions about commitment and about aspects of behaviour
including absence, performance, accidents and intention to quit. The core model,
including the expanded independent variables and hypothesised mediational variables,
is set out in Figure 1.
Methodology
Design & Procedure.
A cross-sectional, self-report questionnaire design was adopted for the study, which
was underpinned by extensive pilot work. During 2004, organisations in the
manufacturing, retail/service and education sectors were approached to participate in
a study examining the use of non-permanent contracts. These three sectors were
5. PsychologicalContract
Well-being,Work Attitudes
& Behaviour
IndependentVariables
3. Contractof Choice
2. Skill Level
1. Type ofContract
Figure 1. The conceptual model
Mediators
6. EmploymentProspects
4. Job ContentEmployment
Contract

9
chosen on the assumption that they were likely to employ predominantly low,
medium and high skill workers respectively, although there will inevitably be a range
of skill levels within most organisations. Questionnaires were either distributed
amongst employees by participating organisations or the research team visited
organisations and supervised questionnaire completion.
Participants.
642 usable questionnaires were collected from 19 organisations. 25% were from non-
permanent employees. Data were also collected from employers but will not be
reported here. Information on the sample is presented in Table 1. The three main
non-permanent contract types were fixed-term contracts (53%), temporary agency
contracts (21%) and seasonal contracts (16%). Other non-permanent contracts
include probationary and training contracts and contractors/consultants. Compared to
the permanent staff, non-permanent workers included a greater proportion of women
and were younger; they were more likely to have higher educational attainments, be
white-collar and union members, and to have shorter tenure and work fewer weekly
hours. In addition to the information presented in Table 1, 21% of non-permanent
reported that they supervised others at work compared with 40% of permanent
workers, and both groups report the same mid-level of work involvement (4-items
from the scale by Kanungo, 1982). Both permanent and non-permanent workers
reported experiencing an average of four out of eight HR practices (items from Guest
& Conway, 1998), such as help with issues outside of work, opportunities to express
views and concerns at work and training and development.
Table 1. Main characteristics of the sample
Non-permanent Permanent Total n
Food Manufacturing 16% 84% 388Retail/Service 22% 78% 140Education 55% 45% 114Total n 158 484 642
Percentage female 67% 60%Average age 34 yrs 39 yrsPercentage A-levels or higher 54% 34%Percentange blue-collar 23% 46%Weekly hours 35 hrs 38 hrsAverage tenure 1.4 yrs 7.7 yrsUnion membership 17% 22%
Sec
tor
Cha
ract
eris
tics

10
The average duration of a temporary contract in our sample was just over 15 months
(although there was a large level of variation in contract length: SD=18 months). The
average time left remaining on contracts at the time of the survey was just over eight
months. On average, the non-permanent workers in the sample had worked on
temporary contracts for around 18 months including their time on the current contract.
Just over 38% of the non-permanent workers in the sample indicated that they had
some expectation of a continuation of their current contract, though less than half of
these were confident about this. Only around four per cent were expecting to receive a
permanent contract with their current employers. The most common reasons for
working on a temporary contract were that the job they wanted came with a non-
permanent contract (54% agree), to get experience and expertise with different tasks
and jobs (53%), because it suits present needs or situation regarding family, study or
leisure (49%) and to gain a permanent contract (45%). Less than 10% of the non-
permanent sample agreed that they had a temporary contract because they had found
it difficult to find a permanent job.
Outcomes Variables: Measuring Well-Being, Work Attitudes and Behaviour
Participants were asked to complete a range of questions that measured aspects of
well-being, several work attitudes and a related features of work behaviour. Well-
being was measured using items from established scales covering occupational self-
efficacy (3-items from Schyns & von Collani, 2002); work-related anxiety and
depression (6-items each from Warr, 1990); work-related irritation (8-items from
Mohr, 1986); general physical health (5-items from Ware, 1999); the (positive)
influence of work at home (4-items from Wagena & Geurts, 2000); and life
satisfaction (6-items from Guest & Conway, 1998). Attitudes were covered by scales
measuring job satisfaction (4-items adapted from Brayfield and Rothe, 1952) and
organisational commitment (4-items from Cook & Wall, 1980). Behaviour was
measured partly through four single-item questions measuring sickness absence,
sickness presence, incidence of accidents and experience of harassment/violence at
work; and two scales measuring intention to quit (4-items modified from Price et al.,
1992) and self-rated performance (6-items from Abramis, 1994). All scales in the
present study were found to have adequate structural validity and reliability. The
reliabilities are shown in the table of correlations in the Appendix.

11
Measuring the Independent and Mediator Variables
Participants were asked to indicate their employment contract from a list of ten
possible contract types that were observed during the pilot stage. From this measure it
was possible to distinguish between permanent and non-permanent workers and also
identify types of non-permanent contract. Skill level was identified using
classifications developed from Goldthorpe’s Class Scheme (unskilled blue-collar
worker, skilled blue-collar worker, lower-level white-collar worker, intermediate
white-collar worker, upper white-collar worker and management/director; example
positions were given for each classification) (Goldthorpe, 1980). Contract of choice
was measured using a four-item scale developed for this study asking whether
respondents had the type of contract that they wanted. This was developed after the
pilot study indicated that existing scales did not display sufficiently high validity. In
addition, single items, developed by Aronsson & Göransson (1999) measuring
whether respondents had their job and profession of choice were also used.
Job content was measured using several dimensions commonly found in job design
research: autonomy (5-item; Rosenthal, Guest & Peccei, 1996), role clarity (3-item;
Price, 1997), skill utilization (4-item; Van der Doef & Maes, 1999) and workload (4-
item; Semmer, Zapf & Dunckel, 1999). Employment prospects were assessed using
scales measuring job insecurity (4-items from de Witte et al, 2002) and employability
(4-items from de Witte, 2000).
The psychological contract was measured through four measures: content, fulfilment,
violation and trust/fairness. Content of psychological contract was measured using an
approach similar to that adopted by Rousseau and others (Robinson and Rousseau,
1994) and adapted in the light of the pilot study, asking participants to indicate
promises or commitments that had been made by their organisation from a list of 15
items commonly used in psychological contract research (e.g. regarding career
opportunities, workload and development opportunities). The number of items on
which promises were made was then summed to provide a score for the content or
breadth of psychological contract. Fulfilment of psychological contract was measured
by asking, for those items on which promises or commitments had been made, the
extent to which their organisation had kept them on a 5-point scale from ‘not at all’ to
12
‘totally’, from which a mean was calculated. Respondents were also asked about their
own obligations towards their employer, in terms of what they had promised (content)
and what they had delivered (fulfilment). Thus we have information on both sides of
the psychological contract. Violation of the psychological contract, which is
considered to include an emotional dimension to the experience of contract breach
(Morrison and Robinson, 1997) was measured by asking respondents how they felt
about the extent to which their organisations had fulfilled their part of the deal using
six adjectives: happy, angry, pleased, violated, disappointed and grateful. After
reversing ‘positively-worded’ items, a mean score was produced. The measures of
trust and fairness (3 items and 4 items respectively from Guest & Conway, 1998)
were found to be very highly correlated (>.07) and both loaded onto the same factor;
therefore a combined measure was used in the analyses.
Analyses and Results
The analyses presented in this report involved three main steps. First the scales were
analysed and inter-correlations were computed. These are shown in the appendix. A
single-item measure of role clarity was used as the scale showed low reliability.
Otherwise, only scales measuring self-efficacy and organisational commitment had
reliabilities below 0.70 (0.68 and 0.69 respectively). Secondly, simple comparisons
using t-tests were made between reports of permanent and non-permanent workers on
each of the main variables measured in the study. Means and standard deviations are
presented. Subsequently, regressions were computed and tests for mediation
conducted. We start with the simple bivariate comparisons.
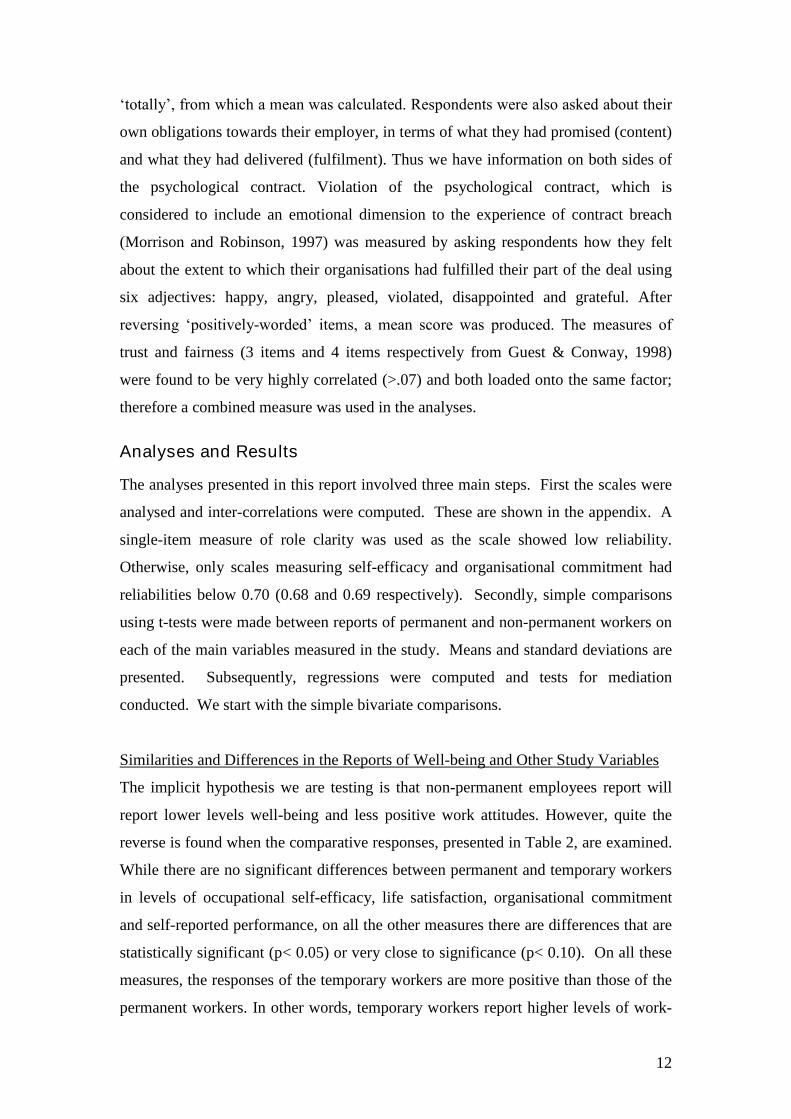
Similarities and Differences in the Reports of Well-being and Other Study Variables
The implicit hypothesis we are testing is that non-permanent employees report will
report lower levels well-being and less positive work attitudes. However, quite the
reverse is found when the comparative responses, presented in Table 2, are examined.
While there are no significant differences between permanent and temporary workers
in levels of occupational self-efficacy, life satisfaction, organisational commitment
and self-reported performance, on all the other measures there are differences that are
statistically significant (p< 0.05) or very close to significance (p< 0.10). On all these
measures, the responses of the temporary workers are more positive than those of the
permanent workers. In other words, temporary workers report higher levels of work-

13
related well-being, higher job satisfaction and a better sickness, accident and
harassment record.
Table 2. Comparison of reports on well-being and work attitudes across contract type
Contrary to expectation, it is the permanent workers who report the poorer outcomes.
However this might still be explained in terms of a less fulfilled psychological
contracts, worse employment prospects, problems with the content of their jobs or
having neither the contract or job that they would wish for. The relevant results are
shown in Table 3. These confirm that although there are no differences in the scope
of the psychological contract, permanent workers report significantly lower levels of
fulfilment of psychological contract, higher levels of violation of their psychological
contracts and lower levels of trust and fairness at work. Permanent workers also
report lower levels of role clarity and higher levels of workload. Temporary workers
report far higher levels of job insecurity and are far less likely to indicate that they
have their employment contract of choice, both of which one may expect to be related
to poorer well-being (see correlations).
Mean SD Mean SD t p-value 1
Work-related healthOccupational self-efficacy 4.03 0.63 4.10 0.62 -1.16 0.247
Influence of work at home 2.98 0.89 2.73 0.90 3.00 0.003
Work-related irritation 2.48 0.71 2.69 0.79 -3.08 0.002
Work-related anxiety 2.08 0.78 2.37 0.85 -3.76 0.000
Work-related depression 2.73 1.18 2.94 1.31 -1.81 0.071
Reported behaviours/incidentsSick leave 1.99 1.02 2.20 1.09 -2.13 0.033
Sick presence 2.31 1.15 2.77 1.22 -4.09 0.000
Accidents 1.14 0.54 1.24 0.61 -1.92 0.056
Harassment 1.14 0.52 1.41 0.88 -4.66 0.000
General health reportsGeneral health 3.99 0.75 3.85 0.80 1.95 0.052
Life satisfaction 5.11 1.24 5.05 1.15 0.56 0.574
Work-related attitudesJob satisfaction 3.80 0.97 3.56 1.02 2.68 0.007
Organisational commitment 3.94 0.72 3.91 0.72 0.50 0.620
Intention to quit 2.07 0.98 2.32 1.07 -2.65 0.008
Self-reported performance 4.01 0.55 4.03 0.56 -0.49 0.622
All scales range between 1-5, therefore a mean score of 3.00 represents the mid-point on each scale.The exception to this is life satisfaction, which was measured on a 7-point scale.
Type of Employment Contract
Non-permanent Permanent
1A mean difference is significant if the p -value is less than 0.05

14
Table 3. Comparison of reports on possible explanatory measures across contract type
While these comparisons are compelling, but it is possible that the differences may be
a result of a number of related background variables rather than due to contract type
alone. The next step is therefore to undertake more sophisticated analyses that take
into account a number of individual and organizational background factors.
Regression Analysis and Background Variables
To examine whether there is still a relationship between employment contract and the
outcome variables after controlling for a range of background variables a series of
regression analyses were conducted and the findings are presented in Tables 4 and 5.
A large number of background variables were included that have been found in the
past to be related to employee health or have been found to distinguish permanent and
non-permanent workers; these were age, gender, educational and occupational level,
level of work involvement, working hours, tenure, union membership, whether the
worker had supervisory responsibilities, the provision of HR practices, organisation
size and industrial sector.
Mean SD Mean SD t p-value 1
Psychological contractEmployer's obligationsContent 10.08 4.15 10.20 4.21 -0.30 0.768
Fulfilment 3.93 0.76 3.58 0.88 4.61 0.000
Violation 2.11 0.80 2.54 0.92 -5.54 0.000
Trust/Fairness 3.46 0.94 2.88 1.00 6.36 0.000
Employee prospectsJob insecurity 2.70 1.05 2.27 0.92 4.53 0.000
Employability 3.55 0.86 3.56 0.95 -0.10 0.917
Job CharacteristicsRole Clarity 4.08 0.96 4.33 0.84 -3.14 0.002
Autonomy 3.29 0.94 3.34 0.94 -0.54 0.588
Skill Utilisation 3.29 1.08 3.20 1.03 0.95 0.344
Workload 2.84 0.98 3.17 0.97 -3.74 0.000
VolitionContract of choice 2.84 1.06 3.64 0.94 -8.99 0.000
Job of choice 3.49 1.24 3.58 1.20 -0.84 0.404
Profession of choice 3.49 1.36 3.51 1.29 -0.10 0.923
All scales range between 1-5, therefore a mean score of 3.00 represents the mid-point on each scale.The exception to this is Content of PC, which is a summated score with a range of 0-15.
Type of Employment Contract
Non-permanent Permanent
1A mean difference is significant if the p -value is less than 0.05

15
In all the regressions presented in Tables 4 and 5, the background control variables
were entered first, followed by the specific variable of interest. Before exploring the
key independent variables, it is worth noting in Tables 4 and 5 that among the control
variables, a few show consistent significant associations with a range of outcomes.
Much the most consistent in this respect is the experience of human resource
practices; those reporting that they experience more of them in their current work also
consistently report much more positive outcomes. Longer working hours are
associated with poorer well-being but not with poorer attitudes and behaviour. Older
workers report more positive responses across a range of outcomes and in particular,
higher levels of job satisfaction and organizational commitment.
Type of employment contract
The first independent variable we explored was the broad measure of type of
employment contract, comparing workers on permanent and temporary contracts.
(Independent Variable 1 [IV 1 in Table 4 & 5]). Findings from these first regressions
replicate the differences found through comparisons of the mean scores shown in
Table 2. This is indicated by the significant beta weights indicating a relationship
between permanent contracts and poorer reports of well-being, work attitudes and
behaviour. Importantly this suggests that the differences between contract types
cannot be explained by any of the background measures.
Type of temporary employment contract
So what are the explanations for these unexpected results? Firstly, it may be that a
simple distinction between permanent and non-permanent employees hides a greater
diversity in experiences across types of temporary contract. To examine how different
types of non-permanent contract workers compare with permanent workers the same
regressions were carried out again but instead of using the dichotomous measure of
contract type, a number of dummy variables were used to represent the different
groups of non-permanent contract workers (IV 2 in Tables 4 & 5). The non-permanent
contract workers were grouped either into fixed-term contract workers (n=82), agency
workers (33) or direct-hire employees (34). Direct-hire workers were mostly seasonal
workers (25) but included a small number of contractors (2), daily/on-call workers (1)
and those with probationary (5) or training (1) contracts.

16
The beta for each dummy variable indicates the strength of the relationship between
the dummy variable and outcome measure relative to permanent contracts. Findings
of the regressions indicate that all types of non-permanent contract workers report at
least as positive well-being, work attitudes and behaviour as permanent workers.
Fixed-term contract workers report a greater positive influence of work at home and
better physical health and lower levels of work-related depression, incidence of
harassment/violence at work and intention to quit than permanent workers. Agency
workers also report a greater positive influence of work at home and lower levels of
work-related anxiety, depression and irritation and a lower incidence of sickness
presence and harassment/violence at work compared with permanent workers. Non-
permanent workers hired directly by organisations report a lower incidence of
sickness absence compared with permanent employees. Examining the valence of the
betas for each of the contract types it seems that they are mostly in the same direction
relative to permanent workers and invariably indicating a more positive outcome. This
consistency in direction suggests that irrespective of the type of temporary contract on
which they are employed, temporary workers give reasonably consistent and more
positive responses than permanent workers. Differentiating the types of temporary
contract does not therefore help to explain the results.
Skill levels: the response of the ‘free workers’
One of the dimensions identified by Marler, Barringer and Milkovich (2002) in their
attempt to explain differences in the reactions of temporary workers was skill level.
Specifically, the expectation was that high skill ‘free’ knowledge workers would be
positive about temporary work and display positive attitudes as a result but low skill,
more ‘precarious’ workers would not. To examine this, further regressions were
carried out in which dummy variables representing ‘free-workers’ and ‘precarious
workers’ were compared against permanent workers (IV 3 in Tables 4 & 5). People
were allocated to one of the two categories on the basis of their skills. Blue-collar and
low-level white-collar workers were combined to represent ‘low-skill’ workers with
the other groups representing ‘high-skill’ workers. Numbers within each of the four

17
groups are as follows; low-skill permanent (n=280), high-skill permanent (n=203),
low-skill temporary (n=90), high-skill temporary (n=68).4
The beta scores indicate the strength of the relationship between the dummy variable
and outcome measures compared to those on permanent contracts. These reveal that
both high and low skill temporary workers generally report more positive attitudes
and behaviour than workers on permanent contracts. High-skill non-permanent
workers report a greater positive influence of work at home, better physical health,
lower work-related depression, lower incidence of harassment/violence at work, lower
intention to quit and higher performance compared with permanent workers. Low-
skill temporary workers also report a greater positive influence of work at home and
greater job satisfaction and lower levels of work-related anxiety, depression and
irritation, a lower incidence of sickness presence and absence and lower incidence of
harassment and violence. While there are some differences in the responses of the
low and high skill temporary workers, both are more positive then the permanent
workers and, contrary to expectation, it is the low skill who more consistently report
higher work-related well-being. We therefore cannot explain the differences in
outcomes in terms of differences in skill levels among temporary workers and related
arguments about free or precarious workers.
The role of contract of choice
The second dimension identified by Marler, Barringer and Milkovich (2002) in
seeking to explain whether temporary workers will be more or less positive than
permanent workers is contract of choice. The assumption is that those who can
choose and are on their contract of choice will display more positive attitudes. As the
results in Table 3 indicate, one of the largest differences found between permanent
and temporary workers is on contract of choice. Temporary workers are less likely to
be in their employment contract of choice. In the correlational analysis in the
Appendix, contract of choice is positively related to all of the outcome measures with
4 Another way of testing the Marler and colleagues (2002) proposition more directly would be tocompare high and low skill temporary and permanent workers. We undertook a series of Anovas toexplore this. More often than not, it was the low-skill permanent workers who reported the leastpositive reports. Further details are available from the authors on request.

18
the correlation ranging between 0.08 and 0.33. Therefore the relationship between
employment contract, contract of choice and outcomes is rather complex. To examine
it further, temporary workers were divided according to whether they were above or
below the mid-point on the scale measuring contract of choice and on this basis being
classified as high or low with respect to contract of choice reflecting, in effect, their
agreement as to whether they were on their contract of choice. Dummy variables,
labelled as high and low contract of choice, were then constructed and entered into the
regression model (IV 4 in Tables 4 & 5). The number of temporary workers falling
into each of these categories was 75 and 81 respectively.
Findings indicate that temporary workers who were employed on their contract of
choice had significantly higher scores on six of the seven well-being measures and on
five of the eight attitude and behaviour measures compared with permanent workers.
Temporary workers with lower scores on the measure of contract of choice, and
therefore not likely to be on their contract of choice, reported higher scores on six out
of the seven well-being measures than the permanent workers but the difference was
only statistically significant on the positive influence of work on home. They
displayed marginally lower life satisfaction. They were more positive than permanent
workers on six of the attitude and behaviour measures and more negative on
organizational commitment. They reported significantly lower levels of harassment
and violence at work. It therefore appears that temporary workers on their contract of
choice report the most positive outcomes, followed by temporary workers not on their
contract of choice who are generally more positive, even if not always significantly
so, than permanent workers. The results indicate that being on employment contract
of choice is important but it cannot explain the more positive outcomes of temporary
workers, since they are less likely to be on their contract of choice. It should be noted
that we have compared temporary workers divided according to contract of choice
against all the permanent workers. The picture might alter a little if we compared
permanent workers who were or were not on their contract of choice.

19
Table 4. Associations of employment contract with Work-related and General Health
Occupationalself-efficacy
Influence ofWork at Home
Work-relatedAnxiety
Work-RelatedDepression
Irritation Physical Health Life Satisfaction
Manufacturing dummy -0.04 -0.04 0.02 0.10 0.09 0.07 0.17Education dummy -0.14 -0.09 0.10 0.11 0.10 -0.04 -0.02Organisation size 0.00 0.03 0.02 0.03 0.05 0.01 0.04Core HR-Practices 0.07 0.22*** -0.32*** -0.40*** -0.21*** 0.10 0.15***Blue Collar dummy -0.10 -0.04 0.02 0.20* -0.03 -0.09 -0.05Low-level White Collar dummy -0.08 -0.06 0.05 0.11 0.05 -0.08 -0.08Mid/Upper White Collar dummy -0.16* 0.01 0.13 0.11 0.13 -0.06 -0.07Age 0.12* 0.12** -0.07 -0.16*** -0.08 0.09 0.03Gender (male+) -0.01 -0.00 -0.06 0.00 -0.03 -0.05 -0.10*Education level 0.08 0.05 -0.07 -0.03 0.00 0.06 0.02Work hours 0.03 -0.05 0.14** 0.06 0.15** -0.04 -0.13**Tenure 0.06 0.05 -0.05 -0.01 -0.05 0.08 0.04Supervisory role 0.05 0.03 0.10* 0.01 0.13** 0.03 0.00Union membership 0.01 -0.03 0.08* 0.10* 0.10* -0.08 -0.03Work Involvement 0.08 0.29*** 0.01 -0.04 0.07 0.00 0.00
IV 1: Permanent contract -0.04 -0.16** 0.14** 0.17*** 0.11* -0.13** -0.08
Adjusted R-square 0.04 0.17 0.13 0.27 0.11 0.02 0.04
IV 2: Contract DummiesFixed-term 0.06 0.10* -0.08 -0.10* -0.05 0.11* 0.07Agency/Subcontractors 0.03 0.12** -0.14*** -0.11** -0.09* 0.03 0.06Direct hire -0.03 0.07 -0.07 -0.08 -0.07 0.04 -0.02
IV 3: Skill Level Dummies 1
Low Skill Temps 0.01 0.10* -0.15*** -0.14*** -0.14** 0.09 0.07High Skill Temps 0.06 0.10* -0.03 -0.10* 0.01 0.11* 0.05
IV 4: Contract Choice DummiesLow Contract Choice Temps 0.02 0.11* -0.08 -0.08 -0.03 0.05 -0.02HIgh Contract Choice Temps 0.03 0.09* -0.12** -0.15*** -0.12** 0.15*** 0.12**
1Skill dummy variables not included as control variables in these analysesR2 indicates percentage of variation explained by independent variables within outcome variable (e.g. 0.10 = 10%)
Work-related Health General Health
*p <.05; **p <.01; ***p <.001

20
Table 5. Associations of types of employment contract with Sickness Behaviours, Incidents at Work and Work Attitudes
SicknessAbsence
SicknessPresence
AccidentsHarrassment and
ViolenceJob Satisfaction
OrganisationalCommitment
Intention to QuitSelf-rated
Performance
Manufacturing dummy -0.11 -0.03 -0.08 0.05 -0.15* -0.08 0.04 0.08Education dummy 0.00 0.02 -0.01 0.14* -0.07 -0.21*** 0.05 -0.02Organisation size 0.00 0.06 0.00 0.09 -0.01 -0.01 0.04 0.00Core HR-Practices -0.06 -0.16*** -0.04 -0.18*** 0.35*** 0.36*** -0.43*** 0.12**Blue Collar dummy 0.13 -0.03 0.26** 0.30*** -0.21** -0.20** 0.13 -0.14Low-level White Collar dummy -0.08 -0.08 0.10 0.19** -0.08 -0.03 0.07 -0.07Mid/Upper White Collar dummy -0.06 0.00 0.09 0.12 -0.07 -0.04 0.08 -0.12Age -0.18*** -0.09 -0.13** -0.05 0.18*** 0.22*** -0.12** 0.02Gender (male+) -0.13** -0.13** 0.10* -0.02 0.00 -0.01 -0.03 -0.08Education level -0.03 -0.09 -0.11 0.01 0.00 0.07 0.04 -0.02Work hours -0.06 0.05 0.04 0.11* -0.01 0.00 0.04 0.09Tenure -0.03 0.05 0.04 -0.06 0.05 0.00 -0.02 0.08Supervisory role -0.12* -0.01 0.13** 0.16*** 0.10* 0.05 0.03 0.10*Union membership 0.08 0.10* -0.02 0.09* -0.06 -0.11** 0.07 -0.09*Work Involvement -0.01 0.09* -0.01 0.11** 0.13*** 0.17*** -0.08* 0.10*
IV 1: Permanent contract 0.14** 0.14** 0.01 0.17*** -0.12* -0.04 0.11* -0.06
Adjusted R-square 0.10 0.07 0.06 0.11 0.33 0.31 0.21 0.05
IV 2: Contract DummiesFixed-term -0.03 -0.03 0.02 -0.15** 0.08 0.02 -0.11* 0.07Agency/Subcontractors -0.07 -0.09* -0.01 -0.10* 0.07 0.05 -0.04 0.06Direct hire -0.14*** -0.15*** -0.05 -0.07 0.04 -0.01 -0.03 -0.08
IV 3: Skill Level Dummies 1
Low Skill Temps -0.14** -0.18*** 0.01 -0.12** 0.10* 0.03 -0.08 0.00High Skill Temps -0.07 -0.02 -0.03 -0.11* 0.08 0.04 -0.09* 0.11*
IV 4: Contract Choice DummiesLow Contract Choice Temps -0.08 -0.07 0.00 -0.15** 0.03 -0.02 -0.04 0.05HIgh Contract Choice Temps -0.13** -0.14** 0.00 -0.09* 0.13*** 0.06 -0.10** 0.04
1Skill dummy variables not included as control variables in these analysesR2 indicates percentage of variation explained by independent variables within outcome variable (e.g. 0.10 = 10%)
Sickness Behaviours and Incidents at Work Work Attitudes
*p <.05; **p <.01; ***p <.001
21
The role of the mediating variables; employability, job content and the psychological
contract
Having failed to explain the different outcomes of permanent and temporary workers
using the two core variables identified by Marler, Barringer and Milkovich (2002),
namely skill level and contract of choice, we turn to three other potential explanatory
factors that were identified at the outset as possible mediating variables. These are
aspects of employability, job content and the psychological contract; all were
measured with more than one variable. As a first step, we need to establish whether
temporary and permanent workers respond differently on any of the relevant
variables. The information is provided in Table 3. This reveals that we can discount
employability (employability and job insecurity) as a mediating variable. Since there
are no differences in reports of employability between temporary and permanent
workers, this variable cannot explain the differences in outcomes. Secondly, although
a large significant difference was found between contract types on job insecurity, it
was temporary workers who reported the higher level of job insecurity. Therefore,
although job insecurity was found to be correlated with more negative outcomes on
all measures except ‘accidents’, it cannot explain why non-permanent workers report
more positive outcomes.
Job content was the second potential explanatory variable identified from the
literature. The suggestion was that temporary workers are given more circumscribed
job roles in comparison with their permanent counterparts and that this affects their
outcomes. However, as indicated in Table 3, no difference was found in the level of
autonomy or skill utilisation reported by permanent and non-permanent employees.
Differences were found indicting that non-permanent employees report greater role
clarity and lower workload, both of which may indicate more simplified job roles and
both were found to be positively related to reports of well-being (see correlation table
in Appendix). In order to evaluate whether these aspects of job content explain the
differences in outcomes, a series of regressions were carried out and presented in
Table 6. These regressions were essentially the same as those carried out in Tables 4
and 5 however the variables representing the role clarity and workload were entered
into the regressions as a second step. In order for these role variables to act as
mediators the beta weights indicating the strength of relationship between
employment contract and outcome variable must be either fully removed (full

22
mediation) or substantially reduced (partial mediation) when entering the regression at
Step 2. Only those outcomes on which there were differences between permanent and
temporary workers were examined in this way. Findings indicate that job content has
a modest mediating role in the relationship between employment contract and well-
being. It partially mediates the relationship with work-related anxiety and sickness
presence and fully mediates the relationship with irritation. However, there is no
consistent pattern of influence of these measures of job content across the range of
outcomes.
This leaves the psychological contract as a potential explanatory variable. Table 3
shows that there is no difference between permanent and temporary employees
regarding content of the psychological contract (i.e. the number of promises reported
being offered by organisations), so this can be ruled out. However differences were
found on the variables of fulfilment and violation of the psychological contract and on
reports of trust and fairness, all indicating that temporary workers have a better state
of psychological contract. In order to evaluate whether the state of the psychological
contract explains the differences in outcomes, a similar series of regressions were
carried out and presented in Table 7. The findings indicate that the state of the
psychological contract acts as either a partial or full mediator in the relationships
between employment contract and outcomes. Table 7 shows that the psychological
contract measures fully mediate the relationship between type of employment contract
and the well-being variables of anxiety, depression and irritation as well as job
satisfaction, sickness absence, sickness presence and intention to quit. They partially
mediate the relationship between type of contract and influence of work at home,
physical health and experience of harassment and violence. Partial mediation
indicates that even after the measures of the state of the psychological contact have
been taken into account, and acknowledging that they explain part of the variation in
outcomes, the type of employment contract still has a significant effect on the
outcomes; and in each of these cases, it is the workers on temporary contract who are
more positive. However in broad terms we can reach the tentative conclusion that
temporary workers report more positive outcomes than permanent workers partly
because they have a better state of psychological contract.


24
Table 6. Evaluation of the Job Content as an explanatory variable
Step 1 Step 2 Step 1 Step 2 Step 1 Step 2 Step 1 Step 2
Step 1 Permanent contract -0.14** -0.14** 0.14** 0.10* 0.16*** 0.16*** -0.14** -0.14**
Step 2 Role Clarity 0.07 -0.20*** -0.21*** 0.08
Workload -0.07 0.32*** 0.05 -0.04
Adjusted R-square 0.18 0.18 0.13 0.23 0.27 0.31 0.02 0.03
Step 1 Step 2 Step 1 Step 2 Step 1 Step 2 Step 1 Step 2
Step 1 Permanent contract 0.15** 0.16** 0.15** 0.13** 0.16*** 0.14** 0.11* 0.11**
Step 2 Role Clarity 0.04 -0.08 0.04 -0.20***Workload -0.12* 0.17** 0.20*** 0.03
Adjusted R-square 0.11 0.11 0.07 0.09 0.11 0.13 0.22 0.25
-0.10*
-0.12**
Step 1 Step 2
*p <.05; **p <.01; ***p <.001
R2 indicates percentage of variation explained by independent variables within outcome variable (e.g. 0.10 = 10%)
N.B. Background variables are controlled for but not presented
N.B. Beta weights and R2-values may be slightly different in regressions due to variations in sample sizes due to missing values
0.33
Job Satisfaction
-0.13***
Step 2
0.080.22***
0.37
0.11*
0.11
Step 1
0.08
0.30***
0.17
Work Attitudes
General Health
Influence of Work atHome
Work-related AnxietyWork-RelatedDepression
Physical Health
Work-related Health
Irritation
Intention to Quit
Sickness Behaviours and Incidents at Work
Sickness Absence Sickness PresenceHarrassment and
Violence

25
Table 7. Evaluation of the State of the Psychological Contract as an explanatory variable
Step 1 Step 2 Step 1 Step 2 Step 1 Step 2 Step 1 Step 2
Step 1 Permanent contract -0.16** -0.09* 0.14** 0.00 0.17*** 0.04 -0.13** -0.11*
Step 2 Psychological ContractFulfilment of PC -0.04 -0.09 -0.08 0.01Violation of PC -0.30*** 0.41*** 0.41*** -0.21***Trust/Fairness 0.08 -0.21*** -0.20*** 0.05
Adjusted R-square 0.20 0.28 0.13 0.39 0.27 0.51 0.02 0.07
Step 1 Step 2 Step 1 Step 2 Step 1 Step 2 Step 1 Step 2
Step 1 Permanent contract 0.14** 0.09 0.14** 0.06 0.17*** 0.12* 0.11* -0.03
Step 2 Psychological Contract
Fulfilment of PC 0.01 -0.08 0.00 -0.02
Violation of PC 0.09 0.09 0.13* 0.44***
Trust/Fairness -0.13* -0.23*** -0.09 -0.25***
Adjusted R-square 0.10 0.12 0.07 0.14 0.11 0.13 0.21 0.50
Step 1 Step 2
*p <.05; **p <.01; ***p <.001
R2 indicates percentage of variation explained by independent variables within outcome variable (e.g. 0.10 = 10%)
N.B. Background variables are controlled for but not presented
N.B. Beta weights and R2-values may be slightly different in regressions due to variations in sample sizes due to missing values
0.13**
-0.28***
0.24***
0.33 0.55
Intention to Quit
Step 1 Step 2
-0.12* 0.01
Sickness Absence Sickness PresenceHarrassment and
ViolenceJob Satisfaction
-0.16**
0.11 0.23
Sickness Behaviours and Incidents at Work Work Attitudes
0.11* 0.01
0.000.31***
Work-related Health General Health
Influence of Work atHome
Work-related AnxietyWork-RelatedDepression
Irritation Physical Health

26
Discussion
Contrary to expectations, temporary workers as a whole report more positive
outcomes than permanent workers on the majority of our measures. In particular,
they report better well-being, health and sickness records. While these are self-report
measures, any biases that this introduces can apply equally well to both temporary and
permanent workers. Being on employment contract of choice was also found to be
positively related to well-being, work attitudes and behaviour, although even
temporary workers who were not on their contract of choice were at least as positive
as permanent workers. However, again contrary to expectations, temporary workers
with higher skill levels, those who might be more likely to be classified as knowledge
and potentially ‘free’ workers, did not report consistently more positive outcomes
than those with lower skills, although both were more positive than the permanent
staff.
Our exploration of three sets of mediating variables that might explain the outcomes
revealed that employability had no role to play, job content had a modest role and the
psychological contract had a major role. It fully or partially mediated the relationship
between type of employment contract and outcomes for all the variables where an
initial association had been identified. Looking more closely at the psychological
contract variables, the measure of violation, which seeks to explore the emotional
reaction to the level of contract fulfilment, has the major effect. It is significantly
associated in the regressions with eight of the ten outcomes. It is closely followed by
the combined measure of trust/fairness, which is associated with seven of the ten
outcomes. The measure of fulfilment or breach emerges from the analysis as being
less important. However, since it is highly correlated with the outcome measures and
with the measures of violation and trust/fairness, it is possible that either mediation or
multicollinearity might explain this finding. In terms of explaining why temporary
workers of all types and levels report greater well-being and more positive work
attitudes and behaviour than permanent workers, it seems that an important part of the
explanation lies in the better state of their psychological contract.
Why do temporary workers report a better state of the psychological contract? One
possible explanation that has been offered by Van Dyne and Ang (1998) based on

27
their study of temporary workers in Singapore, is that temporary workers have lower
expectations about what the employer is obliged to provide for them. In other words,
they expect to be treated differently, have a more limited and perhaps more easily
monitored psychological contract and as a result, they are more easily satisfied.
However our evidence does not support this explanation for these UK workers. As
Table 2 reveals, there is no significant difference in the judgements of temporary and
permanent workers about the number of promises made by their current organization.
A second possible explanation is that temporary workers have fewer inputs and
therefore, in equity theory terms (Mowday and Colwell, 2003), have a more positive
exchange. We examined this by exploring the promises made by workers. No
difference was found in the number of promises that both permanent and temporary
workers reported offering their employer or in the extent to which they said they
subsequently fulfilled each obligation, even after controlling for background
variables. Thirdly, there is a possibility that permanent workers, being more fully
embedded within the cultural norms and organisational environment, are more
sensitive to subtle breaches or violations of psychological contracts. There is some
support for this in the data which show an association between tenure and lower
fulfilment, higher violation and poorer perceptions of fairness and trust.
However, after allowing for the influence of the psychological contract, there is still
evidence that temporary workers report better physical health, a more positive
influence of work on home life and a lower experience of harassment and violence at
work. How are we to explain this unexpected finding that even after taking account
of a wide range of possible factors, temporary workers, irrespective of type of
temporary contract, irrespective of skill level and irrespective of whether they want to
be employed in temporary contracts, report generally more positive outcomes and
sometimes significantly more positive outcomes than workers with permanent
employment contracts? A possible explanation for the results is that permanent jobs
have become more demanding and less attractive for many workers in recent years.
We have evidence about labour intensification, reductions in autonomy and a steady
lowering of job satisfaction across the UK working population as a whole (Green,
2006). Our evidence on indicators such as the impact of work on home, suggests that
many permanent workers find that work interferes unhelpfully with life outside work.
Allied to this, the Health and Safety Executive has begun to give a much higher

28
priority to the increase in stress-related absences from work (Mackay et al., 2004). In
other words, it is not so much that temporary work is attractive but that permanent
work is increasingly unattractive for many of those who experience it. Furthermore, it
is younger workers who find it particularly unattractive. Age is associated with
several of the outcomes, with older workers invariably more positive; and this holds,
even though temporary workers are younger than those in permanent jobs. It is
younger workers in permanent jobs who are particularly negative about the
experience of contemporary work.5
These findings have potentially important policy implications. First, they raise
questions about the basis for the policy initiatives proposed by the European Union to
impose conditions on temporary employment and to make it more like permanent
employment. Our evidence suggests that it is permanent workers who appear to be
more in need of protection. This implies that the European Union is right to give
greater emphasis to the quality of jobs; furthermore, there is some support in our
findings for the view that constraints on working hours should be a feature of high
quality jobs. We found that those working longer hours reported higher levels of
anxiety and irritation and lower life satisfaction. Since it is those in permanent
employment who report a poorer experience of work and lower levels of well-being,
the emphasis should be on improving the quality of work for all workers. Our focus
on temporary employment has served both to challenge assumptions about temporary
working and to highlight the growing problems faced by those in permanent jobs.
References
Aronsson, G. & Göransson, S. (1999). Permanent employment but not in a preferred occupation:
psychological and medical aspects, research implications. Journal of Occupational Health
Psychology, 4(2), 152-163.
Abramis, D. J. (1994). Relationship of job stressors to job performance: linear or inverted-u?
Psychological Reports, 75, 547-558.
Barley, S. & Kunda, G. (2004). Gurus, Hired Guns, and Warm Bodies. Princeton, NJ: Princeton
University Press.
5 It is also possible that some of the explanation for the unexpected results may reflect shortcomings inthe research methodology and analytic framework. For example, the conceptual model was largelybased on the assumption that temporary workers would report more negative outcomes. Also, giventhe cross-sectional nature of the results, we must be cautious in attributing causality.

29
Beatson, M. (1995). Labour Market Flexibility. Research Series No 48. Sheffield: Employment
Department.
Brayfield, A. H., & Rothe, H. F. (1951). An index of job satisfaction. Journal of Applied Psychology,
35, 307-311.
Burchell, B., Lapido, D & Wilkinson, F. (2002). Job Insecurity and Work Intensification. London:
Routledge.
Capelli, P. (1999). The New Deal at Work. Boston, MA: Harvard Business School Press.
Connelly, C. & Gallagher, D. (2004). Emerging trends in contingent work. Journal of Management,
30, 959-983.
Cook, J., & Wall, T. (1980). New work attitude measures of trust, organizational commitment and
personal need non-fulfilment. Journal of Occupational Psychology, 53, 39-52.
De Witte, H. (2000). Arbeidsethos en jobonzekerheid: meting en gevolgen voor welzijn, tevredenheid
en inzet op het werk. In R. Bouwen, K. De Witte, H. De Witte & T. Taillieu (Eds.), Van groep
naar gemeenschap. Liber Amicorum Prof. Dr. Leo Lagrou (pp. 325-350). Leuven: Garant.
De Witte, H. (ed) (2005). Job Insecurity, Union Involvement and Union Activism. Aldershot, Hants:
Ashgate.
De Witte, H., Näswall, K., Chirumbolo, A., Goslinga, S., Hellgren, J., & Sverke, M. (2002). Is
temporary employment a problem? Analysis of its consequences in Belgium, the Netherlands,
Italy and Sweden (Report No. 6:2002). Stockholm: National Institute for Working Life and
Authors.
Green, F. (2006). Demanding Work: The Paradox of Job Quality in the Affluent Economy. Princeton,
NY: Princeton University Press.
Guest, D. (2004). Flexible employment contracts, the psychological contract and employee outcomes:
an analysis and review of the evidence. International Journal of Management Reviews, 5/6, 1-
20.
Guest, D. E., & Conway, N. (1998). Fairness at work and the psychological contract. London,
Chartered Institute of Personnel Development.
Goldthorpe, J. H. (1980). Social mobility and class structure in modern Britain. Oxford: Clarendon
Press.
Handy, C. (1989). The Age of Unreason. London: Random House.
Heery, E. & Salmon, J. (eds) (2000). The Insecure Workforce. London: Routledge.
Herriot, P. & Pemberton, C. (1995). New Deals: The Revolution in Managerial Careers. Chichester:
Wiley.
Kanungo, R. N. (1982). Measurement of job and work involvement. Journal of Applied Psychology,
67(3), 341-349.
Knell, J. (2000). Most Wanted: The Quiet Birth of the Free Worker. London: The Work Institute.
Marler, J., Barringer, M. & Milkovich, G. (2002). Boundaryless and traditional contingent workers:
Worlds apart. Journal of Organizational Behavior, 23, 425-453.
Millward, L.J. & Brewerton, P.M. (1999). Contractors and their psychological contracts. British
Journal of Management, 10, 253-274.

30
Mohr, G. (1986). Die Erfassung psychischer Befindensbeeinträchtigungen bei Industriearbeitern.
Frankfurt: Lang.
Morrison, E. & Robinson, S. (1997). When employees feel betrayed: A model of how psychological
contract violation develops. Academy of Management Review, 22, 226-256.
Mowday, R. & Colwell, K. (2003). Employee reactions to unfair outcomes in the workplace: The
contributions of Adam’s equity theory to understanding work motivation. In L. Porter, G.
Bigley & R. Steers (eds). Motivation and Work Behavior, 7th edition. New York: McGraw-
Hill. pp. 65-82.
Office for National Statistics. (2005). Labour Force Survey. London: Office for National Statistics.
OECD. (2002). Employment outlook. Paris: Organization for Economic Co-operation and
Development.
Parker, S., Griffin, M, Sprigg, C. & Wall, T. (2002). Effect of temporary contracts on perceived work
characteristics and job strain: a longitudinal study. Personnel Psychology, 55, 689–719.
Price, J. L., & Mueller C. W. (1992). Study of Teacher Turnover in Chicago Public Schools. Mimea,
University of Iowa.
Price, J. L. (1997). Handbook of organizational measurement. International Journal of Manpower,
18(4_5_6), 305-558.
Robinson, S. & Rousseau, D. (1994). Violating the psychological contract: Not the exception but the
norm. Journal of Organizational Behavior, 15, 245-259.
Rosenthal, P., Guest, & Peccei, R. (1996). Gender difference in managers' explanations for their work
performance: A study in two organizations. Journal of Occupational & Organizational
Psychology, 69(2), 145-151.
Schyns, B., & von Collani, G. (2002). A new occupational self-efficacy scale and its relation to
personality constructs and organizational variables. European Journal of Work &
Organizational Psychology, 11(2), 219-241.
Semmer, N. K., Zapf, D., & Dunckel, H. (1999). Instrument zur Stressbezogenen Tätigkeitsanalyse
(Instrument for stress-related job analysis (ISTA). In H. Dunckel (Ed.), Handbuch
psychologischer Arbeitsanalyseverfahren (pp. 179-204). Zürich: vdf Hochschulverlag.
Smith, V. (2001). Crossing the Great Divide: Worker Risk and Opportunity in the New Economy.
Ithaca, NY: Cornell University Press.
Van der Doef, M., & Maes, S. (1999). The Leiden Quality of Work Questionnaire: it's construction,
factor structure and psychometric qualities. Psychological Reports, 85, 954-962.
Van Dyne, L. & Ang, S. (1998). Organizational citizenship behavior of contingent workers in
Singapore. Academy of ManagementJournal, 41, 692-703.
Wagena, E., & Geurts, S. (2000). SWING. Ontwikkeling en validering van de 'Survey Wek-thuis
Interferentie-Nijmegen' [SWING. Development and validation of the 'Survey Work-home
Interference-Nijmegen']. Gedrag en Organisatie, 28(3), 138-158.
Ware, J. E. (1999). SF-36 Health Survey. In M. E. Maruish (Ed.), The use of psychological testing for
treatment planning and outcomes assessment (2nd ed.) (pp. 1227-1246). Mahwah, NJ, US:
Lawrence Erlbaum Associates.

31
Warr, P. (1990). The measurement of well-being and other aspects of mental health. Journal of
Occupational Psychology, 63(3), 193-210.

32
Appendix 1. Table of correlations and reliabilities
1 2 3 4 5 6 7 8 9 10 11 12 13 14 15 16 17 18 19
1 Manufacturing dummy
2 Education dummy -0.57
3 Organisation size -0.49 -0.19
4 Core HR-Practices -0.29 0.14 0.15
5 Blue Collar 0.64 -0.38 -0.34 -0.30
6 Low-level White Collar -0.13 0.02 0.18 0.03 -0.37
7 Mid/Upper White Collar -0.45 0.35 0.15 0.22 -0.58 -0.30
8 Age -0.09 0.14 -0.03 0.05 -0.06 -0.07 0.02
9 Gender (male+) 0.20 -0.13 -0.08 -0.13 0.15 -0.19 -0.06 -0.06
10 Education level -0.52 0.44 0.10 0.21 -0.56 -0.08 0.48 -0.09 0.03
11 Work hours 0.20 -0.06 -0.12 -0.03 0.07 -0.32 0.03 0.05 0.29 0.08
12 Tenure 0.16 -0.07 -0.02 -0.06 0.01 -0.10 0.05 0.40 0.01 -0.20 0.10
13 Supervisory role -0.18 0.11 0.10 0.16 -0.33 -0.22 0.32 0.17 0.05 0.28 0.27 0.27
14 Union membership -0.13 0.24 0.00 0.05 -0.06 -0.07 0.07 0.18 -0.03 0.07 0.04 0.24 0.14
15 Work Involvement 0.08 -0.05 -0.06 0.08 0.08 -0.04 -0.08 -0.03 0.10 -0.08 0.12 -0.07 -0.03 -0.04 0.73
16 Permanent Contract 0.23 -0.33 -0.04 -0.02 0.14 -0.17 -0.06 0.17 0.07 -0.22 0.13 0.39 0.17 0.06 -0.04
17 Content PC -0.18 0.04 0.15 0.48 -0.21 0.03 0.15 -0.05 -0.03 0.09 0.01 -0.02 0.17 0.02 0.18 0.01
18 Fulfilment PC -0.22 0.08 0.09 0.42 -0.22 0.06 0.12 0.05 -0.08 0.15 -0.07 -0.10 0.04 -0.12 0.04 -0.17 0.18
19 Violation PC 0.18 -0.05 -0.08 -0.45 0.16 -0.06 -0.08 0.02 0.05 -0.13 0.08 0.18 0.03 0.12 -0.12 0.20 -0.40 -0.59 0.85
20 Trust/Fairness -0.20 0.05 0.10 0.49 -0.20 0.09 0.08 -0.05 -0.07 0.16 -0.09 -0.20 -0.02 -0.13 0.17 -0.25 0.46 0.62 -0.72
21 Job insecurity 0.12 0.01 -0.09 -0.27 0.12 0.01 -0.06 -0.02 0.03 -0.10 -0.02 0.01 -0.10 0.06 -0.04 -0.19 -0.25 -0.28 0.34
22 Employability -0.11 -0.02 0.16 0.05 -0.14 -0.03 0.08 -0.06 0.00 0.20 0.05 -0.08 0.15 -0.02 -0.07 0.00 0.00 0.11 0.00
23 Role Clarity 0.18 -0.19 -0.10 0.16 0.17 0.00 -0.16 0.10 -0.11 -0.21 -0.05 0.06 -0.04 -0.05 -0.03 0.12 0.03 0.25 -0.25
24 Autonomy -0.28 0.18 0.09 0.34 -0.44 -0.06 0.35 0.01 0.07 0.34 0.10 0.09 0.39 0.02 0.13 0.02 0.29 0.23 -0.24
25 Skill Utilization -0.36 0.24 0.15 0.41 -0.48 -0.08 0.40 0.06 0.04 0.37 0.14 0.07 0.38 0.08 0.15 -0.04 0.39 0.28 -0.29
26 Workload -0.23 0.21 0.08 0.05 -0.39 -0.15 0.35 0.25 -0.01 0.33 0.29 0.22 0.47 0.20 -0.08 0.15 0.04 -0.05 0.11
27 Contract of choice 0.03 -0.15 0.00 0.21 -0.04 -0.08 0.02 0.15 -0.01 -0.02 0.00 0.14 0.10 -0.04 0.08 0.34 0.19 0.23 -0.32
28 Job of choice -0.12 0.05 0.04 0.24 -0.20 0.01 0.09 0.17 0.00 0.05 0.02 0.13 0.16 -0.01 0.14 0.03 0.25 0.31 -0.38
29 Profession of choice -0.23 0.14 0.10 0.28 -0.31 -0.01 0.17 0.22 -0.01 0.17 0.07 0.09 0.19 0.03 0.14 0.00 0.32 0.28 -0.37
30 Self-efficacy -0.02 -0.06 0.06 0.11 -0.07 -0.01 -0.02 0.14 0.02 0.04 0.08 0.10 0.13 0.04 0.06 0.05 0.06 0.25 -0.15
31 Influence of work at home -0.13 0.04 0.09 0.27 -0.12 -0.04 0.11 0.09 -0.02 0.11 -0.01 -0.02 0.09 -0.02 0.31 -0.12 0.37 0.25 -0.42
32 Work-related anxiety 0.04 0.03 -0.03 -0.27 0.01 -0.07 0.07 -0.03 0.01 -0.03 0.14 0.05 0.10 0.08 -0.03 0.12 -0.24 -0.40 0.58
33 Work-related depression 0.23 -0.09 -0.13 -0.44 0.25 -0.06 -0.12 -0.14 0.08 -0.16 0.07 0.05 -0.09 0.06 -0.09 0.15 -0.34 -0.50 0.67
34 Irritation -0.02 0.06 0.01 -0.13 -0.10 -0.07 0.14 -0.04 0.04 0.09 0.18 0.04 0.18 0.11 0.03 0.07 -0.10 -0.25 0.39
35 Sick leave 0.05 -0.08 0.00 -0.07 0.19 -0.03 -0.13 -0.16 -0.12 -0.12 -0.13 -0.08 -0.18 0.01 -0.02 0.08 -0.08 -0.15 0.16
36 Sick presence 0.03 -0.04 0.03 -0.12 0.06 -0.07 -0.01 0.01 -0.08 -0.10 0.04 0.12 0.02 0.11 0.03 0.16 -0.13 -0.26 0.30
37 Accidents 0.15 -0.12 -0.03 -0.11 0.20 -0.07 -0.09 -0.09 0.13 -0.16 0.08 0.05 0.03 -0.01 0.01 0.07 -0.04 -0.14 0.18
38 Incidents 0.10 -0.02 -0.05 -0.18 0.13 -0.06 -0.06 -0.02 0.06 -0.08 0.14 0.06 0.11 0.09 0.11 0.14 -0.10 -0.22 0.27
39 Job Satisfaction -0.31 0.15 0.16 0.44 -0.34 0.02 0.22 0.20 -0.07 0.22 0.01 0.03 0.25 0.00 0.15 -0.11 0.45 0.50 -0.60
40 Organizational Commitment -0.21 0.01 0.17 0.44 -0.30 0.04 0.17 0.19 -0.05 0.17 0.02 0.01 0.19 -0.09 0.22 -0.02 0.38 0.45 -0.51
41 Intention to quit 0.13 -0.04 -0.06 -0.42 0.15 -0.04 -0.07 -0.10 0.04 -0.07 0.05 0.04 -0.03 0.05 -0.14 0.10 -0.40 -0.46 0.66
42 Perceived Performance 0.06 -0.07 -0.01 0.12 -0.04 -0.01 -0.02 0.07 -0.03 -0.02 0.12 0.10 0.14 -0.05 0.10 0.02 0.12 0.19 -0.18
43 Physical health 0.00 -0.02 0.01 0.08 -0.04 -0.01 0.02 0.07 -0.06 0.03 -0.03 0.04 0.05 -0.05 0.01 -0.08 0.10 0.17 -0.23
44 Life satisfaction 0.07 -0.06 -0.01 0.13 0.03 0.02 -0.04 0.02 -0.11 -0.06 -0.11 0.04 -0.02 -0.01 0.00 -0.02 0.16 0.24 -0.32
Correlations >0.09 are significant at 5% level

33
20 21 22 23 24 25 26 27 28 29 30 31 32 33 34 35 36 37 38 39 40 41 42 43 44
0.91
-0.32 0.88
-0.01 -0.19 0.84
0.22 -0.15 0.01 n/a
0.21 -0.20 0.18 0.08 0.80
0.27 -0.23 0.15 0.04 0.72 0.86
-0.15 -0.07 0.20 -0.07 0.36 0.41 0.79
0.26 -0.31 0.07 0.20 0.17 0.18 0.07 0.81
0.36 -0.22 0.01 0.21 0.34 0.41 0.15 0.36 n/a
0.32 -0.24 0.09 0.16 0.39 0.47 0.21 0.32 0.72 n/a
0.17 -0.17 0.30 0.25 0.21 0.22 0.11 0.11 0.16 0.15 0.68
0.37 -0.10 0.05 0.06 0.23 0.28 -0.02 0.14 0.27 0.28 0.13 0.86
-0.51 0.31 -0.04 -0.24 -0.11 -0.13 0.27 -0.19 -0.31 -0.28 -0.28 -0.28 0.84
-0.61 0.37 -0.07 -0.24 -0.30 -0.38 -0.03 -0.26 -0.43 -0.43 -0.30 -0.45 0.71 0.87
-0.34 0.21 0.04 -0.18 0.06 0.08 0.32 -0.13 -0.16 -0.11 -0.20 -0.15 0.64 0.51 0.88
-0.18 0.16 -0.05 0.04 -0.17 -0.19 -0.19 -0.08 -0.17 -0.14 -0.10 -0.10 0.14 0.28 0.14 n/a
-0.33 0.15 0.01 -0.08 -0.07 -0.08 0.13 -0.10 -0.15 -0.12 0.00 -0.13 0.31 0.31 0.32 0.34 n/a
-0.16 0.04 0.00 -0.05 -0.11 -0.07 0.01 -0.11 -0.14 -0.15 0.01 -0.16 0.10 0.17 0.09 0.10 0.14 n/a
-0.25 0.08 0.12 -0.01 -0.03 -0.02 0.16 -0.11 -0.04 -0.01 0.05 -0.08 0.27 0.26 0.26 0.07 0.19 0.19 n/a
0.59 -0.30 0.04 0.20 0.42 0.53 0.20 0.30 0.55 0.55 0.28 0.46 -0.44 -0.71 -0.27 -0.28 -0.25 -0.17 -0.12 0.83
0.56 -0.31 0.10 0.15 0.33 0.41 0.15 0.33 0.43 0.42 0.37 0.45 -0.36 -0.59 -0.21 -0.21 -0.15 -0.15 -0.11 0.64 0.69
-0.62 0.37 0.05 -0.25 -0.26 -0.34 0.03 -0.32 -0.49 -0.49 -0.20 -0.41 0.52 0.69 0.38 0.22 0.27 0.13 0.21 -0.71 -0.54 0.82
0.13 -0.15 0.22 0.27 0.32 0.30 0.18 0.13 0.22 0.23 0.51 0.12 -0.20 -0.33 -0.09 -0.15 0.01 -0.02 0.04 0.32 0.35 -0.23 0.82
0.18 -0.20 0.03 0.10 0.10 0.12 -0.01 0.08 0.21 0.20 0.19 0.20 -0.32 -0.37 -0.40 -0.36 -0.25 -0.13 -0.12 0.30 0.23 -0.26 0.17 0.80
0.31 -0.19 0.02 0.22 0.05 0.07 -0.13 0.19 0.23 0.19 0.23 0.26 -0.43 -0.49 -0.51 -0.21 -0.26 -0.18 -0.16 0.34 0.31 -0.39 0.20 0.43 0.86

34