tenure. - unimi.itchecchi.economia.unimi.it/pdf/26.pdftenure. an appraisal of a ... riccardo faini,...
TRANSCRIPT
1
Tenure.An appraisal of a national selection process
for associate professorship †
Daniele ChecchiState University of Milan “Bicocca”
Mailing address:Facoltà di EconomiaUniversità degli Studi di Milano BicoccaPiazza dell’Ateneo Nuovo 1 - 20126 MILANO - Italytel. +39-02-6448-6590 fax +39-02-6448-6585email [email protected]
AbstractThis paper presents a case study of the national academic competition for associate professorship which tookplace in Italy during the academic year 1997-98. The two-stage selection procedure led to the appointment of 44associate professors of Economics (discipline code P01A – Economia Politica). A quantitative analysis will attemptto measure the relative contribution to the appointment probability made by the candidates’ academiccredentials; in particular published articles are classified according to the prestige rank of the journals concerned.According to our results, publishing in foreign journals increased the probability of entering a short list ofapplicants selected for interview (first stage), while the probability of appointment (second stage) was alsoaffected by the evaluation obtained during the interview and other criteria such as a vacancy in the candidate’sown university. All things being equal, candidates from southern universities were favoured, whereas outsiderapplicants (located in foreign universities or holding non-academic positions, like Central Bank ResearchDepartment, etc.) were penalised.
† In this paper the author reviews a national competition for 44 positions of (tenured) associate professorship inEconomics (discipline code P01A – Economia Politica) established by governmental decree (D.M. issued on 22/12/1995and published in GU on 30/1/1996 – subsequently extended by DM issued on 29/2/96 and published in GU on8/3/1996). The author is himself an associate professor who was among the nine members of the selecting committeeappointed by the Ministry of University on 29/5/1997. The other members were the professors Carlo D'Adda (Bologna),Mario Baldassarri (Rome), Nicola Postiglione (Salerno), Piero Tani (Florence), Piero Tedeschi (Padua), Antonio D'Agata(Catania), Fabio Ranchetti (Pavia) and Maria Luigia Segnana (Trento). The author thanks Giuseppe Bertola, GiorgioBrunello, Franco Donzelli, Riccardo Faini, Marzio Galeotti, Tullio Jappelli, Michele Polo, Giorgio Rampa, Nicola Rossi ePatrizio Tirelli for helpful discussions at an earlier stage of this work. The paper has benefited from specific comments byCarlo D'Adda, Luca Flabbi, Massimo Florio, Giuseppe Marotta, PierGiovanna Natale, PierLuigi Porta, Annalisa Rosselliand Maria Luigia Segnana. The author is also grateful to Silvia Pesenti for invaluable assistance in building the data set.Two anonymous referees and the editor (Giuseppe Bertola) suggested several valuable improvements on a previousversion. The author is grateful to all of them. He also acknowledges financial support from the Italian National ResearchCouncil (CNR) and the Ministry for Universities and Scientific and Technological Research (MURST). This data setcannot be made publicly accessible for privacy reasons, but the author is available to provide specific statistics on request(email address: [email protected]).

2
Contents:1. Introduction ....................................................................................................................................................22. Building a data base .......................................................................................................................................53. A two stage selection .......................................................................................................................................84. Building a representative index .....................................................................................................................125. Concluding remarks ......................................................................................................................................156. Addendum: a new system for professorship competition ..................................................................................17References ..........................................................................................................................................................18Tables and figures .............................................................................................................................................19Appendix 1 – Alternative ranking of economic journals and present ranking ...................................................29Appendix 2 – Probit estimates of the two stages of selection...............................................................................32
Infandum, regina, iubes renovare dolorem,Troianas ut opes et lamentabile regnumeruerint Danai, quaeque ipse miserrima vidiet quorum pars magna fui.....Sed si tantus amor casus cognoscere nostroset breviter Troiae supremum audire laborem,quamquam animus meminisse horret luctuque refugit,incipiam....
Vergil, Æneides, 2, 3-13
1. Introduction
Writing about this competition for professorship reminds me of the painful memory expressed byÆneas requested by Dido to recall his flight from Troy. In this paper we will analyse a case ofacademic personnel selection for the Italian universities through the procedure of a national publiccompetition. This selection process was held between September 1997 and July 1998 and ended withthe appointment of 44 new associate professors in Economics (discipline code P01A – Economics(Economia Politica)). In the Italian system, unlike those of other countries, such appointments arealmost automatically tenured , so it is extremely important to scrutinise its recruitment policy in orderto assess its relative quality. Additional elements of interest are the strong impact this kind ofcompetition had on academic life in Italy and the huge amount of public money that has been investedin the procedure. As far as the first aspect is concerned, the entire teaching staff for Economics(discipline code P01A) that existed in Italian universities before 1996 consisted of 249 members.Among them, 130 were full professors and 109 associate professors. The appearance of 44 newlyappointed associate professors implied a 17.6% increase in the entire teaching staff; the same numberrises to 40.3% if we only include associate professors.1 When we consider their average age (39 years),we realise that the consequences of this last selection will influence the Italian academic system for atleast the next two decades. As for the second aspect, we do not have official figures, so it is difficult tosupply an exact estimate. Just to provide a rough one, consider the following calculation. Theexamining committee had 9 members (five full professors and four associate ones) who met 16 times,for a total of 46 days (or over 400 hours). Each member was expected to be able to express ajudgement on each of the 277 applicants: making a cautious estimate of the average length of timespent on each candidate as 3 hours, we can add 831 hours. Finally, we have to add the time spent oncommunicating and travelling to the meeting place (Bologna). Overall, we consider realistic an estimateof 1500 hours of commitment for each member of the committee, which corresponds to 4/5 of the
1 The national committee for evaluation limits itself to the nomination of a number of scholars equal to the number ofexisting open positions. The effective hiring of a nominee in a specific university is based on a process of bilateralbargaining based on teaching loads and additional facilities (given that the government centrally fixes the salary). Anominee becomes definitively tenured undergoing a point evaluation of scientific activity after three years.

3
average annual working hours of an average worker.2 If we estimate an average annual cost of 130million Italian liras (67.484 euro) for a full professor and of 100 million Italian liras (51.911 euro) for anassociate professor, we reach an opportunity cost of this national competition equal to 840 millionItalian liras (436.053 euro). When we add travel and accommodation expenditure for each committeemeeting (estimated at 13 million for each member), we reach the impressive figure of 944 millionItalian lire (490.094 euro) spent to select 44 associate professors, in other words a screeningexpenditure of 21 million Italian liras (11.137 euro) per head.3
Though impressive, however the numbers do not tell us anything about the quality of the selection,unless we specify an objective function for the selecting committee. Here we face the objectives of atleast three groups of agents.i) The university system governed by the Ministry for Universities and Scientific and Technological
Research. In this case, we can imagine the Parliament and/or the Government expressing aninterest in raising human capital formation in the country, both from a quantitative (greaternumber of students reaching the university stage) and qualitative point of view (better screeningamong enrolled students). In this perspective, the selecting criterion should be the adherence toinstitutional goals.
ii) The scientific community, readily identifiable in the entirety of university professors who elect theselecting committee.4 In this case, we expect this community to be interested in the advancement ofscientific research (asking new questions and giving new answers to old ones) as the dominantcriterion to be followed in co-opting new members. As long as this community perceives itself aspart of a larger international community, being already a member of this larger community can beconsidered as an additional asset.
iii) Each single university which has to hire the nominee. When selecting a specific nominee, we expect acollege to pay attention to her teaching capability and interpersonal skills. A newly hired professor notonly has to teach an Economics course, but also to participate in Department meetings, organiseseminars and supervise students preparing dissertations. It is less clear whether colleges care orshould care about advancements in scientific research, since there are no explicit incentives to bemore productive in carrying out research projects.5 However we presume that a Department isconcerned about external visibility and prestige for its non-monetary externalities: for instance, hiring aprofessor well connected abroad will facilitate student and scholar exchanges. In addition, if weaccept the view of universities as joint production of teaching and scientific investigation, hiring ascholar with a good performance in doing research may also help to improve the quality of theteaching offered by a Department.6
2 In Italy we cannot speak of a contractual working time for university professors. In its place there is a legal provision of aminimum of 350 hours a year (comprising teaching and marking exams), leaving on individual responsibility the use of thetime left for scientific production.3 This is the expenditure from the point of view of the Public Administration. From a social welfare point of view, weshould add the expenditures afforded by each applicant to mail a copy of her scientific production to each of the ninemembers of the committee. Finally, we should add the travel and accommodation expenditures met by the applicants whoentered the short list and held the interview. In such a case, we easily pass the figure of one billion of Italian lire.4 There is some randomness in electing the committee, for the Ministry of Universities draws a list of 27 candidates fromthe entirety of the tenured professors, and elections are held on this list. This is intended to avoid full monopolisation ofthe discipline by a theoretically dominant group of scholars.5 Public funding of research in Italy (National Research Council (CNR) and the Ministry for Universities and Scientificand Technological Research (MURST)) is provided on individual basis, without any advantage for the hosting institution(save for a marginal fraction equal to 3-5% deducted for overhead expenses).6 Cf. Johnes 1997. It is less clear whether individual abilities are (imperfect) complements or substitutes in doing researchwithin a Department. In the former case, production efficiency would require integration of individuals with differentperformances, whereas in the latter case perfect stratification would yield the maximum output in research: cf. Benabou1996.

4
Even from this short review, it is evident that the selection process is overloaded with demands.Adherence to institutional goals, scientific productivity, teaching ability and interpersonal skills are fourpossible criteria that may prove mutually incompatible. A candidate who devoted most of her time toteaching courses might exhibit a lesser scientific production (but this is not the case in these data set –see Tables 3 and 4). Equally possible is the case of a candidate with good research record but poorperformance in dealing with colleagues.
The selecting committee did not receive any official indication on how to amalgamate these alternativegoals within a single objective function. Therefore, each member had an incentive to follow personalcriteria, often in accordance with her own constituency. Thus, the end-product of the committee maybe seen as the bargaining outcome among players with different objective functions. When we add thefurther information that national competitions for professorship like the one analysed here were fewand far between (the previous one had taken place six years earlier), we understand why a candidatewould be totally incapable of anticipating the selecting criteria, not to speak of adjusting herperspective career strategy to some pre-specified standard. Even observing one occurrence of acommittee adopting a specific criterion (like “teaching experience”) would induce a change in thecandidate’s behaviour, as there was no guarantee that the next committee would adopt a similarcriterion.7 In the absence of such continuity, the best strategy for a potential candidate seems to havebeen asset diversification: “accept some teaching load, publish in good journals, be friendly witheveryone and do not miss official meetings!» Given the fact that specialising in each activity requirestime, a candidate would have (partially) self-insured against any unexpected modification in theselection criteria, creating an incentive to devote some time to each activity. As a result, the nationalcompetitions system for professorship in force in Italy until 1998 did not provide clear incentives tocandidates to base their profiles on one (or more) of the previous criteria.
The present paper does not, however, aim to provide a normative analysis of optimal selection foruniversity professors. Since the final result is the bargaining outcome of nine members withunobservable objective functions, the working of the selecting committee is like a black box. Openingthis box, this paper intends to provide a positive analysis of a case study, based on observable featuresof this selection procedure. The advantage of adopting observable variables is that this analysis mightin principle be replicated on past or future selection processes, allowing potentially interestingcomparisons. It is important to note that by now this study has no practical use, since Law n.210issued on 3/7/1998 (and the following governmental regulation issued on 28/10/1998) has radicallyreformed the procedures for professorship competitions.8 Still, it arguably retains some interest in thestudy of the working of institutions, especially when considering their somehow slow speed of change.It may also have some interest for future candidates for university posts as they may gain informationon observable characteristics of their predecessors and may form expectations about what representsan element of relative strength or weakness. A final point deserves discussion. The author has playedthe double role of external researcher and object of investigation. As a member of the selectingcommittee, he agreed with the choices and bears the full responsibility of the result. What can assure areader that he is not refraining from asking crucial questions, intentionally or unintentionally ?Weighing the relative cost of potential non objectivity and the relative benefit of giving access to dataotherwise impossible to collect, the author believes that the latter outweighs the former, and istherefore about to develop the empirical analysis of the paper. It is worth recalling that the paper doesnot describe how the committee actually worked (a task that is impossible given the compositioneffects mentioned above). Instead, it asks whether some observable characteristics of the candidates 7 The only continuity in the criteria adopted by successive selecting committees can be assured by the need of eachmember to preserve some reputation within the academic community. However, being this community made ofindividuals with different objective functions, it will always exist a constituency supporting any selection outcome.8 See the sixth section for a discussion of the new system. The system analysed in the present article was initiallyintroduced by the law n.382 issued on 11/7/1980. Notwithstanding a provision of holding a national competition everytwo years, since then we had only three editions of this type of competition.

5
(age, sex, scientific productivity, teaching experience, and job location) may have played some role inincreasing the probability of appointment. Therefore, the estimated models have to be interpreted asdescription of the actual behaviour as if the Committee had been a single selecting agent. If the samevirtual agent had kept on selecting in later editions of these competitions, the proposed estimateswould have provided an invaluable source of information for any potential candidate. It would havebecome possible to maximise the probability of appointment by carefully selecting a strategy where(marginal) costs and benefits for each record were equated. As it is, the institutional set-up haschanged so radically that the present results may prove worthless in working out the best strategy forfuture competitions.
The paper is organised as follows. The next section introduces the data set containing the relevantinformation on the applicants and how they were organised. The third section describes the selectionprocedure in two stages, creating a short list for interview and final appointment, by showing theaverage characteristics of each sub-group and estimating maximum likelihood probit models fortransition. The fourth section presents two synthetic indices to rank the candidates and analyses theirpredictive ability with reference to the competition analysed. The fifth section contains conclusiveremarks and raises some general issues. The sixth section contains an addendum that discusses thereform of the competition systems and raises some doubts concerning its ability to deal with theproblems that emerged in previous sections.
2. Building a data base
All information about the candidates was obtained from their curriculum vitæ which they had to attachto their application.9 In case of ambiguity, original publications were referred to. For each candidate itis possible to identify age, gender, educational achievements, current job position (title and location),teaching experience and scientific productivity.10 All information is easily measured except for the last.In the category of published articles, we find a great variety of papers, varying from top journals tonewspapers. We have thus classified the intellectual production of each candidate in four groups(article in a foreign journal, article in an Italian journal, contribution to collected papers and volumes)with further disaggregation within each group.11 For the first group (articles published in foreignjournals) there are alternative rankings of journals available in the literature. The Social Science CitationIndex offers a ranking based on the number of citations obtained by each journal inside a pre-specifiedgroup of journals. Laband and Piette (1994) provide alternative rankings, where each citation isweighted according to the relative rank of the journal containing the citation. Both approaches presentproblems.12 The Social Science Citation Index includes only journals that report to SSC publishing 9 Here there is a potential risk of imperfect synchronisation of the relevant information. Formal applications for thecompetition were submitted in February 1996, whereas the committee was appointed in May 1997. By then, the applicantswere encouraged to submit their publications to the commissioners, and most of them took the opportunity to updatetheir c.v. When they did not, the author explicitly requested it, but not all applicants accomplished. In these case, the initialc.v. was used. Since the present data set has been built on this information, the information regarding the candidates is notexactly contemporaneous. However, the alternative of using contemporaneous information available at the beginning of1996 would have been excessively penalising for younger applicants.10 Other potential information available in a c.v. is participation to seminars and conferences, refereeing, scholarshipobtained and fellowships. However, not all candidates provide this information, and therefore we were forced to excludethem form the analysis.11 The other alternative would have been counting the number of citations in the EconLit Database, which represents theelectronic version of citations reported in the Journal of Economic Literature (as proposed by Marcuzzo in Carabelli, Parisi andRosselli 1999). This procedure has two main limitations: partial coverage of Italian journals and publishers, and possiblerepetition of the same record (when for example it appears first as a working paper and then as an article). For the sake ofcompleteness of analysis, we have collected this variable for all candidates on the September 1997 version of EconLit, butit does not seem to play any role in predicting the competition outcome.12 We abstract from different length in published pages. The alternative would be to use length-adjusted pages (as inKalaitzidakis et alt. 1999), but this captures more the effort than the quality of the scientific production.

6
house, and in some cases non-scientific journals (like The Economist) are included. On the contrary,Laband and Piette (1994) take as reference basis the citations that appeared in all economic journalsduring the time interval 1984-89, thus excluding by construction all the new journals that started theirpublications after 1989.13 For these reasons, we have devised a personal ranking of journals. It is basedon the relative position reached by a journal in both the Social Science Citation Index (October 1995)and in Laband and Piette’s ranking. Then all entries unrelated with general Economics have beenremoved, and new entries have been added.14 Once the list was completed, it was divided into fourintervals: the top ten journals, a second group of journals ranked between 11 and 50, a third groupincluding 51 through 125 and a fourth group with the remaining journals. As far as Italian journals areconcerned, to the best of our knowledge we do not know of any published ranking. Therefore wehave proposed an arbitrary three-fold partition: the top five journal group (identified by subjectiveevaluation of prestige, age of existence of the journals and constant presence of refereeing activity), thegroup of journals ranging between 6 and 20 and the remaining journals. Contributions to collectedpapers are not generally refereed, even if this is more frequent in the case of foreign volumes. For thisreason we have distinguished only between collected papers published abroad and published in Italy(irrespective of the citizenship of the editor). Finally, the volumes have been divided in accordancewith the publisher (foreign or Italian) and his prestige (primary or non-primary). In order to reducethe number of sub-groups, we chose a three-tier scheme: volume with a primary foreign publisher;volume with a non-primary foreign or a primary Italian publisher; volume with a non-primary Italianpublisher. The general classifying scheme of publications is presented in Table 1.15 When dealing with
cases of co-authorship, the most intuitive solution would be to weigh such a work with n1 , where n is
the number of authors. Nevertheless, this procedure ignores synergies existing in joint work, and this
suggests weighting co-authorship with ( )15.011
−⋅+ n. This formula privileges joint work, since it gives
0.66 for a work with a co-author, 0.5 for a work with 2 co-authors and 0.4 for an article with 3 co-authors.16 Finally, in the case of formally accepted but yet unpublished papers, we have classified themas already published.17
[Insert Table 1 about here]
13 Critiques to Laband and Piette 1994’s procedure are reported in Beed and Beed 1996.14 See the Appendix 1 for original rankings and a more precise description of the procedure followed in creating a personalranking.15 Additional conventions adopted in building the data set:i) articles published in foreign journals different from the 125 listed in Table 1 have been attributed to group P4.ii) working papers from foreign institutions are classified in group P5.iii) working papers from Italian institutions, research reports and unpublished papers (but deposited in accordance with
printing laws – according to the Italian system of public competition, when an unpublished paper accomplishesprinting laws, has to be considered as a published paper) are reported in group P8. Papers that were unpublished andnon-deposited are still counted in group P8 but with half weight.
iv) book reviews and newspaper articles have been excluded.v) master or PhD dissertations have been excluded, since in most cases they give rise to further publications in journals
and volumes.vi) when a paper has been published more than once (for example in Italian and in English), we have classified the paper
in the most prestigious group.16 This specification adopts a concave rather than a linear technology in the production of scientific articles, and assumesthat the former dominates the latter in the relevant [0,1] range. A possible test of this assumption would have been tocount the number of pages for each article and check whether the average number of pages of co-authored papers ishigher than the corresponding number for single-authored papers.17 In case of revise and resubmit, we have weighed these articles as ½ of the corresponding category.

7
Descriptive statistics for the whole sample of applicants are reported in Table 2.18 Reading this Table,we get a general portrait of the average candidate for a position as an associate professor inEconomics: aged around 40 on average, most candidates will have carried out postgraduate studies in aforeign university19 and in their vast majority (84.2%) are actually employed as assistant professors,mainly in a Centre-Northern university. They exhibit a considerable teaching experience, since theyhave taught 3.6 courses on average. Their scientific production has mainly appeared in nationaljournals: they have published less than ½ article (0.48) in the top 125 foreign journals, 1.7 articles inthe top five Italian journals and 4.2 in the successive 15 journals. Younger candidates are slightly moreoutward oriented, since the corresponding values are 0.61, 1.8 and 3.7. Publishing a volume abroad israther limited, whereas there is a tendency for older candidates to have published a volume with a non-primary Italian publisher: the sample average of 0.49 volumes rises to 0.82 for candidates over 40.Therefore it seems possible to identify at least two groups of candidates: a first group composed ofyounger candidates, holding postgraduate certificates from foreign universities and looking forinternational visibility, with limited teaching experience; a second group, composed of oldercandidates, more inward oriented, with wide teaching experience and very often a vast scientificproduction published in less prestigious journals.20 Gender differences indicate a higher age for womenaccompanied by lower “visibility” and “productivity” when compared with their male counterparts.21
[Insert Table 2 about here]
A partial confirmation of these claims is found in the correlation indices reported in Table 3. Theseindices (which exhibit low values, thus reducing the risk of multi-collinearity when jointly using thesevariables as regressors) indicate that gender and age are negatively associated with publishing articles inforeign (variable P3) and top Italian journals (variable P4). On the contrary, teaching experience ispositively correlated with age (the value of 0.40 is among the highest in the table). Once we excludethe case of candidates already holding an associate professorship in a foreign university (variable W5),previous job and job location do not seem to represent a significant source of advantage ordisadvantage. An interesting phenomenon can be noticed: most of the off-diagonal coefficientsreferring to published articles (variables from P1 to P8) are highly significant, indicating the existenceof a “hierarchical cumulating” effect: publishing an article in the 11-51 top foreign journals is positivelyassociated with publishing in the top 10 journals. Alternatively phrased, it is hard to place an article inhighly ranked journals if you have not published in somewhat less prestigious journals. A morestructured analysis is offered with Table 4, where the productivity within each category of articles isregressed on the same set of variables. All things being equal, gender differentials are significant onlyfor foreign journals ranked below 50th position, but no evidence emerges with respect to Italian 18 The committee received 353 formal applications for this competition, but only 277 candidates finalised theirapplications by mailing copy of their papers to the official headquarter of the committee in Bologna. The data set concernsonly this sub-set of candidates.19 This is more valid for younger candidate: more than 50% of candidates younger than 40 hold a PhD from a foreignuniversity, contrary to the 17% of older candidates.20 Both groups are selection biased with respect to the corresponding universe of scholars. In the case of youngercandidates, we expect them to be self-selected among the most brilliant ones, given their aspiration to be appointed asuniversity professors. In the case of older candidates, we expect an opposite bias because most of them have alreadyapplied in a previous competition (held in 1991-92) without success.21 Marcuzzo in Carabelli, Parisi and Rosselli 1999 utilises EconLit citations to define “productivity” and “visibility”(respectively as the number of entries for each candidate and as the ratio between candidates with entries to candidatewithout entries). With reference to the universe of all Italian economists, she measures lower values of both indicators forwomen when compared to men. From Table 2 there is also evidence of slightly weaker background in postgraduatestudies for women, but a reverse situation applies for the younger cohort. When we look at candidate younger than 40,80.2% of male applicants holds a PhD from either a foreign or an Italian university) compared to 81.7% of the femalecounterpart. A possible explanation is that younger female scholars, becoming increasingly aware of discrimination at thehigher stages of the academic career, strengthen their position by improving their academic background. The author isindebted with Annalisa Rosselli for drawing my attention on this point.

8
journals. Holding a PhD degree from a foreign university helps in publishing in top journals, both athome and abroad. The hierarchical cumulating effect is also evident from this table, but its magnitudeis low: publishing one article in a group of journals increases the publication of an average of 0.1 articlein the group of journals immediately higher. Being located outside the Italian academy and/or workingas an associated professor in another university represent an advantage in publishing in top foreignjournals. Vice versa, being located in a southern Italian university represent a disadvantage only forpublishing in top Italian journals. Finally, age does not affect scientific productivity at any level.22
[Insert Tables 3 and 4 about here]
3. A two stage selection
The system of national competitions for a professorship introduced by Italian Law n.382/1980envisaged a two-stage selection. The first stage was based on the valuation of scientific titles (degrees,experience, scientific production) and ended with a short list of candidates admitted to the secondstage. The second stage consisted of an interview, where a candidate was examined about her writings,and had to give a mock lecture on an argument randomly drawn 24 hours in advance. In thecompetition analysed here 277 applicants were evaluated in the first stage, 120 of whom short listed.However only 108 faced the Committee, since 12 candidates withdrew in the time interval between thetwo stages.23 From the group of 108 candidates, the Committee selected 44 nominees. However, thefinal selection was less severe than it may appear, since in the meanwhile the Committee had becomeaware of the simultaneous appointment of 18 of the candidates to other economic disciplines.24 As aconsequence, the degree of selectivity in the first stage (120 out of 277, or 1 candidate every 2.31applicants) was higher than in the second stage (44 out of 90, or one nominee every two candidates).Our aim is to work out the guide lines of the selection stages. In the theory of revealed preferences, wedo not observe the utility function of the agent, but we can still judge whether s/he behaved as a utilitymaximiser. We do not observe either the candidates’ ranking assumed by each commissioner or thebargaining process within the Committee, but the final outcome only. Nevertheless we can verifywhether the observed behaviour of the Committee contradicted (or did not contradict) some minimalrequirements of coherence (for instance, that publishing an article in the top ten foreign journalsindicates more talent than publishing an article in an unknown local journal). We must be aware thatsome features (like scientific productivity or teaching experience) are more observable than others (liketeaching ability or reliability and loyalty with respect to institutions), and a few of them are not evenobservable (like originality of thought, creativity and elegance in reasoning). Some unobservablecharacteristics can be proxied by observable variables (like the ranking of journals were the articleswere published), but they are so arbitrary that one would not be surprised to find two commissionersexpressing opposite evaluations of the same paper in terms of originality and creativity. Since we canuse only observable variables, we are forced to rely on scientific productivity and consequently on theexternal visibility of the candidates. Since this was also the condition of each commissioner at thebeginning of the competition, we expect scientific production to have been the dominant criterion in 22 It is problematical to compare these results with those of Campanelli, Segnana and Soci in Carabelli, Parisi and Rosselli1999. They work on a similar data-set (277 – somehow a magic number! – curriculum vitæ of applicants to the previousnational competition for associate professorship, held in 1991-92. They are mostly concerned with women/mendifferentials, and in this framework they find evidence of higher age of women, weaker background of postgraduatestudies, greater teaching experience, lower productivity in articles published in lower rank journals, but higher productivityin volumes.23 The Committee issued the short list on 17/1/1998 and the interviews began on 12/3/1998. In the meanwhile two othernational competitions ended (Economic Analysis – code P01E and Monetary Economics – code P01F), and nominees in thosecompetitions withdrew from the present one.24 These disciplines are Economic Policy (code P01B), History of Economic Thought (code P01D), International Economics (P01G)and Development Economics (P01H). By the conclusion of the present competition (15/7/1998), there were threecompetitions still not concluded: Public Economics (P01C), Industrial Economics (P01I) and Regional Economics (P01J).

9
the first stage of selection, whereas in the second stage new information was acquired through theinterview and mock lecture. Moreover, while the needs of local universities could not have played anyrole at the first stage, they could have exerted some pressure at the second stage, because theCommittee had to take into account the specific features of the positions to be covered.
Table 5 compares the relevant characteristics of the candidates in the short list (3rd column) with thoseexcluded (4th column), and takes their ratio (5th column). A value exceeding one indicates a feature thatwas over-represented in the short list, thus constituting a potential explaining factor for entering theshort list. The opposite happened when the index was below one. The same exercise is repeated forthe sub-sample of women (6th column) and younger candidates (7th column). From this Table we get apicture of short-listed candidates characterised by better postgraduate backgrounds and better/higherscientific productivity. In fact the candidates in the short list had published at least ten times more inthe top 125 foreign journals than applicants outside, and three times more in collected paperspublished abroad.25 Looking at job location, some disadvantage is associated with working outside theItalian academy. The same differences characterise the sub-sample of women and younger candidates,thus suggesting that previous factors are stronger than possible sample biases.
[Insert Table 5 about here]
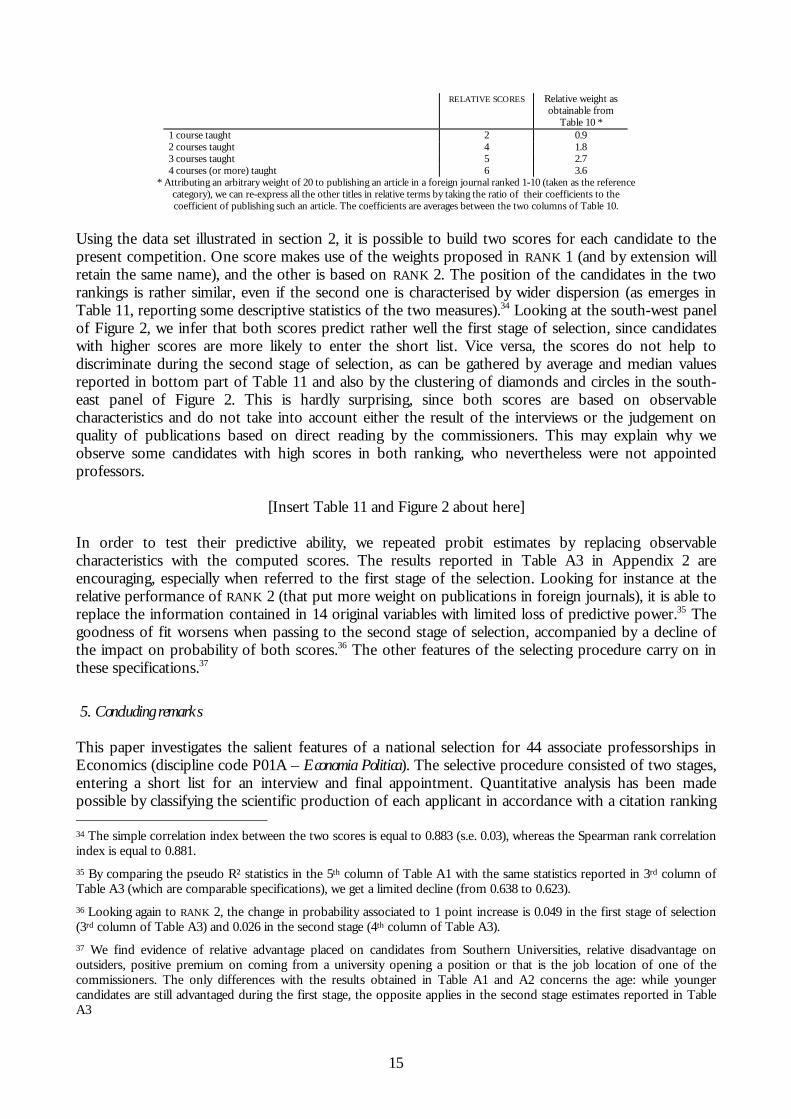
The typical candidate admitted to the short list was a man, under 40, holding a PhD from a foreignUniversity, who had published at least one article in a highly ranked foreign journal and at least threearticles in good Italian journals; additional scientific production is more concentrated in collectedpapers published abroad than in secondary Italian journals. The old practice of requiring thepublication of a volume as a pre-condition to becoming a professor seems to have been ignored.These claims can be made more rigorous by estimating a maximum likelihood probit model, which hasthe advantage of considering the simultaneous contribution of different variables in predicting theprobability of entering the short list. Table A1 in Appendix 2 reports alternative specifications of thefirst stage of selection (“1” being the condition of entering the short list), whereas Table 6 contains thechange in the probability for an infinitesimal change in each independent continuous variable and thediscrete change in the probability for dummy variables (all referring to the last column of Table A1). Inall cases, the probability of entering the short list was positively correlated with the ranking of thejournal where the candidate could have published an article.26 The effect is quite strong: observing thecoefficients shown in Table 6 one sees that publishing an article in the top 50 foreign journals almostensured admission to the short list. The same probability falls to 0.7 for an article published in ajournal ranked between 51 and 125, and then drops to 0.20 for further groups of journals. Taking theratio between these odds coefficients, we can infer that publishing an article in the top 50 foreignjournals is probability-equivalent to publishing just about five articles in the top 5 Italian journals ortwelve articles in secondary Italian journals. We do not find statistical evidence of any probabilitycontributions yielded by minor scientific production (articles in collective volumes published in Italy orarticles in secondary Italian journals). Given the fact that the estimated coefficients declines with theranking of the publication place, we can take these results as evidence of the contemporary adoptionof qualitative and quantitative measures of scientific production by the selecting Committee. Otherfavouring factors seem being women (probability effect equal to 0.17) and young (a decline inprobability of one percentage point for each additional year of age). However, the effect of age masks
25 Notice that all applicants that published in the top ten journals were placed in the short list.26 Bettio in Carabelli, Parisi and Rosselli 1999 estimates probit and hazard functions for becoming associate professor (thuspassing both stages of selection in national competitions) in the universe of the Italian academy for the period 1983-1997(343 observations). She studies the passage as function of age, sex, job location, number of publications in the top 130journals (according to the ranking provided by Laband and Piette 1994) and total number of publications cited by EconLitdata-base. She finds gender discrimination as hardly significant, whereas a positive contribution is offered by the totalnumber of EconLit citations and by being located in North-Centre universities. On the contrary publishing in prestigiousjournals has non-statistically significant effect.

10
the different postgraduate experience of different age cohorts: since younger candidates are more likelyto hold a PhD from a foreign university, when this control is included, the age variable becomes non-significant (4th and 5th column in Table A1). A PhD from a foreign university has a gain in probabilityin the order of 0.33, whereas the equivalent effect of the same degree from an Italian university ismuch lower and statistically non-significant. Since teaching experience was positively correlated withage, it does not come as a surprise that it does not exert a significant effect (5th column in Table A1).Equalising the candidates in terms of scientific productivity, we find evidence that the Committeefavoured candidates from Southern Universities (with a probability effect equal to 0.41)27 while placinga negative premium on outsiders (either working in a foreign university or holding a job outside theacademy – probability effect equal to –0.46). Finally, we wanted to control for “networking effects” bycreating two additional dummies: whether the candidate came from the same university as acommissioner (COMMIS variable),28 and whether the candidate came from a university with a vacancy(LOCAL variable). The former variable is statistically significant, with quite a high impact (0.33,equivalent to holding a PhD from a foreign university), whereas the latter is not.
[Insert Table 6 about here]
How well does this model fits ? Apart from the reported pseudo R² statistics, we can order thecandidates according to the predicted probability and compare it with their actual chances in thecompetition. In Table 7 we distinguish between unanimous admission, majority vote admission andnon-admission. It can easily be noticed that 98 out of 111 applicants with high probability of passingthe first stage of selection were actually inserted in the short list (86 of them on unanimous voting).This leads to the conclusion that the model reported in Table 6 represents a good approximation ofthe actual behaviour of the selecting committee during the first stage of selection.
[Insert Table 7 about here]
It is now time to move to the second stage of selection, where the committee actually met the short-listed candidates. From the interview and the mock lecture new information was revealed, even it isdifficult to measure on an objective scale. However, each member of the committee was required tomark each interview. Taking an average across the commissioners gives us a measure of theperformance of the candidate during the interview.29 It is interesting to see that the appearance of newinformation leads to a reorganisation of the list of statistically significant variables guiding the firststage of selection. Table 8 compares the salient features of the nominees (either in this competition orin other economic disciplines) with those who entered the short list but were not appointed. We canrecognise some analogies between the first and the second stage of selection (Table 5 and Table 8respectively): younger age, a majority holding a PhD (61.2% from a foreign university, 52.3% from anItalian university)30 and at least one article published in the top 125 foreign journals. If we look at 27 We have already noticed that working in a Southern University does not reduce scientific productivity, and therefore apositive coefficient implies a pure effect of preference. As a possible explanation, it must be recalled that half of thepositions were open in Southern Universities, whereas applicants from the same universities were 16%.28 This variable captures spatial continuity between a commissioner and a candidate, and proxies two distinct effects:potential direct acquaintance between the commissioner and the candidate, and potential pressure from the faculty ontothe commissioner on behalf of the candidate. In the absence of better information, this dummy takes value equal to onewhen the city of origin of the commissioner and of the candidate coincides. In case of cities with more than one university(Milan, Rome or Naples) it is rather possible that candidate and commissioner do not know each other. When we estimatethe model presented in Table A1 distinguishing between unanimous and majority vote admission to the short list, thisdummy is significant only in the latter case.29 While not required by official regulations, the Committee adopted the following procedure. Each commissioner markedeach part of the interview in a range [0,5]; then the marks of each commissioner were standardised and then summedacross commissioners. The final score represents the variable ORAL used in the following regressions.30 There are 22.7% of the nominee who hold two degrees (a PhD from an Italian university and a PhD from a foreignuniversity), whereas only 6.8% of the nominees do not possess any postgraduate degree.

11
EconLit citations (which include some Italian journals and articles in collective volumes published inEnglish), we get an average of 4.6 citations (in an interval between 0 and 16). The teaching experienceof the nominees is consistent, since on average they had already taught at least four courses. But thegreatest differences between the group of nominees against the non-nominees is recorded with respectto the evaluation of the interview: in a range of [-33, +33], the nominees had an average score of 6.8,against an average of - 8.2 for non-nominees. When we move to maximum likelihood estimation of aprobit model, we find again that the contribution in probability of publishing an article is increasing inthe ranking of the journal (see Table 9 which reproduces the last column of Table A2 in Appendix 2).An article published in the top 10 foreign journals entails a probability increase in the order of 0.81,whereas the coefficient drops to 0.67 for a journal in range 11-50, and even to 0.57 for range 51-125.The highest contribution is associated with publishing a volume with a leading foreign publisher(probability contribution equal to 1.62, which is threefold the probability contribution obtained by avolume published by non primary Italian publishers).
[Insert Tables 8 and 9 about here]
Once all candidates’ scientific productivity is controlled for by multivariate analysis, we find evidenceof favourable treatment for candidates from southern universities. The counterpart is a negativepremium for outsiders from the Italian Academy, but it masks a more favourable attitude towardscandidate coming from universities with vacancies (see 2nd column of Table A2). When we control forthis effect (inserting the LOCAL dummy variable from the 3rd column onward of Table A2), thedrawback for outsiders becomes statistically non-significant. Both variables controlling for“networking effects” are significant: coming from a university that declared a vacancy ensures aprobability gain in the order of 0.79, and an additional gain in probability of 0.41 is ensured by comingfrom the same university as one of the commissioners. This effect, however, is not as statisticallysignificant as many of the others, the p-value being equal to 0,07). However, a great contribution isalso assured by the quality of the interview; introducing the ORAL variable improves the estimates,raising the pseudo R² from 0.25 to 0.53 (4th column of Table A2). The magnitude of this effect israther large: being judged by each commissioner 2 points above the average (thus obtaining 18additional points) implies a probability 1 of being appointed. Finally, holding a PhD degree andteaching experience reveal significant determinants in predicting the outcome of the second stage ofselection (5th and 6th columns of Table A2 – last three coefficients reported in Table 9).
One may wonder about the coherence of the criteria adopted in the two stages of selection, orwhether they represent two independent stages of a process. Re-estimating the model of Table 9 forcomparison reasons,31 in Table 10 we can contrast the probability contributions of observablecharacteristics. When moving from the first stage (being short-listed) to the second one (being appointed),we notice a decline in the contribution of scientific productivity published in foreign journals and/orwith foreign publishers, and an increase of importance of publishing in indigenous locations (articles incollected papers edited in Italy, volumes with secondary Italian publishers). An analogous trend isobservable with postgraduate degrees, where holding an Italian PhD in the second stage almost equalsthe advantage assured by a foreign PhD. In addition, in the second stage we see a raising importancefor coming from a Southern University and/or from a University with vacant position in thecompetition. Thus, our impression is that the two stages are rather different when examining theselection criteria inferred by our estimates. To support this claim, we consider the estimatedprobabilities inferred from the last columns of Tables A1 and A2. Identical criteria in the two stages ofselection would yield a rank-correlation coefficient close to one, whereas its measure is 0.44 (108observations). This is evident when we graph these probabilities on two axes, as done in Figure 1. 31 In the first stage of selection publishing an article in the ten top journals or a volume with a primary foreign publishersperfectly predicts admission, and we were forced to combine each category with the next one in order not to reduce thenumber of observations. The same procedure had to be adopted in estimating the second stage of selection to make themcomparable.

12
Identical criteria would have led all observations to line up perfectly on a 45 degree line, sincecandidates more likely to enter the short list would also more likely to be appointed. In addition, weshould observe the “diamonds” (a ² indicates a nominee) grouped in the north-eastern part of thediagram, whereas the “circles” (a ¡ indicates a short-listed candidate that subsequently has not beenappointed) should gather in the south-western portion. In fact let us consider an hypothetical casewhere the same selecting device is applied twice, the first time to short-list the candidates, and asecond time to appoint some of them. In this case, the second stage of selection is redundant, becausethe individual obtaining the highest score during the first stage remains highest during the second stageand obtains appointment. Also the second highest candidate retains the same ranking, and getsappointment, and so on. On the contrary, when the selecting device is modified from the first to thesecond stage, being short-listed by a wide margin does not imply an equally high likelihood ofappointment. . In fact, the data show some clustering in the north-eastern region of the graph (bestcandidates at both stages of selection), but there are other candidates with a low probability of enteringthe short list who were subsequently appointed (possibly thanks to a good quality interview).Symmetric considerations apply to candidates clustered in the north-western region (high probabilitywhen entering the short list, but failing to be appointed).
[Insert Table 10 and Figure 1 about here]
Summing up, the first stage of selection seems to have put more emphasis on publishing in prestigiousforeign journals as a dominant condition for being short listed for interview. In addition to the newinformation acquired during the interviews, the second stage balanced the weights in favour ofdomestic journals and publishers. The geographical location of vacant positions seems to have playedsome role, together with a favourable attitude towards candidates from Southern Universities.
For the sake of discussion, let us ask the following question: had the coefficients of Table 10 beenknown at least ten years in advance, what would have been the optimal strategy for a candidate aimingto become an associate professor in economics ? The answer is easy: publish at least one article in thetop 50 foreign journals32 to enter the short list, and ask your university to put up a vacant chair forappointment in the competition. By itself scientific productivity does not seem to have granted the“almost certainty” of being appointed. It appears as if the relative weights in the objective function ofthe selecting committee changed during the different stages of the competition. The advancement ofscientific research, probably dominant during the first stage of selection, was combined in the secondstage with the objectives of teaching ability and interpersonal skills, more typical of local universities.
4. Building a representative index
Analysis so far has shown us that different publications obtained different valuations by the selectingcommittee. We may conjecture if it is possible to provide a single measure of scientific productivity byappropriately weighing different categories of publications. By extension, we are also tempted toextend this approach to all observable characteristics (including postgraduate background and teachingexperience), in order to provide a first approximative ranking of all potential applicants. We are farfrom thinking that this exercise can give a global evaluation of candidates, as the second stage ofselection previously illustrated. In actual fact, teaching and arguing capabilities can be assessed onlythrough direct examination. In addition, we do not believe that recording the journal ranking canconclude the analysis of scientific production. Even if we accept the idea that the quality of an article iscorrelated with the ranking of the journal involved, there are other elements that escape this
32 Equivalently, publish one article in a foreign journal ranked between 51 and 125 and a second article in the top 5 Italianjournals. Remember that publishing in top foreign journals is more likely for scholars holding a PhD from foreignuniversities – see Table 4.

13
correlation: think of creativity, originality, knowledge of the literature, and so on.33 However the longerthis list, the more subjective the evaluation becomes. Even leaving aside differences in ideology or inschools of thought, it is quite plausible that any referee will express positive judgements whenever s/hesympathises with the research project of the author to be evaluated. However, this arbitrariness can beoffset precisely by the use of objective measures. For these reasons, we now propose to build anoverall indicator of the scientific productivity of a scholar, and we will test its discriminating ability onthe data set represented by the candidates to the competition analysed. On the basis of argumentsoffered in the next section, selection procedures based on a large number of candidates shouldarguably put some weight on “objective” (or “hard”) measures of candidates’ productivity. Thisprevents the exclusion of productive and locally unknown candidates, still leaving room forintroducing further elements of “subjective” (or “soft”) judgement. The following indices are just afirst attempt in this direction.
The observable information taken into account can be grouped into three categories:i) the highest postgraduate degree obtained;ii) published articles, classified according to the journal ranking;iii) teaching experience.We ignore other observable variables (like gender, age, and job location) in the absence of goodnormative reasons to prefer one specific type of candidate to another.
In the case of the first group, we have calibrated the weights on the impact of holding these degreesestimated in Table 10
Relative score in thesynthetic index
Relative weight asobtainable from
Table 10 *PhD in a foreign university 8 10.3PhD in a Italian University 4 6.9master 2 --BA (laurea) 1 --
* Attributing an arbitrary weight of 20 to publishing an article in a foreign journal ranked 1-10(taken as the reference category), we can re-express all the other titles in relative terms by takingthe ratio of their coefficients to the coefficient of publishing such an article. The coefficients are
averages between the two columns of Table 10.
With respect to the second group (scientific publications), previous investigation has shown theexistence of at least two distinct profiles among the candidates, one preferred by older candidates andmore centred on the internal debate of the Italian academy, and the other more outward oriented. Inaddition, we have seen that the weights attributed to different groups of publications have changedwhen passing from the first to the second stage of the selection. For both reasons, we propose twoalternative sets of weights. In one case (indicated as RANK 1) the gap between foreign and Italianjournals is limited (an article in the 10 top foreign journals weighs 2.5 articles in the 5 top Italianjournals – that is to say that an article in the American Economic Review is worth 2.5 articles in theGiornale degli Economisti), and secondary writing (like research reports, articles in minor journals,and so on) is not penalised. In the other case (indicated as RANK 2) the gap between foreign andItalian journal widens (now you need 4 articles in the Giornale degli Economisti to reach the score ofone article in the American Economic Review), and we place an asymptotic ceiling to excessiveproduction published in non primary Italian journals. It should be clear that RANK 1 tends to favour ascholar with limited experience in foreign universities, who made most (or all) of her scientific careerin the Italian academy. She may exhibit a conspicuous production in terms of quantity, but most of ithas not passed any referee control, as is the practice of most foreign journals. On the contrary, RANK2 favours candidates with some experience abroad, where they got used to aiming to publish in topjournals, compensating fewer articles with their better placement. When we compare the two sets of 33 Last, but not least, there is the problem of how to rank sectoral journals in comparison with generalist journals. Path-breaking but sector specific contributions may find it difficult to obtain an acceptance in generalist journals (which aremore often quoted, and therefore obtain higher ranking).

14
weights with the estimates obtained in the previous section (and reported in the last column), we getthe impression that the actual behaviour of the committee was closer to RANK 2 than to RANK 1.
RELATIVE SCORES TO DIFFERENT TITLES VARIABLE NAME RANK 1 RANK 2 Relative weightas obtainable
from Table 10 **article in a foreign journal ranked 1-10 P1 10 20 20.0article in a foreign journal ranked 11-50 P2 7 15 15.1article in a foreign journal ranked 51-125 P3 5 10 15.1article in a Italian journal ranked 1-5 or any other foreign journal P4 4 5 4.4article in a Italian journal ranked 6-20 P5 2 max 10* 0.6contribution to collected papers published abroad P6 3 3 2.6contribution to collected papers published at home P7 2 max 10* 1.1article published in any other Italian Journal and any other publication P8 1 max 10* -0.3volume published by a main foreign publisher M1 15 15 8.0Volume published by a main Italian publisher or any other foreign publisher M2 7.5 7.5 8.0other volumes M3 2.5 2.5 7.9
Notes: * using an exponential function like
+−
880
10n
, where n is the number of contributions, imposes a maximum floor equal to 10.
** Attributing an arbitrary weight of 20 to publishing an article in a foreign journal ranked 1-10 (taken as the reference category), we can re-express all theother titles in relative terms by taking the ratio of their coefficients to the coefficient of publishing such an article. The coefficients are averages between
the two columns of Table 10.
Finally, with respect to teaching experience it may be useful to recognise that teaching is an activitythat quickly exhibits decreasing returns. For this reason, a ceiling is imposed on the weight attributableto teaching:
15
RELATIVE SCORES Relative weight asobtainable from
Table 10 *1 course taught 2 0.92 courses taught 4 1.83 courses taught 5 2.74 courses (or more) taught 6 3.6
* Attributing an arbitrary weight of 20 to publishing an article in a foreign journal ranked 1-10 (taken as the referencecategory), we can re-express all the other titles in relative terms by taking the ratio of their coefficients to thecoefficient of publishing such an article. The coefficients are averages between the two columns of Table 10.
Using the data set illustrated in section 2, it is possible to build two scores for each candidate to thepresent competition. One score makes use of the weights proposed in RANK 1 (and by extension willretain the same name), and the other is based on RANK 2. The position of the candidates in the tworankings is rather similar, even if the second one is characterised by wider dispersion (as emerges inTable 11, reporting some descriptive statistics of the two measures).34 Looking at the south-west panelof Figure 2, we infer that both scores predict rather well the first stage of selection, since candidateswith higher scores are more likely to enter the short list. Vice versa, the scores do not help todiscriminate during the second stage of selection, as can be gathered by average and median valuesreported in bottom part of Table 11 and also by the clustering of diamonds and circles in the south-east panel of Figure 2. This is hardly surprising, since both scores are based on observablecharacteristics and do not take into account either the result of the interviews or the judgement onquality of publications based on direct reading by the commissioners. This may explain why weobserve some candidates with high scores in both ranking, who nevertheless were not appointedprofessors.
[Insert Table 11 and Figure 2 about here]
In order to test their predictive ability, we repeated probit estimates by replacing observablecharacteristics with the computed scores. The results reported in Table A3 in Appendix 2 areencouraging, especially when referred to the first stage of the selection. Looking for instance at therelative performance of RANK 2 (that put more weight on publications in foreign journals), it is able toreplace the information contained in 14 original variables with limited loss of predictive power.35 Thegoodness of fit worsens when passing to the second stage of selection, accompanied by a decline ofthe impact on probability of both scores.36 The other features of the selecting procedure carry on inthese specifications.37
5. Concluding remarks
This paper investigates the salient features of a national selection for 44 associate professorships inEconomics (discipline code P01A – Economia Politica). The selective procedure consisted of two stages,entering a short list for an interview and final appointment. Quantitative analysis has been madepossible by classifying the scientific production of each applicant in accordance with a citation ranking 34 The simple correlation index between the two scores is equal to 0.883 (s.e. 0.03), whereas the Spearman rank correlationindex is equal to 0.881.35 By comparing the pseudo R² statistics in the 5th column of Table A1 with the same statistics reported in 3rd column ofTable A3 (which are comparable specifications), we get a limited decline (from 0.638 to 0.623).36 Looking again to RANK 2, the change in probability associated to 1 point increase is 0.049 in the first stage of selection(3rd column of Table A3) and 0.026 in the second stage (4th column of Table A3).37 We find evidence of relative advantage placed on candidates from Southern Universities, relative disadvantage onoutsiders, positive premium on coming from a university opening a position or that is the job location of one of thecommissioners. The only differences with the results obtained in Table A1 and A2 concerns the age: while youngercandidates are still advantaged during the first stage, the opposite applies in the second stage estimates reported in TableA3

16
of foreign and Italian journals. Empirical results reveal that the selecting committee has placed greatweight on publishing in foreign journals as the main criterion in the first stage of selection. On thecontrary, during the second stage this criterion was compound with the evaluation of both theinterview and the mock lecture. An additional element that appears positively significant is whether acandidate comes from a university opening a new position within the present competition. Thescientific productivity of candidates being equal, the committee favoured the applicants from SouthernUniversities, whereas placing a negative premium on outsiders. We have also proposed a syntheticindex built on observable characteristics of the candidates (postgraduate studies, scientific production,teaching experience) and we have shown its predictive ability when applied to the two stages ofselection.
One may ask what is the usefulness of conducting this type of analysis. We hold it worth for two mainreasons. The first one is to provide an objective counterpart to several rumours that circulated duringand after the competition in the Italian academy, and to offer considerations that may be informativein the occasion of future selection processes. Let us consider the problem of positive discrimination.There are those who maintain that a selecting committee should take into account inequality of accessopportunities, because it places some disadvantage on a number of candidates. A typical example isrepresented by women having children at the beginning of their career. As a consequence, they haveexperienced a reduction of the time devoted to research, and when we measure their scientificproductivity some time later we find lower values than those registered for otherwise comparablecandidates. A similar case can be made for candidates from disadvantaged universities, like some ofsouthern universities. They experienced a scarcity of basic infrastructures (libraries, communicationfacilities, availability of research funds), sometimes coupled with irregular presence of teachers. It israther likely that working under these condition may reduce their productivity, especially whencompared with candidates trained in other universities. If a selecting committee wants to cope withthis type of situation it faces two alternatives: either to reserve predefined quotas in the designatedpositions or to grant some extra-premium to compensate for the initial disadvantages. This analysismakes it possible to investigate whether the actual behaviour of the committee implicitly followed oneof these practices. Ex-post we argue that this committee did not apply any type of genderdiscrimination, either positive or negative,38 whereas it did apply a positive discrimination forcandidates from southern universities. The main limitation of this exercise lies in being always an ex-post reconstruction, which cannot be used to assess actual behaviours in real time.
The other reason for this exercise consists of experimenting in quantitative measurement of scientificproduction. The possibility of introducing a common metric based on journal ranking allows thecomparison of candidates otherwise incommensurable. In addition, if we consider that this measureenjoys the property of linearity, we can imagine its adoption in other circumstances. Think ofevaluating the research activity of a single scholar or a full department as a temporal variation in asynthetic index. Alternatively, consider the case of assessing the “academic weight” of differentresearch units applying for research funds. We are perfectly aware of the puzzlement, or even theconcern, which could be triggered by this prospect in the Italian academy.39 The objections couldpoint to the fact that we cannot measure ingenuity with the number of pages or with the place ofpublication. “Sraffa would score quite low!” could be a typical quote of someone opposing thesemeasures. We agree to the idea that it is impossible to assess the scientific contribution of a scholar inan objective way. However, when we are confronted by a large-scale selection, we have to take into 38 Therefore, the two genders obtained the same chances of career advancement, thus preventing discrimination in futureperspectives. Cf. Lazear and Rosen 1990.39 Probably not only in the Italian one. The author is indebted to a referee for the suggestion of reading the first chapterof Stigler 1963 (An academic episode), and it was really enjoyable. It shows that it is almost impossible to design anincentive compatible mechanism to organise a university department. He is also indebted to PierLuigi Porta for pointingout a list of concerns, centred on the loss of research freedom entailed by the gradual but unavoidable extension ofquantitative measures in the Italian academy.

17
account the probability of errors. Borrowing the jargon of statistics, we face two types of errors: type-1 errors (rejection of true hypothesis, namely exclusion of good candidates) and type-2 errors(acceptance of false hypothesis, namely inclusion of poor quality candidates). Arguably, when a “hard”measure is adopted in a selection procedure (among many other possible criteria) it emphasisescandidates who hold high visibility and therefore it may minimises type-1 errors (namely theirpotential exclusion). Obviously, the adoption of this criterion does not prevent type-2 errors (namely,the inclusion of poor quality candidates), but in principle this cannot be avoided, provided that somesubjective judgement is involved. And from an individual point of view, a type-1 error is more seriousthan type-2 one, even if this could not be true from a social point of view.,6. Addendum: a new system for selecting professors
Almost contemporary with the conclusion of the present competition, a new selection system wasintroduced in the Italian academy by Law n.210 issued on 3/7/1998 (and the following governmentalregulation issued on 28/10/1998). The new system introduces three innovations with respect to theold procedure analysed in the present paper:a) it creates a distinction between qualification (abilitazione) and appointment (immissione in ruolo). The
selecting committee is now entitled to appoint a number of qualifications that is double the numberof vacancies (even triple during the first two years of the new law coming into force).
b) each selecting committee may decide upon a single position, and each professor may sit on acommittee not more than once a year.
c) it gives a wider freedom of choice to local universities, which can refuse to hire their professorsfrom the candidates qualified by the committee.
Along these lines, we expect a clear separation between the different phases of selecting new universityprofessors. Different objectives pursued in different phases should now become more transparent.Selecting committees, still elected within the academy, could more freely aim to the advancement ofscientific research by qualifying the best candidates in terms of publications. In their turn, localuniversities can compete to hire the most appropriate candidates in terms of presence, teaching ability,interpersonal skills and institutional commitment. The national system retains the possibility of finalsanction through a national evaluation of scientific activity that is compulsory after three years fromthe initial appointment.
By separating the different phases of selection and attributing the related responsibility to differentclasses of agents, the reform could represent a possible solution to the conflict of goals mentionedabove (and confirmed by the empirical analysis). However, an efficient separation would require aclear-cut partition of tasks, and ensure that each selecting agent works independently of the others.Quite the opposite, the new system does not prevent contamination between the different phases.Each selecting committee includes one member, out of five, appointed by the local university. Sincethe designated member does not have to gain election among peers, s/he is not accountable to therest of the academy. What about the incentives for the other four members ? They are not paid eitherdirectly or indirectly (for example obtaining some relief from teaching). Thus, their only incentive isrepresented by the possibility of qualifying a candidate of their (personal) preference. In this way, thereis substantial competition among five candidates at best. One of them would probably be in adominant position. The candidate from a local university opening a vacancy will be strongly supportedby the locally designated commissioner. This member will probably make use of the argument that theposition has been explicitly opened for her, and that the local faculty will not appoint a differentcandidate. General competition is further reduced by the constraint imposed on applicants to apply amaximum of five times a year. In this manner, potential candidates are forced to spread out amongexisting competition, after an attempt to form expectations on committee formation and existing localcandidates.
It is rather easy to form the expectation that the new system changes the effective requisites to be(almost surely) appointed as university professor. Now you need a local university to opening a ‘one’vacancy for you and a university (full) professor available to become member of a selecting committeeto support your application. Scientific production becomes a residual condition, something like a

18
minimum threshold that is necessary to overcome, but nothing more than that. Without riskingexcessive pessimism, we claim that the new system reduces the incentives for the advancement ofscientific research and for publishing in top journals. The only incentive left for research is based onreputation effect among potential commissioners. If the academy gives significant weight to scientificresearch, it will elect commissioners with similar objective functions. However, this requires eachcommissioner to pledge not to support a specific applicant. And this destroys any incentive to becomea commissioner. In our opinion, this is the fundamental contradiction of the new system. We hopethat new research along the line of the present paper will be able to disprove these pessimisticexpectations.
References
Beed, C., and C.Beed. 1996. Measuring the quality of academic journals: the case of economics. Journalof Postkeynesian Economics 18: 369-396.
Benabou, R., 1996, Equity and efficiency in human capital investment: the local connection, Review ofEconomic Studies, 63: 237-264.
Carabelli, A., Parisi D. and A.Rosselli (eds) 1999, Che genere di economista ?, Bologna: ilMulinoJohnes, G., 1997, Costs and industrial structure in contemporary British higher education, Economic
Journal 107: 727-737.Kalaitzidakis, P., Mamuneas, T.P. and T.Stengos. 1999. European economics: an analysis based on
publications in the core journals. European Economic Review 43(4-6): 1150-1168.Laband, D., and M.Piette. 1994. The relative impacts of economics journals: 1970-1990. Journal of
Economic Literature 32: 640-666.Lazear, E., and S.Rosen. 1990. Male-female wage differentials in job ladders. Journal of Labor Economics
8(1): S106-S123.Stigler, G. 1963. The intellectual and the market place and other essays. Glencoe: The Free Press

19
Tables and figuresTable 1 – Ranking of scientific journals
variable name definition journalsP1 article published in a
foreign journal ranked 1-10Amer.Econ.Rev., Brookings Pap.Econ.Act., Econometrica, J. Econ. Theory, J.Econometrics, J.Financ.Econ.,J.Polit.Econ., Quart.J.Econ., Rand J.Econ., Rev.Econ.Stud.
P2 article published in aforeign journal ranked 11-50
Ec.Theory, Ecol.Econ., Econ.Dev.Cult.Change, Econ.Hist.Rev., Econ.Journal, Economica, Eur.Econ.Rev.,Explorations Econ.Hist., Game Econ.Behav., IMF Staff papers, Ind.Lab.Relat.Rev., Ind.Rel., Inquiry-J.Health Care Org., Int.J.Game Theory, J.Appl.Econom., J.Bus.Econ.Stat., J.Devel.Econ., J.Econ.Hist.,J.Econ.Lit., J.Econ.Perspectives, J.Finance, J.Health Econ., J.Hum.Resour., J.Ind.Econ., J.Int.Bus.Stud.,J.Int.Econ., J.Labor Econ., J.Law Econ., J.Law Econ.Organ., J.Math.Econ., J.Monetary Econ., J.MoneyCredit Banking, J.Public.Econ., J.Reg.Sci., J.Risk Uncertainty, J.Urban Econ., Kyklos, OxfordBull.Econ.Statist., Work Employ.Soc., World Devel.
P3 article published in aforeign journal ranked 51-
125
Amer.J.Econ.Sociology, Appl.Econ., Australian J.Agr.Econ., BritshJ.Ind.Rel., Bus.Hist.Rev., CambridgeJ.Econ., Canadian J.Econ., Cato Journal, Defenc.Econ., Econ.Inquiry (West Econ.J.), Econ.Letters,Econ.Modelling, Econ.Record, Econometric Theory, Economic Policy, Economics & Philosophy, EnergyEcon., Hist.Polit.Econ., Int.Econ.Rev., Int.J.Ind.Organ., Int.J.Soc.Econ., Int.Lab.Rev., Int.Reg.Sci.Rev.,Int.Soc.Sci.J., J.Banking Finance, J.Common Market Stud., J.Comp.Econ., J.Devel.Stud., J.Developing Areas,J.Econ.Behav.Organ., J.Econ.Bus., J.Econ.Dynamics & Control, J.Econ.Educ., J.Econ.Issues, J.Econ.Stud.,J.Environ.Econ.Manag., J.Finan.Quant.Anal., J.Finan.Res., J.Forecasting, J.Lab.Res., J.Macroecon., J.PolicyAnal.Manage., J.PostKeynesian Econ., J.Risk.Ins., J.Transport Econ.Policy, J.World Trade, Labor Hist.,Managerial Dec.Econ., Manchest.Sch.Econ.Soc.Stud., Matekon, Mon.Lab.Rev., Nat.Tax J., Natural Res.J.,Oxford Econ.Pap., Public Choice, Public Finance Quart., Quart.Rev.Econ.Bus., Reg.Sci.Urban Econ.,Reg.Stud., Resour.Energy Econ., Rev.Black Polit.Econ., Rev.Bus.Econ.Res., Rev.Econ.Statist.,Rev.Soc.Econ., Scand.J.Econ., Sci.Society, Scottish J.Polit.Econ., Soc.Choice Welfare, Soc.Res.,Soc.Sci.Quart., Southern Econ.J., Theory & Decision, Urban Stud., Weltwirtsh.Arch., World Econ.
P4 article published in anItalian journal ranked 1-5 or
any other foreign journal
Economia Politica, Economic Notes, Giornale degli Economisti, Politica Economica, Ricerche Economiche
P5 article published in anItalian journal ranked 6-20
BNL Quart.Rev., Econ.Pol.Industriale, Economia e Lavoro, Economia Internazionale, Economia Pubblica,Labour, Lavoro e Relaz.Ind., L'Industria, Metroeconomica, Moneta e Credito, Note Economiche,Riv.Int.Sc.Ec.Comm., Riv.Int.Sc.Sociali, Riv.Politica Economica, Studi economici
P6 contribution to collectedpapers published abroad
P7 contribution to collectedpapers published at home
P8 article published in anyother Italian Journal and any
other publicationM1 volume published by a main
foreign publisherBasic Blackwell, Cambridge Univ.Press, Oxford University Press, MIT Press, North Holland
M2 volume published by a mainItalian publisher or anyother foreign publisher
CLUEB, Laterza, Mulino, NIS, Hoepli, ...Elgar, McMillan, McGraw Hill, ...
M3 other volumes

20
Table 2 – Data descriptionvariablename
allapplicants
(avg)
allapplicants(st.devt.)
allapplicants
(min)
allapplicants
(max)
women(avg)
men(avg)
youngerthan 40 yrs
(avg)
older than40 yrs(avg)
Number of cases 277 277 277 277 76 201 158 119Female FEMALE 0.274 0.447 0 1 1 0 0.259 0.294Age AGE 39.412 6.151 27 65 40.118 39.144 35.209 44.992Educational certificates: BA (laurea) T1 0.985 0.119 0 1 1 0.980 0.987 0.983 master T2 0.516 0.500 0 1 0.579 0.488 0.677 0.294 PhD in a Italian University T3 0.350 0.478 0 1 0.329 0.358 0.487 0.168 PhD in a foreign University T4 0.357 0.478 0 1 0.322 0.371 0.494 0.176Job position: associate professor or reader W5 0.036 0.187 0 1 0.000 0.050 0.051 0.017 assistant professor or lecturer (tenured) W4 0.708 0.456 0 1 0.763 0.687 0.639 0.798 assistant professor or lecturer (tenure track) W3 0.134 0.341 0 1 0.105 0.144 0.209 0.034 research department W2 0.032 0.178 0 1 0.026 0.035 0.032 0.034 other W1 0.090 0.287 0 1 0.105 0.085 0.070 0.118Job location: North NORTH 0.394 0.489 0 1 0.434 0.378 0.437 0.336 Centre CENTER 0.264 0.441 0 1 0.250 0.269 0.228 0.311 South SOUTH 0.166 0.373 0 1 0.171 0.164 0.152 0.185 Foreign university or non-academic pst. EST 0.177 0.382 0 1 0.145 0.189 0.184 0.168Teaching experience (number of taught courses) INS 3.581 4.551 0 38 3.678 3.545 2.361 5.202article in a foreign journal ranked 1-10 P1 0.043 0.252 0 3.06 0.013 0.054 0.071 0.004article in a foreign journal ranked 11-50 P2 0.149 0.411 0 2.66 0.159 0.145 0.207 0.072article in a foreign journal ranked 51-125 P3 0.297 0.612 0 4.66 0.107 0.369 0.337 0.244article in a Italian journal ranked 1-5 orany other foreign journal
P4 1.690 2.300 0 18.30 0.961 1.966 1.883 1.434
article in a Italian journal ranked 6-20 P5 4.249 3.689 0 18.32 3.669 4.468 3.741 4.923contribution to collected paperspublished abroad
P6 0.859 1.684 0 12.14 0.400 1.033 0.998 0.676
contribution to collected paperspublished at home
P7 2.127 3.222 0 21.50 1.869 2.225 1.482 2.984
article published in any other Italianjournal and any other publication
P8 5.314 4.978 0 46.26 4.941 5.455 4.438 6.477
volume published by a main foreignpublisher
M1 0.020 0.123 0 1 0.031 0.016 0.021 0.018
volume published by a main Italianpublisher or any oth. foreign publisher
M2 0.215 0.511 0 3.16 0.255 0.200 0.168 0.278
other volumes M3 0.491 0.949 0 7 0.452 0.505 0.232 0.835# occurrences in Econlit database (1997) ECONLIT 2.708 3.124 0 19 1.671 3.100 2.899 2.454
Table 3 – Data correlations (277 cases)sex age t1 t2 t3 t4 ins p1 p2 p3 p4 p5 p6 p7 p8 m1 m2 m3
sex 1.00age 0.07 1.00t1 0.07 0.01 1.00t2 0.08 -0.38 0.06 1.00t3 -0.03 -0.40 -0.04 0.17 1.00t4 -0.05 -0.34 0.09 0.30 -0.14 1.00ins 0.01 0.40 0.04 -0.17 -0.31 -0.10 1.00p1 -0.07 -0.11 0.02 -0.09 -0.03 0.19 0.13 1.00p2 0.02 -0.13 0.04 0.07 -0.01 0.33 0.09 0.23 1.00p3 -0.19 -0.14 0.06 0.11 -0.02 0.22 0.05 0.03 0.21 1.00p4 -0.20 -0.12 0.04 0.05 0.04 0.26 0.00 0.06 0.13 0.42 1.00p5 -0.10 0.13 0.07 -0.12 -0.10 0.01 0.19 0.06 -0.03 0.15 0.33 1.00p6 -0.17 -0.06 0.04 0.00 0.02 0.29 0.08 -0.01 0.11 0.20 0.40 0.22 1.00p7 -0.05 0.21 -0.02 -0.21 -0.11 -0.11 0.24 -0.09 -0.09 -0.06 0.06 0.36 0.20 1.00p8 -0.05 0.14 -0.12 -0.16 -0.06 -0.08 0.00 -0.04 -0.09 -0.02 0.16 0.29 0.13 0.33 1.00m1 0.05 -0.02 0.02 -0.04 0.04 0.11 0.00 0.09 0.06 0.03 0.08 0.04 -0.01 0.04 0.01 1.00m2 0.05 0.09 -0.01 -0.10 -0.05 0.16 0.15 0.00 0.02 0.05 0.18 0.12 0.24 0.14 0.22 -0.07 1.00m3 -0.03 0.35 -0.07 -0.31 -0.14 -0.25 0.10 -0.08 -0.12 -0.10 -0.02 0.20 -0.05 0.11 0.25 0.02 -0.07 1.00w5 -0.12 -0.04 0.02 -0.01 -0.14 0.22 0.18 0.20 0.27 0.13 0.06 0.09 0.27 -0.10 -0.12 -0.03 0.03 -0.10w4 0.08 0.17 0.06 -0.02 -0.06 -0.07 0.15 -0.12 -0.10 0.01 -0.05 0.05 -0.12 0.04 -0.05 0.10 0.00 -0.01w3 -0.05 -0.29 0.05 0.10 0.26 0.06 -0.21 0.11 0.08 -0.05 0.01 -0.1 -0.01 -0.11 -0.07 -0.06 -0.04 -0.13w2 -0.02 0.00 -0.15 -0.07 -0.05 0.03 -0.01 -0.03 -0.04 0.12 0.15 0.04 0.15 0.19 0.13 -0.03 0.18 -0.04w1 0.03 0.09 -0.07 -0.05 -0.10 -0.13 -0.09 -0.05 -0.08 -0.12 -0.07 -0.05 -0.06 0.01 0.16 -0.05 -0.09 0.25
nord 0.05 -0.09 0.10 0.04 0.08 0.08 0.08 0.06 0.17 -0.01 0.07 -0.08 0.01 0.05 0.02 0.11 0.08 -0.11centro -0.02 0.07 0.00 0.04 0.05 -0.04 -0.16 -0.08 -0.15 0.04 0.04 0.05 0 -0.02 0.03 -0.02 -0.05 -0.06
sud 0.01 0.05 0.05 0.00 -0.01 -0.13 0.1 -0.08 -0.11 -0.06 -0.19 0.05 -0.13 -0.04 -0.16 -0.07 -0.11 0.12est -0.05 -0.01 -0.18 -0.10 -0.16 0.07 -0.02 0.09 0.06 0.02 0.05 -0.01 0.1 -0.01 0.09 -0.05 0.07 0.09
Figures in bold are significant at the 5% threshold

21
Table 4 – Estimate of scientific productivityMethod: step-wise regression, with backward selection with a 0.1 probability threshold
(t-statistics in parentheses)-------------------------------------------------------------------------------Model : 1 2 3 4 5 6# obs : 277 277 277 277 277 277Depvar: p1 p2 p3 p4 p5 p6-------------------------------------------------------------------------------intcpt 0.128 0.028 0.089 -0.90 4.257 2.045 (2.98) (0.95) (1.55) (-1.34) (4.21) (4.19)
p1 0.245 -0.666 (2.65) (-1.89)
p2 0.087 0.227 (2.30) (2.81)
p3 0.086 1.105 (2.27) (5.69)
p4 0.098 0.498 0.219 (6.67) (5.83) (5.59)
p5 0.170 (5.03)
p6 -0.017 0.376 (-1.84) (4.99)
p7 -0.069 0.349 0.110 (-1.75) (5.53) (3.98)
p8 0.114 (2.68)
m2 0.389 (2.24)
m3 0.539 (2.50)
sex -0.176 (-2.34)
t2 -0.081 0.110 (-2.66) (1.67)
t3 0.336 (1.76)
t4 0.092 0.20 0.461 0.683 (2.63) (4.02) (1.80) (3.47)
w1 -0.215 1.272 -3.493 -2.208 (-2.80) (1.72) (-2.87) (-3.99)
w2 -0.233 2.218 -4.027 -1.887 (-2.32) (2.51) (-2.72) (-2.78)
w3 1.526 -3.045 -2.254 (2.21) (-2.72) (-4.28)
w4 -0.099 1.369 -2.578 -2.328 (-2.47) (2.14) (-2.50) (-4.85)
w5 0.385 (3.07)
south -0.954 1.273 (-3.08) (2.37)
est 0.123 (2.08)
-------------------------------------------------------------------------------R² 0.141 0.186 0.22 0.376 0.307 0.324===============================================================================

22
Table 5 – First stage of selection: admission to a short list (oral examination)variablename
all applicants(avg)
applicantsadmitted to oral
exams (avg)
applicants notadmitted to oral
exams (avg)
admitted/not admitted
(all)
admitted/not admitted
(women)
admitted/not admitted
(age <40)Number of cases 277 120 157 0.764 0.580 0.880Female FEMALE 0.274 0.233 0.305 0.764 --- 0.527Age AGE 39.412 38.325 40.242 0.952 1.015 1.019Educational certificates: BA (laurea) T1 0.982 0.991 0.981 1.010 1.000 1.024 master T2 0.513 0.558 0.477 1.170 0.980 0.923 PhD in a Italian University T3 0.350 0.392 0.318 1.233 1.143 0.946 PhD in a foreign University T4 0.357 0.558 0.203 2.749 2.286 2.027Job position: associate professor or reader W5 0.036 0.050 0.025 2.000 0.000 1.135 assistant professor or lecturer (tenured) W4 0.708 0.775 0.656 1.181 1.600 1.413 assistant professor or lecturer (tenure track) W3 0.134 0.125 0.140 0.893 0.000 0.649 research department W2 0.032 0.042 0.025 1.680 0.000 0.757 other W1 0.090 0.008 0.153 0.052 --- 0.000Job location: North NORTH 0.394 0.467 0.337 1.386 1.613 1.391 Centre CENTER 0.264 0.242 0.280 0.864 0.791 0.811 South SOUTH 0.166 0.167 0.165 1.012 0.762 1.342 Foreign university or non-academic pst. EST 0.177 0.125 0.216 0.579 0.381 0.432Teaching experience (number of taught courses) INS 3.581 3.892 3.343 1.164 1.309 2.072article in a foreign journal ranked 1-10 P1 0.043 0.098 0.000 ∞ ∞ ∞article in a foreign journal ranked 11-50 P2 0.149 0.315 0.021 15.00 29.76 14.855article in a foreign journal ranked 51-125 P3 0.297 0.606 0.061 9.934 2.702 6.538article in a Italian journal ranked 1-5 or anyother foreign journal
P4 1.690 2.814 0.830 3.390 2.537 2.829
article in a Italian journal ranked 6-20 P5 4.249 5.664 3.167 1.788 1.743 1.886contribution to collected papers publishedabroad
P6 0.859 1.425 0.427 3.337 2.166 2.600
contribution to collected papers publishedat home
P7 2.127 2.255 2.030 1.111 1.764 1.176
article published in any other Italianjournal and any other publication
P8 5.314 5.558 5.127 1.084 0.960 1.200
volume published by a main foreignpublisher
M1 0.020 0.046 0.000 ∞ ∞ ∞volume published by a main Italianpublisher or any other foreign publisher
M2 0.215 0.327 0.129 2.535 1.430 3.976
other volumes M3 0.491 0.445 0.525 0.848 1.184 1.801# occurrences in Econlit database (1997) ECONLIT 2.708 4.375 1.433 3.053 2.473 2.745
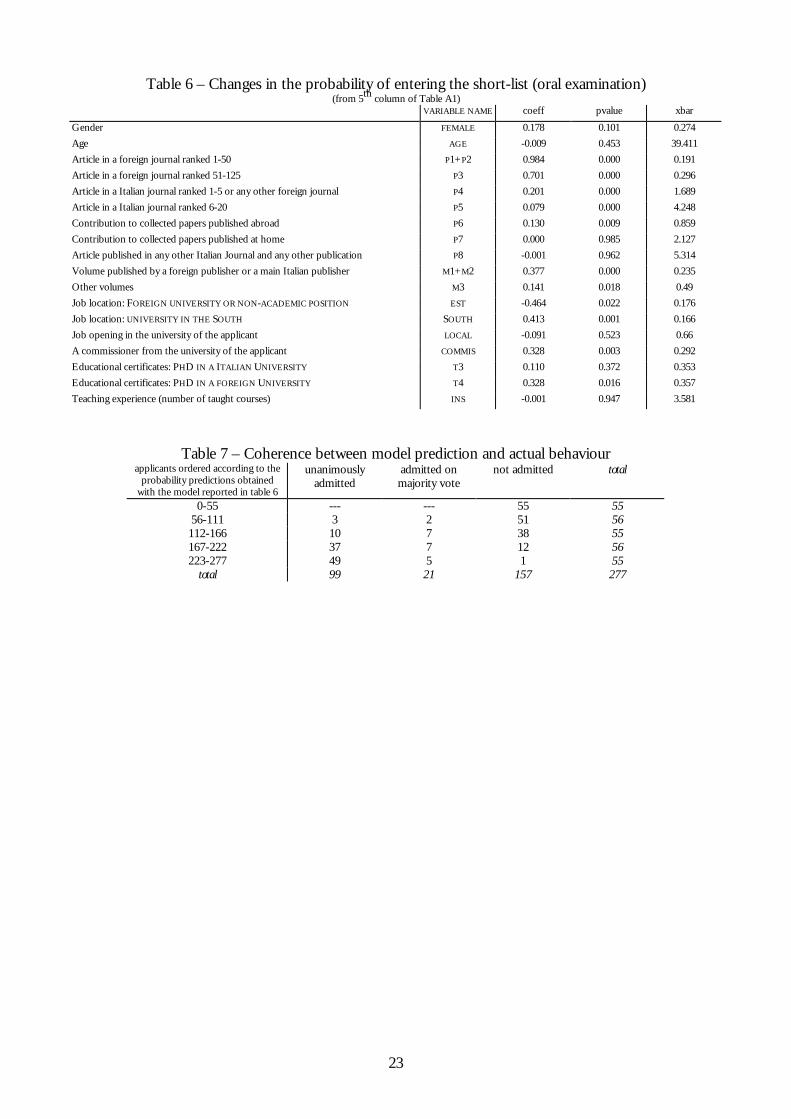
23
Table 6 – Changes in the probability of entering the short-list (oral examination)(from 5th column of Table A1)
VARIABLE NAME coeff pvalue xbar
Gender FEMALE 0.178 0.101 0.274Age AGE -0.009 0.453 39.411Article in a foreign journal ranked 1-50 P1+P2 0.984 0.000 0.191Article in a foreign journal ranked 51-125 P3 0.701 0.000 0.296Article in a Italian journal ranked 1-5 or any other foreign journal P4 0.201 0.000 1.689Article in a Italian journal ranked 6-20 P5 0.079 0.000 4.248Contribution to collected papers published abroad P6 0.130 0.009 0.859Contribution to collected papers published at home P7 0.000 0.985 2.127Article published in any other Italian Journal and any other publication P8 -0.001 0.962 5.314Volume published by a foreign publisher or a main Italian publisher M1+M2 0.377 0.000 0.235Other volumes M3 0.141 0.018 0.49Job location: FOREIGN UNIVERSITY OR NON-ACADEMIC POSITION EST -0.464 0.022 0.176Job location: UNIVERSITY IN THE SOUTH SOUTH 0.413 0.001 0.166Job opening in the university of the applicant LOCAL -0.091 0.523 0.66A commissioner from the university of the applicant COMMIS 0.328 0.003 0.292Educational certificates: PHD IN A ITALIAN UNIVERSITY T3 0.110 0.372 0.353Educational certificates: PHD IN A FOREIGN UNIVERSITY T4 0.328 0.016 0.357Teaching experience (number of taught courses) INS -0.001 0.947 3.581
Table 7 – Coherence between model prediction and actual behaviourapplicants ordered according to the
probability predictions obtainedwith the model reported in table 6
unanimouslyadmitted
admitted onmajority vote
not admitted total
0-55 --- --- 55 5556-111 3 2 51 56112-166 10 7 38 55167-222 37 7 12 56223-277 49 5 1 55
total 99 21 157 277

24
Table 8 – Second stage of selection: appointment to professorshipvariablename
applicants in theshort list who sat
the oral exam(avg)
applicantsnominatedassociate
professors ofEconomics
(discipline P01A)(avg)
applicantsnominatedassociate
professors inother economic
disciplines(avg)
applicants in theshort list who satthe oral exam but
were notnominatedprofessors
(avg)
nominee/nonnominee
(all)
nominee/nonnominee(women)
Number of cases 108* 44* 24* 46* 1.478 0.867Female FEMALE 0.259 0.227 0.125 0.326 0.586 ---Age AGE 38.527 37.955 37.833 38.935 0.974 0.957Educational certificates: BA (laurea) T1 0.991 1.000 1.000 0.978 1.022 1.000 master T2 0.574 0.523 0.583 0.587 0.952 1.484 PhD in a Italian University T3 0.407 0.523 0.292 0.348 1.311 1.154 PhD in a foreign University T4 0.556 0.614 0.542 0.478 1.230 1.154Job position: associate professor or reader W5 0.046 0.023 0.042 0.065 0.451 --- assistant professor or lecturer (tenured) W4 0.778 0.773 0.833 0.761 1.044 1.000 assistant professor or lecturer (tenure track) W3 0.130 0.159 0.083 0.130 1.015 --- research department W2 0.037 0.045 0.042 0.022 2.029 --- other W1 0.009 0.000 0.000 0.022 0.000 ---Job location: North NORTH 0.481 0.568 0.500 0.370 1.472 1.154 Centre CENTER 0.250 0.182 0.333 0.283 0.833 0.577 South SOUTH 0.167 0.159 0.083 0.217 0.609 1.154 Foreign university or non-academic pst. EST 0.102 0.091 0.083 0.130 0.676 1.154Teaching experience (number of taught courses) INS 3.953 4.523 3.188 3.598 1.126 1.062article in a foreign journal ranked 1-10 P1 0.095 0.168 0.090 0.049 2.865 0.000article in a foreign journal ranked 11-50 P2 0.289 0.448 0.256 0.166 2.290 2.025article in a foreign journal ranked 51-125 P3 0.541 0.574 1.019 0.392 1.863 1.323article in a Italian journal ranked 1-5 orany other foreign journal
P4 2.684 2.817 3.887 2.088 0.002 1.811
article in a Italian journal ranked 6-20 P5 5.812 5.052 6.843 5.700 0.997 0.721contribution to collected paperspublished abroad
P6 1.384 1.178 1.832 1.274 1.106 0.987
contribution to collected paperspublished at home
P7 2.271 2.142 2.376 2.247 0.990 0.884
article published in any other Italianjournal and any other publication
P8 5.532 4.918 6.785 5.695 0.979 0.881
volume published by a main foreignpublisher
M1 0.045 0.053 0.090 0.022 3.037 ∞volume published by a main Italianpublisher or any other foreign publisher
M2 0.342 0.358 0.211 0.350 0.874 0.148
other volumes M3 0.460 0.423 0.388 0.510 0.805 0.793
# occurrences in Econlit database (1997) ECONLIT 4.287 4.659 6.167 2.978 1.743 1.319average mark obtained during oralexamination
ORAL -0.116 6.813 3.569 -8.186 -0.717 -0.474
* The total number of cases does not coincide with results of previous Tables, since some applicants who were in the short list did not sit the oral exambecause in the meanwhile they were appointed as associate professor in other economic disciplines (like economic policy, monetary economics, development economics).Summing up, out of 120 scholars placed in the short list, 12 withdrew before the oral exam (6 of them because already nominated associated professors –their information appear in 4th column) and 108 sat the oral exam. Among this latter group, 44 were appointed associate professors in Economics, 18 wereappointed in other disciplines and the remaining 46 did not obtain any position.

25
Table 9 - Changes in the probability of being appointed to professorship(from 6th column of Table A2)
VARIABLE NAME coeff pvalue xbar
Gender FEMALE 0.246 0.291 0.278Age AGE 0.030 0.276 38.455Article in a foreign journal ranked 1-10 P1 0.809 0.093 0.107Article in a foreign journal ranked 11-50 P2 0.673 0.018 0.304Article in a foreign journal ranked 51-125 P3 0.573 0.006 0.481Article in a Italian journal ranked 1-5 or any other foreign journal P4 0.164 0.004 2.445Article in a Italian journal ranked 6-20 P5 -0.018 0.578 0.054Contribution to collected papers published abroad P6 0.075 0.301 1.227Contribution to collected papers published at home P7 0.098 0.064 2.196Article published in any other Italian Journal and any other publication P8 -0.022 0.229 5.315Volume published by a main foreign publisher M1 1.628 0.090 0.037Volume published by a main Italian publisher or any other foreign publisher M2 0.194 0.336 0.354Other volumes M3 0.555 0.005 0.467Job location: FOREIGN UNIVERSITY OR NON-ACADEMIC POSITION EST -0.505 0.355 0.111Job location: UNIVERSITY IN THE SOUTH SOUTH 0.540 0.036 0.189Job opening in the university of the applicant LOCAL 0.792 0.010 0.722A commissioner from the university of the applicant COMMIS 0.414 0.074 0.367Average mark obtained during oral examination ORAL 0.053 0.000 -0.853Educational certificates: PHD IN A ITALIAN UNIVERSITY T3 0.482 0.044 0.444Educational certificates: PHD IN A FOREIGN UNIVERSITY T4 0.546 0.074 0.544Teaching experience(number of taught courses) INS 0.077 0.062 4.05
Table 10 – Comparison between the two stages of selectionentering a short
listappointment toprofessorship
Gender 0.178 0.219Age -0.009 0.025Article in a foreign journal ranked 1-50 0.984 0.611Article in a foreign journal ranked 51-125 0.701 0.502Article in a Italian journal ranked 1-5 or any other foreign journal 0.201 0.151Article in a Italian journal ranked 6-20 0.079 -0.028Contribution to collected papers published abroad 0.130 0.077Contribution to collected papers published at home 0.000 0.089Article published in any other Italian Journal and any other publication -0.001 -0.019Volume published by a foreign publisher or a main Italian publisher 0.377 0.263Other volumes 0.141 0.492Job location: FOREIGN UNIVERSITY OR NON-ACADEMIC POSITION -0.464 -0.559Job location: UNIVERSITY IN THE SOUTH 0.413 0.532Job opening in the university of the applicant -0.091 0.707A commissioner from the university of the applicant 0.328 0.327Educational certificates: PHD IN A ITALIAN UNIVERSITY 0.110 0.437Educational certificates: PHD IN A FOREIGN UNIVERSITY 0.328 0.493Teaching experience(number of taught courses) -0.001 0.075Average mark obtained during oral examination --- 0.054
pseudo R² 0.638 0.565Coefficients in bold are significant at the 0.1 threshold.
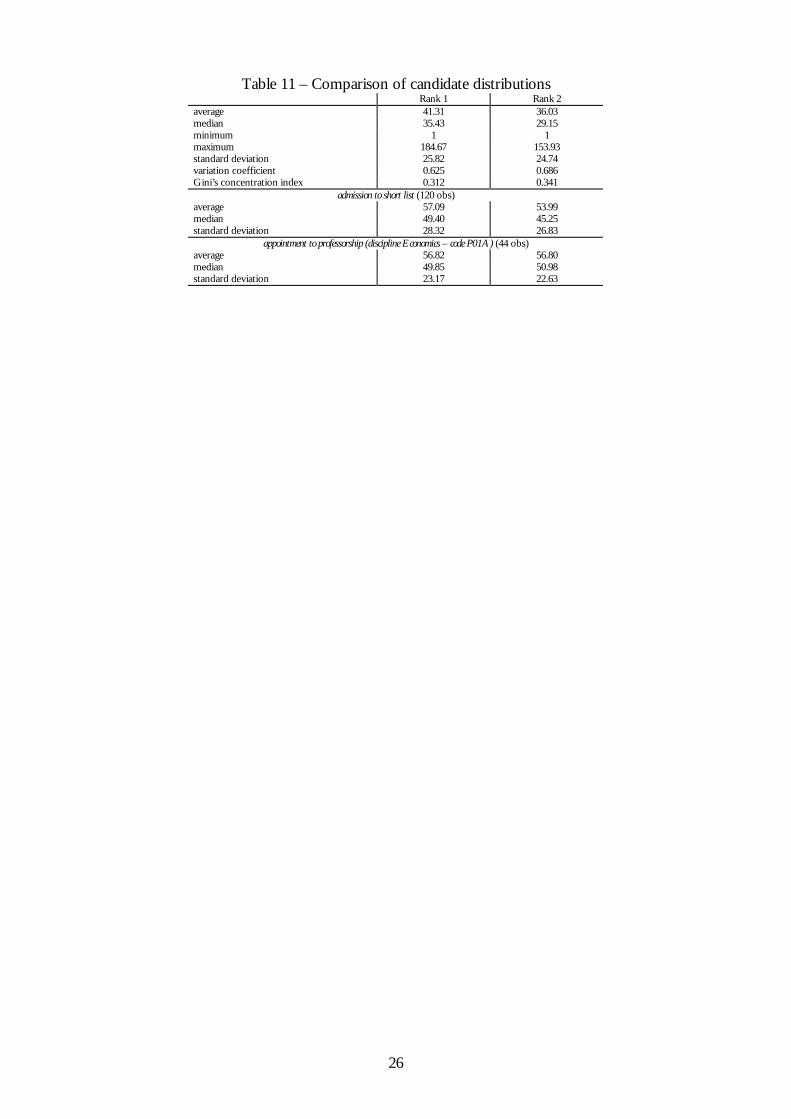
26
Table 11 – Comparison of candidate distributionsRank 1 Rank 2
average 41.31 36.03median 35.43 29.15minimum 1 1maximum 184.67 153.93standard deviation 25.82 24.74variation coefficient 0.625 0.686Gini’s concentration index 0.312 0.341
admission to short list (120 obs)average 57.09 53.99median 49.40 45.25standard deviation 28.32 26.83
appointment to professorship (discipline Economics – code P01A) (44 obs)average 56.82 56.80median 49.85 50.98standard deviation 23.17 22.63

27
pro
bability o
f adm
issio
n to o
ral exam
Figure 1 - Coherence between the two stages of selectionprobability of being nominated
admiss.oral exam non nominee nominee
3.9e-14 1
.021669
1

28
Figure 2 - Alternative rankings of the applicants
Fre
quency
Rank 10 50 100 150 200
0
10
20
30
40
Fre
quency
Rank 20 50 100 150 200
0
10
20
30
40
Rank
1
First stage of selectionRank 2
non admission to oral exam. admission to oral exam.
0 190
0
190
Rank
1
Second stage of selectionRank 2
oral exam but non nominee nominees
0 190
0
190

29
Appendix 1 – Alternative ranking of economic journals and present ranking
The following table reports alternative ranking of economic journals. The first column (from Table 1in Laband and Piette 1994) orders the journals according to the number of quotations obtained byeach journal in the same set of journals. The second column (from Table 2 in Laband and Piette 1994)weights the citations with the ranking of the journal as they appear in the first column, and repeat theprocedure until convergence. In other words, a citation is considered more relevant if it appears in ahighly quoted journal. The third column shows a (unweighed) ranking of the subset of journals thatreport to the Social Sciences Citation Index. The fourth column is the ranking utilised in the presentwork. It is obtained by excluding non-academic journals (like the Economist) or field specific journals(like Soviet Studies or Journal of Accounting Economics), and by considering an average rank between thefirst and the third column, with some exceptions. The Journal of Risk and Uncertainty and the Journal ofFinance were moved to the second group because they appear in just one list; some fate occurred to theJournal of Economic Literature and the Journal of Economic Perspectives, on the consideration that they pre-assign their articles. In their position were moved the Journal of Econometrics, the Brooking Papers onEconomic Activity, the Rand Journal of Economics and the Journal of Economic Theory. Similar changes wereintroduced in the neighbourhood of the border between the second and the third group, downgradingthe journals appearing in just one list and upgrading those appearing in both lists. Finally to update thelist, some additions were introduced in the second group (Economic Theory and International Journal ofGame Theory) and in the third one (Economic Policy, Economics and Philosophy and Theory and Decisions).
1990 Citations to ArticlesPublished 1985-1989 (table 1 in
Laband-Piette 1994 )
1990 Citations to ArticlesPublished 1985-1989 (table 2 in
Laband-Piette 1994 )
SSCI Journal Citation reportsEconomics - October 1995
Ranking utilised in the presentpaper (see Table 1)
1 J.Econ.Lit. J.Finan.Econ. Economist Econometrica 12 J.Finan.Econ. Econometrica J.Econ.Lit. J.Financ.Econ. 23 Yale Law J. J.Polit.Econ. Econometrica J.Polit.Econ. 34 Michigan Law Rev. J.Monet Econ. Quart.J.Econ. Quart.J.Econ. 45 J.Cons.Rev. Quart.J.Econ. J.Risk Uncertainty Amer.Econ.Rev. 56 Econometrica Rev.Econ.Stud. J.Polit.Econ. Rev.Econ.Stud. 67 J.Acc.Econ. Amer.Econ.Rev. J.Econ.Perspect J.Econometrics 78 J.Polit.Econ. Bell.J.Econ.(Rand J.Econ.) Sov.Econ. Brookings Pap.Econ.Act. 89 J.Amer.Statist.Assoc. J. Econ. Theory J.Financ.Econ. Rand J.Econ. 910 J.Legal Stud. J.Finance Amer.Econ.Rev. J. Econ. Theory 1011 Amer.Econ.Rev. J.Econ.Lit. Rev.Econ.Stud. J.Econ.Lit. 1112 J.Monet Econ. J.Acc.Econ. Econ.Geogr. J.Risk Uncertainty 1213 J.Bus. J.Econ.Perspectives J.Econometrics J.Econ.Perspectives 1314 J.Econ.Perspectives J.Bus. J.Account.Econ. J.Finance 1415 Bell.J.Econ.(Rand J.Econ.) J. Math. Econ. Brookings Pap.Econ.Act. J.Law Econ.Organ. 1516 Quart.J.Econ. J.Econometrics J.Environ.Econ.Manag. Ecol.Econ. 1617 J.Roy.Statist.Soc. Brookings Pap.Econ.Act. Oxford Bull.Econ.Statist. Oxford Bull.Econ.Statist. 1718 J.Finance J. Lab. Econ. J.Law Econ.Organ. J.Law Econ. 1819 Demography J. Finan. Quant. Anal. Ecol.Econ. J.Health Econ. 1920 J.Law Econ. Int. Econ. Rev. J.Health Econ. J.Monetary Econ. 2021 Rev.Econ.Stud. J.Law Econ. Rand J.Econ. J.Int.Bus.Stud. 2122 Population Devel.Rev. J. Money Credit Banking J.Law Econ. Econ.Journal 2223 J.Health Econ. J. Public. Econ. Eastern Eur.Econ. J.Labor Econ. 2324 J.Int.Bus.Stud. J.Amer.Statistic.Assoc. Econ.J. Work Employ.Soc. 2425 Oxford Bull.Econ.Statist. J. Bus. Econ. Statist. J.Labor Econ. Ind.Lab.Relat.Rev. 2526 Brookings Pap.Econ.Act. J. Int. Econ. J.Bus.Econ.Stat. J.Appl.Econom. 2627 J.Econometrics Econ.J. J.Hum.Resour. J.Hum.Resour. 2728 Econ.J. Rev.Econ.Statist. Work Employ Soc J.Money Credit Banking 2829 Ind.Lab.Relat.Rev. J.Ind.Econ. J.Econ.Theory Ind.Rel. 2930 J. Lab. Econ. J. Banking Finance Econ.Hist.Rev. J.Bus.Econ.Stat. 3031 J.Acc.Res. Int. J. Ind. Organ. Econ.Dev.Cult.Change IMF Staff papers 3132 J. Econ. Theory J. Econ. Dynamics & Control J.Appl.Econom. Econ.Hist.Rev. 3233 J. Money Credit Banking Demography Post-Sov.Aff. J.Math.Econ. 3334 Ind. Rel. J.Human Res. J.Monetary Econ. J.Ind.Econ. 3435 California Manage. Rev. Soc. Choice Welfare Indones.Econ.Stud. J.Int.Econ. 3536 J. Finan. Quant. Anal. Ind.Lab.Relat.Rev. IMF Staff papers Game Econ.Behav. 3637 J. Int. Econ. J. Econ. Educ. Land Econ. Inquiry-J.Health Care Org. 3738 J. Hum. Res. Econ. Inquiry (West Econ. J.) J.Ind.Econ. J.Public.Econ. 3839 J. Math. Econ. J.Roy.Statist.Soc. Sov.Stud. Econ.Dev.Cult.Change 3940 Econ.Geogr. Econ. Letters Tud.Econ.Soc.Ge. J.Reg.Sci. 4041 Rev.Econ.Statist. J. Econ. Hist. Eur.Econ.Rev. Economica 4142 Sloan Manage. Rev. Oxford Bull.Econ.Statist. Kyklos Explorations Econ.Hist. 4243 J.Ind.Econ. J.Acc.Res. Probl.Communism J.Urban Econ. 4344 J. Bus. Econ. Statist. Economica World Econ. World Devel. 4445 Econ. Hist. Rev. J. Finan. Res. Game Econ.Behav. J.Econ.Hist. 4546 J. Public. Econ. Explorations Econ. Hist. J.Dev.Econ. Eur.Econ.Rev. 4647 Economica J. Risk. Ins. World Dev. Kyklos 47

30
48 Inquiry-J. Health Care Org. Europ. Econ. Rev. J.Int.Econ. J.Devel.Econ. 4849 J. Reg. Sci. J. Econ. Behav. Organ. J.Econ.Hist. Ec.Theory 4950 J. Urban Econ. Scand. J. Econ. J.Financ.Quant.Anal. Int.J.Game Theory 5051 Explorations Econ. Hist. Public Choice J.Public.Econ. J.Environ.Econ.Manag. 5152 Land Econ. J. Compar. Econ. Economica J.Finan.Quant.Anal. 5253 Int. Econ. Rev. Econometric Theory Defenc.Econ. Rev.Econ.Statist. 5354 Reg. Stud. J.Legal Stud. Soc.Choice Welfare Defenc.Econ. 5455 J. Environ. Econ. Manage. J. Urban Econ. Econ.Inq. Reg.Stud. 5556 J. Forecasting J. Lab. Res. J.Urban Econ. Int.Econ.Rev. 5657 Econ. Inquiry (West Econ. J.) Public Finance Rev.Econ.Stat. Econ.Inquiry (WestEcon.J.) 5758 Amer.J.Agr.Econ. J. Devel. Econ. Int.Econ.Rev. J.Forecasting 5859 Mon. Lab. Rev. Southern Econ. J. Int.J.Ind.Organ. Mon.Lab.Rev. 5960 Soc. Sci. Quart. Cato J. New England Econ.Rev. Soc.Sci.Quart. 6061 World Devel. Canadian J. Econ. Resour.Energy Econ. Resour.Energy Econ. 6162 Oxford Econ. Pap. J.Health Econ. Am.J.Agr.Econ. Oxford Econ.Pap. 6263 Public Choice Oxford Econ. Pap. J.Comp.Econ. Int.J.Ind.Organ. 6364 J. Econ. Behav. Organ. J. Macroecon. Energ.Econ. J.Econ.Behav.Organ. 6465 J. Econ. Hist. Kyklos Economet.Theory J.Comp.Econ. 6566 Britsh J. Ind. Rel. Amer.J.Agr.Econ. Nat.Tax J. BritshJ.Ind.Rel. 6667 Econ. Devel. Cult. Change Ind. Rel. Geneva Pap.Risk.Ins. World Econ. 6768 J. Compar. Econ. Britsh J. Ind. Rel. Reg.Sci.Urban Econ. 6869 Int. J. Ind. Organ. Public Finance Quart. J.Policy Anal.Manage. 6970 Reg. Sci. Urban Econ. Manchestr Sch. Econ. Soc. Stu Soc.Choice Welfare 7071 J. Policy Anal. Manage. Population Devel.Review Soc.Res. 7172 Soc. Res. Econ. Modelling Canadian J.Econ. 7273 Canadian J. Econ. World Econ. Nat.Tax J. 7374 Europ. Econ. Rev. Appl. Econ. Southern Econ.J. 7475 Southern Econ. J. Nat. Tax J. J.Econ.Dynamics & Control 7576 J. Econ. Dynamics & Control J. Forecasting J.Lab.Res. 7677 J. Lab. Res. J.Int.Bus.Stud. Int.Reg.Sci.Rev. 7778 Int. Reg. Sci. Rev. Scottish J. Polit. Econ. Cambridge J.Econ. 7879 Cambridge J. Econ. Quart. Rev. Econ. Bus. J.Devel.Stud. 7980 J. Devel. Stud. Reg. Sci. Urban Econ. Sci.Society 8081 Kyklos Cambridge J. Econ. Scand.J.Econ. 8182 Sci. Society Econ. Devel. Cult. Change Manchest.Sch.Econ.Soc.Stud. 8283 J. Devel. Econ. Econ. Record J.Banking Finance 8384 Nat. Tax J. Mon. Lab. Rev. Public Choice 8485 Scand. J. Econ. Land Econ. Energy Econ. 8586 Manchest.Sch. Econ. Soc. Stud. Weltwirtsh. Arch. J.Finan.Res. 8687 J. Banking Finance J. Environ. Econ. Manage. Urban Stud. 8788 Soc. Choice Welfare Econ. Hist. Rev. J.Econ.Educ. 8889 J. Finan. Res. J. Econ. Stud. Weltwirtsh.Arch. 8990 Urban Stud. J. Reg. Sci. Rev.Soc.Econ. 9091 World Econ. Australian J. Agr. Econ. J.Risk.Ins. 9192 J. Econ. Educ. Bus. Hist. Rev. Econ.Modelling 9293 Weltwirtsh. Arch. Energy Econ. Econometric Theory 9394 Rev. Soc. Econ. J. Devel. Stud. J.PostKeynesian Econ. 9495 J. Risk. Ins. Int. J. Soc. Econ. J.Econ.Issues 9596 Econ. Modelling Yale Law J. J.Transport Econ.Policy 9697 J. Post Keynesian Econ. J. Common Market Stud. Public Finance Quart. 9798 J. Econ. Issues Rev. Soc. Econ. Labor Hist. 9899 J. Transport Econ. Policy J. Transport Econ. Policy J.World Trade 99100 Public Finance Quart. J. Post Keynesian Econ. J.Macroecon. 100101 Labor Hist. J. Econ. Bus. J.Common Market Stud. 101102 J. World Trade World Devel. Int.Lab.Rev. 102103 J. Macroecon. J. Econ. Issues Int.J.Soc.Econ. 103104 J. Common Market Stud. Michigan Law Rev. Econ.Letters 104105 Int. Lab. Rev. Reg. Stud. Natural Res.J. 105106 Int. J. Soc. Econ. J. Pol. Anal. Manage. Appl.Econ. 106107 Econ. Letters Hist. Polit. Econ. Cato Journal 107108 Natural Res. J. Inquiry-J. Health Care Org. J.Econ.Bus. 108109 Appl. Econ. Urban Stud. J.Developing Areas 109110 Cato J. Manager.Dec.Econ. Econ.Record 110111 Public Finance Amer. J. Econ. Sociology Scottish J.Polit.Econ. 111112 Energy Econ. California Manage. Rev. Hist.Polit.Econ. 112113 J. Econ. Bus. Int. Lab. Rev. Quart.Rev.Econ.Bus. 113114 J. Developing Areas Int. Soc. Sci. J. Bus.Hist.Rev. 114115 Econ. Record Econ.Geogr. Amer.J.Econ.Sociology 115116 Scottish J. Polit. Econ. J.Cons.Res. Rev.Black Polit.Econ. 116117 Hist. Polit. Econ. J. Developing Areas Int.Soc.Sci.J. 117118 Quart. Rev. Econ. Bus. Labor Hist. Managerial Dec.Econ. 118119 Bus. Hist. Rev. J. World Trade J.Econ.Stud. 119120 Amer. J. Econ. Sociology Sci. Society Australian J.Agr.Econ. 120121 Rev. Black Polit. Econ. Matekon Rev.Bus.Econ.Res. 121122 Int. Soc. Sci. J. Natural Res. J. Matekon 122123 Managerial Dec.Econ. Sloan Manage. Rev. Economic Policy 123124 J. Econ. Stud. Soc. Sci. Quart. Economics & Philosophy 124125 Australian J. Agr. Econ. Soc. Res. Theory & Decision 125126 Rev. Bus. Econ. Res. Rev. Black Polit. Econ.127 Econometric Theory Rev. Bus. Econ. Res.128 Matekon Int. Reg. Sci. Rev.

31

32
Appendix 2 – Probit estimates of the two stages of selection
Table A1 – Probability of admission to the short list (interview and mock lecture)
Dependent variable: AMISS (1=admitted to the short list, 0=not admitted)(t-statistics in parentheses)-------------------------------------------------------------------Model : 1 2 3 4 5# obs : 277 277 277 277 277Depvar: amiss amiss amiss amiss amiss-------------------------------------------------------------------intcpt -1.053 -1.013 -1.188 -2.935** -2.948** (-1.28) (-1.08) (-1.15) (-2.14) (-2.12)
female 0.331 0.414 0.424 0.461* 0.461* (1.37) (1.57) (1.56) (1.64) (1.64)
age -0.035* -0.051** -0.054** -0.024 -0.023 (-1.57) (-2.06) (-2.08) (-0.79) (-0.75)
p1+p2 2.331** 2.487** 2.571** 2.476** 2.481** (4.84) (4.67) (4.90) (4.46) (4.42)
p3 1.355** 1.501** 1.762** 1.767** 1.768** (5.11) (4.96) (5.36) (5.28) (5.27)
p4 0.318** 0.481** 0.50** 0.505** 0.506** (4.31) (4.94) (4.87) (4.83) (4.82)
p5 0.183** 0.190** 0.181** 0.20** 0.20** (4.60) (4.32) (4.06) (4.36) (4.36)
p6 0.315** 0.330** 0.357** 0.328** 0.328** (3.02) (2.99) (2.94) (2.63) (2.63)
p7 -0.013 0.004 -0.005 0.000 0.001 (-0.31) (0.10) (-0.11) (0.00) (0.02)
p8 -0.029 -0.006 -0.011 -0.002 -0.002 (-0.87) (-0.15) (-0.28) (-0.04) (-0.05)
m1+m2 0.736** 0.967** 1.012** 0.946** 0.951** (3.41) (4.06) (4.16) (3.83) (3.67)
m3 0.181 0.269** 0.339** 0.354** 0.355** (1.53) (1.90) (2.24) (2.36) (2.36)
est -1.683** -1.541** -1.298** -1.301** (-3.38) (-2.72) (-2.29) (-2.29)
South 0.769** 1.146** 1.239** 1.242** (2.40) (3.15) (3.22) (3.21)
local -0.299 -0.234 -0.232 (-0.84) (-0.65) (-0.64)
commis 0.955** 0.883** 0.883** (3.30) (2.93) (2.93)
t3 0.284 0.280 (0.92) (0.89)
t4 0.831** 0.827** (2.46) (2.42)
ins -0.003 (-0.07)
-------------------------------------------------------------------pseudo R² 0.528 0.59 0.621 0.637 0.638===================================================================* indicates p-value lower than 0.10** indicates p-value lower than 0.05

33
Table A2 – Probability of being appointed as associate professor of EconomicsDependent variable: VINC (1=being appointed, 0=not appointed)(t-statistics in parentheses)-------------------------------------------------------------------------------Model : 1 2 3 4 5 6# obs : 90 90 90 90 90 90Depvar: vinc vinc vinc vinc vinc vinc-------------------------------------------------------------------------------intcpt -0.039 -1.536 -3.114* -6.250** -10.40** -11.467** (-0.03) (-1.03) (-1.81) (-2.87) (-3.01) (-2.61)
female -0.139 -0.122 0.093 0.755 0.703 0.688 (-0.38) (-0.31) (0.23) (1.24) (1.07) (1.06)
age -0.018 0.001 0.000 0.042 0.106* 0.079 (-0.50) (0.04) (-0.01) (0.86) (1.67) (1.09)
p1 0.578 1.116** 1.538** 1.672** 1.948** 2.110* (1.24) (2.25) (2.63) (2.29) (2.19) (1.68)
p2 0.787** 1.310** 1.497** 1.336** 1.480** 1.754** (2.42) (3.08) (3.35) (2.62) (2.41) (2.36)
p3 0.408* 0.688** 0.903** 1.10** 1.189** 1.495** (1.76) (2.51) (2.88) (2.81) (2.66) (2.72)
p4 0.138* 0.219** 0.30** 0.334** 0.367** 0.427** (1.84) (2.47) (2.90) (2.83) (2.78) (2.86)
p5 -0.036 -0.044 -0.057 0.002 0.002 -0.048 (-0.76) (-0.85) (-0.98) (0.03) (0.02) (-0.56)
p6 -0.059 0.018 -0.056 0.225 0.202 0.194 (-0.70) (0.16) (-0.42) (1.29) (1.10) (1.03)
p7 0.069 0.117 0.147* 0.210* 0.247** 0.254* (1.10) (1.57) (1.72) (1.84) (1.98) (1.85)
p8 -0.021 -0.012 -0.011 -0.071* -0.082* -0.058 (-0.70) (-0.36) (-0.33) (-1.61) (-1.80) (-1.20)
m1 1.129 1.741* 2.758** 3.193* 3.20* 4.248* (1.28) (1.79) (2.32) (1.60) (1.69) (1.70)
m2 0.061 0.321 0.407 0.407 0.240 0.505 (0.22) (1.01) (1.21) (0.94) (0.48) (0.96)
m3 0.185 0.176 0.432* 0.991** 1.255** 1.449** (0.89) (0.80) (1.69) (2.60) (2.80) (2.83)
est -1.789** -0.917 -1.220 -1.164 -1.416 (-2.29) (-1.00) (-1.02) (-0.83) (-0.92)
South 0.608 0.855* 1.501** 1.931** 2.255** (1.36) (1.70) (2.20) (2.26) (2.10)
local 0.967* 1.684** 2.150** 2.631** (1.77) (2.48) (2.59) (2.58)
commis 0.645* 0.691 0.780 1.20* (1.63) (1.41) (1.45) (1.78)
oral 0.125** 0.133** 0.139** (4.36) (3.96) (3.55)
t3 0.911 1.377** (1.60) (2.01)
t4 1.085* 1.530* (1.62) (1.79)
ins 0.201* (1.87)
-------------------------------------------------------------------------------pseudo R² 0.145 0.206 0.253 0.529 0.560 0.592===============================================================================
* indicates p-value lower than 0.10** indicates p-value lower than 0.05

34
Table A3 – Predictive ability of synthetic indicesModel 1: placement in a short list using Rank 1Model 2: appointment to associate professorship in Economics using Rank 1Model 3: placement in a short list using Rank 2Model 4: appointment to associate professorship in Economics using Rank 2
(t-statistics in parentheses)-------------------------------------------------------Model : 1 2 3 4# obs : 277 90 277 90Depvar: amis vinc amis vinc-------------------------------------------------------intcpt 0.754 -4.260** -2.848** -7.670** (1.04) (-2.47) (-2.96) (-3.29)
female 0.305 0.052 0.469* 0.407 (1.41) (0.12) (1.78) (0.87)
age -0.091** 0.065* -0.047** 0.089** (-4.75) (1.69) (-2.37) (2.07)
rank1 0.062** 0.023** --- --- (8.72) (2.58)
rank2 --- --- 0.124** 0.067** (8.58) (3.65)
oral --- 0.109** --- 0.115** (5.02) (4.80)
est -0.948** -1.058 -1.323** -2.380** (-2.51) (-1.32) (-2.57) (-2.39)
South 0.561** 0.438 1.333** 1.370** (2.17) (0.94) (3.93) (2.23)
local -0.078 0.740 -0.241 0.952* (-0.29) (1.54) (-0.74) (1.74)
commis 0.355* 0.189 0.824** 0.512 (1.61) (0.52) (2.93) (1.22)
-------------------------------------------------------pseudo R² 0.398 0.392 0.623 0.485=======================================================* indicates p-value lower than 0.10** indicates p-value lower than 0.05