tereos - october 2021
TRANSCRIPT

TEREOS
October, 2021

Classification : Internal
DISCLAIMER
IMPORTANT: You must read the following before continuing and, in accessing such information, you agree to be bound by the following restrictions. This document was prepared by Tereos (the“Company”) for the sole purpose of the presentation of its mid term plan, and related financial projections, to banks with respect to the syndication of Tereos’ new senior facilities. You acknowledge thatyou have accepted and agreed prior to being granted access to this presentation to comply with the terms and conditions of the confidentiality agreement entered into with the Company and with thefollowing limitations and qualifications.
The information contained in this document has not been independently verified.
No representation or warranty, express or implied, is made as to, and no reliance should be placed upon, the fairness, completeness or correctness of the information or opinions contained in thisdocument and the Company, as well as its affiliates, directors, advisors, employees and representatives accept no responsibility in this respect.
This document contains certain statements that are forward-looking. These statements refer in particular to the Company’s forecasts, its expansion of operations, projections, future events, trends orobjectives which are naturally subject to risks and contingencies that may lead to actual results materially differing from those explicitly or implicitly included in these statements and generally allstatements preceded by, followed by or that include the words “believe”, “expect”, “project”, “anticipate”, “seek”, “estimate”, “should”, “could” or similar expressions. Such forward-looking statements arenot guarantees of future performance. The Company, as well as its affiliates, directors, advisors, employees and representatives, expressly disclaim any liability whatsoever for such forward-lookingstatements.
The Company does not undertake to update or revise the forward-looking statements that are presented in this document to reflect new information, future events or for any other reason and anyopinion expressed in this presentation is subject to change without notice.
This document contains information about the Company’s markets, including their size and prospects. Unless otherwise indicated, the information is based on the Company’s estimates and is providedfor information purposes only. The Company’s estimates are based on information obtained from third party sources, its customers, its suppliers, trade organizations and other stakeholders in themarkets in which the Company operates. The Company cannot guarantee that the data on which its estimates are based are accurate and exhaustive, or that its competitors define the markets in whichthey operate in the same manner.
In this document, references to “Adjusted EBITDA” corresponds to net income before income tax, the share of income from equity affiliates, net financial income, depreciation and amortization, theimpairment of goodwill, the gains resulting from acquisitions on favorable terms, and price complements. It is also restated for changes in the fair value of financial instruments, inventories, and sale andpurchase commitments, except for the portion of these items related to trading activities, fluctuations in the fair value of biological assets, the seasonal effect, and non-recurring items. The seasonaleffect corresponds to the temporary difference in the recognition of depreciation charges and price complements in the Group’s financial statements according to IFRS and the Group’s managementaccounts. Adjusted EBITDA before price complements is not a financial indicator defined as a measure of financial performance by IFRS and may not be comparable to similar indicators referred tounder the same name by other companies. Adjusted EBITDA is provided for additional information purposes and cannot be considered as a substitute for operating income or operating cash flow.
Percentages included in the following presentation may be calculated on non-rounded figures and therefore may vary from percentages calculated on rounded figures.
TEREOS PRESENTATION - OCTOBER 20212

Classification : Internal
Tereos at a glance1
3

Classification : Internal
TEREOS AT A GLANCE: A COOPERATIVE GROUP AND GLOBAL LEADER IN AGRIBUSINESS
44
KEY FACTS
#2 Sugar Global
#2 Ethanol & Alcohol Europe
#2 Sugar Brazil
#3 Starch & Sweetness Europe
#2 Wheat Protein Global
Sugar Cane Sugar Beet
23 Mt 16 Mt
Cereals,
Potatoes, Alfalfa
Cassava
WHAT WE PROCESS1
Sugar Starch Products
Alcohol & Ethanol
WHAT WE PRODUCE AND OUR END MARKETS
Food
Animal Feed
Pharmaceuticals
& Cosmetics
Paper & Cardboard
Energy
Green Chemistry
12,000COOPERATIVE MEMBERS IN FRANCE OWNING SHARE CAPITAL AND SUPPLYING RAW MATERIALS
48INDUSTRIAL FACILITIES
~23,000EMPLOYEES
Consolidated Revenues 20/21 Consolidated Adj. EBITDA 20/21 €4.3bn €465m
Sources: 1 2020/21 Figures
Classification : Internal
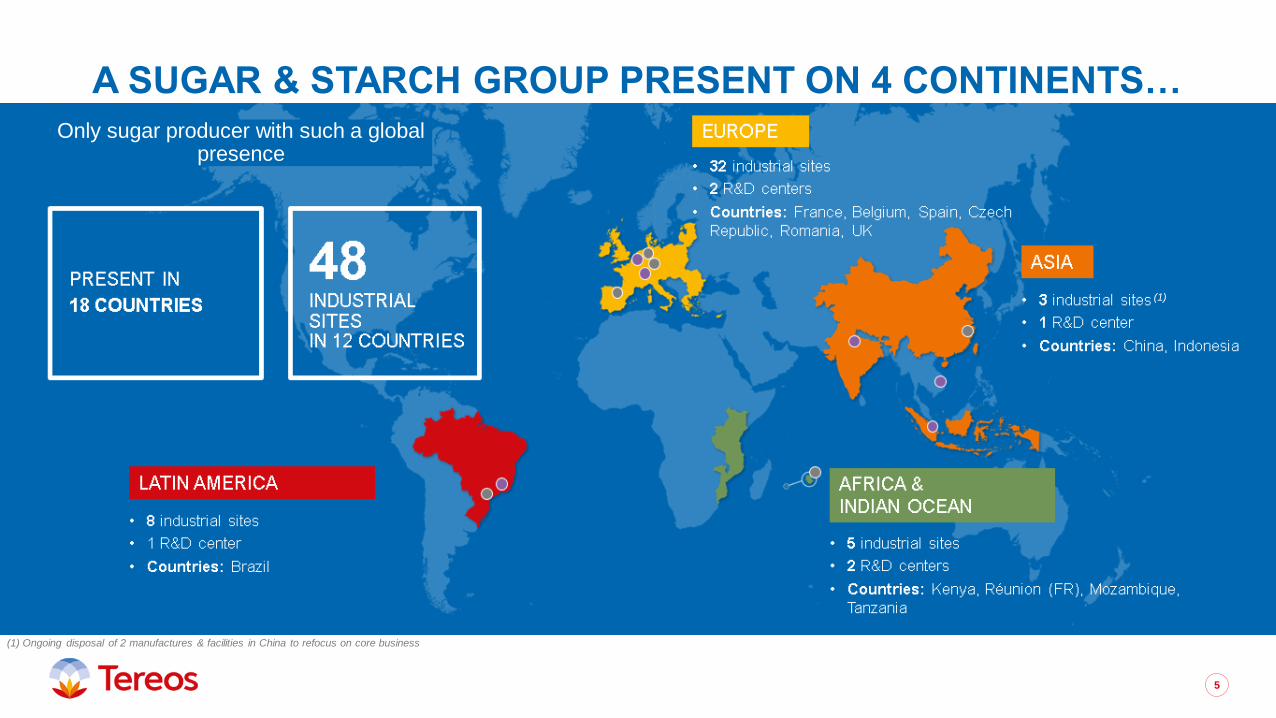
A SUGAR & STARCH GROUP PRESENT ON 4 CONTINENTS…
5
(1) Ongoing disposal of 2 manufactures & facilities in China to refocus on core business
(1)
Only sugar producer with such a global presence
Classification : Internal
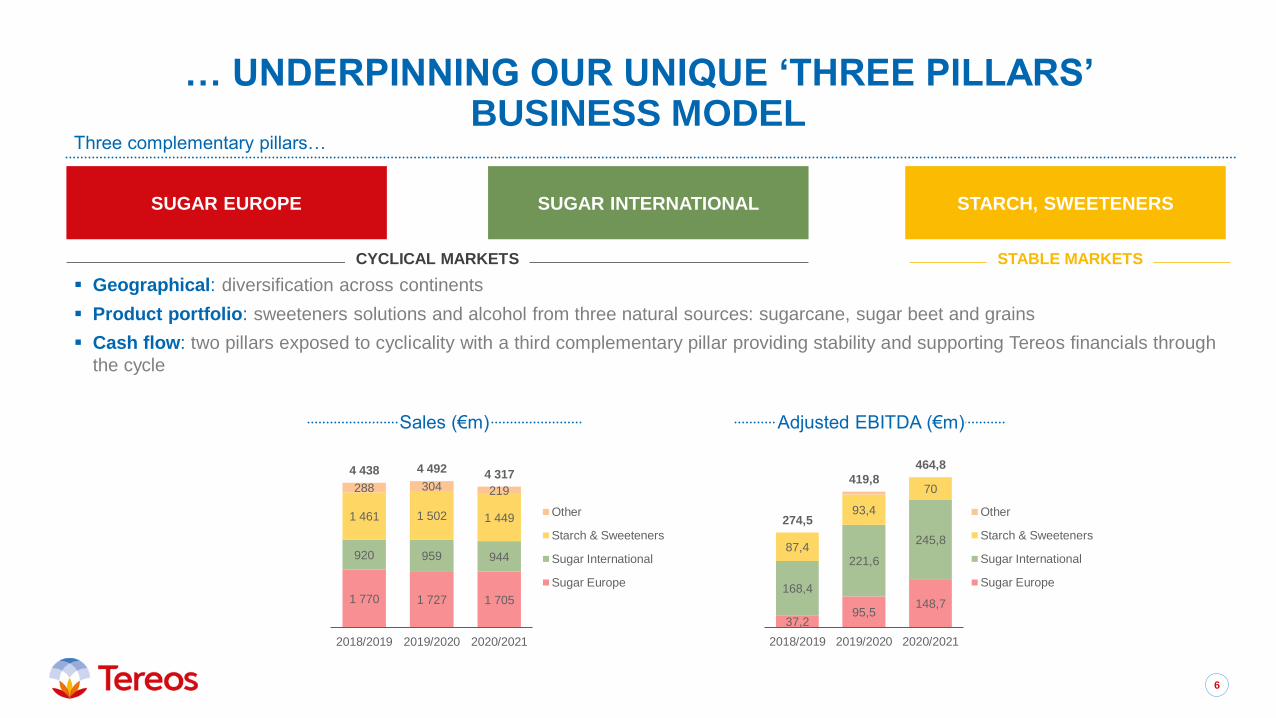
… UNDERPINNING OUR UNIQUE ‘THREE PILLARS’ BUSINESS MODEL
6
SUGAR EUROPE SUGAR INTERNATIONAL STARCH, SWEETENERS
▪ Geographical: diversification across continents
▪ Product portfolio: sweeteners solutions and alcohol from three natural sources: sugarcane, sugar beet and grains
▪ Cash flow: two pillars exposed to cyclicality with a third complementary pillar providing stability and supporting Tereos financials through
the cycle
CYCLICAL MARKETS STABLE MARKETS
Three complementary pillars…
1 770 1 727 1 705
920 959 944
1 461 1 502 1 449
288 304 219
4 438 4 492 4 317
2018/2019 2019/2020 2020/2021
Other
Starch & Sweeteners
Sugar International
Sugar Europe
37,295,5
148,7
168,4
221,6
245,887,4
93,4
70
274,5
419,8
464,8
2018/2019 2019/2020 2020/2021
Other
Starch & Sweeteners
Sugar International
Sugar Europe
Sales (€m) Adjusted EBITDA (€m)

Classification : Internal
KEY PLAYER IN THE CIRCULAR ECONOMY AT THE HEART OF CUSTOMERS’ SUSTAINABILITY AGENDA
7
our agronomy know-how
to achieve high yields
while respecting the environment
Calling upon
Guaranteeinglong-term contracts
in agricultural production
Evaluatingour practices
using external standards
Reducingthe energy consumption needed
to process raw materials
Transformingnon-edible waste
into renewable energy
Measuring & improvingour water recycling system
Transformingfibres and proteins
as part of our nutritional offer
OU
R C
OM
MIT
ME
NT
S
62%of our agricultural produce
is assessed or certified sustainable
90%
of raw materials processed
are bought direct from farmers
100%of sugarcane plants are energy
neutral during the campaign
39%of Tereos sites are certified for ISO
50001 (energy management)
48%renewable energy in the energy mix
of our industrial sites
99%of our raw materials processed are
recovered
OU
R A
CH
IEV
EM
EN
TS
7
Classification : Internal
Financial performance 2
8

Classification : Internal
KEY FINANCIALS LAST 5 YEARS
9
1 861 1 951 1 770 1 727 1 705
1 317 1 289
920 959 944
1 498 1 582
1 461 1 502 1 449
144 164
288 304 219
4 819 4 987
4 438 4 492 4 317
16/17 17/18 18/19 19/20 20/21
Sugar Europe Sugar InternationalStarch & Sweeteners Other
195 179
3796
149
310311
168
222
246
94 106
87
93
70
607 594
275
420
465
16/17 17/18 18/19 19/20 20/21
Sugar Europe Sugar International
Starch & Sweeteners Other
(229)
(42)
(92)
(26)
65
16/17 17/18 18/19 19/20 20/21
Free Cash Flow
Key Highlights:
▪ Stabilised revenues have led to a strong recovery in EBITDA reaching €465m in 2020-21 (up 11% vs 2019-20)
▪ Stark improvement in free cash flow generation over the last three years driven by profitability improvement: 10.8%
EBITDA margin in 2020/21, helping FCF return to €65m in 2020-21
Revenues (€m) FCF (€m)EBITDA (€m)

Classification : Internal
FOCUS ON 2020/21:STRONG IMPROVEMENT IN CONSOLIDATED RECURRING EBIT
Income statement 19/20 20/21
var€ m FY FY
Revenues 4,492 4,317 -175 -4%
Adj. EBITDA 420 465 +45 +11%
Adj. EBITDA Margin 9.3% 10.8% 1.4%
Depreciation / amortization -420 -380 +40
Seasonality adjustment -2 4 +6
Others 29 -2 -31
Recurring EBIT 27 86 59 +218%
EBIT 177 9 -168 -95%
Financial result -155 -128 +27 -17%
Corporate income tax -8 -21 -14
Share of profit of associates 10 8 -3
Net results 24 -133 -157
Adjusted EBITDA at €465m – +€45
million vs last year and
+€110 million excluding one-off items
Net result impacted by €76 million
impairment of assets
Recurring EBIT: strong increase as
result of improvement in sugar and
ethanol prices combined with
record volumes in Brazil +€59
million vs 19/20 (+11%); non-recurring
effects: ETEA operation (positive
impact in 19/20) and impairment of
assets (negative impact in 20/21)
10

Classification : Internal
FOCUS ON 2020/21:SUGAR & RENEWABLES EUROPE
I N C R E A S I N G E B I T D A D E S P I T E L O W E R Y I E L D S
19/20 20/21var
€ m FY FY
Volumes sold
Sugar (kt) 2,553 2,346 -207 -8%
Alcohol & Ethanol (k.m3) 629 506 -123 -19%
Revenues 1,727 1,705 -22 -1%
Adjusted EBITDA 95 149 +53 na
Adj. EBITDA Margin 5.5% 8.7% 3.2%
Recurring EBIT -30 22 +52 na
EBIT -35 22 +57 na
Stable revenues despite decrease
in volumes
In spite of reducing volumes sold,
particularly in the last quarter and
driven by negative effect of yellow
virus on sugar beet yields, revenues
were supported by sugar and ethanol
price recovery
EBITDA improvement
On top of prices’ improvement,
the positive evolution of operational
performance led to a 56% increase
in EBITDA
11

Classification : Internal
FOCUS ON 2020/21:SUGAR & RENEWABLES INTERNATIONAL
S TA B L E R E S U LT S I N T H E C O N T E X T O F B R L D E P R E C I AT I O N
19/20 20/21var
€ m FY FY
Volumes sold
Sugar (kt) 1,787 2,078 291 +16%
Alcohol & Ethanol (k.m3) 647 721 +74 +11%
Revenues 959 944 -15 -2%
Adjusted EBITDA 222 246 +24 +11%
Adj. EBITDA Margin 23.1% 26.0% +2.9%
Recurring EBIT 61 100 +39
EBIT 58 71 +13
Stable revenues despite BRL
depreciation
Brazilian real depreciated by 37%
against the euro in 2020/21 but such
effect was compensated by the
increase in volumes resulting for the
record crop in Brazil and by higher
sugar and ethanol prices
EBITDA supported by good
performance
Adjusted EBITDA driven by increase
in prices and volumes sold, combined
with cost optimization in Brazil, factors
that compensated the foreign
exchange rate effect
12
Classification : Internal
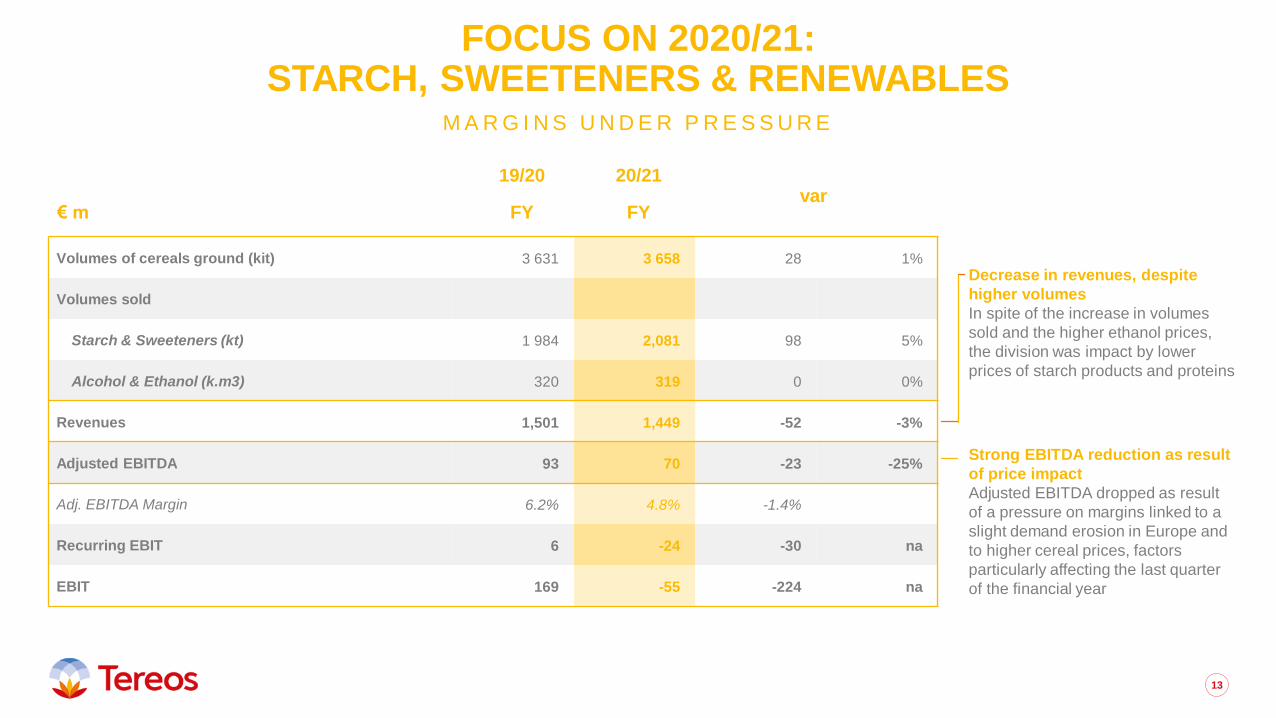
FOCUS ON 2020/21:STARCH, SWEETENERS & RENEWABLES
M A R G I N S U N D E R P R E S S U R E
19/20 20/21var
€ m FY FY
Volumes of cereals ground (kit) 3 631 3 658 28 1%
Volumes sold
Starch & Sweeteners (kt) 1 984 2,081 98 5%
Alcohol & Ethanol (k.m3) 320 319 0 0%
Revenues 1,501 1,449 -52 -3%
Adjusted EBITDA 93 70 -23 -25%
Adj. EBITDA Margin 6.2% 4.8% -1.4%
Recurring EBIT 6 -24 -30 na
EBIT 169 -55 -224 na
Strong EBITDA reduction as result
of price impact
Adjusted EBITDA dropped as result
of a pressure on margins linked to a
slight demand erosion in Europe and
to higher cereal prices, factors
particularly affecting the last quarter
of the financial year
Decrease in revenues, despite
higher volumes
In spite of the increase in volumes
sold and the higher ethanol prices,
the division was impact by lower
prices of starch products and proteins
13

Classification : Internal
POSITIVE FREE CASH FLOW GENERATION & STABLE NET DEBT
Net debt variation 19/20 20/21
€ m FY FY
Net debt (opening position) excluding IFRS16 -2,500 -2,443
Adj. EBITDA 420 465
Other operational flows -32 21
Net financial charges -152 -104
Income tax paid -2 -18
Cash Flow 234 364
Change working capital 20 73
Cash Flow from operating activities 255 437
Maintenance & Renewal -271 -243
Other CAPEX -162 -120
Financial investments -61 -8
Disposals 285 4
Dividends received 14 11
Cash Flow from (used in) investing activities -195 -356
Cash Flow after investing activities 60 81
Dividends paid & price complement -87 -20
Capital increases/other capital movements 1 4
Cash Flow from (used in) transactions relating to equity -85 -16
Free Cash-Flow -26 65
Other (incl. FOREX impact) 83 -43
Net debt excluding IFRS16 -2,443 -2,421
Impact IFRS16 -115 -112
Net debt (closing position) -2,558 -2,533
CAPEX reduction
Lower level related to the conclusion
of investments related to the previous
performance plan and to foreign
exchange rate impacts
Positive free cash-flow
Driven by EBITDA improvement,
working capital decrease and
reduction in CAPEX and financial charges
Stable net debt, despite non-cash
effects
Positive free cash-flow partially offset
by non-cash effects such as foreign
exchange rate variation and accounting
reclassifications
14

Classification : Internal
▪ Proactive management and successful refinancing in 2020/21:
▪ Sustainability-linked export finance line for USD 105m
▪ French State guaranteed loan for €230m
▪ Senior notes issued in October 2020 for €300m, maturing in 2025
▪ Renewal of Tereos SCA sustainability-linked RCF for €200m
▪ Tap of 2025 Senior notes concluded in April 2021 for €125m
▪ Prudent financial policy & new strategy focused on deleveraging
▪ Tereos France RCF refinanced in September 2021 (€390m commitment in a new sustainability-linked loan), highlighting a strong renewed
support from relationship banks
▪ Fitch revised its outlook upwards to BB- Stable from Negative (August 2021) demonstrating positive evolution of our credit story trajectory
15
Group rating B+/Stable
Bond rating B+
BB-/Stable
B+
Last change November 2019 August 2021
Group Ratings
STRONG CREDIT MOMENTUM:RESULT OF CONTINUED FOCUS ON DELEVERAGING, LIQUIDITY,
AND BALANCE SHEET MANAGEMENT

Classification : Internal
1
468
481
16
381257
373
250142
268
111
92
600
300
949
384
846 850
142
568
26 2547
Availableliquidity
2021/22 2022/23 2023/24 2024/25 2025/26 2026/27 2027/28 After
Cash & cash equiv. Undrawn facilities RCF Mid term lines Extensible short term lines Notes
▪ €468m of cash
▪ €481m of undrawn committed long-term lines
▪ Diversified sources of financing : Notes, PGE, RCF, loans
Net debt (€m) / Net leverage3 (x)
1 Pre IFRS 16 impacts and including amortized costs; 2 Notes issued in April 2021 for a principal amount of €125m, of which €62.5m being used to repaid existing debt, the remaining amount is considered in this chart as being additional cash for the
Group; 3 Excluding IFRS 16 from Mar-15 to Mar-18, Including IFRS 16 from Mar-19 to Mar-21
2,159 2,079 2,425 2,350 2,500 2,558 2,533
4.5x 4.7x4.0x 4.0x
9.1x
6.1x 5.5x
3.2x
7.7x
5.2x4.7x
-2.5
0.5
3.5
6.5
9.5
-1,000
1,000
3,000
5,000
7,000
Mar-15 Mar-16 Mar-17 Mar-18 Mar-19 Mar-20 Mar-21
Net Debt Net Leverage Net Leverage - Excl. RMI
€62.5m
debt
repaid
531
481
16
381257
311
250142
268
111
92
600
300
125
1 012
384
784850
142
693
26 2547
Availableliquidity
2021/22 2022/23 2023/24 2024/25 2025/26 2026/27 2027/28 After
Cash & cash equiv. Undrawn facilities RCF Mid term lines Extensible short term lines Notes New notes
Debt maturity schedule as of March 31, 20211 (€m)
Pro forma debt maturity schedule, incl. notes issued in April 20211,2 (€m)
16
SOUND LIQUIDITY PROFILE WITH WELL-DIVERSIFIED SOURCES OF FINANCING

Classification : Internal
390 379
160 171
343 412
7451
Q1-20/21 Q1-21/22Sugar Europe Sugar International
Starch & Sweeteners Others
Q1 2021/22 RESULTS HIGHLIGHTS
17
S L I G H T I N C R E A S E I N O P E R AT I O N A L R E S U LT S D E S P I T E Y E L L O W S V I R U S I M PA C T
▪ Turnover of €1,013 million, up 5% driven by higher sugar and alcohol/ethanol prices but impacted by poor beet crops in Europe
▪ EBITDA of €109 million, up compared to Q1 20/21 despite lower volumes sold on sugar activities and weak margins on European starch activities
▪ LTM EBITDA picks up at €479 million as of June 30 2021, compared to €465 million at end of March 2021
▪ Net debt at €2,690 million, stable compared to the same period the previous year excluding accounting effects and linked to exchange rates
4534
3949
8182
7
Q1-20/21 Q1-21/22Sugar Europe Sugar International
Starch & Sweeteners Others
2 533
2 690
Q4-20/21 Q1-21/22
Net Debt
Revenue (€m)
1 Net Debt / EBITDA 2 Readily Marketable Inventories: €346 million as end of March 2021 and €407 million as end of June 2021
+15.0%+5.0%
EBITDA (€m)
9671,013
94
109
(3)%
+20%
+7%
(24)%
123%
+24%
Var. Var.
Net debt (€m) / Net leverage1 (x)
Net leverage
Excl. RMI2
Net leverage
4.7x 4.8x
5.6x5.5x

Classification : Internal
BUSINESS OUTLOOK
• Sugar beet campaign_ Stabilized surfaces and normal plant development
• Upward pressure on sugar prices in Europe, echoing the world market_Prices expected to rise for the 2022 negotiations
• Sugarcane campaign: adverse weather conditions put pressure on yields_ Drought impact on future production
• High world prices given the expected global deficit_Despite a maxi-sugar mix in Brazil
• Soaring cereal prices_ Continuing prices' increase expected
• Progressive build-up of the new commercial strategy_ Foreseeable effects during upcoming period.
SUGAR AND
RENEWABLES
INTERNATIONAL
SUGAR AND
RENEWABLES
EUROPE
STARCH,
SWEETENERS AND
RENEWABLES
18

Classification : Internal
Strategy319

Classification : Internal
From 2021
to 2023
From 2024
BACK TO BASICSReaffirming the fundamentals
A TWO-STEP STRATEGIC PLAN…
BACK TO GROWTHSeeking out growth drivers
20

Classification : Internal
… BUILT ON 3 VALUE CREATION DRIVERS
GO FROM A VOLUME STRATEGY
TO A MARGIN STRATEGY
PRIORITIZE OUR 3 PILLARS
OF ACTIVITIES
AND DEVELOP SYNERGIES
INCREASE ASSET EFFICIENCY
STRENGTHEN: CAPEX SELECTION
PROCESS & EXPENDITURE
CONTROL
INDUSTRIAL
EXCELLENCE
COMMERCIAL
EXCELLENCE
ORGANIZATION
EFFICIENCY
Short-term Short-term Medium-term
21
Classification : Internal
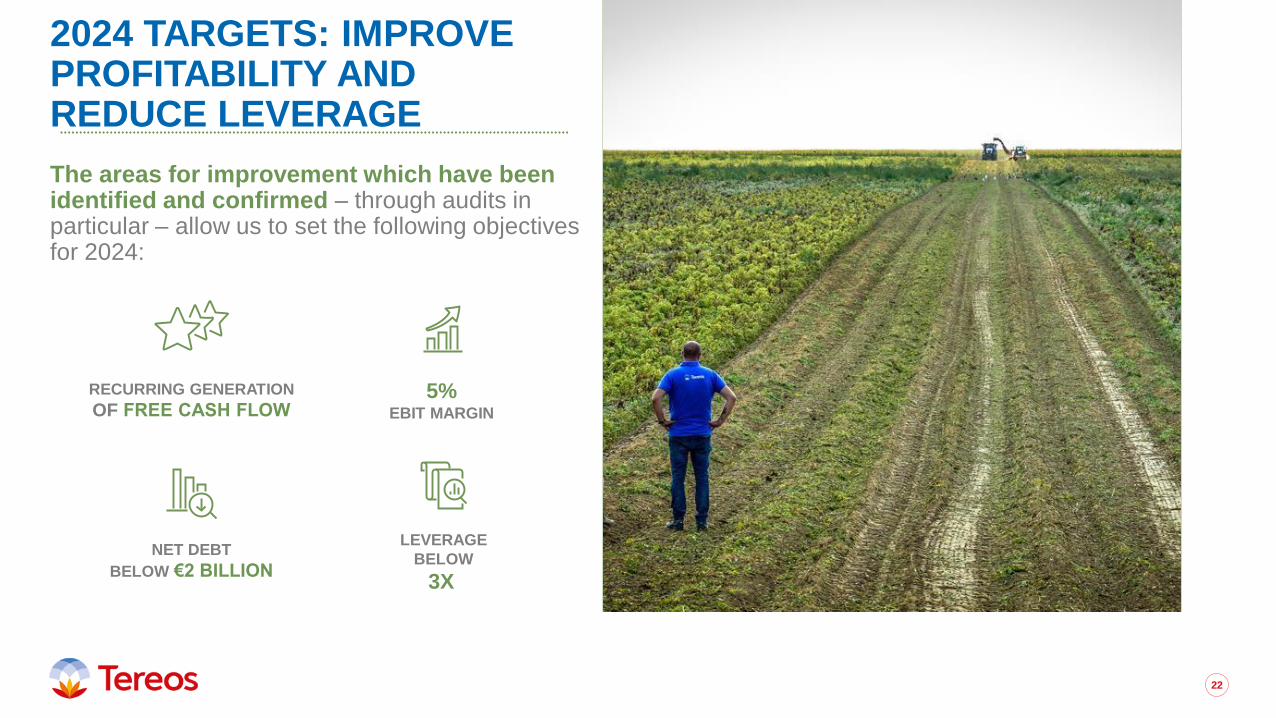
2024 TARGETS: IMPROVE PROFITABILITY AND REDUCE LEVERAGE
The areas for improvement which have been identified and confirmed – through audits in particular – allow us to set the following objectives for 2024:
RECURRING GENERATION
OF FREE CASH FLOW
LEVERAGE
BELOW
3X
NET DEBT
BELOW €2 BILLION
5% EBIT MARGIN
22
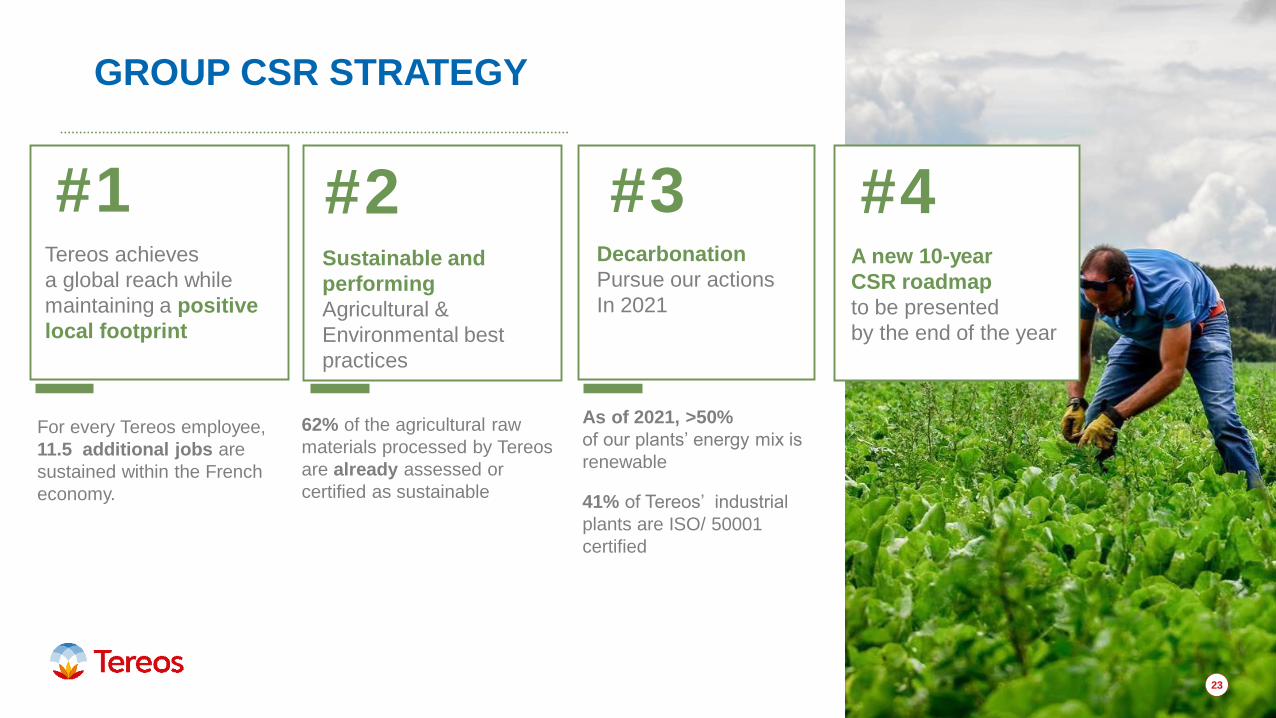
#1Tereos achieves
a global reach while
maintaining a positive
local footprint
#2Sustainable and
performing
Agricultural &
Environmental best
practices
#3Decarbonation
Pursue our actions
In 2021
GROUP CSR STRATEGY
#4A new 10-year
CSR roadmap
to be presented
by the end of the year
62% of the agricultural raw
materials processed by Tereos
are already assessed or
certified as sustainable
As of 2021, >50%
of our plants’ energy mix is
renewable
41% of Tereos’ industrial
plants are ISO/ 50001
certified
For every Tereos employee,
11.5 additional jobs are
sustained within the French
economy.
23
Appendix
24

Classification : Internal
UPDATE ON UNDERLYING MARKET TRENDS
25
SUGAR BRAZIL
▪ #1 sugar producing country; 26% of production and 54% of exports globally in 20/21 crop
▪ BRL/USD FX rate impacts world sugar prices (NY #11)
▪ Adverse weather conditions put pressure on yields, however, partly offset by high world prices
3
SUGAR EUROPE
▪ #2 largest sugar market driven by domestic trends
▪ Normalising conditions following the impact of ending quotas in 2017
▪ Supply / demand balance for 2019/20 and 2020/21 showed a deficit; same trend expected for 2021/22e
2
ETHANOL
▪ Positive momentum in fuel demand
▪ Supported by eco-friendly regulations e.g. Renovabio in Brazil and ethanol blend increase in EU
▪ Non-fuel demand growing in our core markets
4
STARCH AND SWEETENERS
▪ Demand for starches growing at 2.7% CAGR 19e-23e
▪ Demand for sweeteners growing at 2.3% CAGR 19e-23e
▪ Driven by consumption trends in Asia
5
SUGAR GLOBAL1
▪ Growing consumption (1.5% CAGR20-30e) driven by increasing population
▪ Expected deficit for 2021/22e driving high world price – the third year of deficit in a row
▪ Drawdown of stocks levels with 65% of production consumed locally

Classification : Internal
9,6 10,0 10,2 10,2
19,5 18,931,6
25,0
29,1 28,9
41,835,2
000001111111111222222222233333333334444444444555555555566666666667777777777888888888899999999991010101010101010101011111111111111111111121212121212121212121313131313131313131314141414141414141414151515151515151515151616161616161616161617171717171717171717181818181818181818181919191919191919191920202020202020202020212121212121212121212222222222222222222223232323232323232323242424242424242424242525252525252525252526262626262626262626272727272727272727272828282828282828282829292929292929292929303030303030303030303131313131313131313132323232323232323232333333333333333333333434343434343434343435353535353535353535363636363636363636363737373737373737373738383838383838383838393939393939393939394040404040404040404041414141414141414141424242424242424242424343434343434343434344444444444444444444454545454545
2018/19 2019/20 2020/21 2021/22E
Domestic demand Export demand
OUTLOOK ON SUGAR: BALANCED PRODUCTION AFTER YEARS OF SURPLUS
26
Demand driven by exports3
(Mt, SUGAR)
European market remains in balance2
(Mt, white value) 2019/20 2020/21 2021/22E
Production 16.7 14.8 16.6
Imports 2.3 2.2 2.4
Consumption 17.4 17.1 17.5
Exports 1.1 1.0 1.1
Market in deficit1
(Mt, SUGAR) Mt Unit 2019/20 2020/21 2021/22E
Australia Mt, raw value 4.3 4.3 4.3
CS Brazil Mt, tel quel 26.7 38.4 32.0
C America Mt, raw value 5.8 5.4 5.8
China Mt, white value 10.4 10.7 10.1
EU Mt, white value 16.7 14.8 16.6
India Mt, white value 27.3 31.0 32.0
NAFTA Mt, raw value 13.1 14.4 14.4
Pakistan Mt, tel quel 4.8 5.7 6.4
Russia Mt, white value 7.7 5.2 5.8
Thailand Mt, tel quel 8.1 7.4 9.1
Production from key producers expected to stabilise2
World sugar market
Brazilian sugar market European sugar market
Sources: 1 LMC World Sugar Price View, September 2021, World Balance Summary including statistical adjustment, 2 LMC World Sugar Price View presentation, September 2021, Global Balances figures given in “National crop year” of each country, i.e..
Apr-Mar for Brazil, Oct-Sep for other countries 3 LMC EU Sugar Market Monitor, September 2021, EU Sugar Balance
26
1,8
- 2,1
- 3,7
- 5,217 8
17 9
18 0
18 1
18 2
18 3
18 4
18 5
18 6
18 7
18 8
-6
-6
-5
-5
-5
-5
-5
-5
-5
-5
-5
-5
-4
-4
-4
-4
-4
-4
-4
-4
-4
-4
-3
-3
-3
-3
-3
-3
-3
-3
-3
-3
-2
-2
-2
-2
-2
-2
-2
-2
-2
-2
-1
-1
-1
-1
-1
-1
-1
-1
-1
-1
0
0
0
0
0
0
0
0
0
1
1
1
1
1
1
1
1
1
1
2
2
2
2
2
2
2
2
2018/19 2019/20 2020/21 2021/22E
Surplus / Deficit Supply Demand

Classification : Internal
Inventory in
excess
EUROPEAN SUGAR: PRODUCTION DEFICIT AND STABLE PRICES
27
Stable production expected Normalising trend in prices
EU sugar production1 EU Commission reported prices3
Mt, white sugar equivalent EUR/t
Sugar inventories in the EU2
Mt
End of quotas led to a sharp
increase in production
Stock at their lowest levelsEnd of quotas
Sources: 1 LMC EU Sugar Market Monitor, September 2021, EU Sugar Balance 2 EU Commission & Group Analysis, 3 EU Commission Price Observatory (for reported prices ex-works)
300
350
400
450
500
550
600
650
700
750
janv-09 janv-10 janv-11 janv-12 janv-13 janv-14 janv-15 janv-16 janv-17 janv-18 janv-19 janv-20 janv-21
2,0
4,0
1,9 2,2 2,41,8
2,4
1,1 1,2
10%
20%
10%
13% 13%
11%
14%
7%8%
0%
4%
8%
12%
16%
20%
24%
-
2,0
4,0
6,0
8,0
10,0
2013/14 2014/15 2015/16 2016/17 2017/18 2018/19 2019/20 2020/21E 2021/22E
Ending stocks Stock as % of consumption (RHS)
18 14 16 20 17 17 15 17 10
12
14
16
18
20
22
2014/15 2015/16 2016/17 2017/18 2018/19 2019/20 2020/21E 2021/22E

Classification : Internal
BRAZILIAN SUGAR: EXPORT DRIVEN MARKET IMPACTING GLOBAL PRICES
28
#1 worldwide producer with stable supply
Crushed sugarcane in the Center/South region of Brazil1
Large portion dedicated to export
Domestic consumption and exports in Center/South Brazil1
BRL/USD rate impacting the world sugar price
BRL/USD exchange rate2
Increasing world sugar price
World sugar price (NY11)2
MtMt
BRL/USD USD cts/lb
Sources: 1 LMC World Sugar Price View, Brazil Balance, September 2021 2 Bloomberg as of 4 October 2021
0,15
0,20
0,25
0,30
0,35
oct-15 oct-16 oct-17 oct-18 oct-19 oct-20 oct-21-
100
200
300
400
500
600
-
5,0
10,0
15,0
20,0
25,0
30,0
janv-15 janv-16 janv-17 janv-18 janv-19 janv-20 janv-21
NY#11 (USD cts/lb) LN#5 (USD/MT)
27 27 2428 29
20 19
32
25
12 1211
10 10
10 10
10
10
38 38
35
38 38
29 29
42
35
2013/14 2014/15 2015-16 2016/17 2017/18 2018/19 2019/20 2020/21 2021/22E
Export demand Domestic demand
597573
618 607 596573
590606
515
200
250
300
350
400
450
500
550
600
650
2013/14 2014/15 2015/16 2016/17 2017/18 2018/19 2019/20 2020/21 2021/22E
Classification : Internal
FAVOURABLE OUTLOOK ON ETHANOL: POSITIVE MOMENTUM DRIVEN BY FOCUS ON SUSTAINABILITY
29
Expected step up in demand
(Mm3)
Expected step up in supply
(Mm3)
7,8 7,7 7,8 7,9 8,5
00000111111111122222222223333333333444444444455555555556666666666777777777788888888889999999999
101010101010
2016 2017 2018 2019 2024e
Stable supply expected to continue
(Mm3)
6,3 6,5 6,8 7,18,8
1,5 1,6 1,6 1,7
2,17,8 8,1 8,5 8,8
10,9
00000111111111122222222223333333333444444444455555555556666666666777777777788888888889999999999
1010101010101010101011111111111111111111121212121212
2016 2017 2018 2019 2024e
European Fuel Demand European Non Fuel Demand
Strong growth in fuel and non-fuel
demand(Mm3)
European ethanol market supply2 European ethanol market demand2
Brazilian ethanol market supply1Brazilian ethanol market demand1
Sources: 1 Plano Decenal De Expansão de Energia 2030, Ministério de Minas e Energia, Empresa de Pesquisa Energética, 2021, 2 A leading market research firm29
10 11 11 10 10 10 11 11 11 11
24 25 26 28 29 30 31 32 33 35
34 36 37 38 39 40 42 43 44 46
000001111111111222222222233333333334444444444555555555566666666667777777777888888888899999999991010101010101010101011111111111111111111121212121212121212121313131313131313131314141414141414141414151515151515151515151616161616161616161617171717171717171717181818181818181818181919191919191919191920202020202020202020212121212121212121212222222222222222222223232323232323232323242424242424242424242525252525252525252526262626262626262626272727272727272727272828282828282828282829292929292929292929303030303030303030303131313131313131313132323232323232323232333333333333333333333434343434343434343435353535353535353535363636363636363636363737373737373737373738383838383838383838393939393939393939394040404040404040404041414141414141414141424242424242424242424343434343434343434344444444444444444444454545454545454545454646464646464646464647474747474747474747484848484848484848
2021e 2022e 2023e 2024e 2025e 2026e 2027e 2028e 2029e 2030e
Anhydrous Hydrous
31 33 34 35 36 37 38 40 41 43
34 36 37 38 39 40 41 43 44 46
000001111111111222222222233333333334444444444555555555566666666667777777777888888888899999999991010101010101010101011111111111111111111121212121212121212121313131313131313131314141414141414141414151515151515151515151616161616161616161617171717171717171717181818181818181818181919191919191919191920202020202020202020212121212121212121212222222222222222222223232323232323232323242424242424242424242525252525252525252526262626262626262626272727272727272727272828282828282828282829292929292929292929303030303030303030303131313131313131313132323232323232323232333333333333333333333434343434343434343435353535353535353535363636363636363636363737373737373737373738383838383838383838393939393939393939394040404040404040404041414141414141414141424242424242424242424343434343434343434344444444444444444444454545454545454545454646464646464646464647474747474747474747484848484848484848
2021e 2022e 2023e 2024e 2025e 2026e 2027e 2028e 2029e 2030e
Fuel demand Other uses Export
21
Classification : Internal
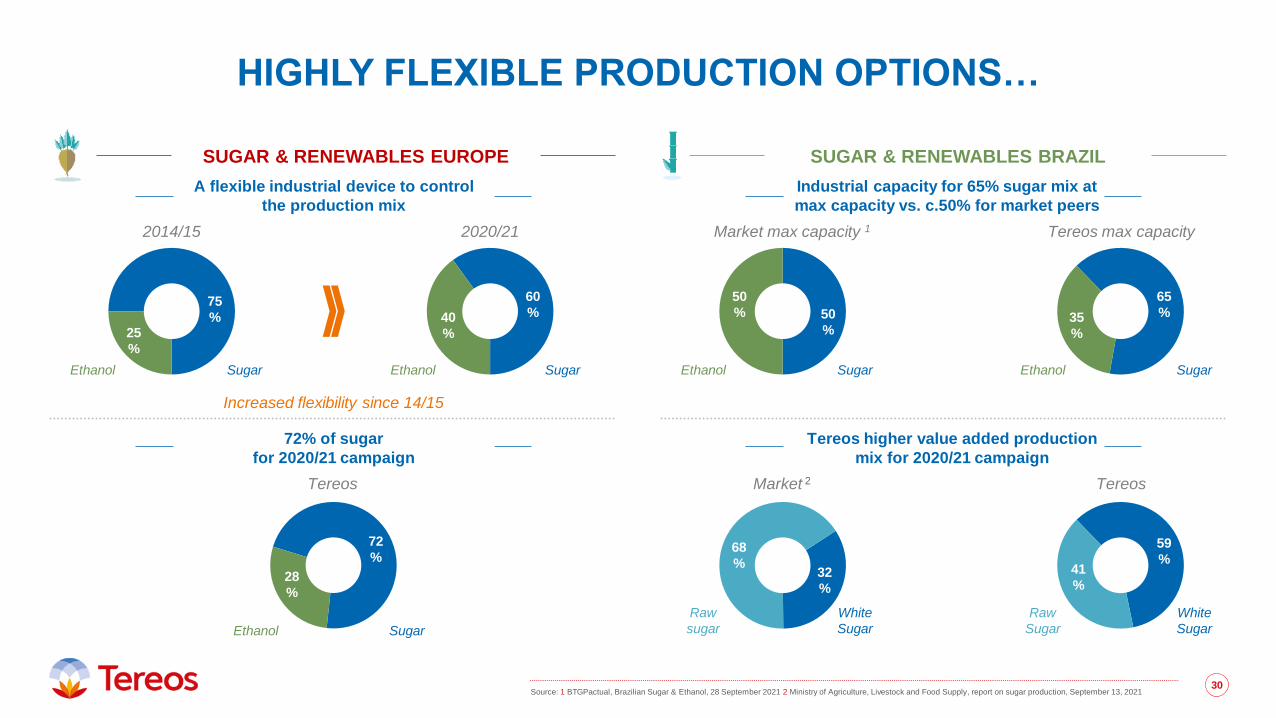
HIGHLY FLEXIBLE PRODUCTION OPTIONS…
30
SUGAR & RENEWABLES BRAZIL
A flexible industrial device to control
the production mix
Increased flexibility since 14/15
40
%
60
%
25
%
75
%
SugarEthanolSugarEthanol
72% of sugar
for 2020/21 campaign
SUGAR & RENEWABLES EUROPE
Industrial capacity for 65% sugar mix at
max capacity vs. c.50% for market peers
2014/15 2020/21
41
%
59
%68
%32
%
White
Sugar
Raw
Sugar
White
Sugar
Raw
sugar
Market 2 Tereos
Tereos higher value added production
mix for 2020/21 campaign
SugarEthanol
72
%
28
%
Market max capacity 1 Tereos max capacity
SugarEthanol SugarEthanol
35
%
65
%
50
% 50
%
Tereos
Source: 1 BTGPactual, Brazilian Sugar & Ethanol, 28 September 2021 2 Ministry of Agriculture, Livestock and Food Supply, report on sugar production, September 13, 202130

Classification : Internal
… ENSURING RESPONSIVENESS TO MARKET DEMAND…
31
7agricultural raw materials
6product families
6main markets
+ sugar beet
+ sugarcane+ paper & corrugated cardboard
+ plant chemistry & fermentation
+ pharmaceuticals & cosmetics
+ wheat
+ corn
+ potatoes
+ cassava
+ alfalfa
+ sugar & sweeteners
+ starch & derivatives
+ alcohol & ethanol
+ food and drink
+ animal feed
+ energy
Other 7%
Starch &
Sweeteners
& Protein25%
8%Co-products
40% Sugar
20% Alcohol & Ethanol
INTERCHANGEABLE
PRODUCTION AT SUGAR,
ALCOHOL AND STARCH SITES
+ protein
+ fibres and seed for animal feed
+ dietary fibres
1 Rounding effect31
2020/21 REVENUE BREAKDOWN BY PRODUCT1
Classification : Internal
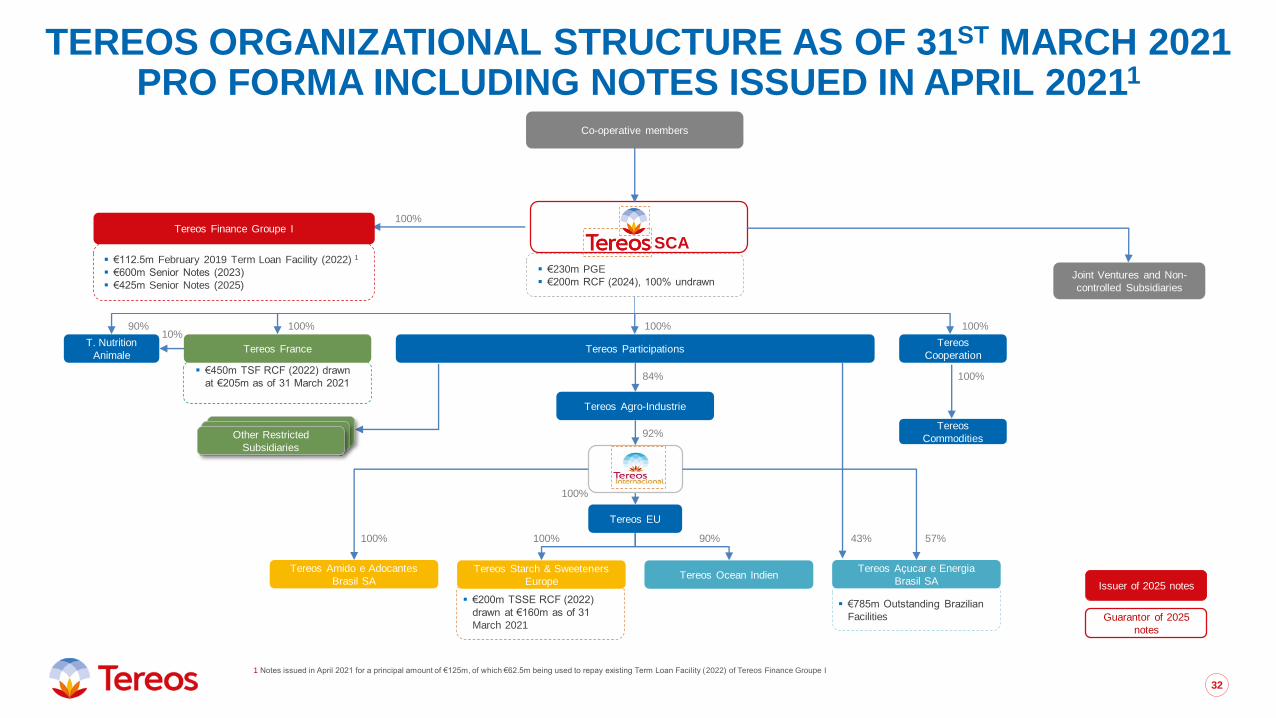
▪ €785m Outstanding Brazilian
Facilities
TEREOS ORGANIZATIONAL STRUCTURE AS OF 31ST MARCH 2021PRO FORMA INCLUDING NOTES ISSUED IN APRIL 20211
32
Issuer of 2025 notes
Guarantor of 2025
notes
▪ €200m TSSE RCF (2022)
drawn at €160m as of 31
March 2021
▪ €450m TSF RCF (2022) drawn
at €205m as of 31 March 2021
Tereos Agro-Industrie
Tereos France
100%
100%
Tereos Starch & Sweeteners
EuropeTereos Ocean Indien
T. Nutrition
Animale
Tereos Amido e Adocantes
Brasil SA
Tereos
Cooperation
Tereos
Commodities
Tereos EU
100%100%90%
92%
Tereos Participations
100% 90%
Tereos Açucar e Energia
Brasil SA
57%100%
100%
Other Restricted
Subsidiaries
84%
100%Tereos Finance Groupe I
▪ €112.5m February 2019 Term Loan Facility (2022) 1
▪ €600m Senior Notes (2023)
▪ €425m Senior Notes (2025)
▪ €230m PGE
▪ €200m RCF (2024), 100% undrawn
SCA
Joint Ventures and Non-
controlled Subsidiaries
Co-operative members
43%
100%
10%
1 Notes issued in April 2021 for a principal amount of €125m, of which €62.5m being used to repay existing Term Loan Facility (2022) of Tereos Finance Groupe I