terre consultation document - citizen spacepublic consultation document for the design of the terre...
TRANSCRIPT
Page 1 of 98
Public consultation document for the design of the TERRE
(Trans European Replacement Reserves Exchange)
Project solution
07th of March 2016 (Start of the consultation)
Page 2 of 98
Content
1 Introduction ................................................................................................. 8
1.1 Overview of the project ......................................................................8
1.2 Scope and goals of the project ............................................................9
1.3 Description of the design phase ......................................................... 10
1.4 Objectives of the document .............................................................. 10
1.5 Questions for Stakeholders ............................................................... 11
2 Overview of different manual reserves balancing markets in TERRE .......... 11
2.1 Questions for Stakeholders ............................................................... 14
3 Product & Imbalance Need ......................................................................... 14
3.1 Description of the product ................................................................ 14
3.1.1 Definition of the cross border product ..................................... 14
3.1.2 BSP-TSO & BRP-TSO rules & requirements .............................. 15
3.1.3 Format of balancing energy offers .......................................... 15
3.1.4 Unavailable offers and Central Dispatch System conversion of bids20
3.1.5 Questions for Stakeholders .................................................... 20
3.2 Imbalance Need definition and elasticity ............................................. 21
3.2.1 Imbalance need description ................................................... 21
3.2.2 Cases of pricing (examples of cases) ...................................... 22
3.2.3 Questions for Stakeholders .................................................... 22
4 Balancing CMO & Algorithm ........................................................................ 23
4.1 Explanation of the Algorithmic optimization choice ............................... 23
4.2 Description of the optimization .......................................................... 24
4.2.1 Maximizing the Social Welfare of the RR process ...................... 24
4.2.2 Volume indeterminacies ........................................................ 25
4.2.3 Flow term in the objective function ......................................... 25
4.2.4 Scheduling step constraints ................................................... 26
4.2.5 Netting method .................................................................... 26
4.2.6 Congestions ......................................................................... 26
4.2.7 Price calculation function ....................................................... 26
4.2.8 Fall-back process.................................................................. 26
4.3 Specific cases ................................................................................. 27
4.3.1 Counter-activations .............................................................. 27
4.3.2 Activation for other operational constraints .............................. 29
4.3.3 National price zones and congestions in Italy ........................... 30
4.4 Questions for Stakeholders ............................................................... 30
Page 3 of 98
5 Settlement .................................................................................................. 31
5.1 Explanation of the Marginal price choice ............................................. 31
5.2 Description of the “product settlement” (rectangle) of XB balancing energy exchanges
between TSOs ......................................................................................... 31
5.3 Definition of marginal price ............................................................... 32
5.4 Description of the calculation of Marginal price .................................... 33
5.5 Indeterminacies (Price) .................................................................... 33
5.6 Specific cases – Netting of Imbalance Needs ....................................... 34
5.7 Congestion Rents ............................................................................ 36
5.8 Questions for stakeholders ............................................................... 36
6 Cost Benefit Analysis .................................................................................. 37
6.1 Assessment Methodology ................................................................. 37
6.2 Costs ............................................................................................. 39
6.3 Benefit ........................................................................................... 40
6.3.1 Impact on BRPs ................................................................... 41
6.3.2 Impact on BSPs ................................................................... 43
6.3.3 Impact on Prices .................................................................. 47
6.3.4 TERRE Annual Benefits .......................................................... 48
6.4 Qualitative Assessment of TERRE in 2018 ........................................... 50
6.5 Conclusion ...................................................................................... 51
6.6 Questions for Stakeholders ............................................................... 52
7 Timing 52
7.1 Timeline ......................................................................................... 52
7.2 Process phases description ............................................................... 53
7.2.1 Pre-Tendering phase ............................................................. 53
7.2.2 Tendering phase .................................................................. 53
7.2.3 Clearing phase ..................................................................... 53
7.2.4 Results communication and verification ................................... 53
7.2.5 Activation Period .................................................................. 54
7.2.6 Delivery Period..................................................................... 54
7.3 XB Scheduling Step ......................................................................... 54
7.3.1 Description .......................................................................... 54
7.4 TERRE Clearing Process .................................................................... 56
7.5 Questions for Stakeholders ............................................................... 56
8 TERRE Platform - High Level Functional Architecture ................................. 57
8.1 Questions for Stakeholders ............................................................... 57
9 Available Transmission Capacity ................................................................. 58

Page 4 of 98
9.1 AC link ........................................................................................... 58
9.2 DC Links......................................................................................... 58
9.3 Questions for Stakeholders ............................................................... 58
10 Governance ................................................................................................. 59
10.1 High level description of the governance ............................................ 59
10.2 Questions for Stakeholders ............................................................... 59
11 Transparency .............................................................................................. 60
11.1 Questions for Stakeholders ............................................................... 60
12 Harmonization Issues ................................................................................. 60
12.1 Harmonization of Price Caps and Floors .............................................. 60
12.1.1 Interim Solution through Settlement ....................................... 61
12.2 Harmonization of ID markets ............................................................ 61
12.3 Questions for Stakeholders ............................................................... 62
13 Project Implementation Plan ...................................................................... 63
13.1 Description of the PIP ...................................................................... 63
13.2 Legal activities ................................................................................ 63
13.3 Approval phases .............................................................................. 64
13.4 Design activities .............................................................................. 64
13.5 Implementation activities ................................................................. 65
13.6 Questions for Stakeholders ............................................................... 65
14 Possible evolutions ..................................................................................... 65
14.1 Questions for Stakeholders ............................................................... 65
15 Glossary 66
15.1 Abbreviations .................................................................................. 66
15.2 Definitions ...................................................................................... 67
16 Summary of questions for Stakeholders ..................................................... 70
17 Annex 1: CMO - References to the GL EB..................................................... 73
17.1 Framework for Exchange Balancing Energy for Replacement Reserves ... 73
17.2 TERRE Standard product to be exchanged .......................................... 73
17.3 TERRE Fall Back process ................................................................... 73
17.4 TERRE Algorithm design options ........................................................ 73
17.5 Social Welfare Objective / Specific Cases: Counter-activation ................ 73
17.5.1 Flow term in the objective function / Congestions ..................... 74
17.5.2 One single CMO / One-stage clearing process .......................... 74

Page 5 of 98
17.5.3 Elastic Imbalance Need ......................................................... 75
17.5.4 Price calculation function TERRE - Marginal Pricing ................... 75
18 Annex 2: Congestion Rent ........................................................................... 76
18.1 References: .................................................................................... 76
18.2 Examples ....................................................................................... 76
19 Annex 3: Harmonization of Caps and Floors ................................................ 79
19.1 Conditions ...................................................................................... 79
19.2 Solution Analysis ............................................................................. 79
20 Annex 4: Italian Market specificities ........................................................... 85
21 Annex 5: CBA Assumptions ......................................................................... 86
21.1 Data Collection Assumptions ............................................................. 86
21.2 Data Conversion Assumptions ........................................................... 88
21.3 Simulation Assumptions ................................................................... 89
22 Annex 6: The Input Data for the CBA simulation ......................................... 89
22.1 TSO Imbalance Needs ...................................................................... 89
22.2 BSP Offers ...................................................................................... 91
22.3 ATC ............................................................................................... 92
23 Annex 7: Transparency Requirements ........................................................ 97

Page 6 of 98
Table of Figures
Figure 1-1: TERRE project Participants and Observers ....................................................................... 8
Figure 3-1: TERRE cross border product shape ............................................................................... 14
Figure 3-2: Divisible Offer with 60min delivery period ..................................................................... 16
Figure 3-3: Divisible Offer with 15min delivery period ..................................................................... 16
Figure 3-4: Submitted Block Offer ................................................................................................ 16
Figure 3-5: Accepted Block Offer: all or nothing ............................................................................. 16
Figure 3-6: Exclusive Offer with 4 sub-offers ................................................................................. 17
Figure 3-7: Example of a Multi-part Offer with delivery time period from H+ 15min to H+60min and three
prices ....................................................................................................................................... 18
Figure 3-8: Linking Block Offers: all 3 offers or nothing are accepted. ............................................... 19
Figure 3-9: Linking Divisible Offers: the same percentage of all 3 offers is accepted (same ratio α) ....... 19
Figure 4-1: Social Welfare of TERRE region .................................................................................... 24
Figure 4-2: Volume indeterminacies: the highest volume is accepted ................................................ 25
Figure 4-3: Counter-activations’ explanation .................................................................................. 27
Figure 4-4: Cumulative activation volumes allowing and not allowing counter-activations .................... 29
Figure 5-1: Energy volume scheduled and settled at XB level in TERRE ............................................. 32
Figure 5-2: Definition of Marginal Price ......................................................................................... 32
Figure 5-3: Indeterminacies in price: Middle point .......................................................................... 34
Figure 5-4: Settlement specific case: both elastic needs .................................................................. 34
Figure 5-5: Settlement specific case: one elastic need, one inelastic need ......................................... 35
Figure 5-6: Opportunity Price ....................................................................................................... 35
Figure 5-7: Example of Opportunity Price ...................................................................................... 36
Figure 6-1: Upwards Imbalances by Country ................................................................................. 41
Figure 6-2: Downwards Imbalances by Country ............................................................................. 42
Figure 6-3: Net BRP Imbalances and Costs .................................................................................... 43
Figure 6-4: Volume of Upwards Activations by Country ................................................................... 44
Figure 6-5: Volume of Downwards Activations by Country ............................................................... 44
Figure 6-6: Value of Upwards Activations ...................................................................................... 45
Figure 6-7: Value of Downward Activations .................................................................................... 46
Figure 6-8: Net BSP Activations and Payments by country. .............................................................. 46
Figure 6-9: Upwards Volume Weighted Average Marginal Prices ....................................................... 47
Figure 6-10: Downwards Volume Weighted Average Marginal Prices ................................................. 47
Figure 6-11: BRP Benefits of TERRE per Country ............................................................................ 48
Figure 6-12: Impact on Net BRP Costs .......................................................................................... 49
Figure 6-13: Comparison of BSP and BRP impacts .......................................................................... 49
Figure 6-14: Congestion Rents Per Direction .................................................................................. 50
Figure 7-1: TERRE Process Timeline .............................................................................................. 52

Page 7 of 98
Figure 7-2: Cross border Scheduling Step of 1 hour ........................................................................ 55
Figure 7-3: Cross border Scheduling Step of 30 hour ...................................................................... 55
Figure 7-4: Cross border Scheduling Step of 15 minutes ................................................................. 55
Figure 7-5: TERRE auction ........................................................................................................... 56
Figure 8-1: High Level Business Process ........................................................................................ 57
Figure 13-1: TERRE Project Implementation Plan ........................................................................... 63
Figure 17-1: Examples of TERRE FATs .......................................................................................... 67
Figure 20-1: Congestion Rent - Systems ....................................................................................... 76
Figure 20-2: Congestion Rent - CMO ............................................................................................. 77
Figure 20-3: Congestion Rent – ATC constraints ............................................................................. 77
Figure 20-4: Congestion Rent – Marginal Price difference ................................................................ 77
Figure 20-5: Congestion Rent ...................................................................................................... 78
Figure 21-1: Simplified merit order list .......................................................................................... 79
Figure 21-2: TSO with positive imbalance need - Example with MP<0 ............................................... 80
Figure 21-3: TSO with positive imbalance need - Results................................................................. 81
Figure 21-4: TSO with negative imbalance need - Example with MP<0 .............................................. 83
Figure 21-5: TSO with negative imbalance need - Results ............................................................... 84
Figure 22-2: Market zones in Italy ................................................................................................ 85
Figure 23-1: Mean Overall imbalance Volumes .............................................................................. 89
Figure 23-2: Total Imbalance Needs ............................................................................................ 90
Figure 23-3: Number of time steps need positive/negative ............................................................. 91
Figure 23-4: Volume/Price Mean for Upwards offers ....................................................................... 91

Page 8 of 98
1 Introduction
1.1 Overview of the project
To support the implementation of the Guideline on “Electricity Balancing”, several pilot initiatives have been
set up. TERRE (Trans European Replacement Reserve Exchange) is the pilot project validated by ENTSO-E
for cross-border Replacement Reserve (RR) exchanges.
The TERRE solution should enhance the experience of the current BALIT bilateral solution used between
NG-RTE, REE-RTE and REN-REE. The TERRE project uses the previous work of REN, REE and RTE in
developing an enduring regional solution for the exchange of balancing energy between TSOs.
The TERRE project involves several TSOs from UK to Greece. 8 European TSOs are participating in the
TERRE pilot project whilst 2 European TSOs are observers.
Participants:
ADMIE
National Grid Electricity
Transmission Plc
National Grid
Interconnectors Limited
REE
REN
RTE
Swissgrid
Terna
Observers:
EIRGRID
SONI
Figure 1-1: TERRE project Participants and Observers
At present, the TERRE project has been progressing through its design phase under the legal scope of a
Memorandum of Understanding (MoU) and Non-Disclosure Agreement (NDA).
The design phase of the project is coming to a close with this public consultation which, together with the
high level design document, will form the National Regulatory Authority (NRA) approval package. The
design phase will close with the publication of a common position paper from NRAs; analyzing the TSOs
proposal and supporting it, subject to possible requests for changes.
ADMIE is currently redesigning its local electricity market and will participate in the implementation phase
of the TERRE project as an observer only. Furthermore, ADMIE is not currently using an RR process for

Page 9 of 98
balancing energy and has decided to continue this policy in the near future. ADMIE will re-evaluate its
decision on the implementation of TERRE at a later stage after the completion of the current market reform
in Greece.
1.2 Scope and goals of the project
The scope of the project is to implement a multi-TSO coordinated exchange of Replacement Reserve -
Cross Border balancing energy with the aim of being compliant with the aims and objectives of the Guideline
on Electricity Balancing (GL EB)1. The model for the Exchange of the Balancing Service considered in this
project will be the TSO-TSO Model.
The main objective of the TERRE project is to establish and operate a platform capable of gathering all the
offers for Replacement Reserves from TSO’s local balancing markets and to provide an optimized allocation
of RR to cover the TSOs imbalance needs.
Furthermore, the target of the TERRE implementation project is to assess and test the impact of the
designed cross-border balancing solution in terms of:
Expected benefits and costs,
Potential barriers,
Needed market design changes and
IT development
The experience and knowledge gained will then contribute to the implementation, at European level, of the
target model for cross-border electricity balancing as identified in the GL EB.
The expected benefits of the TERRE project include, but are not limited to:
Enhancing the efficiency of balancing as well as the efficiency of European, regional and national
balancing markets
Integrating balancing markets and promoting the possibilities for exchanges of balancing services
while ensuring operational security
Ensuring that the procurement of balancing services is fair, objective, transparent and market-
based, avoids undue barriers to entry for new entrants, fosters the liquidity of balancing markets
while preventing undue distortions within the internal market in electricity
Facilitating the participation of demand response services (DRS) and renewable energy sources
(RES)
1 Please note that the GL EB is still in pre-Comitology process.

Page 10 of 98
1.3 Description of the design phase
The design of the TERRE solution has been built in order to be compliant with the requirements of the
implementation of TSO-TSO balancing model according to:
The Framework Guidelines on Electricity Balancing published by ACER on the 18th of September,
2012
ACER Qualified Recommendation on EB published on the 20th of July, 2015
The Guideline on Electricity Balancing (GL EB), currently under the pre-Comitology process:
The design phase started at the end of 2013 and has been organized into six Technical Working Packages,
plus one Legal and Governance Working Package. Each Technical Working Package is being led by one or
two participating TSOs. The Governance issues have been dealt with by the Legal and Governance Working
Group.
The Technical Working Packages for the project are as follows:
1. Product & Imbalance Need
2. Balancing Common Merit Order & Algorithm
3. Settlement
4. Economic Analysis
5. Timing & Scheduling
6. Available Transmission Capacity Management
1.4 Objectives of the document
The present document aims to share the results of the TERRE project design phase in order for stakeholders
to express their comments on the different design aspects.
The comments will be consolidated via a transparent consultation tool based on the results presented in
the following parts of this document.
Consultation material is available on ENTSO-E consultation platform
The consultation process starts on March 07th, 2016 and lasts for 1 month: the consultation
platform will be closed for responses on April 01st, 2016
In order to respond to the consultation, stakeholders have to take part in the Online Survey
available on ENSTO-E consultation platform. The survey has 41 open questions, linked to the
chapter of the present document. Each chapter also includes a question allowing stakeholders to
freely comment on the proposed design. The survey also includes a generic introduction question
for stakeholders to freely comment on the whole document.
After due consideration and evaluation of all comments, project partners will formally seek support for the
TERRE solution from the NRAs.
NB: Formal NRA approval will be sought under the scope of the GL EB, with the submission of the
Implementation Framework for RR, six months after its entry into force.

Page 11 of 98
1.5 Questions for Stakeholders
Q 1.1 Do you have specific comments regarding Chapter 1 content? (Please indicate sub-chap-
ter reference when possible)
2 Overview of different manual reserves balancing markets
in TERRE
The key information for RR market and related to each Member State is described in the tables below:
Table 2-1: - Key information
Spain
(RR and
mFRR)
Portugal
(RR and
mFRR)
France
(RR and
mFRR)
GB
(RR and
mFRR)
Switzerland
(RR and
mFRR)
Italy
(RR and
mFRR)
Greece
(mFRR)
Man
ual
Reserves (
En
erg
y)
Procurement
scheme
Organized
Market
Mandatory
Offers
Pre-
contracted
and
Mandatory
Offers
Pre-
contracted
and
Mandatory
Offers
Organized
Market
Mandator
y Offers
Mandatory
Provision
Implicit or
Explicit
balancing
markets
Explicit Explicit Explicit and
Implicit
Explicit and
Implicit Explicit Explicit Implicit
Min bid size 0.1MW 1MW 10MW 1MW 5MW 1MW 1MW
DSR No No Yes Yes Yes No No
Wind or solar
participation
Regulation
entered in
force on
February
2016
No No Yes Yes No No
Settlement
Rule
Marginal
Pricing
Marginal
Pricing Pay as bid Pay as bid Pay as bid
Pay as
bid
Marginal
Pricing
Divisible
Offers* Yes Yes Yes Yes No Yes Yes
Block Offers* Yes (for
RR) No No Yes (STOR) Yes
Yes
(Startup
Offers)
N/A
Exclusive
Offers* No No No No No No N/A
Linking
Offers*
Yes (for
RR) No No No No Yes N/A
Multipart
Offers* Yes Yes No Yes No No N/A

Page 12 of 98
Ne
gati
ve
Pric
es
Upward
offer No No No Yes Yes No No
Downw
ard
offer
No No Yes Yes Yes No No
Dispatch
method Self Self Self Self Self Central Central
Ramp
Settlement No No Yes Yes No Yes Yes
(*): please refer to the chapter 3.1.2
NB: For more details, please follow the ENTSO E survey link https://www.entsoe.eu/publications/market-
reports/ancillary-services-survey/Pages/default.aspx
The Table below presents the different intra-day Cross Border Market GCT for the zones covered by the
geographical scope of TERRE.

Page 13 of 98
Table 2-2: intra-day and Cross border Gate Closure Time
* = Possibility of 15’ lead-time in case of the application of special emergency contracts established
** If ID GCT have a direct impact in TERRE process?
1st Session 2nd Session 3rd Session 4th Session 5th Session 6th Session ISPMarket
Resolution
Min lead time
for changes
Impact in TERRE
Process?**
Gate Closure Time 18:45 21:45 01:45 04:45 08:45 12:45
How many perios are covered by the session 27 * 60min 24 * 60min 20 * 60min 17 * 60min 13 * 60min 9 * 60min NO
(Hourly periods covered) 21:00 - 00:00(next day) 00:00 - 00:00 04:00 - 00:00 07:00 - 00:00 11:00 - 00:00 15:00 - 00:00
Gate Closure Time 18:45 21:45 01:45 04:45 08:45 12:45
How many perios are covered by the session 27 * 60min 24 * 60min 20 * 60min 17 * 60min 13 * 60min 9 * 60min
(Hourly periods covered) 21:00 - 00:00(next day) 00:00 - 00:00 04:00 - 00:00 07:00 - 00:00 11:00 - 00:00 15:00 - 00:00
Gate Closure Time 17:30 (D-1) 12:30 (D) -- -- -- --
How many periods are covered by the session 24 * 60min 8 * 60min -- -- -- -- NO
(Hourly periods covered) 00:00 - 23:59 16:00 - 23:59 -- -- -- --
Gate Closure Time 21:00 (D-1) 3:00 (D) 8: 00 (D) 11:00 (D) 14:00 (D) 17: 00 (D)
How many periods are covered by the session 6 * 60min 5* 60min 3 * 60min 3 * 60min 3* 60min 4 * 60min NO
(Hourly periods covered) 00:00-05:59 06:00-10:59 11:00-13:59 14:00-16:59 17:00-19:59 20:00-23:59
Gate Closure Time
How many periods are covered by the session 1*30min 1*30min 1*30min 1*30min 1*30min 1*30min NO
(Hourly periods covered)
Gate Closure Time
How many periods are covered by the session NO
(Hourly periods covered)
Gate Closure Time
How many periods are covered by the session
(Hourly periods covered)
Gate Closure Time
How many periods are covered by the session NO
(Hourly periods covered)
IT-CH See TERNA case NO
Gate Closure Time
How many periods are covered by the session NO
(Hourly periods covered)
NO
Gate Closure Time
How many periods are covered by the session
(Hourly periods covered)
Gate Closure Time 17:00 12:00
How many periods are covered by the session 24*60min 9 * 60 min
(Hourly periods covered) 00:00 to 00:00 15:00 to 00:00
FR-GB NO
FR-IT NO
96 gates
96 gates
REN 60 min 60 min 135 min
NO
TERNA 15 min 60 min 195 min
60min
REE 60 min 60 min 135 min
GB-FR
GB National
NG
30 min 60 min 180 min
30 min 30min
SG
AT-CH
15 min
15min 45 min
DE-CH
FR-CH60 min
& 30min45 min
From GCT+lead time until end of the day
24 gates
15min 45min*
Every 15min
From GCT+lead time until end of the day
Every 15min
NO
CH national 15 min 15 min
Every 15min
From GCT+lead time until end of the day
96 gates
From GCT+lead time until end of the day
Every hour
ADMIE
RTE
FR-CH
30 min
60min
& 30min
See TERNA case
FR-SP
24 gates 60 min NO
Every hour
From GCT + lead time until end of the day
See NG case
60min 180 min NO

Page 14 of 98
NB: The harmonization of the local settlement rules will be tackled under the framework of the RR COBA
implementation.
2.1 Questions for Stakeholders
Q 2.1 Do you have any specific comments regarding Chapter 2 content? (Please indicate sub-
chapter reference when possible)
3 Product & Imbalance Need
3.1 Description of the product
3.1.1 Definition of the cross border product
The TERRE product will be one of the Standard Products for Replacement Reserve (RR).
Figure 3-1: TERRE cross border product shape
The TERRE basic product is a 15min scheduled block, i.e. it can be activated for a fixed quarter hour(s) at
hh: 00-hh:15, hh:15-hh:30, hh:30-hh:45 and/or hh:45-hh:60 or a multiple of a fixed quarter hour. Product
full activation time is 30 minutes (see detailed process). TSOs physically schedule this block in their
controllers, and settle the block energy with each other.
Table 3-1: TERRE cross-border product definition
Standard
Characteristics
(0) Activation Principle Scheduled

Page 15 of 98
(1) Preparation Period From 0 to 30 min
(2) Ramping Period From 0 to 30 min
(3) Full Activation Time
30 min
(4) Minimum quantity 1 MW
(5) Minimum delivery period
15 min
(6) Max delivery period
60 min
(7) Location Bidding Zones
(8) Validity Period Defined by BSP but equal or less than 60 min
(9) Recovery Period Defined by BSP
(10) Maximum Offer Size
• In case of divisible offer, no max is requested. • In case of indivisible offer, local rules will be
implemented
(11) Divisible Volume Under the responsibility of BSP
(Resolution for divisible offers = 0,1MW)
(12) Price
Local rules for cap/floor will be implemented in case no harmonization acc. GL EB can be achieved by NRA’s before entry into force of TERRE of TERRE
(13) Time Resolution 15 mins
3.1.2 BSP-TSO & BRP-TSO rules & requirements
The following items will be defined in a later stage of the project. With respect to the Standard Product
design and the terms and conditions under the umbrella of the GL EB (BRP: calculation of the imbalance,
Imbalance Price, BSP: settlement of the service, possible treatment of non-compliance, settlement or not
of ramping, prequalification), the objective would be to have as many harmonized features as possible for
the entry into force of TERRE. However some differences may be difficult to overcome.
3.1.3 Format of balancing energy offers
The following bid formats for balancing energy offers can be processed by the CMO:
Divisible Offers,
Block Offers,
Exclusive Offers,
Multi-part Offers
Linking Offers.
3.1.3.1 Divisible offer in volume

Page 16 of 98
A Divisible Offer is a balancing energy offer that consists of a single quantity and a single price. Its delivery
period can be 15, 30, 45 or 60 minutes. It can also have a minimum quantity. The algorithm can accept a
part of it in terms of quantity; however the same quantity must be accepted for the whole delivery period.
Two examples of Divisible Offers with delivery period 60 minutes and 15 minutes, respectively, are
presented in Figure 3-2 and Figure 3-3. Both offers have a single price for the whole quantity, x €/MWh.
Figure 3-2: Divisible Offer with
60min delivery period
Figure 3-3: Divisible Offer with
15min delivery period
3.1.3.2 Block Offers in volume
A Block Offer is a balancing energy offer that also consists of a single quantity and a single price. Its delivery
period can be 15, 30, 45 or 60 minutes. The difference between a Divisible and a Block Offer is that the
algorithm can accept either the whole quantity of the Block Offer or nothing.
An example of a Block Offer with a delivery period of 30 minutes, from H + 15min to H + 45min, is
presented in Figure 3-4 and Figure 3-5.
Figure 3-4: Submitted Block Offer
Figure 3-5: Accepted Block Offer:
all or nothing

Page 17 of 98
3.1.3.3 Exclusive Offers in volume or in time
Exclusive Offers are balancing energy offers that satisfy the following condition: only one (or
none) of the Exclusive Offers can be activated; hence, the activation of a sub-offer belonging
to an Exclusive Offer excludes the activation of the other sub-offers belonging to the same
Exclusive Offer. The Exclusive Offers can either be divisible or Block Offers.
Exclusive Offers provide greater flexibility to BSPs which bid per portfolio, as they allow them
to better represent their costs. According to discussions within the ENTSO-E Standard
Products subgroup, the number of sub-offers of each Exclusive Offer should be limited by a
maximum number at the present time.
An example of Exclusive Offers is illustrated in Figure 3-6. It presents four Exclusive sub-
Offers with (quantities/prices): (Q1/ P1), (Q2/ P2), (Q3/ P3) and (Q4/ P4), respectively with the
same delivery period, e.g. H + 15min to H + 60min. Only one of these offers can be accepted
by the algorithm.
Figure 3-6: Exclusive Offer with 4 sub-offers
3.1.3.4 Multi-part Offers
A Multi-part Offer is a balancing energy offer that has variable prices for variable quantities
and a single delivery period. Multi-part Offers allow BSPs to internally model their fixed costs,
e.g. start-up costs. In addition, as with the Exclusive Offers, they allow the BSPs which bid
per portfolio to depict their costs more accurately. Multi-part Offers can either be divisible
or Block Offers.
An example of a Multi-part Divisible Offer is presented in Figure 3-7
The depicted Multi-part Offer has a delivery time period starting at H+15min and ending at
H+60min, with a minimum quantity of zero. It consists of three parts:
A quantity Q1 (Q1 ≤ 20MW) of this offer; priced at 50€/MWh;
A quantity Q2 (20MW ≤ Q2 ≤ 25MW) of this offer; priced at 70€/MWh;
A quantity Q3 (25MW ≤ Q3 ≤ 40MW) of this offer; priced at 100€/MWh.
A Multi-part Offer can also be modelled as an Exclusive Offer.
Page 18 of 98
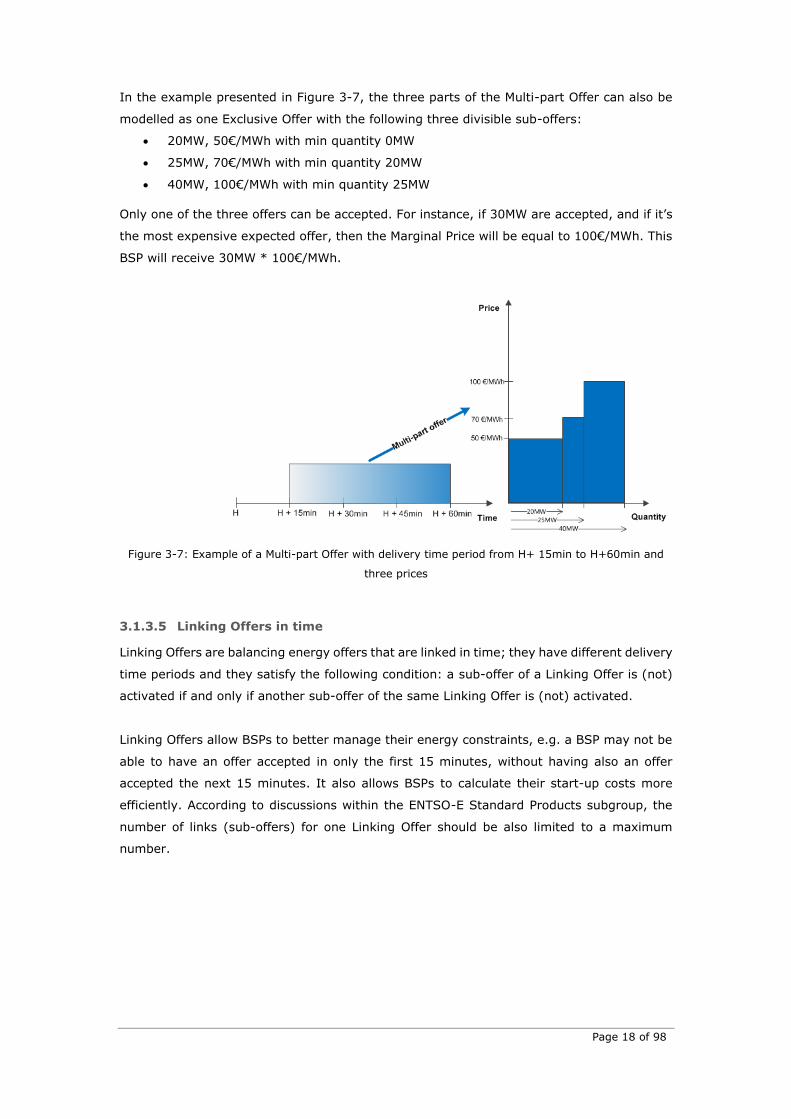
In the example presented in Figure 3-7, the three parts of the Multi-part Offer can also be
modelled as one Exclusive Offer with the following three divisible sub-offers:
20MW, 50€/MWh with min quantity 0MW
25MW, 70€/MWh with min quantity 20MW
40MW, 100€/MWh with min quantity 25MW
Only one of the three offers can be accepted. For instance, if 30MW are accepted, and if it’s
the most expensive expected offer, then the Marginal Price will be equal to 100€/MWh. This
BSP will receive 30MW * 100€/MWh.
Figure 3-7: Example of a Multi-part Offer with delivery time period from H+ 15min to H+60min and
three prices
3.1.3.5 Linking Offers in time
Linking Offers are balancing energy offers that are linked in time; they have different delivery
time periods and they satisfy the following condition: a sub-offer of a Linking Offer is (not)
activated if and only if another sub-offer of the same Linking Offer is (not) activated.
Linking Offers allow BSPs to better manage their energy constraints, e.g. a BSP may not be
able to have an offer accepted in only the first 15 minutes, without having also an offer
accepted the next 15 minutes. It also allows BSPs to calculate their start-up costs more
efficiently. According to discussions within the ENTSO-E Standard Products subgroup, the
number of links (sub-offers) for one Linking Offer should be also limited to a maximum
number.

Page 19 of 98
Figure 3-8: Linking Block Offers: all 3 offers or nothing are accepted.
Linking Offers can either be Block or Divisible Offers. In the case of Divisible Linking Offers,
the same percentage of quantity has to be activated; hence, x % of all Divisible Linking Offer
quantities is activated, where 0 <= x <= 100. Two examples with Block and Divisible Linking
Offers, respectively, are presented in Figure 3-8 and Figure 3-9.
Figure 3-8 depicts three linked Block Offers. Either all three or none are accepted by the
algorithm.
Figure 3-9: Linking Divisible Offers: the same percentage of all 3 offers is
accepted (same ratio α)
Figure 3-9 presents three linking Divisible Offers and their accepted quantities. Minimum
quantities are assumed to be zero. As illustrated in the right graph of Figure 3-9, the same
ratio “α” of the three offers is accepted, e.g. 50% of Q1, Q2 and Q3. Note that the Linking
Offers may have also different prices.

Page 20 of 98
3.1.4 Unavailable Offers and Central Dispatch System conversion of bids
3.1.4.1 Unavailable Offers
The GL EB allows for the possibility for TSOs to mark certain bids as unavailable on the
CMOL. For Standard Products there are two main types of Unavailable Offers:
Unshared Offers which the connecting TSO wants to keep back for their own use,
which must comply with certain volume restrictions (i.e. the volume of Unshared
Offers must not exceed the volume of procured balancing capacity for the RR
process); and
Restricted Offers which cannot be activated by the connecting TSO due to internal
congestions or operational security issues, which are not subject to the same volume
restrictions as Unshared Offers.
The TERRE project will seek to comply with the GL EB with regard to the treatment of
Unavailable Offers for Standard Products. It is not expected that any specific products will
be forwarded to the platform, due to the wide variation in local specific product
characteristics and design.
The volume of unshared bids for RR shall not be higher than the volume of Balancing
Capacity for RR2 procured by the TSO, less the volume of balancing Energy Bids for Specific
RR products.
3.1.4.2 CDS conversion of bids
Though the methodology needs to be developed in coordination with other CDS systems,
the intention is to use balancing resources to supply the TERRE CMO as long as their activa-
tion and delivery parameters fit the parameters of the TERRE product and only if the related
energy can be physically delivered across the border.
3.1.5 Questions for Stakeholders
Q 3.1 Which format of balancing energy offers are most attractive to stakehold-
ers?
Q 3.2 Do stakeholders agree with the definition and features of the TERRE cross
border product?
Q 3.3 What are the stakeholder’s views on BRP-TSO & BSP-TSO rules & require-
ments?
Q 3.4 Does the TERRE product allow for the participation of all types of balancing
service providers (e.g. RES, Thermal, and DSR)? And if not, what changes
in the features will allow greater participation in the TERRE project?
2 The FRR volume will be considered also additionally to the RR volume

Page 21 of 98
Q 3.5 What are your views on the application of the local features of the TERRE
cross border product (e.g. Harmonization of price cap and floors or
Maximum Bid Sizes for Indivisible Offers)?
Q 3.6 The number of bid formats (Divisible, Block, Exclusive, Linking Offers)
which may be used by BSP represents a trade-off between the flexibility
offered to BSP (with several types of offers) and the simplicity to offer bids
and to run the algorithm (eg, with only one standard type of offer). What
are you views on this trade-off? Would you advocate for keeping all types
of bids offered by TSOs or to reduce the number of possible offers?
3.2 Imbalance Need definition and elasticity
3.2.1 Imbalance need description
As with the offers, the imbalance need submitted to the platform by the TSO has several
characteristics. In this paragraph, these characteristics are detailed.
The Imbalance Need’s definition in TERRE relies on concepts of volume, price, and
emergence time and delivery period.
The imbalance need has several properties:
Table 3-2: TSO Imbalance Need definition
Imbalance Need
Characteristics
Anticipation Time Only needs anticipated 45 min or more before real
time can be satisfied by TERRE
Minimum size 0 MW
Minimum delivery period
15 min
Max delivery period 60 min
Location Bidding Zones
Maximum Size
The maximum size of the Imbalance Need should
be less or equal to the sum of the shared offers
made in the same direction. Under certain
conditions, a TSO can notify the system which will
apply an exemption to this rule
Divisible Volume Under the responsibility of TSO to a resolution of
1MW
Price
For inelastic needs TSOs will not price their needs.
For elastic needs a price will be submitted, which
will set a min/max price each TSO is willing to
receive/pay to satisfy its needs. See 3.2.2
Its resolution is 0.01€/MWh.
Time Resolution 15 mins
Firmness Yes

Page 22 of 98
Direction Positive (System short) / Negative (System
long)
3.2.2 Cases of pricing (examples of cases)
The imbalance need in TERRE can be defined by two price/volumes parameters in a more
general shape:
An inelastic volume (“at all price” need). This volume corresponds to an imbalance
need volume absolutely required by the TSO on TERRE. This volume represents the
sure part of imbalance, foreseen at least 45 minutes before real time, which a TSO
wants to cover with TERRE.
An elastic volume (“priced” need). This is, in reality, a couple volume/price or a set
of couples that constitute part of an imbalance, foreseen at least 45 minutes before
real time, which a TSO can cover with more economic, alternative means to TERRE
(e.g. specific products, mFRR or aFRR). The elasticity also helps the TSO to deal with
uncertainties when defining its imbalance volume. The TSO can submit as many
couples of price/volume as they want for dealing with imbalance uncertainty and for
expressing its alternatives.
Each TSO will define an applicable methodology for determining the inelastic and/or elastic
volume, and they may use all or none of the previous parameters. When a TSO wants to use
certain parameters, it has to specify all the previous parameters into TERRE, but it can use
different methods to define these values, depending on the way that it operates its system,
as well as the different platforms (local) that each TSO has access to.
3.2.3 Questions for Stakeholders
Q 3.7 Do you agree with the proposed design of the TSO imbalance need?
Q 3.8 Do you agree with the possibility for inelastic and elastic imbalance needs?
Q 3.9 Do you have specific comments regarding chapter 3 content? (Please indi-
cate sub-chapter reference when possible)

Page 23 of 98
4 Balancing CMO & Algorithm
4.1 Explanation of the Algorithmic optimization choice
The following frame conditions and guidelines have been agreed by the TERRE project. These
rules have to be considered for the algorithmic optimization, due to their listed characteristics
and influence on the TERRE clearing:
Optimization of Social Welfare
The optimization of the social welfare has been defined as the main objective, since it
represents the simplest and most robust process. It is also the main purpose of the TSOs
since it guarantees and enhances the efficiency of the market.
Elastic Imbalance Need
The use of elastic Imbalance Need provides flexibility to TSOs to determine if their Imbalance
Need will be satisfied by TERRE or by an alternative possibility, (like a local market of RR or
by FRR) and is thus expected to result in reduced balancing costs. In addition, it simplifies
the Netting process, as Netting is implemented based on the Imbalance Need prices and no
predefined rules (e.g. proportional distribution) are necessary.
Please note that an Imbalance Need can remain inelastic by pricing the Imbalance Need
using a default maximum instrumental price that does not affect the settlement.
One single CMO
The existence of two CMOs (one for positive Imbalance Need Bids/upward offers and one for
negative Imbalance Need Bids/downward offers) could not ensure efficiency (e.g. in the use
of ATC). In addition, a single CMO allows the Netting of needs in a one-stage process,
resulting in higher social welfare. If two CMOs were used, need Netting would not be possible
in a one-stage clearing process, as positive and negative Imbalance Need Bids would not be
in a single CMO. The positive imbalance needs and the downward offers represent the ‘buying
curve’ (demand) and the negative imbalance needs and the upward offers represent the
‘selling curve’ (supply).
One-stage clearing process
In the one-stage clearing process there is no differentiation between the Netting of
Imbalance Needs and the activation of downward/upward offers in order to satisfy the
demand of a TSO. The activation of downward/upward offers might result in higher social
welfare compared to pre-Netting of Imbalance Needs in a two-stage clearing process.

Page 24 of 98
Furthermore, this approach is more compatible with Elastic Imbalance Need principles and
simplifies the settlement process.
Harmonization of local rules related to negative prices
The introduction of common price rules or limits, i.e., the abolition of any price limits (except
for algorithm resp. IT purpose) would avoid further complexities and prevent discrimination
or disadvantage to any participating BSP or TSO. It would also result in a higher social
welfare, and is in line with the GL EB in promoting a non-capped pricing for balancing. For
more information on this topic, please refer to 12.1.
4.2 Description of the optimization
The main functionality of the Balancing CMO, as described in Chapters 4.2.1 - 4.3, is to
determine the activated balancing energy offers and the satisfied Imbalance Need Bids of
TSOs, taking into consideration the possibility of netting the Imbalance Needs in order to
maximize the social welfare of the TERRE region. The Balancing CMO also calculates the
applicable TERRE Clearing Price, as the Marginal Price for the TSO-TSO clearing.
The handling of some special national requirements is described under Chapter 4.3.2.
4.2.1 Maximizing the Social Welfare of the RR process
The social welfare of the TERRE region is defined as the surplus of the connecting TSOs, as
represented by their Imbalance Need Bids, minus the BSPs’ production costs, as represented
by their balancing energy offers. In simpler terms, as depicted in Figure 4-1, the social
welfare is the area between the satisfied needs and the activated offers. The maximization
of this area results in the maximization of the social welfare.
Figure 4-1: Social Welfare of TERRE region
As described in 3.1.3, the submitted balancing energy offers may have different delivery
time periods and formats. The decision about which offer will be activated is based upon
which offer maximizes the social welfare, looking at the whole Market Clearing Time Period.
In simpler terms, the Balancing CMO does not maximize the social welfare of each Market

Page 25 of 98
Resolution Time Period (15min) separately, but seeks to maximize the social welfare of the
defined Market Clearing Time Period; which is equal to one hour.
4.2.2 Volume indeterminacies
Figure 4-2: Volume indeterminacies: the highest volume is accepted
Different solutions of the main function may result in the same social welfare. If these
solutions represent different accepted volumes, either in terms of offers or in terms of needs,
then the solution that leads to the highest accepted volume is accepted
This is illustrated in Figure 4-2
4.2.3 Flow term in the objective function
Since the ATC network model is used in TERRE, the ATC values constrain the scheduled
flows, as they define the maximum value of a flow and there is no physical network
representation that would allow for the flows to be determined. Therefore the Balancing CMO
minimizes the scheduled flows of the TERRE region such that the primary objective of the
algorithm is the maximization of the social welfare, and secondarily the minimization of the
flows. Hence, the minimization of the flow does not affect the solution of the social welfare
maximization, i.e., the activated balancing energy offers and the satisfied imbalance bid
needs, but based on the results of the social welfare maximization, it minimizes the flows.
If two solutions result in the same social welfare, then the solution leading to the minimum
cross-border scheduled flows would be accepted.
The minimization of the flows is done both in the main function of the Balancing CMO, i.e.
the function that determines the offers to be activated and the needs to be satisfied, as well
as in a separate function that takes the activations and satisfied needs as inputs and provides
the flows. This is implemented in the same way as in the day-ahead market coupling.

Page 26 of 98
4.2.4 Scheduling step constraints
The algorithm includes some constraints related to the scheduling step. If the scheduling
step of the cross-border exchanges was equal to the Market Resolution Time Period, i.e., 15
min, there would be no need to constrain the flows. However, the scheduling step is currently
equal to 1 hour for all borders of the participating TSOs, apart from the French-Swiss border,
where it is equal to 30 min.
We should highlight here that adopting a scheduling step equal to 15 min would result in the
most efficient solution, as all offers (needs) would be optimally activated (satisfied).
Therefore, it will be important to shorten the scheduling step in the future. The algorithm is
designed to be flexible enough to handle different scheduling steps equal to 15 min, 30 min
and 1 hour, while ensuring a constant flow for the related period. For more information on
scheduling step, please refer to section 7.3.
4.2.5 Netting method
Netting is the action of matching two Imbalance Needs of opposite directions, i.e. a transfer
of energy from a zone that has a negative Imbalance Need to a zone with a positive
Imbalance Need. The more Netting occurs, the fewer imbalances remain, and hence, fewer
offers have to be activated. However, fewer activated offers do not necessarily result in lower
Marginal Prices or higher social welfare. In some cases (in particular if the need is elastic),
the activation of downward/upward offers might be financially more beneficial compared to
the Netting of demands, resulting in a higher social welfare.
4.2.6 Congestions
Congestions occur in the TERRE region when the existing ATC is not able to simultaneously
accommodate all the cheapest transactions, resulting in unavoidable suboptimal solutions,
i.e., reduced social welfare. In simpler terms, some submitted balancing energy offers
cannot be activated and a connecting TSO must satisfy its Imbalance Need using more
expensive offers. Similarly, congestion may have an impact on Netting; two Imbalance
Needs may not be Netted due to congestions, and therefore, TSOs have to activate balancing
energy offers. Note that congestions can also result in different prices among the congested
areas, as marginal pricing will be used in TERRE.
4.2.7 Price calculation function
After solving the main and the flows’ calculation function, the Marginal Price has to be
determined for each bidding zone according the principles described in section 0.
4.2.8 Fall-back process
In case the TERRE clearing process fails, the procurement and activation of balancing energy
will be handled at national level only.

Page 27 of 98
4.3 Specific cases
4.3.1 Counter-activations
With the term counter-activations, we refer to the simultaneous activation of an upward and
a downward offer in order to increase the social welfare. Due to the fact that all positive and
negative Imbalance Needs, as well as all upward and downward balancing energy offers are
treated in a single CMO, counter-activations could occur if some downward offers had higher
prices than some upward offers, i.e., if some BSPs would be willing to pay higher prices to
reduce their production than the prices some other BSPs would be willing to receive to
increase their production. Figure 4-3 presents a merit order list. If a downward offer -
illustrated with blue - has a higher price than an upward offer - illustrated with orange -,
then these two offers would be simultaneously activated, as this would result in a higher
social welfare.
Figure 4-3: Counter-activations’ explanation
Excluding counter-activations, introducing further constraints into the single CMO, would
lead to the reduction of social welfare, the distortion of price signals, and limit opportunities
for BSPs to get activated.
We should highlight that these phenomena are not expected to occur, at least not to a large
extent, in a common market like TERRE, with liquid intra-day markets close to real-time.

Page 28 of 98
We can distinguish two different types of counter-activations:
1. Internal counter-activations
2. XB counter-activations
The pros and cons of these two types of counter-activations have been investigated below:
Table 4-1
Pros Cons
Internal Counter-
activations
Increase of social-welfare
Non-distortion of marginal
price
BSPs have higher chance of
being activated
Activation of offers not for
satisfying TSO imbalance
needs due to inefficiencies
of national markets
XB Counter-activations
Potential use of XB capacity
in one direction reducing XB
capacity available for
exchanges of balancing
energy from other
processes (mFRR, aFRR)
activation of offers not for
satisfying TSO imbalance
needs
We have also performed a study in order to quantify potential counter-activations in TERRE,
based on the historical data of 2013. We launched simulations using the historical ATC values
and TSOs’ data, allowing counter-activations. Please refer to section 6 for more information
on the input data assumptions. The simulations were then performed again using the same
inputs, but restricting counter-activations. This was done by setting a limit to the total
allowed activations of upward and downward offers; the limit was equal to the submitted
upward and downward needs, respectively. We have also made the following assumptions:
Admie was not included in the simulations since they have no organized balancing
market
Scheduling step was set to 30min and hence had no impact on the results
The results of this study are presented in Figure 4-4. More specifically, Figure 4-4 presents
the yearly cumulative volumes of total upward and downward activations, when we allow
and when we restrict counter-activations. The difference in volume of 0.58 TWh implies an
increase of activated volume of 19.8% for Upward Activation and by 7.8% for downward
activation when counter-activations are allowed.

Page 29 of 98
Figure 4-4: Cumulative activation volumes allowing and not allowing counter-ac-
tivations
4.3.2 Activation for other operational constraints
4.3.2.1 HVDC Losses
The physical flow of a HVDC interconnector is subject to losses on the link. This implies that
each allocation on a border with losses ends up with an allocation volume in the exporting
area which differs from the allocated volume in the importing area.
It was concluded that the optimal way to consider losses incurred by an exchange across
HVDC interconnectors is to include them in the TERRE algorithm. This is done in the same
way as in Day-Ahead Market Coupling.
4.3.2.2 I/C controllability on HVDC
The calculation of the capacity offered to the market is fundamentally different between AC
and DC borders. On DC borders (within the GB market and elsewhere) the nameplate rating
is generally offered into the market (i.e. no capacity is held in reserve to cater for faults,
operational issues etc.). However this is not the case for AC borders where capacity can be
reduced to cater for operational requirements (e.g. n-1).
For DC borders, this can lead to times where the market benefit that the extra capacity
brings is outweighed by the operational costs of providing the capacity. Therefore, to avoid
such situations and maximize social welfare, TSOs need to manage HVDC links in operational
timescales as certainty of power system conditions increases. TERRE allows these TSOs to
manage HVDC links. To achieve this, the Balancing CMO considers extra constraints related
to the controllability of the HVDC links. More specifically, it is possible for the TSOs managing

Page 30 of 98
HVDC links to submit to TERRE a desired flow range (across the HVDC). The solution of the
Balancing CMO has to respect this flow range. If there is not a feasible solution that satisfies
the desired flow range, the solution that is closest to this range is chosen.
4.3.2.3 Handling of Unforeseeably Accepted and Rejected offers
Since the optimization algorithm seeks to optimize the social welfare of the TERRE region,
and not only divisible offers (with zero minimum quantities) are expected to be used, there
may be cases where an accepted upward (downward) balancing energy offer has a higher
(lower) price than the Marginal Price. These offers are named unforeseeably accepted offers.
Similarly, there may be cases where a rejected upward (downward) balancing energy offer
has a lower (higher) price than the Marginal Price. There offers are named unforeseeably
rejected offers. There is an ongoing study on how these offers will be treated in TERRE that
is planned to finish during the implementation phase.
4.3.3 National price zones and congestions in Italy
In the Italian electricity market, the territory is divided into Market Zones, in order to limit
the exchanges between the interconnected areas with limited transit capacity. There are
currently 6 “real” Market Zones and 4 “virtual” Market Zones (more details can be found in
Annex 4, Chapter 20). The TERRE solution considers each internal zone as an independent
Market Zone. Therefore, for each Market zone, Terna will submit to the TERRE platform:
different ATC values;
different offers and
one need for the whole area
4.4 Questions for Stakeholders
Q 4.1 Do you have any specific comments on the Balancing CMO description?
Q 4.2 What is your opinion on allowing internal and XB counter-activations?
Q 4.3 Do you agree with the proposed treatment of HVDC losses?
Q 4.4 Do you have specific comments regarding chapter 4 content? (Please indi-
cate sub-chapter reference when possible)

Page 31 of 98
5 Settlement
5.1 Explanation of the Marginal Price choice
Currently, there are two possible scheme options for the settlement of the RR energy
exchanged through TERRE:
Pay as bid
Pay as cleared (marginal)
Regarding these two settlement options, the Framework Guidelines (FW) (2012) and the
draft GL EB (2015) contain the following:
Framework Guidelines on Electricity Balancing (18/09/2012)
“3.3.1. The Guideline on Electricity Balancing shall provide that the initial proposal for the pricing method
shall be submitted to the Agency and all NRAs no later than one year after the entry into force of the Guideline
on Electricity Balancing and shall be based on marginal pricing (pay-as-cleared), unless TSOs provide all
NRAs with a detailed analysis demonstrating that a different pricing method is more efficient for EU-wide
implementation in pursuing the general objectives defined in Section 2.1.”
EB GL (ACER draft) (SECTION 12 PROCUREMENT OF BALANCING ENERGY
Article 42 PRICING METHOD FOR BALANCING ENERGY
“1. No later than one year after the entry into force of this Regulation, all TSOs shall develop a proposal for
harmonized pricing method for Balancing Energy. The proposed pricing method shall be based on marginal
pricing (pay-as-cleared), unless TSOs complement the proposal with a detailed analysis demonstrating that
a different pricing method is more efficient for European-wide implementation pursuing the general
objectives defined in Article 11 (…)”
Taking the above into account, the FW and Draft GL EB have a preference for the application
of marginal pricing schemes (pay as cleared).
Also, in principal, marginal pricing gives clearer economic signals when coupling different
bidding zones.
Taking into account the characteristics of the design of TERRE, and the recommendations
from the FW and draft GL EB, the proposal is to apply pay-as-cleared (Marginal Price) for
the settlement of XB Balancing schedules derived from TERRE.
5.2 Description of the “product settlement” (rectangle) of XB balancing energy
exchanges between TSOs
Under the scope of ENTSO-E, the WG AS (Working Group Ancillary Services) is defining
Standard Products that will be exchanged in the different Coordinated Balancing Areas
(CoBAs) for the implementation of the GL EB (draft Balancing Guideline) and analyzing the
most suitable pricing method for each Standard Product. Currently, there are different types
of Standard Products under definition (scheduled products and direct activated products),
and different settlement methods (including or not ramps) depending on the type of product.

Page 32 of 98
This section covers only settlement for TERRE products exchanged between TSOs (at XB
level).
As explained in table 2.1 and in Chapter 3.1.2, there are currently differences between TSO-
BSP settlements among systems.
Also, there may be differences between XB TSO-TSO settlement and local TSO-BSP settle-
ment (e.g. pay as bid or pay as clear, inclusion or not of ramps in local settlement, etc.).
The Standard Product designed for TERRE will be scheduled product. Thus, for the TERRE
project, the energy product exchanged between TSOs through TERRE will be the blue box
below, excluding the energy associated with the increasing and decreasing power ramps
(green triangles).
Figure 5-1: Energy volume scheduled and settled at XB level in TERRE
5.3 Definition of Marginal Price
The Marginal Price shall be based on the prices of the activated balancing offers from BSPs
and, if relevant3, on the prices of the satisfied TSO Need Bid. Graphically, this Marginal Price
will be given by the intersection between the selling and buying curve in the TERRE CMO,
being:
Selling curve: Upwards offers and downwards Needs Buying Curve: Downwards offers and upwards Needs
Figure 5-2: Definition of Marginal Price
The marginal price (MP) shall satisfy the following rules:
3 In case TSO Imbalance needs have a Price (which is optional)
Page 33 of 98
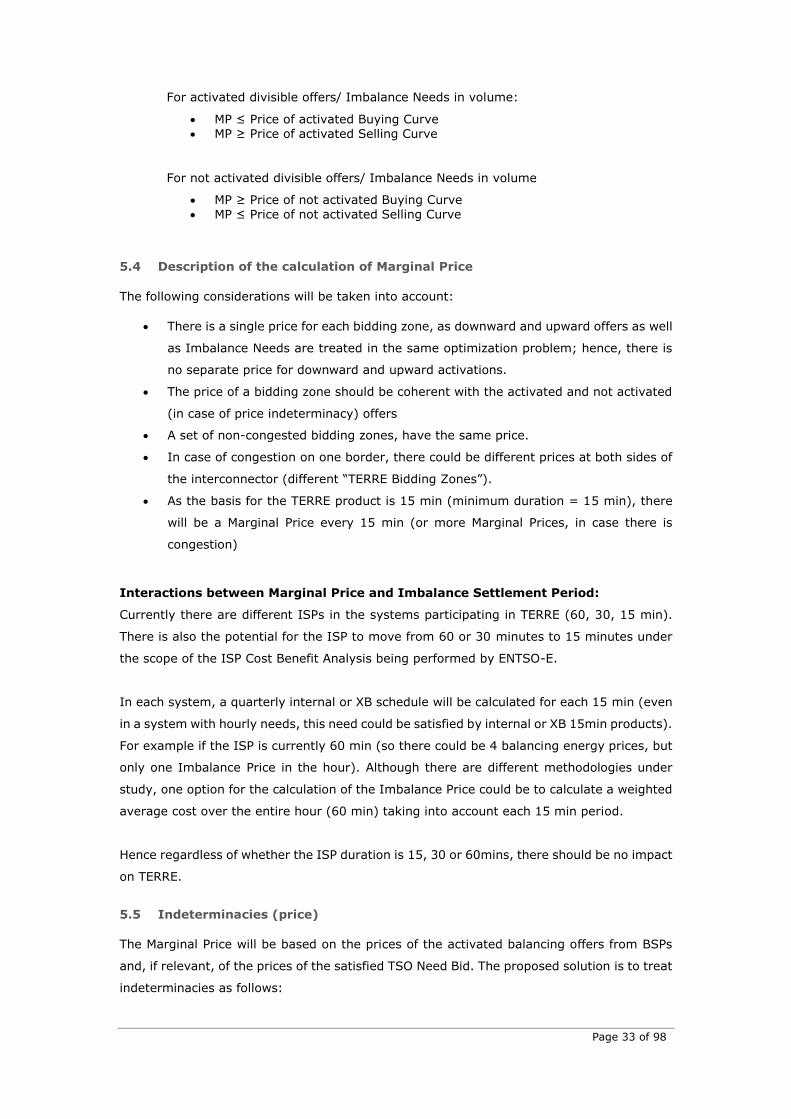
For activated divisible offers/ Imbalance Needs in volume:
MP ≤ Price of activated Buying Curve MP ≥ Price of activated Selling Curve
For not activated divisible offers/ Imbalance Needs in volume
MP ≥ Price of not activated Buying Curve MP ≤ Price of not activated Selling Curve
5.4 Description of the calculation of Marginal Price
The following considerations will be taken into account:
There is a single price for each bidding zone, as downward and upward offers as well
as Imbalance Needs are treated in the same optimization problem; hence, there is
no separate price for downward and upward activations.
The price of a bidding zone should be coherent with the activated and not activated
(in case of price indeterminacy) offers
A set of non-congested bidding zones, have the same price.
In case of congestion on one border, there could be different prices at both sides of
the interconnector (different “TERRE Bidding Zones”).
As the basis for the TERRE product is 15 min (minimum duration = 15 min), there
will be a Marginal Price every 15 min (or more Marginal Prices, in case there is
congestion)
Interactions between Marginal Price and Imbalance Settlement Period:
Currently there are different ISPs in the systems participating in TERRE (60, 30, 15 min).
There is also the potential for the ISP to move from 60 or 30 minutes to 15 minutes under
the scope of the ISP Cost Benefit Analysis being performed by ENTSO-E.
In each system, a quarterly internal or XB schedule will be calculated for each 15 min (even
in a system with hourly needs, this need could be satisfied by internal or XB 15min products).
For example if the ISP is currently 60 min (so there could be 4 balancing energy prices, but
only one Imbalance Price in the hour). Although there are different methodologies under
study, one option for the calculation of the Imbalance Price could be to calculate a weighted
average cost over the entire hour (60 min) taking into account each 15 min period.
Hence regardless of whether the ISP duration is 15, 30 or 60mins, there should be no impact
on TERRE.
5.5 Indeterminacies (price)
The Marginal Price will be based on the prices of the activated balancing offers from BSPs
and, if relevant, of the prices of the satisfied TSO Need Bid. The proposed solution is to treat
indeterminacies as follows:

Page 34 of 98
• Indeterminacy in price: Middle point
Figure 5-3: Indeterminacies in price: Middle point
This option guarantees an equal distribution of social welfare among selling and
buying parties, and is the criteria applied currently in Market Coupling of Regions
(MRC).
5.6 Specific cases – Netting of Imbalance Needs
In TERRE, there could be some situations where, according to the Balancing CMO, there is
only Netting of needs (i.e. there are no activated bids from BSPs). These situations might
be very improbable; nevertheless they need to be studied.
In these cases, there could be indeterminacy in the settlement price associated with the XB
balancing exchange.
Several options have been studied for the definition of the price associated with these XB
flows. After several studies, the proposed solution for XB settlement in the case of Netting
of needs is the following, depending on the elasticity of the needs:
In case both elastic needs (upwards and downwards) Middle price (same as
indeterminacy in price)
Figure 5-4: Settlement specific case: both elastic needs
In case one need is elastic and the other inelastic Price of the elastic need (P2)

Page 35 of 98
Figure 5-5: Settlement specific case: one elastic need, one inelastic need
In case all needs are inelastic (upwards and downwards), the process can be
considered comparable to Imbalance Netting.
In this case, each system calculates an “Opportunity Price” that reflects the avoided cost of
each system thanks to the Netting of needs in TERRE.
Then, the calculation of the global benefit is performed. After, the global benefit is equally
shared across the systems (based on the weighted average of exchanged volume). This
implies that for each system a different Marginal Price is calculated.
Definition of “Opportunity Price” (avoided cost)
Different options have been studied for the definition of the “Opportunity Price”. The proposal
is to reflect the avoided cost in each system thanks to its participation in TERRE (it will be
the cost that would have resulted in the activation of the cheapest National RR resources)
i.e. as if TERRE did not exist (only National RR markets). It would be the following:
Figure 5-6: Opportunity Price
The opportunity cost will be the avoided cost of the internal RR cheapest bids sent to TERRE
from each TSO (e.g. cost if TERRE didn’t exist and each TSO had to use its internal RR bids).
Example: If netted need from TSO is 20 MW:
If TSO-BSP settlement (RR) is marginal: Opportunity Price = internal marginal
price (hypothetic) – 20€/MWh

Page 36 of 98
Figure 5-7: Example of Opportunity Price
Argument for this methodology: this definition
ensures equal distribution of benefits of netting
ensures that global benefit for netting is positive (or at least zero)
5.7 Congestion Rents
There could be situations where borders within TERRE become congested. In such a case,
there could be different Marginal Prices at both sides of the border. Each of these prices will
be established based on the activated Balancing offers and/or the satisfied Imbalance Need
in the non-congested area.
Due to this price difference between the price that an area is “willing to pay” and the price
that the other area is “willing to receive” at either side of the interconnector, a surplus will
occur. This surplus, calculated as the multiplication of the exchanged balancing energy times
the price difference, is called a “congestion rent” in other timeframes (such as the MRC
project). In this case, the “TERRE congestion rent” would be:
TERRE congestion rent = TERRE schedule x (ΔP)
The TERRE schedule is the XB schedule between the two congested areas and ΔP the
difference of Marginal Prices at both sides.
The distribution of congestion rents is a regulatory issue that should be established with the
input from the NRAs.
Taking into account that these congestion rents do not only happen in TERRE but in other
timeframes (e.g. Multi Regional Coupling in Day Ahead), the distribution of congestion rents
of TERRE should be consistent or at least take into account the methodology applied in other
timeframes.
This congestion rent, as in other timeframes, lays down the Regulation R 714-2009 article
16-6 (refer to annex 2, chapter 18).
5.8 Questions for Stakeholders
Q 5.1 Do you agree that the proposed settlement design is in line with the princi-
ples of the EB GL and the integration of balancing markets?

Page 37 of 98
Q 5.2 Do you agree with the application of cross border marginal pricing, settle-
ment of the block and the proposed design for the definition of Marginal
Price between TSOs at the XB level?
Q 5.3 What is your perspective regarding the alignment of the TSO-TSO settle-
ment procedure and the BSP-TSO settlement procedure?
Q 5.4 Do you have specific comments regarding chapter 5 content? (Please indi-
cate sub-chapter reference when possible)
6 Cost Benefit Analysis
6.1 Assessment Methodology
A key part of the project TERRE design phase has been to develop a methodology to assess
the potential benefit of coupling the different Replacement Reserve (RR) markets of the
member states within TERRE in order to perform a robust Cost Benefit Analysis (CBA).
One of the key challenges of developing such a methodology is the current differences
between these balancing markets, with some operating pay-as-bid settlement, others using
marginal pricing, some with unit based bidding and others with portfolio based bidding.
In addition to this, the differences in TSO’s business processes, IT platforms, RR products
and intra-day markets all seek to make performing such a quantitative assessment that
accurately reflects the change from the current situation in each market extremely difficult.
Another challenge to performing such analysis is the inability to model any potential changes
to market bidding behavior, which is influenced by local regulation, market rules and
competition.
Project TERRE, in addition to coupling RR markets, will also be harmonizing bidding rules,
TSO-TSO settlement methodologies for RR, and high level business processes of the TSOs
involved. Given the volume and scope of change as a result of project TERRE, this analysis
is focused on assessing the benefits associated with a having access to a wider pool of
balancing resources and will not be seeking to assess benefits associated with moving from
pay-as-bid to marginal pricing, or moving from one RR product to another.
NB: the results are inherent to the input hypotheses, especially volume - prices of offers and
Imbalance Needs remain the same for all simulations.

Page 38 of 98
In order to assess the benefits of coupling different RR markets, historical data from each
TSO for the 2013 calendar year was used in order to establish the following data sets:
Data Set Historical Data Used
TSO upwards
Imbalance Needs
Actual activations of upwards balancing energy in MW split
out into anticipation time (taken as the minimum response
time of the unit activated) for each 30min settlement period
TSO downwards
Imbalance Needs
Actual activations of downwards balancing energy in MW split
out into anticipation time (taken as the minimum response
time of the unit activated) for each 30min settlement period
BSP upwards offers
Actual offers into the balancing market for upwards balancing
energy (an increase in production/reduction in demand) in
MW with a price in €/MWh per unit for each 30min settlement
period
BSP downwards offers
Actual offers into the balancing market for downwards
balancing energy (a reduction in production/increase in
demand) in MW with a price in €/MWh per unit for each
30min settlement period
Minimum Response
Time
Minimum time taken to deliver the offered volume per unit for
each 30min settlement period. This information is provided
for both upwards and downwards balancing energy offers and
varies depending on where a unit is in its operating range.
Minimum Activation
Time
Minimum duration an activated balancing unit must produce
the activated volume for. This information is provided per unit
for each day.
Available Transmission
Capacity
The amount of remaining cross border transmission capacity
after the closure of the intra-day market in each direction per
30min settlement period.
Table 6-1
The benefits of coupling the different RR markets was calculated using the simulation tool
developed during the design phase of the project under the scope of the Balancing CMO &
Algorithm Working Package, the principles of which are described in section 4.2. In order to
establish the counter-factual or ‘as is’ scenario this tool will be used to calculate the historical
costs of each TSO satisfying its needs using the offers from BSPs in its own area This will be
simulated by setting the Available Transmission Capacity (ATC) to zero on all borders.
Due to the different settlement rules in the different markets and the fact that TERRE will be
applying marginal pricing, the costs for counter-factual scenario will be calculated using
marginal pricing despite some systems using pay-as-bid, hence will not be directly
comparable to the historical costs of system balancing for each TSO.

Page 39 of 98
The simulation will then be performed again using the historical ATC values, where all offers
are put together in a Common Merit Order List (CMOL) per direction. Offers are then
activated from this CMOL in price order, while respecting the ATC constraints. When a
particular border becomes congested, offers are then used from the remaining uncongested
area.
For example if National Grid had an upwards need of 500MW and ATC in the FR-GB direction
of 200MW, the tool would activate the cheapest 200MW of offers from the CMOL, which if
they were all from RTE would cause the HVDC interconnector between FR and GB to become
congested in the FR-GB direction. The remaining 300MW of National Grid needs would be
then satisfied just using to offers within the GB bidding zone.
As per the normal marginal pricing settlement rules defined in the TERRE design, one
Marginal Price will be established per uncongested area. Hence, in the example above there
would be more than one Marginal Price.
The results of this simulation will then be used to calculate the expected costs for satisfying
the TSO needs using the wider pool of balancing resources in the CMOL taking into account
ATC.
The expected benefit or increase in social welfare will then be a comparison of the total costs
of meeting the TSOs needs with and without ATC. This analysis will also look at the individual
effects on the different TSOs within TERRE, any transfers of welfare (e.g. from producers to
consumers) and congestion rent. For a full description of the assumptions made during the
Cost Benefit Analysis please refer to Annex 5 (Chapter21).
6.2 Costs
The costs of the TERRE project are considered under two broad categories:
Central costs of the project itself: The principal cost associated with the central project
will be the development and operation of the TERRE platform (external supplier spend). At
this stage of the project the cost of this can only be estimated, using the most realistic
assumptions available and incorporating some risk margin to allow for contingency actions.
There will also be some direct cost associated with running the project and establishing a
client-side project team.
In addition to these one-off costs there will be some limited recurring costs associated with
operating the platform (system hosting, software support & maintenance, software licenses,
etc.). The recurring costs of the TERRE project are considered negligible, as the systems will
be in place and no major ongoing costs are foreseen.
In order to assist with generation of these estimates, the TSOs launched a “Request for
Information” (RFI) to the IT marketplace, inviting suppliers to comment on the availability

Page 40 of 98
of suitable software packages, approaches to pricing, indicative license costs, time & mate-
rials costs etc. The returns from this RFI, together with previous experience with similar IT
projects support the broad estimation of the lower and upper bounds of cost.
Local IT costs within each TSO market area: In addition to the central costs of the
platform, which will be shared amongst the participating TSOs, each TSO will have to make
changes to local IT systems in order to interact with the TERRE platform.
Again it is at this stage only possible to make very rough order-of-magnitude estimates of
the costs of local system change, based on previous experience. Please note that the esti-
mations provided do not include any expected implementation costs incurred by BSPs or
BRPs.
The table below presents the total estimated costs for the implementation project:
Table 6-2: Estimated costs
Cost range
€25-30 million
6.3 Benefit
The following sections show the outputs of the simulations. These results have been split to
show the impacts on BRPs, in terms of impacts on balancing costs and BSPs, in terms of
impact on activations. Throughout the following figures a consistent signage has been used,
whereby positive imbalance needs correspond to situations where the system is short and
negative imbalance needs correspond to situations where the system in long. The figures
below also seek to consistently refer to costs and values, where a negative cost means
money is being received, and a negative value meaning money is being paid.

Page 41 of 98
6.3.1 Impact on BRPs
Figure 6-1: Upwards Imbalances by Country
The cost of fulfilling the Upwards Imbalance needs in each of the two simulations is illustrated
by country in Figure 6-1. The volume of imbalance (in MWh) required in each country is
shown on the right hand vertical axis, this is constant in each of the study cases. It can be
seen that in every country, the cost of satisfying the Upwards Imbalance is reduced by
TERRE. Also there is a strong correlation between imbalance volume and cost in each coun-
try, as would be expected.
0
200,000
400,000
600,000
800,000
1,000,000
1,200,000
1,400,000
1,600,000
€ 0
€ 20,000,000
€ 40,000,000
€ 60,000,000
€ 80,000,000
€ 100,000,000
€ 120,000,000
€ 140,000,000
€ 160,000,000
France GB Spain Portugal Greece Switzerland Italy
Vo
lum
e o
f Im
bal
ance
(M
Wh
)
Co
st o
f Im
bal
ance
Cost of Upwards Imbalances
Cost of Upwards Imbalance - No TERRE Cost of Upwards Imbalance - TERRE BRP Upward Imbalance Volumes

Page 42 of 98
Figure 6-2: Downwards Imbalances by Country
Figure 6-2 shows the costs for BRPs for downwards Imbalance needs in each of the two
study cases, by country. Please note that where a cost is negative this represents payments
to the BRPs. The TERRE study case shows an increase in the annual payments towards BRPs
for downwards RR energy. The expected correlation between volumes of imbalances is pre-
sent again. This can be explored further in section 6.3.3 which looks at the Volume Weighted
Marginal Prices.
-3,500,000
-3,000,000
-2,500,000
-2,000,000
-1,500,000
-1,000,000
-500,000
0
-€ 120,000,000
-€ 100,000,000
-€ 80,000,000
-€ 60,000,000
-€ 40,000,000
-€ 20,000,000
€ 0
France GB Spain Portugal Greece Switzerland Italy
Vo
lum
e o
f Im
bal
ance
(M
Wh
)
Co
st o
f Im
bal
ance
Cost of Downwards Imbalances
Cost of Downwards Imbalance - No TERRE Cost of Downwards Imbalance - TERRE BRP Downward Imbalance Volumes

Page 43 of 98
Figure 6-3: Net BRP Imbalances and Costs
The figure above shows the net imbalance and costs for BRPs by country. Where a country
has a net long position; they are activating downwards and hence show a negative imbalance
volume. Where a country has a net negative imbalance and the BRP costs become more
negative with TERRE, this shows an increase in payments to BRPs. Conversely where a coun-
try has a net short position, they are activating upwards and hence show a positive imbal-
ance volume. Where a country has a net positive imbalance and the BRP costs reduce with
TERRE, this shows a reduction in payments to BSPs. The figure shows Italy having a com-
paratively long position and sees a change from net payments from BRPs to BSPs to net
payments from BSPs to BRPs under TERRE.
6.3.2 Impact on BSPs
Although the volumes of imbalance needs for each country are constant between the two
study cases, the coupling of the different RR markets under TERRE allows for cheaper bids
to be activated in order to fulfil imbalance needs. Figure 6-4 and Figure 6-5 show the change
in activity.
It is not expected that the net volume of activations between the two study cases will be the
same. This is due to the netting of imbalances in the TERRE model case, where a market
that has an excess of energy can be matched with a market that has a shortfall, providing
there is ATC. There are also counter activations at the local and cross border level. These
counter activations occur where there is a net benefit in paying a BSP to reduce output.
Fulfilling this shortfall results in increasing the output of another BSP.
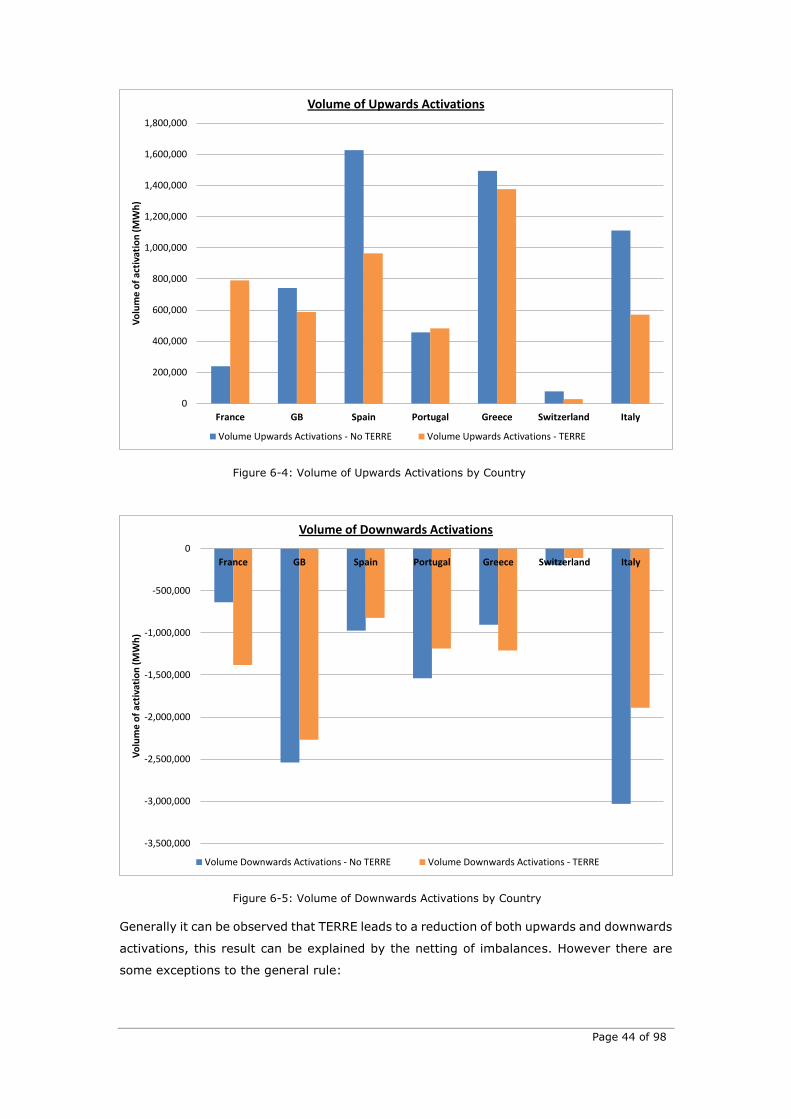
Page 44 of 98
Figure 6-4: Volume of Upwards Activations by Country
Figure 6-5: Volume of Downwards Activations by Country
Generally it can be observed that TERRE leads to a reduction of both upwards and downwards
activations, this result can be explained by the netting of imbalances. However there are
some exceptions to the general rule:
0
200,000
400,000
600,000
800,000
1,000,000
1,200,000
1,400,000
1,600,000
1,800,000
France GB Spain Portugal Greece Switzerland Italy
Vo
lum
e o
f ac
tiva
tio
n (
MW
h)
Volume of Upwards Activations
Volume Upwards Activations - No TERRE Volume Upwards Activations - TERRE
-3,500,000
-3,000,000
-2,500,000
-2,000,000
-1,500,000
-1,000,000
-500,000
0
France GB Spain Portugal Greece Switzerland Italy
Vo
lum
e o
f ac
tiva
tio
n (
MW
h)
Volume of Downwards Activations
Volume Downwards Activations - No TERRE Volume Downwards Activations - TERRE

Page 45 of 98
In Portugal upwards activations increase slightly, whilst downwards activation re-
duce under TERRE. This can be contrasted to the large reduction in Spain’s upwards
activations, and suggests a general trend of exporting RR energy from Portugal to
Spain.
Greece has a relatively high volume of activations, both with and without TERRE,
which are significantly higher than the volume of their imbalances. This can be
attributed to high numbers of local counter-activations, due to the lack of an intra-
day market.
BSPs in France are activated more under TERRE in both directions. The French
market borders four of the other members of TERRE, so it is expected that there
will be more opportunities to exploit ATC when prices favor either import or export
of balancing energy.
Figure 6-6 and Figure 6-7, illustrate the value of the activated volumes within each country.
Figure 6-6: Value of Upwards Activations
As expected from the increase in activations shown in Figure 6-4 and Figure 6-5 shows a
large increase in the value of the French activations. The Spanish and Italian values are
reduced, in line with the volume of activations.
€ 0
€ 20,000,000
€ 40,000,000
€ 60,000,000
€ 80,000,000
€ 100,000,000
€ 120,000,000
€ 140,000,000
€ 160,000,000
France GB Spain Portugal Greece Switzerland Italy
Vo
lalu
e a
ctiv
atio
ns
(€)
Value of Upwards Activations
Value Upwards Activations - No TERRE Value Upwards Activations - TERRE

Page 46 of 98
Figure 6-7: Value of Downward Activations
Figure 6-8: Net BSP Activations and Payments by country.
Figure 6-8 brings the net volumes and values of activations together into a single graph. In
general there is a reduction in the volumes of activations and a reduction in the value, which,
when positive, reduces payments to BSPs and when negative, increases the payments to
BRPs.
-€ 140,000,000
-€ 120,000,000
-€ 100,000,000
-€ 80,000,000
-€ 60,000,000
-€ 40,000,000
-€ 20,000,000
€ 0
France GB Spain Portugal Greece Switzerland ItalyV
ola
lue
act
ivat
ion
s (€
)
Downwards Activations
Value Downwards Activations - No TERRE Value Downwards Activations - TERRE
-2,000,000
-1,500,000
-1,000,000
-500,000
0
500,000
1,000,000
1,500,000
2,000,000
-€ 140,000,000
-€ 120,000,000
-€ 100,000,000
-€ 80,000,000
-€ 60,000,000
-€ 40,000,000
-€ 20,000,000
€ 0
€ 20,000,000
€ 40,000,000
€ 60,000,000
€ 80,000,000
€ 100,000,000
€ 120,000,000
€ 140,000,000
No ATC TERRE No ATC TERRE No ATC TERRE No ATC TERRE No ATC TERRE No ATC TERRE No ATC TERRE
France GB Spain Portugal Greece Switzerland Italy
Vo
lum
e o
f ac
tiva
tio
n (
MW
h)
Val
ue
of
acti
vati
on
Net Volume and Value of Activations
Net Volume Activations Net Value Activations
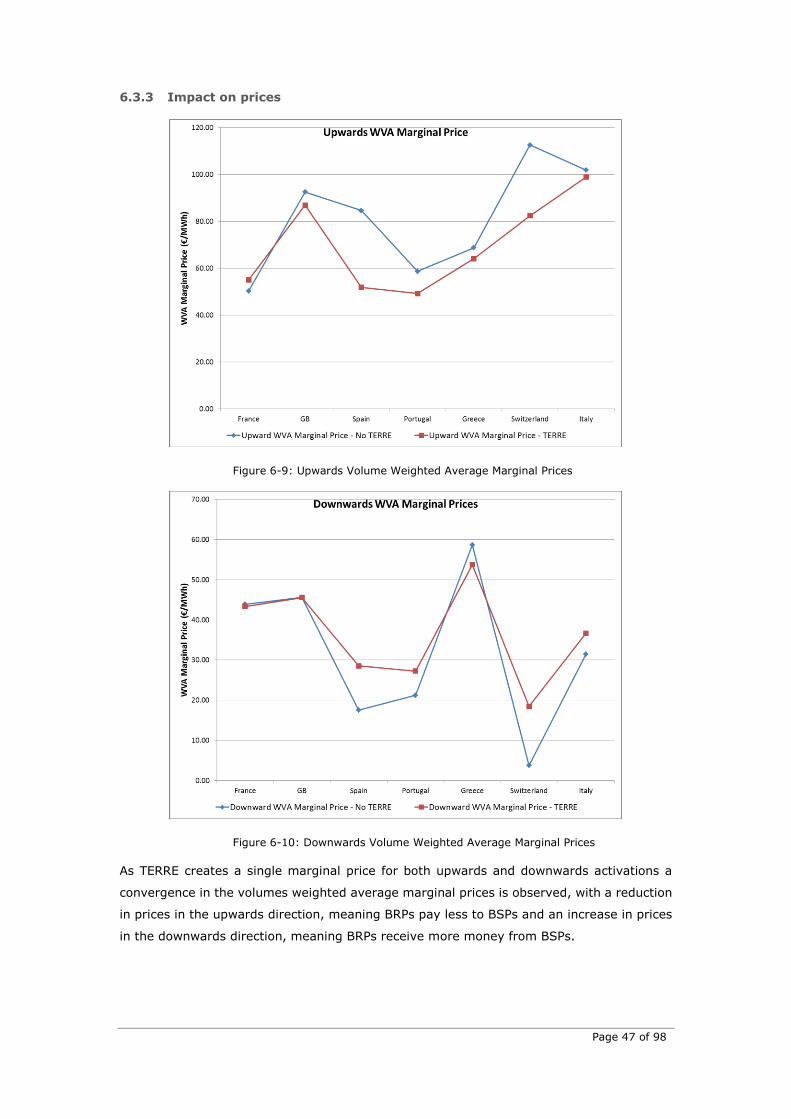
Page 47 of 98
6.3.3 Impact on prices
Figure 6-9: Upwards Volume Weighted Average Marginal Prices
Figure 6-10: Downwards Volume Weighted Average Marginal Prices
As TERRE creates a single marginal price for both upwards and downwards activations a
convergence in the volumes weighted average marginal prices is observed, with a reduction
in prices in the upwards direction, meaning BRPs pay less to BSPs and an increase in prices
in the downwards direction, meaning BRPs receive more money from BSPs.

Page 48 of 98
6.3.4 TERRE Annual Benefits
Figure 6-11: BRP Benefits of TERRE per Country
Figure 6-11 details the annual cost saving for BRPs per country, both in absolute terms and
as a percentage change compared to the values without TERRE. It is observed that Spain
sees the highest absolute saving in BRP costs, whereas Portugal sees the largest percentage
change with BSP to BRP payments, increasing from approximately €5.8m to €25.4m.
NB: the above graph should not be taken as forecast for future benefits
0.00%
50.00%
100.00%
150.00%
200.00%
250.00%
300.00%
350.00%
400.00%
€ 0
€ 10,000,000
€ 20,000,000
€ 30,000,000
€ 40,000,000
€ 50,000,000
€ 60,000,000
€ 70,000,000
France GB Spain Portugal Greece Switzerland Italy
% r
ed
uct
ion
in b
alan
cin
g co
sts
Be
nef
it
TERRE Net BRP Benefits
Annual reduction in BRP costs withTERRE % reduction in BRP costs with TERRE
Total TERRE Benefit: €150,573,060Total % Saving: 118.87%

Page 49 of 98
Figure 6-12: Impact on Net BRP Costs
Figure 6-12 places BRP costs of RR balancing energy from each study case into stacked
columns, which allows for the visualization of the impact on BRP costs with and without
TERRE. Stacks in the positive direction indicate a payment from BRPs to BSPs, whereas
stacks in the negative direction indicate a payment from BSPs to BRPs. It is observed that
for positive stacks the value decreases (less payments from BRPs to BSPs), whereas for
negative stacks the value increases (more payments from BSPs to BRPs). Overall, without
TERRE there is a net payment from BRPs to BSPs of €126.6m whereas with TERRE this flow
reverses to a net payment from BSPs to BRPs of €23.9m; this is represented by the black
line.
Figure 6-13: Comparison of BSP and BRP impacts

Page 50 of 98
Figure 6-13 compares the stacks of reduction in BSP payments and BRP costs. The discrep-
ancy in the values is the result of net costs associated with congestion rent between the
different bidding zones.
NB: the above graph should not be taken as forecast for future benefits
Figure 6-14: Congestion Rents Per Direction
Figure 6-14 shows the congestion rent by border and direction. The difference between re-
ductions in payments to BSPs and reduction in BRP costs (approx. €16.3m) shown in Fig-
ure 6-13 is the net of the congestion rent in each direction (e.g. FR -> GB minus GB ->
FR). A->B signifies the direction. FR is typically importing to GB, hence in the GB-FR direc-
tion this border is congested a lot more than in the opposite direction.
6.4 Qualitative Assessment of TERRE in 2018
As the simulations used in the TERRE CBA have been based on historical data from 2013 it
is important to assess how these results may change with the implementation of the GL EB.
This qualitative assessment has been performed for three key areas:
1. Change in Bidding Behavior
Due to the coupling of the different RR balancing markets and the move to marginal pricing,
the bidding behavior of BSPs in the different markets is expected to change. An increase in
the number of BSP competitors (now BSPs are not just competing against others in their
local market) is expected to drive down bid prices. In addition a move to marginal prices will
increase the incentive for BSPs to bid in at their short run marginal cost, whereas under pay-
as-bid they are incentivized to bid in at the price of the most expensive offer accepted.
The overall effect of these two factors is expected to reduce the bid prices of BSPs in com-
parison with the prices seen in the 2013 data used in the TERRE simulation.

Page 51 of 98
2. Changes in Imbalance Volumes
Due to the increased incentives on BRPs to be balanced or to have ‘helpful’ imbalances, it is
reasonable to expect a reduction in the volume of residual balancing performed by TSOs in
comparison to the 2013 data used in the TERRE simulation.
In addition to changes in the incentives to be balanced, we can also expect that the ability
of BRPs to be better balanced will improve due to the changes planned in the intra-day
market. If we see increased liquidity in the XB intra-day market and BRPs can balance their
position closer to real time than they can today, then it is also expected that the amount of
residual balancing to be performed by the TSO is reduced.
3. Changes in Available Transmission Capacity for Balancing
The GL EB also envisages the possibility to reserve XB capacity by TSOs for the purposes of
exchanging balancing energy if it is properly justified and after approval by NRAs. The TERRE
simulations only use the residual ATC following the closure of the ID market; hence any
reservation of XB capacity by TSOs would increase the ATC for TERRE.
Additionally, there are numerous projects to increase the cross border capacity on borders
within the TERRE region, with potentially three new HVDC interconnectors under develop-
ment on the France-GB border alone (IFA2, ElecLink and FAB Link).
The increases in cross border capacity coupled with the reservation of XB capacity for bal-
ancing will likely result in increased volumes of balancing energy being exchanged, which
could further increase the benefits for BRPs. It would also likely decrease the spread of
Marginal prices, hence lowering the value of congestion rent.
6.5 Conclusion
As shown in section 6.2, the costs for TSOs to create and maintain the TERRE platform are
initially in the range of 25M€ and 30M€ and ongoing costs are considered negligible. The
modelled benefits, for BRP imbalances, shown in Section 6.4, are approximately €150.6m
per year. The costs of implementing project TERRE are far outweighed by the benefits seen
across the region.
In addition to this, the distributional effects of the benefits are such that each member state
benefits from being part of the cooperation, albeit to varying degrees, as shown in Figure
6.11.
For this simulation to be performed; numerous assumptions have had to be made at various
stages of the analysis. Where possible we have tried to ensure that these assumptions are
reasonable and consistent across TSOs. Due to these assumptions and the use of historical
data, it is expected that the actual impact of TERRE, when the project goes live, will differ
from the results shown in this analysis.
However, in line with the broad trends highlighted in this analysis, and the qualitative as-
sessment on wider changes that could influence these results, it is still expected that project

Page 52 of 98
TERRE will deliver significant benefits, due to increased competition, greater liquidity, and
netting of TSO imbalance needs.
6.6 Questions for Stakeholders
Q 6.1 What are your views on the methodology used and assumptions made in
the Cost Benefit Analysis?
Q 6.2 What are your views on the results of the Cost Benefit Analysis?
Q 6.3 Do you think the conclusions of the Cost Benefit Analysis are valid for the
expected market in 2018?
Q 6.4 Do you have specific comments regarding chapter 6 content? (Please indi-
cate sub-chapter reference when possible)
7 Timing
7.1 Timeline
TERRE is a gate-managed system. Each phase of the process is conducted between the
opening and the closure of the corresponding gate. All TSO processes will be taken until H-
30min (H corresponds to the beginning of real time). After the TSO TERRE processes are
concluded, from H-30min to H, each TSO will activate its national units. The way thateach
TSO activates their local units is out of scope of this document.
Figure 7-1: TERRE Process Timeline
Parameter H-X min = RR Balancing Energy Gate Closure Time (applicable to BSP)
Parameter H-45min = TSO Energy Bid Submission Gate Closure Time
Although these parameters can be adjusted during the implementation phase, they were
defined in coordination with all involved parties.
Please note that the RR balancing energy GCT is still under discussion and will be harmonized
under the scope of the implementation of the GL EB.

Page 53 of 98
7.2 Process phases description
7.2.1 Pre-Tendering phase
The pre-tendering phase is the period between H-60m and H-X min, in which all TSOs receive
the intra-day Scheduling information and all BSPs can submit or update their balancing
energy offers and send them to its connecting TSO. After H-X min, no balancing energy
offers from the BSP will be accepted.
7.2.2 Tendering phase
In the tendering phase, all TSO will:
1. Calculate all their Imbalance Needs;
2. Perform operational security assessment in order to determine restricted bids
3. Calculate/update the available ATC;
4. The TSO shall submit to the TERRE platform all valid balancing energy offers (taking into
account the conversion of bids in Central Dispatch Systems) from its connecting BSPs.
All of this information will be sent by the TSO to the TERRE platform before the end of the
tendering phase, i.e., before H-45min.
Before sending the ATC, each TSO shall confirm with the neighboring TSOs the value of ATC
that will be sent to TERRE platform. How the ATC (communicated to TERRE platform by each
TSO and used in TERRE process) is confirmed/agreed among neighboring TSOs is out of
scope of this document.
7.2.3 Clearing phase
The algorithm computation phase is the period in which all balancing energy offers and
Imbalance Needs are processed by TERRE, taking into account the submitted balancing
energy offers and Imbalance Needs, the ATC, requirements and other constraints.
Important to stress that, TERRE will verify the ATC communicated by all TSOs.
The gate opening time of the algorithm computation phase coincides with the Gate Closure
Time of the tendering phase [H-45 min]. The end of the algorithm computation phase will
happen before the beginning of the results communication phase [H-35 min].
A period of 10 minutes is reserved for this process, but this can be reduced during the
implementation phase.
If at the end of the time reserved for this process no results were produced by the algorithm,
a fallback procedure will be activated.
7.2.4 Results communication and verification
The Results Communication Phase is between H-35min and H-30min, and is the period
reserved for:

Page 54 of 98
1. The communication of all session results from the TERRE algorithm to all TSOs,
namely RR activation results (price and volumes), ATC used in the clearing process,
Residual ATC4 and final CMOL;
2. The communication of the Scheduled Exchange5 to the TSOs and the ENTSOE
Verification Platform by TERRE platform.
a. In case of using the SO-SO scheduling process in Net Position: The ENTSOE
Verification Platform which will be hosted by the Coordination Center (Swissgrid
and Amprion) will be responsible for the verification of the TSOs Net Position
schedules resulting from TERRE platform.
b. In case of using the Scheduling process border to border: The current Cross
border scheduling processes will be handled.
7.2.5 Activation Period
Following the receipt of the TERRE clearing Results, each TSO will activate the BSPs in its
control area. The description of the procedure for the activation of the local unit is out of the
scope of this document and is the responsibility of each TSO.
To comply with the parameters of the TERRE Standard product, which has a Full Activation
Time of 30 minutes, this period will be between H-30m and H.
7.2.6 Delivery Period
The delivery period is a one-hour-long period, in which the TSO takes the necessary actions
to deliver the reserve activated by TERRE on its border. These actions are under the
responsibility of each TSO.
7.3 XB Scheduling Step
7.3.1 Description
In order to improve the exchange of energy between borders, we need to define a common
cross border scheduling step to be used in TERRE.
3 different possible Cross Border Scheduling Steps (1 hour, 30 minutes and 15 minutes),
were analyzed, and are represented in the following figures.
4 The Residual ATC is the Capacity available in the interconnection for one hourly period, after finalization
of the commercial transactions for this hourly period.
The Residual ATC will be calculated as follows:
Residual ATC = MAX (0, (NTC – (MIB + MIBi))
Where MIB is the netted inter-area hourly schedules and MIBi is the netted inter-area intraday schedules in the NTC direction.
5 Scheduled Exchange means the transfer scheduled between geographic areas, for each Market Time
Period and for a given direction

Page 55 of 98
Figure 7-2: Cross border Scheduling Step of 1 hour
Figure 7-3: Cross border Scheduling Step of 30 hour
Figure 7-4: Cross border Scheduling Step of 15 minutes
Currently all borders in the TERRE region have a cross border scheduling step of 1hr, with
the exception of the France-Switzerland border which is 30mins.
In the figure for a cross border Scheduling Step of 1 hour, it is explained that, because the
cross border program needs to be stable for the entire hour, only a part of the Imbalance
Need of the TSO will be met by cross border products (represented in grey). The rest of the
Imbalance Need, must be satisfied by National Products or by XB products (represented in
orange) out of the current scope of TERRE. The reduction of the XB Scheduling Step and the
consequent increase of the transacted balancing volumes through TERRE results in a higher
efficiency.
15min 15min 15min 15min
Allocated by local products or
XB products (bilateral agreements
1 Hour Scheduling Step Allocated by TERRE products
H-60m H H+15min H+30min H+45min H+1
TERRE Processing Delivery Period
15min 15min 15min 15min
Allocated by local products or
XB products (bilateral agreements
30 minutes Scheduling Step Allocated by TERRE products
H-60m H H+15min H+30min H+45min H+60m
TERRE Processing Delivery Period
15min 15min 15min 15min
All the Imbalance Needs are
allocated by TERRE products
15 minutes Scheduling Step
H-60m H H+15min H+30min H+45min H+60m
TERRE Processing Delivery Period

Page 56 of 98
To take advantage of the possibilities that this project offers, TSOs are investigating the
reduction of the XB scheduling step for balancing to 30 or 15 minutes, which will allow the
exchange of further energy between TSOs.
Thus, the common solution will be robust enough to allow the reduction of the scheduling
step during the implementation phase or a subsequent stage of the project and to deal with
the different values in place between the borders of the countries that participate in the
TERRE project.
7.4 TERRE Clearing Process
At this stage, the previous conclusions will allow only one clearing process per hour, as
represented in the following picture.
Figure 7-5: TERRE auction
7.5 Questions for Stakeholders
Q 7.1 What are your views on the reduction of XB scheduling step for balancing?
Q 7.2 What are your views on the interactions between the TERRE process and
the XB intra-day market?
Q 7.3 What are your views on the frequency of the clearing (one single clearing
per hour)?
Q 7.4 Do you have specific comments regarding chapter 7 content? (Please indi-
cate sub-chapter reference when possible)
H+60min
RR Clearing Delivery Period
H-60min H-45min H-30min H-15min H H+15min H+30min H+45min

Page 57 of 98
8 TERRE Platform - High Level Functional Architec-
ture
The High Level Functional Architecture shows the sequence of exchanges involved in this
hourly process for the platform and it is as illustrated below.
Figure 8-1: High Level Business Process
More detail regarding the exchange of information among BSPs, TSOs and TERRE platform
is presented in section 7.2.
8.1 Questions for Stakeholders
Q 8.1 Do you have specific comments regarding chapter 8 content? (Please indi-
cate sub-chapter reference when possible)

Page 58 of 98
9 Available Transmission Capacity
The cross border capacity is an input to the algorithmic optimization.
9.1 AC link
At this stage of the project, the TSOs decided to use all cross border Available Transfer
Capacity (ATC) after the intra-day market.
In normal network situation, for each TSO, the TERRE ATC = Net Transfer Capacity – Long
term cross border schedules – Day Ahead cross border schedules – intra-day cross border
schedules.
9.2 DC Links
By opposition to AC networks, DC interconnectors are fully controllable and therefore, the
power flowing on the link can be set by the interconnector operator. The main benefit of this
technology is that it is easier to manage imbalance (difference between metered energy and
commercial position), but the inconvenience is that the power on the link can only be
modified following a predefined maximum ramp-rate (for IFA this maximum is set at
100MW/min), without any possibility to overload the cables (in opposition to classic AC
networks). This means that in some situations where the scheduled power may vary a lot
from one hour to the next, it is impossible to completely get rid of the imbalance.
IFA example:
TERRE results will be physically firm, and the associated cost of imbalance (on both markets)
will be supported by the interconnector owner(s). In order to avoid high imbalance costs due
to important commercial variations, the concept of Physical Feasibility has been developed
(or ramping constraints). The hourly Physical Feasibility is for a given physical schedule of
the link, and taking into account all its constraints (maximum ramp-rates, tunnel, IC
limitations …), the biggest admissible energy upward and downward without generating
imbalance on that specific hour.
9.3 Questions for Stakeholders
Q 9.1 Do you agree with the proposed methodology for the calculation of available
transmission capacity used by TERRE solution for both AC and DC borders?
If not, what would be your proposal?
Q 9.2 Do you have specific comments regarding chapter 9 content? (Please indi-
cate sub-chapter reference when possible)

Page 59 of 98
10 Governance
10.1 High level description of the governance
TERRE is a cooperation of several European TSOs. For the implementation phase, mutual
rights and obligations of the TERRE Members will be laid down in a Cooperation agreement
signed by all TERRE Members. This Cooperation is not considered to be a partnership, joint
venture or other association between the TERRE Members at this stage.
The TSOs will have the decision power on the solution that will be tendered. TERRE Members
will commonly agree on the acceptance of the tender, thus deciding which solution will be
implemented. The respective platform will be operated under the responsibility of all TERRE
Members. The TERRE members will also be the owners of the platform.
TERRE TSOs will form a TERRE Steering Committee (SC), which will be the decision making
body of TERRE and a TERRE Working Group (TWG) which will be the expert body. The TWG
can consist of subgroups, such as ITWG and LGWG (Legal and Governance Working Group),
which can be created by the TERRE SC.
The TERRE TSOs, with the support of NRAs will involve Stakeholders in the development of
the different project stages. The TERRE Stakeholder meetings and workshops will be
organized at a “Regional” level and a “National” level.
Given that TERRE will implement the requirements of the GL EB as regards the exchange of
RR among the Member States involved, the NRAs of the TERRE area will approve the
conditions and methodologies proposed by TERRE Members that are subject to regulatory
approval pursuant to the GL EB.
10.2 Questions for Stakeholders
Q 10.1 Do you have specific comments regarding chapter 10 content? (Please in-
dicate sub-chapter reference when possible)

Page 60 of 98
11 Transparency
The Regulation on Transparency (543/2013), Article 17.1, states that specific information
about balancing has to be provided by "operators of balancing markets". The TSOs assume
that TERRE will be de facto balancing market operator for RR, and therefore would be
expected to submit data to the ENTSO-E Transparency Platform in accordance with the
provisions of article 17.1. (See Annex 7, chapter23)
Other obligations on TSOs for the publication of data outside of this scope are for further
study.
TSOs are responsible for the transparency of data submitted and issued by TERRE in respect
of Regulation on Transparency (543/2013), Article 17.1.
During the implementation phase of the CoBA, some information could be able to be issued
from the platform.
11.1 Questions for Stakeholders
Q 11.1 Do you have specific comments regarding chapter 11 content?
12 Harmonization Issues
12.1 Harmonization of price caps and floors
There are currently different regulation rules among the participating TERRE TSOs. One
example is negative prices, as the regulatory framework conditions in some countries allow
the use of negative prices, whereas others do not.
Currently, the draft GL EB (Art 42) states the following:
Article 42. Pricing method for balancing energy
“2. Balancing energy prices shall not be capped. In case TSOs identify that caps
are needed for consistency with other market timeframes, they may develop within
a proposal for harmonized pricing method for balancing energy a proposal for
harmonized maximum and minimum balancing energy prices to be applied in all
control areas. In such a case, harmonized maximum and minimum balancing energy
prices shall take into account the maximum and minimum clearing price for day-
ahead and intra-day timeframes pursuant to [Commission Regulation (EU)
2015/1222].”
The view of the TERRE TSOs is that harmonization of local rules would be the most efficient
solution to this issue. This involves the removal of caps & floors for balancing energy
markets.
Page 61 of 98
This solution is in line with the GL EB6 and guarantees non-discrimination to BSPs. However,
this is a regulatory issue that is under the scope of the NRAs.
While harmonization of rules is the end objective, in order to avoid potential delays to the
TERRE project, an interim solution through settlement has been developed, which will allow
TERRE to enter into force with the current design, while the local rules for price caps and
floors have yet to be harmonized.
12.1.1 Interim Solution through Settlement
The solution through settlement consists of a settlement re-adjustment at national level. In
simpler terms, the TSO-TSO settlement is not affected and the price of XB flows is respected
even from TSOs that do not accept negative prices. If the XB flow has a negative price, the
TSOs that do not allow negative prices perform an additional settlement at national scope in
order to be financially neutral, respecting, in parallel, the existing caps & floors. These
national re-adjustments will not affect the other TSOs and will be done solely at a national
level, after an agreement of the TSOs with their NRAs.
The main advantages of the solution through settlement are:
No additional constraints are introduced in the Balancing CMO, and the most optimal
solution is found
There is no need for a second round in the Balancing CMO, so this solution will save
time and reduce complexity
This solution is feasible no matter which new TSO enters the TERRE Cooperation (as
the Balancing CMO is not modified, even if the new TSO has cap or floor, this will
not influence the computation time of the CMO).
This information is explained further in Annex 3 (Chapter 19).
12.2 Harmonization of ID markets
As described in Table 2-2, TSOs of TERRE have different ID Market Time Resolution (MTR)
and Gate Closure Time (GCT).
The integration of balancing markets will require an in-depth discussion on the relationship
between intra-day and balancing timeframes. This discussion will take place in the context
of the development of a proposal from the European Commission on Electricity Market Design
in 2016 and the implementation of the CACM NC and GL EB.
6 The related article (42.2) in the current version of the GL EB is amended by ACER with the
following proposal: “In case TSOs identify that caps are needed for consistency with other
market timeframes, they may develop consistency with other market timeframes, they may
develop within a proposal”

Page 62 of 98
12.3 Questions for Stakeholders
Q 12.1 Which features (if any) of local balancing market design needs to be har-
monized for an efficient functioning of the TERRE project? If several,
please rank the first three you consider the most important to harmonies.
Q 12.2 Do you share the position from TERRE TSOs (i.e. the caps and floors in
balancing energy markets should be removed by the entry into force of
TERRE)?
Q 12.3 In case this cannot be done before the entry into force of EB GL, do you
agree on the transitional application of the solution through settlement?
Or which is your view regarding a backup solution?
Q 12.4 What is the minimum amount of time that market participants need to up-
date your RR balancing offers after receiving the results of the cross-bor-
der intra-day (XBID) process?
Q 12.5 Do you consider there are other key issues that need to be harmonized to
avoid significant distortions between BSP across TERRE Members States?
Q 12.6 Do you have specific comments regarding chapter 12 content? (Please in-
dicate sub-chapter reference when possible)

Page 63 of 98
13 Project Implementation Plan
13.1 Description of the PIP
The TERRE project implementation plan is expected to cover 2016, 2017 and part of 2018
for an entry into force window expected at the end of Q2, 2018, in line with the RR CoBA
implementation requirements of the current draft GL EB.
Currently, the project is divided in 4 main types of activities:
1. Legal: Management of Cooperation Agreements (both in implementation and
operational phases) between TSOs and the management of the Parallel Run phase,
which is the pre-requisite for the entry into force
2. Approval: Management of NRA’s and stakeholder’s information and approval
through the consultation and approval processes
3. Design: Management of the design of the TERRE solution through Provider(s)
selection (Request for Proposal management) and Functional Specifications
redaction
4. Implementation: Management of Terre Solution System development and Testing
activities
Figure 13-1: TERRE Project Implementation Plan
13.2 Legal activities
The redaction of two Cooperation Agreement documents is anticipated.
The first document will deal with contractual aspects linked to the governance model of the
implementation phase and set the framework of the cooperation between TSOs (ownership,
cost sharing, responsibilities, etc.). In particular, it will define the responsibility agreements
necessary to contract with a service provider (e.g. TERRE solution provider). This document
is expected to be validated in the middle of Q2, 2016.

Page 64 of 98
The redaction of the second document will start mid-2016 and is supposed to be validated
at the end of Q1, 2017. It will describe the legal dispositions between TERRE TSOs for the
Operational phase of TERRE.
The Parallel Run phase is expected to start before TERRE entry into force and last for less
than 6 months. It should validate the Operational capability of the TERRE solution and
processes.
13.3 Approval phases
Two approval phases are expected for the TERRE project.
The first phase presents the TERRE design phase results to stakeholders through a public
consultation process, taking place until end of April, 2016. This consultation feeds the
approval Package presenting the final design for TERRE and is expected to be submitted to
NRAs during Q2, 2016, for approval around June, 2016. NRAs will then provide a common
position regarding TSOs’ proposal on the TERRE design, and request changes if they deem
it relevant.
This support is a pre-condition for the launch of the TERRE solution development process.
The second approval phase will take place at the beginning of 2018 and submit the TERRE
Implementation results to NRAs for approval. The approval phase will be run according to
the provisions set in the GL EB. This second approval process is a pre-condition for the entry
into force of TERRE.
13.4 Design activities
The TERRE project is expected to request services from one or several providers for the
solution development.
A Request for Proposal (RFP) document will be prepared by project members according to
the validated design options, beginning 2016, and issued to service providers at the end of
Q2, 2016.
A selection process based on services provider’s answers to the RFP will lead to contractual
agreement(s) expected to be signed at the beginning of Q4, 2016. Contractual agreement(s)
are a pre-condition to start the technical activities for the TERRE solution.
TERRE project members will then work in cooperation with the selected service provider(s)
on the Technical Specification redaction. This activity is expected to run until the beginning
of 2017.

Page 65 of 98
13.5 Implementation activities
Development activities for the TERRE solution are expected to start at the beginning of 2017
and will last until the beginning of 2018. The TERRE project expects this development phase
to be divided into several phases (iterations).
In parallel, testing activities (Integration Tests) will take place during the whole
implementation phase in order to ensure full system operability (both technical and
functional). This phase includes test planning and realization.
13.6 Questions for Stakeholders
Q 13.1 Do you have specific comments regarding chapter 13 content? (Please in-
dicate sub-chapter reference when possible)
14 Possible evolutions
Additional TERRE process: Reduction of Market Time Unit or intra-day Gate Closure Time:
The evolution of the European electricity market could lead to a reduction of the Market Time
Resolution or the intra-day Gate Closure Time. If this happened, the project would need to
be adapted to new circumstances; for example, possible introduction of additional clearings.
Additional balancing products and processes: The centralized IT platform will be imple-
mented with enough flexibility to handle different processes and products (e.g. scheduled
balancing products, mFRR process…)
14.1 Questions for Stakeholders
Q 14.1 Do you have specific comments regarding chapter 14 content? (Please in-
dicate sub-chapter reference when possible)

Page 66 of 98
15 Glossary
15.1 Abbreviations
AC Alternative Current
aFRR automatic Frequency Restoration Reserve
ATC Available Transmission Capacity
BALIT Balancing Inter TSO
BSP Balancing Service Provider
BRP Balancing Responsible Party
BZ Bidding Zone
CBA Cost Benefits Analysis
CC Capacity Calculation (ATC or FB)
CDS Central Dispatch System
CGM Common Grid Model
CMO Common Merit Order
CMOL Common Merit Order List
CoBA Coordinated Balancing Area
DA Day Ahead
DC Direct Current
DO Downward Offer
DN Downward Need
DSR Demand Side Response
EB Electricity Balancing
ENTSO-E European Network of Transmission System Operators for Electricity
FAT Full Activation Time
FW Framework Guidelines
FRR Frequency Restoration Reserve
GCT Gate Closure Time
GL Guideline
GL EB Guideline on Electricity Balancing
HVDC High Voltage Direct Current
ID intra-day
ISP Imbalance Settlement Period
IT WG IT Working Group
LT Long Term
LG WG Legal & Governance Working Group
MBA Market Balancing Area
mFRR manual Frequency Restoration Reserve
MoU Memorandum of Understanding
MP Marginal Price
MRC Market Coupling of Region
NA Not applicable

Page 67 of 98
NDA Non-Disclosure Agreement
NRA National Regulatory Authority
NTC Net Transfer Capacity
PIP Project Implementation Plan
QR Qualified Recommendation
RES Renewable Energy Sources
RFI Request for Information
RFP Request for Proposal
RR Replacement Reserve
SoS Security of Supply
TERRE Trans European Replacement Reserve Exchange
TWG TERRE Working Group
TSC TERRE Steering Committee
TSO Transmission System Operator
WG Working Group
WG AS Working Group Ancillary Services
WP Working Package
XB Cross Border
15.2 Definitions
Delivery Period: means a time period of delivery during which the Balancing Service
Provider delivers the full requested change of power in-feed or withdrawals to the system.
Divisibility: means the possibility for the TSO to use only part of the balancing energy bids
or Balancing Capacity bids offered by the Balancing Service Provider, either in terms of power
activation or time duration. As requested by the Guideline on Electricity Balancing this
parameter will be under the responsibility of BSPs. This feature is strictly related with the
Maximum Bid Size.
Full Activation Time (FAT): means the time period between the activation request by TSO
and the corresponding full activation of the concerned product. The Full Activation Time is
the sum of the Preparation Period and the Ramping Period. The Full Activation Time is set to
30 min. Lower values can cause conflict with mFRR process.
Figure 15-1: Examples of TERRE FATs

Page 68 of 98
The TERRE Working Group (TWG) defined only the FAT in order to give the maximum level
of flexibility to the market.
For example you can have two different production units:
• Unit A: Preparation Period = 5 minutes, Ramping Period = 25 minutes;
• Unit B: Preparation Period = 25 minutes, Ramping Period = 5 minutes.
Both the production units are able to join the mechanism.
Location: The level of detail of this parameter is the Bidding Zone.
Maximum Bid Size: means the maximum amount of MW a BSP can aggregate in a single
offer. This parameter is related to the divisibility of the offers:
• in case of a divisible offer, no maximum bid size will be applied;
• in case of an indivisible offer, in order to avoid market arbitrage, the application of a
cap is needed. Considering the differences between the regulations of the Countries
involved, the TERRE Working Group decided, at least in a first stage, that local rules will
be implemented.
The Maximum delivery period represents the maximum time during which the BSP can
deliver the full requested power. It is set to 60 minutes. This value was introduced in order
to avoid any interference with the cross-border intra-day markets.
The combination of a Minimum delivery Period of 15 minutes and a Maximum delivery Period
of 60 minutes means that a BSP will be able to offer a product with a duration of 15, 30, 45
or 60 minutes.
The Minimum delivery period represents the minimum resolution time of each offer. It is
set to 15 minutes. This value was introduced in order to give higher flexibility to the market.
Minimum Quantity: means the minimum value that a BSP can offer. Small values lead to
higher flexibility for BSP. The minimum value is set to 1 MW.
Preparation Period: means the time duration between the request by the TSO and start
of the energy delivery. The Preparation Period can be from 0 to 30 minutes.
Price: the definition of the price of the bids will be under the responsibility of the BSPs
(respecting local rules). Actually negative prices cannot be accepted by several TSOs. This
issue will be submitted to the NRAs.
Ramping Period: means a period of time defined by a fixed starting point and a length of
time during which the input and/or output of Active Power will be increased or decreased.
The Ramping Period can be from 0 to 30 minutes.
Recovery Period: means the minimum time between the delivery period and the following
activation of an offer presented by a BSP. It will be defined by the BSP.
Resolution: Having a resolution of 0.1 MW means that, in case an offer is partially accepted
(e.g. pro rata), the value will be rounded at the value with one decimal number.

Page 69 of 98
Social Welfare: Area between the buying (positive imbalance needs/downward offers) and
the selling (negative imbalance needs/upward offers) curve.
Validity Period: means the time period when the balancing energy bid offered by the
Balancing Service Provider can be activated, whereas all the characteristics of the product
are respected. The Validity Period is defined by a beginning time and an ending time. It will
be defined by the BSP but cannot exceed the Maximum delivery period (60 minutes).

Page 70 of 98
16 Summary of questions for Stakeholders
Stakeholders are invited to answer the following questions, directly linked to the chapters of
this document.
A dedicated tool is available on ENTSO-E website at the address communicated in the launch
letter of this consultation. Please be aware that only comments made using this channel will
be taken into account.
Preliminary remarks:
Questions marked by (*) are open questions on the whole chapter.
Question marked by (**) is an introduction question where stakeholders can freely
comment on the whole content of the document and share opinion on TERRE pro-
ject in general.
Chapter Question ID
Questions
0 General Q 0(**)
Please share your overall questions or comments about the consulta-tion document and TERRE project in general. (Please consider all ques-
tions before as some topics may already be addressed in a dedicated question)
1 Introduction Q 1.1(*) Do you have specific comments regarding chapter 1 content? (Please indicate sub-chapter reference when possible)
2
Overview of dif-ferent manual
reserves bal-
ancing markets in TERRE
Q 2.1(*)
Do you have specific comments regarding chapter 2 content? (Please indicate sub-chapter reference when possible)
3 Product & Im-balance Need
Q 3.1 Which format of balancing energy offers are most attractive to stake-holders?
Q 3.2 Do stakeholders agree with the definition and features of the TERRE cross border product?
Q 3.3 What are the stakeholder’s views on BRP-TSO & BSP-TSO rules & re-quirements?
Q 3.4
Does the TERRE product allow for the participation of all types of bal-ancing service providers (e.g. RES, Thermal, and DSR)? And if not,
what changes in the features will allow greater participation in the
TERRE project?
Q 3.5
What are your views on the application of the local features of the
TERRE cross border product (e.g. Harmonization of price cap and floors or Maximum Bid Sizes for Indivisible Offers)?
Q 3.6
The number of bid formats (Divisible, Block, Exclusive, Linking Offers)
which may be used by BSP represents a trade-off between the flexi-bility offered to BSP (with several types of offers) and the simplicity to offer bids and to run the algorithm (e.g., with only one standard type of offer). What are you views on this trade-off? Would you advocate for keeping all types of bids offered by TSOs or to reduce the number of possible offers?
Q 3.7 Do you agree with the proposed design of the TSO imbalance need?
Q 3.8 Do you agree with the possibility for inelastic and elastic imbalance
needs?
Q 3.9(*) Do you have specific comments regarding chapter 3 content? (Please indicate sub-chapter reference when possible)

Page 71 of 98
Chapter Question ID
Questions
4 Balancing CMO and Algorithm
Q 4.1 Do you have any specific comments on the Balancing CMO description?
Q 4.2 What is your opinion on allowing internal and XB counter-activations?
Q 4.3 Do you agree with the proposed treatment of HVDC losses?
Q 4.4(*) Do you have specific comments regarding chapter 4 content? (Please indicate sub-chapter reference when possible)
5 Settlement
Q 5.1 Do you agree that the proposed settlement design is in line with the principles of the EB GL and the integration of balancing markets?
Q 5.2
Do you agree with the application of cross border marginal pricing,
settlement of the block and the proposed design for the definition of Marginal Price between TSOs at the XB level?
Q 5.3 What is your perspective regarding the alignment of the TSO-TSO set-tlement procedure and the BSP-TSO settlement procedure?
Q 5.4(*) Do you have specific comments regarding chapter 5 content? (Please indicate sub-chapter reference when possible)
6 Cost Benefit
Analysis
Q 6.1 What are your views on the methodology used and assumptions made
in the Cost Benefit Analysis?
Q 6.2 What are your views on the results of the Cost Benefit Analysis?
Q 6.3 Do you think the conclusions of the Cost Benefit Analysis are valid for the expected market in 2018?
Q 6.4(*) Do you have specific comments regarding chapter 6 content? (Please indicate sub-chapter reference when possible)
7 Timing
Q 7.1 What are your views on the reduction of XB scheduling step for bal-ancing?
Q 7.2 What are your views on the interactions between the TERRE process and the XB intra-day market?
Q 7.3 What are your views on the frequency of the clearing (one single clear-
ing per hour)?
Q 7.4(*) Do you have specific comments regarding chapter 7 content? (Please indicate sub-chapter reference when possible)
8
TERRE platform
- High Level Functional Ar-
chitecture
Q 8.1(*)
Do you have specific comments regarding chapter 8 content? (Please
indicate sub-chapter reference when possible)
9 Available Trans-mission Capac-
ity
Q 9.1 Do you agree with the proposed methodology for the calculation of available transmission capacity used by TERRE solution for both AC and DC borders? If not, what would be your proposal?
Q 9.2(*) Do you have specific comments regarding chapter 9 content? (Please indicate sub-chapter reference when possible)
10 Governance Q 10.1(*) Do you have specific comments regarding chapter 10 content? (Please
indicate sub-chapter reference when possible)
11 Transparency Q 11.1(*) Do you have specific comments regarding chapter 11 content? (Please indicate sub-chapter reference when possible)
12 Harmonization
Issues Q 12.1
Which features (if any) of local balancing market design needs to be harmonized for an efficient functioning of the TERRE project? If sev-eral, please rank the first three you consider the most important to harmonies.

Page 72 of 98
Chapter Question ID
Questions
Q 12.2 Do you share the expectation from TERRE TSOs (i.e. the caps and floors in balancing energy markets should be removed by the entry into force of TERRE)?
Q 12.3 In case this cannot be done before the entry into force of EB GL, do you agree on the transitional application of the solution through set-tlement? Or which is your view regarding a backup solution?
Q 12.4
What is the minimum amount of time that market participants need
to update your RR balancing offers after receiving the results of the cross-border intra-day (XBID) process?
Q 12.5
Do you consider there are other key issues that need to be harmonized
to avoid significant distortions between BSP across TERRE Members
States?
Q 12.6(*) Do you have specific comments regarding chapter 12 content? (Please
indicate sub-chapter reference when possible)
13 Project Imple-mentation Plan
Q 13.1(*) Do you have specific comments regarding chapter 13 content? (Please indicate sub-chapter reference when possible)
14 Possible evolu-
tions Q 14.1(*)
Do you have specific comments regarding chapter 14 content? (Please indicate sub-chapter reference when possible)

Page 73 of 98
17 Annex 1: CMO - References to the GL EB
All references are to the ACER qualified recommendation (QR) on the GL EB (August 2014)
published in July, 2015.
17.1 Framework for Exchange Balancing Energy for Replacement Reserves
Art.15 of the GL EB stipulates that the Regional integration model for Replacement Reserves
which is consisted of Coordinated Balancing Areas with aims to share and exchange
balancing energy bids from all Standard and Specific Products for Replacement Reserves.
TERRE aims to fulfil this stipulation and to create the framework for the exchange of
balancing energy for Replacement Reserves.
17.2 TERRE Standard Product to be exchanged
Art.32 (4) stipulates that a Standard Product for balancing energy shall be defined as having
standard characteristics:
a) Preparation Period;
b) Ramping Period;
c) Full Activation Time;
d) minimum and maximum quantity;
e) Deactivation Period;
f) minimum and maximum duration of delivery period;
g) Validity Period; and
h) Mode of Activation. The TERRE Product is described according to the above criteria
17.3 TERRE Fall Back process
Art.36 (1) prescribes that “Each TSO shall ensure that fall back processes are in place in
case the normal procedure fails”.
Art.36 (2) stipulates that: “In case the procurement of Balancing Services fails, all TSOs of
a Coordinated Balancing Area shall perform a repetition of the procurement process
consistent with the objectives of this Regulation. TSOs shall inform Market Participants that
fallback procedures will be used as soon as reasonably practicable”
TERRE TSOs are suggesting the Fall Back processes fulfilling the above stipulation.
17.4 TERRE Algorithm design options
17.5 Social Welfare Objective / Specific Cases: Counter-activation
According to the General Objective of the GL EB, Ar. 11 (1.(b)) an objective of this regulation
is the enhancing efficiency of Balancing as well as the efficiency of European, regional and
national Balancing Markets.
According to the stipulations for the pricing method to be applied,
Art.42 (1): Such pricing method shall:
(d) give correct price signals and incentives to Market Participants;
Page 74 of 98
According to the algorithm development stipulations Ar. 69(6): all TSOs of a Coordinated
Balancing Area established for the Exchange of balancing energy shall develop an algorithm
to be operated by the Activation Optimization Function for the activation of balancing energy
bids in accordance with the principles for balancing algorithms. This algorithm shall:
(a) Minimize the costs of Balancing;
Therefore the maximization of social welfare is the simpler and more straightforward option
that satisfies the above stipulations. Allowing counter activations improves the market
efficiency of Balancing, gives correct price signals and incentives to Market Participants and
minimizes the costs of Balancing.
17.5.1 Flow term in the objective function / Congestions
Art.43 (1): Each TSO shall use cost effective balancing energy bids available for delivery in
its control area through Common Merit Order Lists for ensuring Operational Security.
Art .45 (9): All TSOs of a Coordinated Balancing Area shall have the right to establish an
Activation Optimization Function in accordance with Article 43 and Article 45 for the
optimization of the activation of balancing energy bids from different Common Merit Order
Lists. This function shall at least take into account:
(a) activation processes and technical constrains from different balancing energy
products;
(b) operational Security;
(c) all Balancing Energy bids included in the compatible Common Merit Order Lists;
(d) the possibility to net the counteracting activation requests from TSOs;
(e) submitted activation requests of all TSOs of a Coordinated Balancing Area; and
(f) available Cross Zonal Capacity.
Art.69 (2): The Activation Optimisation Function shall
(a) respect Operational Security constraints;
(b) take into account technical and network constraints; and
(c) if applicable, take into account the available Cross Zonal Capacities.
Minimizing the flows using the flow terms function ensures the operational security. The
Congestion constraints satisfy the requirements for Operational Security, technical and
network constraints and the available Cross Zonal Capacities.
17.5.2 One single CMO / One-stage clearing process
Art.45 (3) Each Activation Optimization Function shall use at least one Common Merit Order
List for upward balancing energy bids and one Common Merit Order List for downward
balancing energy bids.
Art.45 (6): Each TSO shall submit its activation requests for Balancing Energy bids to the
Activation Optimization Function

Page 75 of 98
Art.45 (7): The Activation Optimization Function shall select balancing energy bids and
request the activation of selected balancing energy bids from the Connecting TSOs of the
respective Coordinated Balancing Area where the Balancing Service Provider, associated with
the selected balancing energy bid, is connected
Art.45 (9): All TSOs of a Coordinated Balancing Area shall have the right to establish an
Activation Optimization Function in accordance with Article 43 and Article 45 for the
optimization of the activation of balancing energy bids from different Common Merit Order
Lists. This function shall at least take into account:
(a) activation processes and technical constrains from different balancing energy
products;
(b) Operational Security;
(c) all balancing energy bids included in the compatible Common Merit Order Lists;
(d) the possibility to net the counteracting activation requests from TSOs;
(e) submitted activation requests of all TSOs of a Coordinated Balancing Area; and
(f) available Cross Zonal Capacity.
In order to allow the possibility to net the counteracting activation requests from TSOs, as
well as to utilize as much as possible the available Cross Zonal Capacity the one-stage
clearing process design was selected
17.5.3 Elastic Imbalance Need
Art.43 (1): Each TSO shall use cost effective balancing energy bids available for delivery in
its control area through Common Merit Order Lists for ensuring Operational Security.
Art.45 (10): All TSOs that operate the Frequency Restoration Process and the Reserve
Replacement Processes to balance their Control Area shall strive for using all balancing
energy bids from relevant Common Merit Order Lists to balance the system in the most
efficient way taking into account Operational Security.
Allowing the TSOs to price their Imbalance Need fulfil the above two stipulations.
17.5.4 Price calculation function TERRE - Marginal Pricing
Art.42 (1) stipulates that “No later than one year after the entry into force of this Regulation,
all TSOs shall develop a proposal for harmonized pricing method for balancing energy. The
proposed pricing method shall be based on marginal pricing (pay-as-cleared), unless TSOs
complement the proposal with a detailed analysis demonstrating that a different pricing
method is more efficient for European-wide implementation pursuing the general objectives
defined in Article 11”
TERRE algorithm uses marginal pricing
Art.42 (2): balancing energy prices shall not be capped […]
TERRE TSOs suggests not using price caps, only IT limits

Page 76 of 98
18 Annex 2: Congestion Rent
18.1 References:
The congestion rent principals are defined in the lays down the Regulation R 714-2009 (article 16-6) and the GL EB GL EB (Article 55). The extracted references are:
Extract from the Regulation R 714-2009 (article 16-6)
“Any revenues resulting from the allocation of interconnection shall be used for the following
purposes:
(a) Guaranteeing the actual availability of the allocated capacity; and/or
(b) Maintaining or increasing interconnection capacities through network investments, in
particular in new interconnectors.
If the revenues cannot be efficiently used for the purposes set out in points (a) and/or (b)
of the first subparagraph, they may be used, subject to approval by the regulatory authori-
ties of the Member States concerned, up to a maximum amount to be decided by those
regulatory authorities, as income to be taken into account by the regulatory authorities when
approving the methodology for calculating network tariffs and/or fixing network tariffs.
The rest of revenues shall be placed on a separate internal account line until such time as it
can be spent on the purposes set out in points (a) and/or (b) of the first subparagraph. The
regulatory authority shall inform the Agency of the approval referred to in the second sub-
paragraph.”
Extract from GL EB (Article 55):
“2. Each regulatory authority shall ensure the financial neutrality of all
TSOs under its competence with regard to the financial outcome as a result of
the settlement pursuant to Chapters 2 to 4 of this Title, over the regulatory
period as defined by the competent regulatory authority.”
18.2 Examples
An example is shown below, with two systems A and B:
Imbalance Need (A) = 0 MW
Imbalance Need (B) = + 200 MW
ATC (AB) = 100 MW
Figure 18-1: Congestion Rent - Systems

Page 77 of 98
If there was infinite ATC, the CMO would be the following:
Figure 18-2: Congestion Rent - CMO
However, taking into account the ATC constraints (ATC AB = 100MW):
Figure 18-3: Congestion Rent – ATC constraints
Thus, the first 100MW will be activated in Area A and will be exported to Area B, which
will cover the rest of the Imbalance Need with activation of 100 MW in Area B. As a
result, there will be different Marginal Prices (MP) at both sides of the
interconnector (Area A and Area B, respectively):
Figure 18-4: Congestion Rent – Marginal Price difference
Being MP (B) > MP (A) and energy flowing from Area A to Area B (economic sense).
In this example, the price that Area B is “willing to pay” (MP (B)) for the exchanged
balancing energy (100 MW) is higher than the price that Area A is “willing to receive”
(MP (A)) for exporting this energy.
TERRE congestion rent = TERRE schedule x (PB– PA)
Being: PB > PA and the TERRE schedule of balancing energy flowing from Area A to Area
B.

Page 78 of 98
Figure 18-5: Congestion Rent

Page 79 of 98
19 Annex 3: Harmonization of Caps and Floors
Example of solution through settlement
19.1 Conditions
The solution presented in this section is valid under the following assumptions:
1. Local rules are applied; hence, if a TSO does not accept negative prices, its BSPs
cannot offer negative prices too.
2. The volume of all BSP offers from one system is greater or equal to the volume of
its TSO need in the corresponding direction.
19.2 Solution Analysis
It has been agreed that in TERRE, marginal pricing (MP) will be used. Note here that if the
MP is negative, then upward balancing energy offers with a positive price will never be
activated; if they were activated, they would affect the MP and the resulting MP would be
positive. In addition, if the MP is negative, then all downward balancing energy offers with a
positive price (they are willing to pay for decrease their production) will be activated, as the
problem maximizes the social welfare. It is easier to understand the two observations above
by looking at a simplified merit order list. In reality the problem is much more complex as
such merit order lists would be realistic for one time-step, divisible offers and no ATC
constraints.
Figure 19-1: Simplified merit order list
To analyze the proposed solution, we distinguish two cases:
1. A TSO that does not allow negative prices has a positive imbalance need and

Page 80 of 98
2. A TSO that does not allow negative prices has a negative imbalance need
TSO with positive imbalance need
In the following, we assume that a TSO that does not accept negative prices has a positive
need. If the MP is negative, the TSO will always import from TERRE, because its upward
offers (priced with positive price) will never be activated. In this case, the XB flow will have
a negative price and the TSO will have a surplus. This surplus should be redistributed to its
national system.
Example with MP < 0
Let’s analyze an example where a TSO (A) does not accept negative prices and that has a
positive need (meaning that this TSO needs upwards balancing energy). Let’s consider that
the need from TSO A is inelastic.
In this example, the green arrows reflect the volume of need submitted by this TSO A (UN
A) and the minimum required volume of upwards offers submitted from system A (sum of
all UO A; according to the assumptions of chapter 19.1, the volume of BSP offers submitted
by each TSO must be greater or equal to the volume of its need in the same direction).
Figure 19-2: TSO with positive imbalance need - Example with MP<0
In this example:
The result of the Balancing CMO delivers a Marginal Price (MP) with negative price
(-10 €/MWh)
All the upwards inelastic need of system A (UN A) has been satisfied
All the volume of downwards offers of system A (DO A) has been activated (this is
logic, as these offers have positive price and the resulting MP is negative)
The result is that system A will import balancing energy
For the settlement in system A we will have the following:
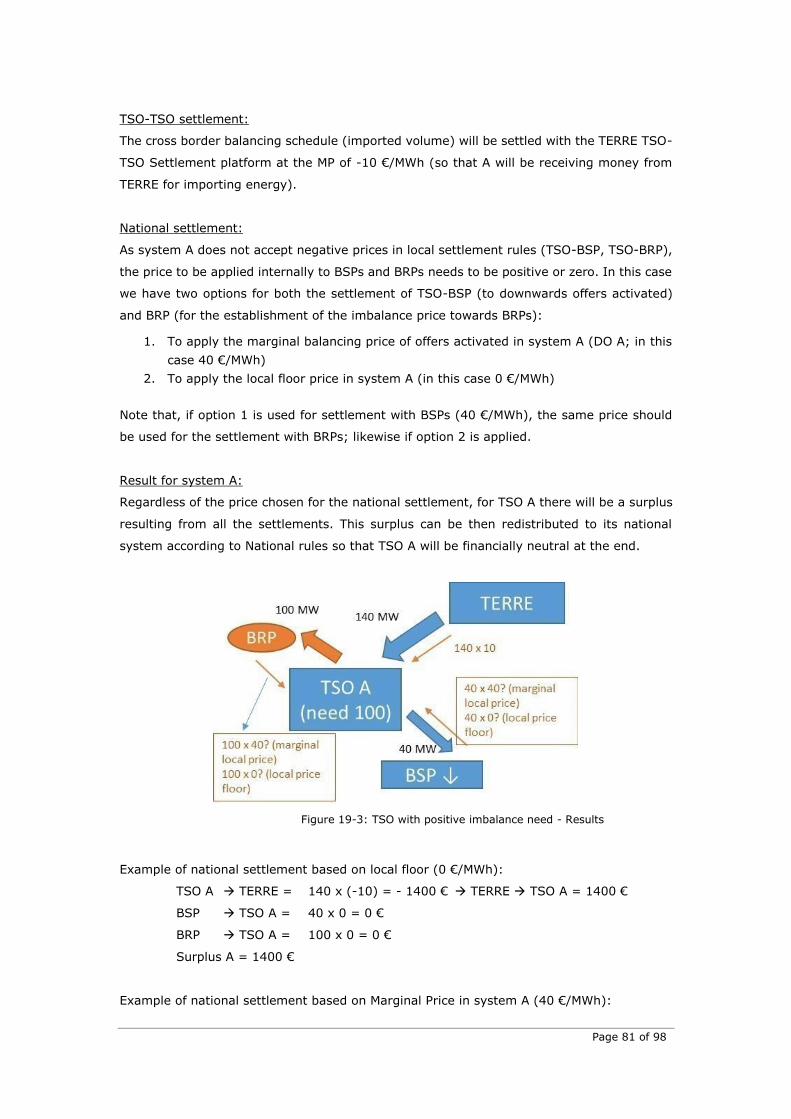
Page 81 of 98
TSO-TSO settlement:
The cross border balancing schedule (imported volume) will be settled with the TERRE TSO-
TSO Settlement platform at the MP of -10 €/MWh (so that A will be receiving money from
TERRE for importing energy).
National settlement:
As system A does not accept negative prices in local settlement rules (TSO-BSP, TSO-BRP),
the price to be applied internally to BSPs and BRPs needs to be positive or zero. In this case
we have two options for both the settlement of TSO-BSP (to downwards offers activated)
and BRP (for the establishment of the imbalance price towards BRPs):
1. To apply the marginal balancing price of offers activated in system A (DO A; in this
case 40 €/MWh)
2. To apply the local floor price in system A (in this case 0 €/MWh)
Note that, if option 1 is used for settlement with BSPs (40 €/MWh), the same price should
be used for the settlement with BRPs; likewise if option 2 is applied.
Result for system A:
Regardless of the price chosen for the national settlement, for TSO A there will be a surplus
resulting from all the settlements. This surplus can be then redistributed to its national
system according to National rules so that TSO A will be financially neutral at the end.
Figure 19-3: TSO with positive imbalance need - Results
Example of national settlement based on local floor (0 €/MWh):
TSO A TERRE = 140 x (-10) = - 1400 € TERRE TSO A = 1400 €
BSP TSO A = 40 x 0 = 0 €
BRP TSO A = 100 x 0 = 0 €
Surplus A = 1400 €
Example of national settlement based on Marginal Price in system A (40 €/MWh):
Page 82 of 98
TSO A TERRE = 140 x (-10) = - 1400 € TERRE TSO A = 1400 €
BSP TSO A = 40 x 40 = 1600 €
BRP TSO A = 100 x 40 = 4000 €
Surplus A = 7000 €
TSO with negative imbalance need
In the following, we assume that a TSO that does not accept negative prices has a negative
need. Here, we can distinguish the following two cases:
1. The price of the TSO need is greater or equal to zero; this automatically implies that
if the price is negative, then the TSO cannot accept it. However, all the downward
offers of the TSO would be activated as they would be priced with a positive price.
Therefore, this TSO could not satisfy its need through TERRE; all its offers would be
activated, and there could be issues of operational security if the TSO would not
have other options to satisfy its need.
2. The TSO does not have other means than TERRE to satisfy its need and would be
inelastic. Therefore the TSO offers a negative price (-2000€ i.e. price cap of the
platform) even if the current local rules would not allow it. However, this could be
crucial for its operational security
In the first case, the need of the TSO is not satisfied by TERRE if MP is negative.
In the second case, the TSO need will be satisfied as long as the TSO is inelastic. In addition,
as aforementioned, all its downward offers and none of its upward offers will be activated,
as they have positive price. According to the rules presented in 19.1 the volume of its
downward offers should be greater or equal to the volume of the need. Therefore, in the
system of the TSO that does not accept negative prices we will have only downward
activation that will be at least equal to the volume of the TSO need.
For instance, if the TSO has a need equal to -100MW (needs 100MW reduction), then its
downward activation (BSPs reducing their generation) will be at least equal to 100MW.
Consequently, either the TSO does not import/export anything (if downward activations are
equal to 100MW) or it imports (if downward activations are more than 100MW). However,
as long as the rules presented in conditions are applied, this TSO will never export.
Thus, for this TSO the sum of the XB flows on its border will be zero, or will import. If it
imports and the price is negative, then it has a surplus as in the case of positive imbalance
need.
Example with MP < 0
Let’s analyze an example where a TSO (A) does not accept negative prices and that has a
negative need (meaning that this TSO needs downwards balancing energy). Let’s consider
that the need from TSO A is inelastic, meaning that the need from system A will be at a “-
∞” price in the CMO.

Page 83 of 98
The green arrows reflect the volume of need submitted by TSO A and the minimum required
volume of downwards offers submitted from system A.
Figure 19-4: TSO with negative imbalance need - Example with MP<0
In this example:
The result of the Balancing CMO delivers a Marginal Price (MP) with negative price
(-10 €/MWh)
All the downwards inelastic need of system A (DN A) have been satisfied
All the volume of downwards offers of system A (DO A) has been activated (this is
logic, as these offers have positive price and the resulting MP is negative).
Taking into account the assumption of chapter 2.1, this volume of downwards offers
(DO) will be equal or higher than the volume of downwards needs (DN):
o System A will never export in this situation
o If volume of DO = volume of DN System A will have Net Position
equal to zero
o If volume of DO > volume of DN System A will import balancing
energy
In this example we assume that volume of DO = volume of DN, so the net position of A will
be zero.
For the settlement in system A, we will have the following:
TSO-TSO settlement:
No balancing energy to be settled with the TERRE TSO-TSO Settlement platform
National settlement:
As system A does not accept negative prices in local settlement rules (TSO-BSP, TSO-BRP),
the price to be applied internally to BSPs and BRPs need to be positive or zero. As in the
previous example, we have two options for both the settlement of TSO-BSP (to downwards
offers activated) and BRP (for the establishment of the imbalance price towards BRPs):

Page 84 of 98
1. To apply the marginal balancing price of offers activated in system A (DO A; in this
case 40 €/MWh)
2. To apply the local floor price (in this case 0 €/MWh)
Note that, if option 1 is used for settlement with BSPs (40 €/MWh), the same price should
be used for the settlement with BRPs. And the same if option 2 is applied.
Result for system A:
Regardless the price chosen for the national settlement, the system A will be neutral or have
a surplus resulting from all the settlements. This surplus can be then redistributed to its
national system according to National rules so that the TSO A will be at the end financially
neutral.
Figure 19-5: TSO with negative imbalance need - Results
Example of national settlement based on local floor (0 €/MWh):
TSO A TERRE = 0 €
BSP TSO A = 100 x 0 = 0 €
TSO A BRP = 100 x 0 = 0 €
Surplus A = 0 €
Example with national settlement based on marginal price in system A (40 €/MWh):
TSO A TERRE = 0 €
BSP TSO A = 100 x 40 = 4000 €
TSO A BRP = 100 x 40 = 4000 €
Surplus A = 0 €
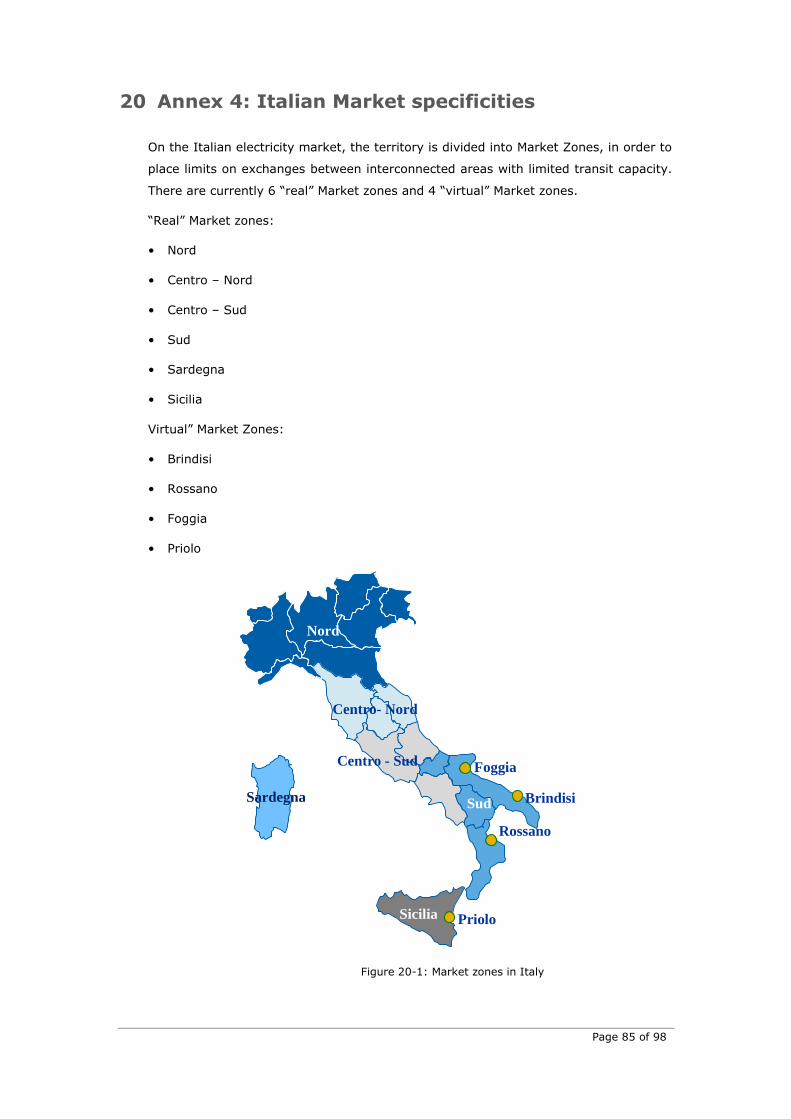
Page 85 of 98
20 Annex 4: Italian Market specificities
On the Italian electricity market, the territory is divided into Market Zones, in order to
place limits on exchanges between interconnected areas with limited transit capacity.
There are currently 6 “real” Market zones and 4 “virtual” Market zones.
“Real” Market zones:
• Nord
• Centro – Nord
• Centro – Sud
• Sud
• Sardegna
• Sicilia
Virtual” Market Zones:
• Brindisi
• Rossano
• Foggia
• Priolo
Figure 20-1: Market zones in Italy
Nord
Priolo
Rossano
Centro- Nord
Centro - Sud
Sud Sardegna Brindisi
Foggia
Sicilia
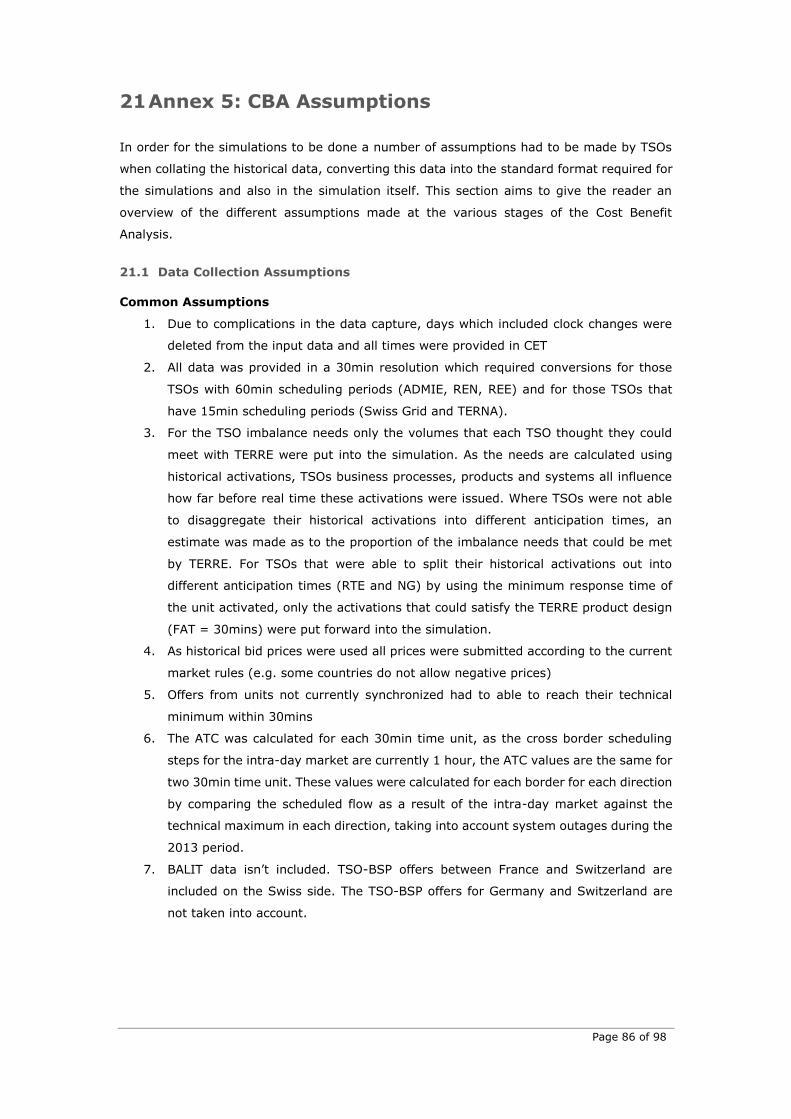
Page 86 of 98
21 Annex 5: CBA Assumptions
In order for the simulations to be done a number of assumptions had to be made by TSOs
when collating the historical data, converting this data into the standard format required for
the simulations and also in the simulation itself. This section aims to give the reader an
overview of the different assumptions made at the various stages of the Cost Benefit
Analysis.
21.1 Data Collection Assumptions
Common Assumptions
1. Due to complications in the data capture, days which included clock changes were
deleted from the input data and all times were provided in CET
2. All data was provided in a 30min resolution which required conversions for those
TSOs with 60min scheduling periods (ADMIE, REN, REE) and for those TSOs that
have 15min scheduling periods (Swiss Grid and TERNA).
3. For the TSO imbalance needs only the volumes that each TSO thought they could
meet with TERRE were put into the simulation. As the needs are calculated using
historical activations, TSOs business processes, products and systems all influence
how far before real time these activations were issued. Where TSOs were not able
to disaggregate their historical activations into different anticipation times, an
estimate was made as to the proportion of the imbalance needs that could be met
by TERRE. For TSOs that were able to split their historical activations out into
different anticipation times (RTE and NG) by using the minimum response time of
the unit activated, only the activations that could satisfy the TERRE product design
(FAT = 30mins) were put forward into the simulation.
4. As historical bid prices were used all prices were submitted according to the current
market rules (e.g. some countries do not allow negative prices)
5. Offers from units not currently synchronized had to able to reach their technical
minimum within 30mins
6. The ATC was calculated for each 30min time unit, as the cross border scheduling
steps for the intra-day market are currently 1 hour, the ATC values are the same for
two 30min time unit. These values were calculated for each border for each direction
by comparing the scheduled flow as a result of the intra-day market against the
technical maximum in each direction, taking into account system outages during the
2013 period.
7. BALIT data isn’t included. TSO-BSP offers between France and Switzerland are
included on the Swiss side. The TSO-BSP offers for Germany and Switzerland are
not taken into account.

Page 87 of 98
ADMIE
1. Only offers from lignite and gas units were put into the data collection
2. Due to the lack of an organised balancing market the TSO imbalance need has been
determined by comparing the Day Ahead schedule with the measured production of
above mentioned units
3. The minimum response time of the different units offering into TERRE was calculated
using a Volume Weighted Average Ramp-rate plus an additional two minutes to
receive the instruction.
4. The minimum activation time for lignite units was assumed for be 60mins and for
gas units this was assumed to be 0mins
5. Due to the lack of an organised balancing market the prices for downward offers
were assumed to be equal to the unit variable cost. Prices for upward offers were
assumed to be equal to unit variable cost plus 10%.
6. For lignite units the upward volumes for submitted offers were calculated as the
difference of the Net Capacity and the Day Ahead schedule. Downward volumes are
calculated as the difference of the Day Ahead schedule and the Technical Minimum.
7. For gas units the upward volumes are calculated as the difference of the Net Capacity
and the Actual Net Production. Downward volumes are calculated as the difference
of the Actual Net Production and the Technical Minimum.
National Grid
1. Due to the fact that the GB Balancing Mechanism is used for both balancing and
system management actions, only the activations used for energy purposes were
used to determine the NG imbalance needs.
2. Minimum response time was assumed to be same for all units rather than providing
individual response times for each unit.
3. A minimum activation time of 0mins was assumed for all units
4. All prices for offers converted into € from £ using an exchange rate of 0.85 £/€,
which was the Bloomberg average for 2013.
5. Units that were contracted to provide Firm Frequency Response were given a default
price of 2000€ or -2000€ depending on the direction, for all periods during contract
dates.
6. Nuclear and wind generation have been excluded from the upward volume with
volumes and prices both set to zero. Nuclear generation has also been omitted from
downward volume, whereas wind was included for downward availability.
REE
1. As a standard 15min product is used for the volume considered to constitute the
TERRE imbalance need, the minimum response time for all units offering volume was
assumed to be 15mins.
2. The minimum delivery period was specified by the BSP for each period

Page 88 of 98
REN
1. For CCGT units a Weighted Average Ramp was used to determine the minimum
response time. For Hydro units this was assumed to be a fixed value.
2. A minimum activation time of 0mins was assumed for all units
RTE
1. The minimum response time was provided by each BSP for each 30min settlement
period to deliver the offered volume.
2. The hydraulic pumped energy transfer stations (STEP) was deleted from the offers
and thus need volume, as they present complex energy constraints that can't be
integrated in the algorithm in a first step. They represent a great volume of activation
for balancing for France that can explain the small imbalance need volume submitted
into TERRE for France.
3. Only the already started unit could offer a volume into TERRE, as we took into
account the starting time of the units.
4. The primary and secondary French reserves are taken off the offered and thus need
volume.
5. The minimum delivery period was specified by the BSP for each period
SwissGrid
1. As a standard 15min product is used for the volume considered to constitute the
TERRE imbalance need, the minimum response time for all units offering volume was
assumed to be 15mins.
2. A minimum activation time of 0mins was assumed for all units
TERNA
1. Only offers from the North Italian bidding zone were considered for the purposes of
the simulation
2. Only three types of units were considered for the technical parameters, hydro,
pump and thermal.
3. For the minimum response time a standard value of 15mins was assumed for
thermal units and a value of 5mins for hydro units.
4. A minimum activation time of 15 mins was assumed for all units
21.2 Data Conversion Assumptions
1. TSOs provided both separate upwards and downwards imbalance needs for each 30
minute time step. In order to get a single net imbalance figure for each 30 minute
time step these imbalance needs in each direction were compared to calculate the
net imbalance need. The mean of these was then taken for each one hour period.
2. Using the information provided by the TSOs, the imbalance needs were filtered to
only provide the volume of needs that could be satisfied by TERRE. The offers were
also filtered to only include units with a Minimum Activation Time (MAT) and
Minimum Response Time (MRT) that was compliant with the TERRE product
characteristics (i.e. MAT =<60mins and MRT =<30mins).

Page 89 of 98
3. All TSO imbalance need were assumed to be inelastic, thus were set to a default
price of 2000€/-2000€. The imbalance need is constant over the hour and
unidirectional.
4. All offers were assumed to be divisible and exclusive.
21.3 Simulation Assumptions
1. TSOs provided both separate upwards and downwards imbalance needs for each 30
minute time step. In order to get a single net imbalance figure for each 30 minute
time step these imbalance needs in each direction were compared to calculate the
net imbalance need for each period.
2. The simulation doesn’t take into account any potential stock constraints, which set
a limit to the total volume of MW that can be instructed during a given period (e.g.
some hydro units).
3. Counter-activations are allowed
4. The Marginal Price is calculated for each bidding zone, which will be the same in the
absence of congestion
5. The algorithm has one clearing, that is to say that it optimises on the entire time
period (one hour) at the same time.
22 Annex 6: The Input Data for the CBA simulation
22.1 TSO Imbalance Needs
Figure 22-1: Mean Overall imbalance Volumes

Page 90 of 98
This is the arithmetic mean of the imbalances upwards and downwards in isolation over the
year in MW. SG has the smallest upward imbalance with REE and TERNA; the largest. On
the downward side TERNA again has the largest imbalance and Greece the smallest.
Figure 22-2: Total Imbalance Needs
In line with the assumptions outlined in Annex 5, Figure 22-2 illustrates the total imbalance
need separated upwards and downwards. The REE has the largest positive imbalance with
SG having the smallest.

Page 91 of 98
Figure 22-3: Number of time steps need positive/negative
Another method of presenting the TSO imbalance needs is showing the number of time steps
(one hour) whether the imbalance is zero, positive or negative. A key observation is that
there are no time steps where TSOs have zero imbalances.
22.2 BSP offers
Figure 22-4: Volume/Price Mean for Upwards offers

Page 92 of 98
Figure 22-5: Volume/Price Mean for downward offers
These two figures plot the mean volume and price of upwards and downwards offers for each
country. As shown in figure 23.4 TERNA has the most expensive upwards offers and REN the
highest volume. In figure 23.5, NG has the highest downward volume and ADMIE has the
highest priced downward offers.
22.3 ATC
FR-CH CH-FR
FR-ES ES-FR
FR-IT IT-FR
0
200
400
600
800
1000
1200
1400
0
10
0
20
0
40
0
60
0
80
0
10
00
12
00
14
00
16
00
18
00
20
00
22
00
24
00
26
00
28
00
30
00
32
00
34
00
36
00
38
00
Mo
re
fre
qu
en
cy
bin
0
500
1000
1500
2000
2500
3000
3500
0
10
0
20
0
40
0
60
0
80
0
10
00
12
00
14
00
16
00
18
00
20
00
22
00
24
00
26
00
28
00
30
00
32
00
34
00
36
00
38
00
Mo
re
fre
qu
en
cy
bin
0
500
1000
1500
2000
2500
3000
0
10
0
20
0
40
0
60
0
80
0
10
00
12
00
14
00
16
00
18
00
20
00
22
00
24
00
26
00
28
00
30
00
32
00
34
00
36
00
38
00
Mo
re
fre
qu
en
cy
bin
0
200
400
600
800
1000
1200
1400
1600
1800
2000
0
10
0
20
0
40
0
60
0
80
0
10
00
12
00
14
00
16
00
18
00
20
00
22
00
24
00
26
00
28
00
30
00
32
00
34
00
36
00
38
00
Mo
re
fre
qu
en
cy
bin
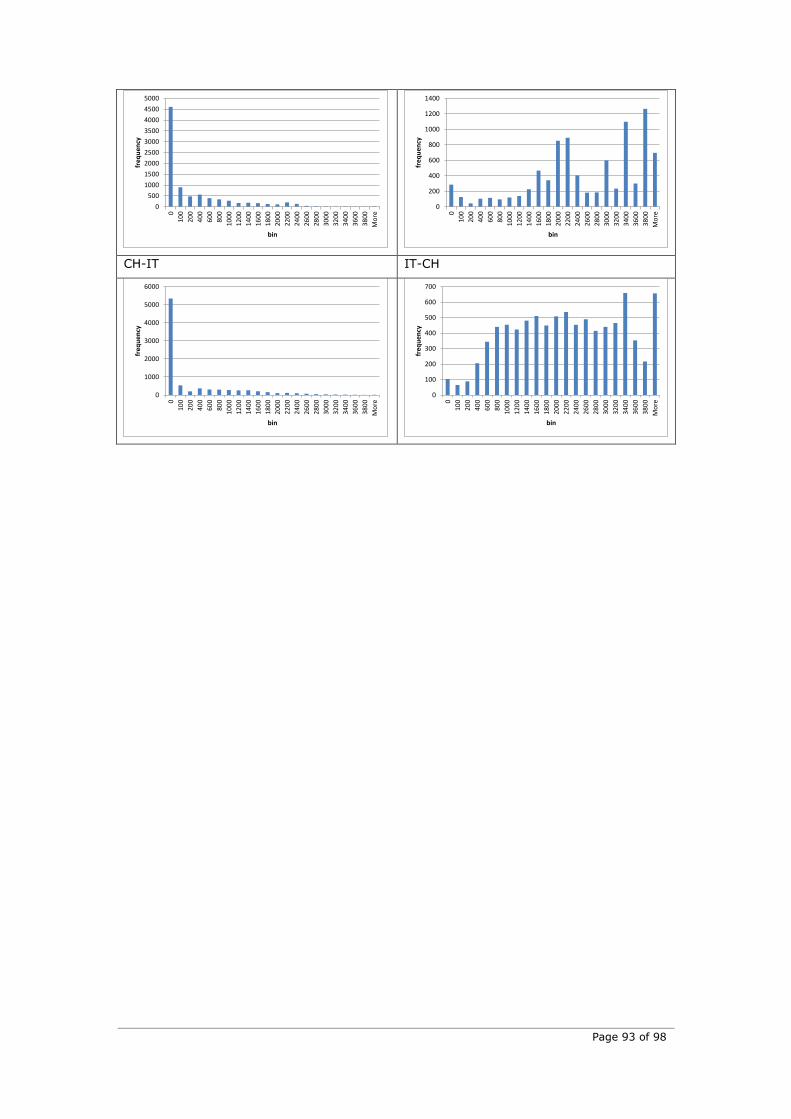
Page 93 of 98
CH-IT IT-CH
0
500
1000
1500
2000
2500
3000
3500
4000
4500
5000
0
10
0
20
0
40
0
60
0
80
0
10
00
12
00
14
00
16
00
18
00
20
00
22
00
24
00
26
00
28
00
30
00
32
00
34
00
36
00
38
00
Mo
re
fre
qu
en
cy
bin
0
200
400
600
800
1000
1200
1400
0
10
0
20
0
40
0
60
0
80
0
10
00
12
00
14
00
16
00
18
00
20
00
22
00
24
00
26
00
28
00
30
00
32
00
34
00
36
00
38
00
Mo
re
fre
qu
en
cy
bin
0
1000
2000
3000
4000
5000
6000
0
10
0
20
0
40
0
60
0
80
0
10
00
12
00
14
00
16
00
18
00
20
00
22
00
24
00
26
00
28
00
30
00
32
00
34
00
36
00
38
00
Mo
re
fre
qu
en
cy
bin
0
100
200
300
400
500
600
700
0
10
0
20
0
40
0
60
0
80
0
10
00
12
00
14
00
16
00
18
00
20
00
22
00
24
00
26
00
28
00
30
00
32
00
34
00
36
00
38
00
Mo
re
fre
qu
en
cybin

Page 94 of 98
GR-IT IT-GR
SP-PT PT-SP
FR-UK UK-FR
Figure 22-6: Histogram of ATC across the year
0
500
1000
1500
2000
2500
3000
3500
0
10
0
20
0
40
0
60
0
80
0
10
00
12
00
14
00
16
00
18
00
20
00
22
00
24
00
26
00
28
00
30
00
32
00
34
00
36
00
38
00
Mo
re
fre
qu
en
cy
bin
0
500
1000
1500
2000
2500
3000
0
10
0
20
0
40
0
60
0
80
0
10
00
12
00
14
00
16
00
18
00
20
00
22
00
24
00
26
00
28
00
30
00
32
00
34
00
36
00
38
00
Mo
re
fre
qu
en
cy
bin
0
100
200
300
400
500
600
700
800
0
10
0
20
0
40
0
60
0
80
0
10
00
12
00
14
00
16
00
18
00
20
00
22
00
24
00
26
00
28
00
30
00
32
00
34
00
36
00
38
00
Mo
re
fre
qu
en
cy
bin
0
100
200
300
400
500
600
0
10
0
20
0
40
0
60
0
80
0
10
00
12
00
14
00
16
00
18
00
20
00
22
00
24
00
26
00
28
00
30
00
32
00
34
00
36
00
38
00
Mo
re
fre
qu
en
cy
bin
0
500
1000
1500
2000
2500
3000
3500
4000
4500
5000
0
10
0
20
0
40
0
60
0
80
0
10
00
12
00
14
00
16
00
18
00
20
00
22
00
24
00
26
00
28
00
30
00
32
00
34
00
36
00
38
00
Mo
re
fre
qu
en
cy
bin
0
500
1000
1500
2000
2500
3000
0
10
0
20
0
40
0
60
0
80
0
10
00
12
00
14
00
16
00
18
00
20
00
22
00
24
00
26
00
28
00
30
00
32
00
34
00
36
00
38
00
Mo
re
fre
qu
en
cy
bin

Page 95 of 98
FR-CH CH-FR
FR-ES ES-FR
0
500
1000
1500
2000
2500
3000
RTE -SWISSGRID
SWISSGRID- RTE
RTE - NG NG - RTE RTE - REE REE - RTE RTE -TERNA
TERNA -RTE
SWISSGRID- TERNA
TERNA -SWISSGRID
ADMIE -TERNA
TERNA -ADMIE
REE - REN REN - REE
MW
Average Daily ATC

Page 96 of 98
FR-IT IT-FR
CH-IT IT-CH
GR-IT IT-GR
ES-PT PT-ES
FR-UK UK-FR
Figure 22-7: Histogram average per day ATC per border

Page 97 of 98
23 Annex 7: Transparency Requirements
Please find below the extracted information from the Transparency Regulation paper (Art.
17).
At a XB level:
(j) if applicable, information regarding Cross Control Area Balancing per balancing time unit, specifying:
— the volumes of exchanged bids and of-fers per procurement time unit,
— maximum and minimum prices of ex-
changed bids and offers per procurement time unit,
— volume of balancing energy activated in the control areas concerned.
(i) in point (j) of paragraph 1 shall be published no later than one hour after the operating period.
At National level:
(a) rules on balancing including:
— processes for the procurement of different
types of balancing reserves and of balancing energy,
— the methodology of remuneration for both the provision of reserves and activated en-ergy for balancing,
— the methodology for calculating imbal-ance charges,
— if applicable, a description on how cross-
border balancing between two or more con-trol areas is carried out and the conditions for generators and load to participate;
(b) the amount of balancing reserves under contract (MW) by the TSO, specifying:
— the source of reserve (generation or load),
— the type of reserve (e.g. Frequency Con-tainment Reserve, Frequency Restoration Reserve, Replacement Reserve),
— the time period for which the reserves are contracted
(e.g. hour, day, week, month, year, etc.);
(a) in point (b) of paragraph 1 shall be published as soon as possible but no later than two hours before the next pro-curement process takes place;

Page 98 of 98
(c) prices paid by the TSO per type of pro-
cured balancing reserve and per procure-ment period (Currency/MW/period);
(b) in point (c) of paragraph 1 shall be
published as soon as possible but no later than one hour after the procure-ment process ends;
(d) accepted aggregated offers per balanc-
ing time unit, separately for each type of balancing reserve;
(c) in point (d) of paragraph 1 shall be
published as soon as possible but no later than one hour after the operating period;
(e) the amount of activated balancing en-ergy (MW) per balancing time unit and per type of reserve;
(d) in point (e) of paragraph 1 shall be published as soon as possible but no later than 30 minutes after the operating period. In case the data are preliminary,
the figures shall be updated when the data become available;
(f) prices paid by the TSO for activated bal-ancing energy per balancing time unit and per type of reserve; price information shall be provided separately for up and down reg-ulation;
(e) in point (f) of paragraph 1 shall be published as soon as possible but no later than one hour after the operating period;
(g) imbalance prices per balancing time
unit;
(f) in point (g) of paragraph 1 shall be
published as soon as possible;
(h) total imbalance volume per balancing time unit;
(g) in point (h) of paragraph 1 shall be published as soon as possible but no later than 30 minutes after the operating period. In case the data are preliminary,
the figures shall be updated when the data become available;
(i) monthly financial balance of the control
area, specifying:
— the expenses incurred to the TSO for pro-curing reserves and activating balancing en-ergy,
— the net income to the TSO after settling
the imbalance accounts with balance re-sponsible parties;
(h) in point (i) of paragraph 1 shall be
published no later than three months af-ter the operational month. In case the
settlement is preliminary, the figures shall be updated after the final settle-ment;