terrestrial green algae diversity in oil …ijaer.in/uploads/ijaer_02__36.pdfout in 3-years old oil...
TRANSCRIPT

International Journal of Agriculture and Environmental Research
ISSN: 2455-6939
Volume:02, Issue:03
www.ijaer.in Copyright © IJAER 2016, All right reserved Page 529
TERRESTRIAL GREEN ALGAE DIVERSITY IN OIL PALM PLANTATION AND SECONDARY FOREST USING
18S-rDNA PCR-DGGE APPROACH
Lim Chin Tsong1, Wong Sing King1, Japar Sidik Bujang2*, Siti Ramlah Ahmad Ali3
1Department of Animal Science and Fishery, Faculty of Agriculture and Food Sciences, Universiti Putra Malaysia Bintulu Sarawak Campus, Nyabau Road, P. O.
Box 396, 97008 Bintulu, Sarawak, Malaysia.
2Department of Biology, Faculty of Science, Universiti Putra Malaysia, 43400 UPM Serdang, Selangor, Malaysia.
3Applied Entomology & Microbiology Unit, Biology Research Division, Malaysian Palm Oil Board, No.6, Persiaran Institusi, Bandar Baru Bangi, 43000 Kajang,
Selangor, Malaysia.
ABSTRACT
The demand for vegetables oils especially palm oil has increased drastically. However, rapid development in oil palm industry leads to many issues, especially regarding sustainable development of palm oil cultivation. Soil algae play an important role in the maintenance of soil fertility as well as recycling of soil organic matter. Their taxonomic knowledge in tropical soils is still scarce, especially in oil palm plantation. Hence, this study was performed to access the heterogeneity of soil algae community structure in response to oil palm plantation activities and compare with nearby secondary forest by using 18S-rDNA PCR-DGGE. Sampling was carried out in 3-years old oil palm plantation at Sungai Asap, Sarawak and nearby disturbed and undisturbed secondary forest. Significant differences in soil chemical properties and soil texture of oil palm plantation were evident: soil organic C, total N and CEC were significantly decreased. Oil palm plantation showed highest richness and diversity of the green algae, followed by disturbed secondary forest and undisturbed secondary forest. Three main clusters were obtained through UPGMA dendrogram generated with dice coefficient, one cluster from each sampling sites, except for some oil palm plantation sampling points were in the same cluster

International Journal of Agriculture and Environmental Research
ISSN: 2455-6939
Volume:02, Issue:03
www.ijaer.in Copyright © IJAER 2016, All right reserved Page 530
as with the disturbed secondary forest. Collectively, these results revealed that disturbance by both human or agricultural activity altered soil algae richness and diversity.
Keywords: Green algae, 18S rDNA PCR-DGGE, oil palm plantation, undisturbed secondary forest, disturbed secondary forest
INTRODUCTION
Palm oil is one of the world's most produced and consumed vegetable oils. In the past two decades, global palm oil production has increase 4-folds, from 15 million metric tonnes (1995) to current 61.4 million metric tonnes (2015) [1]. Palm oil, at 41%, dominates the current global vegetables oil market, followed by soybean, 31% [2]. This may attributed by the advantages of oil palm tree, that it gives higher oil yield per hectare when compared with other oil crops [3], as well as capable of growing on soil that’s not suitable for other crops [4]. Today, more than 85% of global palm oil supply is produced from Asia, particularly in Malaysia and Indonesia [5]. Oil palm plantations in Malaysia have expanded and cover a large area of land since its introduction in 1870’s. Total oil palm planted area has increased to 5.6 million hectares
or 4.6% compared to the previous year (2014) as recorded by MPOB [6]. Besides being the largest state in Malaysia, Sarawak is also one of the main contributors of palm oil production, which recorded 40.9% increment of planted area as compared to the year 2011. In order to meet increasing global palm oil consumption, more new area has been opened for oil palm cultivation. However, further expansion of palm oil planted area also lead to increasing scrutiny due to the effects on the environment. Algae inhabit a number of different terrestrial habitats which include soil, rocks, and caves [7, 8, 9]. Soil algae exist in all kinds of soils, from the poles to tropical, from the desert over grass land, and from forest to agricultural soil. Some of these soils may contain various pollutants, from industrial or agricultural activities [10]. The green algae or Chlorophyta has 450 genera and 7,000 species under it [11]. The most diverse group of soil algae is blue-green algae and green algae as compare to the other two algae phyla, xanthophyta and bacillariophyta [12]. Green-algae are the major groups of algae of tropical soils [13] and they are predominating in acidic soils [14]. According to Bérard et al. [15], algae tend to live in community structures that depending on soil type, method of farming and application of pesticide. As such, they could be the first biological crust that will be exposed to any changes. The role of soil algae include soil formation, which lead to stability and mature soil [16, 17], soil nutrients conservation [18], improvement of soil texture and structure [8, 19], and associated with numerous food webs [20]. Soil algae also

International Journal of Agriculture and Environmental Research
ISSN: 2455-6939
Volume:02, Issue:03
www.ijaer.in Copyright © IJAER 2016, All right reserved Page 531
contribute to the fertility and stability of soil through fixation of carbon and nitrogen, and binding soil particle together to reduce erosion.
Different management practices as well as disturbance to the soil may alter microbial diversities in the soil [21]. Furthermore, certain ecological factors are believed to affect the diversity of algae in soil [22], such as local climate [23] and vegetation [24]. Yet, very few studies have been carried out to study soil algae diversities in tropical region, especially green algae in agricultural as well as disturbed and undisturbed soil. Soil green algae analysis has been limited in the past by the available technology and methods. However, with the introduction and advancement in sequencing technologies and genomics studies, microbial community analysis has reached a new era with the aid of culture-independent techniques [25, 26]. Denaturing gradient gel electrophoresis or DGGE is a powerful tools for microbial ecology studies [27, 28, 29]. Hence, this study was conducted to evaluate and compare the community structures as well as the diversity of green algae in oil palm plantation and the nearby secondary forest.
MATERIALS AND METHODS
Sampling Site
Sampling was carried out at the Malaysian Palm Oil Board (MPOB) Sungai Asap Research Station at Belaga, Sarawak. Two area from secondary forest (S1: undisturbed soil and S2: disturbed soil) and an oil palm plantation (OP: plantation soil) were chosen as study sites. Ten sampling points (P1 to P10) were sampled with 4 randomly picked replicate from each sampling point. The replicates were then pooled together as one sampling point. Top layer contains organic debris was removed with the aid of a trowel and the topsoil was collected (0 to 15 cm). Soil samples collected were divided for nucleic acid extraction and another portion for soil texture and soil chemical properties analysis. Samples for nucleic acid extraction were kept at ambient temperature in sterile plastic tubes during transportation and immediate stored in -20ºC while awaiting further analysis.
Soil Texture Determination and Soil Chemical Properties Analysis
Soil samples collected were air dried at room temperature. Ten sampling points (P1 to P10) of each sampling sites were pooled together as one homogenous sample before sub sampling was carried out (n=3) . The soil samples were analysed by a local agro-chemistry laboratory, RH Biotech Sdn. Bhd. in Sibu, Sarawak for basic soil chemical analysis. Soil pH, total nitrogen (TN), total phosphorous (TP), available phosphorous (avail. P), exchangeable potassium (exch. K), calcium (exch. Ca), magnesium (exch. Mg), and cation exchange capacity (CEC) were determined with the laboratory in-house methods (ID T001-S, T002-S, T003-S, T004-S, and

International Journal of Agriculture and Environmental Research
ISSN: 2455-6939
Volume:02, Issue:03
www.ijaer.in Copyright © IJAER 2016, All right reserved Page 532
T005-s, respectively), which was based on MS 678: Part I, II, IV, V, VLLL: 1980 while organic carbon based on MS 678: Part III: 1980. Soil texture was determined by Soil Physics laboratory at the Department of Land Management, Faculty of Agriculture, UPM by using the Texture AutoLookup programme and classified based on U.S. Department of Agriculture Classification [30]. Soil chemical properties results were statistically analysed with analysis of variance (ANOVA) using SAS software (version 9.0, SAS Institute, Cary NC). Differences between sampling sites were grouped using LSD test and data were expressed as the mean ± SD. Differences were considered significant when the p value was < 0.05.
Soil Nucleic Acid Extraction
Nucleic acids were extracted from 0.25 g of soil sample using PowerSoil DNA isolation kit (MoBio Laboratories, USA) following the manufacturer’s instructions, with modification. Fifty
µl of C6 solution was used instead of the suggested 100 µl to increase the concentration of the eluted DNA obtained. The extracted DNA was confirmed on a 0.8% agarose gel run in 1x TAE buffer (40 mM Tris; pH 8.0, 20 mM acetate acid, 1.0mM EDTA). Then, 2.0 µl of the extracted DNA was used directly in PCR amplifications.
Polymerase Chain Reaction (PCR)
PCR was done according to the protocol from Moro et al. [31]. The designed primers were able to amplify a 473 bp fragment of 18S rDNA of Chlorophyceae. The primers include a forward primer, ChloroF (5’-TGG CCT ATC TTG TTG GTC TGT-3’) and a reverse primer, ChloroR
(5’-GAA TCA ACC TGA CAA GGC AAC-3’). A GC-clamp was attached at the 5’ end of the
reversed primer to prevent complete melting during fragments separation [32]. A final volume of 25.0 µl PCR mixtures was prepared by mixing with 1x PCR buffer, 1.5 mM of MgCl2, 0.2 µM of dNTP mix (Fermentas, Maryland, USA), 0.5 µM of each primer, and 1.25 U of Taq DNA polymerase (Fermentas, Maryland, USA). The PCR parameters included an initial denaturation at 94ºC for 3 min followed by 35 cycles of 94ºC (1 min), 55.6ºC (1 min), and 72ºC (1 min), then with an additional 10 min of final extension at 72ºC. Agarose gel (1%) was used to confirm the PCR products as well as their position with the aid of DNA standards (Fermentas GeneRuler™
1kb DNA Ladder, Maryland, USA).
DGGE analysis and Comparison of DGGE Patterns
PCR products were separated by using DCode™ Universal Mutation Detection System (Bio-Rad Laboratories Inc., Hercules, CA, USA). PCR products were loaded into a 7% gel (w/v) parallel polyacrylamide gels (37.5:1; acrylamide: bisacrylamide) run in 60ºC of 1x TAE buffer with a denaturing gradient of 30% to 50% (100% corresponds to 7 M urea and 40% (v/v) deionized formamide). The gel was run at constant voltage of 55 V for 16 h. Following Shimeta et al. [33],

International Journal of Agriculture and Environmental Research
ISSN: 2455-6939
Volume:02, Issue:03
www.ijaer.in Copyright © IJAER 2016, All right reserved Page 533
the PCR products were not quantified, however, all the samples were loaded with 20.0 µl of PCR products during the initial run. On the subsequent gel, the amount loaded was adjusted to yield relatively same band intensities between all samples. Hence, each well was loaded with 15 to 30 µl of PCR products.
Gels were stained with ethidium bromide (0.5 µg ml-1) followed by photograph under UV illuminator with the AlphaImager™ 5500 gel photo system (Alpha Innotech, California, USA).
The photographs were analyzed with Phoretix 1D Pro software (version 11.7, Totallab Ltd, UK), which identifies the band’s position after subtracting the background using a rolling ball algorithm with a radius of 50 pixels. Manual confirmation was carried out as well during band detection. A matrix of the band was constructed based on the presence or absence of each band. An UPGMA (unweighted pair-group method with arithmetic mean) dendrogram was generated based on the Dice coefficient. The matrix also subjected to multi-dimensional scaling (MDS) analysis using Primer 5 software (version 5.2.2, Primer-E Ltd., Plymouth, United Kingdom) [34]. Multiple gels had to be compared due to a large sample size of 30, hence, a reference that yield a single band was assigned on each DGGE gel image. This allowing the comparison within the gel and reduces chance of error in position when comparing multiple gel image.
The microbial complexity of each sample was simplified by various biodiversity indices, which calculated based on the matrix generated from DGGE patterns. Indices used in this study include: (i) Species richness (N) or the number of bands in a DGGE profile; and (ii) Shannon-Weaver index (H’) [35]. PRIMER 5 software was used to calculate the Shannon index (H’)
based on the binary data generated from Phoretix 1D Pro software.
Sequence and phylogenetic analysis
The prominent DGGE bands were excised and eluted according to Ling et al. [36] with modification. The excised bands were re-suspended into 60.0 μl of TE buffer (10 mM Tris and 1
mM EDTA, pH 8.0). The DNA was allowed to passively diffuse into the buffer at 4ºC overnight. Eluted 18S rDNA was amplified as previously described and again analysed by DGGE. PCR products that confirmed to yield single band were amplified using the ChloroF and ChloroR primer pairs without GC-clamp, and the PCR product was purified using PEG precipitation protocol [37]. Sequencing analysis was performed by 1st Base Laboratory Sdn. Bhd. (Selangor, Malaysia).
The nucleotide sequences obtained were checked with the GenBank database using the Basic Local Alignment Search Tool (BLAST) program (http://www.ncbi/nlm.nih.gov/) to find possible sister groups [38]. Phylogenetic trees of 18S rDNA partial sequences were generated using the neighbour-joining algorithms in MEGA version 5 software [39]. The level of support for the

International Journal of Agriculture and Environmental Research
ISSN: 2455-6939
Volume:02, Issue:03
www.ijaer.in Copyright © IJAER 2016, All right reserved Page 534
phylogenies derived from neighbour-joining analysis was evaluated with 1000 bootstrap replicates.
RESULTS AND DISCUSSION Climate, Soil Texture and Soil Chemical Properties Sarawak, Malaysia has a tropical rainforest climate, with wet periods occurring between November to February during the North-East Monsoon season and dry season occurring from June until August [40]. During sampling in December 2010, the monthly mean temperature was 26.2°C with total rainfall of 441.2 mm (Table 1). Both S1 and S2 were secondary forest that has being reserved as biodiversity strip by the plantation management under MPOB after logging activities. However, the S2 area was disturbed recently by agriculture activities, therefore S2 was classified as disturbed soil.
Table 1: Climatic parameters.
Parameters December 2010a
Mean monthly surface air temperature (°C) 26.2
Monthly total rain fall (mm) 315.2
Mean monthly relative humidity (%) 84.5
aMeteorology Department Malaysia (Sarawak Branch).
Soil physical and chemical properties can varies, depending on soil physical features in the area. Both soils in the secondary forest (S1 and S2) were classified as silty clay loam (S1 = 32% clay, 48% silt and 20% sand; S2 = 32% clay, 49% silt and 19% sand), while the soil under oil palm plantation was loam (OP = 15% clay, 36% silt, and 49% sand). The difference in soil texture between both locations could be due to the variation in topography, where the plantation area was separated from the secondary forests by a 25 degree slope. Meanwhile, both secondary forests were on the same degree of slope and being 3.7 km adjacent to each other. Topographic factors such as slope steepness affect water movement and erosion process, eventually affecting the soil formation, parent material, and hydrological and geological processes [41]. Therefore, soil characteristic was expected to change with respect to hill slope as well as human activities. Soil chemical properties of disturbed soil (S2) and plantation soil (OP) were significantly different compared to undisturbed soil, S1 (Table 2). This might be attributed to land clearance
International Journal of Agriculture and Environmental Research
ISSN: 2455-6939
Volume:02, Issue:03
www.ijaer.in Copyright © IJAER 2016, All right reserved Page 535
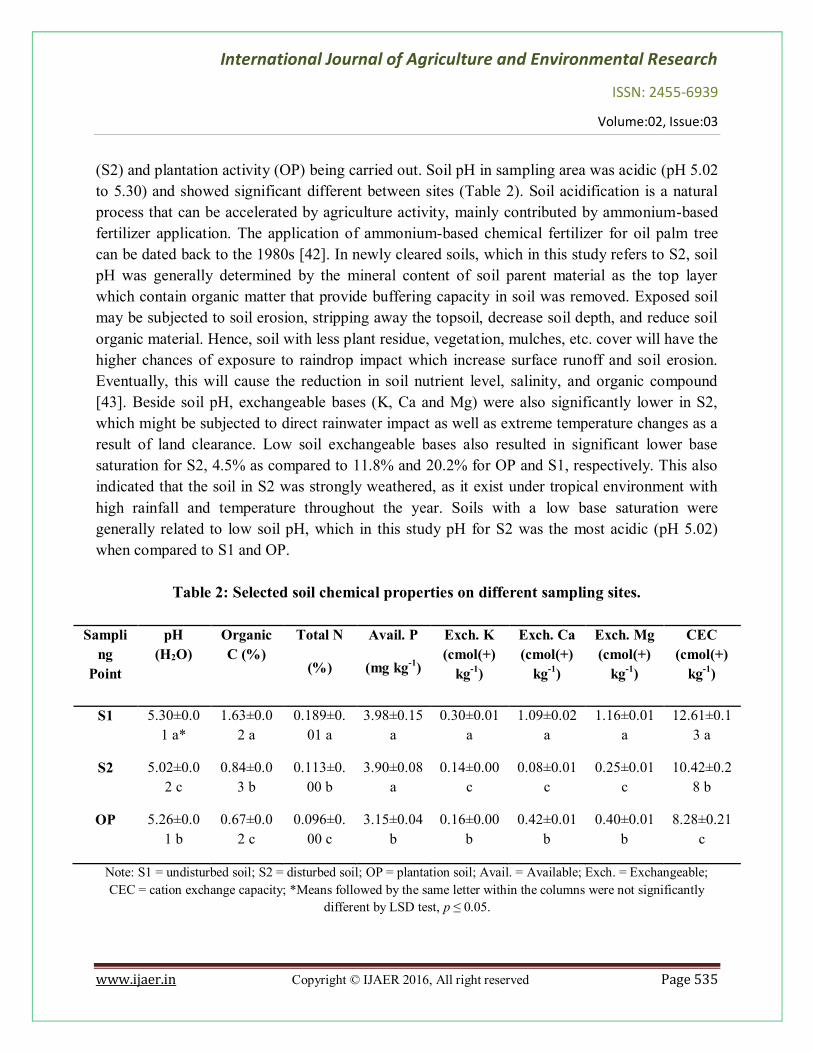
(S2) and plantation activity (OP) being carried out. Soil pH in sampling area was acidic (pH 5.02 to 5.30) and showed significant different between sites (Table 2). Soil acidification is a natural process that can be accelerated by agriculture activity, mainly contributed by ammonium-based fertilizer application. The application of ammonium-based chemical fertilizer for oil palm tree can be dated back to the 1980s [42]. In newly cleared soils, which in this study refers to S2, soil pH was generally determined by the mineral content of soil parent material as the top layer which contain organic matter that provide buffering capacity in soil was removed. Exposed soil may be subjected to soil erosion, stripping away the topsoil, decrease soil depth, and reduce soil organic material. Hence, soil with less plant residue, vegetation, mulches, etc. cover will have the higher chances of exposure to raindrop impact which increase surface runoff and soil erosion. Eventually, this will cause the reduction in soil nutrient level, salinity, and organic compound [43]. Beside soil pH, exchangeable bases (K, Ca and Mg) were also significantly lower in S2, which might be subjected to direct rainwater impact as well as extreme temperature changes as a result of land clearance. Low soil exchangeable bases also resulted in significant lower base saturation for S2, 4.5% as compared to 11.8% and 20.2% for OP and S1, respectively. This also indicated that the soil in S2 was strongly weathered, as it exist under tropical environment with high rainfall and temperature throughout the year. Soils with a low base saturation were generally related to low soil pH, which in this study pH for S2 was the most acidic (pH 5.02) when compared to S1 and OP.
Table 2: Selected soil chemical properties on different sampling sites.
Sampling
Point
pH (H2O)
Organic C (%)
Total N
(%)
Avail. P
(mg kg-1)
Exch. K (cmol(+)
kg-1)
Exch. Ca (cmol(+)
kg-1)
Exch. Mg (cmol(+)
kg-1)
CEC (cmol(+)
kg-1)
S1 5.30±0.01 a*
1.63±0.02 a
0.189±0.01 a
3.98±0.15 a
0.30±0.01 a
1.09±0.02 a
1.16±0.01 a
12.61±0.13 a
S2 5.02±0.02 c
0.84±0.03 b
0.113±0.00 b
3.90±0.08 a
0.14±0.00 c
0.08±0.01 c
0.25±0.01 c
10.42±0.28 b
OP 5.26±0.01 b
0.67±0.02 c
0.096±0.00 c
3.15±0.04 b
0.16±0.00 b
0.42±0.01 b
0.40±0.01 b
8.28±0.21 c
Note: S1 = undisturbed soil; S2 = disturbed soil; OP = plantation soil; Avail. = Available; Exch. = Exchangeable; CEC = cation exchange capacity; *Means followed by the same letter within the columns were not significantly
different by LSD test, p ≤ 0.05.

International Journal of Agriculture and Environmental Research
ISSN: 2455-6939
Volume:02, Issue:03
www.ijaer.in Copyright © IJAER 2016, All right reserved Page 536
Meanwhile, for oil palm plantation (OP), lower organic C, total N, and CEC were observed when compared to the secondary forest (S1 and S2). Palm tree require high nutrients input to sustain high yields, which estimated to be about 110 to 155 kg N ha-1 year-1 of N fertilizer needed [44]. Goh and Hardter [45] estimated that 192 kg ha-1 per year of N was removed by oil palm tree to produce the yield of 25 t ha-1 fresh fruit bunch (FFB) per year. Furthermore, study carried out by Aweto [46] showed that 316.7 kg ha-1 of organic carbon decreased for the top 10 cm of soil in an oil palm plantation. As from the results obtained in this study, the reduction rate of organic carbon in plantation area was more than the secondary forest (143% and 25% reduction for S1 and S2, respectively). This could be due to the litter produced by the plantation was probably inadequate to balance the rate of soil organic matter decomposition and mineralization. Lower organic carbon also directly related to the degree of canopy closure or soil exposure and the quantity as well as nature of litter produced. However, despite that palm fronds are not readily turn into humus to balance the rate of organic carbon loss from the soil, hence, organic carbon in the plantation area was low. DGGE Fingerprints Profiles and Cluster Dendrogram Analysis
Soil algae diversity was explorer with PCR and DGGE, and analysis of the 18S rDNA gene fragments obtained from DGGE gel images (Figure 1) from 3 different sampling sites yields a total of 100 bands (S1 = 34; S2 = 13; OP= 53). An individual discrete band obtained was referred as a phylotype or operational taxonomic unit (OUT), which was treated as a discrete green algae population. Hence, the diversity of green algae can be estimated from the gel images [29]. Although template DNA was obtained from all the sampling points (n=30) (data not shown), not all were successfully amplified by the selected primers used in this study. Therefore, only sampling points that showed positive PCR results were proceed to DGGE analysis (n=16).
Figure 1: DGGE gel image of algae in three different sampling sites as determined by PCR-DGGE analyses (S1: undisturbed soil; S2: disturbed soil: OP: plantation soil; M: marker;
P: sampling point followed by the number of point).

International Journal of Agriculture and Environmental Research
ISSN: 2455-6939
Volume:02, Issue:03
www.ijaer.in Copyright © IJAER 2016, All right reserved Page 537
Shannon-weaver (H’) index showed the structural diversities of the algae community were calculated from the present and absent of the DGGE band in the form of binary data. Presumes each band observed on the DGGE gels indicates a different species, differences in overall diversity might be considered by comparing the number of bands. Conversely, as summarized in Table 3, the diversity (H’) from the plantation soil (OP) and undisturbed soil (S1) were more
than disturbed soil (S2). This was consistence to the study done by King and Ward [47], undisturbed soil had more diverse algal population than disturbed soils, although it was carried out in temperate soil (Houston, Texas). Examining the dendrogram visually, based on the average number of bands (OTUs) per sampling point in a sampling site, OP showed greater number of species present or higher species richness (N) than the both secondary forests. S1 and S2 showed no significant different for the OTUs detected, yet the diversity of S1 was significantly more than S2. Higher algae diversity in disturbed soil than undisturbed soil also found in the studies done by Mayakun and Prathep [48] and Hunt et al. [49].
Table 3: Algae diversity index of 3 sampling sites.
Sampling Sites N H’
S1 5.4 ± 1.9 b 1.8 ± 0.7 a
S2 4.3 ± 1.2 b 1.4 ± 0.3 b
OP 7.4 ± 3.2 a 1.9 ± 0.5 a
Note: N = species richness; H’ = Shannon-Weiner index; *Means followed by the same letter within the columns were not significantly different by LSD test, p ≤ 0.05.
Cluster analysis based on UPGMA with Dice coefficient of the DGGE band fingerprints of soil algae from three sampling sites were shown in Figure 2. The dendrogram was divided into three main groups. Cluster 1 contained most soil samples from plantation area (OP), while some were grouped with the S2 in Cluster 3. Meanwhile, samples from S1 were in their own group, Cluster 2. This result showed a clear different in term of soil green algae diversity from undisturbed soil (S1) and disturbed soil (OP).

International Journal of Agriculture and Environmental Research
ISSN: 2455-6939
Volume:02, Issue:03
www.ijaer.in Copyright © IJAER 2016, All right reserved Page 538
Figure 2: Cluster analysis of DGGE banding pattern of algae communities in soil samples from undisturbed soil (S1), disturbed soil (S2) and plantation soil (OP).
Soil green algae are mainly phototrophic microorganisms that contain chlorophyll and they usually located at the base of the food chain. Like higher plants, soil green algae able photosynthesizing their own food and they were restricted by photic zone [49]. Despite the soil in the secondary forest was undisturbed (S1) for a period of time, the microorganisms population were expected to be higher due to high mineral elements and more accumulated litter. Biomass accumulation in secondary forest was rapid and according to Brown and Lugo [50], the rates can go up to 100 t ha-1 per year during the first 15 years. A secondary forest was able to accumulate woody plant species at a relatively rapid rate and its vegetation is simple as compared to mature forest. A closed-canopy in tropical rainforests, especially secondary forest allow lesser light intensities to reach the forest floor [51]. Therefore, light intensities was lower in the undisturbed secondary forest and soil green algae diversity in the S1 was lower as compare to the oil palm plantation (OP).
The oil palm aged 3 years old during the sampling carried out, while the disturbed soil was only recently being cleared for agriculture activities. Either due to agriculture activities or human activities, the area was cleared and opened. Open vegetation contain more open space and higher light intensities were able to reach the soil surface, hence, it was suitable for algae colonization. However, open soil will give rise to various vegetation growth. At this stage, the abundance area will be covered by scrub and shrubs [52]. Excessive shrubs and grasses growth will eventually limit the light reaching the understory as the result from the formation of new denser canopy

International Journal of Agriculture and Environmental Research
ISSN: 2455-6939
Volume:02, Issue:03
www.ijaer.in Copyright © IJAER 2016, All right reserved Page 539
[53]. Therefore, the species richness and diversity in S2 was lower than S1. Furthermore, as suggest by Hunt et al. [54], an environmental stress might happen to those microorganisms that living on top of the soil due to fluctuation of both temperature and moisture. Therefore, the recent disturbed soil (S2) was believed to have lower diversity and richness of soil green algae. Again, this indicates that disturbance either by human or agriculture activity has the influence against the soil algae community structure.
Sequences of DGGE bands
Each band in DGGE profiles are represent by the dominant microbial populations [29]. To further resolve the diversity of soil green algae, prominent bands were excised from the DGGE gel and sequenced to obtain further information about the prominent algae populations. Out of the 43 excised bands, 38 were successfully sequenced. The closest match of the sequences retrieved was determined by BLAST search (Table 4). Although the selected primers are targeting Chlorophyceae algae, some Trebouxiophyceae class also being targeted as well, as similarly reported by Moro et al. [31]. A neighbour-joining tree based on the sequences obtained was constructed (Figure 3). Phylogenetic analysis based on excised and sequenced DGGE bands clustered into different order of green algae. Five orders under the class of Chlorophyceae were obtained: Chlamydomonadales, Chlorococcales, Sphaeropleales, Chaetopeltidales and Chaetophorales. Meanwhile, two orders from Trebouxiophyceae were obtained as well: Trebouxiales and Chlorellales. The comparison of algae community structure from excised DGGE bands among the three sampling sites were showed in Figure 4. Chlamydomonadales, Trebouxiales, Chaetopeltidales, and Chlorococcales were the predominant groups of soil green algae sequenced from the secondary forest (S1 and S2). Meanwhile, the plantation soil only dominated by three groups of algae: Chlamydomonadales, Sphaeropleales, and Chaetophorales.

International Journal of Agriculture and Environmental Research
ISSN: 2455-6939
Volume:02, Issue:03
www.ijaer.in Copyright © IJAER 2016, All right reserved Page 540
Figure 3: Neighbour-joining tree including the 38 excised DGGE bands and their related sequences. The scale bar indicates 0.002 estimated changes per nucleotides and the
numbers showed the bootstrap values representing percentage confidence of 1000 replicate analysis. (*Trebouxiophyceae)

International Journal of Agriculture and Environmental Research
ISSN: 2455-6939
Volume:02, Issue:03
www.ijaer.in Copyright © IJAER 2016, All right reserved Page 541
Figure 4: Algae community structure comparison based on DGGE profile based on spatial and vertical patterns of the prominent DGGE detected algae community structure for the
three sampling sites, undisturbed soil (S1), disturbed soil (S2) and plantation soil (OP).
Chlamydomonadales also known as Volvovales, forms the largest group in the order of Chlorophyceae [55]. They were found abundant in all the sampling sites and dominated 38%, 44%, and 60% in S1, S2 and OP, respectively. Sphaeropleales belong to filamentous Chlorophyceae, typically found in shallow freshwater habitats that periodically cover by water. It has a thick wall that enable it persists in soil during dry season [56]. In this study, Sphaeropleales were dominants in OP and S1 only. Chlorococcales especially the Coccomyxa are lives aerophytically and they were found on moist soil or surfaces of rock [57]. Same as Chlorococcales, Chaetopeltidales are belongs to unicellular, palmelloid or discoid green algae that inhabiting in freshwater as well as on soil [58]. Both Chlorococcales and Chlorococcales were found dominant in the secondary forest (S1 and S2), which might due to the tropical forests can maintain high moisture content in the atmosphere [59]. and they were found dominant in the secondary forest. Chaetophorales was found within the moist soil, surface of moist rocks and other terrestrial condition although majority of this group member occur in freshwater [60].
Trebouxiophyceae generally are unicells coccoids and mostly found in dryer habitat such as soil [61]. The genus Trebouxia is well known in symbioses with lichen fungi [62]. Lichens are generally found on undisturbed surfaces [63] and in this study they were found dominant in the secondary forest (S1 and S2).

International Journal of Agriculture and Environmental Research
ISSN: 2455-6939
Volume:02, Issue:03
www.ijaer.in Copyright © IJAER 2016, All right reserved Page 542
CONCLUSION
The use of microbial fingerprinting analysis could illustrate an important finding that agriculture and human activity could give some impact to the microbial diversity in the soil. The distribution of green algae communities were differentiated by disturbance of soil as revealed by the cluster analysis. Furthermore, lower soil chemical properties were observed in disturbed soil and planation soil than undisturbed soil. Sequence from the prominent bands showed that Chlamydomonadales was the major order of green algae found in soil especially the plantation area. Meanwhile, Chlamydomonadales, Trebouxiales and Chlorococcales were the predominant order of green algae found in secondary forest. However, the plantation area only predominated by Chlamydomonadales and Saphaeropleales although the diversity index (H’) was 6% and 36%
higher than S1 and S2, respectively. Further study should be conducted as to compare the diversity of soil green algae over time. ACKNOWLEDGEMENTS
This project was funded by the Malaysian Palm Oil Board (MPOB) and the authors would like to thank Universiti Putra Malaysia for providing the facilities.
REFERENCES
[1] Ash, M. and Knisley, S. 2016. Oil Crops Outlook: Import Competition Slows Domestic Soybean Use. United States Department of Agriculture: Economic Research Service. Retrieved 12 April, 2016, from www.ers.usda.gov/media/2028347/march16oil-crops-outlook.pdf
[2] US Department of Agriculture (USDA). 2016. Consumption of vegetable oils worldwide from 1995/1996 to 2015/2016. Retrieved 12 April, 2016, from http://www.statista.com/statistics/263937/vegetable-oils-global-consumption/
[3] Basiron, Y. 2007. Palm oil production through sustainable plantation. European Journal of Lipid Science and Technology, 109: 289-295.
[4] Saxon, E. and Roquemore, S. 2011. Palm oil. In: Boucher, D., Elias, P., Lininger, K., May-Tobin, C., Roquemore, S. and Saxon, E. (Eds.), The root of the problem: what’s driving
tropical deforestation today? UCS Publication. Cambridge, MA.
[5] USDA-FAS, 2016. Oilseeds World Markets and Trade. Circular Series. US Department of Agriculture – Foreign Agricultural Service, Washington, DC

International Journal of Agriculture and Environmental Research
ISSN: 2455-6939
Volume:02, Issue:03
www.ijaer.in Copyright © IJAER 2016, All right reserved Page 543
[6] Malaysia Palm Oil Board (MPOB). 2015. Overview of the Malaysia oil palm industry 2015. Retrieved 2 May, 2016, from http://www.mpob.org.my.
[7] Lemes-Da-Silva, N. M., Branco, L. H. Z., and Necchi-Júnior, O. 2010. Corticolous green algae from tropical forest remnants in the northwest region of São Paulo State, Brazil. Revista Brasileira De Botânica, 33(2): 215-226
[8] Soare, L. C., and Dobrescu, C. M. 2000. Preliminary Data on Edaphic Algae in the City of Piteşti (Romania). Fascicula Biologie, 17: 186-189.
[9] Patova, E. N. and Dorokhova, M.F. 2008. Green algae in tundra soils affected by coal mine pollutions. Biologia, 63: 831-83.
[10] Graham, L. E., Graham, J. M., and Wilcox, L. W. 2009. Terrestrial algae ecology. In: Algae, 2nd edition. Pearson Education, Inc. USA. pp 587-618.
[11] Hoek, C., Mann, D., and Jahns, H. M. 1995. Chlorophyta (Green Algae). In Mann, D., and Jahns, H. M. (Eds.), Algae: An Introduction to Phycology. Cambridge University Press, pp 300-342.
[12] Mukherjee, S. K. (Ed.) 2001. Soil Biology. In textbook of soil science, 2nd edition. McGraw-hill Education, India. pp 44-90.
[13] Ray, J. G. and Binoy Thomas, T. 2012. Ecology and Diversity of Green-algae of Tropical Oxic Dystrustepts Soils in Relation to Different Soil Parameters and Vegetation. Research Journal of Soil Biology, 4: 42-68.
[14] Rindi, F., Allali, H. A., Lam, D. W. and Lopez-Bautista, J. M. 2009. An Overview of the Biodiversity and Biogeography of Terrestrial Green Algae. In: Rescigno, V. and Maletta, S. (Eds.). Biodiversity Hotspots: Chapter 3. Nova Science Publishers Inc., Hauppauge, NY., USA. pp: 105-122.
[15] Bérard, A., Rimet, F., Capowiez, Y., and Leboulanger, C. 2004. Procedures for determining the pesticide sensitivity of indigenous soil algae: a possible bioindicator of soil contamination? Earth and Environmantal Science, 46(1): 24–31.
[16] Hoffman, L., Ector L., and Kostikov, I. 2007. Algal flora from limed and unlimed forest soils in the Ardenne (Belgium). Systematics and Geography of Plants, 77: 15-90.
[17] Metting, B. 1981. The systematics and ecology of soil algae. Botanical Review, 47: 195–
312.

International Journal of Agriculture and Environmental Research
ISSN: 2455-6939
Volume:02, Issue:03
www.ijaer.in Copyright © IJAER 2016, All right reserved Page 544
[18] Tirkey, J., and Adhikary, S. P. 2005. Cyanobacteria in biological soil crusts of India. Current Science, 89(3): 515-521.
[19] Issa, M. A., Défarge, C., Le Bissonais, Y., Marin, B., Duval, O., Bruand, A., D'Acqui, L. P., Nordenberg, S., Annerman, M. 2007. Effects of the inoculation of cyanobacteria on the microstructure and the structural stability of a tropical soil. Plant and Soil, 290: 209-219.
[20] Lukesova, A. And Frouz, J. 2007. Soil and Freshwater Micro-Algae as a Food Source for Invertebrates in Extreme Environments. In Seckbach, J. (Ed.), Algae and Cyanobacteria in Extreme Environments. Springer, Netherlands, pp: 387-397.
[21] Natural resources conservation service (NCRS). 2004. Soil biology and land management. In Soil quality – soil biology technical note No. 4. United States Department of Agriculture.
[22] Mansour, H. A. and Shaaban, A. S. 2010. Algae of soil surface layer of wadi Al-Hitan protective area (World Heritage Site), El-Fayum depression, Egypt. Journal of American Science, 6: 243-255.
[23] Chun-Xiang, H. U. and Yong-Ding, L. 2003. Primary succession of algal community structure in desert soil. Acta Botanica Sinica, 45(8): 917-924.
[24] Neustupa, J. 2001. Soil Algae from Marlstone-substratum Based Biotopes in the Nature Park Džbán (Central Bohemia, Czech Republic) with Special Attention to the Natural Treeless Localities. Archiv für Hydrobiologie. Supplementband, Algological studies Algological Studies 101, 137: 109-120.
[25] Rastogi, G. and Sani, R. K. 2011. Molecular techniques to assess microbial community structure, function, and dynamics in the environment. In Ahmad, I., Ahmad, F., and Pichtel J. (Eds.), Microbes and Microbial Technology: Agricultural and Environmental Applications. Springer , Heidelberg, Germany. pp 29-58.
[26] Riesenfeld, C. S., Schloss, P. D., and Handelsman, J. 2004. Metagenomics: genomic analysis of microbial communities. Annual Review of Genetics, 38: 525-552.
[27] Ferreira, E. P. B. And Martin-Didonet, C. C. G. 2012. Multching and cover crops effects on the soil and rhizosphere-associated bacterial communities in field experiment. Journal of Agriculture, Science and Technology, 14: 671-681.
[28] Green, S. J., Leigh, M. B. and Neufeld, J. D. 2009. Denaturing gradient gel electrophoresis (DGGE) for microbial community analysis. In: Timmis, K.N. (Ed), Handbook of Hydrocarbon and Lipid Microbiology. Springer, Heidelberg, Germany. pp. 4137-4158.

International Journal of Agriculture and Environmental Research
ISSN: 2455-6939
Volume:02, Issue:03
www.ijaer.in Copyright © IJAER 2016, All right reserved Page 545
[29] Muyzer, G. and Smalla, K. 1998. Application of denaturing gradient gel electrophoresis (DGGE) and temperature gradient gel electrophoresis (TGGE) in microbial ecology. Antonie Van Leeuwenhoek International Journal of General and Molecular Microbiology, 73: 127-141.
[30] Teh, C. B. S., and Rashid, M. A. 2003. Object-Oriented Code to Lookup Soil Texture Classes Based on Any Soil Classification Scheme. Communications in Soil and Plant Analysis, 34: 1-11
[31] Moro, C. V., Crouzet, O., Rasconi, S., Thouvenot, A., Coffe, G., Batisson, I., and Bohatier, J. 2009. New design strategy for development of specific primer sets for PCR-based detection of chlorophyceae and bacillariophyceae in environmental samples. Applied and Environmental Microbiology. 75 (17), 5729-5733.
[32] Muyzer, G, De Waal, E. C., and Uitterlinden, A. G. 1993. Profiling of complex microbial populations by denaturing gradient gel electrophoresis analysis of polymerase chain reaction-amplified genes coding for 16S rRNA. Applied and Environmental Microbiology. 59 (3): 695–700.
[33] Shimeta, J., Gast, R. J., Rose, J. M. 2007. Community structure of marine sedimentary protists in relation to flow and grain size. Aquatic Microbial Ecology, 48: 91-104.
[34] Field, J. G., Clarke, K. R., and Warwick, R. M. 1982. A pratical strategy for analysing multispecies distribution patterns. Marine Ecology Progress Series, 8: 37-52.
[35] Shannon, C. E. 1948. A mathematical theory of communication. The Bell System Technical Journal, 27: 379–423 and 623–656.
[36] Ling, J. Zhang, Y., Dong, J., Wang, Y., Chen, L., Feng, J., Sun, H., Wang, D., and Zhang, S. 2011. Spatial variation of bacterial community composition near the Luzon strait assessed by polymerase chain reaction-denaturing gradient gel electrophoresis (PCR-DGGE) and multivariate analysis. African Journal of Biotechnology, 10(74): 16897-16908.
[37] Rosenthal, A., Coutelle, O., Craxton, M. 1993. Large-scale production of DNA sequencing templates by microtitre format PCR. Nucleic Acids Research, 21: 173-174.
[38] Altschul, S. F., Madden, T. L., Schäffer, A. A., Zhang, J., Zhang, Z., Miller, W. and Lipman, D.J. 1997. Gapped BLAST and PSI-BLAST: a new generation of protein database search programs. Nucleic Acids Research, 25:3389-3402.

International Journal of Agriculture and Environmental Research
ISSN: 2455-6939
Volume:02, Issue:03
www.ijaer.in Copyright © IJAER 2016, All right reserved Page 546
[39] Tamura, K., Peterson, D., Peterson, N., Stecher, G., Nei, M., and Kumar, S. 2011. MEGA5: Molecular Evolutionary Genetics Analysis Using Maximum Likelihood, Evolutionary Distance, and Maximum Parsimony Methods. Molecular Biology and Evolution, 28(10): 2731–2739.
[40] Malaysian Meteorological Department (MetMalaysia). 2015. General Climate of Malaysia. Retrieved 30 September 2015, from: http://www.met.gov.my/en/web/metmalaysia/climate/generalinformation/malaysia
[41] Birkeland, P. W. 1984. Soils and Geomorphology. Oxford University Press.
[42] Nelson, P. N., Rhebergen, T., Berthelsen, S., Webb, M. J., Banabas, M., Oberthür, T., Donough, C. R., Rahmadsyah, Indrasuara, K., and Lubis., A. 2001. Soil Acidification under Oil Palm: Rates and Effects on Yield. Better Crops, 95(4): 22-25.
[43] Bot, A. and Benites, J. (Eds.) 2005. Creating drought-resistant soil. In: The important of soil organic matter: Key to drought-resistant soil and sustained food production. Italy: FAO Soils Bulletin volume 80. pp. 35-41.
[44] Kee, K. K. Goh, K. J., and Chew P. S. 1995. Effects of NK fertilizer on soil pH and exchangeable K status on acid soils in an oil palm plantation in Malaysia. Developments in Plant and Soil Sciences, 64: 809-815
[45] Goh, K. J. And Hardter, R. 2003. General Oil Palm Nutrition. In: Fairhurst, T. and Härdter , R. (Eds.), Management for large and sustainable yields. Potash & Phosphate Institute and International Potash Institute. pp. 191-230.
[46] Aweto, A. O. 1995. Organic carbon diminution and estimates of carbon dioxide release from plantation soil. The Environmentalist, 15: 10-15.
[47] King, J. M. and Ward, C. H. 1977. Distribution of edaphic algae as related to land usage. Phycologia. 16(1): 23-30.
[48] Mayakun, J. and Prathep, A. 2005. Seasonal variations in diversity and abundance of macroalgae at Samui Island, Surat Thani Province, Thailand. Songklanakarin Journal of Science and Technology, 27(3): 653-663.
[49] Everest, J. W. and Williams, J. D. 2001. Moss and algae control in lawns. Retrieved 23 August 2014, from: http://www.aces.edu/pubs/docs/A/ANR-0908/ANR-0908.pdf

International Journal of Agriculture and Environmental Research
ISSN: 2455-6939
Volume:02, Issue:03
www.ijaer.in Copyright © IJAER 2016, All right reserved Page 547
[50] Brown, S., and Lugo, A. E. 1990. Tropical secondary forests. Journal of Tropical Ecology, 6: 1-32
[51] Gastellu-Etchegorry, J. P., Guillevic, P., Zagolski, F. Demarez, V., Trichon, V., Deering, D., and Leroy, M. 1999. Modeling BRF and radiation regime of boreal and tropical forests. Remote Sensing of Environment, 68, 281–316.
[52] Martin, J. and Gower, T. 1996. Forest succession. Forestry Facts, 78: 1-4.
[53] Guariguata, M. R. and Ostertag, R. 2001. Neotropical secondary forest succession: changes in structural and function characteristics. Forest Ecology and Management, 148: 185-206.
[54] Hunt, M. E., Floyd, G. L. and Stout, B. B. 1979. Soil algae in field and forest environments. Ecology, 60 (2): 362-375.
[55] Guiry, M. D., Guiryc G.M. 2015. AlgaeBase. World-wide electronic publication. National University of Ireland, Galway. Retrieved 23 August 2015, from: http://www.algaebase.org
[56] Lee, R. E. (Ed.) 2008. Chlorophyta. In Phycology, Cambridge University Press, UK. pp 139-239.
[57] Trémouillaux-Guiller, J., Rohr, T., Rohr, R., and Huss, V. A. R. 2001. Discovery of an endophytic alga in Ginkgo biloba. American Journal of Botany, 89 (5): 727-733.
[58] Sanchez-Puerta, M. V., Leonardi, P. I., O'Kelly, C. J. and Cáceres, E. J. 2006 Pseudulvella
americana belongs to the order Chaetopeltidales (class Chlorophyceae), evidence from ultrastructure and SSU rDNA sequence data. Journal of Phycology, 42: 943-950.
[59] Thomas, S. C. and Baltzer, J. L. 2002. Tropical Forests. In Encyclopaedia of Life Science.
Macmilan Publishers Ltd. [60] Sharma, O. P. (Ed.) 1986. Chlorophyceae green algae. In Textbook of Algae. Tata McGraw-
Hill Education, India. pp 121-270.
[61] Friedl, T. and Rybalka, N. 2012. Systematics of the green algae: a brief introduction to the current status. In Lüttge, U., Beyschlag, W., Büdel, B., Francis, D., Progress in Botany, Volume 73. Springer, Heidelberg, Germany. pp. 256-280.
[62] Grude, M. and Muggia, L. 2010. Identifying algal symbionts in lichen symbioses. In Nimis, P. L. and Lebbe, R. V. (Eds.), tools for identifying biodiversity: progress and problems.

International Journal of Agriculture and Environmental Research
ISSN: 2455-6939
Volume:02, Issue:03
www.ijaer.in Copyright © IJAER 2016, All right reserved Page 548
Proceedings of the International Congress, Paris, September 20 - 22, 2010. National D'Histoire Naturelle - Grand Amphith. EUT.
[63] Goerig, D. J., Chatfield, J. A., Ellis S. D., Rhodes, L. H. and Boehm, M. J. 2009. Lichens. Fact Sheet: Agriculture and Natural Resources, The Ohio State University. HYG-3312-09.