tesco plc preliminary results 2017/18 · • rolled out industry-leading same-day online grocery...
TRANSCRIPT

Preliminary Results 2017/18
Serving Britain’s shoppers a little better every day
ANOTHER STRONG YEAR OF PROGRESS FIRMLY ON TRACK TO DELIVER MEDIUM-TERM AMBITIONS
On a continuing operations basis
2017/18
2016/17
Change at
constant rates
Change at
actual rates Headline measures1:
Group sales2 £51.0bn £49.9bn 0.6% 2.3% Group operating profit before exceptional items3 £1,644m £1,280m 25.9% 28.4% Diluted EPS pre-exceptional items, IAS 19 finance costs and IAS 39 fair value remeasurements4 11.88p 7.30p
62.7%
Dividend per share 3.0p - n/a Retail operating cash flow5 £2,773m £2,278m 21.7%
Net debt5,6 £(2,625)m £(3,729)m down 29.6%
Statutory measures: Revenue £57.5bn £55.9bn 1.3% 2.8% Operating profit £1,837m £1,017m 76.6% 80.6% Profit before tax £1,298m £145m 769.7% 795.2% Diluted EPS 12.08p 0.81p 1,391.4%
Headlines
Positive sales2 and profit3 growth, strong cash5 generation • Group sales2 up 2.3% to £51.0bn; ninth consecutive quarter of like-for-like sales growth in Q4 • UK like-for-like sales7 up 2.2%; consistent strength in fresh food; (0.4)% drag from GM changes • Group operating profit before exceptional items3 up 28.4% to £1,644m
o Includes £31m full year profits arising on property-related items (£(2)m net loss in second half) • Group operating margin3 2.9% (+57bps); 3.0% (+64bps) in 2H, well on track for 3.5-4.0% 2019/20 ambition • Retail operating cash flow5 up 21.7% to £2.8bn; Retail free cash flow5 of £1,377m • Net debt reduced by £1.1bn during the year to £(2.6)bn; total indebtedness £4.4bn lower to £(12.3)bn • Final dividend of 2.0p, giving FY dividend of 3.0p - reflects improved performance and Board confidence • Statutory revenue up 2.8% to £57.5bn; Profit before tax up £1,153m to £1,298m
Further progress against each of our six strategic drivers • Brand health8 continues to strengthen; quality perception +2.7 points and value perception +2.0 points9 • In-year cost savings of £594m; savings of £820m to date towards £1.5bn medium-term target • Generated £2.8bn of retail operating cash5; £499m underlying working capital10 inflow • Improving the mix across geographies, channels and product; 16% GM range reduction in the UK • Released a further £290m value11 from property; 109 sites sold; 1.1m sq. ft. space re-purposed • Innovations including contactless Clubcard; own brand re-launch: new Wicked Kitchen vegan range
Booker merger completed • Booker FY results12 show continued customer satisfaction, top line growth, and strong cash generation • On track to deliver recurring run-rate of at least £200m pre-tax synergies; c.£60m in first year
Dave Lewis, Chief Executive: “This has been another year of strong progress, with the ninth consecutive quarter of growth. More people are choosing to shop at Tesco and our brand is stronger, as customers recognise improvements in both quality and value.
We have further improved profitability, with Group operating margin reaching 3.0% in the second half. We are generating significant levels of cash and net debt is down by almost £6bn over the last three years. All of this puts us firmly on track to deliver our medium-term ambitions and create long-term value for every stakeholder in Tesco.
I am delighted to have completed our merger with Booker, and we are moving quickly to deliver synergies and access new growth, making the most of the complementary skills in our combined business.”

2
Like-for-like sales performance7
1Q
2017/18 2Q
2017/18 3Q
2017/18 4Q
2017/18 1H
2017/18 2H
2017/18 FY
2017/18 UK & ROI 2.2% 2.1% 2.3% 2.4% 2.1% 2.4% 2.3%
UK 2.3% 2.1% 2.3% 2.3% 2.2% 2.3% 2.2%
ROI 0.2% 2.0% 3.3% 5.3% 1.1% 4.3% 2.7%
Central Europe (0.4)% 0.6% 0.8% 0.4% 0.1% 0.6% 0.3% Asia (6.0)% (10.7)% (9.6)% (14.0%) (8.3)% (11.8)% (10.0)%
Group 1.0% 0.6% 0.9% 0.4% 0.8% 0.6% 0.7%
Headline Group results
A full Group income statement can be found on page 14.
52 weeks ended 24 February 2018 On a continuing operations basis
2017/18 2016/17
Year-on-year change
(Constant exchange
rates)
Year-on-year change (Actual
exchange rates)
Group sales (exc. VAT, exc. fuel)2 £50,991m £49,867m 0.6% 2.3%
Fuel £6,500m £6,050m 7.1% 7.4%
Revenue (exc. VAT, inc. fuel) £57,491m £55,917m 1.3% 2.8%
Group operating profit before exceptional items3 - UK & ROI - Central Europe - Asia - Tesco Bank
£1,644m £1,053m
£119m £299m £173m
£1,280m £803m £58m
£262m £157m
25.9% 30.3% 89.7% 7.6%
10.2%
28.4% 31.1%
105.2% 14.1% 10.2%
Include exceptional items
£193m
£(263)m
Group operating profit £1,837m £1,017m 76.6% 80.6%
Group profit before tax before exceptional items, IAS 19 finance costs and IAS 39 fair value remeasurements
£1,282m £781m
64.1%
Group statutory profit before tax £1,298m £145m 795.2%
Diluted EPS before exceptional items, IAS 19 finance costs and IAS 39 fair value remeasurements
11.88p 7.30p
Diluted EPS 12.08p 0.81p
Basic EPS 12.12p 0.81p
Dividend per share 3.0p -
Capex13 £1.1bn £1.2bn
Net debt5,6 £(2.6)bn £(3.7)bn Cash generated from retail operations5 £2.8bn £2.3bn
Notes 1. The Group has defined and outlined the purpose of its alternative performance measures, including its headline measures, in the Glossary on page 55. 2. Group sales exclude VAT and fuel. Sales growth shown on a comparable days basis. 3. Excludes exceptional items by virtue of their size and nature in order to reflect management’s view of the performance of the Group. 4. Headline earnings per share measure excludes IAS 39 fair value remeasurements as well as exceptional items and IAS 19 net pension finance costs. Full details of this measure can be
found in Note 9, starting on page 38. 5. Net debt, retail operating cash flow and retail free cash flow exclude the impact of Tesco Bank in order to provide further analysis of the retail cash flow statement. 6. Net debt includes both continuing and discontinued operations. 7. Like-for-like is a measure of growth in Group online sales and sales from stores that have been open for at least a year at constant foreign exchange rates. 8. As per YouGov BrandIndex (customers recommend) February 2018. 9. Reflects year-on-year change in YouGov Brand perception measures of quality and value. 10. Working capital excluding the impact of exceptional items. 11. Value released from property relates to gross proceeds from property disposals in the year. 12. Booker unaudited results for the financial year to 30 March 2018. Further details can be found on page 13 of this release. 13. Capex is shown excluding property buybacks. Statutory capital expenditure (including property buybacks) for the 52 weeks ended 24 February 2018 was £1.5bn (LY £1.6bn).

3
Creating value for our key stakeholders
We have continued to make further progress this year, guided by the six strategic drivers that we set out in October 2016, as we create long-term and sustainable value for our key stakeholders. Customers • 260,000 more shoppers are shopping at Tesco1 • continued improvement in Brand perception measures of quality (+2.7 points) and value (+2.0 points)2 • helpful introduction of contactless Clubcard, rolled out to 18 million Clubcard members • embarked on re-launch of over 10,000 own brand products with 1,300 completed to date • rolled out industry-leading same-day online grocery delivery service to 99% of UK postcodes • successful launch of Wicked Kitchen with 44% of ready meal sales to new customers in the category • completed roll-out of Tesco Pay+ to all our stores in the UK with 458,000 App downloads to date • surpassed 5 million customers at Tesco mobile and winner of 2018 Best Network for Customer Service3 • significant improvement (+7 NPS) in customer ratings of community and charity initiatives
Colleagues • implementing a 10.5% increase for hourly paid store colleagues over the next two years with the first of
three stages completed in November • maintained strong engagement as a great place to work and shop as we continue transformation • simplified our operational structures to improve efficiency, supporting all colleagues to offer the highest
levels of customer service • low median gender pay gap of 8.7%, less than half the national average at 18.4% • developing the UK’s leading workplace health programme for our 300,000 UK colleagues
Supplier partners • most improved retailer in our relationships with suppliers for the second successive year in the GCA
survey published in June 2017 • ranked first again in the independently-run Advantage supplier survey • Supplier Viewpoint measure maintained at a high level in the UK (78%) despite inflationary challenges • launched Partners Toolkit providing 1,695 UK fresh and packaged suppliers with convenient access to key
documents and information • extended a number of UK supplier agreements to include our Central European businesses • innovations in packaging to cut down on food waste such as extending the freshness of avocados
Shareholders • operating margin of 2.9% (3.0% in 2H), up 57bps year-on-year • generated £2,773m of retail operating cash flow, including underlying working capital inflow of £499m • reduced net debt from February 2017 by £1,104m; pension deficit lowered by £2,776m • regained sole ownership of 17 stores; raised £290m in property-related proceeds • completion of our merger with Booker in line with deal timeline guidance • announced final dividend of 2.0p per share; targeting around two times EPS cover in medium term
Looking ahead
We remain firmly on track to deliver the medium-term ambitions we set out in October 2016: to reduce our costs by £1.5bn, to generate £9bn of retail cash from operations and to improve operating margins to between 3.5% and 4.0% by 2019/20. In addition, by further reducing debt and maintaining a disciplined approach to capital we can continue to strengthen the balance sheet and generate an increasing level of free cash flow. Our intention remains to return to an investment grade credit rating, with our key metrics being fixed charge cover4 and total indebtedness/EBITDAR5. The integration of Booker is well underway and we are focused on delivering the identified synergies to create value for all stakeholders. We anticipate a synergy benefit of c.£60m in the first year, growing to a cumulative c.£140m in the second year and reaching a recurring run-rate of c.£200m per year by the end of the third year. As we look to capitalise on the enhanced opportunities for growth available to the combined Group, we will place increasing focus on growth in earnings and free cash flow generation, in order to deliver strong, sustainable returns for shareholders. Notes 1. KantarWorldpanel UK data for the 52 weeks ending 25 February 2018. 2. Reflects year-on-year change in YouGov Brand perception measures of quality and value. 3. USwitch Broadband & Mobile Awards. 4. EBITDAR / Net finance costs (before exceptional charges, IAS 19 net pension finance costs and IAS 39 fair value remeasurements) + Retail operating lease expense 5. Net Debt + defined pension deficit (net of tax) + discounted operating lease commitments / EBITDAR

4
Financial Results
Sales:
On a continuing operations basis UK & ROI Central Europe1
Asia2 Tesco Bank Group
Sales (exc. VAT, exc. fuel)
£38,650m £6,343m £4,947m £1,051m £50,991m
change at constant exchange rates3 % 2.2% (1.6)% (9.4)% 3.9% 0.6% change at actual exchange rates3 % 2.5% 6.1% (4.4)% 3.9% 2.3% Like-for-like sales (exc. VAT, exc. fuel) 2.3% 0.3% (10.0)% - 0.7% Statutory revenue (exc. VAT, inc. fuel) £44,908m £6,585m £4,947m £1,051m £57,491m
Includes: Fuel £6,258m £242m - - £6,500m
1. Central Europe consists of Czech Republic, Hungary, Poland and Slovakia. 2. Asia consists of Thailand and Malaysia. 3. Sales change shown on a comparable days basis; statutory Group sales change was 0.6% at constant exchange rates and 2.3% at actual exchange rates.
Group sales grew by 0.6% at constant exchange rates with like-for-like growth of 0.7%. At actual exchange rates, sales grew by 2.3% including a 1.7% foreign exchange translation benefit due to the depreciation of Sterling. Further information on sales performance is included in Appendices 1 to 3 on page 65 of this statement.
In the UK and the Republic of Ireland (ROI), like-for-like sales grew by 2.3%. In the UK, like-for-like sales growth of 2.2% includes our ninth consecutive quarter of positive performance, despite an ongoing drag of (0.4)% from general merchandise as we take action to de-emphasise certain categories. Like-for-like growth of 2.9% in food was driven by a consistently strong performance in fresh food, where we outperformed the market in volume terms by around 1.7%4. During the fourth quarter we experienced some distribution-related disruption, following the administration of Palmer & Harvey, resulting in lost tobacco sales across December. Despite these challenges, which are now behind us, we continued to deliver positive sales momentum through the fourth quarter.
Market conditions have remained challenging with continued cost price inflation. We have worked hard with our supplier partners throughout the year to mitigate price increases wherever possible, and made a significant investment in the first half to further hold back inflation and protect customers. We have continued to reduce promotional participation over the year, focusing instead on consistently offering the best value for customers on all of our products.
Our own brand ranges have performed very well, with like-for-like sales growing 4.2% year-on-year. We have embarked on a re-launch of over 10,000 own brand products, across our entry, core and finest* ranges, with the initial focus on ready meals and Italian products. Our new, exclusive Hearty Food Co. range of ready meals and improved core Tesco products have proved particularly popular, contributing to an increase in overall own brand participation of nearly one per cent. Exciting innovations such as our plant-based Wicked Kitchen dishes have also proved popular with customers, experiencing strong repeat rate purchasing.
We have continued to refine our general merchandise range, reducing SKUs by 16% as we focus on categories with more sustainable profitability. We have delivered 2.7% sales growth in our home category, following the launch of our new own brand Go Cook and Fox & Ivy ranges. These new brands have driven a 14% and 20% increase in customers to our cook and homeware ranges, respectively. Clothing performed well throughout the year with like-for-like sales growth of 2.6%, reflecting the strength of the F&F brand and quality of our range.
All store formats and channels have achieved like-for-like growth, with our large store business growing at 1.9% and our online grocery sales growing 5.1% with both higher order numbers and average basket size. We have delivered 2.7% growth in our Express convenience stores, with a positive customer response to the changes we have made to tailor ranges and improve product availability. 4. Shows volume outperformance. Data is for the 52-weeks ending 25 February and is sourced from IRI Retail AdvantageTM, global insight providers to the retail industry. IRI market definition excludes Aldi and Lidl.

5
In ROI, like-for-like sales grew by 2.7% improving steadily throughout the year as customers responded well to an even more competitive price position. The main driver of growth was a 4.2% increase in volume, well ahead of market volume growth. Fresh food volumes were particularly strong, growing by 5.2% year-on-year.
In Central Europe, like-for-like sales increased by 0.3% despite competitive market conditions. Our focus on improving the quality and breadth of the range in our stores has delivered positive results with fresh food sales growth of 1.2%. However, this growth was held back by declines in general merchandise and clothing. Our convenience formats delivered positive like-for-like growth across all countries. We have continued to exit from unprofitable stores in the region, with 28 store closures contributing to an overall sales reduction of (1.6)% at constant exchange rates. Legislative changes in the region are affecting our business, with Poland phasing in a gradual ban on Sunday trading from March 2018, which takes complete effect by 2020.
In Asia, our previously announced decision to withdraw from unprofitable bulk selling activities in Thailand and scale back mass couponing, contributed to a (10.0%) decline in like-for-like sales. Adjusting for this impact, underlying like-for-like sales in the region were down (1.0)%, largely reflecting the deflationary effect of lowering our fresh food prices for customers.
We have made a change to the reporting of a number of small sub-categories in Asia and Central Europe in order to better reflect Tesco’s relationship with suppliers in respect of consignment sales. This has a small impact on the total sales growth reported for our Asia and Central Europe segments – further information can be found in Appendices 1 and 2 on page 65.
Group statutory revenue of £57.5bn includes fuel sales of £6.5bn, which grew by 7.4% year-on-year driven largely by fuel retail price inflation.
Operating profit:
On a continuing operations basis UK & ROI Central Europe
Asia Tesco Bank
Group
Operating profit before exceptional items £1,053m £119m £299m £173m £1,644m change at constant exchange rates % 30.3% 89.7% 7.6% 10.2% 25.9% change at actual exchange rates % 31.1% 105.2% 14.1% 10.2% 28.4% Operating profit margin before exceptional items 2.3% 1.8% 6.0% 16.5% 2.9% change at constant exchange rates (basis points) 49bp 86bp 96bp 95bp 56bp change at actual exchange rates (basis points) 50bp 87bp 99bp 95bp 57bp Operating profit £1,199m £212m £277m £149m £1,837m
Group operating profit before exceptional items was £1,644m, up 25.9% on last year at constant exchange rates and up 28.4% at actual rates. Statutory operating profit of £1,837m includes the impact of exceptional items, which are described in more detail below and in Note 4 on page 32 of this statement.
UK & ROI operating profit before exceptional items was £1,053m, up 31.1%, with margin growth of 50 basis points year-on-year. Our efforts to reduce operating costs and improve efficiencies across our store estate and head office have delivered a significant increase in profitability, particularly during the second half when our operating margin reached 2.5%, up 67 basis points year-on-year. Further progress on maximising the mix within our business and driving volume more selectively, particularly in general merchandise, has aided margin expansion.
Central Europe operating profit before exceptional items was £119m, up £61m year-on-year at actual exchange rates. We have made continued progress towards operating the four markets we serve as one combined region, helping to improve our customer offer. In the first half of the year we opened a new distribution centre in Galánta, Slovakia serving all four countries and benefiting from the best local practices in the region. The resulting benefits of more effective stock management combined with our other efforts on cost savings have more than offset the impact of inflation on the cost base and enabled us to improve profitability.
Asia operating profit before exceptional items was £299m, up 7.6% at constant exchange rates and up 14.1% at actual rates. This improvement has been driven by re-focusing on our core retail offer, as we have significantly

6
reduced the level of bulk selling activity and short-term promotional couponing. Furthermore, we have continued to reduce our cost base as part of the Group’s overall cost savings programme.
Further information on operating profit performance is included in Note 2, starting on page 24 of this statement.
Property-related items in operating profit:
This year Last year
Profits arising on property-related items £31m £(4)m Exceptional property transactions £79m £165m Other exceptional property-related items1 £10m £(51)m
Total profits arising on property-related items £120m £110m 1. In 2017/18 this includes a £7m provision reversal relating to net restructuring and redundancy costs and a £3m provision reversal relating to net impairment of non-current assets and onerous lease provisions. In 2016/17 we recognised a £(20)m charge relating to net restructuring and redundancy costs and a £(31)m net impairment of non-current assets and onerous lease provisions.
Across the Group, £31m of operating profit before exceptional items arose from property-related items. This includes profits on the disposal of a development site in Welwyn Garden City in the UK and various other sites. In the second half we realised a net loss of £(2)m with a gain on land and other smaller store disposals being offset by an increase in other property-related costs.
The majority of profits on property-related items have been treated as exceptional by virtue of the size and nature of the associated transactions. In addition to £65m generated from two property-related transactions in the first half of the year (the development of our Hackney store as part of our ‘air-rights’ programme and our exit from a joint venture with British Land), a further £14m exceptional profit arose in the second half in relation to the disposal of one Central European store.
Further detail on exceptional property transactions and property-related items can be found in Note 4 on page 32 of this statement.
Exceptional items in operating profit: This Year Last Year
Net restructuring and redundancy costs £(102)m £(199)m Net impairment reversal/(charge) of non-current assets and onerous lease provisions
£53m £(6)m
Provision for customer redress £(24)m £(45)m Interchange settlement - £57m Investment disposal £124m - Property transactions £79m £165m Disposal of opticians business £38m - Amounts provided and released in relation to SFO and FCA obligations
£25m £(235)m
Total exceptional items in operating profit £193m £(263)m
Exceptional items are excluded from our headline performance measures by virtue of their size and nature in order to reflect management’s view of the performance of the Group. In the current year, the net effect of exceptional items on operating profit is £193m, including the property transactions described above.
Net restructuring and redundancy charges of £(102)m relate principally to structural changes to our business to simplify our operating model within stores and head office.
Net impairment reversal of non-current assets of £53m includes a net reversal of £185m in property, plant and equipment and investment property, a net £(24)m charge in software and other intangible assets and a net charge of £(108)m of onerous lease provisions.

7
Provision for customer redress of £(24)m relating to Tesco Bank, includes an increase of £(35)m in the provision for Payment Protection Insurance (PPI), partially offset by a £1m Consumer Credit Act (CCA) provision release and a credit of £10m received following the conclusion of negotiations with a third party in respect of previously recognised customer redress.
The gain on investment disposal of £124m reflects the sale of our remaining minority stake in the Lazada e-commerce platform, completed during the first half. The sale of our opticians business in the UK & ROI to Vision Express resulted in a £38m gain on disposal.
In the prior year, we took an exceptional charge of £(235)m in respect of the Deferred Prosecution Agreement between Tesco Stores Limited and the UK Serious Fraud Office regarding historic accounting practices and an agreement with the UK Financial Conduct Authority of a finding of market abuse in relation to the Tesco PLC trading statement announced on 29 August 2014. Included in this charge was £(85)m for the Shareholder Compensation Scheme. With the Compensation Scheme now being closed to new claimants, we have released £25m of the amounts provided. Outstanding claims submitted before the 22 February 2018 deadline are still being processed.
Further detail on exceptional items can be found in Note 4 on page 32 of this statement.
Joint ventures and associates: This year Last year
Share of post-tax losses from JVs and associates before exceptional items
£(6)m £(30)m
Exceptional items: Impairment in Gain Land Insurance reserve adjustment
- -
£(54)m £(23)m
Share of post-tax losses from JVs and associates £(6)m £(107)m
Our share of post-tax losses from joint ventures and associates before exceptional items was £(6)m, an improvement of £24m year-on-year due to reduced losses recognised in Gain Land, our joint venture in China. There were no exceptional items this year relating to our share of post-tax losses from joint ventures and associates.
Finance income and finance costs:
The following table sets out the components of net finance costs.
Net finance costs before exceptional charges, IAS 19 net pension finance costs and IAS 39 fair value remeasurements reduced by £113m year-on-year to £(356)m. This 24.1% decline year-on-year was mainly driven by a net £96m reduction in interest on interest-bearing liabilities. Debt maturities totalled £1.4bn during the year and we also undertook £1.3bn of bond tenders in two separate liability management exercises. These bond
This year Last year
Interest payable on medium term notes, loans and bonds £(363)m £(434)m Interest receivable on associated derivatives £31m £6m Net interest on medium term notes, loans and bonds £(332)m £(428)m Other interest receivable and similar income £44m £42m Other finance charges and interest payable £(70)m £(89)m Capitalised interest £2m £6m Net finance cost before exceptional charges, IAS 19 net pension finance costs and IAS 39 fair value remeasurements
£(356)m £(469)m
IAS 39 fair value remeasurements £23m £61m IAS 19 net pension finance costs £(162)m £(113)m Exceptional charge - translation of Korea proceeds £(38)m £(244)m Net finance costs £(533)m £(765)m
8
tenders during the year contributed to £23m lower interest costs and we expect an associated reduction in interest payable of c.£50m on an annualised basis. In cash interest terms, we were helped by a favourable timing benefit of £55m on our largest sterling-denominated bond, for which no annual coupon payment was made during the year owing to the timing of our year-end date.
Net finance costs, which include non-cash items, were around 30% lower year-on-year. Fair value remeasurements are largely driven by changes in the market’s assessment of credit risk and various market indices which can fluctuate significantly.
Net pension finance costs increased by £(49)m year-on-year, driven by a higher opening pension deficit part offset by a lower opening discount rate. Net pension finance costs are calculated by multiplying the opening deficit by the opening discount rate each year. For 2018/19, they are expected to decrease to c.£(95)m as the impact of a higher opening discount rate is more than offset by the year-on-year reduction in deficit.
The exceptional charge of £(38)m relating to the translation of the remaining proceeds from the sale of our business in Korea will not arise again since the funds have now been moved to a Sterling denominated entity within the Group. The proceeds had been held in GBP money market funds in a non-Sterling denominated subsidiary and the translation effect represents no economic cost to the Group.
Further detail on finance income and costs can be found in Note 5 on page 34.
Group tax:
This year Last year
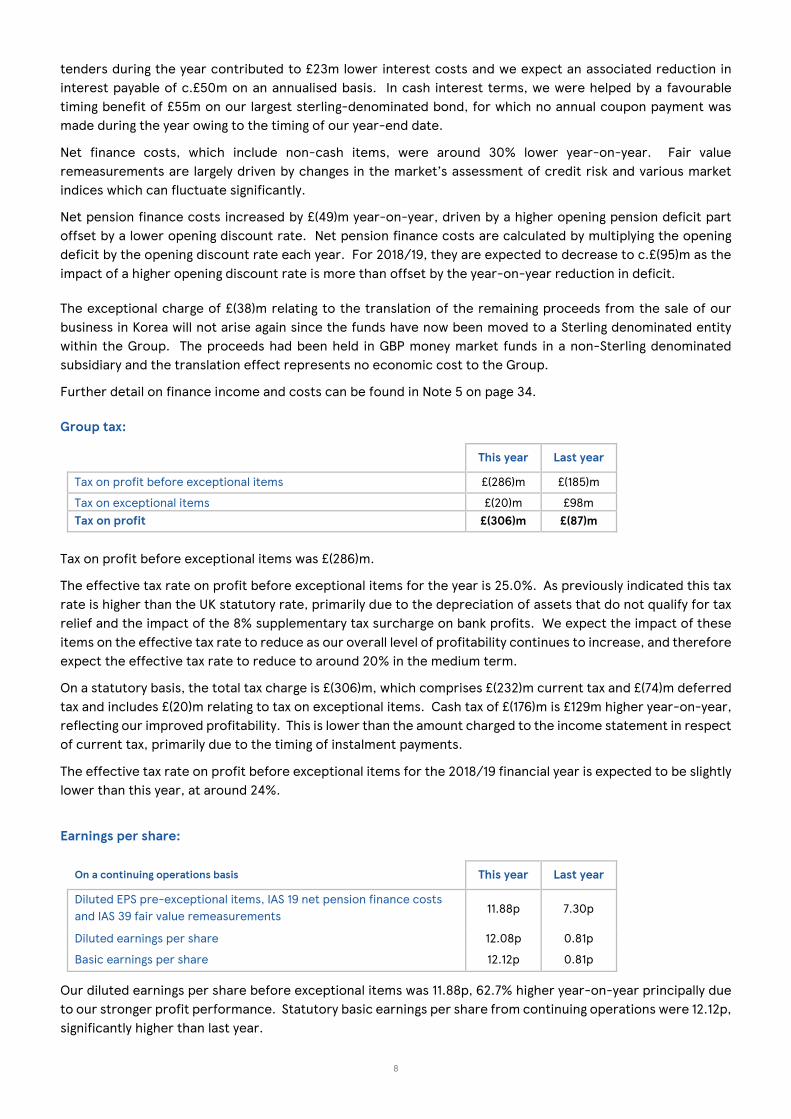
Tax on profit before exceptional items £(286)m £(185)m
Tax on exceptional items £(20)m £98m Tax on profit £(306)m £(87)m
Tax on profit before exceptional items was £(286)m.
The effective tax rate on profit before exceptional items for the year is 25.0%. As previously indicated this tax rate is higher than the UK statutory rate, primarily due to the depreciation of assets that do not qualify for tax relief and the impact of the 8% supplementary tax surcharge on bank profits. We expect the impact of these items on the effective tax rate to reduce as our overall level of profitability continues to increase, and therefore expect the effective tax rate to reduce to around 20% in the medium term.
On a statutory basis, the total tax charge is £(306)m, which comprises £(232)m current tax and £(74)m deferred tax and includes £(20)m relating to tax on exceptional items. Cash tax of £(176)m is £129m higher year-on-year, reflecting our improved profitability. This is lower than the amount charged to the income statement in respect of current tax, primarily due to the timing of instalment payments.
The effective tax rate on profit before exceptional items for the 2018/19 financial year is expected to be slightly lower than this year, at around 24%.
Earnings per share:
On a continuing operations basis This year Last year
Diluted EPS pre-exceptional items, IAS 19 net pension finance costs and IAS 39 fair value remeasurements 11.88p 7.30p
Diluted earnings per share 12.08p 0.81p
Basic earnings per share 12.12p 0.81p
Our diluted earnings per share before exceptional items was 11.88p, 62.7% higher year-on-year principally due to our stronger profit performance. Statutory basic earnings per share from continuing operations were 12.12p, significantly higher than last year.

9
Dividend:
As outlined in our merger prospectus published on 5 February 2018, we propose to pay a final dividend of 2.0 pence per ordinary share. The proposed final dividend was approved by the Board of Directors on 10 April 2018 and is subject to the approval of shareholders at the Annual General Meeting to be held on 15 June 2018. This takes the total dividend for the year to 3.0 pence per ordinary share following the payment of an interim dividend of 1.0 pence per ordinary share in November 2017. We anticipate a split of broadly one-third to two-thirds between next year’s interim and final dividends and intend to reach our targeted cover of around two times earnings in the medium term.
The final dividend will be paid on 22 June 2018 to shareholders who are on the register of members at close of business on 18 May 2018 (the Record Date). Shareholders may elect to reinvest their dividend in the Dividend Reinvestment Plan (DRIP). The last date for receipt of DRIP elections and revocations will be 1 June 2018.
Pension:
On an IAS 19 basis, the pension deficit measure (net of deferred tax) has reduced from £5.5bn last year to £2.7bn at the end of the current year. The movement during the year was partly driven by an increase in yields on corporate bonds, which drive the discount rate used for accounting purposes and our previously announced decision at the half-year stage to update the discount rate model in line with developing market practice and following actuarial advice. In the Group’s view, it now more appropriately reflects expected yields on corporate bonds over the life of the scheme’s liabilities. At the same time, the application of latest industry life expectancy tables and favourable actual scheme experience have also contributed to the reduction.
During the year, the triennial pension review was concluded, with the business and the Trustees agreeing that annual contributions will increase by £15m to £285m per annum from April 2018, with our framework for the long-term funding of the scheme unchanged. As at 31 March 2017, the actuarial deficit was £3.0bn, an increase of c.£0.25bn since the last triennial valuation.
Further information on the Group’s pension liability is available in Note 17 which begins on page 49.
Summary of total indebtedness1: Feb 2018 Feb 2017 Movement
Net debt (excludes Tesco Bank) £(2,625)m £(3,729)m £1,104m Discounted operating lease commitments £(6,931)m £(7,440)m £509m Pension deficit, IAS 19 basis (post-tax) £(2,728)m £(5,504)m £2,776m
Total indebtedness £(12,284)m £(16,673)m £4,389m 1. Total indebtedness is defined in the glossary, starting on page 55.
Retail net debt reduced by £1.1bn to £(2.6)bn as our retail operating cash flow and disposal proceeds were greater than capital expenditure and other charges. Within net debt, we used surplus cash to prepay £1.3bn of the Group’s long-dated bonds as part of our ongoing focus on strengthening the balance sheet.
Discounted operating lease commitments have reduced by £509m, including the benefit from the buyback of 17 stores in the UK during the year.
As outlined above, on an IAS 19 basis, our pension deficit decreased by £2.8bn as a result of an increase in yields on corporate bonds, as well as our decision to update the discount rate model. We also updated our assumptions for life expectancy, reflecting the latest best estimates.
Overall, total indebtedness has reduced by £4.4bn in the year. Net debt has reduced by almost £6bn over the last three years.
IFRS 16 ‘Leases’ will be effective in the Group financial statements for the 52 weeks ending 29 February 2020. The Group intends to retrospectively adopt the standard, with comparatives restated from a transition date of 25 February 2018. The standard has no impact on the Group’s underlying cash flows. It is, however, expected to have a significant impact on reported assets, liabilities and the income statement of the Tesco Group, as well as the classification of cash flows relating to lease contracts. The Group is in the process of finalising this work
10
and setting out related accounting policies and procedures for leases. Until this work has been carried out, it is not practical to provide a reasonable estimate of the financial effect of IFRS 16.
Summary retail cash flow:
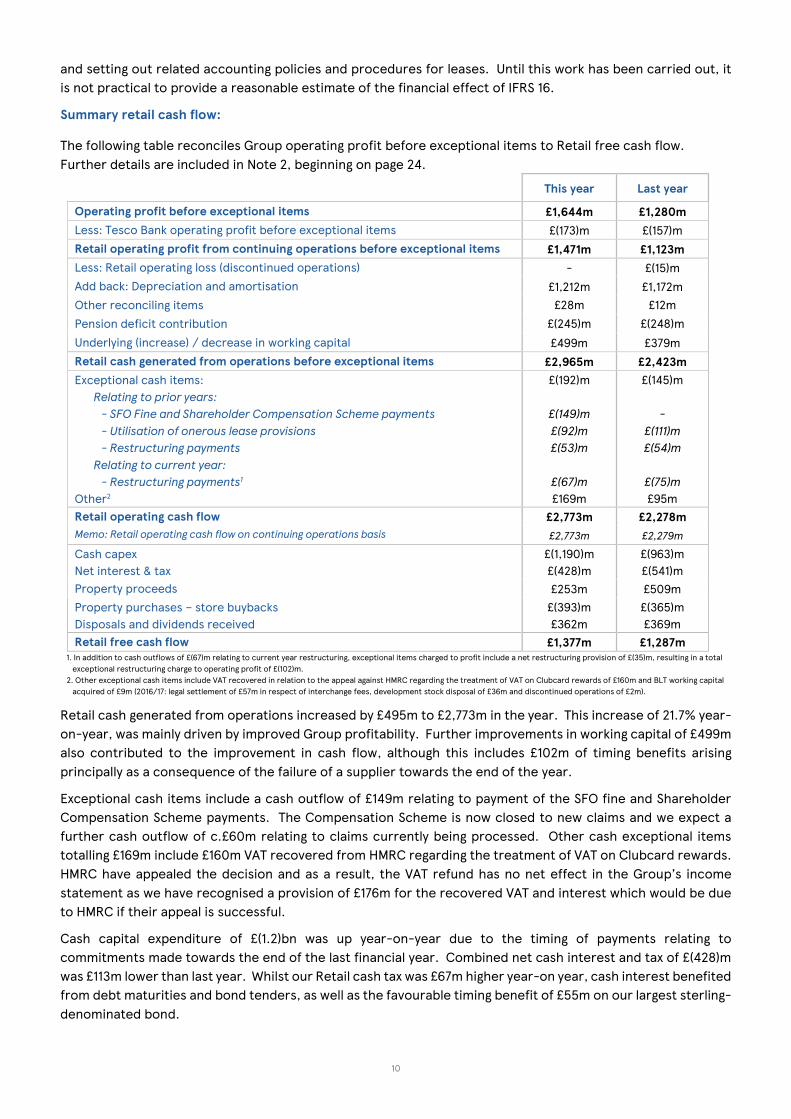
The following table reconciles Group operating profit before exceptional items to Retail free cash flow. Further details are included in Note 2, beginning on page 24.
This year Last year
Operating profit before exceptional items £1,644m £1,280m Less: Tesco Bank operating profit before exceptional items £(173)m £(157)m Retail operating profit from continuing operations before exceptional items £1,471m £1,123m Less: Retail operating loss (discontinued operations) - £(15)m Add back: Depreciation and amortisation £1,212m £1,172m Other reconciling items £28m £12m Pension deficit contribution £(245)m £(248)m Underlying (increase) / decrease in working capital £499m £379m Retail cash generated from operations before exceptional items £2,965m £2,423m Exceptional cash items: Relating to prior years: - SFO Fine and Shareholder Compensation Scheme payments - Utilisation of onerous lease provisions - Restructuring payments Relating to current year: - Restructuring payments1 Other2
£(192)m
£(149)m £(92)m £(53)m
£(67)m £169m
£(145)m
- £(111)m £(54)m
£(75)m £95m
Retail operating cash flow £2,773m £2,278m Memo: Retail operating cash flow on continuing operations basis £2,773m £2,279m
Cash capex Net interest & tax
£(1,190)m £(428)m
£(963)m £(541)m
Property proceeds £253m £509m Property purchases – store buybacks Disposals and dividends received
£(393)m £362m
£(365)m £369m
Retail free cash flow £1,377m £1,287m 1. In addition to cash outflows of £(67)m relating to current year restructuring, exceptional items charged to profit include a net restructuring provision of £(35)m, resulting in a total exceptional restructuring charge to operating profit of £(102)m. 2. Other exceptional cash items include VAT recovered in relation to the appeal against HMRC regarding the treatment of VAT on Clubcard rewards of £160m and BLT working capital acquired of £9m (2016/17: legal settlement of £57m in respect of interchange fees, development stock disposal of £36m and discontinued operations of £2m).
Retail cash generated from operations increased by £495m to £2,773m in the year. This increase of 21.7% year-on-year, was mainly driven by improved Group profitability. Further improvements in working capital of £499m also contributed to the improvement in cash flow, although this includes £102m of timing benefits arising principally as a consequence of the failure of a supplier towards the end of the year.
Exceptional cash items include a cash outflow of £149m relating to payment of the SFO fine and Shareholder Compensation Scheme payments. The Compensation Scheme is now closed to new claims and we expect a further cash outflow of c.£60m relating to claims currently being processed. Other cash exceptional items totalling £169m include £160m VAT recovered from HMRC regarding the treatment of VAT on Clubcard rewards. HMRC have appealed the decision and as a result, the VAT refund has no net effect in the Group’s income statement as we have recognised a provision of £176m for the recovered VAT and interest which would be due to HMRC if their appeal is successful.
Cash capital expenditure of £(1.2)bn was up year-on-year due to the timing of payments relating to commitments made towards the end of the last financial year. Combined net cash interest and tax of £(428)m was £113m lower than last year. Whilst our Retail cash tax was £67m higher year-on year, cash interest benefited from debt maturities and bond tenders, as well as the favourable timing benefit of £55m on our largest sterling-denominated bond.

11
We generated £253m of proceeds from property sales, £256m lower year-on-year. These proceeds include the sale of our Hackney store in the first half and a number of other sites mainly in the UK and Central Europe throughout the year. We completed the buyback of 17 stores during the year, for a cash consideration of £393m, including £189m related to our transaction with British Land. We anticipate rental savings of £26m on an annualised basis as a result of these property purchases, which reduce our discounted lease commitments by £197m.
Finally, cash inflows of £362m relating to disposals and dividends received includes consideration of £196m from the sale of our remaining minority stake in the Lazada online business, a dividend of £50m from Tesco Bank, and proceeds of £45m relating to the disposal of our optician business in the UK to Vision Express, in addition to a number of smaller transactions.
Retail free cash flow of £1,377m is up 7.0% year-on-year. This is lower than the rate of growth in retail operating cash flow principally due to the timing of cash capital expenditure and lower property proceeds.
Capital expenditure and space:
UK & ROI Central Europe Asia Tesco Bank Group
This year
Last year
This year
Last year
This year
Last year
This year
Last year
This year
Last year
Capital expenditure £676m £731m £133m £141m £239m £261m £50m £46m £1,098m £1,179m
Openings (k sq ft) 104 180 13 - 477 549 - - 594 729 Closures (k sq ft) (75) (1,752) (435) (201) (175) (26) - - (685) (1,979) Repurposed (k sq ft) (75) (98) (492) (133) (527) (696) - - (1,094) (927)
Net space added (k sq ft) (46) (1,670) (914) (334) (225) (173) - - (1,185) (2,177)
Capital expenditure shown in the table above reflects expenditure on ongoing business activities across the Group. Our capital expenditure in the UK focused on maintaining and replacing essential assets, alongside programmes to refresh and repurpose the estate, enhancing our store operations. New store capex has mainly been allocated to our new store opening programme in Thailand, with a limited number of Express store openings and a net gain of one new superstore in the UK. Our capital expenditure in Central Europe relates mainly to repurposing of existing stores.
Across the Group, our repurposing programme has contributed to a net reduction of 1.1m sq. ft., has focused on improving the ease and relevance of our large-store shopping trip for customers. In the UK & ROI, we have repurposed 75,000 sq. ft. across 20 stores. Within the year, we opened over 50 concessions within our stores, including Arcadia Group, Holland & Barrett, Dixons Carphone and Next. A brand new Booker ‘Chef Central’ concept store was also opened within the Tesco Extra Store at Bar Hill, Cambridge in February 2018. The store primarily serves professional caterers but is open to all customers.
In Central Europe, we have primarily been partnering with other clothing brands in repurposed store space including H&M and Decathlon, as part of our biggest opening programme ever. In Asia, we have worked with a range of different partners across a variety of brands including MR. DIY and Major Cineplex.
In the UK, we opened 24 new stores in the period but exited from 22. The net increase consists of expansion in Superstore and Express store numbers offset by closures of Metro and One Stop stores. In Asia, we opened a net 38 stores primarily in our convenience formats in Thailand, whilst in Central Europe we closed a net 26 stores during the year.
Capital expenditure for the full year was £1.1bn. Going forward, we expect our annual capital expenditure to remain within a range of £1.1bn to £1.4bn.
Statutory capital expenditure of £1.5bn as shown in Note 2 on page 24 includes £398m relating to property buybacks.
Further details of current and forecast space can be found in Appendix 5 starting on page 66.
12
Property
This year Last year
UK & ROI Central Europe
Asia Group UK & ROI Central Europe Asia Group
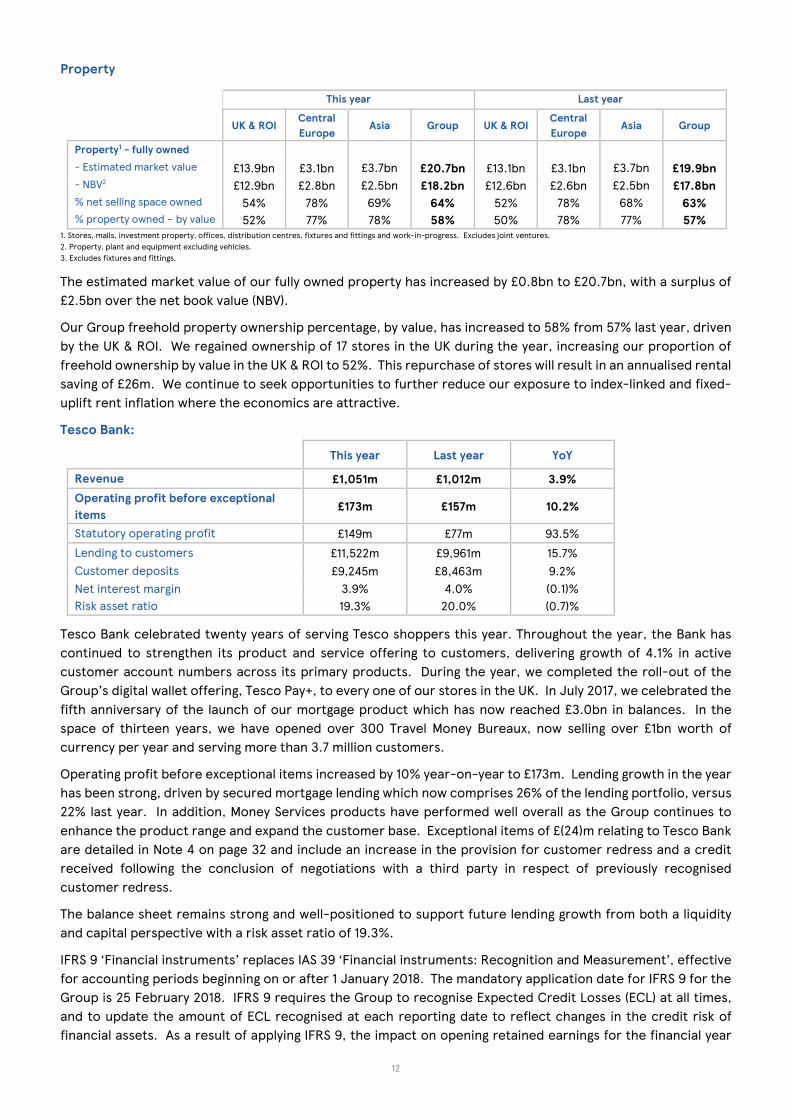
Property1 - fully owned - Estimated market value £13.9bn £3.1bn £3.7bn £20.7bn £13.1bn £3.1bn £3.7bn £19.9bn - NBV2 £12.9bn £2.8bn £2.5bn £18.2bn £12.6bn £2.6bn £2.5bn £17.8bn % net selling space owned 54% 78% 69% 64% 52% 78% 68% 63% % property owned – by value
52% 77% 78% 58% 50% 78% 77% 57%
1. Stores, malls, investment property, offices, distribution centres, fixtures and fittings and work-in-progress. Excludes joint ventures. 2. Property, plant and equipment excluding vehicles. 3. Excludes fixtures and fittings.
The estimated market value of our fully owned property has increased by £0.8bn to £20.7bn, with a surplus of £2.5bn over the net book value (NBV).
Our Group freehold property ownership percentage, by value, has increased to 58% from 57% last year, driven by the UK & ROI. We regained ownership of 17 stores in the UK during the year, increasing our proportion of freehold ownership by value in the UK & ROI to 52%. This repurchase of stores will result in an annualised rental saving of £26m. We continue to seek opportunities to further reduce our exposure to index-linked and fixed-uplift rent inflation where the economics are attractive.
Tesco Bank: This year Last year YoY
Revenue £1,051m £1,012m 3.9% Operating profit before exceptional items
£173m £157m 10.2%
Statutory operating profit £149m £77m 93.5% Lending to customers £11,522m £9,961m 15.7% Customer deposits £9,245m £8,463m 9.2% Net interest margin 3.9% 4.0% (0.1)% Risk asset ratio 19.3% 20.0% (0.7)%
Tesco Bank celebrated twenty years of serving Tesco shoppers this year. Throughout the year, the Bank has continued to strengthen its product and service offering to customers, delivering growth of 4.1% in active customer account numbers across its primary products. During the year, we completed the roll-out of the Group’s digital wallet offering, Tesco Pay+, to every one of our stores in the UK. In July 2017, we celebrated the fifth anniversary of the launch of our mortgage product which has now reached £3.0bn in balances. In the space of thirteen years, we have opened over 300 Travel Money Bureaux, now selling over £1bn worth of currency per year and serving more than 3.7 million customers.
Operating profit before exceptional items increased by 10% year-on-year to £173m. Lending growth in the year has been strong, driven by secured mortgage lending which now comprises 26% of the lending portfolio, versus 22% last year. In addition, Money Services products have performed well overall as the Group continues to enhance the product range and expand the customer base. Exceptional items of £(24)m relating to Tesco Bank are detailed in Note 4 on page 32 and include an increase in the provision for customer redress and a credit received following the conclusion of negotiations with a third party in respect of previously recognised customer redress.
The balance sheet remains strong and well-positioned to support future lending growth from both a liquidity and capital perspective with a risk asset ratio of 19.3%.
IFRS 9 ‘Financial instruments’ replaces IAS 39 ‘Financial instruments: Recognition and Measurement’, effective for accounting periods beginning on or after 1 January 2018. The mandatory application date for IFRS 9 for the Group is 25 February 2018. IFRS 9 requires the Group to recognise Expected Credit Losses (ECL) at all times, and to update the amount of ECL recognised at each reporting date to reflect changes in the credit risk of financial assets. As a result of applying IFRS 9, the impact on opening retained earnings for the financial year

13
2018/19 for Tesco Bank is expected to be £(166)m. This reflects the increase in impairment allowance under the new ECL model, net of deferred tax. The impact of the new impairment requirements on the Retail business is not material.
An income statement for Tesco Bank can be found in Appendix 6 on page 69 of this statement. Balance sheet and cash flow detail for Tesco Bank can be found within Note 2 starting on page 24 of this statement. Tesco Bank’s full year results are also published today and are available at www.corporate.tescobank.com.
Merger with Booker Group:
We completed our merger with Booker Group on 5 March, 2018, after the end of the Tesco financial year. Our ‘Joining Forces’ integration programme is well underway and we are focused on delivering the synergies identified during the merger process. We anticipate a synergy benefit of c.£60m in the first year post-completion, growing to a cumulative c.£140m in the second year and reaching the recurring run-rate of c.£200m per year by the end of the third year.
Booker Q4 results show a continued strong performance, with customer satisfaction up 0.3% to 85.7% and like-for-like sales up 9.9%. Whilst Booker’s full year results are still subject to audit approval, operating profit before exceptional items for the financial year to 30 March 2018 is c.£195m and net cash is c.£120m.
Transaction costs of £(26)m relating to our merger with Booker were included in Tesco’s UK & ROI operating profit before exceptional items in the 2016/17 financial year. Further costs and fees of £(21)m arising in the 2017/18 financial year have been treated in a consistent fashion. A similar amount, consisting of stamp duty costs directly arising from the completion of the merger, will be charged to underlying profit in the 2018/19 financial year. As outlined in our merger prospectus, we anticipate up to £(145)m of integration costs over three years, which will be treated as exceptional.
Contacts
Investor Relations: Chris Griffith 01707 912 900
Media: Jane Lawrie 01707 918 701
Philip Gawith, Teneo Blue Rubicon 0207 420 3143
This document is available at www.tescoplc.com/prelims2018
A meeting for investors and analysts will be held today at 9.00am at London Stock Exchange, 10 Paternoster Square, London, EC4M 7LS. Access will be by invitation only. For those unable to attend, there will be a live webcast available on our website at www.tescoplc.com/prelims2018. This will include all Q&A and will also be available for playback after the event. All presentation materials, including a transcript, will be made available on our website.
Disclaimer
This document may contain forward-looking statements that may or may not prove accurate. For example, statements regarding expected revenue growth and operating margins, market trends and our product pipeline are forward-looking statements. Phrases such as "aim", "plan", "intend", “should”, "anticipate", "well-placed", "believe", "estimate", "expect", "target", "consider" and similar expressions are generally intended to identify forward-looking statements. Forward-looking statements involve known and unknown risks, uncertainties and other important factors that could cause actual results to differ materially from what is expressed or implied by the statements. Any forward-looking statement is based on information available to Tesco as of the date of the statement. All written or oral forward-looking statements attributable to Tesco are qualified by this caution. Tesco does not undertake any obligation to update or revise any forward-looking statement to reflect any change in circumstances.

TESCO PLC
14
Group income statement
Notes
52 weeks ended 24 February 2018
52 weeks ended 25 February 2017
Before exceptional
items
£m
Exceptional items
(Note 4)
£m
Total
£m
Before exceptional
items
£m
Exceptional items
(Note 4)
£m
Total
£m
Continuing operations
Revenue 2 57,491 - 57,491 55,917 - 55,917
Cost of sales (54,092) (49) (54,141) (52,899) (116) (53,015)
Gross profit/(loss) 3,399 (49) 3,350 3,018 (116) 2,902
Administrative expenses (1,786) 153 (1,633) (1,734) (261) (1,995)
Profits/(losses) arising on property-related items 31 89 120 (4) 114 110
Operating profit/(loss) 1,644 193 1,837 1,280 (263) 1,017
Share of post-tax profits/(losses) of joint ventures and associates
12 (6) - (6) (30) (77) (107)
Finance income 5 98 - 98 109 - 109
Finance costs 5 (593) (38) (631) (630) (244) (874)
Profit/(loss) before tax 1,143 155 1,298 729 (584) 145
Taxation 6 (286) (20) (306) (185) 98 (87)
Profit/(loss) for the year from continuing operations 857 135 992 544 (486) 58
Discontinued operations
Profit/(loss) for the year from discontinued operations 7 - 216 216 (37) (75) (112)
Profit/(loss) for the year 857 351 1,208 507 (561) (54)
Attributable to:
Owners of the parent 857 349 1,206 515 (555) (40)
Non-controlling interests - 2 2 (8) (6) (14)
857 351 1,208 507 (561) (54)
Earnings/(losses) per share from continuing and discontinued operations
Basic 9 14.77p (0.49)p
Diluted 9 14.72p (0.49)p
Earnings/(losses) per share from continuing operations
Basic 9 12.12p 0.81p
Diluted 9 12.08p 0.81p
The notes on pages 21 to 54 form part of this condensed consolidated financial information.

TESCO PLC
15
Group statement of comprehensive income/(loss)
Notes
52 weeks 2018
£m
52 weeks 2017
£m
Items that will not be reclassified to income statement
Remeasurements on defined benefit pension schemes 17 3,265 (3,567)
Tax on items that will not be reclassified (554) 579
2,711 (2,988)
Items that may subsequently be reclassified to income statement
Change in fair value of available-for-sale financial assets and investments (62) 80
Currency translation differences:
Retranslation of net assets of overseas subsidiaries, joint ventures and associates 179 764
Movements in foreign exchange reserve and net investment hedging on subsidiary disposed, reclassified and reported in the Group income statement
7 140 -
Gains/(losses) on cash flow hedges:
Net fair value gains/(losses) (146) 385
Reclassified and reported in the Group income statement (52) (384)
Tax on items that may be reclassified 22 (23)
81 822
Total other comprehensive income/(loss) for the year 2,792 (2,166)
Profit/(loss) for the year 1,208 (54)
Total comprehensive income/(loss) for the year 4,000 (2,220)
Attributable to:
Owners of the parent 3,993 (2,206)
Non-controlling interests 7 (14)
Total comprehensive income/(loss) for the year 4,000 (2,220)
Total comprehensive income/(loss) attributable to owners of the parent arises from:
Continuing operations 3,637 (2,096)
Discontinued operations 356 (110)
3,993 (2,206)
The notes on pages 21 to 54 form part of this condensed consolidated financial information.
TESCO PLC
16
Group balance sheet
Notes
24 February 2018
£m
25 February 2017
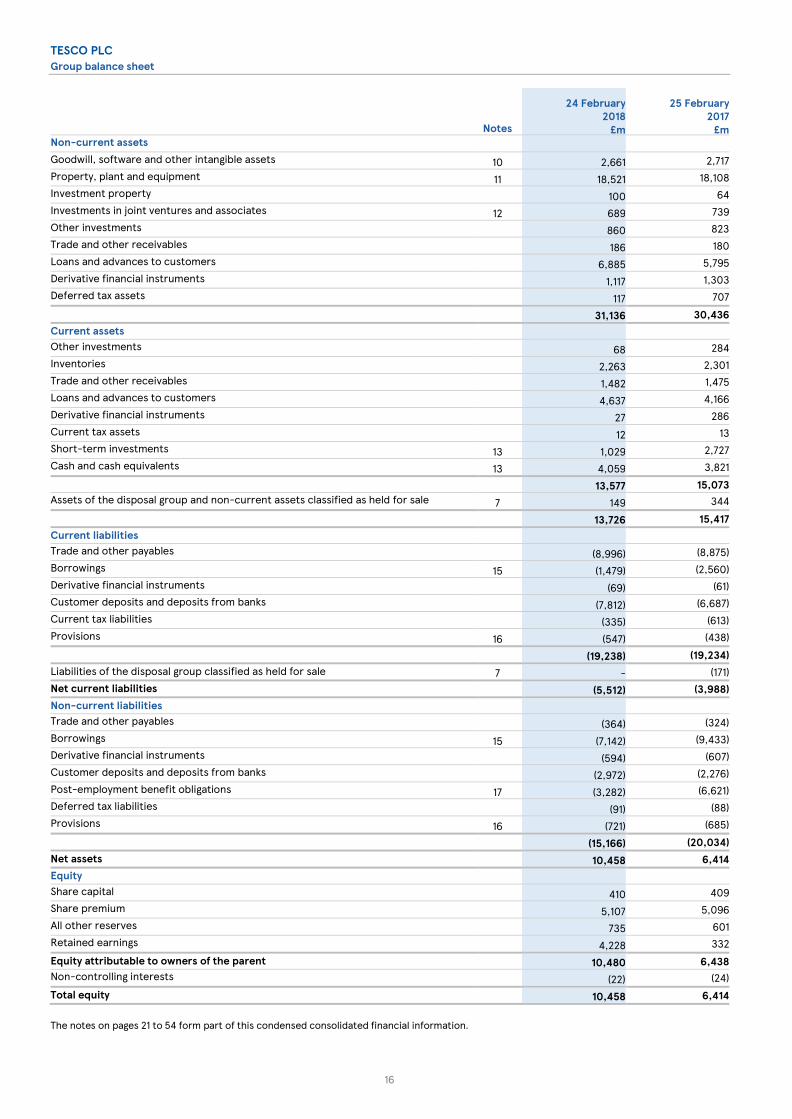
£m Non-current assets Goodwill, software and other intangible assets 10 2,661 2,717 Property, plant and equipment 11 18,521 18,108 Investment property 100 64 Investments in joint ventures and associates 12 689 739 Other investments 860 823 Trade and other receivables 186 180 Loans and advances to customers 6,885 5,795 Derivative financial instruments 1,117 1,303 Deferred tax assets 117 707
31,136 30,436 Current assets Other investments 68 284 Inventories 2,263 2,301 Trade and other receivables 1,482 1,475 Loans and advances to customers 4,637 4,166 Derivative financial instruments 27 286 Current tax assets 12 13 Short-term investments 13 1,029 2,727 Cash and cash equivalents 13 4,059 3,821 13,577 15,073 Assets of the disposal group and non-current assets classified as held for sale 7 149 344
13,726 15,417 Current liabilities Trade and other payables (8,996) (8,875) Borrowings 15 (1,479) (2,560) Derivative financial instruments (69) (61) Customer deposits and deposits from banks (7,812) (6,687) Current tax liabilities (335) (613) Provisions 16 (547) (438) (19,238) (19,234) Liabilities of the disposal group classified as held for sale 7 - (171) Net current liabilities (5,512) (3,988) Non-current liabilities Trade and other payables (364) (324) Borrowings 15 (7,142) (9,433) Derivative financial instruments (594) (607) Customer deposits and deposits from banks (2,972) (2,276) Post-employment benefit obligations 17 (3,282) (6,621) Deferred tax liabilities (91) (88) Provisions 16 (721) (685)
(15,166) (20,034) Net assets 10,458 6,414 Equity Share capital 410 409 Share premium 5,107 5,096 All other reserves 735 601 Retained earnings 4,228 332 Equity attributable to owners of the parent 10,480 6,438 Non-controlling interests (22) (24) Total equity 10,458 6,414 The notes on pages 21 to 54 form part of this condensed consolidated financial information.

TESCO PLC
17
Group statement of changes in equity
All other reserves
Share capital
£m
Share premium
£m
Other
reserves £m
Capital redemption
reserve £m
Hedging reserve
£m
Translation reserve
£m
Treasury shares
£m
Retained earnings
£m
Total
£m
Non- controlling
interests £m
Total
equity £m
At 25 February 2017 409 5,096 40 16 217 350 (22) 332 6,438 (24) 6,414
Profit/(loss) for the year - - - - - - - 1,206 1,206 2 1,208
Other comprehensive income/(loss)
Change in fair value of available–for–sale financial assets and investments
- - - - - - - (62) (62) - (62)
Currency translation differences
- - - - - 314 - - 314 5 319
Remeasurements of defined benefit pension schemes
- - - - - - - 3,265 3,265 - 3,265
Gains/(losses) on cash flow hedges
- - - - (198) - - - (198) - (198)
Tax relating to components of other comprehensive income
- - - - 21 (9) - (544) (532) - (532)
Total other comprehensive income/(loss)
- - - - (177) 305 - 2,659 2,787 5 2,792
Total comprehensive income/(loss)
- - - - (177) 305 - 3,865 3,993 7 4,000
Transactions with owners
Purchase of treasury shares - - - - - - (14) - (14) - (14)
Share–based payments - - - - - - 20 105 125 - 125
Issue of shares 1 11 - - - - - - 12 - 12
Dividends - - - - - - - (80) (80) - (80)
Changes in non-controlling interests
- - - - - - - - - (5) (5)
Tax on items charged to equity - - - - - - - 6 6 - 6
Total transactions with owners
1 11 - - - - 6 31 49 (5) 44
At 24 February 2018 410 5,107 40 16 40 655 (16) 4,228 10,480 (22) 10,458
The notes on pages 21 to 54 form part of this condensed consolidated financial information.

TESCO PLC
18
Group statement of changes in equity continued
All other reserves
Share capital
£m
Share premium
£m
Other
reserves £m
Capital redemption
reserve £m
Hedging reserve
£m
Translation reserve
£m
Treasury shares
£m
Retained earnings
£m
Total
£m
Non- controlling
interests £m
Total
equity £m
At 27 February 2016 407 5,095 40 16 211 (401) (7) 3,265 8,626 (10) 8,616
Profit/(loss) for the year - - - - - - - (40) (40) (14) (54)
Other comprehensive income/(loss)
Change in fair value of available-for-sale financial assets and investments
- - - - - - - 80 80 - 80
Currency translation differences - - - - - 764 - - 764 - 764
Remeasurements on defined benefit pension schemes
- - - - - - - (3,567) (3,567) - (3,567)
Gains/(losses) on cash flow hedges
- - - - 1 - - - 1 - 1
Tax relating to components of other comprehensive income
- - - - 5 (13) - 564 556 - 556
Total other comprehensive income/(loss)
- - - - 6 751 - (2,923) (2,166) - (2,166)
Total comprehensive income/(loss)
- - - - 6 751 - (2,963) (2,206) (14) (2,220)
Transactions with owners
Purchase of treasury shares - - - - - - (24) - (24) - (24)
Share-based payments - - - - - - 9 28 37 - 37
Issue of shares 2 1 - - - - - - 3 - 3
Dividends - - - - - - - - - - -
Tax on items charged on equity - - - - - - - 2 2 - 2
Total transactions with owners 2 1 - - - - (15) 30 18 - 18
At 25 February 2017 409 5,096 40 16 217 350 (22) 332 6,438 (24) 6,414
The notes on pages 21 to 54 form part of this condensed consolidated financial information.

TESCO PLC
19
Group cash flow statement
Notes 52 weeks
2018 £m
52 weeks 2017
£m
Cash flows generated from/(used in) operating activities
Operating profit/(loss) of continuing operations 1,837 1,017
Operating profit/(loss) of discontinued operations - (117)
Depreciation and amortisation 1,295 1,304
(Profit)/loss arising on sale of property, plant and equipment and intangible assets (66) (78)
(Profit)/loss arising on sale of subsidiaries and other investments (165) 3
(Profit)/loss arising on sale of joint ventures and associates (23) (5)
Impairment loss on goodwill - 46
Net impairment loss/(reversal) on other investments (22) (12)
Net impairment loss/(reversal) on property, plant and equipment, intangible assets and investment property
(167) (5)
Adjustment for non-cash element of pensions charge 4 7
Additional contribution into pension schemes 17 (245) (248)
Share-based payments 113 15
Tesco Bank fair value movements included in operating profit 156 98
Retail (increase)/decrease in inventories 55 124
Retail (increase)/decrease in development stock 21 16
Retail (increase)/decrease in trade and other receivables (1) (74)
Retail increase/(decrease) in trade and other payables 278 510
Retail increase/(decrease) in provisions 132 11
Retail (increase)/decrease in working capital 485 587
Tesco Bank (increase)/decrease in loans and advances to customers (1,738) (1,529)
Tesco Bank (increase)/decrease in trade and other receivables 30 (24)
Tesco Bank increase/(decrease) in customer and bank deposits, trade and other payables 1,821 1,474
Tesco Bank increase/(decrease) in provisions (6) 25
Tesco Bank (increase)/decrease in working capital 107 (54)
Cash generated from/(used in) operations 3,309 2,558
Interest paid (351) (522)
Corporation tax (paid)/received (176) (47)
Net cash generated from/(used in) operating activities 2,782 1,989
The notes on pages 21 to 54 form part of this condensed consolidated financial information.

TESCO PLC
20
Group cash flow statement continued
Notes
52 weeks 2018
£m
52 weeks 2017
£m
Net cash generated from/(used in) operating activities 2,782 1,989
Cash flows generated from/(used in) investing activities
Proceeds from sale of property, plant and equipment, investment property, intangible assets and non-current assets classified as held for sale
253 512
Purchase of property, plant and equipment, investment property and non-current assets classified as held for sale
(1,440) (1,205)
Purchase of intangible assets (197) (169)
Disposal of subsidiaries, net of cash disposed 66 205
Acquisition of subsidiaries, net of cash acquired 19 (27) (25)
Proceeds from sale of joint ventures and associates 23 -
Net (increase)/decrease in loans to joint ventures and associates - 15
Investments in joint ventures and associates (21) -
Net (investments in)/proceeds from sale of short-term investments 1,697 736
Net (investments in)/proceeds from sale of other investments 236 141
Dividends received from joint ventures and associates 26 28
Interest received 50 41
Net cash generated from/(used in) investing activities 666 279
Cash flows generated from/(used in) financing activities
Proceeds from issue of ordinary share capital 11 1
Increase in borrowings 313 185
Repayment of borrowings (3,721) (2,036)
Net cash flows from derivative financial instruments 253 475
Repayments of obligations under finance leases (10) (12)
Dividends paid to equity owners 8 (82) -
Net cash generated from/(used in) financing activities (3,236) (1,387)
Net increase/(decrease) in cash and cash equivalents 212 881
Cash and cash equivalents at the beginning of the year 3,832 3,082
Effect of foreign exchange rate changes 15 (131)
Cash and cash equivalents including cash held in disposal group at the end of the year 4,059 3,832
Cash held in disposal group 7 - (11)
Cash and cash equivalents at the end of the year 13 4,059 3,821
The notes on pages 21 to 54 form part of this condensed consolidated financial information.

TESCO PLC
21
Note 1 Basis of preparation
This preliminary consolidated financial information has been prepared in accordance with the Disclosure and Transparency Rules of UK Financial Conduct Authority, and the principles of International Financial Reporting Standards (IFRS) as adopted by the European Union. The accounting policies applied are consistent with those described in the Annual Report and Group financial statements 2018. This preliminary consolidated financial information has been prepared on a going concern basis. This preliminary consolidated financial information does not constitute statutory consolidated financial statements for the 52 weeks ended 24 February 2018 as defined under section 434 of the Companies Act 2006. The Annual Report and Group financial statements for the 52 weeks ended 24 February 2018 were approved by the Board of Directors on 10 April 2018. The report of the auditor on those Group financial statements was unqualified, did not contain an emphasis of matter paragraph and did not contain any statement under section 498 of the Companies Act 2006. An abbreviated copy of the audit report can be found on page 60. The Annual Report and Group financial statements for 2018 will be filed with the Registrar in due course. The Annual Report and Group financial statements for the 52 weeks ended 25 February 2017 were approved by the Board of Directors on 11 April 2017. The report of the auditor on those Group financial statements was unqualified, did not contain an emphasis of matter paragraph and did not contain any statement under section 498 of the Companies Act 2006. The Directors consider that the Group has, at the time of approving the Group financial statements, adequate resources to continue in operational existence for the foreseeable future and have therefore continued to adopt the going concern basis in preparing the preliminary consolidated financial information.
Judgement - Equity transactions with joint venture partners
During the year the Group unwound its joint venture with British Land Co PLC (British Land). As part of the unwind, the Group obtained sole control of BLT Properties Ltd and seven stores, while British Land obtained sole control of BLT Holdings (2010) Ltd and two stores.
The Group is an equity partner in several joint ventures. Where the Group acquires the other partner’s interests in the joint venture, management applies judgement in determining whether the transaction is accounted for as a business combination or as an asset acquisition. Factors considered in making this determination include whether the property management services in the joint venture are significant processes, and whether substantially all of the consideration paid relates to the fair value of purchased properties. For transactions accounted for as business combinations where the Group leases properties in the joint venture, management further considers whether increases in valuation of the properties above vacant possession value are attributable to the value of the lease contract or reflect residual goodwill.
Management exercised judgement in accounting for the Group’s acquisition of BLT Properties Ltd as an asset acquisition, since substantially all of the purchase price related to the fair value of the seven stores purchased. The sale of shares in BLT Holdings (2010) Ltd was accounted for as a sale of an investment. Refer to Note 4.
Change in estimate - Post-employment benefit obligations
The present value of post-employment benefit obligations depends on a number of factors that are determined on an actuarial basis using a number of assumptions. The assumptions used in determining the net cost/(income) for pensions include the discount rate. Any changes in these assumptions will impact the carrying amount of post-employment benefit obligations.
During the year the Group has taken actuarial advice and decided to change the model used for deriving the discount rate assumption for valuing the Tesco PLC Pension Scheme’s liabilities under IAS 19 ‘Employee Benefits’.
Further details of this change and its impact in the year are disclosed in Note 17.
Discontinued operations
In accordance with IFRS 5 ‘Non-current Assets Held for Sale and Discontinued Operations’, the net results of discontinued operations are presented separately in the Group income statement and the assets and liabilities of these operations are presented separately in the Group balance sheet. Management has applied judgement in presenting the Group’s retail operations in Turkey as a discontinued operation Management consider the retail operations in Turkey as an operating segment, one level below the reportable Retail Central Europe segment. Management further considered previous treatment of similar disposals in China and Korea as discontinued operations. Refer to Note 7.
Standards issued but not yet effective
At the date of authorisation of these condensed consolidated financial statements, the Group has not applied the following standards that have been issued but are not yet effective. The Group has not adopted any new or amended standards early.
• IFRS 9 ‘Financial Instruments’
IFRS 9 ‘Financial Instruments’ replaces IAS 39 ‘Financial Instruments: Recognition and Measurement’ with the exception of macro hedge accounting. The standard will be effective in the Group financial statements for the 52 weeks ending 23 February 2019. The Group intends to apply the classification and measurement and impairment requirements of the standard retrospectively at the transition date of 25 February 2018 by adjusting the opening balance sheet, with no restatement of comparative periods. Hedge accounting relationships within the scope of IFRS 9 will transition prospectively.
The standard covers three elements: – Classification and measurement: Changes to a more principle based approach to classify financial assets as either held at amortised cost, fair value through other comprehensive income (FVOCI) or fair value through profit or loss, dependent on the business model and cash flow characteristics of the financial asset; – Impairment: Moves to an impairment model based on expected credit losses based on a three stage approach; and – Hedge accounting: The IFRS 9 hedge accounting requirements are designed to allow hedge accounting to be more closely aligned with the Group’s underlying risk management. A new International Accounting Standards Board (IASB) project is in progress to develop an approach to better reflect dynamic risk management in entities’ financial statements.

TESCO PLC
22
Note 1 Basis of preparation continued
Standards issues but not yet effective continued
Classification and measurement: From a review of the Group’s balance sheet as at 24 February 2018, the Group expects the following classification changes to take place: – All financial instruments classified as loans and receivables under IAS 39 will be classified and measured at amortised cost under IFRS 9; and – All financial instruments classified as available-for-sale under IAS 39 will be classified and measured at FVOCI under IFRS 9.
Impairment: IFRS 9 requires the Group to recognise expected credit losses (ECL) at all times, and to update the amount of ECL recognised at each reporting date to reflect changes in the credit risk of financial assets. The ECL will be measured under the simplified approach, with the exception of loans and advances to customers, other investments and joint venture loans, where the three-stage approach will be applied. The assessment of credit risk and the estimation of ECL are required to be unbiased, forward-looking and probability-weighted, determined by evaluating at the reporting date for each financial asset a range of possible outcomes using reasonable and supportable information about past events, current conditions and forecasts of future events and economic conditions. The estimation of ECL also takes into account the time value of money. As a result of applying IFRS 9, the impact on opening retained earnings for the year ended 28 February 2019 for Tesco Bank is expected to be a reduction of £166m. This reflects the increase in impairment allowance under the new ECL model, net of deferred tax. The impact of the new impairment requirements on the Retail business is not material. Hedge accounting: The IFRS 9 hedge accounting requirements are designed to allow hedge accounting to be more closely aligned with financial risk management. A new IFRS is under development to account for dynamic risk management. As permitted under IFRS 9, the Group will elect to continue to apply the existing hedge accounting requirements of IAS 39 for its portfolio hedge accounting until this new standard is implemented. All other existing hedge relationships will transition to IFRS 9 on adoption.
• IFRS 15 ‘Revenues from Contracts with Customers’
IFRS 15, ‘Revenues from Contracts with Customers’ will be effective in the Group financial statements for the 52 weeks ending 23 February 2019. The Group intends to adopt the standard retrospectively, with comparatives restated from a transition date of 26 February 2017.
IFRS 15 introduces a five-step approach to the timing of revenue recognition based on performance obligations in customer contracts. The core principle of IFRS 15 is that an entity should recognise revenue to depict the transfer of promised goods and services to customers in an amount that reflects the consideration to which the entity expects to be entitled in exchange for those goods or services. The Group recognises revenue from the principal activities of retailing and associated activities and retail banking and insurance services through Tesco Bank. For the majority of revenue streams, there is a low level of judgement applied in determining the consideration or the timing of transfer of control. As a result, revenue recognition under IFRS 15 will be largely consistent with current practice. Revenue streams that will be impacted include Clubcard loyalty points, for which the fair value of consideration will change, and certain telecommunication contracts and bespoke contracts fulfilled by dunnhumby, for which the timing of revenue recognition will change.
IFRS 15 is not expected to result in a material impact to the Retail business. The impact for Tesco Bank is still under assessment.
• IFRS 16 ‘Leases’
IFRS 16 ‘Leases’ will be effective in the Group financial statements for the 53 weeks ending 29 February 2020. The Group intends to adopt the standard retrospectively, with comparatives restated from a transition date of 25 February 2018.
IFRS 16 provides a single lessee accounting model, requiring lessees to recognise right-of-use assets and lease liabilities for all applicable leases. Under IFRS 16, lessees will be required to remeasure the lease liability upon the occurrence of certain events, such as a change in future lease payments resulting from a change in an index or rate used to determine those payments. The lessee will generally recognise the amount of the remeasurement of the lease liability as an adjustment to the right-of-use asset. IFRS 16 is expected to have a significant impact on reported assets, liabilities and income statement of the Group, as well as the classification of cash flows relating to lease contracts. The standard will impact a number of key measures such as operating profit and cash generated from operations, as well as a number of alternative performance measures used by the Group. The Group’s IFRS 16 Project is governed by a Steering Committee, which regularly reports progress to the Group Audit Committee. During the current reporting period, progress has been made in the collation of the additional lease data required to support IFRS 16 calculations, establishing systems and processes required for accounting and reporting under IFRS 16 and in determining the appropriate discount rates to apply to lease payments. During the next financial year, the Group will finalise this work and set out accounting policies and procedures for leases. The Group will also establish a process of parallel reporting for the comparative period. Until the impact assessment is completed, it is not practical to provide a reasonable estimate of the financial effect of IFRS 16.

TESCO PLC
23
Note 1 Basis of preparation continued
Alternative performance measures (APMs)
In the reporting of financial information, the Directors have adopted various APMs.
These measures are not defined by International Financial Reporting Standards (IFRS) and therefore may not be directly comparable with other companies’ APMs, including those in the Group’s industry.
APMs should be considered in addition to, and are not intended to be a substitute for, or superior to, IFRS measurements.
Purpose
The Directors believe that these APMs assist in providing additional useful information on the underlying trends, performance and position of the Group.
APMs are also used to enhance the comparability of information between reporting periods and geographical units (such as like-for-like sales), by adjusting for non-recurring or uncontrollable factors which affect IFRS measures, to aid users in understanding the Group’s performance.
Consequently, APMs are used by the Directors and management for performance analysis, planning, reporting and incentive-setting purposes.
The key APMs that the Group has focused on in the financial year are as follows:
• Group sales: This is the headline measure of revenue for the Group. It excludes the impact of sales made at petrol filling stations due to the significant volatility of fuel prices. This volatility is outside the control of management and can mask underlying changes in performance.
• Like-for-like sales: This is a widely used indicator of a retailer’s current trading performance. It is a measure of growth in Group online sales and sales from stores that have been open for at least a year (but excludes prior year sales of stores closed during the year) at constant foreign exchange rates.
• Operating profit before exceptional items: This is the headline measure of the Group’s performance, and is based on operating profit before the impact of exceptional items. Exceptional items relate to certain costs or incomes that derive from events or transactions that fall within the normal activities of the Group but which, individually or, if of a similar type, in aggregate, are excluded by virtue of their size and nature in order to reflect management’s view of the performance of the Group.
• Retail operating cash flow: This is the operating cash flow of continuing operations, excluding the effects of Tesco Bank’s cash flows.
• Retail free cash flow: Retail free cash flow includes all cash flows from operating and investing activities for the Retail business, and the market purchase of shares in relation to share schemes. The following items are excluded: investing cash flows that increase/decrease items within Net debt, and cash flows from major corporate acquisitions and disposals.
• Net debt: This excludes the net debt of Tesco Bank but includes that of the discontinued operations to reflect the net debt obligations of the Retail business.
• Diluted earnings per share from continuing operations before exceptional items, net pension finance costs and fair value remeasurements on financial instruments: This relates to profit after tax before exceptional items from continuing operations, net pension finance costs and fair value remeasurements on financial instruments attributable to owners of the parent divided by the weighted average number of ordinary shares in issue during the financial year adjusted for the effects of potentially dilutive share options.
Some of the Group’s IFRS measures are translated at constant exchange rates. Constant exchange rates are the average actual periodic exchange rates for the previous financial year and are used to eliminate the effects of exchange rate fluctuations in assessing performance. Actual exchange rates are the average actual periodic exchange rates for that financial year.
Changes to APMs
During the financial year, the following changes have been applied to the Group’s APMs:
• Free cash flow has been redefined to include all cash flows from operating and investing activities, and the market purchase of shares in relation to share schemes. The following items are excluded: investing cash flows that increase/decrease items within Group net debt, and cash flows from major corporate acquisitions and disposals. This measure reflects the cash available to shareholders. Previously, free cash flow only included capital expenditure cash flows within investing activities. Retail free cash flow is now considered a key APM.
• Diluted earnings per share from continuing operations before exceptional items and net pension finance costs has been replaced with diluted earnings per share from continuing operations before exceptional items, net pension finance costs and fair value remeasurements on financial instruments. Fair value remeasurements are now excluded as they are impacted by changes to credit risk and various market indices, which can fluctuate significantly. Also included in these items are fair value remeasurements on financial instruments resulting from liability management exercises. Other earnings per share measures before exceptional items are no longer considered APMs and have been removed.
• Total indebtedness ratio and Fixed charge cover have been included as new APMs during the year. Earnings before interest, tax, depreciation, amortisation and rent expense (EBITDAR) has also been included as it is used to calculate these debt metrics. Total indebtedness ratio and Fixed charge cover are measures of the Group’s ability to meet its payment obligations and are widely used by analysts and credit rating agencies.
Refer to the Glossary for a full list, comprehensive descriptions and purpose of the Group’s APMs.

TESCO PLC
24
Note 2 Segmental reporting
The Group’s operating segments are determined based on the Group’s internal reporting to the Chief Operating Decision Maker (CODM). The CODM has been determined to be the Group Chief Executive, with support from the Executive Committee, as the function primarily responsible for the allocation of resources to segments and assessment of performance of the segments.
In line with changes in management structure reporting to the CODM, the Group has reassessed its reportable segments and determined that the retailing and associated activities previously disclosed within the International segment should be segregated between the Central Europe and Asia segments.
The principal activities of the Group are therefore presented in the following segments:
• Retailing and associated activities (Retail) in: – UK & ROI – the United Kingdom and Republic of Ireland; – Central Europe – Czech Republic, Hungary, Poland, Slovakia; and – Asia – Malaysia and Thailand.
• Retail banking and insurance services through Tesco Bank in the UK (Tesco Bank).
This presentation reflects how the Group’s operating performance is reviewed internally by management. Segmental information for the 52 weeks ended 25 February 2017 has been amended accordingly. The amounts disclosed within the Central Europe and Asia segments total the amounts previously disclosed within the International segment.
Excluded from the segmental information below are the Retail activities of Turkey which have been classified as discontinued operations. Refer to Note 7 for further details.
The CODM uses operating profit before exceptional items, as reviewed at monthly Executive Committee meetings, as the key measure of the segments’ results as it reflects the segments’ underlying performance for the financial year under evaluation. Operating profit before exceptional items is a consistent measure within the Group as defined within Note 1. Refer to Note 4 for exceptional items. Inter-segment revenue between the operating segments is not material.
Income statement
The segment results and the reconciliation of the segment measures to the respective statutory items included in the Group income statement are as follows:
52 weeks ended 24 February 2018 At constant exchange rates
UK & ROI £m
Central Europe
£m Asia £m
Tesco Bank
£m
Total at constant
exchange £m
Foreign
exchange £m
Total at actual
exchange £m
Continuing operations
Group sales 38,522 5,884 4,692 1,051 50,149 842 50,991
Revenue 44,775 6,109 4,692 1,051 56,627 864 57,491
Operating profit/(loss) before exceptional items* 1,046 110 282 173 1,611 33 1,644
Exceptional items 141 88 (20) (24) 185 8 193
Operating profit/(loss) 1,187 198 262 149 1,796 41 1,837
Operating margin 2.3% 1.8% 6.0% 16.5% 2.8% 2.9%
52 weeks ended 24 February 2018 At actual exchange rates
UK & ROI £m
Central Europe
£m Asia £m
Tesco Bank
£m
Total at actual
exchange £m
Continuing operations
Group sales 38,650 6,343 4,947 1,051 50,991
Revenue 44,908 6,585 4,947 1,051 57,491
Operating profit/(loss) before exceptional items* 1,053 119 299 173 1,644
Exceptional items 146 93 (22) (24) 193
Operating profit/(loss) 1,199 212 277 149 1,837
Operating margin 2.3% 1.8% 6.0% 16.5% 2.9%
Share of post-tax profits/(losses) of joint ventures and associates (6)
Finance income 98
Finance costs (631)
Profit/(loss) before tax 1,298
* Intercompany recharges totalling £nil (2017: £2m) between continuing operations and the Turkey discontinued operations have been eliminated.

TESCO PLC
25
Note 2 Segmental reporting continued
Income statement continued
52 weeks ended 25 February 2017 At actual exchange rates
UK & ROI £m
Central Europe
£m Asia £m
Tesco Bank
£m
Total at actual
exchange £m
Continuing operations
Group sales 37,692 5,977 5,186 1,012 49,867
Revenue 43,524 6,195 5,186 1,012 55,917
Operating profit/(loss) before exceptional items* 803 58 262 157 1,280
Exceptional items (284) 132 (31) (80) (263)
Operating profit/(loss) 519 190 231 77 1,017
Operating margin 1.8% 0.9% 5.1% 15.5% 2.3%
Share of post-tax profits/(losses) of joint ventures and associates (107)
Finance income 109
Finance costs (874)
Profit/(loss) before tax 145
* Refer to previous table for footnote
Balance sheet
The following tables showing segment assets and liabilities exclude those balances that make up net debt (cash and cash equivalents, short-term investments, joint venture loans and other receivables, bank and other borrowings, finance lease payables, derivative financial instruments and net debt of the disposal group). Net debt balances have been included within the unallocated segment to reflect how the Group manages these balances. Intercompany transactions have been eliminated other than intercompany transactions with Tesco Bank in net debt.
At 24 February 2018 UK & ROI
£m
Central Europe
£m Asia £m
Tesco Bank
£m Unallocated
£m Total
£m
Goodwill, software and other intangible assets 1,281 36 271 1,073 - 2,661
Property, plant and equipment and investment property 13,190 2,799 2,564 68 - 18,621
Investments in joint ventures and associates 12 1 586 90 - 689
Non-current other investments 3 - - 857 - 860
Non-current trade and other receivables(a) 30 6 12 - - 48
Non-current loans and advances to customers - - - 6,885 - 6,885
Deferred tax assets 19 33 65 - - 117
Non-current assets(b) 14,535 2,875 3,498 8,973 - 29,881
Inventories and current trade and other receivables(c) 2,428 610 398 308 - 3,744
Current loans and advances to customers - - - 4,637 - 4,637
Current other investments - - - 68 - 68
Total trade and other payables (7,241) (853) (1,028) (238) - (9,360)
Total customer deposits and deposits from banks - - - (10,784) - (10,784)
Total provisions (1,034) (110) (47) (77) - (1,268)
Deferred tax liabilities (20) (35) (32) (4) - (91)
Net current tax (263) (9) (16) (35) - (323)
Post-employment benefits (3,261) - (21) - - (3,282)
Assets of the disposal group and classified as held for sale(d) 95 54 - - - 149
Liabilities of the disposal group(d) - - - - - -
Net debt (including Tesco Bank)(e) - - - (288) (2,625) (2,913)
Net assets 5,239 2,532 2,752 2,560 (2,625) 10,458
(a) Excludes loans to joint ventures of £138m (2017: £137m) which form part of Net debt.(b) Excludes derivative financial instrument non-current assets of £1,117m (2017: £1,303m).(c) Excludes net interest and other receivables of £1m (2017: £1m) which form part of Net debt.(d) Excludes net debt of the disposal group of £nil (2017: £(65)m). Refer to Note 7.(e) Refer to Note 18.

TESCO PLC
26
Note 2 Segmental reporting continued
Balance sheet continued
At 25 February 2017 UK & ROI
£m
Central Europe
£m Asia £m
Tesco Bank
£m Unallocated
£m Total
£m
Goodwill, software and other intangible assets 1,293 44 278 1,102 - 2,717
Property, plant and equipment and investment property 12,893 2,613 2,593 73 - 18,172
Investments in joint ventures and associates 11 1 656 71 - 739
Non-current other investments - - - 810 13 823
Non-current trade and other receivables(a) 23 7 13 - - 43
Non-current loans and advances to customers - - - 5,795 - 5,795
Deferred tax assets 601 23 83 - - 707
Non-current assets(b) 14,821 2,688 3,623 7,851 13 28,996
Inventories and current trade and other receivables(c) 2,389 654 394 338 - 3,775
Current loans and advances to customers - - - 4,166 - 4,166
Current other investments - - - 156 128 284
Total trade and other payables (7,006) (799) (1,152) (242) - (9,199)
Total customer deposits and deposits from banks - - - (8,963) - (8,963)
Total provisions (914) (80) (45) (84) - (1,123)
Deferred tax liabilities (7) (26) (41) (14) - (88)
Net current tax (579) (1) (12) (8) - (600)
Post-employment benefits (6,600) - (21) - - (6,621)
Assets of the disposal group and classified as held for sale(d) 100 46 - - 187 333
Liabilities of the disposal group(d) - - - - (95) (95)
Net debt (including Tesco Bank)(e) - - - (722) (3,729) (4,451)
Net assets 2,204 2,482 2,746 2,478 (3,496) 6,414
(a)–(e) Refer to previous table for footnotes.
Other segment information
52 weeks ended 24 February 2018 UK & ROI
£m
Central Europe
£m Asia £m
Tesco Bank
£m
Total continuing operations
£m
Discontinued operations
£m Total
£m Capital expenditure (including acquisitions
through business combinations):
Property, plant and equipment 940 117 236 7 1,300 - 1,300
Investment property 1 - - - 1 - 1
Goodwill, software and other intangible assets* 141 16 3 43 203 - 203
Depreciation and amortisation:
Property, plant and equipment (686) (147) (230) (12) (1,075) - (1,075)
Investment property (1) - - - (1) - (1)
Software and other intangible assets (121) (18) (9) (71) (219) - (219)
Impairment:
Property, plant and equipment loss (50) (6) (32) - (88) - (88)
Property, plant and equipment reversal 154 112 9 - 275 - 275
Investment property loss - (1) - - (1) - (1)
Investment property reversal 3 2 - - 5 - 5
Goodwill, software and other intangible assets loss
(20) (8) - - (28) - (28)
Software and other intangible assets reversal 4 - - - 4 - 4
* Includes £8m (2017: £nil) of goodwill, software and other intangible assets acquired through business combinations.

TESCO PLC
27
Note 2 Segmental reporting continued
Other segment information continued
52 weeks ended 25 February 2017 UK & ROI
£m
Central Europe
£m Asia £m
Tesco Bank
£m
Total continuing operations
£m
Discontinued operations*
£m Total
£m
Capital expenditure (including acquisitions through business combinations):
Property, plant and equipment 995 127 259 12 1,393 2 1,395
Investment property - - - - - - -
Goodwill, software and other intangible assets 111 13 3 34 161 - 161
Depreciation and amortisation:
Property, plant and equipment (687) (141) (208) (17) (1,053) (5) (1,058)
Investment property (1) - - - (1) - (1)
Software and other intangible assets (117) (16) (10) (101) (244) (1) (245)
Impairment:
Property, plant and equipment loss (12) (121) (34) - (167) (106) (273)
Property, plant and equipment reversal 118 158 3 - 279 - 279
Investment property loss (2) (1) - - (3) - (3)
Investment property reversal 3 1 - - 4 - 4
Goodwill, software and other intangible assets loss
(54) - - - (54) - (54)
Software and other intangible assets reversal - 1 - - 1 - 1
* Discontinued operations in this table represents amounts up until the point a disposal group is classified as such. This comprises those of Turkey in the first four months of the 52 weeks ended 25 February 2017.

TESCO PLC
28
Note 2 Segmental reporting continued
Cash flow statement
The following tables provide further analysis of the Group cash flow statement, including a split of cash flows between Retail and Tesco Bank. The current year’s presentation includes additional details on the line items impacted by exceptional items, while removing the analysis between Retail continuing and discontinued operations. Comparatives for the prior year have been amended accordingly.
Retail Tesco Bank Tesco Group
52 weeks ended 24 February 2018
Before exceptional
items £m
Exceptional items
£m
Retail Total
£m
Before exceptional
items £m
Exceptional items
£m
Tesco Bank Total
£m Total
£m Operating profit/(loss) of continuing operations 1,471 217 1,688 173 (24) 149 1,837
Operating profit/(loss) of discontinued operations - - - - - - -
Depreciation and amortisation 1,212 - 1,212 83 - 83 1,295
ATM net income (37) - (37) 37 - 37 -
(Profit)/loss arising on sale of property, plant and equipment and intangible assets
(8) (58) (66) - - - (66)
(Profit)/loss arising on sale of subsidiaries and other investments
(3) (162) (165) - - - (165)
(Profit)/loss arising on sale of joint ventures and associates
(7) (16) (23) - - - (23)
Net impairment loss/(reversal) on other investments
(22) - (22) - - - (22)
Net impairment loss/(reversal) on property, plant and equipment, software and other intangible assets and investment property
(8) (159) (167) - - - (167)
Adjustment for non-cash element of pensions charge
4 - 4 - - - 4
Additional contribution into pension schemes (245) - (245) - - - (245)
Share-based payments 109 - 109 4 - 4 113
Tesco Bank fair value movements included in operating profit
- - - 156 - 156 156
Cash flows generated from operations excluding working capital
2,466 (178) 2,288 453 (24) 429 2,717
(Increase)/decrease in working capital 499 (14) 485 110 (3) 107 592
Cash generated from/(used in) operations* 2,965 (192) 2,773 563 (27) 536 3,309
Interest paid (347) - (347) (4) - (4) (351)
Corporation tax (paid)/received (131) - (131) (45) - (45) (176)
Net cash generated from/(used in) operating activities
2,487 (192) 2,295 514 (27) 487 2,782
* APM: ‘Retail operating cash flow’ of £2,773m (2017: £2,279m) is the cash generated from operations of the continuing Retail business. Included in Retail cash generated from/(used in) operations of £2,773m (2017: £2,278m) is £nil (2017: £(1)m) relating to discontinued operations.
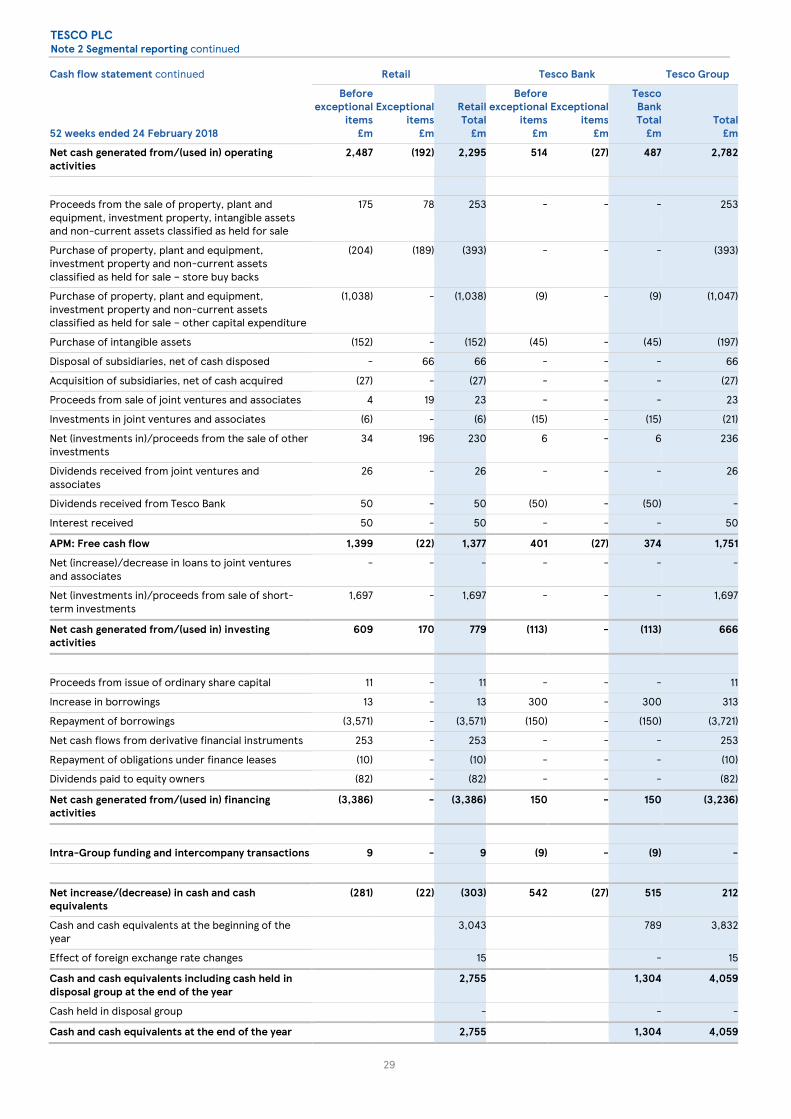
TESCO PLC
29
Note 2 Segmental reporting continued
Cash flow statement continued Retail Tesco Bank Tesco Group
52 weeks ended 24 February 2018
Before exceptional
items £m
Exceptional items
£m
Retail Total
£m
Before exceptional
items £m
Exceptional items
£m
Tesco Bank Total
£m Total
£m
Net cash generated from/(used in) operating activities
2,487 (192) 2,295 514 (27) 487 2,782
Proceeds from the sale of property, plant and equipment, investment property, intangible assets and non-current assets classified as held for sale
175 78 253 - - - 253
Purchase of property, plant and equipment, investment property and non-current assets classified as held for sale – store buy backs
(204) (189) (393) - - - (393)
Purchase of property, plant and equipment, investment property and non-current assets classified as held for sale – other capital expenditure
(1,038) - (1,038) (9) - (9) (1,047)
Purchase of intangible assets (152) - (152) (45) - (45) (197)
Disposal of subsidiaries, net of cash disposed - 66 66 - - - 66
Acquisition of subsidiaries, net of cash acquired (27) - (27) - - - (27)
Proceeds from sale of joint ventures and associates 4 19 23 - - - 23
Investments in joint ventures and associates (6) - (6) (15) - (15) (21)
Net (investments in)/proceeds from the sale of other investments
34 196 230 6 - 6 236
Dividends received from joint ventures and associates
26 - 26 - - - 26
Dividends received from Tesco Bank 50 - 50 (50) - (50) -
Interest received 50 - 50 - - - 50
APM: Free cash flow 1,399 (22) 1,377 401 (27) 374 1,751
Net (increase)/decrease in loans to joint ventures and associates
- - - - - - -
Net (investments in)/proceeds from sale of short-term investments
1,697 - 1,697 - - - 1,697
Net cash generated from/(used in) investing activities
609 170 779 (113) - (113) 666
Proceeds from issue of ordinary share capital 11 - 11 - - - 11
Increase in borrowings 13 - 13 300 - 300 313
Repayment of borrowings (3,571) - (3,571) (150) - (150) (3,721)
Net cash flows from derivative financial instruments 253 - 253 - - - 253
Repayment of obligations under finance leases (10) - (10) - - - (10)
Dividends paid to equity owners (82) - (82) - - - (82)
Net cash generated from/(used in) financing activities
(3,386) - (3,386) 150 - 150 (3,236)
Intra-Group funding and intercompany transactions 9 - 9 (9) - (9) -
Net increase/(decrease) in cash and cash equivalents
(281) (22) (303) 542 (27) 515 212
Cash and cash equivalents at the beginning of the year
3,043 789 3,832
Effect of foreign exchange rate changes 15 - 15
Cash and cash equivalents including cash held in disposal group at the end of the year
2,755 1,304 4,059
Cash held in disposal group - - -
Cash and cash equivalents at the end of the year 2,755 1,304 4,059

TESCO PLC
30
Note 2 Segmental reporting continued
Cash flow statement continued Retail Tesco Bank Tesco Group
52 weeks ended 25 February 2017
Before exceptional
items £m
Exceptional items
£m
Retail Total
£m
Before exceptional
items £m
Exceptional items
£m
Tesco Bank Total
£m Total
£m Operating profit/(loss) of continuing operations 1,123 (183) 940
157 (80) 77 1,017
Operating profit/(loss) of discontinued operations (15) (102) (117) - - - (117)
Depreciation and amortisation 1,172 14 1,186 95 23 118 1,304
ATM net income (43) - (43) 43 - 43 -
(Profit)/loss arising on sale of property, plant and equipment and intangible assets
54 (134) (80) 2 - 2 (78)
(Profit)/loss arising on sale of subsidiaries and other investments
7 - 7 (4) - (4) 3
(Profit)/loss arising on sale of joint ventures and associates
(5) - (5) - - - (5)
Impairment loss on goodwill - 46 46 - - - 46
Net impairment loss/(reversal) on other investments
(12) - (12) - - - (12)
Net impairment loss/(reversal) on property, plant and equipment, software and other intangible assets and investment property
(10) 5 (5) - - - (5)
Adjustment for non-cash element of pension charge
7 - 7 - - - 7
Additional contribution into pension schemes (248) - (248) - - - (248)
Share-based payments 14 - 14 1 - 1 15
Tesco Bank fair value movements included in operating profit
- - - 96 2 98 98
Cash flows generated from operations excluding working capital
2,044 (354) 1,690 390 (55) 335 2,025
Decrease/(increase) in working capital 379 209 588 (77) 22 (55) 533
Cash flows generated from/(used in) operations* 2,423 (145) 2,278 313 (33) 280 2,558
Interest paid (518) - (518) (4) - (4) (522)
Corporation tax (paid)/received (64) - (64) 17 - 17 (47)
Net cash generated from/(used in) operating activities
1,841 (145) 1,696 326 (33) 293 1,989
* Refer to previous table for footnotes

TESCO PLC
31
Note 2 Segmental reporting continued
Cash flow statement continued Retail Tesco Bank Tesco Group
52 weeks ended 25 February 2017 Before exceptional
items £m
Exceptional items
£m
Retail Total
£m
Before exceptional
items £m
Exceptional items
£m
Tesco Bank Total
£m Total
£m
Net cash generated from/(used in) operating activities
1,841 (145) 1,696 326 (33) 293 1,989
Proceeds from sale of property, plant and equipment, investment property, intangible assets and non-current assets classified as held for sale
19 490 509 3 - 3 512
Purchase of property, plant and equipment, investment property and non-current assets classified as held for sale – store buy backs
(365) - (365) - - - (365)
Purchase of property, plant and equipment, investment property and non-current assets classified as held for sale – other capital expenditure
(834) - (834) (6) - (6) (840)
Purchase of intangible assets (129) - (129) (40) - (40) (169)
Disposal of subsidiaries, net of cash disposed 205 - 205 - - - 205
Acquisition of subsidiaries, net of cash acquired (25) - (25) - - - (25)
Proceeds from sale of joint ventures and associates - - - - - - -
Investments in joint ventures and associates - - - - - - -
Net (investments in)/proceeds from sale of other investments
111 - 111 30 - 30 141
Dividends received from joint ventures and associates
28 - 28 - - - 28
Dividends received from Tesco Bank 50 - 50 (50) - (50) -
Interest received 41 - 41 - - - 41
APM: Free cash flow 942 345 1,287 263 (33) 230 1,517
Net (increase)/decrease in loans to joint ventures and associates
15 - 15 - - - 15
Net (investments in)/proceeds from sale of short-term investments
736 - 736 - - - 736
Net cash generated from/(used in) investing activities
(148) 490 342 (63) - (63) 279
Proceeds from issue of ordinary share capital 1 - 1 - - - 1
Increase in borrowings 185 - 185 - - - 185
Repayment of borrowings (2,036) - (2,036) - - - (2,036)
Net cash flows from derivative financial instruments 475 - 475 - - - 475
Repayment of obligations under finance leases (12) - (12) - - - (12)
Dividends paid to equity owners - - - - - - -
Net cash generated from/(used in) financing activities
(1,387) - (1,387) - - - (1,387)
Intra-Group funding and intercompany transactions (5) - (5) 5 - 5 -
Net increase/(decrease) in cash and cash equivalents
301 345 646 268 (33) 235 881
Cash and cash equivalents at the beginning of the year
2,528 554 3,082
Effect of foreign exchange rate changes (131) - (131)
Cash and cash equivalents including cash held in disposal group at the end of the year
3,043 789 3,832
Cash held in disposal group (11) - (11)
Cash and cash equivalents at the end of the year 3,032 789 3,821

TESCO PLC
32
Note 3 Income and expenses
Continuing operations
52 weeks 2018
£m
52 weeks 2017
£m
Profit/(loss) before tax is stated after charging/(crediting) the following:
Property rental income, of which £(34)m (2017: £(38)m) relates to investment properties (372) (358)
Other rental income (55) (50)
Direct operating expenses arising on rental earning investment properties 17 20
Costs of inventories recognised as an expense 42,297 41,140
Inventory losses and provisions 1,373 1,337
Depreciation and amortisation 1,295 1,298
Operating lease expenses, of which £70m (2017: £84m) relates to hire of plant and machinery 1,018 1,043
Net impairment loss/(reversal) on property, plant and equipment and investment property (191) (113)
Net impairment loss/(reversal) of goodwill, software and other intangible assets 24 53
Note 4 Exceptional items
Income statement
52 weeks ended 24 February 2018 Profit/(loss) for the year included the following exceptional items:
Exceptional items included in:
Cost of sales
£m
Admin-istrative
expenses £m
Property- related
items £m
Total exceptional items included
within operating profit
£m
Share of JV and associates
profits/(losses) £m
Finance costs
£m Taxation
£m
Exceptional items within
discontinued operations
£m Net restructuring and redundancy costs(a)
(75) (34) 7 (102) - - 19 -
Net impairment reversal of non-current assets and onerous lease provisions(b)
50 - 3 53 - - 28 -
Provision for customer redress(c) (24) - - (24) - - (3) -
Investment disposal(d) - 124 - 124 - - (25) - Disposal of opticians business(e) - 38 - 38 - - (7) - Release of amounts provided in relation to DPA and FCA obligations(f)
- 25 - 25 - - - -
Property transactions(g) - - 79 79 - - (32) - Foreign exchange losses on GBP short-term investments held in overseas entities(h)
- - - - - (38) - -
Exceptional items relating to discontinued operations(i)
- - - - - - - 216
Total (49) 153 89 193 - (38) (20) 216
(a) This includes £(68)m relating to UK & ROI changes to store and call centre colleague structures and working practices and £(34)m relating to head office restructuring costs.(b) Net impairment reversal of non-current assets includes a net reversal of £185m in property, plant and equipment and investment property, a net charge of £(24)m charge in goodwill,
software and other intangible assets and a net charge of £(108)m of onerous lease provisions. Refer to Notes 10, 11 and 16 for further details on impairment and onerous lease provisions.(c) The net charge of £(24)m reflects an additional charge of £(35)m relating to an update to the Payment Protection Insurance (PPI) provision ruling during the year which resulted in the
inclusion of items that had previously been out of scope for redress. This was partially offset by a £1m release of the Consumer Credit Act (CCA) provision and a £10m credit received following the conclusion of negotiations with a third party in respect of previously recognised customer redress.
(d) The Group disposed of its remaining 8.8% investment stake in Lazada Group S.A. (Lazada) for net cash consideration of $254m (£196m), generating a profit of £124m. The tax charge of£25m arises due to a capital gain on the disposal.
(e) £38m relates to the gain from disposal of the Group's opticians business to Vision Express (UK) Ltd in UK & ROI. (f) The Group had taken a total exceptional charge of £(235)m in respect of the Deferred Prosecution Agreement (DPA) and Financial Conduct Authority (FCA) obligations, including £(85)m
for the compensation scheme in the 52 weeks to 25 February 2017. With the compensation scheme now being closed to new claimants, £25m relating to the compensation scheme was released in the 52 weeks to 24 February 2018.
(g) As part of the Group's strategy to maximise value from property, the Group disposed of surplus properties which generated a profit of £58m. The Group also recognised a net gain of £21m from the unwind of its joint venture with British Land, whereby the Group purchased seven stores from the joint venture and disposed of its remaining equity interest in the joint venture.
(h) The Group was holding proceeds from the sale of the Korea operations in GBP money market funds in an intermediate entity with a Euro functional currency. £(38)m loss represents theforeign exchange losses arising on the revaluation of these sterling-denominated funds into Euros until the repatriation of funds during the 52 weeks to 24 February 2018. The loss does not represent an economic loss to the Group since there is an offset within other comprehensive income.
(i) Income from discontinued operations primarily relates to the release of a £340m provision relating to capital gains tax in respect of the disposal of the Group's Korean operations, following completion of the tax assessment by Korean Tax Authorities. The Group also recognised a £6m gain from the revaluation of the potential capital gains tax liability in the discontinued operations in China. These gains were partially offset by a £(128)m net loss relating to the disposal of the Group's Turkish operations and a £(2)m loss relating to costs associated with the disposal of the Korean business.

TESCO PLC
33
Note 4 Exceptional items continued
Income statement continued
52 weeks ended 25 February 2017 Profit/(loss) for the year included the following exceptional items:
Exceptional items included in:
Cost of sales
£m
Admin-istrative
expenses £m
Property- related
items £m
Total exceptional items included
within operating profit
£m
Share of JV and associates
profits/ (losses)
£m
Finance costs
£m Taxation
£m
Exceptional items within
discontinued operations
£m Net restructuring and redundancy costs
(153) (26) (20) (199) - - 39 -
Net impairment (loss)/reversal of non-current assets and onerous lease provisions
25 - (31) (6) (54) - 20 -
Provision for customer redress (45) - - (45) - - - -
Interchange settlement 57 - - 57 - - (11) -
Amounts provided in relation to DPA and FCA obligations
- (235) - (235) - - - -
Property transactions - - 165 165 - - 50 -
Insurance reserve adjustment - - - - (23) - - - Foreign exchange losses on GBP short term investments held in overseas entities
- - - - - (244) - -
Exceptional items relating to discontinued operations
- - - - - - - (75)
Total (116) (261) 114 (263) (77) (244) 98 (75)
Cash flow statement
The table below shows the impact of exceptional items on the Group cash flow statement:
Cash flows from operating activities
Cash flows from investing activities
52 weeks 2018
£m
52 weeks 2017
£m
52 weeks 2018
£m
52 weeks 2017
£m Prior year restructuring costs and other exceptional costs including trading store redundancies(a)
(56) (54) - -
Current year restructuring costs and other exceptional costs including trading store redundancies(a)
(67) (78) - -
Utilisation of onerous lease provisions (93) (113) - - Property transactions(b) 9 36 (111) 490 Property transactions - sale of investment in joint venture - - 19 - Provision for customer redress(c) (23) (28) - - Legal settlement - 57 - - DPA/compensation scheme payments (149) - - - VAT refund – HMRC court case(d) 160 - - - Proceeds from sale of investments – Lazada - - 196 - Proceeds from sale of opticians business - - 45 - Proceeds from sale of subsidiaries treated as discontinued(e) - - 26 - Exceptional cash flows from discontinued operations - 2 (5) - Total (219) (178) 170 490
(a) Cash outflows on settlement of restructuring and redundancy costs.(b) Property transactions is made up of £78m proceeds from disposal of properties and £(180)m from property buy backs from the BLT Properties Limited joint
venture, comprising £189m paid for the properties acquired and £9m relating to working capital and cash acquired. Refer to footnote (g) on the previous page.(c) Settlement of claims for customer redress in Tesco Bank.(d) VAT recovered in relation to the appeal against HMRC regarding the treatment of VAT on Clubcard rewards. Refer to Note 16 for further details.(e) This relates to the disposal of the Group's Turkish operations comprising £37m proceeds received and £11m cash disposed. Refer to Note 7 for further details.

TESCO PLC
34
Note 5 Finance income and costs
Continuing operations Notes
52 weeks 2018
£m
52 weeks 2017
£m
Finance income
Interest receivable and similar income 75 48
Financial instruments – fair value remeasurements 23 61
Total finance income 98 109
Finance costs
GBP MTNs and Loans (207) (227)
EUR MTNs (84) (114)
USD Bonds (72) (93)
Finance charges payable under finance leases and hire purchase contracts (8) (8)
Other interest payable (62) (81)
Capitalised interest 11 2 6
Total finance costs before exceptional items and net pension finance costs (431) (517)
Net pension finance costs 17 (162) (113)
Foreign exchange losses on GBP short-term investments held in overseas entities 4 (38) (244)
Total finance costs (631) (874)
Net finance cost (533) (765)
Note 6 Taxation
Recognised in the Group income statement
Continuing operations
52 weeks 2018
£m
52 weeks 2017
£m
Current tax (credit)/charge
UK corporation tax 143 70
Overseas tax 118 111
Adjustments in respect of prior years (29) 19
232 200
Deferred tax (credit)/charge
Origination and reversal of temporary differences 25 (43)
Adjustments in respect of prior years* 49 (36)
Change in tax rate - (34)
74 (113)
Total income tax (credit)/charge 306 87
* Adjustments in respect of prior years include a tax charge of £25m in relation to an adjustment to capital losses on property disposals classified as exceptional.
The Finance Act 2016 included legislation to reduce the main rate of UK corporation tax from 20% to 19% from 1 April 2017 and to 17% from 1 April 2020. These rate reductions were substantively enacted by the balance sheet date and therefore included in these consolidated financial statements. Temporary differences have been remeasured using the enacted tax rates that are expected to apply when the liability is settled or the asset realised.
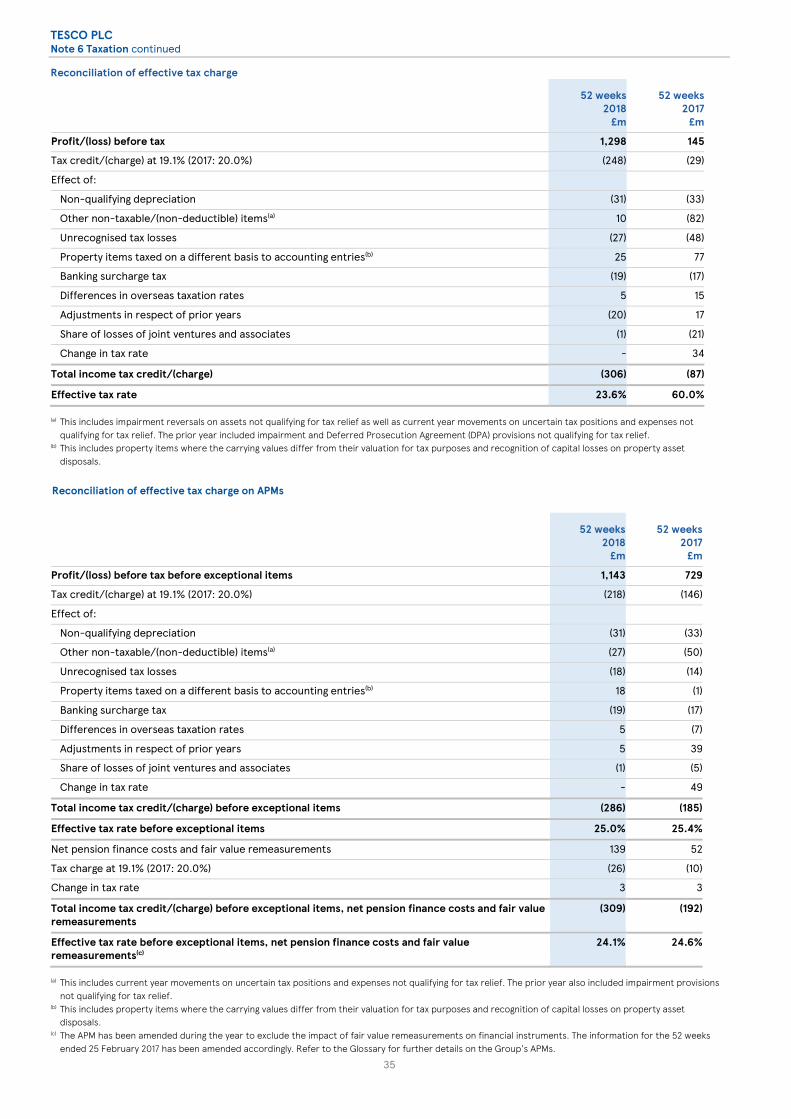
TESCO PLC
35
Note 6 Taxation continued
Reconciliation of effective tax charge
52 weeks 2018
£m
52 weeks 2017
£m
Profit/(loss) before tax 1,298 145
Tax credit/(charge) at 19.1% (2017: 20.0%) (248) (29)
Effect of:
Non-qualifying depreciation (31) (33)
Other non-taxable/(non-deductible) items(a) 10 (82)
Unrecognised tax losses (27) (48)
Property items taxed on a different basis to accounting entries(b) 25 77
Banking surcharge tax (19) (17)
Differences in overseas taxation rates 5 15
Adjustments in respect of prior years (20) 17
Share of losses of joint ventures and associates (1) (21)
Change in tax rate - 34
Total income tax credit/(charge) (306) (87)
Effective tax rate 23.6% 60.0%
(a) This includes impairment reversals on assets not qualifying for tax relief as well as current year movements on uncertain tax positions and expenses not qualifying for tax relief. The prior year included impairment and Deferred Prosecution Agreement (DPA) provisions not qualifying for tax relief.
(b) This includes property items where the carrying values differ from their valuation for tax purposes and recognition of capital losses on property asset disposals.
Reconciliation of effective tax charge on APMs
52 weeks 2018
£m
52 weeks 2017
£m
Profit/(loss) before tax before exceptional items 1,143 729
Tax credit/(charge) at 19.1% (2017: 20.0%) (218) (146)
Effect of:
Non-qualifying depreciation (31) (33)
Other non-taxable/(non-deductible) items(a) (27) (50)
Unrecognised tax losses (18) (14)
Property items taxed on a different basis to accounting entries(b) 18 (1)
Banking surcharge tax (19) (17)
Differences in overseas taxation rates 5 (7)
Adjustments in respect of prior years 5 39
Share of losses of joint ventures and associates (1) (5)
Change in tax rate - 49
Total income tax credit/(charge) before exceptional items (286) (185)
Effective tax rate before exceptional items 25.0% 25.4%
Net pension finance costs and fair value remeasurements 139 52
Tax charge at 19.1% (2017: 20.0%) (26) (10)
Change in tax rate 3 3
Total income tax credit/(charge) before exceptional items, net pension finance costs and fair value remeasurements
(309) (192)
Effective tax rate before exceptional items, net pension finance costs and fair value remeasurements(c)
24.1% 24.6%
(a) This includes current year movements on uncertain tax positions and expenses not qualifying for tax relief. The prior year also included impairment provisionsnot qualifying for tax relief.
(b) This includes property items where the carrying values differ from their valuation for tax purposes and recognition of capital losses on property asset disposals.
(c) The APM has been amended during the year to exclude the impact of fair value remeasurements on financial instruments. The information for the 52 weeksended 25 February 2017 has been amended accordingly. Refer to the Glossary for further details on the Group’s APMs.

TESCO PLC
36
Note 7 Discontinued operations and non-current assets classified as held for sale
Assets and liabilities of the disposal group and non-current assets classified as held for sale
24 February 2018
£m
25 February 2017
£m
Assets of the disposal group - 198
Non-current assets classified as held for sale 149 146
Total assets of the disposal group and non-current assets classified as held for sale 149 344
Total liabilities of the disposal group - (171)
Total net assets of the disposal group and non-current assets classified as held for sale 149 173
The non-current assets classified as held for sale consist mainly of properties in the UK and Central Europe due to be sold within one year.
Discontinued operations On 10 June 2016, the Group announced the proposed sale of its 95.5% controlling interest in Tesco Kipa Kitle Pazarlama Ticaret Lojistik ve Gıda Sanayi A.Ş. (referred to as Turkish operations or Turkey) to Migros Ticaret A.Ş. (Migros). Local regulatory approval was granted on 9 February 2017 and the sale completed on 1 March 2017. In accordance with IFRS 5 ‘Non-current Assets Held for Sale and Discontinued Operations’, the Turkish operations for the period up to 1 March 2017 have been classified as a disposal group.
The tables below show the results of the discontinued operations which are included in the Group income statement and Group cash flow statement respectively.
Income statement 52 weeks(a)
2018 £m
52 weeks 2017
£m
Revenue - 543
Expenses(b) - (580)
Profit/(loss) before tax before exceptional items - (37)
Taxation - -
Profit/(loss) after tax before exceptional items - (37)
Net impairment (loss)/reversal of non-current assets - (99)
Costs to sell and other provisions - Turkey - (3)
Loss after tax on disposal of Turkish operations (128) -
Net adjustments to profit/(loss) of past disposals(c) 344 27
Total profit/(loss) after tax of discontinued operations(d) 216 (112)
(a) These figures represent the income statement of Turkey for the current year and the net adjustments to profit/(loss) of past disposals of £344m. Refer to Note 4 for further details.
(b) Intercompany recharges totalling £nil (2017: £2m) between continuing operations and the Turkey discontinued operation have been eliminated.(c) At 25 February 2017, the Group held a provision of £329m for potential additional capital gains tax relating to the disposal of the Group’s Korean operations.
During the year, the final tax assessment was received from the Korean Tax Authorities, confirming that no further capital gains tax is payable. As a result, the provision of £340m, after the impact of foreign exchange movements, has been released. The Group also recognised a £6m gain from the revaluation of the potential capital gains tax liability in the discontinued operations in China and a £(2)m loss relating to costs associated with the disposal of the Korean business. These amounts have been classified as exceptional items within ‘Exceptional items relating to discontinued operations’.
(d) Total profit/(loss) after tax of discontinued operations includes a loss of £nil attributable to non-controlling interests (2017: £(6)m).

TESCO PLC
37
Note 7 Discontinued operations and non-current assets classified as held for sale continued
The loss after tax on disposal of the Group’s Turkish operations is made up as follows: £m
Gross proceeds 37
Deferred and contingent consideration 2
Net proceeds 39
Net book value of assets disposed:
Goodwill, software and other intangible assets (9)
Property, plant and equipment (121)
Inventories (43)
Trade and other receivables (14)
Cash and cash equivalents (11)
Trade and other payables 88
Borrowings 76
Provisions 2
Post-employment benefit obligation 5
Currency translation reserve recycled to the Group income statement (140)
Taxation -
Loss after tax of disposal of Turkish operations (128)
Earnings/(losses) per share impact from discontinued operations 52 weeks 2018
Pence/share
52 weeks 2017
Pence/share
Basic 2.65 (1.30)
Diluted 2.64 (1.30)
Cash flow statement 52 weeks
2018 £m
52 weeks 2017
£m Net cash flows from operating activities - (20)
Net cash flows from investing activities - 13
Net cash flows from financing activities - 21
Net cash flows from discontinued operations - 14
Intra-Group funding and intercompany transactions - (2)
Net cash flows from discontinued operations, net of intercompany - 12
Net cash flows from disposal of subsidiary (11) -
Net cash flows from discontinued operations, net of intercompany and disposal of subsidiary (11) 12
Note 8 Dividends
2018 2017 Pence/share £m Pence/share £m
Amounts recognised as distributions to owners in the financial year:
Current financial year interim dividend 1.00 82 - -
Dividends paid to equity owners in the financial year 1.00 82 - -
Current financial year proposed final dividend 2.00 195 - -
The proposed final dividend was approved by the Board of Directors on 10 April 2018 and is subject to the approval of shareholders at the Annual General Meeting. The proposed dividend has not been included as a liability as at 24 February 2018, in accordance with IAS 10 ‘Events after the reporting period’. It will be paid on 22 June 2018 to shareholders who are on the Register of members at close of business on 18 May 2018.
The Group has implemented a share forfeiture programme following the completion of a tracing and notification exercise to any shareholders who have not had contact with Tesco PLC (the Company) over the past 12 years, in accordance with the provisions set out in the Company’s Articles. £2m of unclaimed dividends in relation to these shares have been adjusted for in retained earnings.

TESCO PLC
38
Note 9 Earnings/(losses) per share and diluted earnings/(losses) per share
Basic earnings/(losses) per share amounts are calculated by dividing the profit/(loss) attributable to owners of the parent by the weighted average number of ordinary shares in issue during the financial year.
Diluted earnings/(losses) per share amounts are calculated by dividing the profit/(loss) attributable to owners of the parent by the weighted average number of ordinary shares in issue during the financial year adjusted for the effects of potentially dilutive share options. The dilutive effect is calculated on the full exercise of all potentially dilutive ordinary share options granted by the Group, including performance-based options which the Group considers to have been earned.
For the 52 weeks ended 24 February 2018 there were 27 million (2017: 20 million) potentially dilutive share options. As the Group has recognised a profit for the year from its continuing operations dilutive effects have been considered in calculating diluted earnings per share.
2018 2017
Basic
Potentially dilutive
share options Diluted Basic
Potentially dilutive
share options Diluted
Profit/(loss) (£m)
Continuing operations(a) 990 - 990 66 - 66
Discontinued operations(b) 216 - 216 (106) - (106)
Total 1,206 - 1,206 (40) - (40)
Weighted average number of shares (millions) 8,165 27 8,192 8,148 20 8,168
Earnings/(losses) per share (pence)
Continuing operations 12.12 (0.04) 12.08 0.81 - 0.81
Discontinued operations 2.65 (0.01) 2.64 (1.30) - (1.30)
Total 14.77 (0.05) 14.72 (0.49) - (0.49)
(a) Excludes profits/(losses) from non-controlling interests of £2m (2017: £(8)m).(b) Excludes profits/(losses) from non-controlling interests of £nil (2017: £(6)m).
APM: Earnings/(losses) per share from continuing operations before exceptional items, net pension finance costs and fair value remeasurements on financial instruments
Notes 52 weeks
2018 52 weeks
2017
Profit before tax from continuing operations before exceptional items (£m) 1,143 729
Add: Net pension finance costs (£m) 5 162 113
Less: Fair value remeasurements on financial instruments (£m) 5 (23) (61)
Profit before tax from continuing operations before exceptional items, net pension finance costs and fair value measurements (£m)
1,282 781
Profit before tax from continuing operations before exceptional items, net pension finance costs and fair value remeasurements attributable to the owners of the parent (£m)
1,282 784
Taxation on profit from continuing operations before exceptional items, net pension finance costs and fair value remeasurements attributable to the owners of the parent (£m)
(309) (188)
Profit after tax from continuing operations before exceptional items, net pension finance costs and fair value remeasurements attributable to the owners of the parent (£m)
973 596
Basic weighted average number of shares (millions) 8,165 8,148
Basic earnings per share from continuing operations before exceptional items, net pension finance costs and fair value remeasurements (pence)
11.92 7.31
Diluted weighted average number of shares (millions) 8,192 8,168
Diluted earnings per share from continuing operations before exceptional items, net pension finance costs and fair value remeasurements (pence)
11.88 7.30
Diluted earnings per share from continuing operations before exceptional items, net pension costs and fair value remeasurements on financial instruments is a new APM. Refer to page 55 for further details on the Group’s APMs.
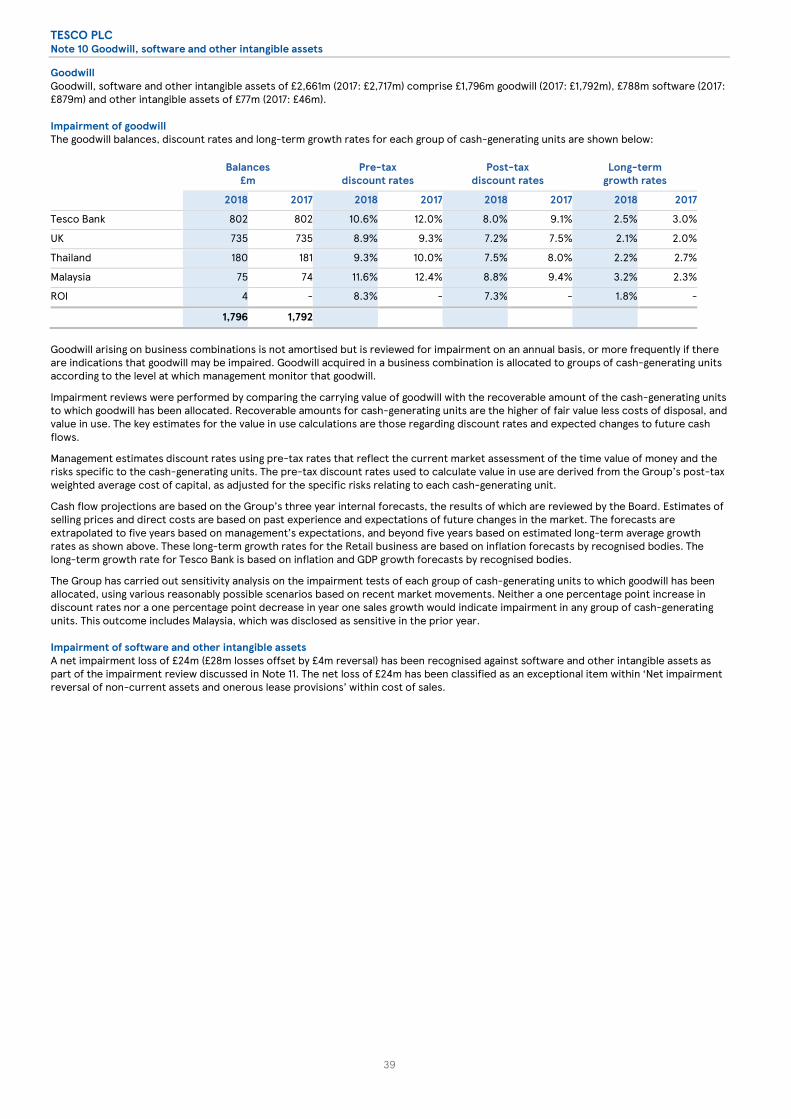
TESCO PLC
39
Note 10 Goodwill, software and other intangible assets
Goodwill Goodwill, software and other intangible assets of £2,661m (2017: £2,717m) comprise £1,796m goodwill (2017: £1,792m), £788m software (2017: £879m) and other intangible assets of £77m (2017: £46m).
Impairment of goodwill The goodwill balances, discount rates and long-term growth rates for each group of cash-generating units are shown below:
Balances £m
Pre-tax discount rates
Post-tax discount rates
Long-term growth rates
2018 2017 2018 2017 2018 2017 2018 2017
Tesco Bank 802 802 10.6% 12.0% 8.0% 9.1% 2.5% 3.0%
UK 735 735 8.9% 9.3% 7.2% 7.5% 2.1% 2.0%
Thailand 180 181 9.3% 10.0% 7.5% 8.0% 2.2% 2.7%
Malaysia 75 74 11.6% 12.4% 8.8% 9.4% 3.2% 2.3%
ROI 4 - 8.3% - 7.3% - 1.8% -
1,796 1,792
Goodwill arising on business combinations is not amortised but is reviewed for impairment on an annual basis, or more frequently if there are indications that goodwill may be impaired. Goodwill acquired in a business combination is allocated to groups of cash-generating units according to the level at which management monitor that goodwill.
Impairment reviews were performed by comparing the carrying value of goodwill with the recoverable amount of the cash-generating units to which goodwill has been allocated. Recoverable amounts for cash-generating units are the higher of fair value less costs of disposal, and value in use. The key estimates for the value in use calculations are those regarding discount rates and expected changes to future cash flows.
Management estimates discount rates using pre-tax rates that reflect the current market assessment of the time value of money and the risks specific to the cash-generating units. The pre-tax discount rates used to calculate value in use are derived from the Group’s post-tax weighted average cost of capital, as adjusted for the specific risks relating to each cash-generating unit.
Cash flow projections are based on the Group’s three year internal forecasts, the results of which are reviewed by the Board. Estimates of selling prices and direct costs are based on past experience and expectations of future changes in the market. The forecasts are extrapolated to five years based on management’s expectations, and beyond five years based on estimated long-term average growth rates as shown above. These long-term growth rates for the Retail business are based on inflation forecasts by recognised bodies. The long-term growth rate for Tesco Bank is based on inflation and GDP growth forecasts by recognised bodies.
The Group has carried out sensitivity analysis on the impairment tests of each group of cash-generating units to which goodwill has been allocated, using various reasonably possible scenarios based on recent market movements. Neither a one percentage point increase in discount rates nor a one percentage point decrease in year one sales growth would indicate impairment in any group of cash-generating units. This outcome includes Malaysia, which was disclosed as sensitive in the prior year.
Impairment of software and other intangible assets A net impairment loss of £24m (£28m losses offset by £4m reversal) has been recognised against software and other intangible assets as part of the impairment review discussed in Note 11. The net loss of £24m has been classified as an exceptional item within ‘Net impairment reversal of non-current assets and onerous lease provisions’ within cost of sales.

TESCO PLC
40
Note 11 Property, plant and equipment
Land and buildings
£m Other(a)
£m Total
£m
Cost
At 25 February 2017 22,690 10,681 33,371
Foreign currency translation 312 116 428
Additions(b)(c) 819 481 1,300
Reclassification (83) (49) (132)
Classified as held for sale (146) (21) (167)
Disposals (139) (299) (438)
At 24 February 2018 23,453 10,909 34,362
Accumulated depreciation and impairment losses
At 25 February 2017 7,095 8,168 15,263
Foreign currency translation 121 97 218
Charge for the year 470 605 1,075
Impairment losses 44 44 88
Reversal of impairment losses (268) (7) (275)
Reclassification(d) (147) 100 (47)
Classified as held for sale (92) (11) (103)
Disposals (107) (271) (378)
At 24 February 2018 7,116 8,725 15,841
Net carrying value(e)
At 24 February 2018 16,337 2,184 18,521
At 25 February 2017 15,595 2,513 18,108
Construction in progress included above(f)
At 24 February 2018 68 57 125
At 25 February 2017 57 66 123
(a) Other assets consist of fixtures and fittings with a net carrying value of £1,752m (2017: £2,023m), office equipment with a net carrying value of £116m (2017: £161m) and motor vehicles with a net carrying value of £316m (2017: £329m).
(b) Includes £2m (2017: £6m) in respect of interest capitalised, principally relating to land and buildings. The capitalisation rate used to determine the amount of finance costs capitalised during the financial year was 4.5% (2017: 4.9%). Interest capitalised is deducted in determining taxable profit in the financial year in which it is incurred.
(c) Includes £189m net payment relating to the purchase of seven stores from a joint venture with British Land, which is a related party transaction. Refer to Note 4 for further details of the unwind of the joint venture with British Land.
(d) Reclassification includes amounts related to impairment losses and reversals booked in the year, comprising a £(199)m reduction to the net impairment reversal in Land and Buildings and a £164m reduction to the net impairment losses in Other assets. The offsetting £35m has been reclassified to Software andOther intangible assets.
(e) Includes £786m (2017: £788m) of assets pledged as security for secured bonds (Note 15) and £509m (2017: £411m) of property held as security in favour of the Tesco PLC Pension Scheme.
(f) Construction in progress does not include land.
Assets held under finance leases Net carrying value includes assets held under finance leases, which are analysed below. These assets are pledged as security for the finance lease liabilities.
2018 2017
Land and buildings
£m Other
£m
Land and buildings
£m Other
£m Net carrying value 75 32 66 27
Land and buildings The net carrying value of land and buildings comprises:
2018 £m
2017 £m
Freehold 13,779 13,175 Long leasehold – 50 years or more 412 404 Short leasehold – less than 50 years 2,146 2,016 Net carrying value 16,337 15,595

TESCO PLC
41
Note 11 Property, plant and equipment continued
Land and buildings
£m Other(a)
£m Total
£m
Cost
At 27 February 2016 22,557 10,468 33,025
Foreign currency translation 727 327 1,054
Additions(b) 816 579 1,395
Reclassification (103) 58 (45)
Classified as held for sale (316) (6) (322)
Disposals (674) (594) (1,268)
Transfer to disposal group classified as held for sale (317) (151) (468)
At 25 February 2017 22,690 10,681 33,371
Accumulated depreciation and impairment losses
At 27 February 2016 7,198 7,927 15,125
Foreign currency translation 258 239 497
Charge for the year 419 639 1,058
Impairment losses 246 27 273
Reversal of impairment losses (246) (33) (279)
Reclassification (58) 11 (47)
Classified as held for sale (137) (1) (138)
Disposals (353) (539) (892)
Transfer to disposal group classified as held for sale (232) (102) (334)
At 25 February 2017 7,095 8,168 15,263
(a)-(b) Refer to previous page for footnotes
Commitments for capital expenditure contracted for, but not incurred, at 24 February 2018 were £116m (2017: £115m), principally relating to store development.
Impairment of property, plant and equipment The Group has determined that for the purposes of impairment testing each store is a cash-generating unit. Cash-generating units are tested for impairment if there are indicators of impairment at the balance sheet date. Recoverable amounts for cash-generating units are the higher of fair value less costs of disposal, and value in use.
The key estimates for the value in use calculations are those regarding discount rates and expected changes to future cash flows.
Management estimates discount rates using pre-tax rates that reflect the current market assessment of the time value of money and the risks specific to the cash-generating units. The discount rates are derived from the Group’s post-tax weighted average cost of capital, as adjusted for the specific risks relating to each geographical region and range from 7% to 12% (2017: 9% to 13%). On a post-tax basis, the discount rates range from 5% to 9% (2017: 7% to 10%).
Cash flow projections are based on the Group’s three year internal forecasts, the results of which are reviewed by the Board. Estimates of selling prices and direct costs are based on past experience and expectations of future changes in the market. The forecasts are extrapolated to five years based on management’s expectations, and beyond five years based on long-term average growth rates, which are derived from inflation forecasts by recognised bodies. These long-term average growth rates range from 1% to 4% (2017: 1% to 3%).
Fair values are determined with regard to the market rent for the stores or for alternative uses with investment yields appropriate to reflect the physical characteristics of the property, location, infrastructure, redevelopment potential and other factors. In some cases, fair values include residual valuations where stores may be viable for redevelopment. The key inputs to the valuation are the potential market rents and yields, both of which are largely based on rentals and yields for similar properties in that location. Fair values for the Group’s properties were determined with the assistance of independent, professional valuers where appropriate.
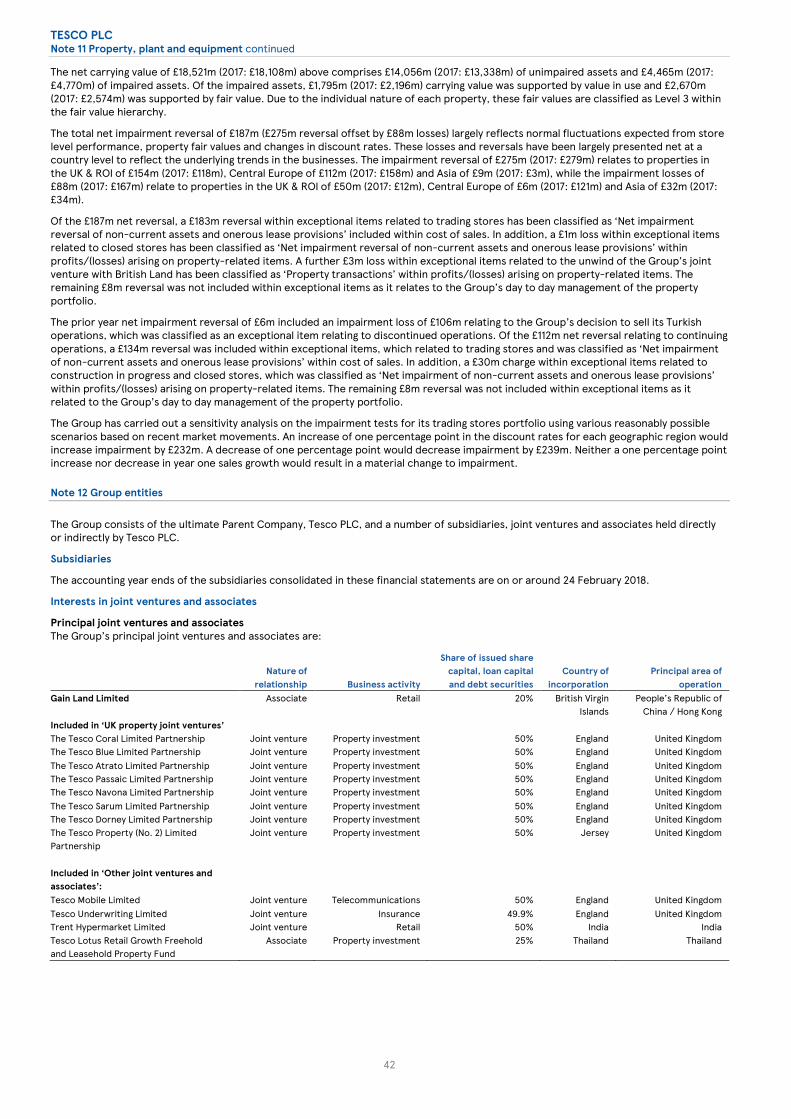
TESCO PLC
42
Note 11 Property, plant and equipment continued
The net carrying value of £18,521m (2017: £18,108m) above comprises £14,056m (2017: £13,338m) of unimpaired assets and £4,465m (2017: £4,770m) of impaired assets. Of the impaired assets, £1,795m (2017: £2,196m) carrying value was supported by value in use and £2,670m (2017: £2,574m) was supported by fair value. Due to the individual nature of each property, these fair values are classified as Level 3 within the fair value hierarchy.
The total net impairment reversal of £187m (£275m reversal offset by £88m losses) largely reflects normal fluctuations expected from store level performance, property fair values and changes in discount rates. These losses and reversals have been largely presented net at a country level to reflect the underlying trends in the businesses. The impairment reversal of £275m (2017: £279m) relates to properties in the UK & ROI of £154m (2017: £118m), Central Europe of £112m (2017: £158m) and Asia of £9m (2017: £3m), while the impairment losses of £88m (2017: £167m) relate to properties in the UK & ROI of £50m (2017: £12m), Central Europe of £6m (2017: £121m) and Asia of £32m (2017: £34m).
Of the £187m net reversal, a £183m reversal within exceptional items related to trading stores has been classified as ‘Net impairment reversal of non-current assets and onerous lease provisions’ included within cost of sales. In addition, a £1m loss within exceptional items related to closed stores has been classified as ‘Net impairment reversal of non-current assets and onerous lease provisions’ within profits/(losses) arising on property-related items. A further £3m loss within exceptional items related to the unwind of the Group’s joint venture with British Land has been classified as ‘Property transactions’ within profits/(losses) arising on property-related items. The remaining £8m reversal was not included within exceptional items as it relates to the Group’s day to day management of the property portfolio.
The prior year net impairment reversal of £6m included an impairment loss of £106m relating to the Group’s decision to sell its Turkish operations, which was classified as an exceptional item relating to discontinued operations. Of the £112m net reversal relating to continuing operations, a £134m reversal was included within exceptional items, which related to trading stores and was classified as ‘Net impairment of non-current assets and onerous lease provisions’ within cost of sales. In addition, a £30m charge within exceptional items related to construction in progress and closed stores, which was classified as ‘Net impairment of non-current assets and onerous lease provisions’ within profits/(losses) arising on property-related items. The remaining £8m reversal was not included within exceptional items as it related to the Group’s day to day management of the property portfolio.
The Group has carried out a sensitivity analysis on the impairment tests for its trading stores portfolio using various reasonably possible scenarios based on recent market movements. An increase of one percentage point in the discount rates for each geographic region would increase impairment by £232m. A decrease of one percentage point would decrease impairment by £239m. Neither a one percentage point increase nor decrease in year one sales growth would result in a material change to impairment.
Note 12 Group entities
The Group consists of the ultimate Parent Company, Tesco PLC, and a number of subsidiaries, joint ventures and associates held directly or indirectly by Tesco PLC.
Subsidiaries
The accounting year ends of the subsidiaries consolidated in these financial statements are on or around 24 February 2018.
Interests in joint ventures and associates
Principal joint ventures and associates The Group’s principal joint ventures and associates are:
Nature of relationship Business activity
Share of issued share capital, loan capital and debt securities
Country of incorporation
Principal area of operation
Gain Land Limited Associate Retail 20% British Virgin Islands
People’s Republic of China / Hong Kong
Included in ‘UK property joint ventures’ The Tesco Coral Limited Partnership Joint venture Property investment 50% England United Kingdom The Tesco Blue Limited Partnership Joint venture Property investment 50% England United Kingdom The Tesco Atrato Limited Partnership Joint venture Property investment 50% England United Kingdom The Tesco Passaic Limited Partnership Joint venture Property investment 50% England United Kingdom The Tesco Navona Limited Partnership Joint venture Property investment 50% England United Kingdom The Tesco Sarum Limited Partnership Joint venture Property investment 50% England United Kingdom The Tesco Dorney Limited Partnership Joint venture Property investment 50% England United Kingdom The Tesco Property (No. 2) Limited Partnership
Joint venture Property investment 50% Jersey United Kingdom
Included in ‘Other joint ventures and associates’: Tesco Mobile Limited Joint venture Telecommunications 50% England United Kingdom Tesco Underwriting Limited Joint venture Insurance 49.9% England United Kingdom Trent Hypermarket Limited Joint venture Retail 50% India India Tesco Lotus Retail Growth Freehold and Leasehold Property Fund
Associate Property investment 25% Thailand Thailand

TESCO PLC
43
Note 12 Group entities continued
The accounting period end dates of the joint ventures and associates consolidated in these financial statements range from 31 December 2017 to 28 February 2018. The accounting period end dates for joint ventures differ from those of the Group for commercial reasons and depend upon the requirements of the joint venture partner as well as those of the Group. The accounting period end dates of the associates are different from those of the Group as they depend upon the requirements of the parent companies of those entities.
There are no significant restrictions on the ability of joint ventures and associates to transfer funds to the parent, other than those imposed by the Companies Act 2006, and for Tesco Underwriting Limited, regulatory capital requirements.
The UK property joint ventures involve the Group partnering with third parties in carrying out some property investments in order to enhance returns from property and access funding, while reducing risks associated with sole ownership. These property investments generally cover shopping centres and standalone stores. The Group enters into operating leases for some or all of the properties held in the joint ventures. These leases provide the Group with some rights over alterations and adjacent land developments. Some leases also provide the Group with options to purchase the other joint venturers’ equity stakes at a future point in time. In some cases the Group has the ability to substitute properties in the joint ventures with alternative properties of similar value, subject to strict eligibility criteria. In other cases, the Group carries out property management activities for third party rentals of shopping centre units.
The property investment activities are carried out in separate entities, usually partnerships or limited liability companies. The Group has assessed its ability to direct the relevant activities of these entities and impact Group returns and concluded that the entities qualify as joint ventures since decisions regarding them require the unanimous consent of both equity holders. This assessment included not only rights within the joint venture agreements, but also any rights within other contractual arrangements between the Group and the entities.
The Group made a number of judgements in arriving at this determination, the key ones being: • since the provisions of the joint venture agreements require the relevant decisions impacting investor returns to be either
unanimously agreed by both joint venturers at the same time, or in some cases to be agreed sequentially by each venturer atdifferent stages, there is joint decision making within the joint venture;
• since the Group’s leases are priced at fair value, and any rights embedded in the leases are consistent with market practice, theydo not provide the Group with additional control over the joint ventures or infer an obligation by the Group to fund thesettlement of liabilities of the joint ventures;
• any options to purchase the other joint venturers’ equity stakes are priced at market value, and only exercisable at future dates,hence they do not provide control to the Group at the current time;
• where the Group has a right to substitute properties in the joint ventures, the rights are strictly limited and are at fair value,hence do not provide control to the Group; and
• where the Group carries out property management activities for third party rentals in shopping centres, these additional activities are controlled through joint venture agreements or lease agreements, and do not provide the Group with additionalpowers over the joint venture.

TESCO PLC
44
Note 12 Group entities continued
Summarised financial information for joint ventures and associates The summarised financial information below reflects the amounts presented in the financial statements of the relevant joint ventures and associates, and not the Group’s share of those amounts. These amounts have been adjusted to conform to the Group’s accounting policies where required. The summarised financial information for UK property joint ventures has been aggregated in order to provide useful information to users without excessive detail since these entities have similar characteristics and risk profiles largely based on their nature of activities and geographic market.
UK property joint ventures Gain Land Limited
2018 £m
2017 £m
12 months to Dec 2017
£m
12 months to Dec 2016
£m Summarised balance sheet Non-current assets(a) 3,851 4,060 3,924 4,172
Current assets (excluding cash and cash equivalents) 92 99 1,801 2,231 Cash and cash equivalents 37 48 414 631 Current liabilities(b) (304) (301) (5,318) (6,232) Non-current liabilities(b) (4,561) (4,831) (409) (169)
Net assets/(liabilities)(c) (885) (925) 412 633
Summarised income statement Revenue 280 292 9,097 9,081
Profit/(loss) after tax - - (230) (626)
Reconciliation to carrying amounts:
Opening balance - – 433 511 Additions/(disposals) - – - - Foreign currency translation - – (21) 47 Share of profits/(losses)(d) 12 14 (46) (125) Dividends received from joint ventures and associates (12) (14) - - Deferred profits offset against carrying amounts(e) - - - -
Closing balance - - 366 433
Group’s share in ownership 50% 50% 20% 20% Group’s share of net assets/(liabilities) (443) (463) 82 127 Goodwill
- - 284 306
Deferred property profits offset against carrying amounts(e) (61) (63) - - Cumulative unrecognised losses(d)(f) 168 175 - - Cumulative unrecognised hedge reserves(d)(f) 336 351 - - Carrying amount - - 366 433
(a) The non-current asset balances of UK property joint ventures are reflected at historic depreciated cost to conform to the Group’s accounting policies. The aggregate fair values in the financial statements of the UK property joint ventures are £4,983m (2017: £5,242m).
(b) The current and non-current liabilities of UK property joint ventures largely comprise loan balances of £3,892m (2017: £4,121m) and derivative swap balances of £672m (2017: £703m) entered into to hedge the cash flow variability exposures of the joint ventures.
(c) The December 2016 comparative summarised balance sheet for Gain Land Limited (Gain Land) has been updated to reflect £353m impairment of assets withinGain Land. Tesco’s 20% share of this impairment was previously recorded as an impairment of the goodwill inherent within Tesco’s investment in Gain Land.
(d) The share of profit for the year for UK property joint ventures related to £12m dividends received from joint ventures with £nil carrying amounts. £5m of lossesand £7m of increases in the fair values of derivatives arising from these entities have been included in cumulative unrecognised losses and cumulative unrecognised hedge reserves respectively.
(e) Deferred profits that arose from the transfer of properties into the UK property joint ventures have been offset against the carrying amounts of the relatedjoint ventures. £2m relating to BLT Properties Limited has been released during the year as a result of the joint venture being wound up on 6 April 2017.
(f) Cumulative unrecognised losses of £24m and cumulative unrecognised hedge reserves of £8m were disposed of relating to BLT Properties Limited.
At 24 February 2018, the Group has £104m (2017: £103m) loans to UK property joint ventures and £nil (2017: £nil) to Gain Land.

TESCO PLC
45
Note 12 Group entities continued
Other joint ventures and associates The Group also has interests in a number of other joint ventures and associates, excluding UK property joint ventures and Gain Land. These are not considered to be individually material to the Group.
Joint ventures Associates
2018 £m
2017 £m
2018 £m
2017 £m
Aggregate carrying amount of other joint ventures and associates 262 245
61 61 Group’s share of profits/(losses) for the year 17 (7) 11 11
Impairment Management has performed impairment tests and sensitivity analysis on its investments in Gain Land, Trent Hypermarket Limited and Tesco Underwriting Limited. The carrying values of Trent Hypermarket Limited of £98m (2017: £112m) and Tesco Underwriting Limited of £90m (2017: £71m) are included within ‘Other joint ventures and associates’ as discussed above.
The recoverable values of these investments were estimated taking into account forecast cash flows, equity valuations of comparable entities and/or recent transactions for comparable businesses. No impairment was recognised in the year for these investments. The Group has performed sensitivity analysis on the impairment tests for these investments. A reasonably possible increase of one percentage point in the discount rate, based on recent market movements, would not indicate impairment in Gain Land or Tesco Underwriting Limited. An increase in the discount rate of one percentage point would not result in a material impairment to the carrying value of Trent Hypermarket Limited.
Future changes in estimated cash flows, discount rates, competitive landscape, retail market conditions and other factors may result in impairment losses or reversals of impairment in future periods.
Note 13 Cash and cash equivalents and short-term investments
Cash and cash equivalents
2018 £m
2017 £m
Cash at bank and in hand 3,580 3,498
Short-term deposits 479 323
4,059 3,821
Short-term investments
2018 £m
2017 £m
Money market funds 1,029 2,727 Included in cash and cash equivalents is an amount of £777m (2017: £777m) that was set aside at the balance sheet date for completion of the merger with Booker Group PLC. This cash was invested at a floating rate of interest, held in ring-fenced accounts and was not available to the Group. The merger was completed on 5 March 2018, with £766m being paid on completion. Refer to Note 22 for further details on the Booker merger.
Note 14 Commercial income
Consistent with standard industry practice, the Group has agreements with suppliers whereby volume-related allowances, promotional and marketing allowances and various other fees and discounts are received in connection with the purchase of goods for resale from those suppliers. Most of the income received from suppliers relates to adjustments to a core cost price of a product, and as such is considered part of the purchase price for that product. Sometimes receipt of the income is conditional on the Group performing specified actions or satisfying certain performance conditions associated with the purchase of the product. These include achieving agreed purchases or sales volume targets and providing promotional or marketing materials and activities or promotional product positioning. While there is no standard industry definition, these amounts receivable from suppliers in connection with the purchase of goods for resale are generally termed commercial income.
Commercial income is recognised when earned by the Group, which occurs when all obligations conditional for earning income have been discharged, and the income can be measured reliably based on the terms of the contract. The income is recognised as a credit within cost of sales. Where the income earned relates to inventories which are held by the Group at period ends, the income is included within the cost of those inventories, and recognised in cost of sales upon the sale of those inventories.
Amounts due relating to commercial income are recognised within trade and other receivables, except in cases where the Group currently has a legally enforceable right to set-off and intends to offset amounts due from suppliers against amounts owed to those suppliers, in which case only the net amount receivable or payable is recognised. Accrued commercial income is recognised within accrued income when commercial income earned has not been invoiced at the balance sheet date.
Management consider the best indicator of the estimation undertaken is by reference to commercial income balances not settled at the balance sheet date and has therefore provided additional disclosures of commercial income amounts reflected in the balance sheet.

TESCO PLC
46
Note 14 Commercial income continued
Below are the commercial income balances included within inventories and trade and other receivables, or netted against trade and other payables. Amounts received in advance of income being earned are included in accruals and deferred income.
2018 £m
2017 £m
Current assets Inventories (69) (75) Trade and other receivables
Trade/other receivables 169 215 Accrued income 186 150
Current liabilities Trade and other payables
Trade payables 199 213 Accruals and deferred income (7) (22)
Note 15 Borrowings
Current
Par value Maturity 2018
£m 2017
£m
Bank loans and overdrafts – – 351 912
Loans from joint ventures – – 6 6
LIBOR + 0.5% Term Loan £488m Oct 2017 - 484
1.250% MTN €500m Nov 2017 - 423
5.5% USD Bond $850m Nov 2017 - 709
5.2% Tesco Bank Retail Bond £125m Aug 2018 126 -
3.375% MTN €750m Nov 2018 667 -
LIBOR + 0.65% Tesco Bank Bond(a) £300m Apr 2020 300 -
5.5457% Secured Bond(b)(c) £350m Feb 2029 17 15
Finance leases – – 12 11
1,479 2,560
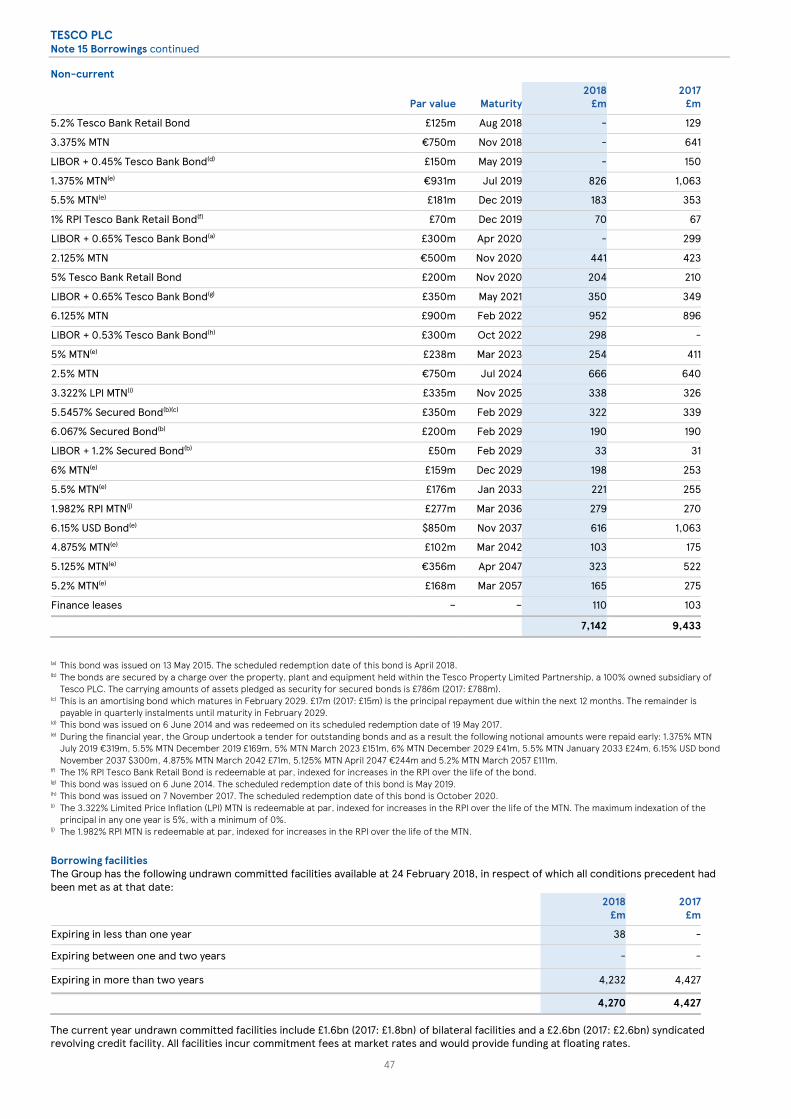
TESCO PLC
47
Note 15 Borrowings continued
Non-current
Par value Maturity 2018
£m 2017
£m
5.2% Tesco Bank Retail Bond £125m Aug 2018 - 129
3.375% MTN €750m Nov 2018 - 641
LIBOR + 0.45% Tesco Bank Bond(d) £150m May 2019 - 150
1.375% MTN(e) €931m Jul 2019 826 1,063
5.5% MTN(e) £181m Dec 2019 183 353
1% RPI Tesco Bank Retail Bond(f) £70m Dec 2019 70 67
LIBOR + 0.65% Tesco Bank Bond(a) £300m Apr 2020 - 299
2.125% MTN €500m Nov 2020 441 423
5% Tesco Bank Retail Bond £200m Nov 2020 204 210
LIBOR + 0.65% Tesco Bank Bond(g) £350m May 2021 350 349
6.125% MTN £900m Feb 2022 952 896
LIBOR + 0.53% Tesco Bank Bond(h) £300m Oct 2022 298 -
5% MTN(e) £238m Mar 2023 254 411
2.5% MTN €750m Jul 2024 666 640
3.322% LPI MTN(i) £335m Nov 2025 338 326
5.5457% Secured Bond(b)(c) £350m Feb 2029 322 339
6.067% Secured Bond(b) £200m Feb 2029 190 190
LIBOR + 1.2% Secured Bond(b) £50m Feb 2029 33 31
6% MTN(e) £159m Dec 2029 198 253
5.5% MTN(e) £176m Jan 2033 221 255
1.982% RPI MTN(j) £277m Mar 2036 279 270
6.15% USD Bond(e) $850m Nov 2037 616 1,063
4.875% MTN(e) £102m Mar 2042 103 175
5.125% MTN(e) €356m Apr 2047 323 522
5.2% MTN(e) £168m Mar 2057 165 275
Finance leases – – 110 103
7,142 9,433
(a) This bond was issued on 13 May 2015. The scheduled redemption date of this bond is April 2018.(b) The bonds are secured by a charge over the property, plant and equipment held within the Tesco Property Limited Partnership, a 100% owned subsidiary of
Tesco PLC. The carrying amounts of assets pledged as security for secured bonds is £786m (2017: £788m). (c) This is an amortising bond which matures in February 2029. £17m (2017: £15m) is the principal repayment due within the next 12 months. The remainder is
payable in quarterly instalments until maturity in February 2029. (d) This bond was issued on 6 June 2014 and was redeemed on its scheduled redemption date of 19 May 2017.(e) During the financial year, the Group undertook a tender for outstanding bonds and as a result the following notional amounts were repaid early: 1.375% MTN
July 2019 €319m, 5.5% MTN December 2019 £169m, 5% MTN March 2023 £151m, 6% MTN December 2029 £41m, 5.5% MTN January 2033 £24m, 6.15% USD bond November 2037 $300m, 4.875% MTN March 2042 £71m, 5.125% MTN April 2047 €244m and 5.2% MTN March 2057 £111m.
(f) The 1% RPI Tesco Bank Retail Bond is redeemable at par, indexed for increases in the RPI over the life of the bond. (g) This bond was issued on 6 June 2014. The scheduled redemption date of this bond is May 2019.(h) This bond was issued on 7 November 2017. The scheduled redemption date of this bond is October 2020. (i) The 3.322% Limited Price Inflation (LPI) MTN is redeemable at par, indexed for increases in the RPI over the life of the MTN. The maximum indexation of the
principal in any one year is 5%, with a minimum of 0%. (j) The 1.982% RPI MTN is redeemable at par, indexed for increases in the RPI over the life of the MTN.
Borrowing facilities The Group has the following undrawn committed facilities available at 24 February 2018, in respect of which all conditions precedent had been met as at that date:
2018 £m
2017 £m
Expiring in less than one year 38 -
Expiring between one and two years - -
Expiring in more than two years 4,232 4,427
4,270 4,427
The current year undrawn committed facilities include £1.6bn (2017: £1.8bn) of bilateral facilities and a £2.6bn (2017: £2.6bn) syndicated revolving credit facility. All facilities incur commitment fees at market rates and would provide funding at floating rates.
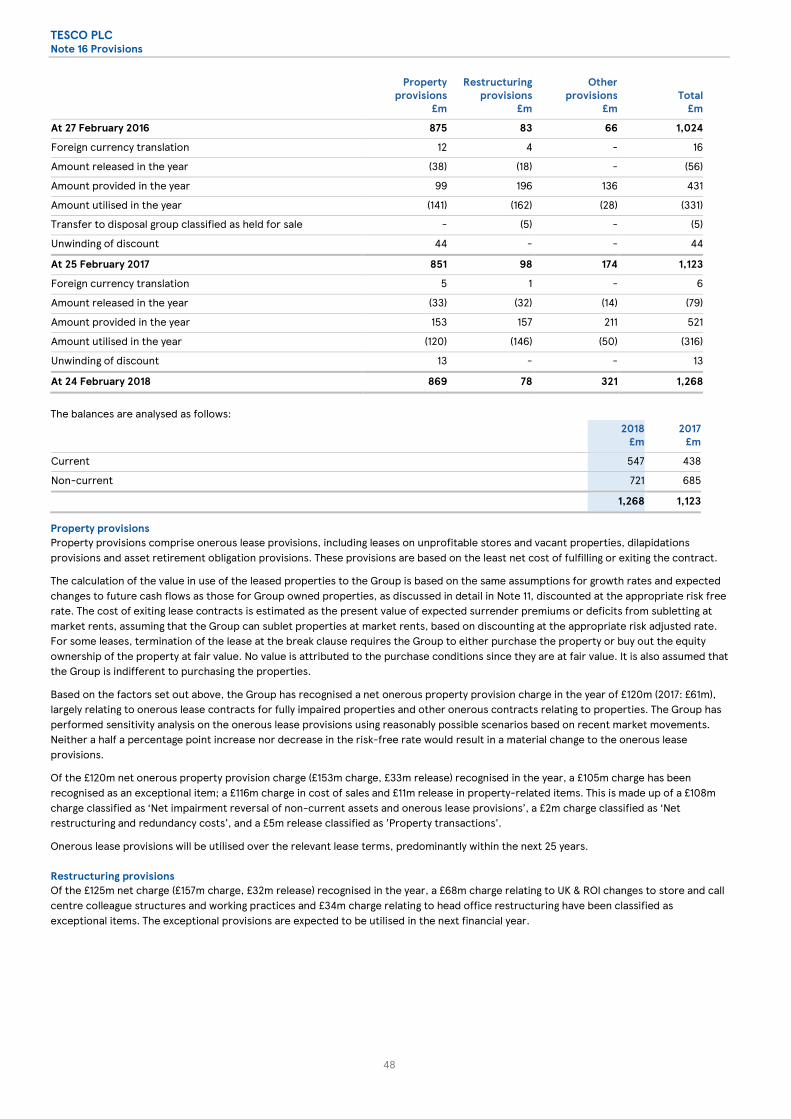
TESCO PLC
48
Note 16 Provisions
Property provisions
£m
Restructuring provisions
£m
Other provisions
£m Total
£m
At 27 February 2016 875 83 66 1,024
Foreign currency translation 12 4 - 16
Amount released in the year (38) (18) - (56)
Amount provided in the year 99 196 136 431
Amount utilised in the year (141) (162) (28) (331)
Transfer to disposal group classified as held for sale - (5) - (5)
Unwinding of discount 44 - - 44
At 25 February 2017 851 98 174 1,123
Foreign currency translation 5 1 - 6
Amount released in the year (33) (32) (14) (79)
Amount provided in the year 153 157 211 521
Amount utilised in the year (120) (146) (50) (316)
Unwinding of discount 13 - - 13
At 24 February 2018 869 78 321 1,268
The balances are analysed as follows: 2018
£m 2017
£m
Current 547 438
Non-current 721 685
1,268 1,123
Property provisions Property provisions comprise onerous lease provisions, including leases on unprofitable stores and vacant properties, dilapidations provisions and asset retirement obligation provisions. These provisions are based on the least net cost of fulfilling or exiting the contract.
The calculation of the value in use of the leased properties to the Group is based on the same assumptions for growth rates and expected changes to future cash flows as those for Group owned properties, as discussed in detail in Note 11, discounted at the appropriate risk free rate. The cost of exiting lease contracts is estimated as the present value of expected surrender premiums or deficits from subletting at market rents, assuming that the Group can sublet properties at market rents, based on discounting at the appropriate risk adjusted rate. For some leases, termination of the lease at the break clause requires the Group to either purchase the property or buy out the equity ownership of the property at fair value. No value is attributed to the purchase conditions since they are at fair value. It is also assumed that the Group is indifferent to purchasing the properties.
Based on the factors set out above, the Group has recognised a net onerous property provision charge in the year of £120m (2017: £61m), largely relating to onerous lease contracts for fully impaired properties and other onerous contracts relating to properties. The Group has performed sensitivity analysis on the onerous lease provisions using reasonably possible scenarios based on recent market movements. Neither a half a percentage point increase nor decrease in the risk-free rate would result in a material change to the onerous lease provisions.
Of the £120m net onerous property provision charge (£153m charge, £33m release) recognised in the year, a £105m charge has been recognised as an exceptional item; a £116m charge in cost of sales and £11m release in property-related items. This is made up of a £108m charge classified as ‘Net impairment reversal of non-current assets and onerous lease provisions’, a £2m charge classified as ‘Net restructuring and redundancy costs’, and a £5m release classified as 'Property transactions'.
Onerous lease provisions will be utilised over the relevant lease terms, predominantly within the next 25 years.
Restructuring provisions Of the £125m net charge (£157m charge, £32m release) recognised in the year, a £68m charge relating to UK & ROI changes to store and call centre colleague structures and working practices and £34m charge relating to head office restructuring have been classified as exceptional items. The exceptional provisions are expected to be utilised in the next financial year.
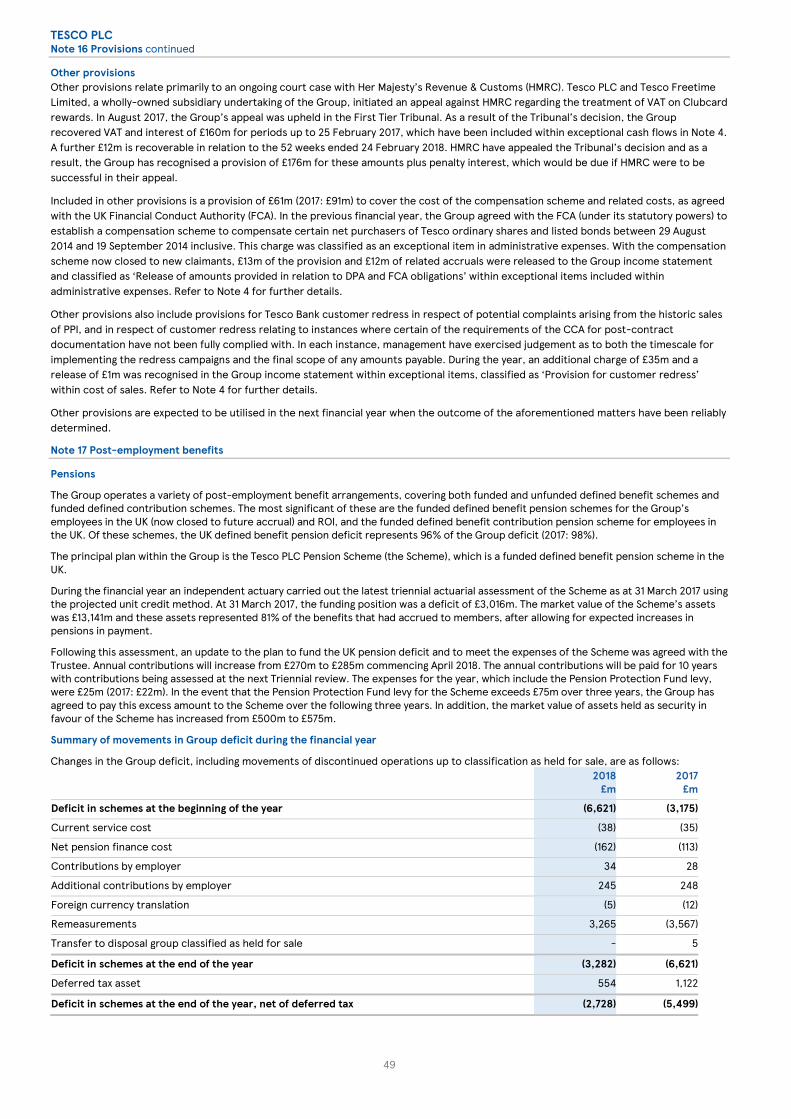
TESCO PLC
49
Note 16 Provisions continued
Other provisions Other provisions relate primarily to an ongoing court case with Her Majesty’s Revenue & Customs (HMRC). Tesco PLC and Tesco Freetime Limited, a wholly-owned subsidiary undertaking of the Group, initiated an appeal against HMRC regarding the treatment of VAT on Clubcard rewards. In August 2017, the Group’s appeal was upheld in the First Tier Tribunal. As a result of the Tribunal’s decision, the Group recovered VAT and interest of £160m for periods up to 25 February 2017, which have been included within exceptional cash flows in Note 4. A further £12m is recoverable in relation to the 52 weeks ended 24 February 2018. HMRC have appealed the Tribunal’s decision and as a result, the Group has recognised a provision of £176m for these amounts plus penalty interest, which would be due if HMRC were to be successful in their appeal.
Included in other provisions is a provision of £61m (2017: £91m) to cover the cost of the compensation scheme and related costs, as agreed with the UK Financial Conduct Authority (FCA). In the previous financial year, the Group agreed with the FCA (under its statutory powers) to establish a compensation scheme to compensate certain net purchasers of Tesco ordinary shares and listed bonds between 29 August 2014 and 19 September 2014 inclusive. This charge was classified as an exceptional item in administrative expenses. With the compensation scheme now closed to new claimants, £13m of the provision and £12m of related accruals were released to the Group income statement and classified as ‘Release of amounts provided in relation to DPA and FCA obligations’ within exceptional items included within administrative expenses. Refer to Note 4 for further details.
Other provisions also include provisions for Tesco Bank customer redress in respect of potential complaints arising from the historic sales of PPI, and in respect of customer redress relating to instances where certain of the requirements of the CCA for post-contract documentation have not been fully complied with. In each instance, management have exercised judgement as to both the timescale for implementing the redress campaigns and the final scope of any amounts payable. During the year, an additional charge of £35m and a release of £1m was recognised in the Group income statement within exceptional items, classified as ‘Provision for customer redress’ within cost of sales. Refer to Note 4 for further details.
Other provisions are expected to be utilised in the next financial year when the outcome of the aforementioned matters have been reliably determined.
Note 17 Post-employment benefits
Pensions
The Group operates a variety of post-employment benefit arrangements, covering both funded and unfunded defined benefit schemes and funded defined contribution schemes. The most significant of these are the funded defined benefit pension schemes for the Group’s employees in the UK (now closed to future accrual) and ROI, and the funded defined benefit contribution pension scheme for employees in the UK. Of these schemes, the UK defined benefit pension deficit represents 96% of the Group deficit (2017: 98%).
The principal plan within the Group is the Tesco PLC Pension Scheme (the Scheme), which is a funded defined benefit pension scheme in the UK.
During the financial year an independent actuary carried out the latest triennial actuarial assessment of the Scheme as at 31 March 2017 using the projected unit credit method. At 31 March 2017, the funding position was a deficit of £3,016m. The market value of the Scheme’s assets was £13,141m and these assets represented 81% of the benefits that had accrued to members, after allowing for expected increases in pensions in payment.
Following this assessment, an update to the plan to fund the UK pension deficit and to meet the expenses of the Scheme was agreed with the Trustee. Annual contributions will increase from £270m to £285m commencing April 2018. The annual contributions will be paid for 10 years with contributions being assessed at the next Triennial review. The expenses for the year, which include the Pension Protection Fund levy, were £25m (2017: £22m). In the event that the Pension Protection Fund levy for the Scheme exceeds £75m over three years, the Group has agreed to pay this excess amount to the Scheme over the following three years. In addition, the market value of assets held as security in favour of the Scheme has increased from £500m to £575m.
Summary of movements in Group deficit during the financial year
Changes in the Group deficit, including movements of discontinued operations up to classification as held for sale, are as follows: 2018
£m 2017
£m
Deficit in schemes at the beginning of the year (6,621) (3,175)
Current service cost (38) (35)
Net pension finance cost (162) (113)
Contributions by employer 34 28
Additional contributions by employer 245 248
Foreign currency translation (5) (12)
Remeasurements 3,265 (3,567)
Transfer to disposal group classified as held for sale - 5
Deficit in schemes at the end of the year (3,282) (6,621)
Deferred tax asset 554 1,122
Deficit in schemes at the end of the year, net of deferred tax (2,728) (5,499)

TESCO PLC
50
Note 17 Post-employment benefits continued
UK principal financial assumptions
During the financial year the Group has taken actuarial advice and decided to change the model used for deriving the discount rate assumption for valuing the Scheme’s liabilities under IAS 19.
The standard requires the discount rate to be determined by reference to market yields of high quality corporate bonds of suitable currency and term to the Scheme cash flows. The standard does not specify the approach that should be taken to extrapolate current market rates along the yield curve when there are no suitable corporate bonds of sufficient duration. As the term of the Scheme's liabilities is particularly long, the Group balance sheet is sensitive to the extrapolation approach adopted. Under the previous model, the extrapolation was in line with the movement in the gilt yield curve. The model now adopted by the Group extrapolates based on the trend observable in corporate bond yields. In the Group's view, this more appropriately reflects long-dated corporate bond yields for the cash flow profile of the Scheme’s liabilities.
The impact of the change in discount rate model was to give a £2.0bn gain on change of financial assumptions at the point of the transition. If the transition had occurred at the balance sheet date, the gain would have been £1.3bn.
The major assumptions, on a weighted average basis, used by the actuaries to value the defined benefit obligation were as follows:
2018 %
2017 %
Discount rate 2.9 2.5
Price inflation 3.1 3.2
Rate of increase in deferred pensions* 2.1 2.2
Rate of increase in pensions in payment*
Benefits accrued before 1 June 2012 2.9 3.0
Benefits accrued after 1 June 2012 2.2 2.2
* In excess of any Guaranteed Minimum Pension (GMP) element.
If the discount rate assumption increased by 0.1% or 1.0%, the UK defined benefit obligation would decrease by approximately £388m or £3,377m respectively. If this assumption decreased by 0.1% or 1.0%, the UK defined benefit obligation would increase by approximately £404m or £4,718m respectively.
If the inflation assumption increased by 0.1% or 1.0%, the UK defined benefit obligation would increase by approximately £339m or £3,651m respectively. If this assumption decreased by 0.1% or 1.0%, the UK defined benefit obligation would decrease by approximately £323m or £2,876m respectively.
UK mortality assumptions
The Group, in consultation with an independent actuary, conducted a mortality analysis under the Scheme as part of the triennial actuarial valuation process. Subsequent to this analysis, the Group adopted the best estimate assumptions for the calculation of the IAS 19 pension liability for the main UK scheme.
The mortality assumptions used are based on tables that have been projected to 2017 with CMI 2016 improvements. In addition, the allowance for future mortality improvements from 2017 is in line with CMI 2016 improvements, with a long-term improvement rate of 1.25% per annum.
The following table illustrates the expectation of life of an average member retiring at age 65 at the reporting date and a member reaching age 65 at reporting date +25 years. A comparison between the two retiree dates illustrates the expected improvements in mortality over the time period.
2018 Years
2017 Years
Retiring at reporting date at age 65: Male 22.3 23.2 Female 24.0 24.5 Retiring at reporting date +25 years at age 65: Male 23.8 25.5 Female 26.0 26.9
The base tables used in calculating the mortality assumptions are as follows:
Pensioners: 100% of the SAPS S2 normal male pensioners for male staff and 85% of SAPS S2 normal light male pensioners for male senior managers. 100% of the SAPS S2 all female pensioners for female staff and 85% of SAPS S2 all female pensioners for female senior managers.
Non-Pensioners: 105% of the SAPS S2 normal male pensioners for male staff and 87% of SAPS S2 normal light male pensioners for male senior managers. 98% of the SAPS S2 all female pensioners for female staff and 86% of SAPS S2 all female pensioners for female senior managers.

TESCO PLC
51
Note 18 Analysis of changes in Net debt
At 25 February
2017 £m
Cash flow
£m
Fair value movements
£m
Foreign exchange
movements £m
Interest income/ (charge)
£m
Other non-cash
movements £m
Non-cash movements –
Turkey disposal £m
Reclassifications of movements
in net debt of the disposal group
£m
At 24 February
2018 £m
Total Group
Bank and other borrowings
(11,712) 3,408 91 (49) (56) - 73 (73) (8,318)
Finance lease payables (114) 10 - (2) - (16) - - (122)
Net derivative financial instruments
893 (253) (195) - 20 - - - 465
Arising from financing activities
(10,933) 3,165 (104) (51) (36) (16) 73 (73) (7,975)
Cash and cash equivalents
3,821 212 - 15 - - - 11 4,059
Short-term investments 2,727 (1,697) - (1) - - - - 1,029
Joint venture loans 137 - - - - 1 - - 138
Interest and other receivables
1 (27) - - 27 - - - 1
Interest payables (167) 351 - (3) (362) - 3 (3) (181)
Net derivative interest 28 (23) - - 11 - - - 16
Net debt of the disposal group
(65) - - - - - - 65 -
Total Group (4,451) 1,981 (104) (40) (360) (15) 76 - (2,913)
Tesco Bank
Bank and other borrowings
(1,440) (150) 6 - - - - - (1,584)
Net derivative financial instruments
(105) - 63 - - - - - (42)
Arising from financing activities
(1,545) (150) 69 - - - - - (1,626)
Cash and cash equivalents
789 515 - - - - - - 1,304
Joint ventures loans 34 - - - - - - - 34
Interest payables - 4 - - (4) - - - -
Tesco Bank (722) 369 69 - (4) - - - (288)
Retail
Bank and other borrowings
(10,272) 3,558 85 (49) (56) - 73 (73) (6,734)
Finance lease payables (114) 10 - (2) - (16) - - (122)
Net derivative financial instruments
998 (253) (258) - 20 - - - 507
Arising from financing activities
(9,388) 3,315 (173) (51) (36) (16) 73 (73) (6,349)
Cash and cash equivalents
3,032 (303) - 15 - - - 11 2,755
Short-term investments 2,727 (1,697) - (1) - - - - 1,029
Joint ventures loans 103 - - - - 1 - - 104
Interest and other receivables
1 (27) - - 27 - - - 1
Interest payables (167) 347 - (3) (358) - 3 (3) (181)
Net derivative interest 28 (23) - - 11 - - - 16
Net debt of the disposal group
(65) - - - - - - 65 -
Net debt (3,729) 1,612 (173) (40) (356) (15) 76 - (2,625)
Net debt excludes the net debt of Tesco Bank but includes that of discontinued operations. Balances and movements in respect of the total Group and Tesco Bank are presented to allow reconciliation between the Group balance sheet and the Group cash flow statement.

TESCO PLC
52
Note 18 Analysis of changes in Net debt continued
Reconciliation of net cash flow to movement in Net debt
2018
£m 2017
£m Net increase/(decrease) in cash and cash equivalents 212 881
Elimination of Tesco Bank movement in cash and cash equivalents (515) (235)
Retail cash movement in other Net debt items:
Net increase/(decrease) in short-term investments (1,697) (736)
Net increase/(decrease) in joint venture loans - (15)
Net (increase)/decrease in borrowings and lease financing 3,568 1,863
Net cash flows from derivative financial instruments (253) (475)
Net interest paid on components of net debt 297 477
Change in Net debt resulting from cash flow 1,612 1,760
Retail net interest charge on components of net debt (356) (472)
Retail fair value and foreign exchange movements (213) 111
Debt acquired on disposal of Turkish operations 76 -
Retail other non-cash movements (15) (18)
(Increase)/decrease in Net debt 1,104 1,381
Opening Net debt (3,729) (5,110)
Closing Net debt (2,625) (3,729)
Note 19 Business combinations and disposals
Business combinations The Group has paid a further £25m of deferred consideration in the financial year, related to its obligations under the purchase agreement for the acquisition of Sociomantic Labs from prior years.
On 26 October 2017, the Group obtained sole control of Tesco Mobile Ireland Limited (TMI), previously accounted for as a joint venture, through acquisition of Three Ireland Limited’s (Three) 50% interest in TMI. The Group paid £2m to Three for their 50% interest and recognised a gain of £3m. The TMI acquisition generated goodwill of £4m.
Disposals On 1 March 2017, the Group announced the completion of the disposal of its 95.5% controlling stake in the Kipa business in Turkey following the receipt of all local regulatory approvals. Refer to Note 7 for further details.
On 30 June 2017, the Group disposed of its 8.8% shareholding in Lazada to Alibaba Group Holding Limited (Alibaba) for net cash consideration of $254m (£196m). The group’s investment in Lazada was recognised as an available-for-sale financial asset and classified as Level 3 in the fair value hierarchy. At the time of the disposal, the investment was revalued resulting in a gain of £70m recognised in the Group statement of comprehensive income. The available-for-sale reserve, including £54m recorded prior to the current year, was reclassified to the Group income statement resulting in a pre-tax profit on disposal of £124m. The disposal was subject to capital gains tax of £25m, which has been recognised as a reduction in the Group’s deferred tax asset. The transaction has been included within exceptional items, classified as ‘Investment disposal’. Refer to Note 4.
On 4 December 2017, the Group disposed of the trade and assets of its opticians business to Vision Express (UK) Ltd for net cash consideration of £45m, resulting in a pre-tax profit of £38m included within exceptional items, which was classified as ‘Disposal of opticians business’ within administrative expenses. Included in the pre-tax profit is £3m contingent consideration. Refer to Note 4.
Note 20 Contingent liabilities
There are a number of contingent liabilities that arise in the normal course of business, which if realised, are not expected to result in a material liability to the Group. The Group recognises provisions for liabilities when it is more likely than not that a settlement will be required and the value of such a payment can be reliably estimated.
For details of assets held under finance leases, which are pledged as security for the finance lease liabilities, refer to Note 11.
As previously reported, law firms in the UK have announced the intention of forming claimant groups to commence litigation against the Group for matters arising out of or in connection with its overstatement of expected profits in 2014, and purport to have secured third party funding for such litigation. In this regard, the Group has received two High Court claims against Tesco PLC. The first was received on 31 October 2016 from a group of 112 investors (now reduced to 78 investors) and the second was received on 5 December 2016 from an investment company and a trust company. The merit, likely outcome and potential impact on the Group of any such litigation that either has been or might potentially be brought against the Group is subject to a number of significant uncertainties and therefore, the Group cannot make any assessment of the likely outcome or quantum of any such litigation as at the date of this disclosure.

TESCO PLC
53
Note 20 Contingent liabilities continued
Prior to the disposal of its Korean operations (Homeplus), Tesco PLC provided guarantees in respect of 13 Homeplus lease agreements in Korea in the event of termination of the relevant lease agreement by the landlord due to Homeplus’ default. Entities controlled by MBK and CPPIB, as the purchasers of Homeplus, undertook to procure Tesco PLC’s release from these guarantees following the disposal of Homeplus. 8 currently remain outstanding. This liability decreases over time with all relevant leases expiring in the period between 2026 and 2033. Tesco PLC has the benefit of an indemnity from the purchasers of Homeplus for any claims made under such guarantees. The maximum potential liability under the lease guarantees is between KRW366bn (£243m) and KRW517bn (£344m).
Tesco Stores Limited has received claims from current and former Tesco store colleagues alleging that their work is of equal value to that of colleagues working in Tesco’s distribution centres and that differences in terms and conditions relating to pay are not objectively justifiable. The claimants are seeking the differential between the pay terms looking back, and equivalence of pay terms moving forward. At present, the likely number of claims that may be received and the merit, likely outcome and potential impact on the Group of any such litigation is subject to a number of significant uncertainties and therefore, the Group cannot make any assessment of the likely outcome or quantum of any such litigation as at the date of this disclosure. There are substantial factual and legal defences to these claims and the Group intends to defend them.
Note 21 Lease commitments
Operating lease commitments – Group as lessee
Future minimum lease commitments under non-cancellable operating leases are as follows:
2018
£m 2017
£m Within one year 1,077 1,199
Greater than one year but less than five years 3,552 3,767
After five years 6,788 7,395
Total minimum lease commitments 11,417 12,361
Future minimum lease commitments under non-cancellable operating leases after five years are analysed further as follows:
2018
£m 2017
£m Greater than five years but less than ten years 3,035 3,161
Greater than ten years but less than fifteen years 2,008 2,225
After fifteen years 1,745 2,009
Total minimum lease commitments – after five years 6,788 7,395
The Group has used operating lease commitments discounted at 7% (2017: 7%) of £6,931m (2017: £7,440m) in its calculation of total indebtedness. The discounted operating lease commitment included in total indebtedness is not an appropriate proxy for the expected impact of recognising a lease liability under IFRS 16 ‘Leases’, primarily due to differences in the discount rates used and the treatment of additional lease rentals arising from contracts that contain extend or buy conditions, amongst other differences.
Operating lease commitments represent rentals payable by the Group for certain of its retail, distribution and office properties and other assets such as motor vehicles. The leases have varying terms, purchase options, escalation clauses and renewal rights. Purchase options and renewal rights, where they occur, are at market value. Escalation clauses are in line with market practices and include inflation linked, fixed rates, resets to market rents and hybrids of these.
The Group has lease-break options on certain sale and leaseback transactions. These options are exercisable if the Group exercises an existing option to buy back, at market value and at a specified date, either the leased asset or the equity of the other joint venture partner. No commitment has been included in respect of the buy-back option as the option is at the Group’s discretion. The Group is not obliged to pay lease rentals after that date, therefore minimum lease commitments exclude those falling after the buy-back date. The current market value of these properties is £2.8bn (2017: £2.9bn) and the total undiscounted lease rentals, if they were to be incurred following the option exercise date, would be £2.6bn (2017: £2.6bn) using current rent values, as shown below.
The additional lease rentals if incurred following the option exercise date would be as follows:
2018
£m 2017
£m Within one year 2 23
Greater than one year but less than five years 265 170
Greater than five years but less than ten years 738 709
Greater than ten years but less than fifteen years 659 670
After fifteen years 935 1,019
Total undiscounted contingent additional lease rentals 2,599 2,591
Total discounted contingent additional lease rentals at 7% 1,159 1,107
The lease break options are exercisable between 2018 and 2023.

TESCO PLC
54
Note 21 Lease commitments continued
Operating lease commitments with joint ventures and associates
In prior years, the Group entered into several joint ventures and associates, and sold and leased back properties to and from these joint ventures and associates. The terms of these sale and leasebacks varied. However, common factors included: the sale of the properties to the joint venture or associate at market value; options within the lease for the Group to repurchase the properties at market value; market rent reviews; and 20 to 30 full-year lease terms. The Group reviews the substance as well as the form of the arrangements when determining the classification of leases as operating or finance. All of the leases under these arrangements are operating leases.
Note 22 Events after reporting period
Booker Group PLC
On 27 January 2017, the Group announced that it had reached an agreement on the terms of a recommended share and cash merger with Booker Group PLC, the UK’s leading food wholesaler, subject to shareholder and regulatory approvals. Following an in-depth ‘Phase 2’ investigation by the Competition and Markets Authority (CMA), regulatory approval was granted on 20 December 2017. Shareholder approval was obtained on 28 February 2018 and the transaction completed on 5 March 2018. The transaction will be treated as an acquisition, with the merger meeting the definition of a business combination per IFRS 3. The merger builds on the Group’s core expertise of sourcing, distributing and selling food in the UK market and will enable the Group to enter the faster growing out of home food consumption market. The Directors expect the merger to deliver financial synergies of at least £200m per annum by the end of the third year following completion. The consideration of £3,893m was satisfied by cash of £766m and shares of £3,127m, with Booker Group PLC shareholders receiving 0.861 Tesco PLC ordinary shares and 42.6 pence per Booker Group PLC share held. A total of 1,548 million new Tesco PLC ordinary shares have been issued as a result of the transaction, with the new shares carrying equal voting and distribution rights as the existing ordinary shares. The fair value of the shares is based on the published share price on 2 March 2018 of 202.0p. Given the proximity of the transaction to the announcement of the Group’s financial statements, a full purchase price allocation exercise has not yet been completed and the valuation of the assets acquired is subject to amendment on finalisation of the fair value exercise. Acquired net assets have a provisional value of £543m prior to fair value adjustments. This reflects the net assets of Booker Group PLC as at 8 September 2017, as disclosed in their most recent published financial information. The remaining £3,350m will be allocated between intangible assets, including goodwill, software and other intangible assets, with the majority expected to be allocated to goodwill representing the synergies expected from the merger. None of the goodwill is expected to be deductible for tax purposes.

TESCO PLC
55
Glossary – Alternative performance measures
Introduction
In the reporting of financial information, the Directors have adopted various APMs.
These measures are not defined by International Financial Reporting Standards (IFRS) and therefore may not be directly comparable with other companies’ APMs, including those in the Group’s industry.
APMs should be considered in addition to, and are not intended to be a substitute for, or superior to, IFRS measurements.
Purpose
The Directors believe that these APMs assist in providing additional useful information on the underlying trends, performance and position of the Group.
APMs are also used to enhance the comparability of information between reporting periods and geographical units (such as like-for-like sales), by adjusting for non-recurring or uncontrollable factors which affect IFRS measures, to aid users in understanding the Group’s performance.
Consequently, APMs are used by the Directors and management for performance analysis, planning, reporting and incentive-setting purposes.
The key APMs that the Group has focused on in the financial year are as follows:
• Group sales: This is the headline measure of revenue for the Group. It excludes the impact of sales made at petrol filling stations due to the significant volatility of fuel prices. This volatility is outside the control of management and can mask underlying changes in performance.
• Like-for-like sales: This is a widely used indicator of a retailer’s current trading performance. It is a measure of growth in Group online sales and sales from stores that have been open for at least a year (but excludes prior year sales of stores closed during the year) at constant foreign exchange rates.
• Operating profit before exceptional items: This is the headline measure of the Group’s performance, and is based on operating profit before the impact of exceptional items. Exceptional items relate to certain costs or incomes that derive from events or transactions that fall within the normal activities of the Group but which, individually or, if of a similar type, in aggregate, are excluded by virtue of their size and nature in order to reflect management’s view of the performance of the Group.
• Retail operating cash flow: This is the operating cash flow of continuing operations, excluding the effects of Tesco Bank’s cash flows.
• Retail free cash flow: Retail free cash flow includes all cash flows from operating and investing activities for the Retail business, and the market purchase of shares in relation to share schemes. The following items are excluded: investing cash flows that increase/decrease items within Net debt, and cash flows from major corporate acquisitions and disposals.
• Net debt: This excludes the net debt of Tesco Bank but includes that of the discontinued operations to reflect the net debt obligations of the Retail business.
• Diluted earnings per share from continuing operations before exceptional items, net pension finance costs and fair value remeasurements on financial instruments: This relates to profit after tax before exceptional items from continuing operations, net pension finance costs and fair value remeasurements on financial instruments attributable to owners of the parent divided by the weighted average number of ordinary shares in issue during the financial year adjusted for the effects of potentially dilutive share options.
Some of the Group’s IFRS measures are translated at constant exchange rates. Constant exchange rates are the average actual periodic exchange rates for the previous financial period and are used to eliminate the effects of exchange rate fluctuations in assessing performance. Actual exchange rates are the average actual periodic exchange rates for that financial period.
Changes to APMs
During the financial year, the following changes have been applied to the Group’s APMs:
• Free cash flow has been redefined to include all cash flows from operating and investing activities, and the market purchase of shares in relation to share schemes. The following items are excluded: investing cash flows that increase/decrease items within Group net debt, and cash flows from major corporate acquisitions and disposals. This measure reflects the cash available to shareholders. Previously, free cash flow only included capital expenditure cash flows within investing activities. Retail free cash flow is now considered a key APM.
• Diluted earnings per share from continuing operations before exceptional items and net pension finance costs has been replaced with diluted earnings per share from continuing operations before exceptional items, net pension finance costs and fair value remeasurements on financial instruments. Fair value remeasurements are now excluded as they are impacted by changes to credit risk and various market indices, which can fluctuate significantly. Also included in these items are fair value remeasurements on financial instruments resulting from liability management exercises. Other earnings per share measures before exceptional items are no longer considered APMs and have been removed.
• Total indebtedness ratio and Fixed charge cover have been included as new APMs during the year. EBITDAR has also been included as it is used to calculate these debt metrics. Total indebtedness ratio and Fixed charge cover are measures of the Group’s ability to meet its payment obligations and are widely used by analysts and credit rating agencies.

TESCO PLC
56
Glossary – Alternative performance measures continued
APM Closest equivalent IFRS measure
Adjustments to reconcile to IFRS measure
Note/page reference for reconciliation
Definition and purpose
Income statement Revenue measures
Group sales Revenue • Exclude sales made at petrol filling stations
Note 2 • Excludes the impact of sales made at petrol filling stations to demonstrate the Group’s underlying performance in the core retail and financial services businesses by removing the volatilities associated with the movement in fuel prices. This is a key management incentive metric.
Growth in sales No direct equivalent • Consistent with accounting policy
Not applicable • Growth in sales is a ratio that measures year-on-year movement in Group sales for continuing operations for 52 weeks. It shows the annual rate of increase in the Group's sales and is considered a good indicator of how rapidly the Group's core business is growing.
Like-for-like No direct equivalent • Consistent with accounting policy
Not applicable • Like-for-like is a measure of growth in Group online sales and sales from stores that have been open for at least a year (but excludes prior year sales of stores closed during the year) at constant foreign exchange rates. It is a widely used indicator of a retailer’s current trading performance and is important when comparing growth between retailers that have different profiles of expansion, disposals and closures.
Profit measures
Operating profit before exceptional items
Operating profit* • Exceptional items Note 2 • Operating profit before exceptional items is the headline measure of the Group’s performance. It is based on operating profit before the impact of certain costs or incomes that derive from events or transactions that fall within the normal activities of the Group, but which are excluded by virtue of their size and nature in order to reflect management’s view of the performance of the Group. This is a key management incentive metric.
Operating margin No direct equivalent • Consistent with accounting policy
Not applicable • Operating margin is calculated as operating profit before exceptional items divided by revenue. Progression in operating margin is an important indicator of the Group’s operating efficiency.
Earnings before exceptional items, interest, tax, depreciation, amortisation and rent expense (EBITDAR)
Operating profit* • Exceptional items • Depreciation and amortisation • Rent expense • Tesco Bank EBITDAR • Discontinued operations
Page 58 • This measure is based on Retail operating profit from continuing operations before exceptional items. It excludes Retail depreciation, amortisation and rent expense and is used to derive the Total indebtedness ratio and Fixed charge cover APMs.
Profit before tax before exceptional items, net pension finance costs and fair value remeasurements on financial instruments
Profit before tax • Exceptional items • Net pension finance costs (IAS 19) • Fair value remeasurements on
financial instruments (IAS 39)
Note 9 • This measure excludes exceptional items, the net finance costs of the defined benefit pension deficit and fair value remeasurements on financial instruments. Net pension finance costs are impacted by corporate bond yields, which can fluctuate significantly and are reset each year based on often volatile external market factors. Fair value remeasurements are impacted by changes to credit risk and various market indices, which can fluctuate significantly. Also included in these items are fair value remeasurements on financial instruments resulting from liability management exercises.
Profits/(losses) arising on property-related items
No direct equivalent • Consistent with accounting policy
Not applicable • Profits/(losses) arising on property-related items relates to the Group’s property activities including; gains and losses on disposal of property assets, development property built for resale and property joint ventures; costs resulting from changes in the Group’s store portfolio and distribution network, including pre-opening and post-closure costs; and income/(charges) associated with impairment of non-trading property and related onerous contracts.
• These items are disclosed separately to clearly identify the impact of these items versus the other operating expenses related to the core retail and financial services operations of the business. They are often one-time in nature and can have a disproportionate impact on profit between reporting periods.

TESCO PLC
57
Glossary – Alternative performance measures continued
APM Closest equivalent IFRS measure
Adjustments to reconcile to IFRS measure
Note/page reference for reconciliation
Definition and purpose
Profit measures continued
Total finance costs before exceptional items, net pension finance costs and fair value remeasurements on financial instruments
Finance costs • Exceptional items • Net pension finance costs
(IAS 19) • Fair value remeasurements on
financial instruments (IAS 39)
Note 5 • Total finance costs before exceptional items, net pension finance costs and fair value remeasurements on financial instruments is the net finance costs adjusted for non-recurring one off items, net pension finance costs and fair value remeasurements on financial instruments. Net pension finance costs are impacted by corporate bond yields, which can fluctuate significantly and are reset each year based on often volatile external market factors. Fair value remeasurements are impacted by changes to credit risk and various market indices, which can fluctuate significantly. Also included in these items are fair value remeasurements on financial instruments resulting from liability management exercises.
Earnings per share from continuing operations before exceptional items, net pension finance costs and fair value remeasurements on financial instruments
Diluted earnings per share
• Exceptional items • Discontinued operations • Net pension finance costs
(IAS 19) • Fair value remeasurements on
financial instruments (IAS 39)
Note 9 • This relates to profit after tax before exceptional items from continuing operations, net pension finance costs and fair value remeasurements attributable to owners of the parent divided by the weighted average number of ordinary shares in issue during the financial period.
• It excludes net pension finance costs and fair value remeasurements on financial instruments. Net pension finance costs are impacted by corporate bond yields, which can fluctuate significantly and are reset each year based on often volatile external market factors. Fair value remeasurements are impacted by changes to credit risk and various market indices, which can fluctuate significantly. Also included in these items are fair value remeasurements on financial instruments resulting from liability management exercises.
Tax measures
Effective tax rate before exceptional items
Effective tax rate • Exceptional items and their tax impact
Note 6 • Effective tax rate before exceptional items is calculated as total income tax credit/(charge) excluding the tax impact of exceptional items divided by profit before tax before exceptional items. This provides an indication of the ongoing tax rate across the Group.
Effective tax rate before exceptional items, net pension finance costs and fair value remeasurements on financial instruments
Effective tax rate • Exceptional items and their tax impact
• Net pension finance costs (IAS 19) and their tax impact
• Fair value remeasurements on financial instruments (IAS 39) and their tax impact
Note 6 • Effective tax rate before exceptional items, net pension finance costs and fair value remeasurements on financial instruments is calculated as total income tax credit/(charge) excluding the tax impact of exceptional items, net pension finance costs and fair value remeasurements divided by the profit before tax before exceptional items, net pension finance costs and fair value remeasurements.
Balance sheet measures
Net debt Borrowings less cash and related hedges
• Net debt from Tesco Bank Note 18 • Net debt excludes the net debt of Tesco Bank but includes that of the discontinued operations to reflect the net debt obligations of the Retail business. Net debt comprises bank and other borrowings, finance lease payables, net derivative financial instruments, joint venture loans and other receivables and net interest receivables/payables, offset by cash and cash equivalents and short-term investments. It is a useful measure of the progress in generating cash and strengthening of the Group balance sheet position and is a measure widely used by credit rating agencies.
Total indebtedness Borrowings less cash and related hedges
• Net debt from Tesco Bank • Present value of future minimum
lease payments under non-cancellable operating leases
• IAS 19 deficit in the pension schemes
Page 9 • Total indebtedness is the net debt plus the IAS 19 deficit in the pension schemes (net of associated deferred tax) plus the present value of future minimum lease payments under non-cancellable operating leases to provide an overall view of the Group’s obligations. It is an important measure of the long term obligations of the Group and is a measure widely used by credit rating agencies.
Total indebtedness ratio
No direct equivalent • Consistent with accounting policy
Page 58 • Total indebtedness ratio is calculated as Total indebtedness divided by EBITDAR. It is a measure of the Group’s ability to meet its payment obligations and is widely used by analysts and credit rating agencies.
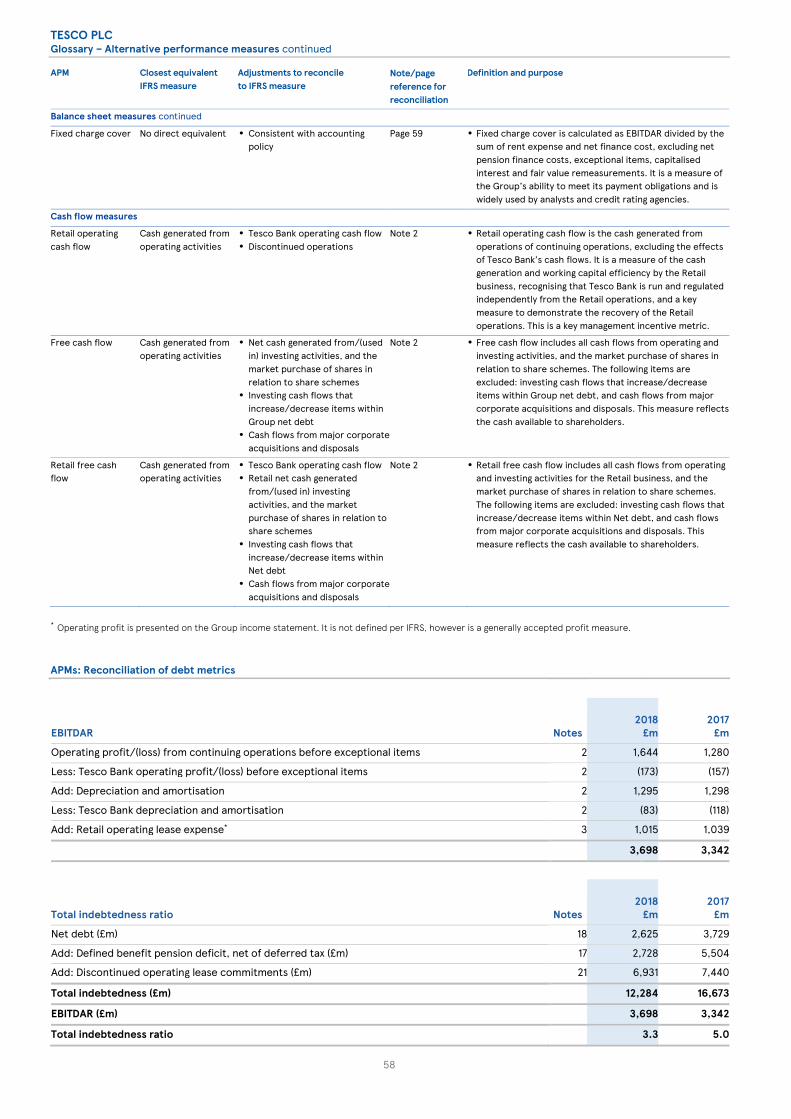
TESCO PLC
58
Glossary – Alternative performance measures continued
APM Closest equivalent IFRS measure
Adjustments to reconcile to IFRS measure
Note/page reference for reconciliation
Definition and purpose
Balance sheet measures continued
Fixed charge cover No direct equivalent • Consistent with accounting policy
Page 59 • Fixed charge cover is calculated as EBITDAR divided by the sum of rent expense and net finance cost, excluding net pension finance costs, exceptional items, capitalised interest and fair value remeasurements. It is a measure of the Group’s ability to meet its payment obligations and is widely used by analysts and credit rating agencies.
Cash flow measures
Retail operating cash flow
Cash generated from operating activities
• Tesco Bank operating cash flow • Discontinued operations
Note 2 • Retail operating cash flow is the cash generated from operations of continuing operations, excluding the effects of Tesco Bank’s cash flows. It is a measure of the cash generation and working capital efficiency by the Retail business, recognising that Tesco Bank is run and regulated independently from the Retail operations, and a key measure to demonstrate the recovery of the Retail operations. This is a key management incentive metric.
Free cash flow Cash generated from operating activities
• Net cash generated from/(used in) investing activities, and the market purchase of shares in relation to share schemes
• Investing cash flows that increase/decrease items within Group net debt
• Cash flows from major corporate acquisitions and disposals
Note 2 • Free cash flow includes all cash flows from operating and investing activities, and the market purchase of shares in relation to share schemes. The following items are excluded: investing cash flows that increase/decrease items within Group net debt, and cash flows from major corporate acquisitions and disposals. This measure reflects the cash available to shareholders.
Retail free cash flow
Cash generated from operating activities
• Tesco Bank operating cash flow • Retail net cash generated
from/(used in) investing activities, and the market purchase of shares in relation to share schemes
• Investing cash flows that increase/decrease items within Net debt
• Cash flows from major corporate acquisitions and disposals
Note 2 • Retail free cash flow includes all cash flows from operating and investing activities for the Retail business, and the market purchase of shares in relation to share schemes. The following items are excluded: investing cash flows that increase/decrease items within Net debt, and cash flows from major corporate acquisitions and disposals. This measure reflects the cash available to shareholders.
* Operating profit is presented on the Group income statement. It is not defined per IFRS, however is a generally accepted profit measure.
APMs: Reconciliation of debt metrics EBITDAR
Notes 2018
£m 2017
£m
Operating profit/(loss) from continuing operations before exceptional items 2 1,644 1,280
Less: Tesco Bank operating profit/(loss) before exceptional items 2 (173) (157)
Add: Depreciation and amortisation 2 1,295 1,298
Less: Tesco Bank depreciation and amortisation 2 (83) (118)
Add: Retail operating lease expense* 3 1,015 1,039
3,698 3,342
Total indebtedness ratio
Notes 2018
£m 2017
£m
Net debt (£m) 18 2,625 3,729
Add: Defined benefit pension deficit, net of deferred tax (£m) 17 2,728 5,504
Add: Discontinued operating lease commitments (£m) 21 6,931 7,440
Total indebtedness (£m) 12,284 16,673
EBITDAR (£m) 3,698 3,342
Total indebtedness ratio 3.3 5.0

TESCO PLC
59
APMs: Reconciliation of debt metrics continued Fixed cover charge
Notes 2018
£m 2017
£m
Net finance cost (£m) 5 533 765
Less: Net pension finance costs (£m) 5 (162) (113)
Less: Exceptional foreign exchange losses on GBP short-term investments held in overseas entities (£m) 5 (38) (244)
Add: Capitalised interest (£m) 5 2 6
Add: Fair value remeasurements on financial instruments (IAS 39) (£m) 5 23 61
Net finance cost, excluding net pension finance costs, exceptional items, capitalised interest and fair value remeasurements on financial instruments (IAS 39) (£m)
358 475
Add: Retail operating lease expense (£m)* 3 1,015 1,039
1,373 1,514
EBITDAR (£m) 3,698 3,342
Fixed charge cover 2.7 2.2
* Group operating lease expense of £1,018m (2017: £1,043m) includes £3m (2017: £4m) relating to Tesco Bank
Glossary - Other
Capital expenditure (Capex) The additions to property, plant and equipment, investment property and intangible assets (excluding assets acquired under business combinations).
Capital employed Net assets plus net debt plus dividend creditor less net assets of the disposal groups and non-current assets classified as held for sale.
Enterprise Value This is calculated as market capitalisation plus net debt.
FTE FTE refers to full-time equivalents.
LPI LPI refers to Limited Price Inflation.
Market capitalisation The total value of all Tesco shares calculated as total number of shares multiplied by closing share price at year-end.
MTN MTN refers to Medium Term Note.
Net Promoter Score (NPS) This is a loyalty measure based on a single question requiring a score between 0-10. The NPS is calculated by subtracting the percentage of detractors (scoring 0-6) from the percentage of promoters (scoring 9-10). This generates a figure between -100 and 100 which is the NPS.
Return on capital employed (ROCE) Return divided by the average of opening and closing capital employed.
Return Profit before exceptional items and interest, after tax (applied at effective rate of tax).
RPI RPI refers to Retail Price Index.
Total shareholder return The notional annualised return from a share, measured as the percentage change in the share price, plus the dividends paid with the gross dividends, reinvested in Tesco shares. This is measured over both a one and five year period.
TESCO PLC
60
Independent auditor’s report to the members of Tesco PLC on the Preliminary Announcement of Tesco PLC
As the independent auditor of Tesco PLC (the “Group”) we are required by UK Listing Rule LR 9.7A.1(2)R to agree to the publication of the Group’s preliminary announcement statement of annual results for the period ended 24 February 2018.
The preliminary statement of annual results for the period ended 24 February 2018 includes: disclosures required by the Listing Rules, Group headlines, CEO’s statement, like-for-like sales performance, headline Group results, financial results, Group income statement, Group statement of comprehensive income/(loss), Group balance sheet, Group statement of changes in equity, Group cash flow statement and notes to the consolidated financial statements. We are not required to agree to the publication of presentations to analysts and trading statements.
The Directors of the Group are responsible for the preparation, presentation and publication of the preliminary statement of annual results in accordance with the UK Listing Rules.
We are responsible for agreeing to the publication of the preliminary statement of annual results, having regard to the Financial Reporting Council’s Bulletin “The Auditor's Association with Preliminary Announcements made in accordance with UK Listing Rules”.
Status of our audit of the financial statements
We confirm that we have issued an unqualified opinion on the full financial statements of Tesco PLC.
Our audit report on the Group financial statements sets out the following risks of material misstatement which had the greatest effect on our audit strategy; the allocation of resources in the audit; and directing the efforts of the engagement team, together with how our audit responded to those key audit matters:
STORE IMPAIRMENT REVIEW
Key audit matter description
The Group held £18,521m (2016/17: £18,108m) of property, plant and equipment at 24 February 2018.
Under IFRS, the Group is required to complete an impairment review of its store portfolio where there are indicators of impairment or impairment reversal.
Judgement is required in identifying indicators of impairment and estimation is required in determining the recoverable amount of the Group’s store portfolio. Additionally, there is judgement in relation to triggering the reversals of impairments recognised in previous periods.
There is a risk that the carrying value of stores and related fixed assets may be higher than the recoverable amount. Where a review for impairment, or reversal of impairment, is conducted, the recoverable amount is determined based on the higher of ‘value-in-use’ and ‘fair value less costs of disposal’.
The three areas which are key to management’s impairment review are as follows: - value-in-use is derived from cash flow projections which rely upon Directors’ assumptions and estimates of future trading
performance, including the Group’s ability to realise forecast cost savings; - value-in-use is calculated by a number of complex models. There is a risk the models are not calculating the value-in-use
accurately; and - in certain circumstances the fair value of properties supports the carrying value of store assets. There is an estimation
required in determining the fair value of properties in each of the Group’s territories.
As a result of the Group’s store impairment review completed during the year, a net impairment reversal of £187m (2016/17: net impairment reversal of £6m) was recognised.
How the scope of our audit responded to the key audit matter Our audit procedures included assessing the design and implementation of key controls around the impairment review processes.
In relation to the Directors’ value-in-use assessment our procedures have included:
- challenging the key assumptions utilised in the cash flow forecasts with reference to historical trading performance, market expectations and our understanding of the Group’s strategic initiatives;
- reviewing and challenging the adequacy of the management’s sensitivity analysis in relation to key assumptions to consider the extent of change in those assumptions that either individually or collectively would be required for the assets to be impaired, in particular forecast cash flows and property fair values; and
- assessing the accuracy of the ‘value-in-use’ modelling by the Group by assessing the methodology applied in determining the value in use compared with the requirements of IAS 36 ‘Impairment of Assets’ and checking the integrity of the value-in-use models utilised by the Group.
In relation to the Group’s ‘fair value less costs of disposal’, we have challenged the assumptions used by the Group in determining the fair market value of the assets, including those completed by external valuers, using internal property valuation specialists and assessing whether appropriate valuation methodologies have been applied.
Key observations
Whilst we note actions are required by the Group to achieve these forecasts over the medium term, we concluded that the assumptions in the impairment models, specifically in the value-in-use calculations, were within an acceptable range, and that the overall level of net reversal of impairment was reasonable.
TESCO PLC
61
Independent auditor’s report to the members of Tesco PLC on the Preliminary Announcement of Tesco PLC RECOGNITION OF COMMERCIAL INCOME
Key audit matter description
The Group has agreements with suppliers whereby volume-related allowances, promotional and marketing allowances and various other fees and discounts are received in connection with the purchase of goods for resale from those suppliers. As such, the Group recognises a reduction in cost of sales as a result of amounts receivable from suppliers.
In accordance with IFRS, commercial income should only be recognised as income within the income statement when the performance conditions associated with it have been met, for example where the marketing campaign has been held.
The variety and number of the buying arrangements with suppliers can make it complex to determine the performance conditions associated with the income, giving rise to a requirement for management judgement and scope for error in accounting for such income. As such we have identified this as a key audit matter.
How the scope of our audit responded to the key audit matter
We obtained a detailed understanding and evaluated the design and implementation of controls that the Group has established in relation to commercial income.
In addition, our substantive audit procedures across the Group’s retail operations included a combination of the following:
- testing whether amounts recognised were accurate and recorded in the correct period based on the contractual performance obligations by agreeing a sample of individual supplier agreements;
- testing commercial income balances included within inventories and trade and other receivables, or netted against trade and other payables via balance sheet reconciliation procedures;
- circularising a sample of suppliers to test whether the arrangements recorded were complete and held discussions with a sample of buyers to further understand the buying processes, where required. Where responses from suppliers were not received, we completed alternative procedures such as agreement to underlying contractual arrangements;
- using data analytics to profile commercial income, identifying deals which exhibited characteristics of audit interest upon which we completed detailed testing;
- reviewing the Group’s ongoing compliance with the Groceries Supplier Code of Practice (GSCOP). Additionally, reviewing the reporting and correspondence to the Group’s supplier hotline in order to identify any areas where further investigation was required; and
- also considering the adequacy of the commercial income related disclosure within the Group’s financial statements.
Key observations
The results of our testing were satisfactory. We consider the disclosure given around supplier rebates to provide an appropriate understanding of the types of rebate income received and the impact on the Group’s balance sheet as at 24 February 2018.
INVENTORY VALUATION
Key audit matter description
The Group carries inventory at the lower of cost and net realisable value. As at 24 February 2018, the Group held inventories of £2,263m (2016/17: £2,301m).
The Group provides for obsolescence based on forecast inventory usage. This methodology relies upon assumptions made in determining appropriate provisioning percentages to apply to inventory balances.
How the scope of our audit responded to the key audit matter
We obtained a detailed understanding and evaluated the design and implementation of controls that the Group has established in relation to inventory valuation.
We obtained assurance over the appropriateness of management’s assumptions applied in calculating the value of inventory provisions by:
- critically assessing the Group’s inventory provisioning policy, with specific consideration given to aged inventory (especially for non-food and general merchandising products) as well as stock turn calculations, including the impact of seasonality;
- verifying the value of a sample of inventory to confirm whether it is held at the lower of cost and net realisable value, through comparison to vendor invoices and sales prices;
- using data analytics to identify unusual inventory usage characteristics, completing assumption tolerance testing and recalculating the provision in totality based on the Group’s policy; and
- reviewing historical accuracy of inventory provisioning with reference to inventory write-offs during the year in relation to stock loss or other inventory adjustments.
Key observations
We concur that the total level of provision is within an acceptable range.

TESCO PLC
62
Independent auditor’s report to the members of Tesco PLC on the Preliminary Announcement of Tesco PLC PENSION OBLIGATION VALUATION
Key audit matter description
The Group has a defined benefit pension plan in the UK. At 24 February 2018, the Group recorded a net retirement obligation before deferred tax of £3,282m (2016/17: £6,621m), comprising scheme assets of £13,235m (2016/17: £13,196m) and scheme liabilities of £16,517m (2016/17: £19,817m).
The Group has, after taking actuarial advice, decided to change the methodology used for deriving the discount rate for valuing the Group's pension liabilities under IAS 19 “Employee Benefits”.
The pension valuation is dependent on market conditions and assumptions made. The key audit matter specifically relates to the following key assumptions: discount rate, inflation expectations and life expectancy assumptions. The setting of these assumptions is complex and requires the exercise of significant management judgement with the support of third party actuaries.
How the scope of our audit responded to the key audit matter
We obtained a detailed understanding and evaluated the design and implementation of controls that the Group has established in relation to the pension obligation valuation process.
In testing the pension valuation, we have utilised internal pension actuarial specialists to review the key actuarial assumptions used, both financial and demographic, and considered the methodology utilised to derive these assumptions. Furthermore, we have benchmarked and performed a sensitivity analysis on the key assumptions determined by the Directors.
We have challenged the Group's decision to change the discount rate methodology with reference to developing market practice, the age of the pension scheme and advice from our actuarial specialists.
Key observations
We are satisfied that the methodology and assumptions applied in relation to determining the pension valuation are within an acceptable range.
We consider the change in methodology for establishing the discount rate to be acceptable and compliant with accounting standards. The actual discount rate applied of 2.9% is within our benchmark range. We note that the methodology used by the Group applies a different approach to the observable yields on high quality corporate bonds compared with our benchmark approach, which results in a discount rate which is at the optimistic end of our acceptable range.
CONTINGENT LIABILITIES
Key audit matter description
In 2016/17 UK shareholder actions were initiated against the Group linked to the overstatement of expected profits in 2014 which may result in legal exposures.
Additionally, the Group has other ongoing legal matters relating to previous corporate transactions which require management judgement to be applied in order to determine the likely outcome.
Judgement is required in assessing the nature of these exposures and their accounting and disclosure requirements.
How the scope of our audit responded to the key audit matter
In assessing the potential exposures to the Group, we have completed a range of procedures including:
- assessing the design and implementation of controls in relation to the monitoring of known exposures; - reading Board and other meeting minutes to identify areas subject to Group consideration; - meeting with the Group’s internal legal advisors in understanding ongoing and potential legal matters impacting the Group; - reviewing third party correspondence and reports; and - reviewing the proposed accounting and disclosure of actual and potential legal liabilities, drawing on third party
assessment of open matters.
Key observations
We concur that the accounting and disclosures in relation to the ongoing UK shareholder actions are appropriate.
In relation to other ongoing legal matters in respect of previous corporate transactions, we are satisfied no specific disclosure is required.
TESCO PLC
63
Independent auditor’s report to the members of Tesco PLC on the Preliminary Announcement of Tesco PLC PRESENTATION OF THE GROUP’S INCOME STATEMENT
Key audit matter description
One of the Group’s key performance indicators is ‘Group operating profit before exceptional items’. The key audit matter is that Group management may override the Group’s accounting policy application guidance to manipulate this key performance indicator.
Management judgement is required when applying this accounting policy and when determining classification within the Group’s income statement and assessing the Group’s overall quality of earnings.
How the scope of our audit responded to the key audit matter
In order to address this key audit matter we have completed audit procedures including:
- assessing the design and implementation of controls which address the risk of inappropriate presentation of the Group’s income statement, such as the ‘entity level’ controls which underpin the overall control environment for the Group and specific controls over determining the presentation of exceptional items.
- auditing key areas of management estimate and judgement, including consideration of exceptional items disclosed by the Group and the existence of any further potential exceptional items included within the Group’s underlying profit measures; and
- assessing transactions completed outside of the normal course of business.
Key observations
We note that consistent with other businesses of a similar scale to the Group, there are non-recurring income and expense items included within profit before exceptional items which do not meet the Group’s definition of exceptional items and which largely offset. We concur that these have been appropriately included within profit before exceptional items.
RETAIL TECHNOLOGY ENVIRONMENT, INCLUDING IT SECURITY
Key audit matter description
The Group’s retail operations utilise a range of information systems. In 2015/16 and 2016/17 we reported deficiencies in certain IT controls. These deficiencies could have an adverse impact on the Group’s controls and financial reporting systems.
The Group is continuing the replacement of a number of the Group’s key systems and making changes to key elements of the Group’s IT infrastructure to address the identified deficiencies.
How the scope of our audit responded to the key audit matter
We continued to challenge and assess changes to the IT environments outside of the UK through the testing of remediated controls and concluding on the sufficiency and appropriateness of management's changes.
During the year we have assessed the design and implementation of the Group’s controls over the information systems that are important to financial reporting, including the changes made as part of the Group’s replacement programme.
Consistent with 2016/17, in 2017/18 we were not able to take a control reliant audit approach due to the ongoing weaknesses in the IT environment.
Where we noted deficiencies which affected applications and databases within the scope of our audit, we extended the scope of our substantive audit procedures.
Key observations
Although management’s remediation plan is designed to address our concerns, given the complexity of the underlying systems the plan is a multi-year programme and not yet complete, and therefore weaknesses remain in the control environment.
We note that management’s actions have reduced the number of deficiencies in the year relating to user access and change management controls linked to the Group’s financial reporting.
These matters were addressed in the context of our audit of the financial statements as a whole, and in forming our opinion thereon, and we did not provide a separate opinion on these matters.
TESCO PLC
64
Independent auditor’s report to the members of Tesco PLC on the Preliminary Announcement of Tesco PLC
Procedures performed to agree to the Preliminary Announcement of annual results
In order to agree to the publication of the Preliminary Announcement of annual results of the Group we carried out the following procedures: (a) checked that the figures in the Preliminary Announcement covering the full year have been accurately extracted from the audited
financial statements and reflect the presentation to be adopted in the audited financial statements; (b) considered whether the information (including the management commentary) is consistent with other expected contents of the annual
report; (c) considered whether the financial information in the Preliminary Announcement is misstated; (d) considered whether the Preliminary Announcement includes a statement by the Directors as required by section 435 of CA 2006 and
whether the Preliminary Announcement includes the minimum information required by UKLA Listing Rule 9.7A.1; (e) where the Preliminary Announcement includes alternative performance measures (“APMs”), considered whether appropriate
prominence is given to statutory financial information and whether: • the use, relevance and reliability of APMs has been explained; • the APMs used have been clearly defined, and have been given meaningful labels reflecting their content and basis of calculation; • the APMs have been reconciled to the most directly reconcilable line item, subtotal or total presented in the financial statements of the corresponding period; and • comparatives have been included, and where the basis of calculation has changed over time this is explained.
(f) read the management commentary, any other narrative disclosures and any final interim period figures and considered whether they are fair, balanced and understandable.
Use of our report
Our liability for this report, and for our full audit report on the financial statements is to the Company’s members as a body, in accordance with Chapter 3 of Part 16 of the Companies Act 2006. Our audit work has been undertaken so that we might state to the Company’s members those matters we are required to state to them in an auditor’s report and for no other purpose. To the fullest extent permitted by law, we do not accept or assume responsibility to anyone other than the Company and the Company’s members as a body, for our audit work, for our audit report or this report, or for the opinions we have formed. Panos Kakoullis (Senior statutory auditor) For and on behalf of Deloitte LLP Statutory Auditor London, United Kingdom 10 April 2018

TESCO PLC
65
Appendix 1
Total sales performance at actual rates (exc. VAT, exc. fuel)
1Q
2017/18 2Q
2017/18 3Q
2017/18 4Q
2017/18 1H
2017/18 2H
2017/18 FY
2017/18 UK & ROI 2.0% 2.5% 2.7% 2.9% 2.2% 2.8% 2.5%
UK 1.6% 2.1% 2.5% 2.3% 1.8% 2.4% 2.1%
ROI 9.2% 10.0% 7.1% 13.3% 9.6% 10.2% 9.9%
Central Europe 8.4% 8.8% 3.1% 4.5% 8.6% 3.8% 6.1% Asia 8.5% (4.0)% (8.9)% (11.5)% 2.0% (10.3)% (4.4)%
Tesco Bank 4.8% 4.8% 4.9% 1.1% 4.8% 3.0% 3.9% Group 3.4% 2.7% 1.6% 1.5% 3.0% 1.6% 2.3%
Appendix 2 Total sales performance at constant rates (exc. VAT, exc. fuel)
1Q
2017/18 2Q
2017/18 3Q
2017/18 4Q
2017/18 1H
2017/18 2H
2017/18 FY
2017/18 UK & ROI 1.4% 2.1% 2.5% 2.7% 1.8% 2.6% 2.2% UK 1.6% 2.1% 2.5% 2.4% 1.8% 2.4% 2.1%
ROI 0.0% 2.1% 3.8% 9.4% 1.1% 6.6% 3.9%
Central Europe (1.7)% (1.2)% (1.3)% (2.0)% (1.4)% (1.7)% (1.6)%
Asia (4.8)% (10.8)% (9.6)% (12.4)% (7.7)% (11.1)% (9.4)% Tesco Bank 4.8% 4.8% 4.9% 1.1% 4.8% 3.0% 3.9%
Group 0.5% 0.4% 0.9% 0.5% 0.5% 0.7% 0.6%
These results have been reported on a continuing operations basis and exclude the results from the Group’s operations in Turkey. Growth rates are all based on comparable days. Notes
As part of a routine review of revenue streams, the Group has identified a number of small sales sub-categories, in Asia and Central Europe, where Tesco is viewed as acting more as a selling agent than as a retailer principal. A change was therefore made in the current year to reflect the net commission on these sales, instead of the previous presentation of the gross revenue and cost of sales separately. While this change was adopted in the fourth quarter, the total sales growth performance measures for each prior quarter in Appendices 1 and 2 above, have been adjusted to reflect this change with an impact of c.(0.2)% at Group level.
Appendix 3 Country detail - Retail
Revenue
(exc. VAT, inc. fuel)*
Local
currency (m) £m
Average exchange rate
Closing exchange rate
UK 42,644 42,644 1.0 1.0 ROI 2,572 2,264 1.1 1.1 Czech Republic 43,680 1,474 29.6 28.8 Hungary 577,204 1,641 351.7 355.5 Poland 10,580 2,202 4.8 4.7 Slovakia 1,404 1,236 1.1 1.1 Malaysia 4,370 791 5.5 5.5 Thailand 181,754 4,156 43.7 43.9
* Excludes franchising revenue within Central Europe of £32m, which is not allocated to individual countries.

TESCO PLC
66
Appendix 4
UK sales area by size of store
Store size (sq ft) February 2018 February 2017
No. of stores
Million sq ft
% of total sq ft
No. of stores
Million sq ft
% of total sq ft
0 – 3,000 2,512 5.2 13.1 2,507 5.2 13.1 3,001 – 20,000 284 3.4 8.5 288 3.4 8.6 20,001 – 40,000 284 8.2 20.6 283 8.2 20.5 40,001 – 60,000 182 9.4 23.6 182 9.4 23.5 60,001 – 80,000 120 8.5 21.4 120 8.6 21.5 80,001 – 100,000 45 4.2 10.6 45 4.2 10.6 Over 100,000 8 0.9 2.2 8 0.9 2.2
Total* 3,435 39.8 100.0 3,433 39.9 100.0
* Excludes franchise stores.
Appendix 5
Actual Group space – store numbers(a)
2016/17
year-end Openings
Closures/ disposals
Net gain/ (reduction)(b)
2017/18 Year-end
Repurposing/ extensions
Extra 252 - - - 252 20
Superstore 479 2 (1) 1 480 -
Metro 176 - (4) (4) 172 -
Express 1,740 11 (2) 9 1,749 -
Dotcom only 6 - - - 6 -
Total Tesco 2,653 13 (7) 6 2,659 20
One Stop(c) 780 11 (15) (4) 776 -
UK(c) 3,433 24 (22) 2 3,435 20
ROI 148 2 - 2 150 -
UK & ROI(c) 3,581 26 (22) 4 3,585 20
Czech Republic(c) 198 2 (11) (9) 189 6
Hungary 206 - - - 206 4
Poland 429 - (14) (14) 415 4
Slovakia 154 - (3) (3) 151 1
Central Europe(c) 987 2 (28) (26) 961 15
Malaysia 71 2 (1) 1 72 4
Thailand 1,914 67 (30) 37 1,951 30
Asia 1,985 69 (31) 38 2,023 34
Group(c) 6,553 97 (81) 16 6,569 69
UK (One Stop) 158 19 (8) 11 169 -
Czech Republic 98 2 (3) (1) 97 -
Franchise stores 256 21 (11) 10 266 -
(a) Continuing operations. (b) The net gain/(reduction) reflects the number of store openings less the number of store closures/disposals. (c) Excludes franchise stores.

TESCO PLC
67
Appendix 5 continued Actual Group space – ‘000 sq ft(a)
2016/17
year-end Openings
Closures/ disposals
Repurposing/ extensions(c)
Net gain/ (reduction)
As at 24 February
2018 Extra 17,748 - - (76) (76) 17,672
Superstore 14,075 37 (15) - 22 14,097
Metro 1,993 - (32) - (32) 1,961
Express 4,054 24 (4) - 20 4,074
Dotcom only 716 - - - - 716
Total Tesco 38,586 61 (51) (76) (66) 38,520
One Stop(b) 1,269 21 (24) - (3) 1,266
UK(b) 39,855 82 (75) (76) (69) 39,786
ROI 3,543 22 - 1 23 3,566
UK & ROI(b) 43,398 104 (75) (75) (46) 43,352
Czech Republic(b) 5,479 2 (166) (256) (420) 5,059
Hungary 6,896 - - (58) (58) 6,838
Poland 9,578 - (146) (151) (297) 9,281
Slovakia 3,859 11 (123) (27) (139) 3,720
Central Europe(b) 25,812 13 (435) (492) (914) 24,898 Malaysia 4,005 64 (60) (179) (175) 3,830
Thailand 15,522 413 (115) (348) (50) 15,472
Asia 19,527 477 (175) (527) (225) 19,302
Group(b) 88,737 594 (685) (1,094) (1,185) 87,552
UK (One Stop) 212 24 (12) - 12 224
Czech Republic 92 2 (2) - - 92
Franchise stores 304 26 (14) - 12 316
(a) Continuing operations. (b) Excludes franchise stores. (c) Repurposing of gross selling space is not included in the above net selling space measure.

TESCO PLC
68
Appendix 5 continued Group space forecast to 23 February 2019 – ‘000 sq ft(a)
2017/18
year-end Openings
Closures/ disposals
Repurposing/extensions
Net gain/ (reduction)
2018/19 year-end
Extra 17,672 - - - - 17,672
Superstore 14,097 28 - - 28 14,125
Metro 1,961 - - - - 1,961
Express 4,074 95 (23) - 72 4,146
Dotcom only 716 - - - - 716
Total Tesco 38,520 123 (23) - 100 38,620 One Stop(b) 1,266 37 (32) - 5 1,271
UK(b) 39,786 160 (55) - 105 39,891 ROI 3,566 81 - - 81 3,647
UK & ROI(b) 43,352 241 (55) - 186 43,538
Czech Republic(b) 5,059 13 (285) (108) (380) 4,679
Hungary 6,838 - (28) (314) (342) 6,496
Poland 9,281 - (243) (235) (478) 8,803
Slovakia 3,720 39 (86) (119) (166) 3,554
Central Europe(b) 24,898 52 (642) (776) (1,366) 23,532 Malaysia 3,830 43 (88) (40) (85) 3,745
Thailand 15,472 596 - (211) 385 15,857
Asia 19,302 639 (88) (251) 300 19,602
Group(b) 87,552 932 (785) (1,027) (880) 86,672
UK (One Stop) 224 52 - - 52 276
Czech Republic 92 4 - - 4 96
Franchise stores 316 56 - - 56 372
(a) Continuing operations. (b) Excludes franchise stores.

TESCO PLC
69
Appendix 6 Tesco Bank income statement
2018(a)
£m 2017(a)
£m Revenue
Interest receivable and similar income 673 622
Fees and commissions receivable 378 390
1,051 1,012 Direct costs
Interest payable (176) (175)
Fees and commissions payable (22) (23)
(198) (198)
Gross profit 853 814 Other expenses:
Staff costs (174) (165)
Premises and equipment (77) (76)
Other administrative expenses (209) (215)
Depreciation and amortisation (83) (96)
Provisions for bad and doubtful debts (137) (105)
Operating profit before exceptional items 173 157
Exceptional items(b) (24) (80)
Operating profit 149 77
Net finance costs: movements on derivatives and hedge accounting 11 6
Net finance costs: interest (4) (4)
Share of profit/(loss) of joint venture 10 (16)
Profit before tax 166 63
(a) These results are for the 12 months ended 28 February 2018 and the previous period represents the 12 months ended 28 February 2017. (b) Exceptional items in 2018 consist of an increase in PPI provision of £35m partially offset by a decrease in CCA provision of £1m and a credit of £10m
received following the conclusion of negotiations with a third party in respect of previously recognised customer redress.