tesi completa 2
TRANSCRIPT
UNIVERSITY OF TRIESTE
XXIIIrd
CYCLE of the DOCTORATE in NEUROSCIENCE and
COGNITIVE SCIENCE – NEUROBIOLOGY
BDNF TRANSLATIONAL CONTROL AS A THERAPEUTIC
TARGET IN RETT SYNDROME
(BIO-06)
CANDIDATE
Valentina Vaghi
COORDINATOR
PROF. Pierpaolo BATTAGLINI
University of Trieste
SUPERVISOR
PROF. Enrico TONGIORGI
University of Trieste
ACADEMIC YEAR 2009/2010

Index
Introduction ............................................................................................................................................ 1
Clinical features of RTT........................................................................................................................ 2
Genetic basis of RTT ............................................................................................................................ 7
Phenotypic variability in RTT........................................................................................................... 9
MeCP2 mutations in males ........................................................................................................... 13
The MeCP2 duplication disorder................................................................................................... 14
MeCP2 mutations in other neuropsychiatric disorders ................................................................ 14
MeCP2 ................................................................................................................................................... 16
MeCP2 gene structure ...................................................................................................................... 16
The structural domain of MECP2 protein ......................................................................................... 17
MeCP2 mechanism of action ............................................................................................................ 18
Spatial and temporal profiles of MeCP2 expression......................................................................... 20
MeCP2 dysfunction during brain development ................................................................................ 21
Modeling RTT and related disorders in mice .................................................................................... 25
MECP2 target genes and relevance to RTT pathogenesis................................................................. 28
MECP2 regulates gene expression in an activity-dependent manner (BDNF).............................. 30
Brain Derived Neurotrophic Factor (BDNF)........................................................................................... 35
BDNF function and signaling ............................................................................................................. 36
BDNF gene structure ......................................................................................................................... 39
BDNF expression regulation.............................................................................................................. 41
BDNF transcriptional regulation.................................................................................................... 41
BDNF translational regulation....................................................................................................... 43
Therapeutic approaches to RTT ............................................................................................................ 49
Rescue via MeCP2 overexpression.................................................................................................... 49
Rescue via BDNF overexpression ...................................................................................................... 50
Pharmacological treatment for RTT .................................................................................................. 52
Clinical trials for RTT.......................................................................................................................... 53
Current projects for Rett Syndrome.................................................................................................. 53
Aims....................................................................................................................................................... 55
Materials and methods ......................................................................................................................... 56
Animals.............................................................................................................................................. 56
Barrel cortex neuroanatomical analysis............................................................................................ 56
RNA extraction and cDNA preparation ............................................................................................. 58
Total extracts preparation and Western Blot analysis...................................................................... 58
Cell line.............................................................................................................................................. 59
Lipofectamine transfection ............................................................................................................... 60
Cloning and generation of Luciferase constructs pN1-RLuc and pN1-FLuc ...................................... 61
Dual luciferase assay ......................................................................................................................... 63
Cells treatments ................................................................................................................................ 64
MTT Viability Assay ........................................................................................................................... 65
Semi-quantitative PCR....................................................................................................................... 66
Real time PCR .................................................................................................................................... 66
Cell count analysis of sh-MeCP2 efficiency ....................................................................................... 68
Bioinformatic analysis of RNA sequences ......................................................................................... 68
Results and discussion........................................................................................................................... 69
Effects of MeCP2 deletion on body weight and brain weight in C57/BL6 mice. .............................. 69
BDNF specific isoforms expression in MeCP2-/Y
mice brains............................................................. 73
BDNF specific isoforms expression in RTT patients brains................................................................ 76
qRT-PCR experiments on human brain samples ............................................................................... 79
MeCP2 silencing in SH-SY5Y neuroblastoma cell line ....................................................................... 81
BDNF specific isoforms expression in MeCP2-knocked down SHSY-5Y cells .................................... 84
Investigating BDNF translatability..................................................................................................... 86
Response of BDNF 5’UTR splice variants to different agonists......................................................... 90
Response of BDNF CDS and 3’UTR variants to different agonists..................................................... 93
Regulation of the signaling cascade for BDNF protein production................................................... 95

Desipramine and Mirtazapine effect on BDNF isoforms translation ................................................ 99
Conclusions ......................................................................................................................................... 102
Bibliography ........................................................................................................................................ 109

Introduction
1
Introduction
In 1954, Dr. Andreas Rett, a pediatrician in Vienna, Austria, first noticed two girls insistently
wringing their hands as they sat in the laps of their respective mothers in the waiting room of the
pediatric clinic. He observed these children making the same repetitive hand-washing motions.
Curious, he compared their clinical and developmental histories and discovered they were very
similar. This coincidental occurrence prompted Dr. Andreas Rett to search for more patients with the
same unusual behavior. Dr. Rett checked with his nurse and learned that he had six other girls with
similar behavior in his practice. Surely, he thought, all these girls must have the same disorder. Not
satisfied with studying his own patients, Dr. Rett made a film of these girls and traveled throughout
Europe seeking other children with these symptoms. A year later, in 1966, Dr. Rett described similar
findings in 22 patients, reporting for the first time a unique clinical entity that now bears his name
(Rett, 1966). But it would not be until 17 years later that Rett syndrome (RTT) became recognized in
the medical community when Dr. Bengt Hagberg, a Swedish neurologist, and his colleagues reported
35 cases of RTT in the English language (Hagberg 1985), and recognized this clinical entity as a
condition “similar to a virtually overlooked syndrome described by Rett in the German literature.”
In addition to the worldwide recognition of RTT, the 1980’s witnessed major strides in
another field, namely DNA methylation. For the first time, a connection was established between
DNA methylation and heritable changes in gene expression: the process of DNA methylation is one of
the main actor of the “epigenetic” regulation of gene expression. The term “epigenetic”, which
literally means “outside conventional genetics”, is used to describe the study of stable alteration in
gene expression potential that arise during development and cell proliferation (Jaenisch and Bird
2003). It was proposed in 1975 that DNA methylation could be responsible for the stable
maintenance of a particular gene expression pattern through mitotic cell division. Since then ample
evidence has been obtained to support this concept, and DNA methylation is now recognized to be a
chief contributor to the stability of gene expression state. Specifically, DNA methylation establishes a
silent chromatin state by collaborating with proteins that modify nucleosomes. Scientists identified
the cytosines residues of the dinucleotide sequence CpG to be the site of almost all DNA methylation
in mammalian genomes and began to explore the effects of this modification on gene activity. CpG
islands were found to be unmethylated in native state (with the exception of sequences on the
inactive X chromosome), and methylation of CpGs was associated with gene silencing and alteration
in chromatin structure. Two mechanisms have been reported for DNA methylation-mediated gene
repression. The first suggest that methylation of CpG sites within gene promoters will inhibit
sequence-specific binding of transcription factors. In the second, more prevalent mechanism, the
repression is mediated by proteins that specifically bind to methylated CpGs (methyl- CpG binding
Introduction
2
proteins) and alter chromatin structures, rendering it inaccessible to members of the transcription
machinery. In 1992, the group of Dr. Adrian Bird identified a novel mammalian protein that binds to
methylated CpGs, called metyl-CpG binding protein 2 (MeCP2) (Lewis et al. 1992). They reported the
identification, purification and cDNA cloning of MeCP2 , they showed that this new protein is able to
bind to DNA that contains a single methyl-CpG pair and that the distribution of MeCP2 along the
chromosomes parallels that of methyl-CpG. In 1994, Dr. Quadreri and colleagues showed that the
gene encoding MeCP2 was localized to the X-chromosome in mouse (Quaderi et al. 1994) and 3
years later it was demonstrated that this protein is able to repress transcription in vitro (Nan et al.
1998). Meanwhile, as the DNA metylation field was unraveling repression mechanisms mediated by
MeCP binding proteins, the RTT community was trying to understand the pathophysiology of this
condition. The turning point for RTT research came in 1999 with the discovery of its genetic basis. In
1999, Amir and colleagues came to the striking finding that mutations in the widely expressed
MECP2 are responsible for RTT, bringing together the field of epigenetics and neurobiology(Amir et
al. 1999).
Clinical features of RTT
RTT (MIM 312750) is a postnatal progressive neurodevelopmental disorder that manifests in
girls during early childhood. RTT has characteristic clinical features, including autistic traits, mental
retardation, postural hypotonia, failure in locomotion, loss of purposeful hand use, stereotyped hand
movements, scoliosis, seizures, and autonomic nervous system disturbance. However, not all the
symptoms are prominent initially, but rather appear sequentially at specific ages (Hagberg 2002).
Initially it has been stressed that the patients are normal until 6-18 months of age although in 2005,
Nomura and colleagues pointed out that the disorder begins very early in infancy, with subtle
symptoms, autistic features and muscle hypotonia (Nomura 2005). The evaluation of the early signs
is important, because they reflect the initial underlying pathophysiology before the changes become
obvious: the most frequent complaints which brought the patients to medical attention is the motor
development delay (Nomura 2005) and on some occasions also a rather sudden onset of autistic
features starting in late infancy to early childhood. One early indicator of neurological involvement is
deceleration of head growth, leading to microcephaly (the circumference of the head is more than
two standard deviations smaller than average for the person's age and sex) by the second year of life.
With the onset of developmental stagnation, the acquired microcephaly is accompanied by general
growth retardation, weight loss, and a weak posture brought on by muscle hypotonia. Early motor
symptoms are discussed in a review article by Dr. M. Segawa (Segawa 2005; Segawa and Nomura

Introduction
3
2005)in which the motor milestones of 38 patients with RTT were evaluated and a delay from infancy
was revealed. Head control was delayed in 5 patients (13,1%) in early infancy and became more
evident in mid infancy in 13 (34,2%). Delay in motor milestones was obvious as regards crawling,
which was delayed in 7 (19,4%) or impossible in 27 patients (71,1%) and walking, which was delayed
in 30 of 38 patients (79,0%). Moreover the patients examined in infancy showed hypotonia of the
muscles of the trunk and of extremities. The gait of RTT is characterized by lack of coordinated
movements of upper extremities. As the syndrome progresses, patients lose purposeful use of their
hands and instead develop stereotypic hand wringing or washing movements, and in some cases
clapping, flapping and mouthing of the hands. Social withdrawal and loss of language become
apparent in addition to irritability and self-abusive behavior. Other autistic features also manifest. As
reported by a 16 cases study by Nomura in 2005 (Nomura 2005), the most frequently observed
behaviors were ‘lack of following and expressionless face’ in 70–80%. ‘Aloneness or indifference’,
‘lack of anticipatory motor adjustment’, and ‘lack of eye-to-eye contact’ were observed in about 2/3
of the cases. ‘Lack of social smiling’, ‘hypersensitivity to sound’, ‘lack of babbling’, ‘no response to
calling’, and ‘no response to peek-a-boo’ were seen in over half of the cases. Babies were often
described as ‘very quiet and good, sleeping longer in daytime’. These features suggest poor
responsiveness to environmental stimulation and abnormal sleep-wake rhythm (S-W-R). The
behavioral characteristics, which appeared after 1 year old in all RTT cases reflected overall mental
retardation. These included ‘speech delay’ or ‘no symbolic play’. ‘Dislikes being intervened while
playing’ was present in only 16.7% because the children did not reach the level of ‘playing’.
Hyperactivity was observed in only 33.3%. Further studies with 36 patients revealed similar results.
Autistic behavior before 1 year, ‘quiet and good baby’ and ‘sleeping well’, were seen in almost all
girls, ‘lack of following parents’ and ‘aloneness or indifference’ were observed in over 50%, and ‘lack
of social smiling’ and ‘expressionless face’ were observed in about 50%. In contrast, the characteristic
behaviors observed after 1 year old were ‘sudden laughing and crying’, ‘absence of the features of
high-functioning autism’, and ‘overlay by severe mental retardation’. These suggest that in contrast
to autism, the autistic features become less prominent as the RTT child becomes older with the
superimposition of severe mental retardation. The onset of metal deterioration is accompanied by
loss of motor coordination and the development of ataxia (gross lack of coordination of muscle
movements) and gait apraxia (loss of the ability to execute or carry out learned purposeful
movements, despite having the desire and the physical ability to perform the movements).
The earliest autonomic perturbation is hyperventilation during wakefulness. Breathing
abnormalities are among the clinical criteria for RTT, and include alternating periods of
hyperventilation and apneas, breath holds, forced and deep breathing as well as apneustic breathing.

Introduction
4
Perhaps the most striking breathing abnormalities are the frequent breath holds and apneas as they
reveal abnormal cardiorespiratory coupling. Recurring breath holds may have another important
consequence for cardiovascular function as they are thought to lead to prolonged QT
syndrome(Guideri et al. 2004; Guideri et al. 2001a; Guideri et al. 2001b; Guideri et al. 2005; Sekul et
al. 1994). Indeed, decreased heart rate variability and prolonged QTc are characteristic features of
RTT patients (Weese-Mayer et al. 2006). Another key feature of the RTT breathing phenotype is its
state-dependency. Respiratory disturbances in RTT are significantly more severe during wakefulness
compared to sleep (Weese-Mayer et al. 2008) and are exacerbated by behavioral arousal. Similarly,
heart rate variability is decreased during the night. Thus, cardiorespiratory dysregulation in RTT
occurs during wakefulness and sleep, but the degree of dysregulation is quantitatively much less
dramatic during night time compared to wakefulness. The state-dependence of breathing
abnormalities in RTT suggests that breathing dysregulation in RTT may result from disturbances in
mechanisms that modulate the respiratory rhythm. Disturbances in neuromodulatory mechanisms
could be responsible in particular for the significant worsening of breathing irregularities during the
day, as well as with behavioral arousal and postnatal maturation (Katz et al. 2009) .
One of the most arduous features of RTT is the occurrence of seizures, which range from
easily controlled to intractable epilepsy, with the most common types being partial complex and
tonic-clonic seizures. In a study of 2006 by Jian and colleagues, 275 cases were analyzed and seizures
were reported in 81% of the cases with a median age of onset around 48 months. In 9% seizure onset
occurred in the first year of life. Seizure onset is influenced by genotype. Some mutations appear to
be associated with a later age of onset of seizures, whereas others may increase the risk of earlier
age of onset (Jian et al. 2006). The seizures tend to decrease in severity after the teenage years and
into adulthood, presenting minor problems after the age of forty.
Amelioration of the social component of the autistic-like behavior occurs sometime between
5 to 10 years of age. Despite having a normal appetite, patients continue to lose weight and many
suffer from osteopenia, scoliosis, and rigidity as they age. Behavioral abnormalities during this
postregression phase have also been frequently reported in the literature (see review by (Mount et
al. 2001), including teeth grinding, night laughing or crying, screaming fits, low mood, and anxiety
episode elicited by distressful external events. In a questionnaire study, Mount et al. (Mount et al.
2002) found that in addition to the diagnostic features of hand stereotypies and breathing
abnormalities, other behavioral abnormalities were more common in girls with RTT than in a
comparison group of girls with severe to profound mental retardation (SMR). These behaviors
included mood fluctuations, signs of fear and anxiety, inconsolable crying and screaming at night,
and repetitive mouth and tongue movements and grimacing (Mount et al. 2003a; Mount et al.
Introduction
5
2003b). Patients suffers devastating motor deterioration and most girls with RTT lose mobility, and
are often wheelchair-bound during the teenage years. Additional autonomic abnormalities are
hypotrophic, cold blue feet, severe constipation, oropharyngeal dysfunction, and cardiac anomalies.
As patients get older they often develop Parkinsonian features (Hagberg 2005) (Roze et al. 2007).
Females with Rett syndrome typically survive into adulthood up to sixty or seventy years of age in
severely debilitated physical condition. The incidence of sudden, unexplained death is significantly
higher than in controls of similar age (Kerr and Julu 1999). This sudden death may in part be caused
by the higher incidence of longer corrected QT intervals, T-wave abnormalities, and reduced heart
rate variability in Rett syndrome (Guideri et al. 1999). The diagnostic criteria to clarify and simplify
the diagnosis of typical, or classic, RTT were revised in 2010 and are reported in Table 1.
Introduction
6
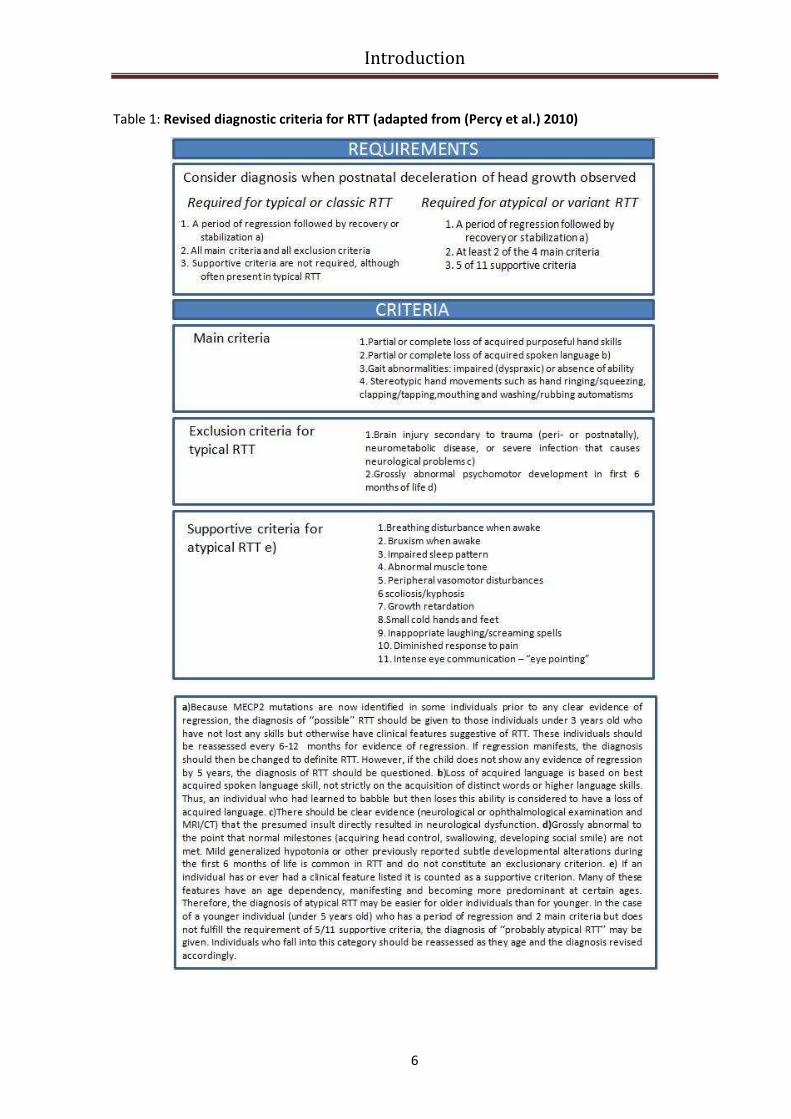
Table 1: Revised diagnostic criteria for RTT (adapted from (Percy et al.) 2010)

Introduction
7
Genetic basis of RTT
Considering that RTT occurs almost exclusively in females, it has been proposed that RTT is
caused by an X-linked dominant mutation with lethality in hemizygous males (Ellison et al. 1992;
Zoghbi 1988). The disorder has an estimated incidence of 1 /10,000 females, and the majority of the
cases are sporadic (Hagberg et al. 1985). A few familial cases with inheritance through maternal lines
have been reported (Zoghbi 1988), and , since more than 99% of RTT cases are sporadic, it was very
hard to map the disease locus by traditional linkage analysis. An alternative linkage approach is that
of exclusion mapping, which relies on concordance/discordance analysis for X chromosome DNA
markers in the families with affected half-sisters. This approach relies on the hypothesis that the
mother is likely a carrier of the RTT syndrome gene because the half-sisters have different fathers.
Accordingly, if RTT is X linked, one would expect both sisters to have concordance for alleles at
markers in the putative RTT region. Discordant regions, indicating that the two sisters have inherited
different maternal alleles, can be excluded. Dr. Ellison and colleagues performed genetic analysis in
two families with affected half-sisters by using more than 60 X chromosome markers which included
standard RFLPs and highly informative short tandem repeats and confirmed that the candidate
region resides on X chromosome. In 1998, studying a Brazilian family with three affected daughter
Dr. Sirianni and colleagues confirmed the X-linked inheritance of the disorder and localized the RTT
gene to Xq28 region.
Finally in 1999, Amir and collaborators, using a systematic mutational analysis of genes
located in Xq28 in RTT patients identified mutations in the gene (MECP2) encoding X-linked methyl-
CpG-binding protein 2 (MeCP2) as the cause of RTT. In this paper they screened genomic DNA from
21 sporadic (all with classic RTT) and 8 familial RTT patients. Among the sporadic patients they
identified three missense mutations, one frameshift mutation and a nonsense mutation (Amir et al.
1999). Considering that all mutations identified are de novo in sporadic cases, one mutation
segregates in familial RTT, all missense mutations change conserved amino acid in the binding
domanin of MeCP2 and both truncating mutations disrupt the catalitic domain of MeCP2, it appeared
evident that mutations in MECP2 are the cause of RTT. In the following years 300 unique pathogenic
nucleotide changes were described (Christodoulou and Weaving 2003), as well as deletions regarding
whole MeCP2 exons (Archer et al. 2006b) ; (Pan et al. 2006); (Ravn et al. 2005) .Up to now eight
missense and nonsense mutations account for ~70% of all mutations, while small C-terminal
deletions account for another ~10%, and complex rearrangements constitute ~6% (Fig.1).
Several phenotype-genotype correlation studies have been reported and some general
conclusions concerning the type of mutation and the seriousness of the disorder can be made.
Mutations disrupting the nuclear localization signal (NLS) of MeCP2 or early truncating mutations
Introduction
8
cause more severe phenotype than missense mutations (Kifayathullah et al.), whereas C-terminal
deletions are associated with milder phenotype (Bebbington et al.). In a recent review which aims to
characterize the phenotypes associated with the more common MECP2 mutations it has been shown
that patients with truncating mutations differed from those with missense mutations regarding
acquisition of propositive words and independent gait, before the beginning of the disease, and
microcephaly, growth, foot length, dystonia, rigidity and severity score, at the time of observation.
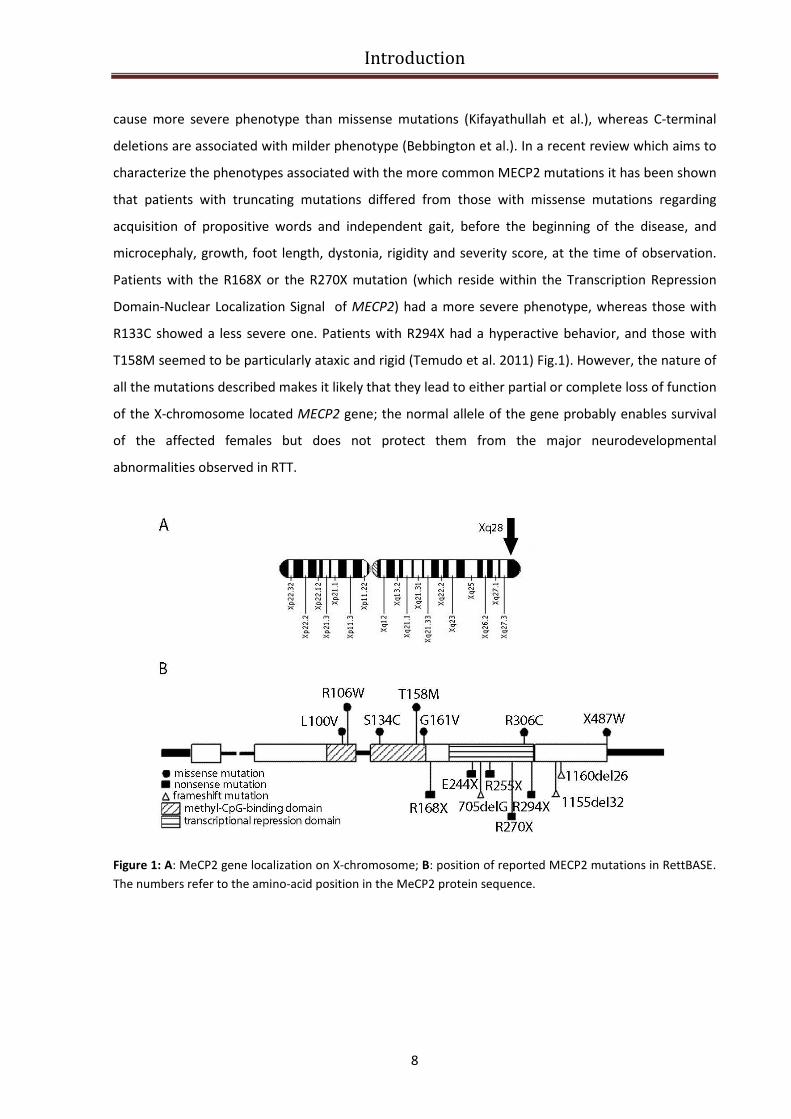
Patients with the R168X or the R270X mutation (which reside within the Transcription Repression
Domain-Nuclear Localization Signal of MECP2) had a more severe phenotype, whereas those with
R133C showed a less severe one. Patients with R294X had a hyperactive behavior, and those with
T158M seemed to be particularly ataxic and rigid (Temudo et al. 2011) Fig.1). However, the nature of
all the mutations described makes it likely that they lead to either partial or complete loss of function
of the X-chromosome located MECP2 gene; the normal allele of the gene probably enables survival
of the affected females but does not protect them from the major neurodevelopmental
abnormalities observed in RTT.
Figure 1: A: MeCP2 gene localization on X-chromosome; B: position of reported MECP2 mutations in RettBASE.
The numbers refer to the amino-acid position in the MeCP2 protein sequence.
Introduction
9
Phenotypic variability in RTT
The use of clinical criteria to define RTT (Table 1) limited the amount of variability that was
accepted under the umbrella of the diagnosis; however, there has been an issue regarding the
phenotypic range of the disorder. Classical and atypical RTT phenotypes vary in severity and onset
between different patients and in the same patient over time. To this extent, mutation analysis of
MECP2 indicates that the clinically defined syndrome does not always coincide with an identifiable
mutation in the gene and also the corollary is true: mutations in MECP2 gene does not always lead to
RTT (Dragich et al. 2000). The main source of the phenotypic variability associated with different
MECP2 mutations in female is due to X-chromosome inactivation (XCI). X-inactivation (also called
lyonization) is a process by which one of the two copies of the X chromosome present in female
mammals is inactivated. The choice of which X chromosome will be inactivated is random in
placental mammals, such that half of the cells have the maternal X chromosome active and the other
half have the paternal X chromosome active; once an X chromosome is inactivated it will remain
inactive throughout the lifetime of the cell and its descendants in the organism. Therefore, a female
with a MECP2 mutation is typically a mosaic, whereby half of her cells express the wild-type MECP2
allele and the other half express the mutant MECP2 allele. Although the majority of patients with
classic RTT have balanced XCI patterns in brain tissue (Shahbazian et al. 2002c), nonrandom XCI (also
called skewed X inactivation patterns) were observed in several cases (Renieri et al. 2003) (Weaving
et al. 2005). In particular, nonrandom XCI patterns favoring expression of the wild-type allele can
result in an amelioration of the RTT neurological phenotype. Moreover, depending on the extent of
such favorable skewing, some patients can be mildly affected or are even asymptomatic carriers of
MECP2 mutations (Sirianni et al. 1998). This cases are usually identified because of the occurrence of
RTT in their offspring. The best examples for illustrating the dramatic effects of XCI patterns in RTT
are monozygotic twins: in a paper of 2001 Dr. T. Ishii and colleagues described the case of
monozygotic twins carrying the same nonsense mutation of MECP2 gene, R294X (located on the
transcription repression domain) which results in completely different phenotype with a severer
condition of one of the two girls who is unable to walk compared to her sister who can walk with
other’s support (Ishii et al. 2001). Another rare but important source of phenotypic variability is
represented by somatic mosaicism in female with MECP2 mutations: in 2001 Bourdon V. and
colleagues described for the first time a somatic mosaicism in a girl affected by RTT, who carried a
nucleotide deletion affecting MECP2 gene in DNA extracted from a lymphoblastoid cell line but the
same deletion was undetectable in DNA from leucocytes (Bourdon et al. 2001) . Mutations in loci
other than MECP2 have also been found in individuals that have been labeled as atypical RTT,
although the criteria utilized have not always been clear. The high variability led to the classification
Introduction
10
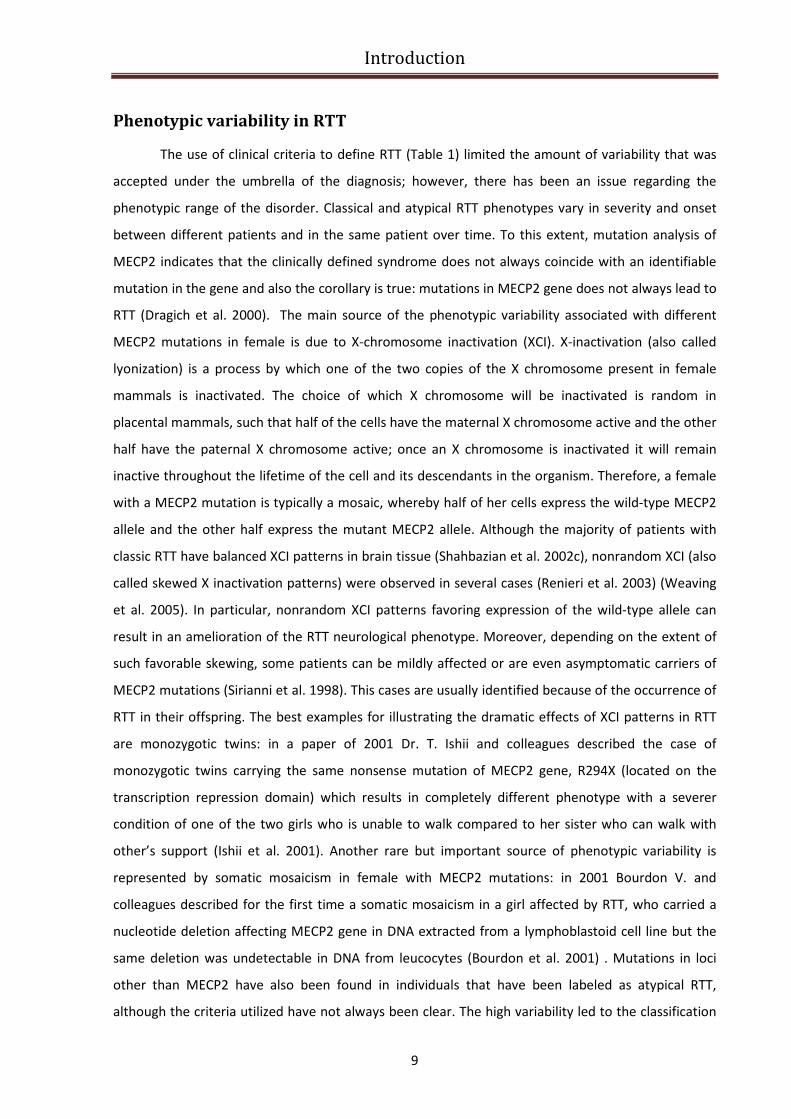
of RTT variants group which include also atypical forms of the disorder that deviate from the classical
clinical presentation (Fig.2).
Figure 2: Specific variant forms of RTT flow diagram.
Zappella Variant
One of the milder form of atypical RTT is known “forme fruste” (or “worndown form”) which
has a later age of onset compared with the classical form, with regression occurring between 1 to 3
years of age; hand use is sometimes preserved with minimal stereotypic movements. The preserved
speech variant (PSV, also called “Zappella variant”) is another benign form of RTT characterized by
the ability of patients to speak few words, although not necessarily in context. In a paper published
in 2001, Dr. Zappella and colleagues reported the clinical and mutation analysis of 18 PSV patients
and defined the phenotype of the affected girls (Zappella et al. 2001). Patients with this variant have
an evident autistic behavior, but normal head circumference and are usually overweight, often
obese, have kyphosis and are able to speack in single words and two-word phrases. The course of
the disorder is in stages as in classic RTT. Significantly, all mutations found in PSV are either missense
or late truncating mutations, suggesting that early truncating mutations lead to a poor prognosis
(classic RTT), while late truncating and missense mutations lead either to classic RTT or PSV. The
more severe variants include the congenital form that lacks the early period of normal development,
and it’s similar to a form of classical RTT with onset of seizures before the age of 6 months. The
Introduction
11
following paragraphs describe mutations in 2 different genes that have been linked to variants of RTT
syndrome, namely CDKL5 and FOXG1.
Hanefeld Variant (CDLK5 mutations)
Several disorders have been included among atypical RTT; one of these, the early seizure
variant of RTT, also known as the Hanefeld variant (Fig.2), characterizes female patients with atypical
RTT and infantile spasms (IS) and/or early onset of epileptic seizures. A number of reports have
described mutations in the X-linked gene cyclin-dependent kinase-like 5 (CDLK5, Online Mendelian
Inheritance in Man #300203) in patients who present seizures in the first few months of life and
show features of RTT (Mari et al. 2005). The importance of CDLK5 in early onset seizures and mental
retardation in females has been further reinforced by recent studies linking mutations in CDLK5 to
patients with RTT but only in those affected by a variant form characterized by seizures onset before
6 month of age (Chen et al. 2010). In the last years the frequency of CDLK5 mutations in patients
affected by infantile spasms or early onset epilepsy of unknown cause has also been investigated and
the identification of several novel pathogenic mutations led the scientific community to propose that
CDKL5 mutations in females are a significant cause of mental retardation and of forms of early
intractable epilepsy (Archer et al. 2006a). Although the majority of patients with CDLK5 mutations
are female, a large deletion involving CDLK5 in a male patient with X-linked retinoschisis, infantile
spasms and early-onset seizures was also identified (Huopaniemi et al. 2000). Despite the clear
involvement of CDKL5 in human health, this protein remains partially uncharacterized and its
functions in the nervous system as well as the molecular consequences of its pathogenic mutations
are not clearly understood. According to its involvement in brain function, CDKL5 is a ubiquitous
protein particularly expressed in the brain and in the first postnatal ages its expression correlates
with neuronal maturation and synaptogenesis. Given its amino acids sequence, CDKL5 (previously
known as serine/thereonine kinase 9 , STK9) was supposed to be a proline-directed serine/threonine
kinase sharing homology with members of the mitogen-activated protein (MAP) kinase and cyclin-
dependent kinase (CDK) families (Montini et al. 1998). Moreover, the similar RTT phenotypes in
patients carrying mutations in the gene coding for MECP2 and CDKL5, together with recent reports
demonstrating the importance of MeCP2 phosphorylation for selective binding to DNA (Chen et al.
2003), opened the possibility that the two proteins might operate in a common developmental
pathway. Moreover, it was demonstrated that CDKL5 and MeCP2 interact and that immunopurified
CDKL5 leads, directly or indirectly, to the phosphorylation of the methylbinding protein (Mari et al.
2005). In a recent paper by Dr. Q. Chen and colleagues it was proposed that CDLK5 is a critical
Introduction
12
regulator of neuronal morphogenesis (Chen et al. 2010): downregulating CDKL5 by RNA interference
(RNAi) in cultured cortical neurons inhibited neurite growth and dendritic arborization, whereas
overexpressing CDKL5 had opposite effects. Moreover they demonstrated that CDKL5 colocalizes and
forms a protein complex with Rac1, a critical regulator of actin remodeling
and neuronal
morphogenesis. All these evidences contribute to confer a critical role to CDLK5 in neuronal
development and explain why CDKL5 mutations can be involved in a congenital RTT-like disorder.
Rolando Variant (FOXG1 mutations)
Recent reports have identified mutations in FOXG1 in individuals characterized as having the
congenital variant of RTT (Zappella et al. 2005).The congenital variant was initially described by
Rolando in 1985 (Rolando 1985)(Fig.2). In this form, girls are floppy and retarded from the very first
months of life. The majority of congenital variants do not bear MECP2 or CDKL5 mutations, with only
few cases being reported with MECP2 mutations. Dr. F. Ariani and colleagues in 2008 identified a de
novo 3 Mb interstitial deletion of chromosome 14q12 in a 7 year-old girl showing dysmorphic
features and a RTT-like clinical course, including normal perinatal period, postnatal microcephaly,
seizures, and severe mental retardation (Ariani et al. 2008). The deleted region was gene poor and
contained only five genes. Among them, FOXG1 (MIM 164874) turned out to be a very interesting
gene because it encodes a brain-specific transcriptional repressor. FOXG1 encodes fork head box
protein G1, FoxG1 (formerly brain factor 1 [BF-1]), a transcriptional factor with expression restricted
to fetal and adult brain and testis. FoxG1 interacts with the transcriptional repressor JARID1B and
with global transcriptional corepressors of the Groucho family. The interaction with these proteins is
of functional importance for early brain development (Tan et al. 2003). Like MeCP2, FoxG1 also
indirectly associates with the histone deacetylase 1 protein (Yao et al. 2001).
In a recent paper of 2009, Dr. Mencarelli M.A. and colleagues reported the analysis of 60
MECP2/CDLK5 mutation negative European RTT patients (classical and variants) and 4 atypical RTT
patients were found to be affected by FOXG1 mutations (Mencarelli et al. 2009). In all cases
hypotonia, irresponsiveness and irritability were present in the neonatal period. At birth, head
circumference was normal while a deceleration of growth was recognized soon afterwards, leading
to severe microcephaly. Motor development was severely impaired and typical stereotypic hand
movements with hand washing and hand mouthing activities were present continuously. Some
patients showed abnormal movements of the tongue and jerky movements of the limbs. Epilepsy
was a variable sign and scoliosis was present and severe in the older patients. Neurovegetative
symptoms typical of RTT were frequently present. These new cases give additional support to the
Introduction
13
genetic heterogeneity in RTT and help to delineate the clinical spectrum of the FOXG1-related
phenotypes.
MeCP2 mutations in males
Soon after the identification of mutations in MECP2 as the major cause of RTT in females, the
first mutation in MECP2 gene in a male patient was described (Wan et al. 1999). This mutation was
identified in several individuals from a familial case of RTT that had contributed to map the disease in
Xq28. In this unique family, two sisters were carriers of the G269fs mutation in MECP2. One of these
women had two affected children: a girl affected by the classical form of RTT, and a boy who died in
early infancy from a severe neonatal encephalopathy of unknown origin. They were both affected by
G269fs mutation. Until that date, due to the exclusive female occurrence of RTT, it was believed that
any mutation causing the disease led to early termination of putative male pregnancies. The
discovery by Wan and collaborators instantly revealed that the presence of a mutation in the MECP2
gene on the single X chromosome of a male embryo was compatible with development and life. This
important and unexpected discovery prompted most laboratories involved in mutation screening for
RTT to include male cases in their screens. Today, it is clear that MECP2 mutations in male patients
are not so rare. Surprisingly, they are responsible for a wide spectrum of neurological disorders,
ranging from mild mental retardation (MR) to severe neonatal encephalopathy. The frequency of
potentially disease-causing MECP2 mutations in the population of mentally retarded male patients is
between 1.3% and 1.7%. Ten years after the description of the first mutation in a boy with a severe
phenotype, it is now possible to make a number of genotype/phenotype correlations and to
distinguish the three groups of patients. The first group is composed of patients who have a mutation
which is also found in typical cases of RTT. These boys have severe neonatal encephalopathy, and
they usually die in their first year of life. These mutations can lead to a milder phenotype (and to
clinical RTT) when they are diluted among normally expressing cells. This is the case of males with
Klinefelter syndrome (47, XXY) or when somatic mosaicism is present. To this regard Dr. M. Topçu
and colleagues in a paper of 2002 described a boy with features of classic Rett syndrome who is
mosaic for the truncating MECP2 mutation R270X (Topcu et al. 2002). The second group of patients
has mutations that are not found in females with RTT. These mutations are usually compatible with
life into adulthood. The neurological presentation ranges from severe to mild nonspecific mental
retardation. The third group is composed of males having a duplication of the whole MECP2 gene
(and sometimes genes in its vicinity). The primary clinical features associated with this
microduplication are non-specific, but they comprise a severe phenotype. Affected individuals
Introduction
14
experience infantile hypotonia, recurrent respiratory infection, severe mental retardation, absence
of speech development, seizures and spasticity. The recurrence of respiratory infections may be a
criterion to distinguish these cases from other syndromes, as they occur in a context of normal
growth.
The MeCP2 duplication disorder
Perhaps one of the more intriguing findings regarding RTT and MeCP2 is the fact that loss of
function and gain in MECP2 dosage result in clinically similar neurologic disorders. In fact,
duplications of Xq28 that span the MeCP2 locus have been reported in males with progressive
neurodevelopmental phenotype (as mentioned in the above paragraph). The MECP2 duplication
syndrome is a severe neurodevelopmental disorder characterized by infantile hypotonia, severe
mental retardation, poor speech development, progressive spasticity, recurrent respiratory
infections (in ~75% of affected individuals) and seizures (in ~50%). MECP2 duplication syndrome is
100% penetrant in males. Generalized tonic-clonic seizures are most often observed. One third of
affected males are never able to walk independently. Almost 50% of affected males die before age
25 years, presumably from complications of recurrent infection and/or neurologic deterioration
(Friez et al. 2006; Lugtenberg et al. 2009; Meins et al. 2005). A male patient with a triplication of the
locus was also described with a worse early-onset neurological phenotype (del Gaudio et al. 2006).
Occasionally, females have been described with a MECP2 duplication and related clinical findings,
often associated with concomitant X-chromosomal abnormalities that prevent inactivation of the
duplicated region (Ariani et al. 2004). Studies of transgenic mice that express wild-type MECP2 at
twice the normal level reveal that doubling the dosage of this protein leads to a progressive
neurological phenotype similar to that observed in human patients (Collins et al. 2004). These
observations, together with the finding that MECP2 is the only common gene shared among all
patients with the duplication syndrome, give support to the notion that MECP2 is the gene within the
almost 400 kb duplicated region that is responsible for these phenotypes.
MeCP2 mutations in other neuropsychiatric disorders
The identification of mutation in MECP2 as the cause of most cases of RTT provided the
opportunity to explore the mechanisms that underlie the disorder both clinically and molecularly.
However, the gene involved proved to be quite complex because of the heterogeneous
manifestations of its mutations. In the examination of the varoius phenotypes resulting from MECP2
Introduction
15
mutations, the expressivity of the mutant allele in heterozygous females with balanced X-inactivation
patterns indicates that some alleles show X-linked recessive effects, while the mutations found in
RTT are dominant acting. These differentially acting alleles also manifest as various phenotypes in
males, as males that are hemizygous for RTT causing MECP2 mutations present with a severe
neonatal encephalopathy, while males with recessive-acting mutations exhibit nonspecific X-linked
mental retardation (MRX) phenotypes. In short, mutation in MECP2 is not synonymous with RTT, and
RTT is not always caused by an identifiable mutation in MECP2 (Hammer et al. 2002). Phenotypes
resulting from MECP2 mutations have been shown to extend not only to several RTT variants (as
previously described), but also to some autism variants, atypical Angelman syndrome, and
nonspecific mental retardation (MR). Concerning the effects caused by MECP2 recessive mutations in
females, several cases of mild mental retardation, learning disabilities, and autism spectrum
disorders have been described (Carney et al. 2003; Lam et al. 2000). Moreover these type of
mutations can also cause severe mental retardation with epilepsy and Angelman-like syndrome (very
rare syndrome characterized mainly by mental retardation, mutism, facial anomalies, epilepsy and
weak eye muscles; males tend to have severe mental retardation whereas female carriers have mild
or no mental retardation in females (Milani et al. 2005; Watson et al. 2001). The spectrum of MECP2
disorders worsen with complex forms of severe MR in males that are often associated with epilepsy,
ataxia, tremor, hyperactive, autism, and bipolar disease (Klauck et al. 2002)or juvenile-onset
schizophrenia (Cohen et al. 2002). In addition, MECP2 mutations were identified in males with MR,
psychosis and Parkinsonian features (Klauck et al. 2002).
The full spectrum of phenotypes caused by MECP2 mutations is far from being elucidated:
mutations that are predicted to result in a null allele suggest that the neurodevelopmental
abnormalities are caused by MECP2 loss of function, but, on the other side, MECP2 duplication
disorder demonstrates that the protein could also gain a toxic function if its dosage is altered. Recent
studies on MeCP2 expression and functions are beginning to provide insight on how variations in the
level of this protein can lead to neuronal dysfunction.
Introduction
16
MeCP2
A nuclear protein that preferentially bound methylated DNA in vitro without apparent regard
for a consensus binding sequence was first described in 1989, and was named MeCP(Meehan et al.
1992; Meehan et al. 1989). This was demonstrated using synthetic double stranded (ds)DNA
oligomers methylated by bacterial methyl transferases. Competition of the protein from synthetic
DNA probes was observed only when the competitor DNA was methylated (Meehan et al. 1989). Pull
down assays showed that in each extract, MeCP preferentially bound the methylated DNA templates
without sequence specificity. Further experiments revealed that MeCP was indeed represented by 2
different proteins – MeCP1 and MeCP2 (Meehan et al. 1992)– with MeCP1 requiring at least 12
symmetrically methylated CpGs and MeCP2 able to bind a single methylated CpG pair. It was
proposed that MeCP2 normally binds methylated DNA in the context of chromatin, leading to long-
term transcriptional repression.
MeCP2 gene structure
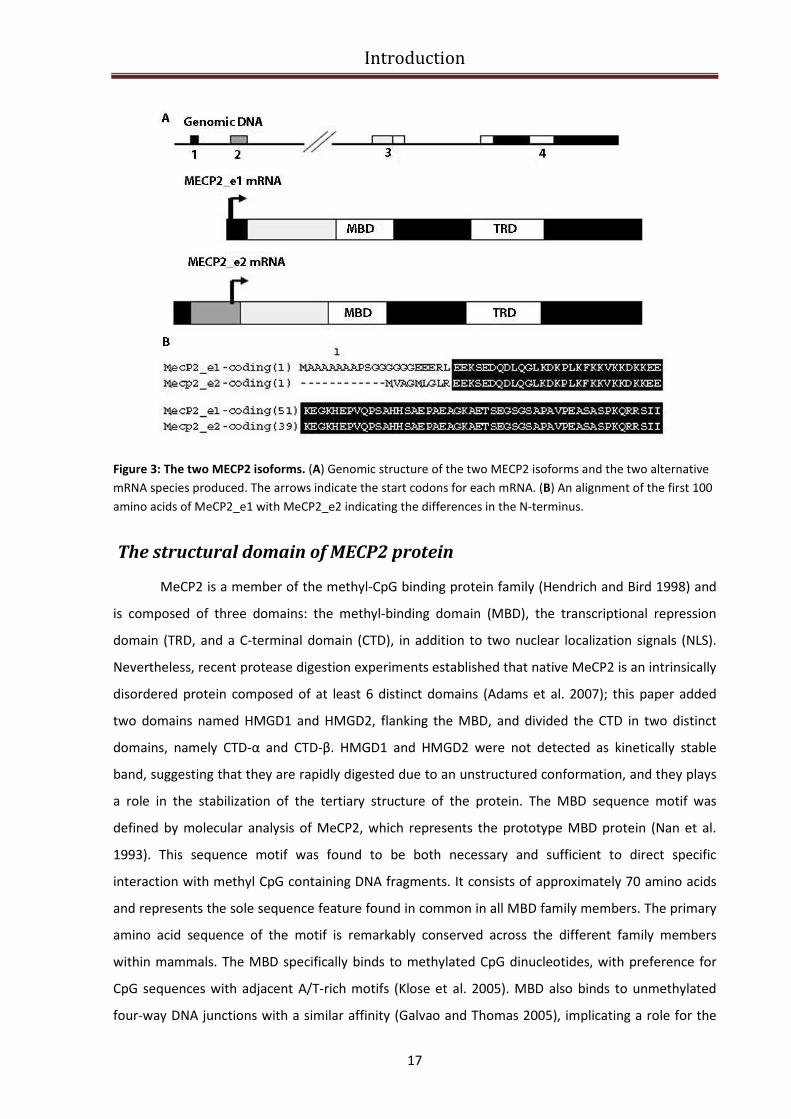
MECP2 consists of four exons that code for two different isoforms of the protein, due to
alternative splicing of exon 2. The MeCP2 splice variants differ only in their N-termini; the more
abundant MeCP2-e1 isoform (encoded by MECP2α) contains 24 amino acids encoded by exon1 and
lacks the 9 amino acids encoded by exon2, whereas the start site for the MeCP2-e2 isoform (encoded
by MECP2β) is in exon 2 (Fig.3). Moreover the MeCP2-e1 isoform has an acid isoelectric point (pI) of
4.25 instead the MeCP2-e2 isoform has a basic pI of 9.5 (Mnatzakanian et al. 2004). Concerning the
subcellular localization, both MeCP2 isoforms are nuclear and colocalize with methylated
heterochromatic foci in mouse cells. At the anatomical level, it has been demonstrated that the two
isoforms have a differential distribution between the dorsal thalamus and hypothalamus in
developing postnatal mouse brains (Dragich et al. 2007). In addition, MECP2 has a large, highly
conserved 3’-untranslated region that contains multiple polyadenylation sites, which can be
alternatively used to generate four different transcripts. Expression studies in mice showed that the
longest transcript is the most abundant in brain, with higher expression during embryonic
development, followed by postnatal decline, and subsequent increase in expression levels later in
adult life(Pelka et al. 2005) (Shahbazian et al. 2002b).
Introduction
17
Figure 3: The two MECP2 isoforms. (A) Genomic structure of the two MECP2 isoforms and the two alternative
mRNA species produced. The arrows indicate the start codons for each mRNA. (B) An alignment of the first 100
amino acids of MeCP2_e1 with MeCP2_e2 indicating the differences in the N-terminus.
The structural domain of MECP2 protein
MeCP2 is a member of the methyl-CpG binding protein family (Hendrich and Bird 1998) and
is composed of three domains: the methyl-binding domain (MBD), the transcriptional repression
domain (TRD, and a C-terminal domain (CTD), in addition to two nuclear localization signals (NLS).
Nevertheless, recent protease digestion experiments established that native MeCP2 is an intrinsically
disordered protein composed of at least 6 distinct domains (Adams et al. 2007); this paper added
two domains named HMGD1 and HMGD2, flanking the MBD, and divided the CTD in two distinct
domains, namely CTD-α and CTD-β. HMGD1 and HMGD2 were not detected as kinetically stable
band, suggesting that they are rapidly digested due to an unstructured conformation, and they plays
a role in the stabilization of the tertiary structure of the protein. The MBD sequence motif was
defined by molecular analysis of MeCP2, which represents the prototype MBD protein (Nan et al.
1993). This sequence motif was found to be both necessary and sufficient to direct specific
interaction with methyl CpG containing DNA fragments. It consists of approximately 70 amino acids
and represents the sole sequence feature found in common in all MBD family members. The primary
amino acid sequence of the motif is remarkably conserved across the different family members
within mammals. The MBD specifically binds to methylated CpG dinucleotides, with preference for
CpG sequences with adjacent A/T-rich motifs (Klose et al. 2005). MBD also binds to unmethylated
four-way DNA junctions with a similar affinity (Galvao and Thomas 2005), implicating a role for the
Introduction
18
MeCP2 MBD in higher-order chromatin interactions. Following the characterization of MBD domain,
the second MeCP2 domain to be characterized was the TRD. Using an in vitro β-actin transcription
assay, different regions of MeCP2 were fused to the Gal 4 DNA binding domain. Results showed that
residues 205–310 were required for transcriptional silencing, defining the TRD (Nan et al. 1997). The
TRD domain is the catalytic domain of the protein and it’s involved in transcriptional repression
through recruitment of corepressors and chromatin remodeling complexes. The C terminus
facilitates MeCP2 binding to naked DNA and to nucleosomal core. In 2007, Adams and colleagues
demonstrated that the CTD can be divided into a CTD-α (residues 310–354) and a CTD-β (residues
355–486)(Adams et al. 2007). The CTD-β contains 2 identifiable sequence motifs: 7 consecutive
histidines between residues 366–72 and a group 2 WW binding protein motif within a larger proline-
rich region at residues 381–393. The His-rich motif in MeCP2 is highly conserved between species.
The WW binding protein motif (residues 384–387) has been demonstrated to interact with splicing
and transcription factors (Buschdorf and Stratling 2004; Kato et al. 2010
). Interestingly, the proline-rich region in the CTD-β (residues 355–486) has been shown to bind
HMGB1(Dintilhac and Bernues 2002). At the level of chromatin structure, the CTD is required for
MeCP2-mediated chromatin compaction. Although the C-terminal region of MeCP2 is not yet well
characterized, it’s clear that it has a key contribution for protein function, since mutations that
involve deletion of this domain are responsible for the development of RTT-phenotype in females
and also in a mouse model lacking the MeCP2 C terminus (Shahbazian et al. 2002a).
MeCP2 mechanism of action
As DNA methylation was known to be an important mechanism for regulating gene
expression (Bird 2002) and MeCP2 had been shown to localize to the heterochromatin (Nan et al.
1996), it seemed likely, and was soon confirmed, that MeCP2 could function as a transcriptional
repressor (Nan et al. 1997) . Although initially described as a global transcriptional repressor, only a
limited number of targets of MeCP2- mediated regulation have been identified. The most well
established mechanism by which MeCP2 is able to repress transcription involves the recruitment of
corepressor Sin3a and histone deacetylases (HDACs) 1 and 2, that are able to alter chromatin
structure (Jones et al. 1998; Nan et al. 1998)(Fig.4). However, it has also been demonstrated that
MeCP2 is able to regulate transcription independently of HDACs, and several such HDAC-
independent mechanisms have been proposed. Kaludov and Wolffe demonstrated that MeCP2 is still
able to repress transcription in vitro in the absence of histones by interacting with transcription
factor IIB (TFIIB) to prevent assembly of the pre-initiation complex (Kaludov and Wolffe 2000).

Introduction
19
Moreover, Nikitina and colleagues, in 2007 showed that MeCP2 is able to bind chromatin through
direct interaction with its C-terminal domain (Nikitina et al. 2007a; Nikitina et al. 2007b). In addition,
the interaction with Sin3a is not stable and appears to be dependent on MeCP2 being DNA-bound
(Klose and Bird 2004). This suggest that Sin3a is not an exclusive partner of MeCP2 and that other
factors may interact with MeCp2 to modulate gene expression or other unknown functions.
Concerning this, MeCP2 may interact with other chromatin-modifying enzymes or complexes,
including the catalytic component of the SWI/SNF chromatin remodeling complex Brahma, the DNA
methyltransferase DNMT1, the histone methyltransferase Suv39H1, the corepressor c-Ski and N-CoR,
LANA and the SWI2/SNF2 DNA helicase/ATPase responsible for α-thalassemia-mental retardation
syndrome X-linked (ATRX)(Harikrishnan et al. 2005; Kaludov and Wolffe 2000; Kimura and Shiota
2003; Kokura et al. 2001; Nan et al. 2007). Consistent with its role as a chromatin-binding protein,
MeCP2 was shown to be capable of binding to four-way DNA junctions, a property that is shared by
several other proteins including HP1, HMGB1 and the SWI/SNF complex(Galvao and Thomas 2005).
The interaction of MeCP2 with chromatin is transient and dynamic, as demonstrated by rapid
recovery of fluorescence after photobleaching (Kumar et al. 2008). It has also been proposed that
MeCP2 may be involved in the formation of a chromatin loop at the Dlx5 and Dlx6 genes that results
in silencing of these genes (Horike et al. 2005).
In addition to the proposed roles in transcriptional repression and modulation of chromatin
structure, a recent study potentially links MeCP2 function to mRNA splicing (Young et al. 2005)(Fig.4).
Using coimmunoprecipitation from HeLa cell extracts, MeCP2 was shown to interact with YB-1(Young
et al. 2005). The YB-1 protein is a highly conserved component of messenger ribonucleoprotein
particles (mRNPs), and functions as the main mRNA packaging protein. The interaction between
MeCP2 and YB-1 requires the presence of RNA, as coimmunoprecipitation treated with RNase failed
to pull down YB-1 with MeCP2. It is unclear whether the RNA bridges MeCP2 and YB-1 or stabilizes a
protein–protein interaction between the two. In the same study, it was also observed that MeCP2
affects the splicing of reporter mini-genes, and that a functional MBD was not required for the YB-1
interaction or splice regulation. These findings, in conjunction with the observation that there are
aberrant alternative splicing patterns in a mouse model of RTT(Young et al. 2005), imply that MeCP2
has a previously uncharacterized function as a splice site regulator. Given that MeCP2 interacts with
other proteins, chromatin, DNA, and RNA, it is clearly a multifunctional protein, with roles in
chromatin remodeling and RNA splicing.
Introduction
20
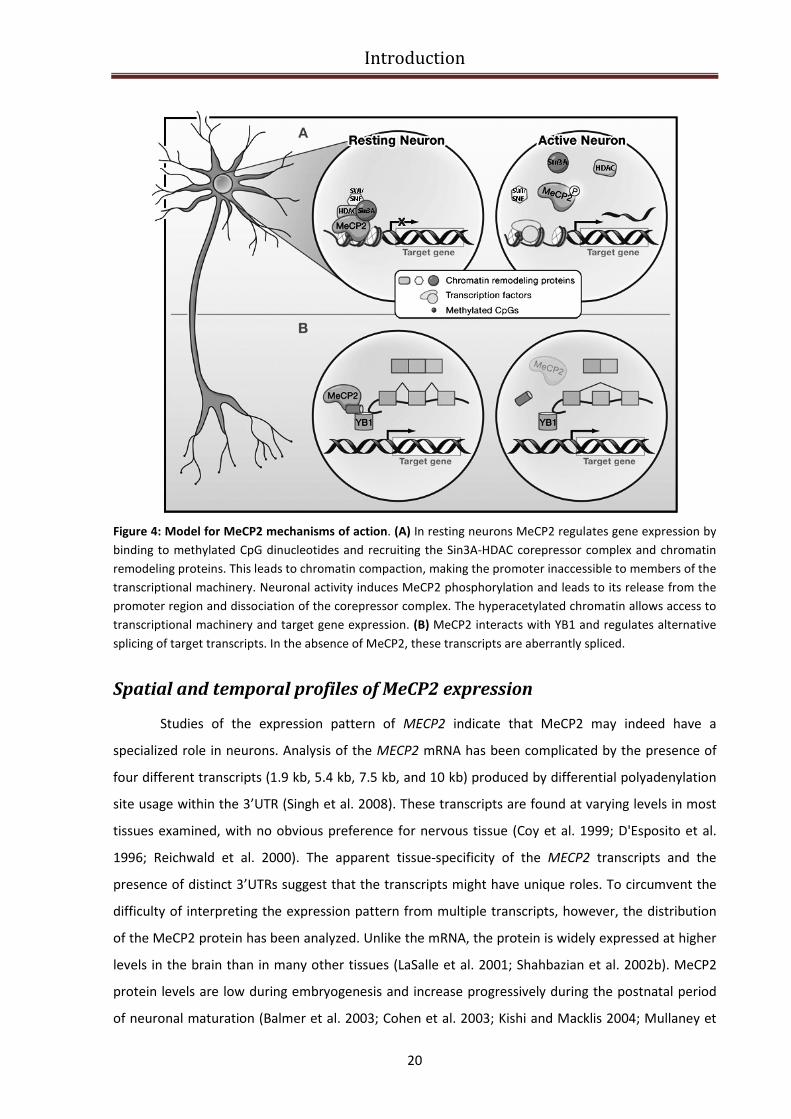
Figure 4: Model for MeCP2 mechanisms of action. (A) In resting neurons MeCP2 regulates gene expression by
binding to methylated CpG dinucleotides and recruiting the Sin3A-HDAC corepressor complex and chromatin
remodeling proteins. This leads to chromatin compaction, making the promoter inaccessible to members of the
transcriptional machinery. Neuronal activity induces MeCP2 phosphorylation and leads to its release from the
promoter region and dissociation of the corepressor complex. The hyperacetylated chromatin allows access to
transcriptional machinery and target gene expression. (B) MeCP2 interacts with YB1 and regulates alternative
splicing of target transcripts. In the absence of MeCP2, these transcripts are aberrantly spliced.
Spatial and temporal profiles of MeCP2 expression
Studies of the expression pattern of MECP2 indicate that MeCP2 may indeed have a
specialized role in neurons. Analysis of the MECP2 mRNA has been complicated by the presence of
four different transcripts (1.9 kb, 5.4 kb, 7.5 kb, and 10 kb) produced by differential polyadenylation
site usage within the 3’UTR (Singh et al. 2008). These transcripts are found at varying levels in most
tissues examined, with no obvious preference for nervous tissue (Coy et al. 1999; D'Esposito et al.
1996; Reichwald et al. 2000). The apparent tissue-specificity of the MECP2 transcripts and the
presence of distinct 3’UTRs suggest that the transcripts might have unique roles. To circumvent the
difficulty of interpreting the expression pattern from multiple transcripts, however, the distribution
of the MeCP2 protein has been analyzed. Unlike the mRNA, the protein is widely expressed at higher
levels in the brain than in many other tissues (LaSalle et al. 2001; Shahbazian et al. 2002b). MeCP2
protein levels are low during embryogenesis and increase progressively during the postnatal period
of neuronal maturation (Balmer et al. 2003; Cohen et al. 2003; Kishi and Macklis 2004; Mullaney et
Introduction
21
al. 2004; Shahbazian et al. 2002b). Within the brain, MeCP2 is present at high levels in most mature
postmigratory neurons (Jung et al. 2003) but not in glia (Akbarian et al. 2001; LaSalle et al. 2001).
MeCP2 levels also vary in a neuron-specific manner (LaSalle et al. 2001). In the developing cerebral
cortex of mouse, human, and non-human primate embryos, the appearance of MeCP2 correlates
with neuronal maturation, with earlier-born neurons expressing MeCP2 before later-born neurons
(Akbarian et al. 2001; Shahbazian et al. 2002b). Since MeCP2 is expressed in mature neurons and its
levels increase during postnatal development, MeCP2 may play a role in modulating the activity or
plasticity of mature neurons. Consistent with this hypothesis, MECP2 mutations do not seem to
affect the proliferation or differentiation of neuronal precursors. Although the mechanisms that
regulate the complex MECP2 expression patterns are unknown, a recent study identified the core
promoter and several cis-regulatory elements that drive MECP2 expression, and may dictate the
spatial and temporal patterns of MECP2 expression (Liu and Francke 2006). These results on the
spatial and the temporal expression of MeCP2 protein may partially explain why the brain is most
affected in RTT, why the development of white matter progresses normally although neuronal
development does not, why certain neuronal populations appear more affected than others, and
why the onset of disease is delayed. Understanding the functions of MeCP2 that are specific to
mature neurons will be the next challenge in elucidating the pathogenesis of RTT.
MeCP2 dysfunction during brain development
As explained in the previous paragraph, a large body of evidence supports the notion that
MeCP2 plays a unique role in neuronal maturation and developmental synaptic plasticity. In order to
delineate a model of RTT pathogenesis, this information needs to be coupled to data on the
neurologic phenotype of RTT and the pattern of expression of MeCP2 in this disorder. The
neuroanatomical features of RTT have been extensively delineated and provide clues about the
fundamental abnormalities in the disorder. The main morphological abnormalities detected in the
central nervous system (CNS) are an overall decrease in the size of the brain and of individual
neurons (Fig.5).
Introduction
22
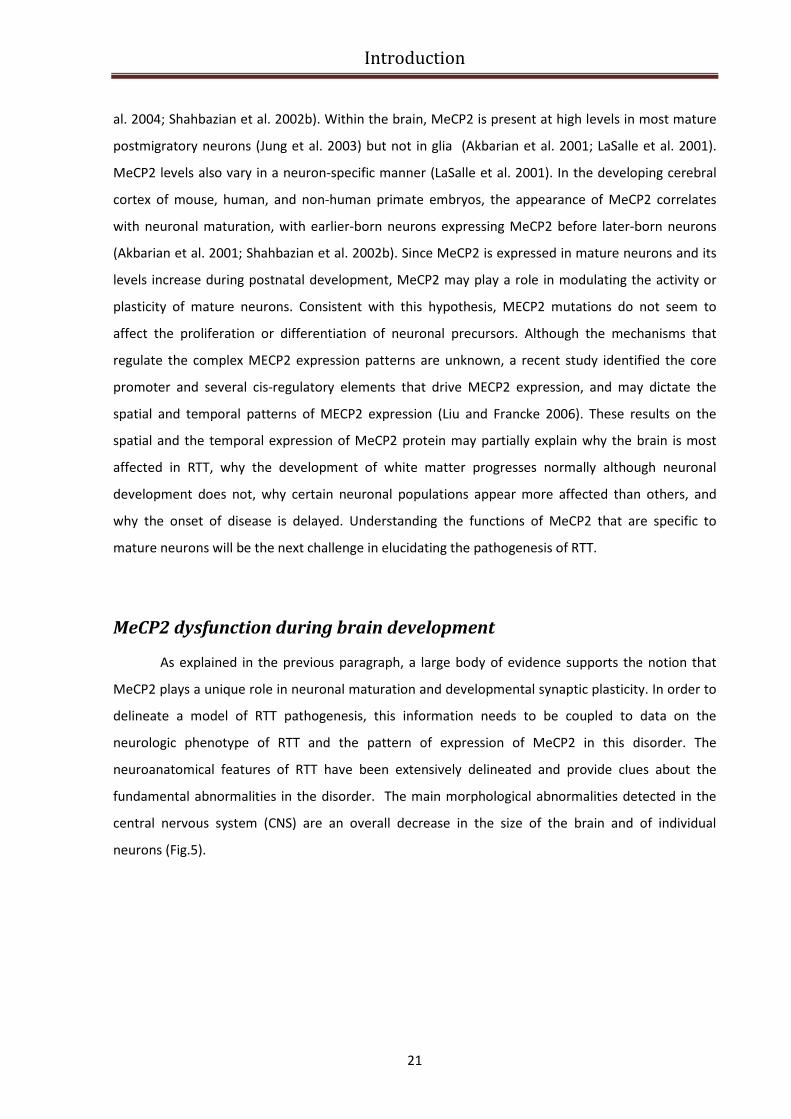
Figure 5: Camera lucida drawings of pyramidal neurons in layer V of the frontal cortex from human brain.
The neurons on left side from a non-Rett brain reveal the presence of apical and basilar dendrites. The neurons
from the Rett brain on the right reveal fewer and shorter apical and basilar dendrites (adapted from
(Armstrong 2002).
In 1999, Armstrong D.D. and collaborators reported that the RTT brain is small and remains
so, without apparent atrophy, degeneration, demyelination, or inflammatory response. Its
morphology, in some aspects, suggests an arrest of development during infancy (Armstrong et al.
1999) and mature brain function is not achieved (Naidu 1997). The reduced head circumference in
RTT, which has been correlated with the degree of motor handicap (Hagberg et al. 2000; Stenbom et
al. 1995), is indicative of reduced brain size. Some studies of the last decades described a global
hypoplasia of the brain by magnetic resonance imaging (Casanova et al. 1991; Murakami et al. 1992)
and a significant reduction in grey matter throughout the cortex with greater reduction in prefrontal,
posterior frontal, and anterior temporal regions (Reiss et al. 1993). They observed that there was no
progressive loss of brain volume but rather a reduced growth. Brain weight was determined in an
autopsy study of organ weights in RTT, and although all other organs were appropriate in weight for
height, the brain weight was significantly reduced (Armstrong et al. 1999). The average RTT brain
weight is 990 grams, without decline, an observation supporting the hypothesis that RTT is
associated with an arrested brain development. In an attempt to define how the RTT brain is arrested
in its development and how this results in altered neurophysiology, isolated brain region were
investigated with anatomic methods. The ‘Golgi method’ used in studies of mental retardation
(Marin-Padilla 1976; Purpura 1974)was applied to RTT brains. The dendritic arborization of cortical
pyramidal neurons of layers III and V in the frontal (area 6), motor (area 4), inferior temporal (area
20), hippocampus (areas 34, 28), and visual cortex (area 17) in the RTT brain was compared with that
of the non-RTT brain. Using camera lucida drawings of Golgi preparation and the Sholl analysis, a
significant fewness of dendrites with those that exist, manifesting a simplified branching pattern was
Introduction
23
in observed in RTT in the frontal, motor, and inferior temporal lobes (Armstrong et al. 1995). This
observation was supported by the reports of Bauman et al. (Bauman et al. 1995a; Bauman et al.
1995b)defining a decreased neuronal size and increased packing density in RTT cortex. Because
dendritic alterations have been reported in various disorders associated with mental retardation, the
dendritic changes in RTT were compared with those in trisomy 21. The RTT pathology was found to
be unique, with a failure of dendritic arborization in specific selected neuronal populations
(Armstrong et al. 1998), (e.g. pyramidal neurons in frontal, motor, and temporal lobes). The sites of
“hypotrophic neurons” in the RTT brain correlate with the cortical localization of some of its
significant motor and behavioral symptoms. Besides the spatial correlation there is also a temporal
nexus between the time at which the clinical deficits are observed in the RTT girls and the time of the
normal maturation of cortical layers III and V. The motor delay and emotional instability are observed
between 1–3 years (Kerr 1995),and it is at this time that the projection and association circuits of
cortical layers III and V are organized (Poliakov 1961). Thus, it is possible that the reduction of the
dendritic arborization in layers III and V contribute to the decreased brain size and the apparent
failure of cortical processing that results in the functional deficits. Moreover there are some
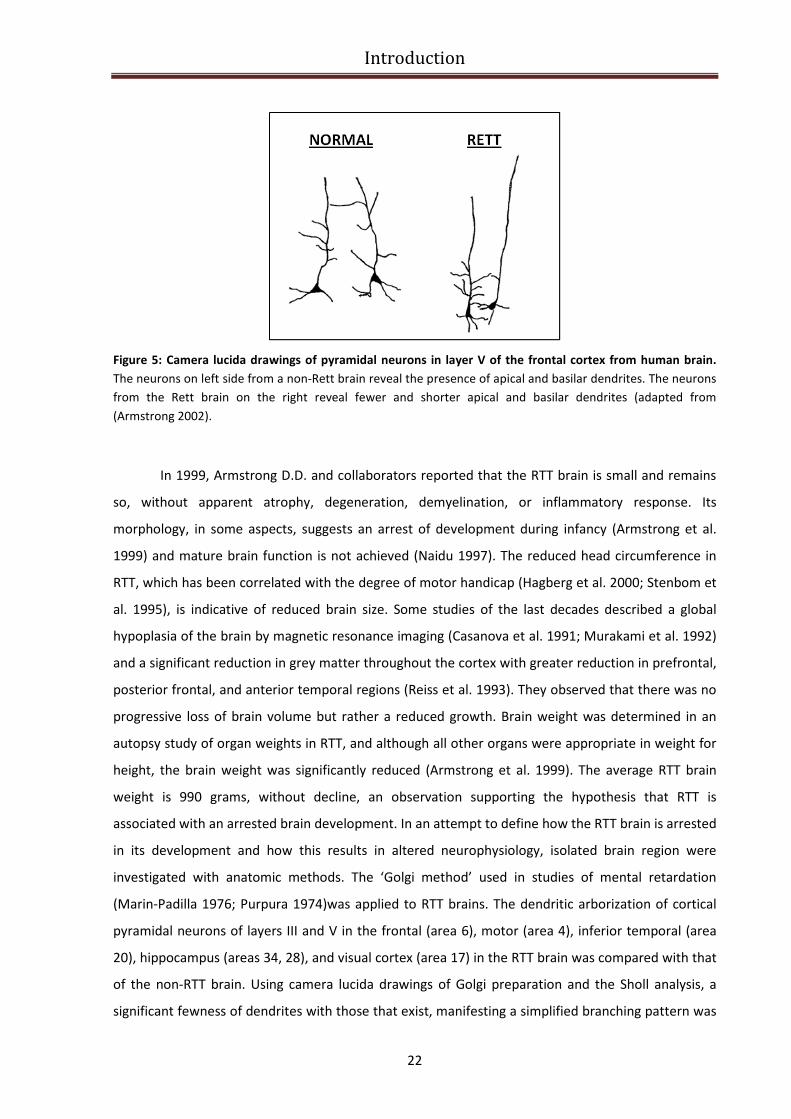
additional observations supporting the idea that there is an arrest of cortical maturation. Kaufmann
and colleagues in 1995 and 1997 demonstrated that in all RTT cortical areas there is a reduction of
MAP2, a marker that is normally expressed during the period of dendritic branching expression and
also a second protein, cyclooxygenase 2 (COX 2), which is expressed in distal dendrites during the
period of dendrite/synapse pruning, was decreased in frontal and temporal regions, with
preservation of the visual cortex (Fig.6)(Kaufmann et al. 1995; Kaufmann et al. 1997).
Figure 6: Reduction of cortical maturation in RTT patients’ brain. Reduced levels of MAP-2, a dendritic protein
involved in microtubule stabilization was observed in motor cortex of RTT patients (adapted from Kaufmann et
al., 1995)
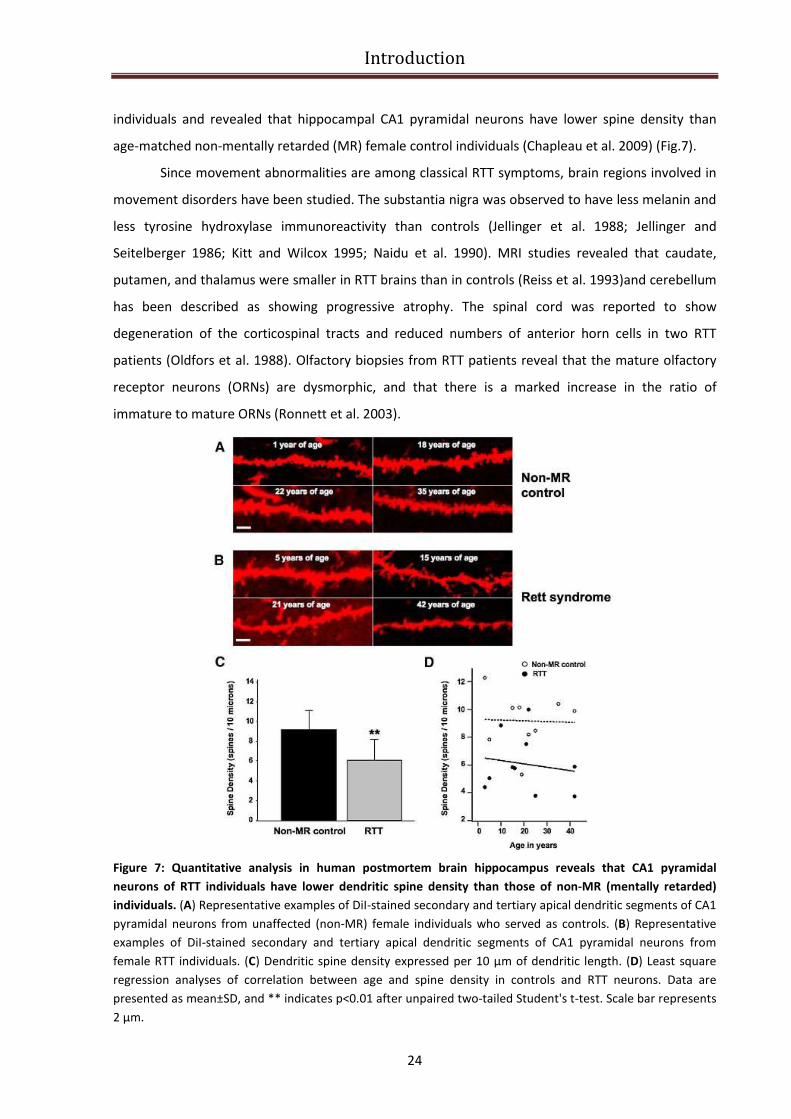
The number of dendritic spines in the frontal lobe was observed to be decreased in human
RTT patients (Belichenko and Dahlstrom, 1995). In 2009, Chapleau and colleagues presented the first
quantitative analyses of dendritic spine density in postmortem brain tissue from female RTT
Introduction
24
individuals and revealed that hippocampal CA1 pyramidal neurons have lower spine density than
age-matched non-mentally retarded (MR) female control individuals (Chapleau et al. 2009) (Fig.7).
Since movement abnormalities are among classical RTT symptoms, brain regions involved in
movement disorders have been studied. The substantia nigra was observed to have less melanin and
less tyrosine hydroxylase immunoreactivity than controls (Jellinger et al. 1988; Jellinger and
Seitelberger 1986; Kitt and Wilcox 1995; Naidu et al. 1990). MRI studies revealed that caudate,
putamen, and thalamus were smaller in RTT brains than in controls (Reiss et al. 1993)and cerebellum
has been described as showing progressive atrophy. The spinal cord was reported to show
degeneration of the corticospinal tracts and reduced numbers of anterior horn cells in two RTT
patients (Oldfors et al. 1988). Olfactory biopsies from RTT patients reveal that the mature olfactory
receptor neurons (ORNs) are dysmorphic, and that there is a marked increase in the ratio of
immature to mature ORNs (Ronnett et al. 2003).
Figure 7: Quantitative analysis in human postmortem brain hippocampus reveals that CA1 pyramidal
neurons of RTT individuals have lower dendritic spine density than those of non-MR (mentally retarded)
individuals. (A) Representative examples of DiI-stained secondary and tertiary apical dendritic segments of CA1
pyramidal neurons from unaffected (non-MR) female individuals who served as controls. (B) Representative
examples of DiI-stained secondary and tertiary apical dendritic segments of CA1 pyramidal neurons from
female RTT individuals. (C) Dendritic spine density expressed per 10 μm of dendritic length. (D) Least square
regression analyses of correlation between age and spine density in controls and RTT neurons. Data are
presented as mean±SD, and ** indicates p<0.01 after unpaired two-tailed Student's t-test. Scale bar represents
2 μm.
Introduction
25
Additionally, a variety of neurochemical changes are documented in the cerebrospinal fluid
and brain tissue of patients with RTT. Numerous neurotransmitters have been candidates for study
because of their importance in brain function and brain development. Serotonin, norepinephrine,
and their metabolites were studied by several investigators in the brain and cerebrospinal fluid (CSF)
(Lekman et al. 1989; Lekman et al. 1990; Perry et al. 1988; Zoghbi et al. 1989; Zoghbi et al. 1985)
(Budden et al. 1990; Nielsen et al. 1992)with variable results, possibly related to the age of the RTT
patients. The glutamatergic system has been studied, and has exhibited elevation of glutamate in CSF
(Hamberger et al. 1992). Other studies revealed elevations of glutamate transmitter and of NMDA
glutamate receptors in younger patients and a reduced expression of these receptors in older RTT
patients (Blue et al. 1999). Substance P is decreased in the CSF (Matsuishi et al. 1997)and showed
decreased immunoreactivity in spinal cord and brain stem nuclei. Studies on dopamine and
GABAergic system have been inconclusive. Nerve growth factor is decreased in the CSF ((Lappalainen
et al. 1996; Riikonen and Vanhala 1999)and neuronal immunoreactivity for nerve growth factor is
decreased (Lipani et al. 2000).
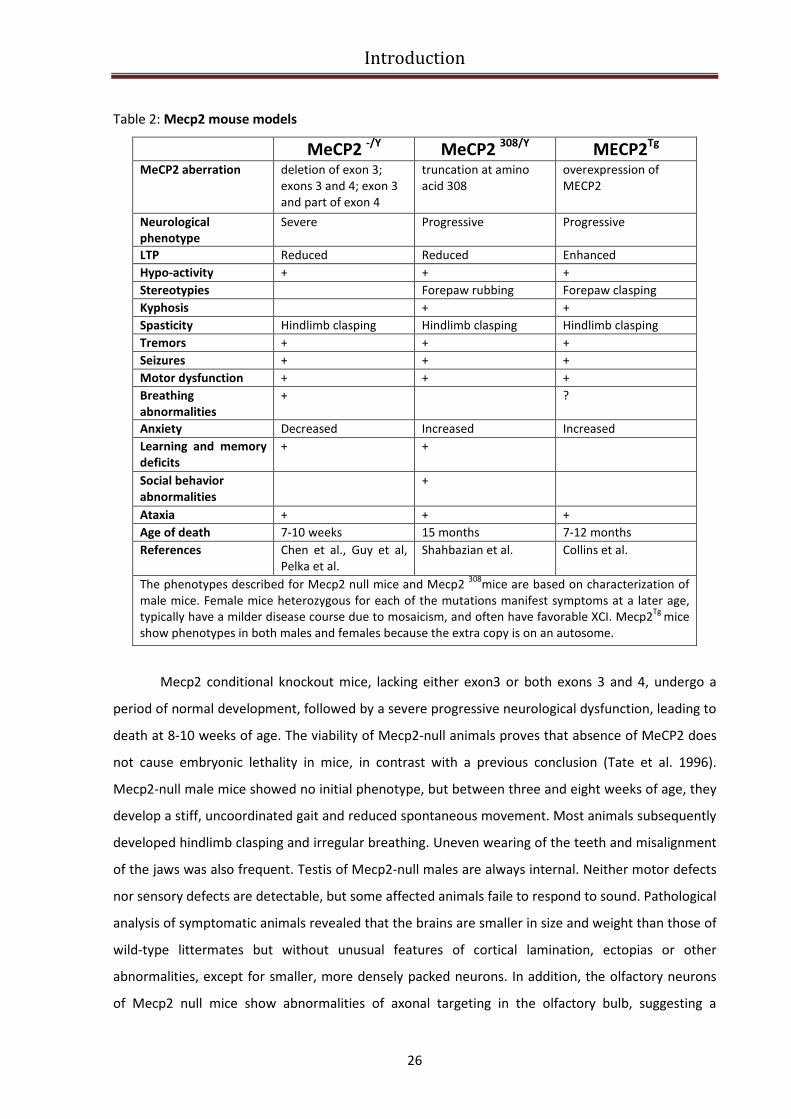
Modeling RTT and related disorders in mice
The potential benefit of animal models that mimic the symptoms of RTT is enormous, and
has led to the creation of several mouse models expressing alterations in the gene encoding methyl
CpG binding-protein 2 (Mecp2). Four mouse models currently exist. Three models result in the loss of
functional Mecp2 protein either through the deletion of exon 3 of the Mecp2 gene (Mecp21lox
, (Chen
et al. 2001)or by the deletion of exons 3 and 4 (Mecp2tm1-1Bird
, (Guy et al. 2001) Mecp2tm1Tam
, (Pelka et
al. 2006). In the fourth model, the Mecp2 protein is truncated after codon 308 (Mecp2308
), retaining
several key functional domains (Shahbazian et al. 2002a). Moreover, a fifth mouse model exists, in
which a two-fold overexpression of human MeCP2 has been induced (MECP2Tg
, (Collins et al. 2004).
The main features of these mouse models are summarized in Table 2.
Introduction
26
Table 2: Mecp2 mouse models
MeCP2 -/Y
MeCP2 308/Y
MECP2Tg
MeCP2 aberration deletion of exon 3;
exons 3 and 4; exon 3
and part of exon 4
truncation at amino
acid 308
overexpression of
MECP2
Neurological
phenotype
Severe Progressive Progressive
LTP Reduced Reduced Enhanced
Hypo-activity + + +
Stereotypies Forepaw rubbing Forepaw clasping
Kyphosis + +
Spasticity Hindlimb clasping Hindlimb clasping Hindlimb clasping
Tremors + + +
Seizures + + +
Motor dysfunction + + +
Breathing
abnormalities
+ ?
Anxiety Decreased Increased Increased
Learning and memory
deficits
+ +
Social behavior
abnormalities
+
Ataxia + + +
Age of death 7-10 weeks 15 months 7-12 months
References Chen et al., Guy et al,
Pelka et al.
Shahbazian et al. Collins et al.
The phenotypes described for Mecp2 null mice and Mecp2 308
mice are based on characterization of
male mice. Female mice heterozygous for each of the mutations manifest symptoms at a later age,
typically have a milder disease course due to mosaicism, and often have favorable XCI. Mecp2Tg
mice
show phenotypes in both males and females because the extra copy is on an autosome.
Mecp2 conditional knockout mice, lacking either exon3 or both exons 3 and 4, undergo a
period of normal development, followed by a severe progressive neurological dysfunction, leading to
death at 8-10 weeks of age. The viability of Mecp2-null animals proves that absence of MeCP2 does
not cause embryonic lethality in mice, in contrast with a previous conclusion (Tate et al. 1996).
Mecp2-null male mice showed no initial phenotype, but between three and eight weeks of age, they
develop a stiff, uncoordinated gait and reduced spontaneous movement. Most animals subsequently
developed hindlimb clasping and irregular breathing. Uneven wearing of the teeth and misalignment
of the jaws was also frequent. Testis of Mecp2-null males are always internal. Neither motor defects
nor sensory defects are detectable, but some affected animals faile to respond to sound. Pathological
analysis of symptomatic animals revealed that the brains are smaller in size and weight than those of
wild-type littermates but without unusual features of cortical lamination, ectopias or other
abnormalities, except for smaller, more densely packed neurons. In addition, the olfactory neurons
of Mecp2 null mice show abnormalities of axonal targeting in the olfactory bulb, suggesting a
Introduction
27
function for MeCP2 in terminal neuronal differentiation (Matarazzo et al. 2004). Moreover, the
respiratory rhythm disturbances observed in the Mecp2 null mice have been attributed to alterations
in bulbar post-inspiratory discharges and to malfunction of a specific region of the pons that
enhances post-inspiratory activity and leads to the development of respiratory dysrhythmia and
apnea (Stettner et al. 2007). Variable progression of symptoms lead ultimately to rapid weight loss
and death at approximately 54 days (Guy et al. 2001). Female Mecp2+/-
mice have behavioral
abnormalities as well, but with a later age of onset. Moreover, an embryonic Mecp2 deletion only in
neurons, obtained using a nestin-Cre transgene, results in a phenotype resembling the ubiquitous
knockout, demonstrating that MeCP2 dysfunction in the brain is sufficient to cause the disease (Guy
et al. 2001). Several studies were published on one side to confirm that neuronal MeCP2 dysfunction
is responsible for the neurological phenotype observed in Mecp2 null mice and on the other side to
show that MeCP2 is not very essential to the first earliest stages of brain development. When Mecp2
is deleted in postmitotic neurons using a calcium-calmodulin-dependent protein kinase II (CaMKII)-
Cre transgene, similar but less severe neurological phenotypes are observed with a later age of
onset, confirming a critical role for MeCP2 in mature neurons. These mice display gait ataxia,
increased anxiety, and impaired social behavior (Chen et al. 2001; Gemelli et al. 2006). In further
support of this idea, when Mecp2 is expressed in postmitotic neurons of Mecp2 null mice under the
control of the endogenous tau promoter, the neurological phenotypes of the knockout mice are
rescued (Luikenhuis et al. 2004). Recently, another Mecp2 null mouse model was reported in which
exon 3 and part of exon 4 were deleted. The mice are hypoactive and display learning deficits and
reduced anxiety (Pelka et al. 2006). The same research group generated the same mutation on an XO
background in order to determine whether the Y chromosome has any impact on the phenotype.
They compared the postnatal development of Mecp2-null 40 XY and 39 XO mice. These mice have in
common a maternally derived X-chromosome that carries the mutant allele, and differ only by the
presence of an extra sex chromosome in the 40 XY. Since the phenotype in Mecp2 -/Y
and Mecp2 -/O
mice is similar, they conclude that the Y-chromosome has no effect on the phenotypic manifestation
in Mecp2 null mice.
Another RTT mouse model, generated by truncating MeCP2 at amino acid 308, results in a
hypomorphic allele that retains the MBD, TRD, and NLS, and only eliminates the C-terminal region of
the protein, similar to C-terminal deletions found in RTT patients (Shahbazian et al. 2002a). Male
mice that are hemozygous for the targeted mutation are viable and fertile. A truncated protein is
detected by immunohistochemical analysis of brain tissue. Mecp2308/Y
mice appear normal until 6
weeks of age; by 6 weeks of age, male mutant mice begin to exhibit tremors, progressive motor
dysfunction, oily disheveled fur, hypoactivity, myoclonic seizures, and kyphosis. Approximately 10%
Introduction
28
of male mutants die between 10 and 12 months of age. Heterozygous female mice exhibit a milder
phenotype. All mutant male mice and 62% of female heterozygotes exhibit a repetitive clasping
movement of their forelimbs and exhibit tremors. In vivo, the truncated protein maintains normal
chromatin localization, but histone H3 is hyperacetylated in the brain, indicating abnormal chromatin
architecture (McGill et al. 2006; Moretti et al. 2005; Shahbazian et al. 2002a).
Transgenic mice expressing either 2 or 3 fold MeCP2 human protein levels from the
endogenous mice promoter (MECP2Tg
) show significant neurological impairment, including motor
dysfunction, seizures and stereotypic behaviors with the onset of phenotype around ten weeks of
age (Collins et al. 2004). These mice displayed enhanced motor and contextual learning and
enhanced synaptic plasticity in the hippocampus. After 20 weeks of age, however, they developed
seizures, became hypoactive and approximately 30% of them died by 1 year of age. In addition,
higher levels of MeCP2 expression in other transgenic lines are associated with more severe
phenotypes (Collins et al. 2004). The multiple transgenic lines provide strong evidence that higher
protein levels correlate with more severe phenotypes. Summing up, even a modest excess of
endogenous MeCP2 levels can cause a progressive neurological phenotype. Studies of these mouse
models suggest that MeCP2 levels must be tightly regulated even postnatally and that the slightest
perturbation results in deleterious neurological consequences (Collins et al. 2004; Luikenhuis et al.
2004). Moreover regarding the role of MeCP2 as regulator of gene expression, it seems likely that
abnormal MeCP2 levels result in a differential regulation of the expression pattern of MeCP2 target
genes (Chahrour et al. 2008).
MECP2 target genes and relevance to RTT pathogenesis
Since MeCP2 is believed to function as a transcriptional repressor, it is logical to focus the
attention on the transcriptional targets of MeCP2 to gain insight into disease pathogenesis. Previous
transcriptional profiling studies comparing brain tissue from Mecp2-null and wild-type mice revealed
only subtle differences in gene expression (Tudor et al. 2002) suggesting some conclusions: first of all
Mecp2 deficiency does not lead to global alterations in transcription but instead leads to slight
changes of gene expression that are only detectable by sensitive statistical analysis of relatively large
datasets; secondly if MeCP2 regulates the expression of a select number of genes in different subsets
of neurons, such transcriptional changes would be missed in samples of brain tissue containing a host
of vastly different neuronal types. Several laboratories have used candidate gene approaches,
sampling both human and mouse tissues, and identified putative MeCP2 targets that may shed light
on the molecular mechanism underlying the pathogenesis of RTT. Some of this target have been
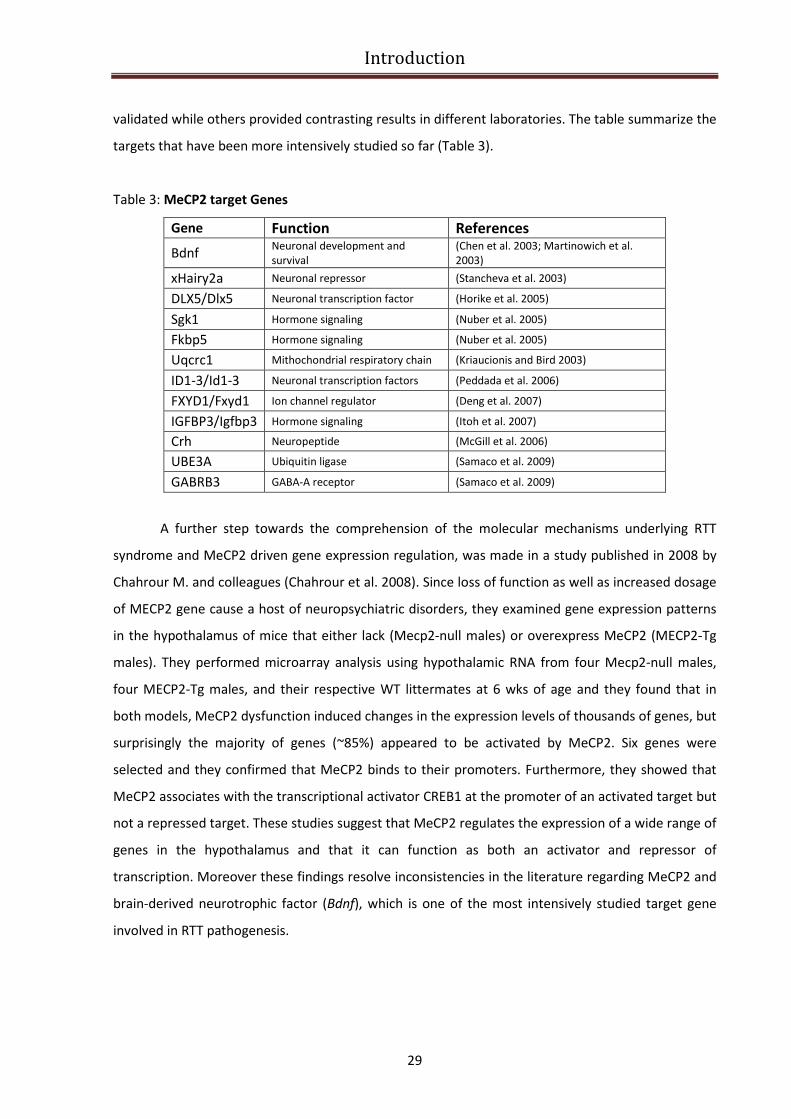
Introduction
29
validated while others provided contrasting results in different laboratories. The table summarize the
targets that have been more intensively studied so far (Table 3).
Table 3: MeCP2 target Genes
Gene Function References
Bdnf Neuronal development and
survival
(Chen et al. 2003; Martinowich et al.
2003)
xHairy2a Neuronal repressor (Stancheva et al. 2003)
DLX5/Dlx5 Neuronal transcription factor (Horike et al. 2005)
Sgk1 Hormone signaling (Nuber et al. 2005)
Fkbp5 Hormone signaling (Nuber et al. 2005)
Uqcrc1 Mithochondrial respiratory chain (Kriaucionis and Bird 2003)
ID1-3/Id1-3 Neuronal transcription factors (Peddada et al. 2006)
FXYD1/Fxyd1 Ion channel regulator (Deng et al. 2007)
IGFBP3/Igfbp3 Hormone signaling (Itoh et al. 2007)
Crh Neuropeptide (McGill et al. 2006)
UBE3A Ubiquitin ligase (Samaco et al. 2009)
GABRB3 GABA-A receptor (Samaco et al. 2009)
A further step towards the comprehension of the molecular mechanisms underlying RTT
syndrome and MeCP2 driven gene expression regulation, was made in a study published in 2008 by
Chahrour M. and colleagues (Chahrour et al. 2008). Since loss of function as well as increased dosage
of MECP2 gene cause a host of neuropsychiatric disorders, they examined gene expression patterns
in the hypothalamus of mice that either lack (Mecp2-null males) or overexpress MeCP2 (MECP2-Tg
males). They performed microarray analysis using hypothalamic RNA from four Mecp2-null males,
four MECP2-Tg males, and their respective WT littermates at 6 wks of age and they found that in
both models, MeCP2 dysfunction induced changes in the expression levels of thousands of genes, but
surprisingly the majority of genes (~85%) appeared to be activated by MeCP2. Six genes were
selected and they confirmed that MeCP2 binds to their promoters. Furthermore, they showed that
MeCP2 associates with the transcriptional activator CREB1 at the promoter of an activated target but
not a repressed target. These studies suggest that MeCP2 regulates the expression of a wide range of
genes in the hypothalamus and that it can function as both an activator and repressor of
transcription. Moreover these findings resolve inconsistencies in the literature regarding MeCP2 and
brain-derived neurotrophic factor (Bdnf), which is one of the most intensively studied target gene
involved in RTT pathogenesis.

Introduction
30
MECP2 regulates gene expression in an activity-dependent manner (BDNF)
BDNF was identified as a target of MeCP2 through a candidate gene approach (Chen et al.
2003; Martinowich et al. 2003). Genomic analysis has shown that BDNF gene is large, almost 40 kb in
length, and complex, containing a functional promoter with different activity preceding each of the
identified 5’exon (Timmusk et al. 1993), that produce a variety of mature mRNA. One of these, the
promoter III (Timmusk et al. 1993) (the analogous promoter in the mouse is the BDNF exon IV
promoter, (Aid et al., 2007)) is activated by calcium influx through L-type voltage-sensitive calcium
channels; in the absence of calcium, the promoter is largely inactive. In particular Tao and colleagues
(Tao Y. et al., 1998) demonstrated that CREB or a closely related protein mediates Ca2+-dependent
regulation of BDNF. In cortical neurons, Ca2+ influx triggers phosphorylation of CREB, which by
binding to a critical Ca2+ response element (CRE) within the BDNF gene activates BDNF transcription.
In 2003 two groups independently reported important data regarding MeCP2 function in the context
of neuronal gene regulation, focusing on BDNF regulation driven by MeCP2 (Chen et al. 2003;
Martinowich et al. 2003). They took different approaches to dissecting BDNF regulation.
Martinowich and colleagues began their study of the mouse BDNF exon IV (Aid et al., 2007) promoter
by asking whether DNA methylation altered promoter-driven expression in a transient transfection
assay. They achieved site-specific methylation using methylated oligonucleotide and PCR
amplification and they found out that methylation of some, but not all, cytosine residue within the
core promoter resulted in a loss of transcriptional activity after transfection into cultured neurons
followed by depolarization. This result suggested that DNA methylation might be involved in
repression of the promoter in vivo and was confirmed by a direct analysis of CpG methylation in situ
of exon IV promoter (Aid et al., 2007) in cultured neuronal cells. Moreover chromatin
immunoprecipitation experiments with cultured neurons revealed that MeCP2 was associated with
the promoter IV (Aid et al., 2007)locus in the absence of stimulation. Membrane depolarization led to
a loss of MeCP2 at BDNF exon IV (Fig.8). Immunofluorescence microscopy revealed a major
redistribution of MeCP2 within neuronal nuclei following depolarization. As expected, histone
modification at BDNF locus were accompanied also by a loss of association of MeCP2 and its
associated corepressor complex, composed by mSin3a and histone deacetylase.
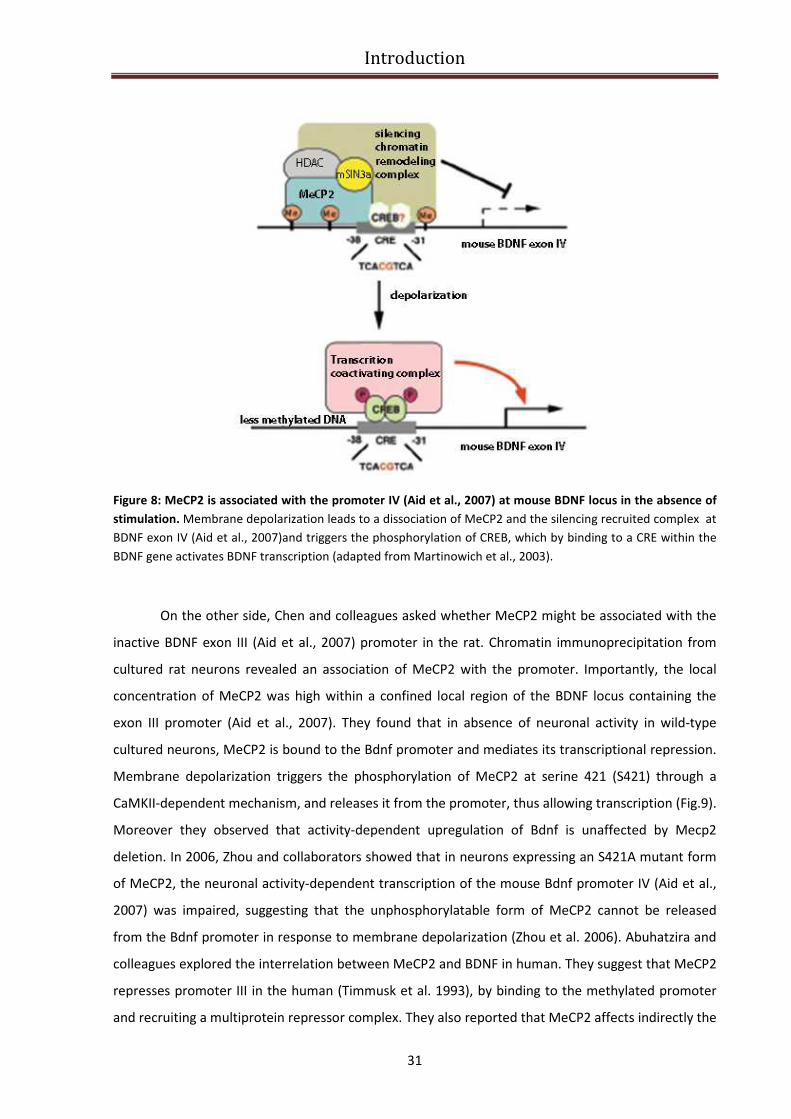
Introduction
31
Figure 8: MeCP2 is associated with the promoter IV (Aid et al., 2007) at mouse BDNF locus in the absence of
stimulation. Membrane depolarization leads to a dissociation of MeCP2 and the silencing recruited complex at
BDNF exon IV (Aid et al., 2007)and triggers the phosphorylation of CREB, which by binding to a CRE within the
BDNF gene activates BDNF transcription (adapted from Martinowich et al., 2003).
On the other side, Chen and colleagues asked whether MeCP2 might be associated with the
inactive BDNF exon III (Aid et al., 2007) promoter in the rat. Chromatin immunoprecipitation from
cultured rat neurons revealed an association of MeCP2 with the promoter. Importantly, the local
concentration of MeCP2 was high within a confined local region of the BDNF locus containing the
exon III promoter (Aid et al., 2007). They found that in absence of neuronal activity in wild-type
cultured neurons, MeCP2 is bound to the Bdnf promoter and mediates its transcriptional repression.
Membrane depolarization triggers the phosphorylation of MeCP2 at serine 421 (S421) through a
CaMKII-dependent mechanism, and releases it from the promoter, thus allowing transcription (Fig.9).
Moreover they observed that activity-dependent upregulation of Bdnf is unaffected by Mecp2
deletion. In 2006, Zhou and collaborators showed that in neurons expressing an S421A mutant form
of MeCP2, the neuronal activity-dependent transcription of the mouse Bdnf promoter IV (Aid et al.,
2007) was impaired, suggesting that the unphosphorylatable form of MeCP2 cannot be released
from the Bdnf promoter in response to membrane depolarization (Zhou et al. 2006). Abuhatzira and
colleagues explored the interrelation between MeCP2 and BDNF in human. They suggest that MeCP2
represses promoter III in the human (Timmusk et al. 1993), by binding to the methylated promoter
and recruiting a multiprotein repressor complex. They also reported that MeCP2 affects indirectly the
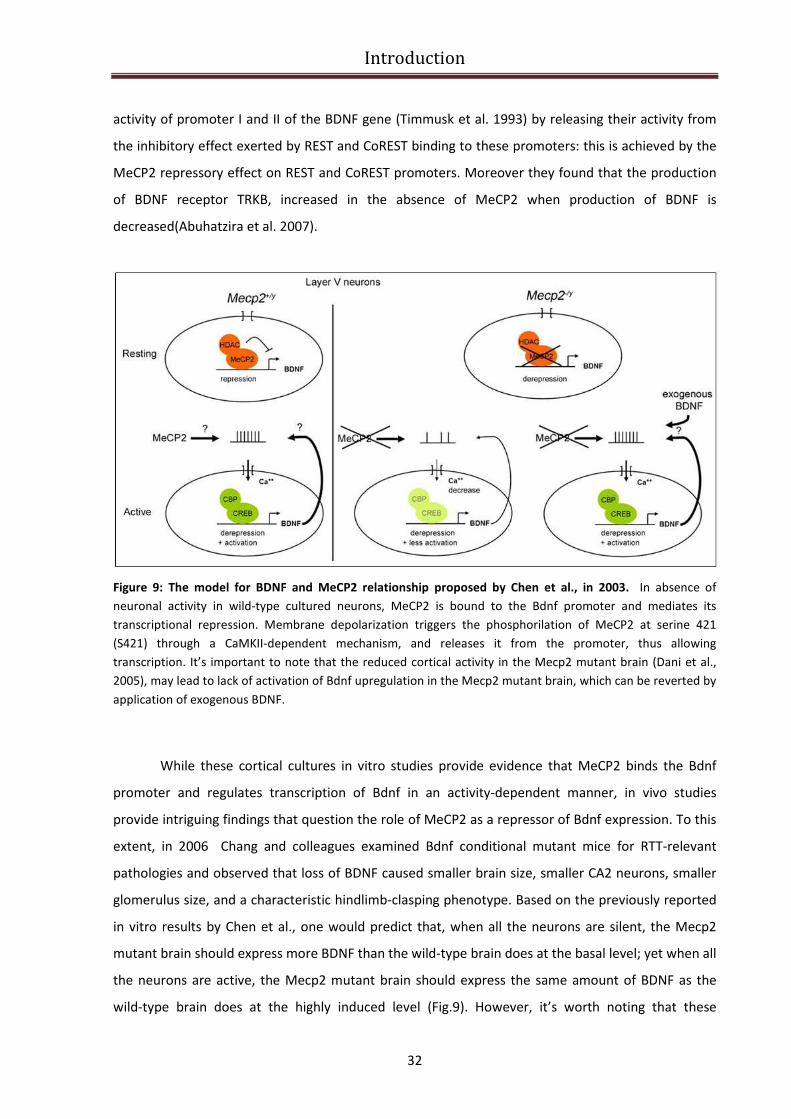
Introduction
32
activity of promoter I and II of the BDNF gene (Timmusk et al. 1993) by releasing their activity from
the inhibitory effect exerted by REST and CoREST binding to these promoters: this is achieved by the
MeCP2 repressory effect on REST and CoREST promoters. Moreover they found that the production
of BDNF receptor TRKB, increased in the absence of MeCP2 when production of BDNF is
decreased(Abuhatzira et al. 2007).
Figure 9: The model for BDNF and MeCP2 relationship proposed by Chen et al., in 2003. In absence of
neuronal activity in wild-type cultured neurons, MeCP2 is bound to the Bdnf promoter and mediates its
transcriptional repression. Membrane depolarization triggers the phosphorilation of MeCP2 at serine 421
(S421) through a CaMKII-dependent mechanism, and releases it from the promoter, thus allowing
transcription. It’s important to note that the reduced cortical activity in the Mecp2 mutant brain (Dani et al.,
2005), may lead to lack of activation of Bdnf upregulation in the Mecp2 mutant brain, which can be reverted by
application of exogenous BDNF.
While these cortical cultures in vitro studies provide evidence that MeCP2 binds the Bdnf
promoter and regulates transcription of Bdnf in an activity-dependent manner, in vivo studies
provide intriguing findings that question the role of MeCP2 as a repressor of Bdnf expression. To this
extent, in 2006 Chang and colleagues examined Bdnf conditional mutant mice for RTT-relevant
pathologies and observed that loss of BDNF caused smaller brain size, smaller CA2 neurons, smaller
glomerulus size, and a characteristic hindlimb-clasping phenotype. Based on the previously reported
in vitro results by Chen et al., one would predict that, when all the neurons are silent, the Mecp2
mutant brain should express more BDNF than the wild-type brain does at the basal level; yet when all
the neurons are active, the Mecp2 mutant brain should express the same amount of BDNF as the
wild-type brain does at the highly induced level (Fig.9). However, it’s worth noting that these
Introduction
33
predictions are made under the assumption that the level of neuronal activity is the same in both the
wild-type and Mecp2 mutant brain. In 2005, Dani et al. reported reduced cortical activity in the
Mecp2 mutant brain (Dani et al. 2005), which may lead to lack of activation of Bdnf upregulation in
the Mecp2 mutant brain. Indeed, Chang and colleagues found that BDNF protein level in the whole-
brain lysate in Mecp2 mutant mice is decreased (rather than increased) to about 70% of the wild-
type level. Moreover they reported that conditional deletion of Bdnf in Mecp2 mutants caused an
earlier onset of RTT-like symptoms. To assess whether this interaction was functional and potentially
therapeutically relevant, they increased BDNF expression in the Mecp2 mutant brain with a
conditional Bdnf transgene. Forebrain-specific BDNF overexpression extended the lifespan, rescued a
locomotor defect, and reversed an electrophysiological deficit observed in Mecp2 mutants. These
results demonstrate in vivo interaction between MeCP2 and Bdnf, and a correlation between altered
BDNf levels and neurologic impairment in MeCP2 null mice (Chang et al. 2006).
To further explore the involvement of BDNF in RTT Wang and colleagues examined how
genetic loss of MeCP2 affects transynaptic BDNF signaling, a regulated process that requires tight
coupling between activity-dependent presynaptic BDNF expression and secretion (Wang et al. 2006).
To approach this issue, they compared BDNF secretion from wild-type and Mecp2 null neurons using
ELISA in situ, a method that permits detection of native BDNF release in vitro (Balkowiec and Katz
2000). Their results showed that although MeCP2 null cortical neurons express less Bdnf mRNA and
contain lower levels of the protein compared with wild-type neurons, they secreted a greater
percentage of their total BDNF content and this enhanced secretion is due to an increase in BDNF
stores available for release. To determine whether perturbations are specific to BDNF-releasing
neurons, or more global, they also compared exocytic function and catecholamine release in
wildtype and MeCP2 null adrenal chromaffin cells. They reported that catecholamine release is
similarly affected, indicating general neurosecretory alterations in MeCP2 null mice.
In 2007, other studies further defined the role of MeCP2 in regulation of BDNF expression
and neural function: in particular Deng at al., reported reduced Bdnf gene expression in the frontal
cortex of RTT patients (Deng et al. 2007) and Ogier and colleagues reported that, under both
depolarizing and nondepolarizing conditions, deficits in BDNF expression are particularly significant in
the brainstem and nodose cranial sensory ganglia (NGs), which contain structures that are critical for
cardiorespiratory homeostasis, and may be linked to the severe respiratory abnormalities
characteristic of RTT (Ogier et al. 2007).
To add details to this complicated relationship between MeCP2 and BDNF it is worthy to
mention another paper of 2007, in which Klein and colleagues reported that MECP2 overexpression
in cultured cortical neurons resulted in elevated Bdnf mRNA levels, likely via a homeostatic
Introduction
34
regulatory loop that includes the CREB-induced microRNA132, which negatively regulates MeCP2
levels (Klein et al. 2007).
In addition, a recent paper by Larimore et al., showed that both knockdown of endogenous
Mecp2 as well as overexpression of wildtype MECP2 in cultured hippocampal neurons, increased
intracellular BDNF protein levels, while overexpression of RTT-associated MECP2 mutants failed to
affect BDNF levels (Larimore et al. 2009).Taken together these observations support the idea that the
developmental increase in Mecp2 expression controls BDNF protein levels, which in turn participate
in the growth and maturation of dendritic architecture, and that RTT-associated MECP2 mutations
impair neuronal terminal differentiation by deregulating BDNF levels and/or its activity-dependent
release. The relationship between MeCP2 function and BDNF-mediated signaling remains mainly
unknown and hotly debated. The few available studies of BDNF levels in RTT patients have not
yielded results consistent with the “BDNF hypothesis of Rett” and reveal our incomplete
understanding of the potential and intriguing role of neurotrophin signaling in the pathogenesis of
RTT. Furthermore, they underscore the need for further cellular and molecular studies, that explore
the consequences of mutant MeCP2 expression on neurotrophin expression, targeting and/or
release, as well as signaling through its p75NTR and Trk receptors.
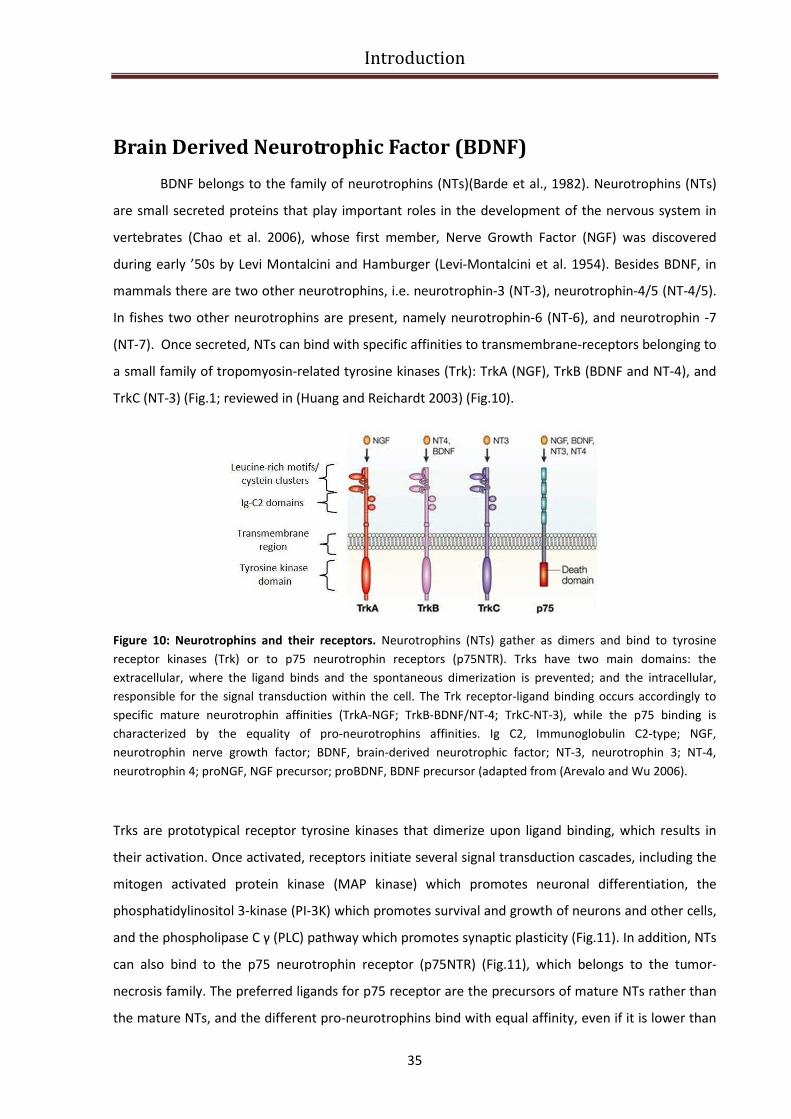
Introduction
35
Brain Derived Neurotrophic Factor (BDNF)
BDNF belongs to the family of neurotrophins (NTs)(Barde et al., 1982). Neurotrophins (NTs)
are small secreted proteins that play important roles in the development of the nervous system in
vertebrates (Chao et al. 2006), whose first member, Nerve Growth Factor (NGF) was discovered
during early ’50s by Levi Montalcini and Hamburger (Levi-Montalcini et al. 1954). Besides BDNF, in
mammals there are two other neurotrophins, i.e. neurotrophin-3 (NT-3), neurotrophin-4/5 (NT-4/5).
In fishes two other neurotrophins are present, namely neurotrophin-6 (NT-6), and neurotrophin -7
(NT-7). Once secreted, NTs can bind with specific affinities to transmembrane-receptors belonging to
a small family of tropomyosin-related tyrosine kinases (Trk): TrkA (NGF), TrkB (BDNF and NT-4), and
TrkC (NT-3) (Fig.1; reviewed in (Huang and Reichardt 2003) (Fig.10).
Figure 10: Neurotrophins and their receptors. Neurotrophins (NTs) gather as dimers and bind to tyrosine
receptor kinases (Trk) or to p75 neurotrophin receptors (p75NTR). Trks have two main domains: the
extracellular, where the ligand binds and the spontaneous dimerization is prevented; and the intracellular,
responsible for the signal transduction within the cell. The Trk receptor-ligand binding occurs accordingly to
specific mature neurotrophin affinities (TrkA-NGF; TrkB-BDNF/NT-4; TrkC-NT-3), while the p75 binding is
characterized by the equality of pro-neurotrophins affinities. Ig C2, Immunoglobulin C2-type; NGF,
neurotrophin nerve growth factor; BDNF, brain-derived neurotrophic factor; NT-3, neurotrophin 3; NT-4,
neurotrophin 4; proNGF, NGF precursor; proBDNF, BDNF precursor (adapted from (Arevalo and Wu 2006).
Trks are prototypical receptor tyrosine kinases that dimerize upon ligand binding, which results in
their activation. Once activated, receptors initiate several signal transduction cascades, including the
mitogen activated protein kinase (MAP kinase) which promotes neuronal differentiation, the
phosphatidylinositol 3-kinase (PI-3K) which promotes survival and growth of neurons and other cells,
and the phospholipase C γ (PLC) pathway which promotes synaptic plasticity (Fig.11). In addition, NTs
can also bind to the p75 neurotrophin receptor (p75NTR) (Fig.11), which belongs to the tumor-
necrosis family. The preferred ligands for p75 receptor are the precursors of mature NTs rather than
the mature NTs, and the different pro-neurotrophins bind with equal affinity, even if it is lower than
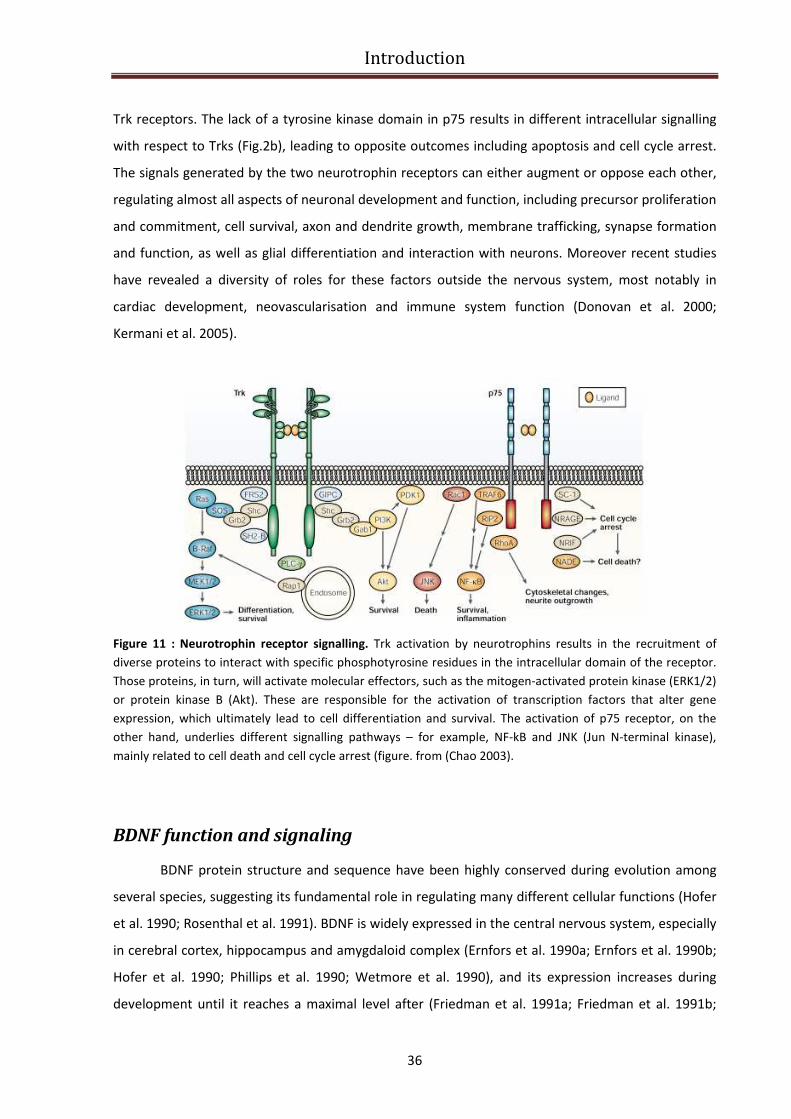
Introduction
36
Trk receptors. The lack of a tyrosine kinase domain in p75 results in different intracellular signalling
with respect to Trks (Fig.2b), leading to opposite outcomes including apoptosis and cell cycle arrest.
The signals generated by the two neurotrophin receptors can either augment or oppose each other,
regulating almost all aspects of neuronal development and function, including precursor proliferation
and commitment, cell survival, axon and dendrite growth, membrane trafficking, synapse formation
and function, as well as glial differentiation and interaction with neurons. Moreover recent studies
have revealed a diversity of roles for these factors outside the nervous system, most notably in
cardiac development, neovascularisation and immune system function (Donovan et al. 2000;
Kermani et al. 2005).
Figure 11 : Neurotrophin receptor signalling. Trk activation by neurotrophins results in the recruitment of
diverse proteins to interact with specific phosphotyrosine residues in the intracellular domain of the receptor.
Those proteins, in turn, will activate molecular effectors, such as the mitogen-activated protein kinase (ERK1/2)
or protein kinase B (Akt). These are responsible for the activation of transcription factors that alter gene
expression, which ultimately lead to cell differentiation and survival. The activation of p75 receptor, on the
other hand, underlies different signalling pathways – for example, NF-kB and JNK (Jun N-terminal kinase),
mainly related to cell death and cell cycle arrest (figure. from (Chao 2003).
BDNF function and signaling
BDNF protein structure and sequence have been highly conserved during evolution among
several species, suggesting its fundamental role in regulating many different cellular functions (Hofer
et al. 1990; Rosenthal et al. 1991). BDNF is widely expressed in the central nervous system, especially
in cerebral cortex, hippocampus and amygdaloid complex (Ernfors et al. 1990a; Ernfors et al. 1990b;
Hofer et al. 1990; Phillips et al. 1990; Wetmore et al. 1990), and its expression increases during
development until it reaches a maximal level after (Friedman et al. 1991a; Friedman et al. 1991b;
Introduction
37
Maisonpierre et al. 1990; Schecterson and Bothwell 1992). Then, the expression of BDNF seems not
to decline with age (Katoh-Semba et al. 1998; Narisawa-Saito and Nawa 1996). However, BDNF has
not only been found in the central nervous system, but its mRNA has been observed in numerous
other tissues and cell types like colon, intestine, leukocytes, ovary, spleen, thymus, testis, pancreas
and blood (Liu et al. 2005; Pruunsild et al. 2007; Rosenfeld et al. 1995). The widespread distribution
of BDNF among tissues underlines its importance in a large number of different cellular processes,
especially for what concerns neuronal function. BDNF, like the other neurotrophins is a
morphoregulatory molecule that supports cell proliferation, cell survival/death, differentiation, and
phenotype maintenance. New evidence indicates that BDNF is also involved in dendritogenesis and
axonogenesis (McAllister et al. 1997), spine formation and maturation, synaptogenesis and moreover
neuronal homeostasis, brain plasticity-related process such as memory and learning (Tyler et al.
2002; Yamada et al. 2002) and drug addiction (Ghitza et al. 2009). The regulation of synaptic
transmission and plasticity, peculiar for NT-3 and especially BDNF, was reported in a study carried by
Lohof and co-workers, demonstrating how such neurotrophins are able to potentiate synaptic
transmission in developing neuromuscular junction (Lohof et al. 1993). Alterations in BDNF
expression in specific neuronal subpopulations contribute to the onset of various pathologies,
including depression, epilepsy, Alzheimer’s- , Huntington’s- and Parkinson’s disease, and as
previously described, Rett syndrome (Binder 2004; Castren and Rantamaki; Cheng and Yeh 2003;
Gottschalk et al. 1998; Lu and Chow 1999; Murer et al. 2001; Russo-Neustadt and Chen 2005;
Zuccato et al. 2005).
One of the main actions of BDNF is connected to synaptic plasticity and in particular to long
term potentiation (LTP) and long term depression (LTD). It was demonstrated that BDNF expression
(Castren et al. 1993; Castren et al. 1992; Lu and Figurov 1997; Patterson et al. 1992; Zafra et al.
1990)and release (Goodman et al. 1996)are intimately correlated to synaptic activity, turning BDNF
into a prominent factor for mediating the effects of activity on morphology. It is well-established
that BDNF can exert its fast effects on synaptic transmission through post-translational modifications
of synaptic proteins, modifying synaptic response through a protein synthesis-independent
mechanism. A direct evidence of the role of BDNF in synaptic transmission came from studies using
knockout mice (Korte et al. 1995), in which LTP was severely impaired, and was rescued by both
application of exogenous BDNF or virus-mediated BDNF re-expression (Korte et al. 1996; Patterson et
al. 1996).
At pre-synaptic level, BDNF activation of TrkB receptor seems to contribute to LTP through
retrograde nuclear signaling, leading to transcriptional activation in pre-synaptic cell bodies (Gooney
et al. 2004). At post-synaptic level, BDNF modulates the sensitivity of NMDA receptors and promotes
Introduction
38
new protein synthesis of synapse-targeted transcripts (Messaoudi et al. 2002). From a molecular
point of view, BDNF induces the dimerization of TrkB, promoting the trans-phosphorylation of
specific residues in the intracellular domain of the receptor (Huang and Reichardt 2003). This event
induces the activation of three different signaling cascades (Fig.12) : the MAP Kinase, PI3 Kinase
pathway and the activation of Phospholipase Cγ (PLCγ). The phosphorylated tyrosine residues
provide a docking site for adaptor proteins such as Shc and Frs2, which induce Ras activation. The
latter initiates MAP kinase – signaling cascade, having as final target eIF4E (Initiation Factor 4E) that
in the phosphorilated form is able to initiate the translation of target transcripts (Bramham 2007).
Other studies showed that, in presynaptic terminals, BDNF potentiates glutamate release (Kang and
Schuman 1995; Takei et al. 1998) through the phosporylation of synapsin, a vesicular protein
requires for the fusion of vesicles with plasma membrane. BDNF activates PI3 kinase pathway, whose
downstream postsynaptic target is Akt, a crucial kinase able to phosphorilate mTOR (mammalian
Target of Rapamycin). The transduction pathway of mTOR is involved in the regulation of CAP-
dependent mRNA translation (Kang and Schuman 1996; Takei et al. 2001)and represents the
principal mechanism through which BDNF is able to induce local protein synthesis (LPS). In fact, even
if for the maintenance of LTP new mRNA transcription is required, during the induction phase only
protein synthesis from pre-existing mRNAs is needed. It is thought that this is the critic phase in
which de novo synthesis of synaptic proteins is regulated by BDNF signaling, achieving the long term
modification characteristic of synaptic plasticity (Kang and Schuman 1996; Ying et al. 2002). The last
intracellular pathway initiated by BDNF is the PLCγ cascade, that leads to the post-synaptic
phosphorilation of B2 subunit of NMDA receptor via CamKIIα (Frerking et al. 1998). This kinase is
then responsible for the BDNF-induced E-LTP that requires exclusively post-translational
modifications of synaptic proteins (Minichiello et al. 1999). The increase of intracellular Ca++
mediated by PLCγ signaling is able to induce also the activation of CamKIV and subsequently to the
transcription factor CREB (cAMP Responsive Element Binding Protein), thus allowing the transcription
of new genes that are required during the consolidation phase of L-LTP (Minichiello 2009).in
conclusion, we can state that PLCγ pathway is involved in both BDNF-dependent e-LTP induction
(through CamKIIα) and consolidation of L-LTP through de novo mRNA synthesis under the control of
CREB.
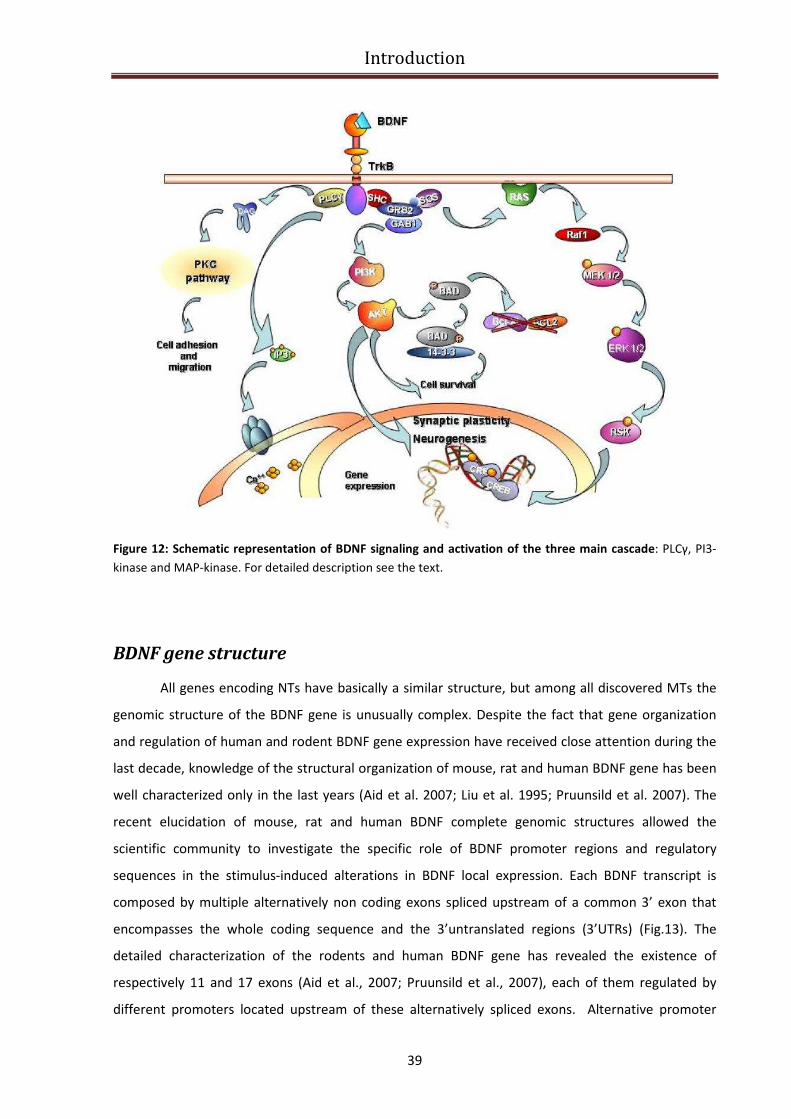
Introduction
39
Figure 12: Schematic representation of BDNF signaling and activation of the three main cascade: PLCγ, PI3-
kinase and MAP-kinase. For detailed description see the text.
BDNF gene structure
All genes encoding NTs have basically a similar structure, but among all discovered MTs the
genomic structure of the BDNF gene is unusually complex. Despite the fact that gene organization
and regulation of human and rodent BDNF gene expression have received close attention during the
last decade, knowledge of the structural organization of mouse, rat and human BDNF gene has been
well characterized only in the last years (Aid et al. 2007; Liu et al. 1995; Pruunsild et al. 2007). The
recent elucidation of mouse, rat and human BDNF complete genomic structures allowed the
scientific community to investigate the specific role of BDNF promoter regions and regulatory
sequences in the stimulus-induced alterations in BDNF local expression. Each BDNF transcript is
composed by multiple alternatively non coding exons spliced upstream of a common 3’ exon that
encompasses the whole coding sequence and the 3’untranslated regions (3’UTRs) (Fig.13). The
detailed characterization of the rodents and human BDNF gene has revealed the existence of
respectively 11 and 17 exons (Aid et al., 2007; Pruunsild et al., 2007), each of them regulated by
different promoters located upstream of these alternatively spliced exons. Alternative promoter
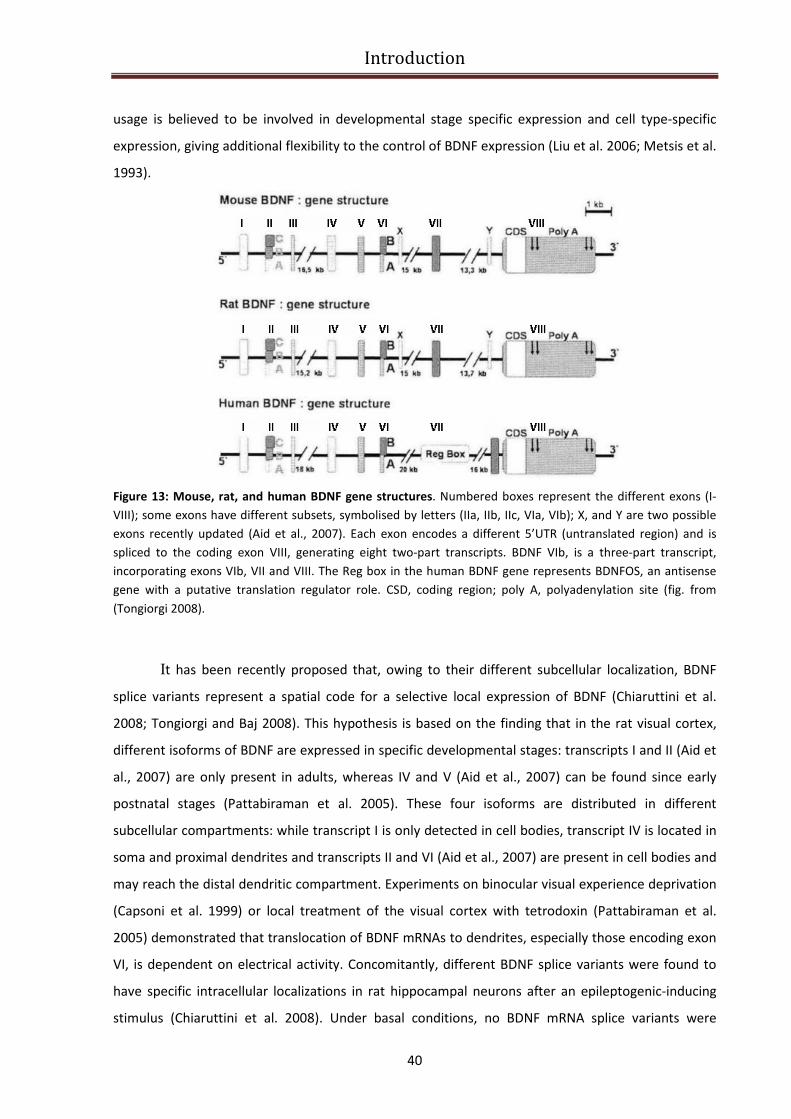
Introduction
40
usage is believed to be involved in developmental stage specific expression and cell type-specific
expression, giving additional flexibility to the control of BDNF expression (Liu et al. 2006; Metsis et al.
1993).
Figure 13: Mouse, rat, and human BDNF gene structures. Numbered boxes represent the different exons (I-
VIII); some exons have different subsets, symbolised by letters (IIa, IIb, IIc, VIa, VIb); X, and Y are two possible
exons recently updated (Aid et al., 2007). Each exon encodes a different 5’UTR (untranslated region) and is
spliced to the coding exon VIII, generating eight two-part transcripts. BDNF VIb, is a three-part transcript,
incorporating exons VIb, VII and VIII. The Reg box in the human BDNF gene represents BDNFOS, an antisense
gene with a putative translation regulator role. CSD, coding region; poly A, polyadenylation site (fig. from
(Tongiorgi 2008).
It has been recently proposed that, owing to their different subcellular localization, BDNF
splice variants represent a spatial code for a selective local expression of BDNF (Chiaruttini et al.
2008; Tongiorgi and Baj 2008). This hypothesis is based on the finding that in the rat visual cortex,
different isoforms of BDNF are expressed in specific developmental stages: transcripts I and II (Aid et
al., 2007) are only present in adults, whereas IV and V (Aid et al., 2007) can be found since early
postnatal stages (Pattabiraman et al. 2005). These four isoforms are distributed in different
subcellular compartments: while transcript I is only detected in cell bodies, transcript IV is located in
soma and proximal dendrites and transcripts II and VI (Aid et al., 2007) are present in cell bodies and
may reach the distal dendritic compartment. Experiments on binocular visual experience deprivation
(Capsoni et al. 1999) or local treatment of the visual cortex with tetrodoxin (Pattabiraman et al.
2005) demonstrated that translocation of BDNF mRNAs to dendrites, especially those encoding exon
VI, is dependent on electrical activity. Concomitantly, different BDNF splice variants were found to
have specific intracellular localizations in rat hippocampal neurons after an epileptogenic-inducing
stimulus (Chiaruttini et al. 2008). Under basal conditions, no BDNF mRNA splice variants were

Introduction
41
detected in distal dendrites; however, in response to pilocarpine administration, exons II and VI were
found in the dendrites, whereas I and IV continued to be confined to cell soma. Curiously, after
kainate administration, only exon VI was found in dendrites. Since the pilocarpine model induces a
more dramatic status epilepticus than kainate, the different pattern of distribution of BDNF mRNA is
thought to be involved with its main targeting to the most active synapses. Overall, the results
suggest that activity dependent expression of different splice variants may act as a spatial code,
guarantying the accurate delivery of BDNF to specific targets in the cell soma or along the dendrites,
where it can have diversified functions (Tongiorgi 2008). Importantly, recent studies reported that
dendritic release of BDNF act mostly on a local scale, affecting nearby dendrites of recipient cells
(Horch and Katz 2002; Nagappan and Lu 2005).
BDNF expression regulation
Unraveling the regulation of BDNF gene expression is important for understanding its
contribution to nervous system function and pathology. Given the high complexity of BDNF gene
structure and the number of cellular processes in which this neurotrophin is involved, it’s likely that
its expression is a fine controlled process that occurs at different levels (transcriptional, translational,
post-translational, and epigenetic regulation) and through several factors (cis-acting and trans-acting
factors).
BDNF transcriptional regulation
In mouse and rat, BDNF mRNA is expressed throughout development and differentially in
adult tissues (Ernfors et al. 1990a; Hofer et al. 1990; Hohn et al. 1990). In the brain, BDNF mRNA
becomes detectable during embryonic development, reaching the highest levels by days 10 to 14
postnatally and decreasing thereafter. In the adult animal BDNF is expressed throughout the brain,
with the highest levels in the neurons of hippocampus (Conner et al. 1997; Ernfors et al. 1990a; Hofer
et al. 1990). Neuronal BDNF expression is affected by many stimuli, such as GABAergic and
glutamatergic neurotransmission and membrane depolarization through calcium-mediated pathway
(Ghosh et al. 1994; Shieh and Ghosh 1999; West et al. 2001; Zafra et al. 1991; Zafra et al. 1990).
Regulation of BDNF has been thoroughly studied in rodents. Rat BDNF (rBDNF) gene was first
discover to have four promoters driving expression of transcripts containing different 5’exons spliced
to a single coding exon (Timmusk et al. 1993). Up to now, it has been found that rodent BDNF
contains nine exons (Aid et al. 2007), and each of them is supposed to contain a different promoter
activity (Aid et al. 2007).Several transcription factors contributing to the regulation of BDNF
Introduction
42
promoters have been characterized. rBDNF promoter IV (pIV) is upregulated via cAMP response
element binding protein (CREB) (alias CREB1) binding to a cAMP/ Ca 2+
-response element (CRE)(Shieh
et al. 1998; Tao et al. 1998).This is modulated by upstream stimulatory factors (USFs) and calcium-
responsive transcription factor (CaRF) binding to an E-box element and a CaRE1 (Ca2+
-response
element 1) element, respectively (Chen et al. 2003; Tao et al. 2002). Additionally, MeCP2 (methyl-
CpG-binding protein 2), BHLHB2 (basic helix-loop-helix B2) and NF B (nuclear factor B) have been
shown to regulate rodent pIV (Chen et al. 2003; Jiang et al. 2008). However, CRE plays a central role
because knock-in mutation of CRE blocks mouse BDNF (mBDNF) pIV activityresponsiveness in vivo
(Hong et al., 2008). Exon I of rBDNFis also induced by neuronal activity (Timmusk et al., 1993). CREB,
USFs, MEF2D (myocyte enhancer factor 2D), and NFkB have been implicated in mediating the
induction (Lubin et al. 2007; Tabuchi et al. 2002). Additionally, NPAS4 (neuronal PAS domain protein
4) has been shown to bind pI and pIV of mBDNF(Lin et al. 2008), but the binding sites were not
specified. Finally, BDNF exon IXa transcripts are also upregulated, whereas levels of mRNAs with
other 5 exons are elevated to a lesser extent or not influenced by neuronal activity (Koppel et al.
2009).
To enable studying human BDNF (hBDNF) transcription, hBDNF gene structure was described
(Pruunsild et al., 2007). Similarly to rodent BDNF, multiple 5’ exons are spliced to a single coding exon
in human, and altogether, the hBDNF gene contains 11 exons and nine promoters (Pruunsild et al.,
2007). Importantly, there are two human-specific exons in hBDNF and, additionally, the locus
comprises a non-coding antisense gene that is absent in rodents (Pruunsild et al., 2007). Although
much is known about regulation of rodBDNF, regulation of hBDNF by neuronal activity has been
poorly studied. In a recent paper of 2011, Pruunsild and colleagues have studied regulation of human
BDNF (hBDNF) transcription by membrane depolarization of cultured mouse or rat primary cortical
neurons expressing hBDNF gene or transfected with hBDNF promoter constructs, respectively. They
identified an asymmetric E-box-like element, PasRE [basic helix-loop-helix (bHLH)-PAS transcription
factor response element], in hBDNF promoter I and demonstrate that binding of this element by
bHLH-PAS transcription factors ARNT2 (aryl hydrocarbon receptor nuclear translocator 2) and NPAS4
(neuronal PAS domain protein 4) is crucial for neuronal activity-dependent transcription from
promoter I. They showed that binding of CREB (cAMP response element-binding protein) to the
cAMP/Ca2+
-response element (CRE) in hBDNF promoter IV is critical for activity-dependent
transcription from this promoter and that upstream stimulatory factor (USF) transcription factors
also contribute to the activation by binding to the upstream stimulatory factor binding element (UBE)
in hBDNFpromoter IV. They also demonstrated that CRE and PasRE elements in hBDNF promoter IX
are required for the induction of this promoter by neuronal activity (Pruunsild et al. 2011)
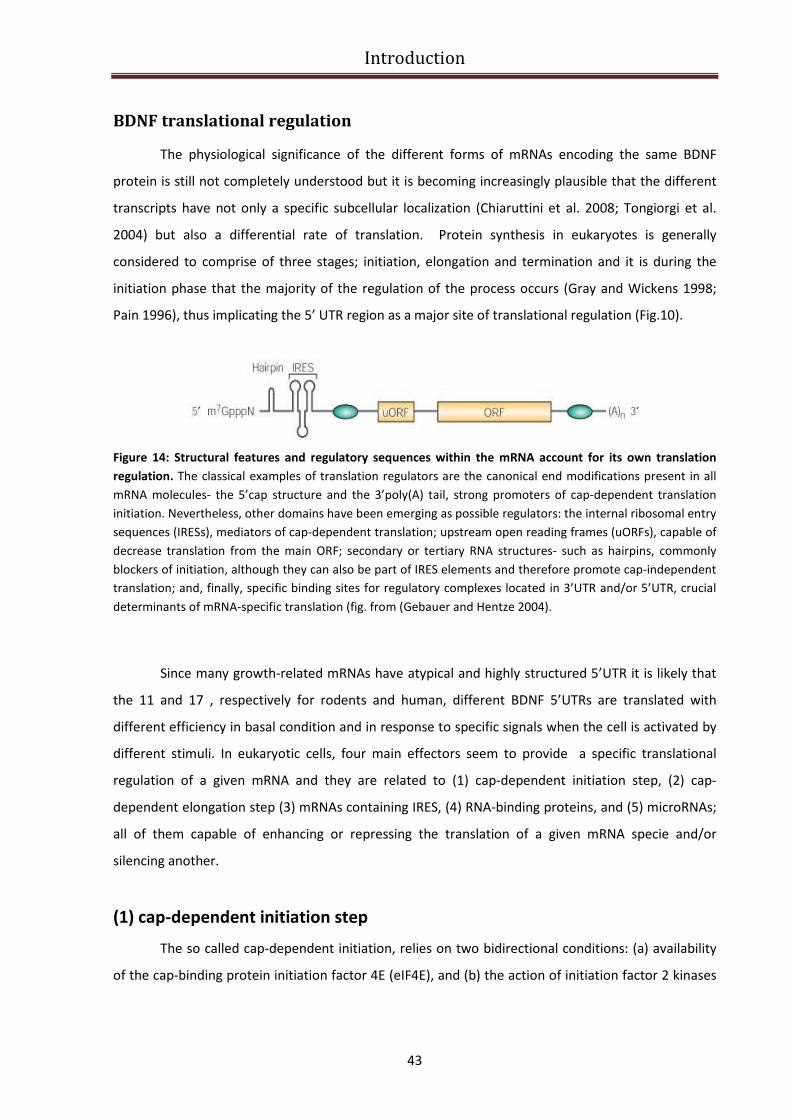
Introduction
43
BDNF translational regulation
The physiological significance of the different forms of mRNAs encoding the same BDNF
protein is still not completely understood but it is becoming increasingly plausible that the different
transcripts have not only a specific subcellular localization (Chiaruttini et al. 2008; Tongiorgi et al.
2004) but also a differential rate of translation. Protein synthesis in eukaryotes is generally
considered to comprise of three stages; initiation, elongation and termination and it is during the
initiation phase that the majority of the regulation of the process occurs (Gray and Wickens 1998;
Pain 1996), thus implicating the 5’ UTR region as a major site of translational regulation (Fig.10).
Figure 14: Structural features and regulatory sequences within the mRNA account for its own translation
regulation. The classical examples of translation regulators are the canonical end modifications present in all
mRNA molecules- the 5’cap structure and the 3’poly(A) tail, strong promoters of cap-dependent translation
initiation. Nevertheless, other domains have been emerging as possible regulators: the internal ribosomal entry
sequences (IRESs), mediators of cap-dependent translation; upstream open reading frames (uORFs), capable of
decrease translation from the main ORF; secondary or tertiary RNA structures- such as hairpins, commonly
blockers of initiation, although they can also be part of IRES elements and therefore promote cap-independent
translation; and, finally, specific binding sites for regulatory complexes located in 3’UTR and/or 5’UTR, crucial
determinants of mRNA-specific translation (fig. from (Gebauer and Hentze 2004).
Since many growth-related mRNAs have atypical and highly structured 5’UTR it is likely that
the 11 and 17 , respectively for rodents and human, different BDNF 5’UTRs are translated with
different efficiency in basal condition and in response to specific signals when the cell is activated by
different stimuli. In eukaryotic cells, four main effectors seem to provide a specific translational
regulation of a given mRNA and they are related to (1) cap-dependent initiation step, (2) cap-
dependent elongation step (3) mRNAs containing IRES, (4) RNA-binding proteins, and (5) microRNAs;
all of them capable of enhancing or repressing the translation of a given mRNA specie and/or
silencing another.
(1) cap-dependent initiation step
The so called cap-dependent initiation, relies on two bidirectional conditions: (a) availability
of the cap-binding protein initiation factor 4E (eIF4E), and (b) the action of initiation factor 2 kinases
Introduction
44
(eIF2K). Interestingly, both conditions take advantage of the inducible phosphorylation events, which
can be regulated by the upstream kinases or phosphatases.
Translation initiation is a complex process that begins with the interaction of the cap-binding
protein complex, eukaryotic initiation factor-4F (eIF4F),with the mRNA 5′-end cap structure
(m7GpppN; where N is any nucleotide) (Fig.10). eIF4F comprises three subunits: eIF4E, which is the
cap-binding protein; eIF4A,which is an RNA helicase; and the scaffolding protein eIF4G that bridges
the mRNA and the ribosome through eIF3, which binds the ribosome directly. The 40S ribosomal
subunit with its associated initiation factors is thought to scan the 5′ untranslated region (UTR) until
it recognizes the initiation codon AUG. The recognition of the initiation codon triggers hydrolysis of
the eIF2-bound GTP, release of the initiation factors, and concomitant joining of the 60S ribosomal
subunit to generate a complete 80S ribosome, which is competent to enter the elongation phase of
translation. Several eIF4E-binding proteins (eIF4E-BPs) form a common family of proteins who share
a small domain required for the eIF4E and eIF4G association. Thus, a hypophosphorylated eIF4E-BP is
able to bind eIF4E, competitively displaying eIF4G and consequently translation inhibition occurs.
This repression is released by the induction of eIF4E-BPs hyperphosphorylation, usually associated to
extracellular cues able to activate the ERK and mTOR pathways, like TrkB activation which depend on
BDNF (Takei et al. 2001). Conversely, environmental cues - such as amino-acid starvation, heme
depletion, viral infection, UV or ER stress - play a crucial role in determining the eIF2α activity. eIF2α
represents the target of at least four known kinases - GCN2 (amino-acid regulated eIF2K), HRI (heme-
regulated eIF2K, PKR (RNA-dependent eIF2K), and PERK (PKR-like endoplasmic reticulum eIF2K) that
are activated under different environmental conditions (Klann and Dever 2004). eIF2α needs to be in
its GTP-bound form to bind Met-tRNAi, thus creating the ternary complex that in turn can assemble
40S, forming the 43S pre-initiation complex. So, phosphorylation of eIF2α makes all this events
impossible, thus being related to a global decrease in the translation rate. Nevertheless, this
modification can also result in activation of specific mRNAs, as shown by Carnevalli and colleagues
(Carnevalli et al. 2006).

Introduction
45
Figure 15: Assembly of the translational initiation complex in eukaryotes(reproduced from (Klann et al. 2004).
For detailed explanation see the text.
Other mRNAs, characterized by the presence of a terminal oligopyrimidine tract in their
5’UTR (5’TOPs), can undergo enhanced translation through an mTOR-dependent pathway (Liao et al.
2007; Schratt et al. 2004) involving the activation of p70S6K (ribosomal protein S6 kinase, 70KDa).
Remarkably, 5’TOPs encode ribosomal proteins and other translation elements (Jefferies et al. 1997),
such as the RNA helicase eIF1A or the elongation factor eEF2 that can be translocated to the
dendritic compartment (Miyata et al. 2005; Smart et al. 2003). Curiously, the dendritic expression of
these 5’TOPs is upregulated by late-LTP stimulation, an event that is related to a sustained mTOR and
p70S6K activation, but not by early-LTP (Tsokas et al. 2005; Tsokas et al. 2007). This suggests 5’TOPs
as critical players in the maintenance of translation capacity during periods of intensive protein
synthesis.
(2) regulation of cap-dependent elongation step
Though the initial step of translation is thought to be the main point of regulation of protein
synthesis, elongation factor 2 (eEF2), a GTP-binding protein that mediates the translocation of
peptidyl-tRNA from the A to the P site on the ribosome, has been emerging as a possible translation
Introduction
46
modulator. Like initiation factors, eEF2 can also be phosphorylated, this time by EF2 kinase,
consequently inducing reduction of peptide elongation, a phenomenon that has been strictly related
to NMDAR activation (Marin et al. 1997); yet, it can be reversed by PP2A, a protein phosphatase that
has a decreased activity following both NMDA- and BDNF-dependent LTP induction (Scheetz et al.
1997) (Takei et al. 2009). Moreover, EF2K activity is, by its turn, regulated by other protein kinases,
namely those involved in the stress-response signalling- such as p38, or S6 kinase and mTOR. All
these data suggests that regulation of peptide elongation via eEF2 phosphorylation can indeed be
responsible for local increases in the synthesis of specific proteins during activity-dependent synaptic
change (Scheetz et al. 2000). Furthermore, chemical long-term potentiation (chemLTP, an NDMAR-
dependent form of plasticity, in which spontaneous bursts are induced by high concentrations of K+
and Ca2+, and cyclic AMP/adenylyl cyclase signalling), was related to a decrease of overall protein
synthesis in the hippocampus (Chotiner et al. 2003); and yet, it also induced an enhanced expression
of Arc (also seen in (Park and Tang 2009). Although it remains to be determined whether this type of
translation regulation occurs in other forms of protein synthesis-dependent synaptic plasticity, this
mechanism seems to favour the translation of poorly initiated mRNAs.
(3) mRNAs containing IRES
In many cases , long and highly structured 5’UTR harbour internal ribosome entry sites (IRESs).
Interestingly, some of the established dendritic mRNAs important to synaptic activity-such as
αCaMKII, Arc, or MAP2 (Klann et al. 2004; Pinkstaff et al. 2001), contain secondary structures or
multiple AUG codons that normally would block 43S complex from scanning the 5’UTR properly.
Therefore, this cap-independent mechanism seems to favour translation of specific mRNAs when the
cell renders cap-dependent translation inefficient. The IRES-mediated translation is the only
validated cap-independent translational mechanism since the IRES directly recruits ribosomes,
thereby bypassing the requirement for the mRNA 5′ cap structure and eIF4E (Jang et al. 1988;
Pelletier and Sonenberg 1988). IRESs were initially discovered in picornaviruses (Pelletier and
Sonenberg 1988), where they initiate the translation of viral RNAs that are naturally uncapped (and
yet efficiently translated). Cellular IRESs have been described in a limited, but growing number of
mRNAs encoding proteins that have important roles in cell growth and proliferation, differentiation
and the regulation of apoptosis. This is, perhaps, not surprising given that these cellular processes
require the strict control of gene expression. IRES-mediated translation provides a means for
escaping the global decline in protein synthesis and allows the selective translation of specific
mRNAs. The precise molecular mechanism of cellular IRES directed translation is not completely
understood. Cellular IRESs are often found in long and structured 5′ UTRs, and are relatively

Introduction
47
inefficient in directing translation under physiological conditions that favor cap-dependent
translation (Stoneley and Willis 2004). However, IRESs continue to function when cap-dependent
translation is compromised. This is because IRES translation is independent of the presence or
integrity of several canonical initiation factors (primarily eIF4E)13. Efficient IRES-dependent
translation requires auxiliary cellular proteins that are known as IRES trans-acting factors (ITAFs).
Several ITAFs have been implicated in IRES-mediated translation, although the requirement for these
proteins is not absolute and seems to be IRES specific (Martinez-Salas and Fernandez-Miragall 2004).
An increasing literature suggests that the 5’ UTRs of some dendritically translated mRNAs allow for
more efficient translation via an IRES that allows initiator-independent translation (Gromeier et al.
1999; Jopling and Willis 2001; Pinkstaff et al. 2001). There are few consensus sites for IRES function,
and it is not yet clear if BDNF contains such sequences, but future studies examining these
possibilities are warranted. Of note, a recent preliminary report suggests that an untranslated exon
of the human BDNF gene may contain an IRES function (Zaitsev and Lu, 2003).
(4) RNA-binding proteins
Many of the translational control mechanism acting at 3’UTR involve the recognition of cis-acting
sequences by specific trans-acting factors that can either promote or repress translation. Notably,
many of these regulators are actually RNA binding protein that can exert a dual role in transporting
and regulating mRNA expression through interaction with 5’UTR binding factors. The 3’UTR of a
selected group of mRNAs, including the best known case αCaMKII, contains sequences that allow the
binding of RNA-binding proteins . Several mRNA-binding proteins have been described: CPEB
(cytoplasmatic polyadenylation binding element), ZBP1 (zipcode-binding protein), and FMRP (fragile-
X mental retardation protein), bind to their respective specific target mRNAs- αCaMKII, tPA, IRSp53,
β-actin via their particular cis-elements- cytoplasmatic polyadenylation element (CPE), zipcode, or
cytoplasmic FMR1-interacting protein 1 (CYFIP1), respectively (Richter and Klann 2009).
Nevertheless, specific eIF4E-BPs can tether to the described mRNA-protein interactions, thus
inhibiting the translation until proper stimulation
One of the best characterized mechanism of mRNA binding-protein mediated translational
regulation is mediated by CPEB, a sequence specific RNA binding protein that governs both mRNA
sorting in dendrites as well as translational repression of dorman mRNAs and activity dependent
polyadenilation, that in turn promotes translational activation (Huang et al. 2003). Translational
repression is exerted by interaction of CPEB with Maskin, that builds a complex with two other
additional proteins, the poly(A)ribonuclease PARN that are hold together with the scaffolding protein
symplekin (Barnard et al. 2004). Maskin contains an eIF4E binding domain similar to the eIF4G
Introduction
48
binding pocket, and therefore acts as a mRNA specific 4EBP, thus inhibiting the assembly of the eIF4E
complex and translational initiation (Stebbins-Boaz et al. 1999). Once again, this repression is
released by phosphorylating eIF4E-BPs, by an activity-dependent process.
(5) microRNAs
Small noncoding RNAs- miRNAs, are able to bind 3’UTR sequences of target mRNAs, blocking
translation or degradating transcripts. The huge number of target mRNAs added to the possibility of
many miRNAs to regulate one single mRNA, make this regulatory mechanism quite complex (see
(Konecna et al. 2009)for a detailed review). So far, miR-134, a brain specific miRNA found in the
synaptodendritic domain, is known to negatively regulate dendritic spine morphogenesis in cultured
hippocampal neurons. It acts by binding and consequently repressing Lim domain kinase 1 (LIMK1)
translation, an action that can be upturned by the BDNF-dependent mTOR activation (Schratt et al.
2006) (Ashraf and Kunes 2006). LIMK1 regulates actin filament dynamics though inhibition of
ADF/cofilin (Bamburg et al. 1999), being involved in spine morphology regulation. Interestingly, it has
been shown that also miRNA132 is a direct target of BDNF regulation through CREB mediated
transcription. The authors have identified p250GAP as a major target transcripts for this miRNA,
whose BDNF-dependent expression downregulates p250GAP protein levels, to promote neurite
outgrowth (Vo et al. 2005).
Introduction
49
Therapeutic approaches to RTT
Rescue via MeCP2 overexpression
The absence of neuronal degeneration in MeCP2 disorders asks the question of whether
restoring MECP2 expression would restore normal neuronal function and reverse the resulting
disease phenotypes. Recent work by Guy et al. (Guy et al. 2007)and Giacometti et al.(Giacometti et
al. 2007) provide evidence supporting the feasibility of a reversal of the disease in mouse models of
RTT.
Guy et al. created a mouse in which endogenous Mecp2 is silenced by insertion of a Lox-Stop
cassette and can be conditionally activated through Cre-mediated deletion of the cassette. The
Mecp2 lox-Stop
allele behaved as a null mutation, and its activation was controlled by a tamoxifen-
inducible (TM-inducible) Cre transgene. Acute TM injections caused sudden activation of Mecp2 and
led to either rapid death or complete phenotypic rescue of the null mice. The associated toxicity
resembled that caused by MeCP2 overexpression and was not due to the TM injections. A more
gradual approach for induction was obtained using smaller and repeated doses of TM which
eliminated the toxicity and reversed the late-onset neurological phenotype. These results indicate
that MeCP2-deficient neurons are not permanently damaged, since Mecp2 activation leads to robust
abrogation of advanced neurological defects in both young and adult animals. The authors suggested
that neuronal MeCP2 target sites are defined by DNA methylation patterns that are preserved in its
absence and that guide newly synthesized MeCP2 to its correct chromosomal positions. MeCP2 then
resumes its role as interpreter of the DNA methylation signal required for normal neuronal function
(Guy et al., 2007). The striking importance of this work consists in the demonstration that the
consequences of MeCP2 loss of function are reversible, and that the neurological defects in RTT, and
other MECP2 disorders, are not impervious to therapeutic possibilities.
In an independent study, Giacometti and colleagues demonstrated partial disease rescue by
postnatal reactivation of MeCP2 in mutant animals (Giacometti et al. 2007). Indeed, previous results
from the same research group demonstrated that a Tau promoter-driven reactivation of a Mecp2
transgene in postmitotic mutant neurons prevents development of an obvious phenotype, consistent
with the conclusion that RTT is not a developmental disorder but rather is caused by MeCP2
deficiency in mature neurons (Luikenhuis et al. 2004). However, these experiments did not resolve
the important question of whether later reactivation of MeCP2 in postnatal life could affect the
phenotype progression. In the following paper of 2007, they showed that induction of a Mecp2
transgene in postnatal mutant animals delayed onset of symptoms and time of death. To achieve
activation of MeCP2 in postnatal neurons, they constructed a conditionally active rescue transgene
Introduction
50
by placing a LoxP–Stop–LoxP (LSL) cassette in front of the Mecp2e2 cDNA. The LSL-Mecp2 transgene
was then placed on a Mecp2 null background to determine if it could rescue upon excision of the
Stop signal. Four different Cre transgenes, as follows, were tested to activate Mecp2: Nestin-Cre in
neuronal and glial precursors; Tau-Cre in postmitotic neurons during embryogenesis; CaMKII-Cre 93
(C93) in the forebrain, hippocampus, midbrain, and brainstem at postnatal day (P) 0–P15; or CaMKII-
Cre 159 (C159) in the forebrain at P15–P30. Although activation of the LSL-Mecp2 transgene
prolonged the lifespan and delayed motor deterioration of Mecp2-/Y mice, the extent of rescue
directly correlated with the time, level, and site of Cre expression. The most efficient symptomatic
rescue was obtained in lines that provided early and wide Cre expression in most neurons (Nestin-
Cre and Tau-Cre), extending the lifespan of mutant mice to 8 months. Postnatal MeCP2 activation in
C93 and C159 lines extended the life span by 4 weeks, with the earlier C93 expression giving a more
efficient rescue than the later C159 expression (Giacometti et al. 2007). The most important
conclusion from these results is that reactivation of MeCP2 in mutant animals even as late as 2–4
weeks of age can result in a significant amelioration of RTT-like symptoms. However, full restoration
of the phenotype was not achieved with any of the rescue transgenes, even when the transgene was
activated early in development in progenitor cells (Nestin Cre) or at a time when neurons become
postmitotic (Tau Cre). Inappropriate expression of MeCP2 probably contributed to this partial rescue.
Although it would be difficult to reverse a mutation in the Mecp2 gene, it may be possible to
modulate the activity of downstream genes that have been shown to impact the phenotype
progression, such as Bdnf.
Rescue via BDNF overexpression
In 2006, Chang and colleagues demonstrated that the overexpression of BDNF in the Mecp2
mutant brain led to later onset/slower disease progression (Chang et al. 2006). Several aspects of the
Mecp2 mutant phenotype were ameliorated by postnatal ectopic expression of BDNF. For example,
BDNF overexpression markedly improved the locomotor function of the Mecp2 mutant mice and it is
possible that the improved motor function allows mutant mice more efficient access to food and
water, which may, at least in part, explain the significant extension of lifespan. Furthermore, BDNF
overexpression rescued an electrophysiological deficit in the Mecp2 mutant cortex, resulting in an
increased spontaneous firing of layer 5 pyramidal neurons. This result is consistent with many
previous reports that studied the effect of BDNF on synaptic transmission (Schuman 1999). It is
possible that the overexpression of BDNF in Mecp2 mutant brains also increased neuronal activity in
other parts of the brain, such as the motor cortex, which contributed to the enhanced locomotor
function.
Introduction
51
In 2009, Larimore and co-workers confirmed that pyramidal neurons transfected with a
plasmid encoding a small hairpin RNA (shRNA) to knockdown endogenous Mecp2 had shorter
dendrites than control untransfected neurons, without detectable changes in axonal morphology. On
the other hand, overexpression of wildtype (wt) human MECP2 increased dendritic branching, in
addition to axonal branching and length. Consistent with reduced neuronal growth and complexity in
Rett syndrome (RTT) brains, overexpression of human MECP2 carrying missense mutations common
in RTT individuals (R106W or T158M) reduced dendritic and axonal length. They demonstrated that
the extracellular BDNF scavenger TrkB-Fc prevented dendritic overgrowth in wild type MECP2-
overexpressing neurons, while overexpression of the Bdnf gene reverted the dendritic atrophy
caused by Mecp2-knockdown. These results demonstrate that BDNF is able to revert the dendritic
atrophy caused by Rett-associated MECP2 mutations (Larimore et al. 2009).
It is worthy to note that BDNF overexpression can also be achieved by means of a
pharmacological treatment. In 2007, Ogier and collaborators focused their research on neural
structures important for cardiorespiratory control, including the nodose cranial sensory ganglia (NGs)
and brainstem, which exhibit the earliest and most significant known deficits in BDNF expression in
the Mecp2 null mouse brain (Wang et al. 2006). Because BDNF is required for the development of NG
and brainstem respiratory neurons, as well as breathing (Katz 2005), they hypothesize that BDNF
deficits contribute to the RTT-like respiratory phenotype of Mecp2 null mice. They examined BDNF
expression in NG neurons cultured under depolarizing and nondepolarizing conditions and they
observed that Mecp2 null cells exhibit significantly lower levels of BDNF expression than wild type,
under both depolarizing and nondepolarizing conditions. However, they showed that BDNF levels in
mutant cells could be elevated to wild-type resting levels by depolarizing stimuli in vitro. Similarly,
they found that treatment of Mecp2 null mice with the ampakine drug, which enhances activation of
glutamatergic AMPA receptors (Nagarajan et al. 2001), elevated NG BDNF levels in vivo. Moreover,
ampakine treatment significantly improved respiratory function in Mecp2 null mice, suggesting that
this class of compounds may be of therapeutic value in RTT.
In a recent paper of 2010, Ben-Zeev B. and collaborators, tried to increase BDNF expression
in MeCP2 null mice treating mice with Glatiramer acetate (GA, Copolymer 1, Copaxone) an
immunomodulator with proven safety and efficacy in Multiple Sclerosis, which has been reported to
cause elevated secretion of BDNF both in animal model and in MS patients (Ben-Zeev et al. 2010).
Their results are not still conclusive due to the small number of MeCP2 null treated mice, but the
preliminary results are encouraging, because of a marked enhancement of GA induced BDNF
expression in mice cortex.
Introduction
52
Pharmacological treatment for RTT
Mecp2-deficient mice present developmental deficits of the bioaminergic systems
developmentally correlated with the breathing difficulties (Viemari et al. 2005). Norepinephrine (NE)
content is initially reduced in the medulla oblongata of Mecp2-deficient mice at 1 month of age and,
close to death, the serotoninergic contents is also affected. These neurochemical deficiencies are in
part explained by a specific decrease in the number of medullary neurons expressing TH, a rate
limiting enzyme of catecholamine synthesis. Interestingly, it has been shown in vitro, using Mecp2-
deficient brainstem slices, that NE application was able to stabilize the firing pattern of the
respiratory pacemaker neurons (Viemari et al. 2005). Therefore, Roux and colleagues hypothesized
that a pharmacological treatment designed to stimulate NE metabolism could possibly improve
breathing in the context of Mecp2 deficiency (Roux et al. 2007). They used desipramine (DMI) which
is a tricyclic antidepressant widely used in the treatment of depressive symptoms and is one of the
agents most selective for the NE system(Frazer 2001). Its mode of action is the inhibition the NE
reuptake in nerve terminals through the blocking of the NE-selective transporter proteins, thereby
increasing the availability of NE in the synaptic cleft. They showed that 3 days of DMI treatment is
able to reduce the number of apneas of Mecp2-deficient mice and increase the number of TH-
expressing neurons. Interestingly, a longer treatment (2 weeks) restored a normal number of TH-
expressing cells in Mecp2-deficient mice and restored the normal breathing phenotype in mice (Roux
et al., 2007).
In 2008, Tropea and collaborators proposed systemic treatment of MeCP2 mutant mice with an
active peptide fragment of Insulin-like Growth Factor 1 (1-3 IGF-1). Like BDNF, IGF-1 is widely
expressed in the CNS during normal development (D'Ercole et al. 1996), strongly promotes neuronal
cell survival and synaptic maturation (O'Kusky et al. 2000), and facilitates the maturation of
functional plasticity in the developing cortex. BDNF stimulates synaptic strengthening via a pathway
involving PI3K/pAkt/ PSD-95 and MAPK signaling, and IGF-1, which stimulates the same pathways as
BDNF (Zheng and Quirion 2004), has been shown to elevate excitatory postsynaptic currents (Ramsey
et al. 2005). The biological action of IGF-1 is also regulated by the binding of IGF binding proteins
(IGFBP1–6), which may be of significance to RTT and other disorders. IGFBP3, for example, has a
binding site for the MeCP2 protein, and MeCP2 null mice and RTT patients express aberrantly high
levels of IGFBP3 (Itoh et al. 2007), which can be expected in turn to inhibit IGF-1 signaling. Depressed
IGF-1 signaling has indeed been implicated in autism spectrum disorder (Riikonen et al. 2006). Infact
(1-3)IGF-1 ameliorates symptoms of RTT in MeCP2 null mice. Specifically, (1-3)IGF-1 treatment leads
to a partial rescue of nine separate measures of organismal function, as well as brain structure and
function: (i) lifespan, (ii) locomotor activity, (iii) respiratory function, (iv) heart rate, (v) brain weight,
Introduction
53
(vi) concentration of a postsynaptic density protein in motor cortex, (vii) spine density on motor
cortex neurons, (viii) excitatory synaptic transmission in sensorimotor cortex neurons, and (ix)
cortical circuit plasticity. Although the treatment with IGF-1 didn’t significantly restore all the
symptoms of RTT in mutant mice, which still died prematurely, the results presented in this paper
pointed to a potential utility of full-length IGF-1 or its derivatives in the treatment of RTT.
Clinical trials for RTT
Currently there is no cure for Rett syndrome but since 2004 at least 3 different drug clinical
trials have been carried on and they are still ongoing, recruiting participants. The first one is the trial
of Dextromethorphan (DM), which acts by blocking NMDA/glutamate receptors. The rationale which
underlies this trial is that increased brain glutamate and its NMDA receptors found in the brain of
younger Rett syndrome (RTT) patients cause toxic damage to neurons, and contributing to EEG
spikes. This study is being done to determine if DM will prevent the harmful over-stimulation of the
neurons thereby reducing EEG spike activity. Treatment with DM consists of one of 3 different doses
(0.25 mg/kg per day; or 2.5 mg/kg/day; or 5mg/kg/day), and aims to find out which dose if any will
help improve EEG abnormalities, behavior, cognition, and reduce seizures, as well as improve
breathing abnormalities, motor capabilities and bone density. The second one is a pilot study on the
effects of desipramine (DMI) on the neurovegetative parameters of RTT patients and its rationale
comes from the previously described work by Roux and colleagues of 2007 (Roux et al. 2007). In this
study, 2 different doses of DMI will be tested and the primary outcome will be the assessment of
DMI efficacy on the respiratory abnormalities. The last trial concerns the treatment of RTT patients
with IGF-1 and the main purposes of this project are: 1) determine if IGF-1 has any effect on
normalizing RTT children’s pulse, blood pressure and breathing pattern 2)assess the safety of IGF-1 in
children with RTT, and 3)prove the efficacy of IGF-1 in improving child's behavior, communication,
and speech.
Current projects for Rett Syndrome
Despite the complex and terrible constellation of symptoms, as discussed above, RTT has
been reversed in pre-clinical models of the disease. Based on this 2007 breakthrough, the Rett
Syndrome Research Trust has identified three broad approaches for the treatment and cure of RTT:
a) increase levels of MeCP2; b) ameliorate individual symptoms via existing drugs; c) target modifier
genes which act to diminish or cancel the effects of MECP2 mutations. a) in order to increase the
levels of MeCP2 two projects of gene therapy are ongoing. Since Rett Syndrome is a single gene
disorder, gene therapy is potentially a viable approach to treatment. Recently the Kaspar lab of Ohio
Introduction
54
State University has reported that Adeno-Associated Virus, serotype 9 (scAAV9), is able to cross the
blood-brain-barrier achieving global distribution in the central nervous system when administered via
the bloodstream. This collaborative project between Kaspar, a leading gene therapist, and Gail
Mandel, a prominent Rett researcher, will determine the clinical potential of scAAV9 in MeCP2 gene
replacement strategies for RTT. The Kaspar lab has already been successful in initial trials of SMN
gene delivery with scAAV9 for treating a mouse model of Spinal Muscular Atrophy (SMA), completely
rescuing the lethal phenotype seen in that disease model. The genetics of the Rett model are ideally
suited to investigation of the clinical utility of scAAV9. The second project seeks to develop a gene
therapy approach to the treatment of Rett with a new generation vector, AAVrh10 which has shown
remarkable gene expression throughout the central nervous system. The Crystal lab of Weill Cornell
Medical College, University of Edinburgh is one of only a few in the world that has conducted gene
therapy clinical trials in humans. Complimenting the Crystal expertise at gene therapy and clinical
trials is Adrian Bird, who brings his deep knowledge of MeCP2 and the Rett animal models. If gene
therapy with AAVrh10 is successful in the mice Crystal’s past experience in clinical trial development
will prove invaluable. b) the improvement of RTT symptoms via existing drugs is one of the most
promising and less invasive approach to cure RTT. Many research groups are currently involved in
finding the appropriate drug able on one side to activate MeCP2 and on the other side to restore the
normal level of MeCP2 target proteins, whose expression is deregulated because of MeCP2
mutations. One of the most recent and challenging project aims to identify drugs/compounds and/or
genes that will activate the silent MECP2 on the inactive X chromosome (Antonio Bedalov, M.D.,
Ph.D. Fred Hutchinson Cancer Research Center). c) An emerging field of interest is that of genetic
modifiers that impact the severity of disease. RTT is ideal for modifier screening for two reasons: i) it
has been shown to be reversible in mice and ii) the existence of girls who do not have Rett symptoms
despite having common mutations in MECP2. It is likely that these girls have mutations in other
genes that confer protection from damaged MECP2. This project aims to identify these
advantageous gene modifiers and provide novel avenues for therapeutic intervention. The project is
beginning to yield encouraging results and is underway in the laboratory of Monica Justice, Ph.D. at
Baylor College of Medicine.
Aims
55
Aims
RTT (MIM 312750) is a postnatal progressive neurodevelopmental disorder that represents
the second major cause of mental retardation in female children. This pathology , which becomes
manifest during early childhood, is caused by mutations affecting the MECP2 gene located on X
chromosome (Amir et al., 1999) that in normal conditions regulates the expression of numerous
genes.It has been recently demonstrated that BDNF is one of the target genes of MeCP2 (Chen et
al.2003, Martinowich et al.2003).
Recent studies suggest that alterations in BDNF signaling contribute to RTT pathophysiology.
For example, Mecp2 null mice exhibit progressive deficits in BDNF levels after birth (Chang et al.,
2006; Wang et al., 2006), and genetic restoration of BDNF in the forebrain improves motor function
and extends lifespan (Chang et al., 2006). Moreover, neural structures important for
cardiorespiratory control, including the nodose cranial sensory ganglia (NGs) and brainstem, exhibit
the earliest and most significant known deficits in BDNF expression in the Mecp2 null mouse brain
(Wang et al., 2006).
Our idea is to identificate a pharmacological approach to treat RTT. The strategy is based on
the evidence that in RTT animal models there are residual BDNF mRNA levels and on the fact that
several compounds, including antidepressants, are able to increase BDNF levels.
In this study:
• we defined the pattern of BDNF and its splice variants expression in somatosensory and
motor human RTT patients cortex and in two different models of RTT, the MeCP2 null mice
and a cellular model of RTT, obtained disrupting MeCP2 expression in human neuroblastoma
SHSY-5Y cells by RNA-interfering approach.
• Through a Luciferase-based assay, we obtained information on translatability of each BDNF
splice variant in physiological conditions and after the stimulation with several receptor
agonists.
• We carried out a systematic pharmacological analysis of the translation of each BDNF
transcript to determine which drug can be used to enhance BDNF protein levels, therefore
resulting in a candidate drug to revert some RTT symptoms.
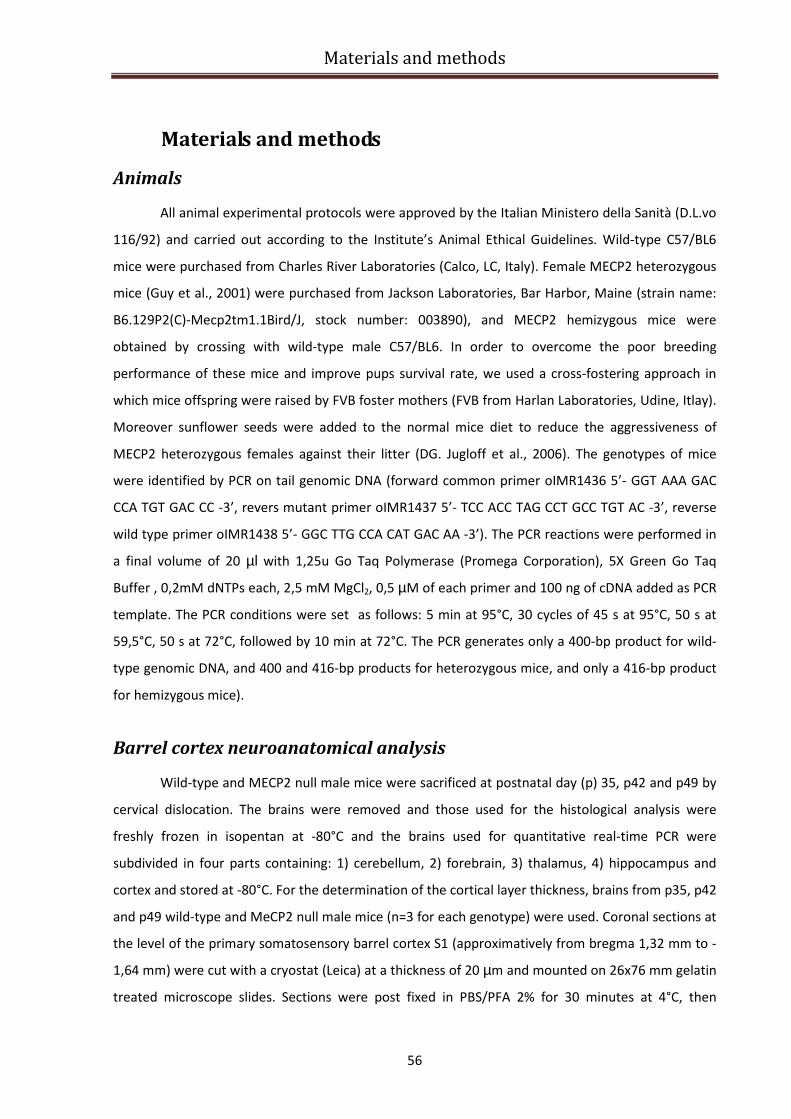
Materials and methods
56
Materials and methods
Animals
All animal experimental protocols were approved by the Italian Ministero della Sanità (D.L.vo
116/92) and carried out according to the Institute’s Animal Ethical Guidelines. Wild-type C57/BL6
mice were purchased from Charles River Laboratories (Calco, LC, Italy). Female MECP2 heterozygous
mice (Guy et al., 2001) were purchased from Jackson Laboratories, Bar Harbor, Maine (strain name:
B6.129P2(C)-Mecp2tm1.1Bird/J, stock number: 003890), and MECP2 hemizygous mice were
obtained by crossing with wild-type male C57/BL6. In order to overcome the poor breeding
performance of these mice and improve pups survival rate, we used a cross-fostering approach in
which mice offspring were raised by FVB foster mothers (FVB from Harlan Laboratories, Udine, Itlay).
Moreover sunflower seeds were added to the normal mice diet to reduce the aggressiveness of
MECP2 heterozygous females against their litter (DG. Jugloff et al., 2006). The genotypes of mice
were identified by PCR on tail genomic DNA (forward common primer oIMR1436 5’- GGT AAA GAC
CCA TGT GAC CC -3’, revers mutant primer oIMR1437 5’- TCC ACC TAG CCT GCC TGT AC -3’, reverse
wild type primer oIMR1438 5’- GGC TTG CCA CAT GAC AA -3’). The PCR reactions were performed in
a final volume of 20 µl with 1,25u Go Taq Polymerase (Promega Corporation), 5X Green Go Taq
Buffer , 0,2mM dNTPs each, 2,5 mM MgCl2, 0,5 µM of each primer and 100 ng of cDNA added as PCR
template. The PCR conditions were set as follows: 5 min at 95°C, 30 cycles of 45 s at 95°C, 50 s at
59,5°C, 50 s at 72°C, followed by 10 min at 72°C. The PCR generates only a 400-bp product for wild-
type genomic DNA, and 400 and 416-bp products for heterozygous mice, and only a 416-bp product
for hemizygous mice).
Barrel cortex neuroanatomical analysis
Wild-type and MECP2 null male mice were sacrificed at postnatal day (p) 35, p42 and p49 by
cervical dislocation. The brains were removed and those used for the histological analysis were
freshly frozen in isopentan at -80°C and the brains used for quantitative real-time PCR were
subdivided in four parts containing: 1) cerebellum, 2) forebrain, 3) thalamus, 4) hippocampus and
cortex and stored at -80°C. For the determination of the cortical layer thickness, brains from p35, p42
and p49 wild-type and MeCP2 null male mice (n=3 for each genotype) were used. Coronal sections at
the level of the primary somatosensory barrel cortex S1 (approximatively from bregma 1,32 mm to -
1,64 mm) were cut with a cryostat (Leica) at a thickness of 20 µm and mounted on 26x76 mm gelatin
treated microscope slides. Sections were post fixed in PBS/PFA 2% for 30 minutes at 4°C, then
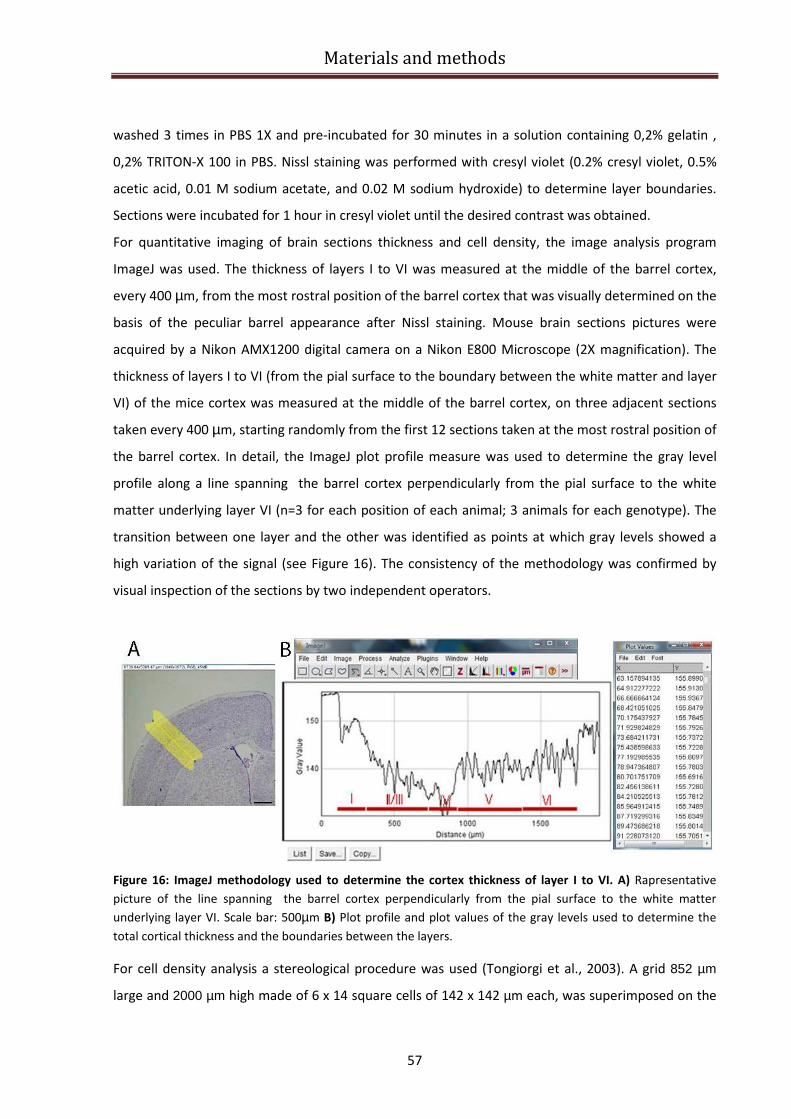
Materials and methods
57
washed 3 times in PBS 1X and pre-incubated for 30 minutes in a solution containing 0,2% gelatin ,
0,2% TRITON-X 100 in PBS. Nissl staining was performed with cresyl violet (0.2% cresyl violet, 0.5%
acetic acid, 0.01 M sodium acetate, and 0.02 M sodium hydroxide) to determine layer boundaries.
Sections were incubated for 1 hour in cresyl violet until the desired contrast was obtained.
For quantitative imaging of brain sections thickness and cell density, the image analysis program
ImageJ was used. The thickness of layers I to VI was measured at the middle of the barrel cortex,
every 400 µm, from the most rostral position of the barrel cortex that was visually determined on the
basis of the peculiar barrel appearance after Nissl staining. Mouse brain sections pictures were
acquired by a Nikon AMX1200 digital camera on a Nikon E800 Microscope (2X magnification). The
thickness of layers I to VI (from the pial surface to the boundary between the white matter and layer
VI) of the mice cortex was measured at the middle of the barrel cortex, on three adjacent sections
taken every 400 µm, starting randomly from the first 12 sections taken at the most rostral position of
the barrel cortex. In detail, the ImageJ plot profile measure was used to determine the gray level
profile along a line spanning the barrel cortex perpendicularly from the pial surface to the white
matter underlying layer VI (n=3 for each position of each animal; 3 animals for each genotype). The
transition between one layer and the other was identified as points at which gray levels showed a
high variation of the signal (see Figure 16). The consistency of the methodology was confirmed by
visual inspection of the sections by two independent operators.
Figure 16: ImageJ methodology used to determine the cortex thickness of layer I to VI. A) Rapresentative
picture of the line spanning the barrel cortex perpendicularly from the pial surface to the white matter
underlying layer VI. Scale bar: 500µm B) Plot profile and plot values of the gray levels used to determine the
total cortical thickness and the boundaries between the layers.
For cell density analysis a stereological procedure was used (Tongiorgi et al., 2003). A grid 852 µm
large and 2000 µm high made of 6 x 14 square cells of 142 x 142 µm each, was superimposed on the
Materials and methods
58
image of the very same Nissl-stained sections which were measured for the thickness analysis (see
above). Using the optical dissector, all nuclei were counted in three randomly selected square fields
of the grid for each layer (Figure 17).
Figure 17: Representation of the procedure used to measure cell density. See text for detailed explanation.
RNA extraction and cDNA preparation
Total RNA was extracted from hippocampus and cortex samples of wild-type and MeCP2 null
male mice at p35, p42, and p49 (n=4 for each genotype) and from SHSY-5Y scramble and sh-RNA
transfected cells, using RNeasy Lipid Tissue Mini Kit (QUIAGEN). RNA was extracted from SHSY-5Y
pN1-Fluc constructs transfected cells with TriZol Reagent (Invitrogen). 1,5 µg of total RNA was then
heat denaturated and reverse-transcribed into cDNA with a mix containing 100 ng random primers
(Roche Diagnostic), 5X first strand buffer (250mM Tris-HCl ph 8.3, 375 mM KCl, 15mM MgCl2), 10mM
DTT (Invitrogen), 2U/mL RNase inhibitor (Roche Diagnostic), 500mM dNTPs (Promega) and 200U
Superscript III (Invitrogen). The reaction was carried out at 42°C for 50 minutes followed by
Superscript III inactivation for 15 minutes at 70°C.
Total extracts preparation and Western Blot analysis
Western blot analysis was used to detect Firefly luciferase amount in SHSY-5Y cells
transfected with pN1-exon-Fluc vectors and, in another set of experiments, to assess efficiency of
MeCP2 silencing after transfection of sh-MeCP2-RNAs in SHSY-5Y cells.
After transfection with the different pN1-exon-Fluc constructs, cells were carefully washed in PBS,
trypsinized and resuspended in cold (4°C) lysis buffer containing 137mM NaCl (Fluka), 20mM Tris-HCl
Materials and methods
59
pH 8.0, 0.75% Nonidet P-40, 10% glycerol, and a cocktail of protease inhibitors – 1mM PMSF
(Phenilmethyl-sulfonilfluoride), 10µg/ml TEWI (Turkey Egg White inhibitor), 4μg/ml SBTI (Soy Bean
Trypsin inhibitor), 1mM IAA (Iodoacetamide), 1mM SPERM (Spermidin). The cell suspension was
further homogenized with a syringe, rocked for 30-45min at 4ºC, and centrifuged at 10,000xg for 8-
10min at 10°C, thus removing cellular debris. The pellet was discarded, since the Fluc-containing
constructs are all translation products. Bradford assay was used to determine protein concentration,
then samples were boiled and analyzed on 12% polyacrylamide gel electrophoresis (20µg of protein
were loaded). Proteins were then electroblotted for 1 hour onto nitrocellulose membrane
(Schleicher & Schuell). Membranes were saturated for 40 minutes with a solution containing 5%
non-fat milk in PBST (PBS+0.1% Tween 20) before an overnight incubation at 4°C with rabbit anti-
luciferase 1:1500 (Sigma) and mouse anti-α-tubulin 1:20.000 (Sigma). Membrane was then washed
3X5 minutes in 5% non fat milk in PBST and incubated for 1h at RT with the respective secondary
antibody goat anti-rabbit AP, 1:1500 and goat anti-mouse AP 1:1500 (Jackson). For alkaline
phosphatase development, membranes were equilibrated in 100mM Tris-HCl, pH 9.5, 50 mM MgCl2,
100mM NaCl in presence of nitro blue tetrazolium (NBT 70mg/mL, Roche) and bromochloroindolyl
phosphate (BCIP 50mg/mL, Roche). The reaction was stopped by a high pH solution containing 0.5M
EDTA pH 8.0 and PBS.
Concerning MeCP2 silencing experiments, western blot analysis was carried on as previously
described but with the following modifications. After transfection with the sh-MeCP2-RNA and
scramble constructs, cells were carefully washed in PBS, trypsinized and the nuclear proteins were
extracted using ProteoJET™ Cytoplasmic and Nuclear Protein Extraction Kit (Fermentas), following
the producer instructions. After electoblotting, membranes were saturated with 5% non fat milk in
PBST and incubated overnight with polyclonal rabbit anti-MECP2 (1:3000, kindly provided by Prof.
Etienne Joly) or rabbit anti-emerin (1:3000, Abcam). Membrane was then washed 3X10 minutes in
5% non fat milk in PBST and incubated for 1h at RT with the secondary antibody anti rabbit HRP
1:10000 (Dako). The immunoreactive bands were detected according to the manufacturer’s
Enhanced ChemiLuminescence protocol, incubating membranes for 5 minutes with
chemiluminescent substrate (GE Healthcare) before exposure to X-ray films (Kodak). For
densitometric analysis of semiquantitative Western Blot experiments we used Quantity
One®software developed by Bio Rad Laboratories.
Cell line
Human neuroblastoma catecholaminergic SHSY-5Y cells (kindly provided by Nicola
Woodroofe, Sheffield Hallam University, UK) were cultured in D-MEM 10% FBS, penicillin 100U/mL
Materials and methods
60
and streptomycin 100µg/mL. Undifferentiated cells were then used for MeCP2 knock down, MTT,
luciferase assay, and western blotting. All cells were maintained at 37ºC in a 5% CO2-humified
incubator.
Lipofectamine transfection The different pN1-Fluc constructs, the sh-MeCP2-RNAs and the MeCP2-GFP plasmid were
transfected into SHSY-5Y cells using lipofectamine 2000 (TM)
(Invitrogen).
• pN1-Fluc constructs transfection:
one day prior transfection, SHSY-5Y cells were seeded into a 96-well white plate with clear bottom
(PBI International) at a confluency of 50-60% and cultured overnight in D-MEM 10% FBS. Plasmids
were then transiently transfected into SH-SY5Y cells using LipofectamineTM 2000 (Invitrogen) at high
cell density (70-75%), according to the manufacturer’s protocol. The relative quantity of DNA to
lipofectamine has been determined empirically and the optimal ratio was found to be at 0.2µg of
DNA and 0.5µl of lipofectamine for each well of 96-well plate. Each Fluc-containing construct was
transfected together with the normalized Rluc construct in a 10:1 ratio. The DNA was then diluted in
25µl of native MEM and incubated separately for 5min at room temperature. The diluted
lipofectamine was then combined with the DNA, incubating the complexes for 20min at room
temperature, thus allowing the formation of DNA-containing micelles. 50µl of such solution was
added in each well containing cells and previously changed medium, incubating them 37ºC in a
humified atmosphere containing 5% CO2 during 24h. The lipofectamine mixture was kept in culture
until lysate preparation.
• MeCP2-GFP plasmid and sh-MeCP2-RNAs transfection:
one day prior transfection, SHSY-5Y cells were seeded into a 6-well plate in D-MEM 10% FBS at 50%
confluency. For MeCP2 endogenous silencing, sh-MeCP2-RNAs constructs as well as scramble
plasmid were transiently transfected into SH-SY5Y cells using LipofectamineTM 2000 (Invitrogen) at
the ratio of 4 µg DNA/10 µl lipofectamine for each well of a 6 multiwell plate in 250 µl of native
MEM. For MeCP2 exogenous silencing, a plasmid carrying MeCP2 in fusion with GFP was transfected
one day before the transfection of shMECP2-RNAs constructs (4 µg of DNA to 10 µg of lipofectamine
for each well of a 6 multiwell plate in 250 µl of native MEM). The protocol was carried on as
described above except that the lipofectamine mixture was removed after 4-6 hours and the lysates
were prepared 48 hours later.
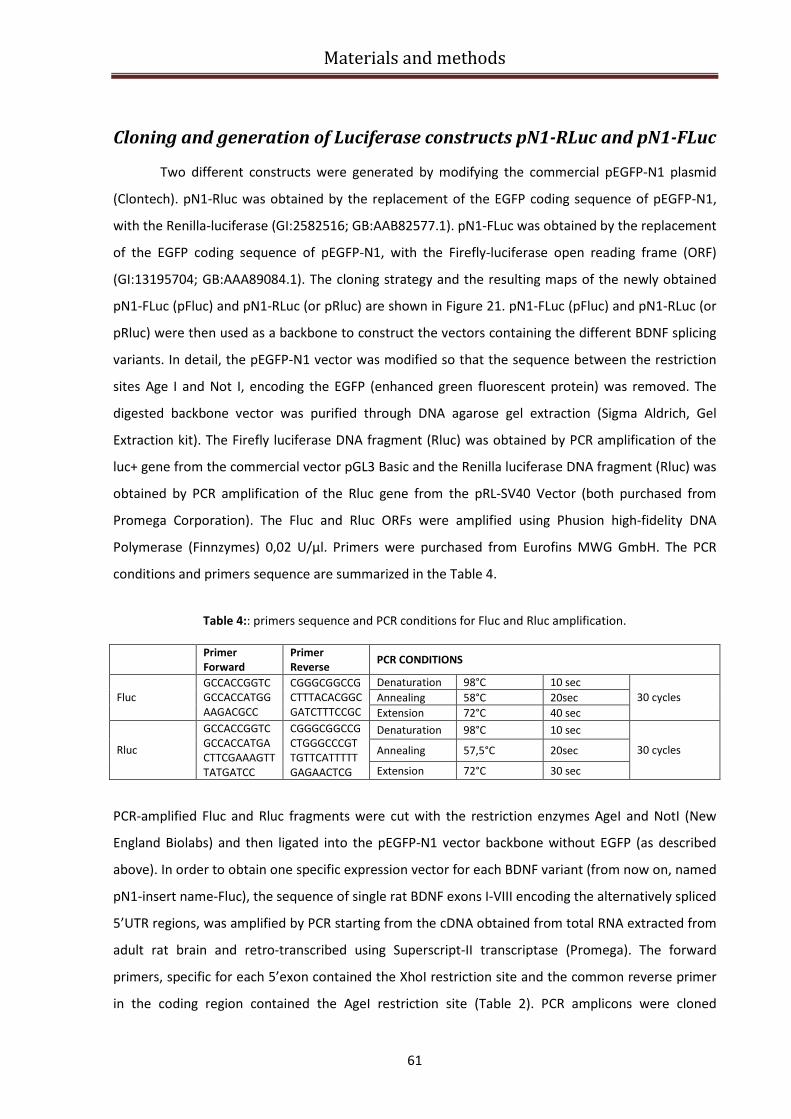
Materials and methods
61
Cloning and generation of Luciferase constructs pN1-RLuc and pN1-FLuc
Two different constructs were generated by modifying the commercial pEGFP-N1 plasmid
(Clontech). pN1-Rluc was obtained by the replacement of the EGFP coding sequence of pEGFP-N1,
with the Renilla-luciferase (GI:2582516; GB:AAB82577.1). pN1-FLuc was obtained by the replacement
of the EGFP coding sequence of pEGFP-N1, with the Firefly-luciferase open reading frame (ORF)
(GI:13195704; GB:AAA89084.1). The cloning strategy and the resulting maps of the newly obtained
pN1-FLuc (pFluc) and pN1-RLuc (or pRluc) are shown in Figure 21. pN1-FLuc (pFluc) and pN1-RLuc (or
pRluc) were then used as a backbone to construct the vectors containing the different BDNF splicing
variants. In detail, the pEGFP-N1 vector was modified so that the sequence between the restriction
sites Age I and Not I, encoding the EGFP (enhanced green fluorescent protein) was removed. The
digested backbone vector was purified through DNA agarose gel extraction (Sigma Aldrich, Gel
Extraction kit). The Firefly luciferase DNA fragment (Rluc) was obtained by PCR amplification of the
luc+ gene from the commercial vector pGL3 Basic and the Renilla luciferase DNA fragment (Rluc) was
obtained by PCR amplification of the Rluc gene from the pRL-SV40 Vector (both purchased from
Promega Corporation). The Fluc and Rluc ORFs were amplified using Phusion high-fidelity DNA
Polymerase (Finnzymes) 0,02 U/µl. Primers were purchased from Eurofins MWG GmbH. The PCR
conditions and primers sequence are summarized in the Table 4.
Table 4:: primers sequence and PCR conditions for Fluc and Rluc amplification.
PCR-amplified Fluc and Rluc fragments were cut with the restriction enzymes AgeI and NotI (New
England Biolabs) and then ligated into the pEGFP-N1 vector backbone without EGFP (as described
above). In order to obtain one specific expression vector for each BDNF variant (from now on, named
pN1-insert name-Fluc), the sequence of single rat BDNF exons I-VIII encoding the alternatively spliced
5’UTR regions, was amplified by PCR starting from the cDNA obtained from total RNA extracted from
adult rat brain and retro-transcribed using Superscript-II transcriptase (Promega). The forward
primers, specific for each 5’exon contained the XhoI restriction site and the common reverse primer
in the coding region contained the AgeI restriction site (Table 2). PCR amplicons were cloned
Primer
Forward
Primer
Reverse PCR CONDITIONS
Denaturation 98°C 10 sec
Annealing 58°C 20sec Fluc
GCCACCGGTC
GCCACCATGG
AAGACGCC
CGGGCGGCCG
CTTTACACGGC
GATCTTTCCGC Extension 72°C 40 sec
30 cycles
Denaturation 98°C 10 sec
Annealing 57,5°C 20sec Rluc
GCCACCGGTC
GCCACCATGA
CTTCGAAAGTT
TATGATCC
CGGGCGGCCG
CTGGGCCCGT
TGTTCATTTTT
GAGAACTCG Extension 72°C 30 sec
30 cycles
Materials and methods
62
between the XhoI and AgeI restriction sites of the pFluc-N1 vector upstream of the Firefly Luciferase
coding sequence. In addition, the complete rat BDNF coding sequence (CDS) was cloned between the
Xho I and Sac II restriction site of the pFluc-N1 vector upstream the Fluc gene.
Furthermore, the two 3’untranslated regions (3’UTR) variants, called respectively 3’UTR-long and
3’UTR-short were cloned into the HpaI and NotI restriction sites of pN-Fluc vector downstream the F-
luc gene using specific primers generating specific vectors (from now on named, pN1-Fluc-3’UTR-long
or short; or pN1-insert name-Fluc-3’UTR-long or short. See Table I). Finally, the two Kozak sequences,
one specific for exon I and the other in common to all other transcripts (exon IX), were inserted (Age
I-Not I) through a modified Fluc sequence containing the two above modified kozak sequences. The
BDNF CDS, 3’UTR-long and 3’UTR-short and all exons were amplified using Phusion high-fidelity DNA
Poliymerase (Finnzymes) 0,02 U/µl (or Platinum Polymerase for exon III). Primers were purchased
from Eurofins MWG GmbH (see Table 5 for PCR conditions). To obtain BDNF exon 6, joined with
either one of the two 3’UTR variants (3’UTR-long and -short) within a Firefly luciferase reporter
vector, the previously described plasmid pN1-Fluc-3’short or 3’long were used as backbones, and
exon 6 was cloned into the XhoI and HpaI restriction sites. The PCR condition used to amplify exon VI
are the same reported in table 5 and the cloning procedure is the same described above.

Materials and methods
63
Table 5: primers sequence and PCR conditions for BDNF 3’short and long, CDS and 5’ exons amplification.
*The exon III was amplified using Platinum Taq DNA Polymerase High Fidelity (Invitrogen)
** The exon VI has a high GC percentage and the amplification was preceded by 8 minutes of
denaturation at a temperature of 98°C.
Dual luciferase assay
24 hours after Luciferase constructs transfection (as described in “Lipofectamine
transfection” paragraph), Luciferase assay was performed according to the manufacturer’s
instructions (Promega). At the time of luciferase assay, the growth medium was removed from the
cultured cells and a sufficient volume of PBS 1X was applied to wash the surface of the culture vessel.
Primer Forward Primer Reverse PCR CONDITIONS
Denaturation 98°C 10 sec
Annealing 57,5°C 15sec 3’UTR long GGGCGGCCGCTGGAT
TTATGTTGTATAG
GCCGGTTAACTTACA
ATAGGCTTCTGATGT
GG Extension 72°C 2 min
31 cycles
Denaturation 98°C 10 sec
Annealing 57,5°C 15sec 3’ UTR short GGGCGGCCGCTGGAT
TTATGTTGTATAG
GTCAGTTAACTTTAT
TATCAATTCACAATT
AAAGC Extension 72°C 15 sec
31 cycles
Denaturation 98°C 10 sec
Annealing 57,5°C 15 sec CDS GCGCTCGAGATGACC
ATCCTTTTCCTTAC
GTCACACGTGTCCCC
TTTTAATGGTCAGTG Extension 72°C 40 sec
31 cycles
Denaturation 98°C 10 sec
Annealing 57°C 20 sec Exon I
AATTCTCGAGTAAAGC
GGTAGCCGGCTGGTG
CAGG
GTCTACCGGTTTTGC
TGTCCTGGAGACTCA
GTGTC Extension 72°C 40 sec
31 cycles
Denaturation 98°C 10 sec
Annealing 58°C 20 sec Exon IIa
GATCCTCGAGGCTTTG
GCAAAGCCATCCGCA
CGTGAC
GCCACCGGTCTGGA
TGAAGTACTACCACC
TCGGAC Extension 72°C 35 sec
31 cycles
Denaturation 98°C 10 sec
Annealing 58°C 20 sec Exon IIb
GATCCTCGAGGCTTTG
GCAAAGCCATCCGCA
CGTGAC
GTTACCGGTGGAGC
TTGCCAAGAGTCTAT
TCCAG Extension 72°C 35 sec
31 cycles
Denaturation 98°C 10 sec
Annealing 58°C 20 sec Exon IIc
GATCCTCGAGGCTTTG
GCAAAGCCATCCGCA
CGTGAC
GAAACCGGTCTTCTT
TGCGGCTTACACCAC
CCCGGTGGCTAG Extension 72°C 35 sec
31 cycles
Denaturation 94°C 15 sec
Annealing 55°C 15 sec Exon III*
AGGCTCGAGGCCCTC
ACGATTCTCGCTGGAT
AG
GCTAACCGGTCTGG
GCTCAATGAAGCATC
CAGCCC Extension 68°C 20 sec
31 cycles
Denaturation 98°C 10 sec
Annealing 58°C 20 sec Exon IV
AATTCTCGAGACCCAC
TTTCCCATTCACCGAG
G
GACTACCGGTCAGTC
ACTACTTGTCAAAGT
AAACATCAAGGC Extension 72°C 20 sec
31 cycles
Denaturation 98°C 10 sec
Annealing 58°C 20 sec Exon V
GACTCTCGAGAAACC
ATAACCCCGCACACTC
TGTGTAGTTTCATTGT
GTGTTCG
GACTACCGGTCTTCC
CGCACCTTCCCGCAC
CACAGAGCTAGAAA
AAGCGAACACAC Extension 72°C 15 sec
31 cycles
Denaturation 98°C 10 sec
Annealing 57,5°C 20 sec Exon VI**
GACTCTCGAGCCAATC
GAAGCTCAACCGAAG
AGC
GATCACCGGTCTCAG
GGTCCACACAAAGC
TCTCGG Extension 72°C 15 sec
31 cycles
Denaturation 98°C 10 sec
Annealing 58°C 20 sec Exon VII
GACTCTCGAGCACTGT
CACCTGCTTTCTAGGG
AGTATTACC
GTACACCGGTCTCCC
GGATGAAAGTCAAA
ACTTTCACTTCCTCT
GGAGG Extension 72°C 20 sec
31 cycles
Denaturation 98°C 10 sec
Annealing 58°C 20 sec
Exon VIII
GTCACTCGAGGTTATA
GAGTTGGATGCAAGC
GTAACCCG
GCATACCGGTGACA
CCATTTTCAGCAATC
GTTTGTTCAGCTCC Extension 72°C 35 sec
31 cycles
Materials and methods
64
Then, the PBS 1X solution was completely removed and the cells lysis was started by adding 20 µl of
PLB (passive lysis buffer) into each well. After adding the PLB solution, the culture plate was placed
on an orbital shaker with gentle shaking at room temperature for 15 minutes to cover uniformly the
cell monolayer with PLB. After lysis, 100 µl of Luciferase Assay Reagent II (LARII) were dispensed in
each well and Firefly luciferase activity was measured using the Glo Max Multi luminometer with two
injectors (Promega Corporation). After quantifying the Firefly luminescence, this reaction was
quenched and simultaneously, the Renilla luciferase reaction was initiated by adding 100 µl Stop &
Glo Reagent (Promega) to the same well, then Renilla luciferase activity was measured.
Cells treatments
The Dual luciferase assay was used to evaluate the effects of different receptor agonists,
protein synthesis inhibitors and antidepressants drugs on the BDNF splice variants translation in
undifferentiated SHSY-5Y cells.
• Receptor agonists treatment:
24 hours after luciferase constructs transfection, cells were treated for three hours with the listed
receptor inhibitors agonists at the following concentrations: KCL (50mM), BDNF (50ng/ml),
Glutammate (GLU: 20µM), S)-3,5-Dihydroxyphenylglycine (DHPG: 50 µM), AMPA (30 µM), NMDA (30
µM), Acetylcholine (AcH: 30 µM), Norepinephrine (NE: 50 µM), Dopamine (DOPA: 40 µM) and
Serotonin (5-HT 50 µM). All agonists were purchased from Sigma Aldrich with the exception of
DHPG, AMPA and NMDA that were from Ascent Scientific.
• Protein synthesis inhibitors treatment:
The effects of the different inhibitors were evaluated treating cells for 30min before inducing
depolarization for 3h with 50mM KCl. The following inhibitors at the reported concentrations were
used: Aurora kinase A inhibitor 10µM (PHA-680632) was a gift from Nerviano Medical Sciences S.r.l.
(Milan, Italy); PP2 20µM (1-tert-butyl-3-(4-chlorophenyl)-1H-pyrazolo[3-4] pyrimidin-4-amine),
rapamycin 20nM (Ascent Scientific Bristol, UK), Bisindolylmaleimide I 50nM (2-[1-(3-
dimethylaminopropyl)-1H-indol-3-yl]-3-(1H-indol-3yl)-maleimide, GF 109203X, Gö 6850), KN62 20µM
(1-[N,O-bis-5-isoquinolinesulfonyl)-N-methyl-L-tyrosyl]-4-phenylpiperazine), U0126 50µM (1,4-
diamino-2,3-dicyano-1,4-bis(2-aminophenylthio- butadiene), and U0124 50µM (1,4-Diamino-2,3-
dicyano-1,4-bis(methylthio) butadiene) from Calbiochem® (Damstadt, Germany).
• Antidepressant drug treatment:
The effects of Desipramine and Mirtazapine were evaluated using the luciferase assay after
incubation of the cells for 24 hours (Desipramine and Mirtazapine 10 µM) or 48 hours (Mirtazapine
Materials and methods
65
1, 10, and 50 µM). Desipramine and Mirtazapine were purchased from Enzo Biochem and Ascent
Scientific respectively.
MTT Viability Assay
Each drug was tested in a viability assay to demonstrate that the concentration used was not
toxic for the cells and no appreciable cell death could be detected.
Using a 96-well plate 100µl of SHSY-5Y cells were distributed per well, maintaining them overnight at
37°C in a 5% CO2 humified incubator. On the following day the cells were incubated at 37°C with the
following drugs:
• KCL (50mM), BDNF (50ng/ml), Glutammate (GLU: 20µM), S)-3,5-Dihydroxyphenylglycine
(DHPG: 50 µM) , AMPA (30 µM), NMDA (30 µM), Acetylcholine (AcH: 30 µM),
Norepinephrine (NE: 50 µM), Dopamine (DOPA: 40 µM) and Neurotrophin-3 (NT3: 50ng/ml)
for 3 hours;
• Aurora kinase A inhibitor, PP2, rapamycin, GF 109203X, KN62, U0126 and U0124 for 30
minutes;
• Desipramine 1, 10, 100 µM and Mirtazapine 1, 10, 100 µM for 24 hours and Mirtazapine 1,
10, 50 µM for 48 hours.
After that, 20µl of aseptically prepared 5mg/ml MTT was added, adding it also to an additional
quadruplicate of wells without cells, as an internal control. The cells were again incubated at 37°C
this time for 2h, allowing the formation of formazan crystals by the mitochondrial dehydrogenase of
viable cells. Afterwards, the media was carefully removed, and the formazan crystals were solubilised
by adding 200µl of MTT solvent per well, a solution that contains acidified isopropanol (4mM HCl and
0.1% Nondet P-40 in isopropanol). The crystals were further dissolved by gently pipeting the solution
up and down being the resulting purple solution spectrophotometrically measured at 570nm. An
increased absorbance can therefore be directly correlated to the cell number, allowing one to
determine the cellular viability after a specific treatment. Since the method is dependent on the
physiological state of the cells, the assay was always performed after checking the cellular
morphology prior treatment. Moreover, two controls were performed: (1) untreated cells, an
internal control to verify the drug-dependent effect; and (2) KCl 200mM or DMSO 100% treated
cells, in which a cytotoxic concentration of this substances is used, thus allowing us to verify the
assay fidelity. When the MTT assay is used to determine cell viability after antidepressant drug
treatment, vehicles treated cells (H2O for Desipramine and DMSO 50% in H2O for Mirtazapine)
represent additional controls.
Materials and methods
66
Semi-quantitative PCR
Semi-quantitative PCR was used for the amplification of Firefly Luciferase gene (Fluc) and
MeCP2 gene respectively from pN1-exon-Fluc constructs and sh-MeCP2-RNAs transfected SHSY-5Y
cells. It was performed using a Mastercycler® instrument (Eppendorf) according to the
manufacturer’s instructions. For both the experiments the PCR reactions were performed in a final
volume of 20 µl with 1,25u Go Taq Polymerase, 5X Green Go Taq Buffer , 0,2mM dNTPs each, 2,5
mM MgCl2, 0,5 µM of each primer (Fluc FW: 5’-GCCACCGGTCGCCACCATGGAAGACGCC-3’; Fluc REV:
5’-CGGGCGGCCGCTTTACACGGCGATCTTTCCGC-3’; MeCP2 FW: 5’-CATCATCCGTGACCGGGGAC-3’;
MeCP2 REV: 5’-CCTCTGCCAGTTCCTGGAGC-3’; GAPDH FW:5’-ACCACAGTCCATGCCATCAC-3’; GAPDH
REV: 5’-TCCACCACCCTGTTGCTGTA-3’) and 100 ng of cDNA added as PCR template. The amounts of
target genes were normalized relative to GAPDH housekeeping gene, used as reference gene in the
corresponding samples. Concerning Fluc amplification, the PCR reaction was performed as follows: 5
min at 95°C, 26 cycles of 45 s at 95°C, 50 s at 56,5°C, 1 min 50 s at 72°C, followed by 10 min at 72°C.
For the amplification of MeCP2, the PCR reaction was performed as follows: 5 min at 95°C, 27 cycles
of 45 s at 95°C, 50 s at 56,5°C, 50 s at 72°C, followed by 10 min at 72°C. For densitometric analysis of
semiquantitative PCR experiments we used Quantity One®software developed by Bio Rad
Laboratories.
Real time PCR
The amount of each BDNF transcripts present in MeCP2 null mice, in RTT patients’ brains and
in SHSY-5Y MeCP2 knocked down cells compared to the corresponding control condition was
measured by quantitative real-time PCR (qRT-PCR) using SYBR Green detection. qRT-PCR was
performed using a Rotor Gene 3000 instrument (Explera) according to the manufacturer’s
instructions. The PCR reactions were performed in a final volume of 10 µl with 2X Master SYBR Green
I Mix (Fluocycle, Euroclone), 0,5 µM of each primer and 100ng cDNA added as PCR template. BDNF
transcripts levels were normalized to GAPDH mRNA levels to adjust for small differences in input
cDNA. The primers sequences for mouse and human BDNF splice variants amplification are listed in
Table 6 and 7 respectively.
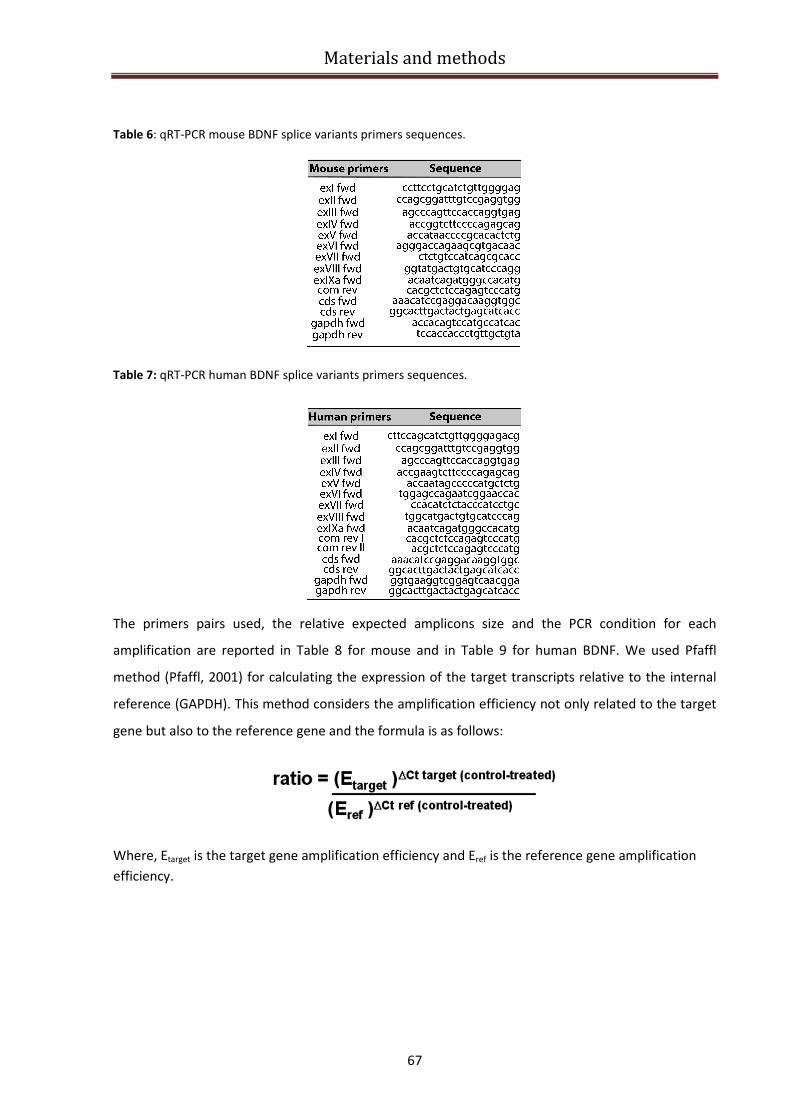
Materials and methods
67
Table 6: qRT-PCR mouse BDNF splice variants primers sequences.
Table 7: qRT-PCR human BDNF splice variants primers sequences.
The primers pairs used, the relative expected amplicons size and the PCR condition for each
amplification are reported in Table 8 for mouse and in Table 9 for human BDNF. We used Pfaffl
method (Pfaffl, 2001) for calculating the expression of the target transcripts relative to the internal
reference (GAPDH). This method considers the amplification efficiency not only related to the target
gene but also to the reference gene and the formula is as follows:
Where, Etarget is the target gene amplification efficiency and Eref is the reference gene amplification
efficiency.
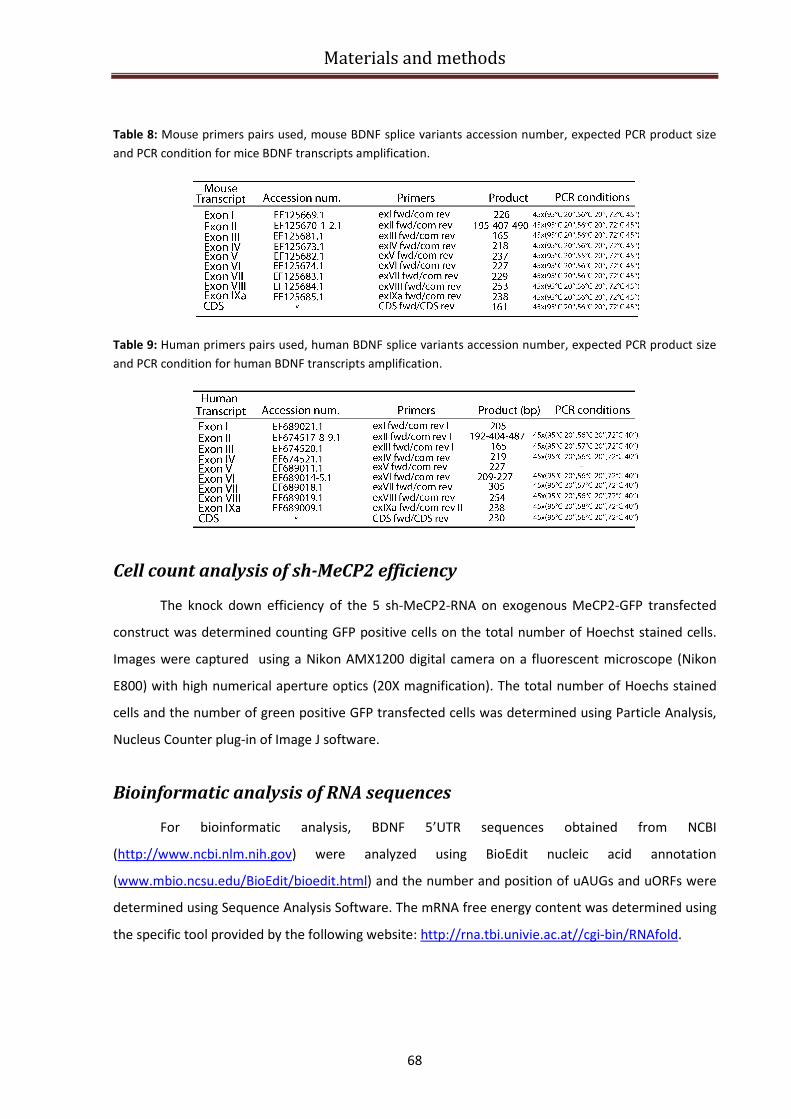
Materials and methods
68
Table 8: Mouse primers pairs used, mouse BDNF splice variants accession number, expected PCR product size
and PCR condition for mice BDNF transcripts amplification.
Table 9: Human primers pairs used, human BDNF splice variants accession number, expected PCR product size
and PCR condition for human BDNF transcripts amplification.
Cell count analysis of sh-MeCP2 efficiency
The knock down efficiency of the 5 sh-MeCP2-RNA on exogenous MeCP2-GFP transfected
construct was determined counting GFP positive cells on the total number of Hoechst stained cells.
Images were captured using a Nikon AMX1200 digital camera on a fluorescent microscope (Nikon
E800) with high numerical aperture optics (20X magnification). The total number of Hoechs stained
cells and the number of green positive GFP transfected cells was determined using Particle Analysis,
Nucleus Counter plug-in of Image J software.
Bioinformatic analysis of RNA sequences
For bioinformatic analysis, BDNF 5’UTR sequences obtained from NCBI
(http://www.ncbi.nlm.nih.gov) were analyzed using BioEdit nucleic acid annotation
(www.mbio.ncsu.edu/BioEdit/bioedit.html) and the number and position of uAUGs and uORFs were
determined using Sequence Analysis Software. The mRNA free energy content was determined using
the specific tool provided by the following website: http://rna.tbi.univie.ac.at//cgi-bin/RNAfold.
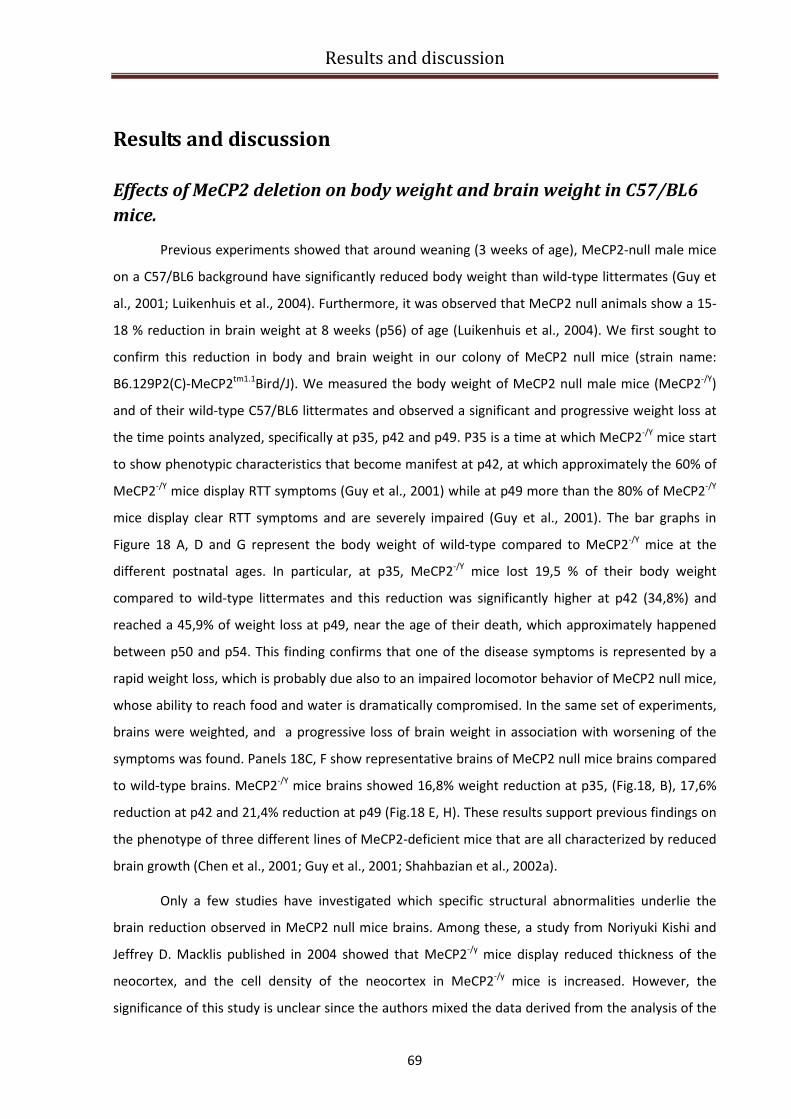
Results and discussion
69
Results and discussion
Effects of MeCP2 deletion on body weight and brain weight in C57/BL6
mice.
Previous experiments showed that around weaning (3 weeks of age), MeCP2-null male mice
on a C57/BL6 background have significantly reduced body weight than wild-type littermates (Guy et
al., 2001; Luikenhuis et al., 2004). Furthermore, it was observed that MeCP2 null animals show a 15-
18 % reduction in brain weight at 8 weeks (p56) of age (Luikenhuis et al., 2004). We first sought to
confirm this reduction in body and brain weight in our colony of MeCP2 null mice (strain name:
B6.129P2(C)-MeCP2tm1.1
Bird/J). We measured the body weight of MeCP2 null male mice (MeCP2-/Y
)
and of their wild-type C57/BL6 littermates and observed a significant and progressive weight loss at
the time points analyzed, specifically at p35, p42 and p49. P35 is a time at which MeCP2-/Y
mice start
to show phenotypic characteristics that become manifest at p42, at which approximately the 60% of
MeCP2-/Y
mice display RTT symptoms (Guy et al., 2001) while at p49 more than the 80% of MeCP2-/Y
mice display clear RTT symptoms and are severely impaired (Guy et al., 2001). The bar graphs in
Figure 18 A, D and G represent the body weight of wild-type compared to MeCP2-/Y
mice at the
different postnatal ages. In particular, at p35, MeCP2-/Y
mice lost 19,5 % of their body weight
compared to wild-type littermates and this reduction was significantly higher at p42 (34,8%) and
reached a 45,9% of weight loss at p49, near the age of their death, which approximately happened
between p50 and p54. This finding confirms that one of the disease symptoms is represented by a
rapid weight loss, which is probably due also to an impaired locomotor behavior of MeCP2 null mice,
whose ability to reach food and water is dramatically compromised. In the same set of experiments,
brains were weighted, and a progressive loss of brain weight in association with worsening of the
symptoms was found. Panels 18C, F show representative brains of MeCP2 null mice brains compared
to wild-type brains. MeCP2-/Y
mice brains showed 16,8% weight reduction at p35, (Fig.18, B), 17,6%
reduction at p42 and 21,4% reduction at p49 (Fig.18 E, H). These results support previous findings on
the phenotype of three different lines of MeCP2-deficient mice that are all characterized by reduced
brain growth (Chen et al., 2001; Guy et al., 2001; Shahbazian et al., 2002a).
Only a few studies have investigated which specific structural abnormalities underlie the
brain reduction observed in MeCP2 null mice brains. Among these, a study from Noriyuki Kishi and
Jeffrey D. Macklis published in 2004 showed that MeCP2-/y
mice display reduced thickness of the
neocortex, and the cell density of the neocortex in MeCP2-/y
mice is increased. However, the
significance of this study is unclear since the authors mixed the data derived from the analysis of the
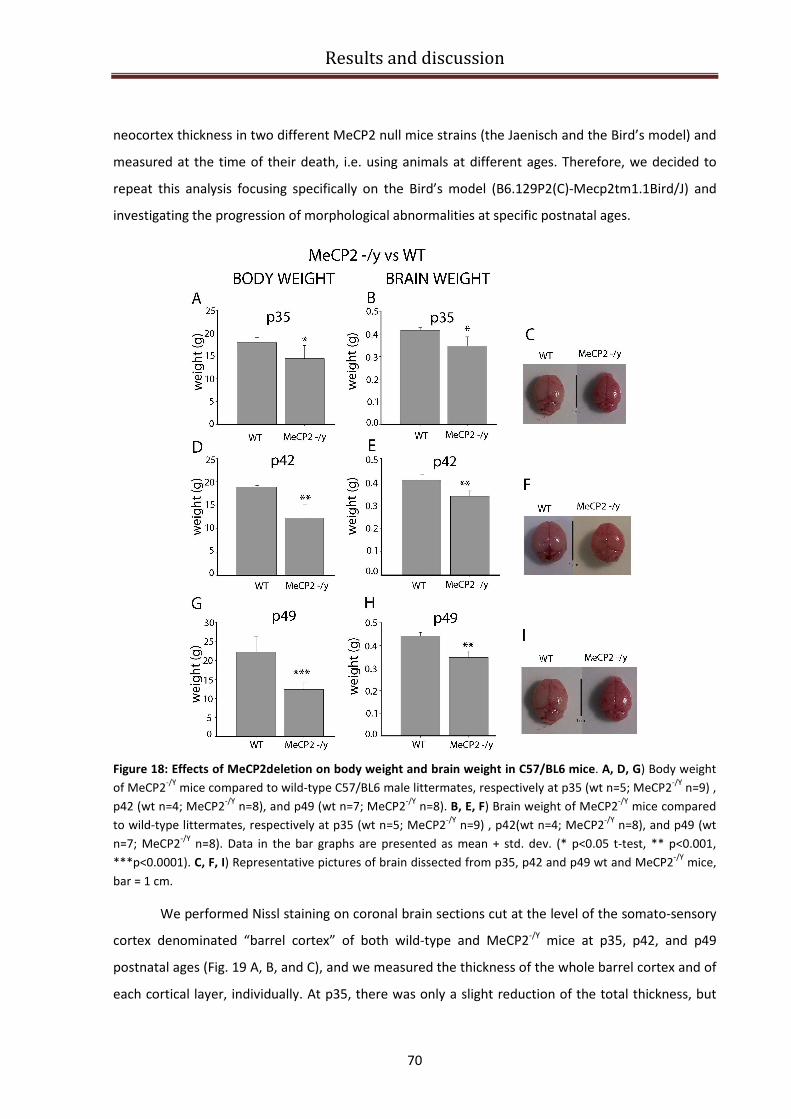
Results and discussion
70
neocortex thickness in two different MeCP2 null mice strains (the Jaenisch and the Bird’s model) and
measured at the time of their death, i.e. using animals at different ages. Therefore, we decided to
repeat this analysis focusing specifically on the Bird’s model (B6.129P2(C)-Mecp2tm1.1Bird/J) and
investigating the progression of morphological abnormalities at specific postnatal ages.
Figure 18: Effects of MeCP2deletion on body weight and brain weight in C57/BL6 mice. A, D, G) Body weight
of MeCP2-/Y
mice compared to wild-type C57/BL6 male littermates, respectively at p35 (wt n=5; MeCP2-/Y
n=9) ,
p42 (wt n=4; MeCP2-/Y
n=8), and p49 (wt n=7; MeCP2-/Y
n=8). B, E, F) Brain weight of MeCP2-/Y
mice compared
to wild-type littermates, respectively at p35 (wt n=5; MeCP2-/Y
n=9) , p42(wt n=4; MeCP2-/Y
n=8), and p49 (wt
n=7; MeCP2-/Y
n=8). Data in the bar graphs are presented as mean + std. dev. (* p<0.05 t-test, ** p<0.001,
***p<0.0001). C, F, I) Representative pictures of brain dissected from p35, p42 and p49 wt and MeCP2-/Y
mice,
bar = 1 cm.
We performed Nissl staining on coronal brain sections cut at the level of the somato-sensory
cortex denominated “barrel cortex” of both wild-type and MeCP2-/Y
mice at p35, p42, and p49
postnatal ages (Fig. 19 A, B, and C), and we measured the thickness of the whole barrel cortex and of
each cortical layer, individually. At p35, there was only a slight reduction of the total thickness, but

Results and discussion
71
starting from p42 and continuing at p49, there was a significant reduction of the overall cortical
thickness in MeCP2-/Y
mice compared to wild-type animals (Figure 19B, C). This result is confirmed by
the quantitative analysis reported in panels D, E, and F. In particular, the barrel cortex thickness was
measured on a total of 4 sections/cortex taken using a random-uniform approach, every 400 µm
from the most rostral to most caudal position of the barrel cortex (Fig. 19 D, E, and F).
Figure 19: Neocortical projection layers in MeCP2
-/Y mice are thinner than those in wild-type mice, and the
cell density of the neocortex in MeCP2-/Y
mice is increased compared to wild-type. A,B,C) Nissl staining of the
neocortex in wild-type and MeCP2-/Y
mice at different ages (A: p35, B: p42, and C: p49); scale bar 500 µm.
D,E,F) Quantification of thickness of total neocortex at four positions, every 400 µm from the rostral end of the
Results and discussion
72
barrel cortex at p35 (D), p42 (E) , and p49 (F); n=3wt + 3MeCP2-/Y. G,H,I) Quantification of thickness of every
single layer of the neocortex at p35 (G), p42 (H) , and p49 (I) measured at fixed distance from the rostral barrel
cortex n=3wt + 3MeCP2-/Y
. L,M,N) Quantification of cell density of each layer of the neocortex from wild-type
and MeCP2-/Y
mice at the different ages (L:p35, M:p42, and N:p49) (n=4 grids for each layer of each animal).
(*p<0,05 t-test vs wild-type). Values represent the mean ± SEM.
At the age of p49 (Fig. 19 F) there was an evident trend towards a reduction of the cortical
thickness at each position analyzed, but the cortex was significantly thinner only at a distance of 400
µm from the beginning of the barrel cortex. We next measured each cortical layer individually in
wild-type and MeCP2-/Y
mice. At every age analyzed, there was a significant reduction in the
thickness of cortical layers II/III (Fig. 19 G, H, and I), moreover at p35 and p49 we observed a
significant reduction also of layer V (Figure 19 G and I). Of note, we did not observed any significant
reduction of thickness of the granular layer IV (Fig. 19 G, H, and I). Our results are compatible with
the hypothesis on BDNF involvement in the RTT cortical anomalies, since layer IV is known to
produce little if any BDNF, and the layer II/III is the most affected layer in forebrain-specific BDNF null
mutant mice (Gorski et al., 2003).
There are at least two possibilities to explain why MECP2 -/Y
brains have a thinner neocortex:
(1) loss of neurons or other cells (more likely neurons, based on MECP2 expression within neurons);
and (2) reduced size or complexity of neurons. To investigate these two possibilities, we analyzed cell
density in each layer of each genotype (Fig. 19 L, M, and N). At p42 there was a significant increase in
the cell density in layers II/III, IV and V (Fig. 19 M), instead at p49 the cell density was significant
increased only in layers II/III and IV (Fig. 19 N). There was no significant difference in cell density at
p35. It interesting to note that, consistently with what one could expect, an approximately 10%
reduction in cortical thickness is followed by an approximately 20% increase in the number of
counted cells/µm2 (panels H and M and I and N, considering layer II/III). Surprisingly for layer IV there
is an increase in cell density without a substantial decrease in cortical thickness (Fig. 19 M,N).
However, a similar increase in layer IV cell density was also observed in another study, but the
authors did not provide an explanation for this finding (Kishi and Macklis, 2004). Since we counted all
cells, the increased number of cells observed in layer IV in absence of a layer shrinkage, may be due
to an increase in the number of astrocytes or other glial cells. Our results suggest that in MeCP2-/Y
mice there is a progressive reduction in the neocortex thickness which is not caused by neuronal
death. Hence, the reduction of thickness may be explained by the presence of dysmorphic neurons in
mutant mice which could be caused by disruption of a cell autonomous developmental programme
or by a decreased neurotrophic support, or both.
Results and discussion
73
BDNF specific isoforms expression in MeCP2-/Y mice brains
Cortical neurons with a reduction in the number and length of dendritic branches and a
significant loss of dendritic spines have been described in patients affected by RTT (Kaufmann and
Moser, 2000; Fiala et al., 2002) and the same abnormalities are reproduced in MeCP2 null mice,
which display smaller somas and reduced dendritic arborization of cortical pyramidal neurons (Kishi
and Macklis 2004). On the other hand, neurotrophins were first shown to increase the length and
complexity of dendrites of cortical pyramidal neurons (McAllister et al., 1995; McAllister et al., 1997),
confirming that endogenous neurotrophins play a critical role in dendritic development. In particular,
it was demonstrated that cortical pyramidal neurons that overexpress BDNF exhibit increased
dendritic arborization, as well as enhanced rates of spine retraction and formation (Horch and Katz,
2002; Horch et al., 1999). BDNF was later shown to increase spine density in CA1 pyramidal neurons,
an effect blocked by the scavenger TrkB-IgG, the receptor tyrosine kinase inhibitor k-252a, and
inhibitors of the MAPK/ERK signaling cascade (Tyler and Pozzo-Miller, 2001; Alonso et al., 2004).
Indeed, TrkB and BDNF conditional mutant mice show a similar even if less severe phenotype than
MeCP2-/Y
mice and BDNF dysregulation is a specific consequence of MeCP2 loss. In addition, in two
independent studies of Wang and Chang in 2006, demonstrated that BDNF protein content of
peripheral and CNS tissues is reduced in MeCP2 null mice at 5 weeks of age (Wang et al., 2006; Chang
et al., 2006). In particular Chang et al., (2006) reported that BDNF protein levels decreased in MeCP2-
/Y cortex, cerebellum and the rest of the brain, respectively by 21%, 41%, and 55% of wild-type levels.
To determine if the decrease in BDNF protein levels is reflective of a decreased BDNF gene
expression, we analysed the mRNA levels for each BDNF splice variant in wild type and MeCP2 null
mice forebrains. The rationale for this experiment is that in order to devise a pharmacological
strategy aimed at restoring BDNF levels in RTT brain it is necessary to first determine if there are
residual amounts of BDNF mRNA and its composition in terms of splice variants, because the
different BDNF transcripts have a different expression level and translatability.
We isolated RNA from forebrain tissue samples containing cerebral cortex and hippocampus
from MeCP2-/Y
and wild-type control mice, and retro-transcribed it to cDNA. This was used as a
template for Sybr Green quantitative real-time PCR as described in “materials and methods”. The
primers pairs used to amplify each BDNF 5’UTR exon were composed by specific forward primers,
designed for each 5’exon, and by a common reverse primer; a specific couple of primers was used to
amplify the coding sequence of BDNF and the internal control (GAPDH) (Fig. 20 A). The primers
efficiency was determined using the comparative quantitation method provided by the Rotor Gene
3000 software. The primers pairs used to amplify each exon, the CDS and the GAPDH and the relative
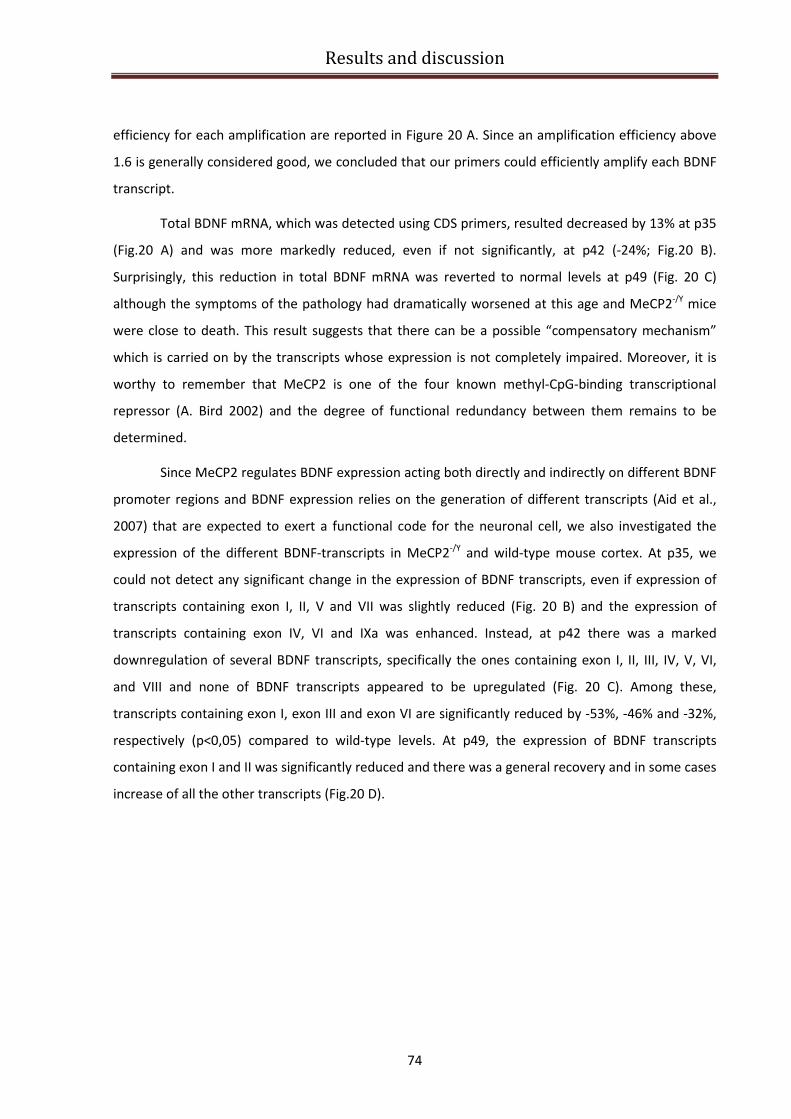
Results and discussion
74
efficiency for each amplification are reported in Figure 20 A. Since an amplification efficiency above
1.6 is generally considered good, we concluded that our primers could efficiently amplify each BDNF
transcript.
Total BDNF mRNA, which was detected using CDS primers, resulted decreased by 13% at p35
(Fig.20 A) and was more markedly reduced, even if not significantly, at p42 (-24%; Fig.20 B).
Surprisingly, this reduction in total BDNF mRNA was reverted to normal levels at p49 (Fig. 20 C)
although the symptoms of the pathology had dramatically worsened at this age and MeCP2-/Y
mice
were close to death. This result suggests that there can be a possible “compensatory mechanism”
which is carried on by the transcripts whose expression is not completely impaired. Moreover, it is
worthy to remember that MeCP2 is one of the four known methyl-CpG-binding transcriptional
repressor (A. Bird 2002) and the degree of functional redundancy between them remains to be
determined.
Since MeCP2 regulates BDNF expression acting both directly and indirectly on different BDNF
promoter regions and BDNF expression relies on the generation of different transcripts (Aid et al.,
2007) that are expected to exert a functional code for the neuronal cell, we also investigated the
expression of the different BDNF-transcripts in MeCP2-/Y
and wild-type mouse cortex. At p35, we
could not detect any significant change in the expression of BDNF transcripts, even if expression of
transcripts containing exon I, II, V and VII was slightly reduced (Fig. 20 B) and the expression of
transcripts containing exon IV, VI and IXa was enhanced. Instead, at p42 there was a marked
downregulation of several BDNF transcripts, specifically the ones containing exon I, II, III, IV, V, VI,
and VIII and none of BDNF transcripts appeared to be upregulated (Fig. 20 C). Among these,
transcripts containing exon I, exon III and exon VI are significantly reduced by -53%, -46% and -32%,
respectively (p<0,05) compared to wild-type levels. At p49, the expression of BDNF transcripts
containing exon I and II was significantly reduced and there was a general recovery and in some cases
increase of all the other transcripts (Fig.20 D).
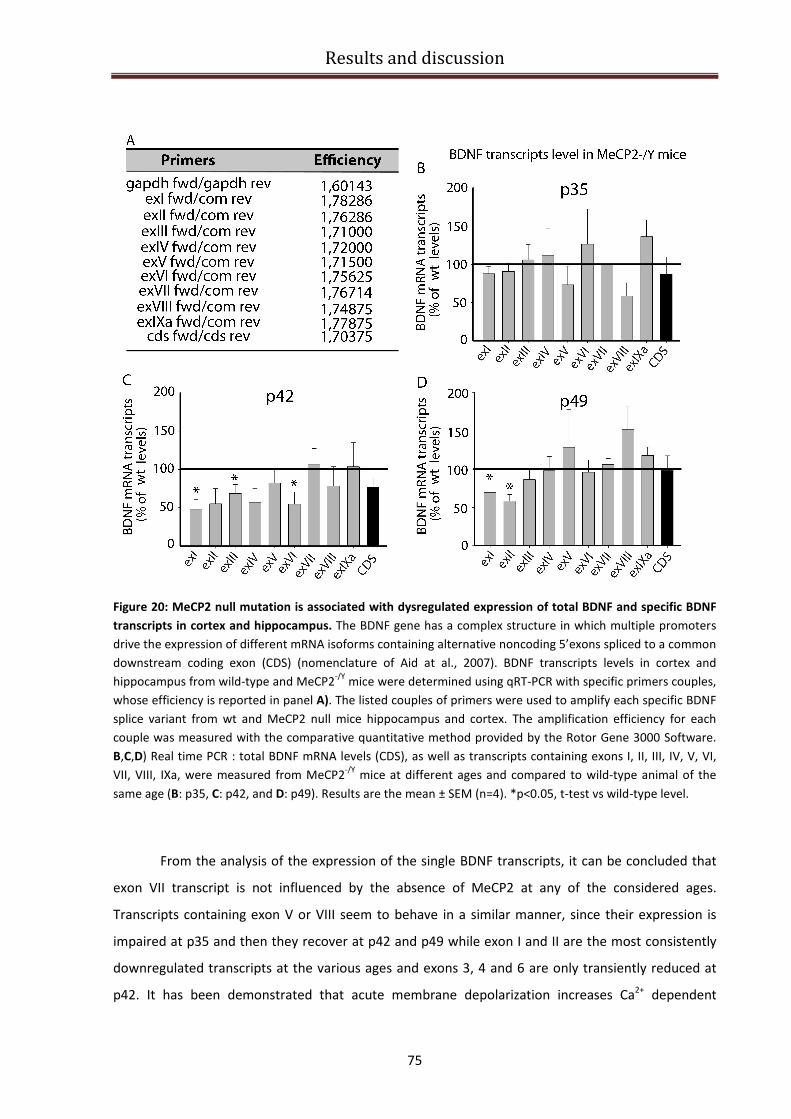
Results and discussion
75
Figure 20: MeCP2 null mutation is associated with dysregulated expression of total BDNF and specific BDNF
transcripts in cortex and hippocampus. The BDNF gene has a complex structure in which multiple promoters
drive the expression of different mRNA isoforms containing alternative noncoding 5’exons spliced to a common
downstream coding exon (CDS) (nomenclature of Aid at al., 2007). BDNF transcripts levels in cortex and
hippocampus from wild-type and MeCP2-/Y
mice were determined using qRT-PCR with specific primers couples,
whose efficiency is reported in panel A). The listed couples of primers were used to amplify each specific BDNF
splice variant from wt and MeCP2 null mice hippocampus and cortex. The amplification efficiency for each
couple was measured with the comparative quantitative method provided by the Rotor Gene 3000 Software.
B,C,D) Real time PCR : total BDNF mRNA levels (CDS), as well as transcripts containing exons I, II, III, IV, V, VI,
VII, VIII, IXa, were measured from MeCP2-/Y
mice at different ages and compared to wild-type animal of the
same age (B: p35, C: p42, and D: p49). Results are the mean ± SEM (n=4). *p<0.05, t-test vs wild-type level.
From the analysis of the expression of the single BDNF transcripts, it can be concluded that
exon VII transcript is not influenced by the absence of MeCP2 at any of the considered ages.
Transcripts containing exon V or VIII seem to behave in a similar manner, since their expression is
impaired at p35 and then they recover at p42 and p49 while exon I and II are the most consistently
downregulated transcripts at the various ages and exons 3, 4 and 6 are only transiently reduced at
p42. It has been demonstrated that acute membrane depolarization increases Ca2+
dependent
Results and discussion
76
transcription BDNF of exon I and IV, whose transcription is driven by two highly depolarization-
responsive promoters (Pruunsild et al., 2011). In addition, since MeCP2 acts by binding directly BDNF
exon IV and represses the transcription of BDNF exon IV (Chen et al., 2003), one could expect that a
loss of MeCP2 would result in an increase in the expression of this transcript. The fact that we did not
observe any significant change in its expression could be explained by the robust reduction in overall
cortical activity seen in MeCP2-/y
mice (Chen et al., 2003), which can mask the activation of BDNF
exon IV transcription in response to membrane depolarization. In addition, it has been demonstrated
that promoters I and II of the BDNF gene flank an RE1 element for silencing and repression that is the
target of two known key regulators of neuronal genes; REST (RE1 silencing transcription factor) and
its corepressor CoREST. Chromatin Immunoprecipitation (ChIP) analysis of the Rest promoter
revealed the presence of MeCP2 bound to BDNF promoter. MeCP2 deficiency can lead to
overexpression of REST and CoREST, which become constitutively active and repress the
transcription of BDNF exon I and II. This mechanism could indeed explain the significant reduced
expression of transcripts containing exon I and IIthat we detected at p42 and especially at p49 in
MeCP2-/Y
mice (Fig.20 C,D).
BDNF specific isoforms expression in RTT patients brains
To the best of our knowledge, there is still a lack of information about the expression of
BDNF isoforms in RTT human brain. There is a need to provide a clear picture of the regulation of
BDNF in RTT for several reasons. Given the involvement of BDNF in RTT, it is important to elucidate
how and at which extent its expression is dysregulated; then we need to validate MeCP2-/Y
mouse
model as an accurate tool for preclinical drug evaluation and, the last but most important point, we
need to understand if the recovery of an appropriate regulation of BDNF could revert some
symptoms of the pathology and open the way for a possible pharmacological treatment. In order to
investigate BDNF isoforms expression in RTT patients, in 2010 we acquired human brain tissue from
normal individuals and RTT patients from NICHD Brain and Tissue Bank for Developmental Disorders,
at University of Maryland Baltimora, USA. RTT patients were all of the classical RTT syndrome type
and all females. A 18 years old female (UMB#1815) carrying a heterozygous IVS3-2A>G mutation
which affects splicing at the junction between MeCP2 exons 3-2; a 20 years old female (UMB#4516),
without genetic analysis available, a 17 years old female (UMB#4882) carrying a C763T nonsense
mutation, and a 19 years old female (UMB#4852) carrying a heterozygous G451T missense mutation
in exon 4 of MeCP2 gene (Table 10).
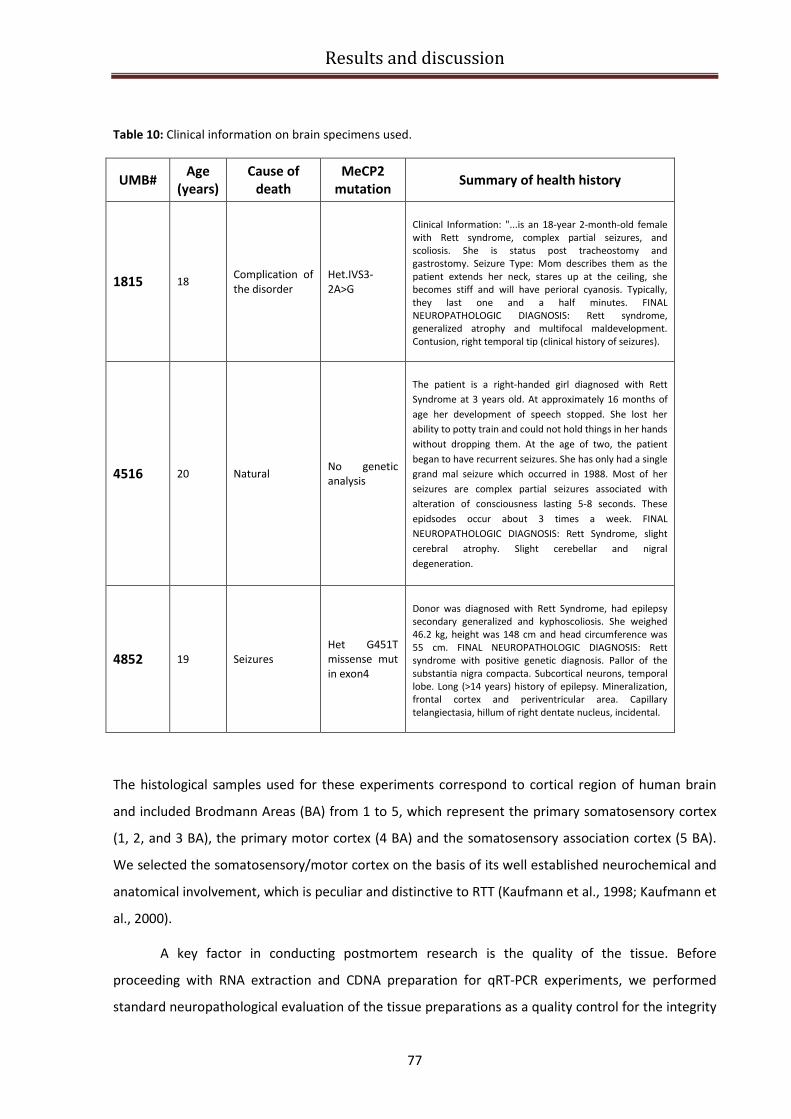
Results and discussion
77
Table 10: Clinical information on brain specimens used.
UMB# Age
(years)
Cause of
death
MeCP2
mutation Summary of health history
1815 18 Complication of
the disorder
Het.IVS3-
2A>G
Clinical Information: "...is an 18-year 2-month-old female
with Rett syndrome, complex partial seizures, and
scoliosis. She is status post tracheostomy and
gastrostomy. Seizure Type: Mom describes them as the
patient extends her neck, stares up at the ceiling, she
becomes stiff and will have perioral cyanosis. Typically,
they last one and a half minutes. FINAL
NEUROPATHOLOGIC DIAGNOSIS: Rett syndrome,
generalized atrophy and multifocal maldevelopment.
Contusion, right temporal tip (clinical history of seizures).
4516 20 Natural No genetic
analysis
The patient is a right-handed girl diagnosed with Rett
Syndrome at 3 years old. At approximately 16 months of
age her development of speech stopped. She lost her
ability to potty train and could not hold things in her hands
without dropping them. At the age of two, the patient
began to have recurrent seizures. She has only had a single
grand mal seizure which occurred in 1988. Most of her
seizures are complex partial seizures associated with
alteration of consciousness lasting 5-8 seconds. These
epidsodes occur about 3 times a week. FINAL
NEUROPATHOLOGIC DIAGNOSIS: Rett Syndrome, slight
cerebral atrophy. Slight cerebellar and nigral
degeneration.
4852 19 Seizures
Het G451T
missense mut
in exon4
Donor was diagnosed with Rett Syndrome, had epilepsy
secondary generalized and kyphoscoliosis. She weighed
46.2 kg, height was 148 cm and head circumference was
55 cm. FINAL NEUROPATHOLOGIC DIAGNOSIS: Rett
syndrome with positive genetic diagnosis. Pallor of the
substantia nigra compacta. Subcortical neurons, temporal
lobe. Long (>14 years) history of epilepsy. Mineralization,
frontal cortex and periventricular area. Capillary
telangiectasia, hillum of right dentate nucleus, incidental.
The histological samples used for these experiments correspond to cortical region of human brain
and included Brodmann Areas (BA) from 1 to 5, which represent the primary somatosensory cortex
(1, 2, and 3 BA), the primary motor cortex (4 BA) and the somatosensory association cortex (5 BA).
We selected the somatosensory/motor cortex on the basis of its well established neurochemical and
anatomical involvement, which is peculiar and distinctive to RTT (Kaufmann et al., 1998; Kaufmann et
al., 2000).
A key factor in conducting postmortem research is the quality of the tissue. Before
proceeding with RNA extraction and CDNA preparation for qRT-PCR experiments, we performed
standard neuropathological evaluation of the tissue preparations as a quality control for the integrity

Results and discussion
78
of the histological samples. Figure 21 A, shows Nissl staining of 20 µm frozen sections, that did not
reveal any tissue abnormality in no one of the processed samples with normal cortical lamination,
small neuronal somas and more densely packed gray matter. As the histological appearance of the
four specimes was similar, there was no obvious effect of post-mortem delay, which is comprised
between 5 and 18 hours for all the samples included in this study (Fig.21 A).
Figure 21: Quality control of human brain samples tissue received from NICHD Brain and Tissue Bank for
Developmental Disorders. Histological samples correspond to human somatosensory and motor cortex
(Brodmann areas 1-5) and were conserved as frozen samples to allow for biochemical analysis. A) Nissl staining
of 20 µm sections. Pictures were taken at different magnification (10X and 40X). Scale bar=100µm for the
upper panels and 10 µm for the lower panels. B) Agarose gel electrophoresis to control the integrity of RNA
extracted. The two bands at 28S and 18S are clearly distinguishable. C) Agarose gel electrophoresis to show the
PCR products corresponding to GAPDH gene, which was used as a control to verify the quality of cDNA
produced from the extracted RNAs.

Results and discussion
79
RNA was extracted, as described in “materials and methods”, and its quality was analyzed by
agarose gel electrophoresis, as shown in Figure 21 B. Intact total eukaryotic RNA consists mainly of
two ribosomal species: 28S and 18S. Their corresponding bands should appear sharp and well
delineated on a gel electrophoresis and the 28S band should be approximately twice as bright as the
18S band. As total RNA degrades, shorter fragments progressively accumulate and the ribosomal
species become less abundant; consequently, the 28S and 18S bands fade or disappear and the
smaller species migrate as a smear (Stan A.D. et al., 2006). As shown in Fig. 21 B, the RNA extracted
from human tissue samples appear to have little signal between the two bands 28S and 18S, and
because of residual total RNA degradation, low molecular weight material can be visualized below
the 18S band. Concerning the sample UMB#4882 the RNA extracted appears to be degraded and the
28S and 18S bands are poorly detectable. For all the other samples, the 28S and 18S bands are still
clearly defined, meaning that little degradation has occurred. We can conclude that the RNAs
extracted have a medium quality and we excluded the sample UMB#4882 from our future
experiments. Furthermore we tested the quality of the corresponding cDNA retro-transcribed from
the extracted RNA, via amplification of the housekeeping gene Glyceraldehyde 3-phosphate
dehydrogenase (GAPDH). We obtained good amplification efficiency, as shown in the representative
pictures of the agarose gel (Fig.21 C) both for the concentrated cDNA samples (the first two lanes for
each sample) and for the 100 ng/µl diluted samples (the second two lanes for each sample).
qRT-PCR experiments on human brain samples
The results of our preliminary qRT-PCR experiments on human RTT patients brain samples
are reported in Fig. 22. We have performed quantitative analysis of BDNF total mRNA and transcripts
containing BDNF exon IV using specific primers for CDS and exon IV (see efficiency in Fig. 20).
Remarkably the expression level of total BDNF mRNA represented by its CDS is very similar in all the
brain samples coming from healthy donors (Fig. 22A). In addition, the expression level of BDNF
transcripts IV is slightly but still not significantly different in the analyzed healthy donors’ population
(Fig. 22 B); this is not surprising since the expression of this transcript is known to be tightly
dependent upon neuronal activity (Tao et al., 2002)
When compared to BDNF expression profile in RTT patients’ brain samples, we observed that
RTT patient #1815 shows a 52% significant reduction (p<0.05) in BDNF CDS (Fig. 22 C) and a 12%
decrease in BDNF CDS is detectable in RTT patient #4516 (Fig. 22 D), instead a 60% increase in CDS
level is appreciable in patient #4852 (Fig. 22 E). Concerning BDNF exon IV expression we can observe
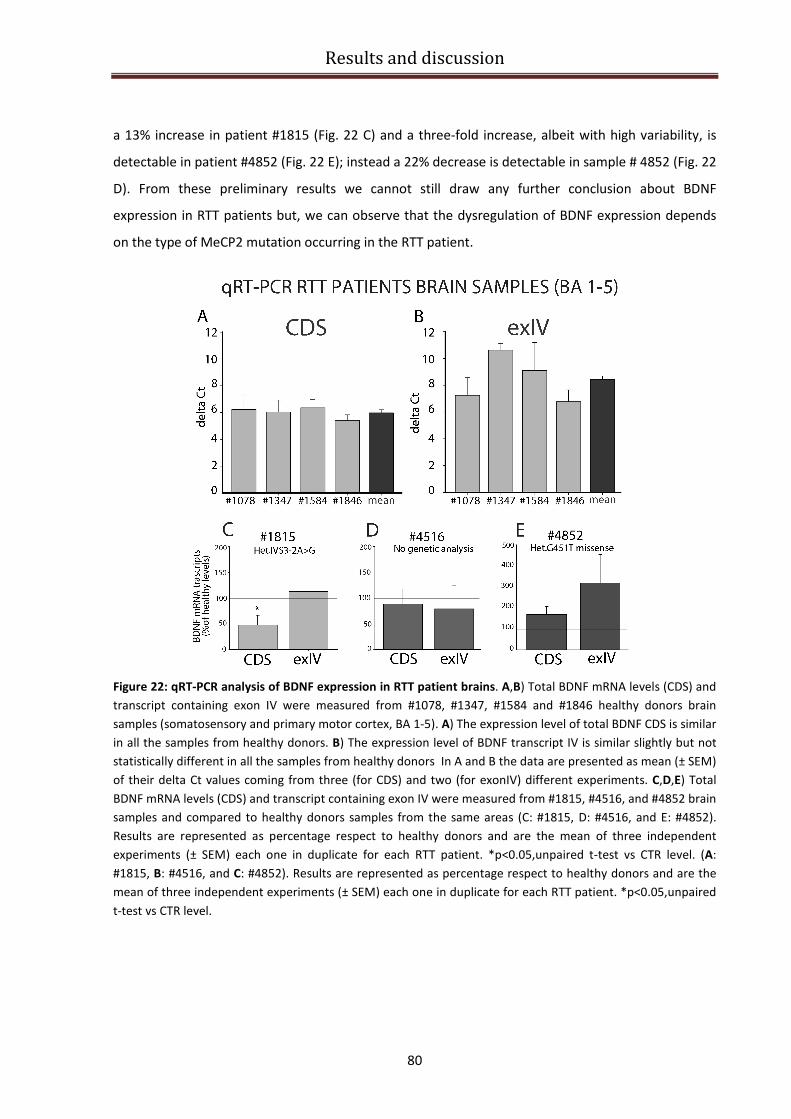
Results and discussion
80
a 13% increase in patient #1815 (Fig. 22 C) and a three-fold increase, albeit with high variability, is
detectable in patient #4852 (Fig. 22 E); instead a 22% decrease is detectable in sample # 4852 (Fig. 22
D). From these preliminary results we cannot still draw any further conclusion about BDNF
expression in RTT patients but, we can observe that the dysregulation of BDNF expression depends
on the type of MeCP2 mutation occurring in the RTT patient.
Figure 22: qRT-PCR analysis of BDNF expression in RTT patient brains. A,B) Total BDNF mRNA levels (CDS) and
transcript containing exon IV were measured from #1078, #1347, #1584 and #1846 healthy donors brain
samples (somatosensory and primary motor cortex, BA 1-5). A) The expression level of total BDNF CDS is similar
in all the samples from healthy donors. B) The expression level of BDNF transcript IV is similar slightly but not
statistically different in all the samples from healthy donors In A and B the data are presented as mean (± SEM)
of their delta Ct values coming from three (for CDS) and two (for exonIV) different experiments. C,D,E) Total
BDNF mRNA levels (CDS) and transcript containing exon IV were measured from #1815, #4516, and #4852 brain
samples and compared to healthy donors samples from the same areas (C: #1815, D: #4516, and E: #4852).
Results are represented as percentage respect to healthy donors and are the mean of three independent
experiments (± SEM) each one in duplicate for each RTT patient. *p<0.05,unpaired t-test vs CTR level. (A:
#1815, B: #4516, and C: #4852). Results are represented as percentage respect to healthy donors and are the
mean of three independent experiments (± SEM) each one in duplicate for each RTT patient. *p<0.05,unpaired
t-test vs CTR level.
Results and discussion
81
MeCP2 silencing in SH-SY5Y neuroblastoma cell line
While research models in animals allow studies in the whole organism within a reasonable
time, there also exists a need for the possibility to investigate disease-related processes in human
cells. Apart from their easy handling, in vitro cell culture models allow the direct monitoring of
parameters over time and represent an extremely valuable tool for high-throughput-screening for
therapeutic compounds. Primary human neuronal cells however are not an available tool for study.
Therefore, cell culture-based approaches are being developed, relying on the derivation and
propagation of neuronal cells from human neuroblastomas. One widely employed model for
neuronal cells in culture is the human neuroblastoma line SH-SY5Y, which has been extensively used
to study several neurologic disease, such as Alzheimer’s disease (Greco S.J. et al., 2009) and
Parkinson disease (Lopes F.M et al., 2010). We decided to generate a cellular model for RTT
disrupting the expression of MeCP2 in undifferentiated SH-SY5Y, using an approach of RNA-
interference (RNAi). There are at least two compelling reasons for the choice of the neuroblastoma
SH-SY5Y cell line for our study: i) these cells express BDNF and TrkB receptor, the high affinity
receptor promoting cell survival, neuronal development and LTP; ii) the BDNF transcripts expression
pattern is very similar to that of human cortical tissue. To this extent, a comparison of levels of each
BDNF transcripts demonstrated that BDNF transcript IV is the most highly expressed transcript in
both the human cortex and SH-SY5Y cells, representing over one-half of the total BDNF. Both the
human cortex and SY5Y cells predominantly express BDNF transcripts I, IV, and V, whereas transcripts
II, VI, and VII are minor contributors to the total, and transcript III is not detectable (Garzon et al.,
2002).
A set of five different lentiviral vector encoding shRNA specific for human MeCP2
(NM_004992, Sigma MISSIONTM
TRC shRNA set) was tested in order to discriminate which one was
able to efficiently knock-down the MeCP2 expression. A control shRNA vector (SHC002, The
MISSIONTM
NonTarget shRNA Control Vector, Sigma), which contains a shRNA sequence that does
not target human and mouse genes (>4 base pair mismatches to any known human or mouse gene),
was used as a negative control for MeCP2 knockdown shRNAs. Knockdown efficiency of endogenous
MeCP2 was monitored via semi-quantitative PCR (Fig. 23 A,B) and immunoblotting using a polyclonal
antibody specific for MeCP2 (Fig. 23 C, D). We aligned the sh-MeCP2 sequences and we confirmed
that all of them targeted the CDS region of MeCP2. In particular sh-MeCP2 39, 40, and 42 targeted
MeCP2 exon4, instead sh-MeCP2 41 and 43 targeted MeCP2 exon3, so we concluded that all the sh-
MeCP2-RNAs were potentially able to silence both the MeCP2 isoforms (e_1 and e_2), which differ
only for the presence of exon 2 at their N-termini. In fact, alternative splicing of the MeCP2-e_1
Results and discussion
82
transcript, encoded by MeCP2α, excludes exon 2, while the MeCP2-e_2 isoform, encoded by
MeCP2β, is expressed from an ATG in exon2 (MeCP2-e_1 is the most abundant isoform). The
different shRNAs were separately and transiently transfected in undifferentiated SH-SY5Y cells for 24
hours or 48 hours, then RNA was extracted and a semiquantitative PCR was performed for each
silencing in order to investigate which shRNA is able to knock down MeCP2 mRNA more efficiently.
Fig. 23 A, shows that at 24 hours sh-MeCP2 40 and sh-MeCP2 43 were able to reduced significantly
the expression of MeCP2 by 80 and 84 %, respectively. After 48 hours of transfection however, the
expression of MeCP2 resulted less efficiently silenced except for sh-MeCP2 42, which reduced by
45% the expression of MeCP2. The lack of a significant reduction of MeCP2 mRNA at 48h post-
transfection is likely to be caused by duplication of the cells and the consequent loss of the sh-RNAs,
which are no longer present in the new cells. Considering the successful results obtained for sh-
MeCP2 40, 42 and 43 in the reduction of mRNA MeCP2expression, we focused on these plasmids to
assess their effect on MeCP2 translation into protein as final outcome. We performed Western blot
analysis on cellular lysates obtained after 24 (data not shown) and 48 hours of transfection with the
above-mentioned sh-RNAs (Fig. 23 B).
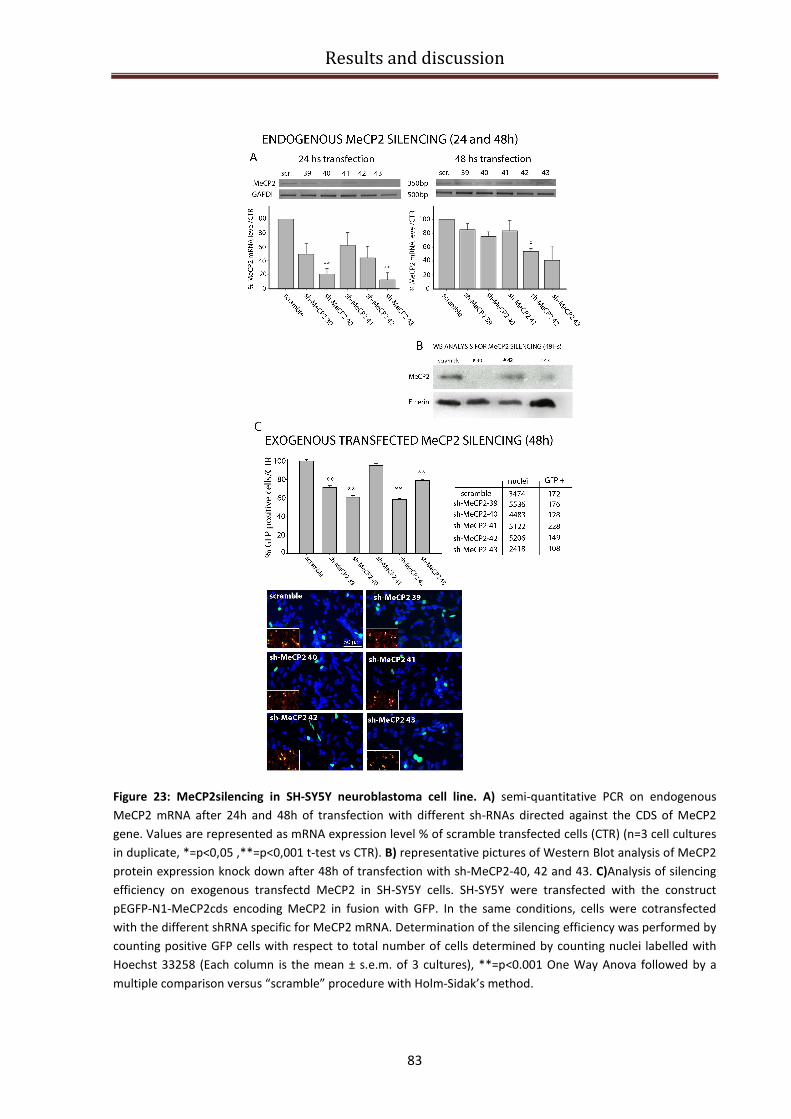
Results and discussion
83
Figure 23: MeCP2silencing in SH-SY5Y neuroblastoma cell line. A) semi-quantitative PCR on endogenous
MeCP2 mRNA after 24h and 48h of transfection with different sh-RNAs directed against the CDS of MeCP2
gene. Values are represented as mRNA expression level % of scramble transfected cells (CTR) (n=3 cell cultures
in duplicate, *=p<0,05 ,**=p<0,001 t-test vs CTR). B) representative pictures of Western Blot analysis of MeCP2
protein expression knock down after 48h of transfection with sh-MeCP2-40, 42 and 43. C)Analysis of silencing
efficiency on exogenous transfectd MeCP2 in SH-SY5Y cells. SH-SY5Y were transfected with the construct
pEGFP-N1-MeCP2cds encoding MeCP2 in fusion with GFP. In the same conditions, cells were cotransfected
with the different shRNA specific for MeCP2 mRNA. Determination of the silencing efficiency was performed by
counting positive GFP cells with respect to total number of cells determined by counting nuclei labelled with
Hoechst 33258 (Each column is the mean ± s.e.m. of 3 cultures), **=p<0.001 One Way Anova followed by a
multiple comparison versus “scramble” procedure with Holm-Sidak’s method.
Results and discussion
84
We found that a time of 24 hours of transfection is not sufficient to sort any effect on MeCP2 protein
levels (data not shown), instead after 48 hours of transfection no protein product is detectable when
sh-MeCP2-40 is transfected into cells and a small amount of protein is present with sh-MeCP2-43.
These results confirm the previous data obtained from semiquantitative PCR and exclude sh-MeCP2-
42 as a candidate for a successful silencing of endogenous MeCP2. Furthermore we decided to
validate these findings with an additional experiment on neuroblastoma cells transfected with GFP-
tagged MeCP2 and treated with sh-RNA for 48 hours. Measuring the percentage of GFP positive cells
with respect to the total number of cells (determined by counting nuclei labelled with Hoechst
33258) after the sh-RNA transfection, we observed that all sh-MeCP2s except sh-MeCP2-41 plasmids
were able to significantly reduce the number of GFP positive cells. In particular sh-MeCP2-40 induced
a 40% reduction of GFP positive cells compared to the scramble plasmid (Fig. 23, C bar graphs). The
lower part of Fig. 23 C shows some representative pictures that depict the situation reported in the
bar graph. Collecting the results from these three experiments (Fig 23 A, B and C), we identified the
sh-MeCP2- 40 as the only one which was able to successfully silence MeCP2 gene expression in all
the experimental conditions. We used this experimental setting (48 hours of transfection with sh-
MeCP2-40) to silence MeCP2in undifferentiated SH-SY5Y cells to further examine our cellular model
of RTT.
BDNF specific isoforms expression in MeCP2-knocked down SHSY-5Y
cells
After having validated the effective RNA interference (RNAi) protocol to knock down human
MeCP2 expression in SHSY-5Y neuroblastoma cells, we investigated the pattern of BDNF isoforms
expression using quantitative real time PCR following MeCP2 gene disruption. At 48 hours after
transfection with sh-MeCP2-40, we performed qRT-PCR with Sybr Green and the BDNF isoforms
expression in MeCP2-knocked down cells was compared with BDNF expression profile of the
scrambled transfected cells (here referred as CTR).
We set the appropriate amplification condition for each transcript and we determined the
amplification efficiency for each primers pair with the comparative quantitative method provided by
the Rotor Gene 3000 software, as described above. The results are reported in Figure 24 A. Total
BDNF mRNA, represented by its CDS expression, was downregulated by the 42% in MeCP2 knocked-
down cells. BDNF transcripts with exon I or V turned out to be undetectable both from control and
MeCP2-knocked down SH-SY5Y cells (Fig. 24 A, B). In MeCP2 silenced cells, we found a slight
decrease in the expression of exon IV and VIII transcripts compared to the control condition

Results and discussion
85
(scrambled transfected cells) while in the same conditions, the expression of exon III and exon VI
containing transcripts was upregulated by 63% and 70%, respectively.
Figure 24:qRT-PCR analysis of BDNF expression in SHSY-5Y MeCP2 knocked down cells. A) The listed couples
of primers were used to amplify each specific BDNF splice variant from scramble transfected and MeCP2knock
down SH-SY5Y cells. The amplification efficiency for each couple was measured with the comparative
quantitative method provided by the Rotor Gene 3000 Software. B) Real time PCR: total BDNF mRNA levels
(CDS), as well as transcripts containing exons I, II, III, IV, V, VI, VII, VIII, IXa were measured from MeCP2knock
down SH-SY5Y cells and compared to scramble transfected cells. Results are the mean ± SEM (n=4). *p<0.05, t-
test vs CTR level.
Previous studies showed that the BDNF transcript expression pattern in SH-SY5Y cells is very
similar to that of the human cortical tissue (Garzon et al., 2002). Moreover, a comparison of levels of
each BDNF transcript demonstrated that BDNF transcript IV is the most highly expressed transcript in
both the human cortex and SY5Y cells, representing over one-half of the total BDNF. According to the
same study both the human cortex and SY5Y cells predominantly express BDNF transcripts I, IV, and
VI, whereas transcripts II, VII and VIII are minor contributors to the total, and transcript III is not
detectable (the nomenclature correspond to the most recent revision by Pruunsild et al., 2007).
However, that study did not provide any information about the expression of transcripts V and IXa,
since they were not considered at that time. We could not detect any significant change in the
expression of exon II containing transcripts, even if we expected to observe a downregulation of its
expression, since it is regulated by a REST/CoREST repression mechanism, which must be
constitutively activated in absence of MeCP2.
Results and discussion
86
Investigating BDNF translatability
As described in the introduction, transcription of BDNF gene produces 11 primary transcripts
in rodents (Aid et al., 2007,; Gene ID: 12064 and 24225) and 17 primary transcripts in humans
(Pruunsild et al., 2007; Gene ID: 627) each characterized by a different alternatively spliced 5’
untranslated (UTR) exon, a common coding region, and two possible 3’UTR tails. Pruunsild et al.
(2007), and Aid et al. (2007) studies have highlighted that the 5’UTR region of each BDNF transcript is
encoded by a different exon with unique length, GC content and putative secondary structures. Thus,
each BDNF transcript is likely to display a different translatability. However, since the final protein
product is the same, it is presently impossible to determine the relative contribution of each single
BDNF splice variants to the production of the BDNF protein. Thus, to determine the role of each
BDNF transcript in producing the protein, it is necessary to develop new tools able to determine the
amount of protein generated by each BDNF splice variant at basal condition and in response to a
disease state or a specific drug.
To obtain information on translatability of each BDNF splice variant, we built up a Luciferase-
based assay. The 10 exons coding for the different rat BDNF 5’UTRs and the sequences coding for the
two 3’ UTR tails were cloned into a vector that was initially modified to express the Firefly Luciferase
gene (Fluc) under the CMV promoter. With a similar strategy, we obtained also a plasmid expressing
Renilla Luciferase (Rluc), which acts as a normalizing vector. The cloning strategy and the resulting
maps of the newly obtained pN1-FLuc (pFluc) and pN1-RLuc (or pRluc) are shown in Figure 25. pN1-
FLuc (pFluc) and pN1-RLuc (or pRluc) were then used as a backbone to construct the vectors
containing the different BDNF splicing variants.
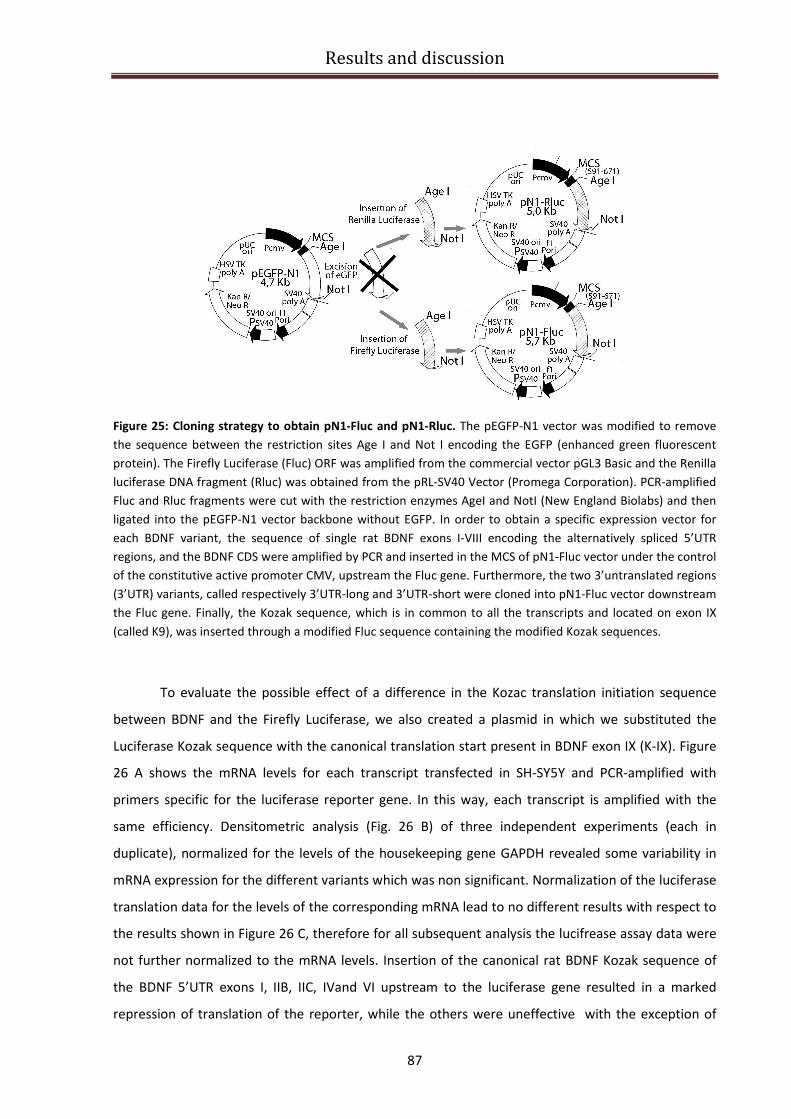
Results and discussion
87
Figure 25: Cloning strategy to obtain pN1-Fluc and pN1-Rluc. The pEGFP-N1 vector was modified to remove
the sequence between the restriction sites Age I and Not I encoding the EGFP (enhanced green fluorescent
protein). The Firefly Luciferase (Fluc) ORF was amplified from the commercial vector pGL3 Basic and the Renilla
luciferase DNA fragment (Rluc) was obtained from the pRL-SV40 Vector (Promega Corporation). PCR-amplified
Fluc and Rluc fragments were cut with the restriction enzymes AgeI and NotI (New England Biolabs) and then
ligated into the pEGFP-N1 vector backbone without EGFP. In order to obtain a specific expression vector for
each BDNF variant, the sequence of single rat BDNF exons I-VIII encoding the alternatively spliced 5’UTR
regions, and the BDNF CDS were amplified by PCR and inserted in the MCS of pN1-Fluc vector under the control
of the constitutive active promoter CMV, upstream the Fluc gene. Furthermore, the two 3’untranslated regions
(3’UTR) variants, called respectively 3’UTR-long and 3’UTR-short were cloned into pN1-Fluc vector downstream
the Fluc gene. Finally, the Kozak sequence, which is in common to all the transcripts and located on exon IX
(called K9), was inserted through a modified Fluc sequence containing the modified Kozak sequences.
To evaluate the possible effect of a difference in the Kozac translation initiation sequence
between BDNF and the Firefly Luciferase, we also created a plasmid in which we substituted the
Luciferase Kozak sequence with the canonical translation start present in BDNF exon IX (K-IX). Figure
26 A shows the mRNA levels for each transcript transfected in SH-SY5Y and PCR-amplified with
primers specific for the luciferase reporter gene. In this way, each transcript is amplified with the
same efficiency. Densitometric analysis (Fig. 26 B) of three independent experiments (each in
duplicate), normalized for the levels of the housekeeping gene GAPDH revealed some variability in
mRNA expression for the different variants which was non significant. Normalization of the luciferase
translation data for the levels of the corresponding mRNA lead to no different results with respect to
the results shown in Figure 26 C, therefore for all subsequent analysis the lucifrease assay data were
not further normalized to the mRNA levels. Insertion of the canonical rat BDNF Kozak sequence of
the BDNF 5’UTR exons I, IIB, IIC, IVand VI upstream to the luciferase gene resulted in a marked
repression of translation of the reporter, while the others were uneffective with the exception of

Results and discussion
88
exon 2A which enhanced translation. In Figure 26 D a representative Western-blot is displayed,
showing the protein expression (antibody anti-luc) for each pN1-insert name-Fluc construct. Results
of the luciferase assay and the western-blot are consistent with each other, meaning that the
different levels of luminescence which were measured are indeed a result of a different amount of
reporter protein production.
Figure 26: The different BDNF 5’UTRs determine a different translatability of the Firefly Luciferase reporter
gene. A) Representative picture for PCR amplification of the Firefly Luciferase gene (with exception for the first
lane in which Renilla Luciferase gene was amplified) from each BDNF 5’UTR- Firefly Luciferase (or Renilla for the
first lane) construct trasfected in SH-SY5Y neuroblastoma cells. In the bottom picture GAPDH amplification
shows that similar amount of cells were used. B) Densitometric analysis of Luciferase transcription normalized
on GAPDH expression shows that the RNA for each constructs is similarly transcribed (n=3 cell cultures). C) The
bar graph shows the different levels of Firefly Luciferase signal for each exon, normalized for the Renilla
Luciferase signal (RLU=relative light units). D) Western blot analysis with an antibody anti-Luciferase (~68KDa)
on protein extracts from SH-SY5Y neuroblastoma cells shows differential protein expression of the different
constructs comparable to that observed with the luciferase assay, while a similar amount of tubulin (~57KDa,
bottom line) is detected for each sample.
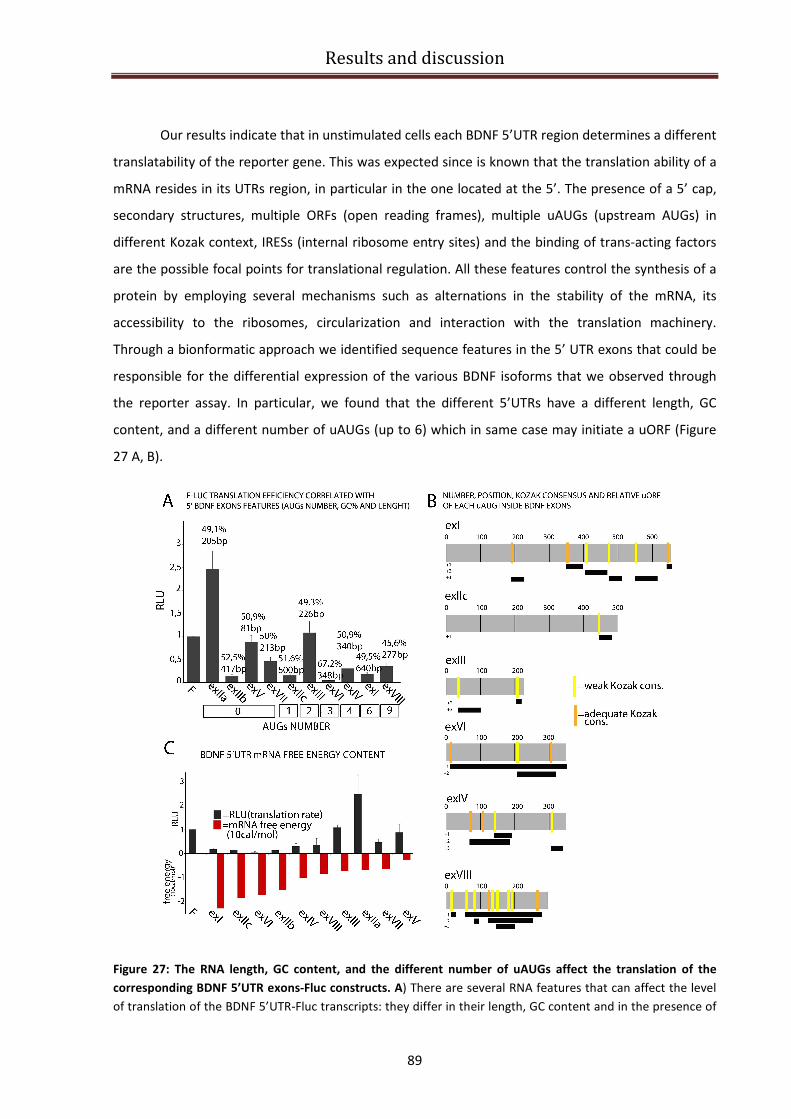
Results and discussion
89
Our results indicate that in unstimulated cells each BDNF 5’UTR region determines a different
translatability of the reporter gene. This was expected since is known that the translation ability of a
mRNA resides in its UTRs region, in particular in the one located at the 5’. The presence of a 5’ cap,
secondary structures, multiple ORFs (open reading frames), multiple uAUGs (upstream AUGs) in
different Kozak context, IRESs (internal ribosome entry sites) and the binding of trans-acting factors
are the possible focal points for translational regulation. All these features control the synthesis of a
protein by employing several mechanisms such as alternations in the stability of the mRNA, its
accessibility to the ribosomes, circularization and interaction with the translation machinery.
Through a bionformatic approach we identified sequence features in the 5’ UTR exons that could be
responsible for the differential expression of the various BDNF isoforms that we observed through
the reporter assay. In particular, we found that the different 5’UTRs have a different length, GC
content, and a different number of uAUGs (up to 6) which in same case may initiate a uORF (Figure
27 A, B).
Figure 27: The RNA length, GC content, and the different number of uAUGs affect the translation of the
corresponding BDNF 5’UTR exons-Fluc constructs. A) There are several RNA features that can affect the level
of translation of the BDNF 5’UTR-Fluc transcripts: they differ in their length, GC content and in the presence of
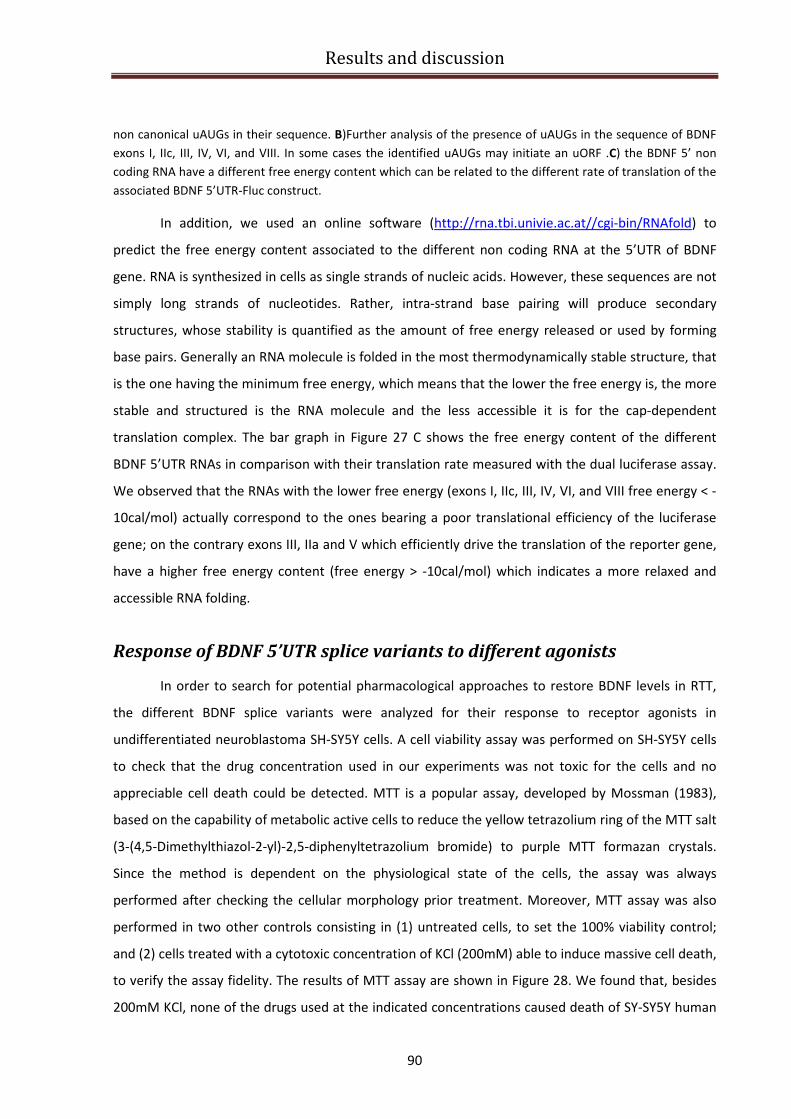
Results and discussion
90
non canonical uAUGs in their sequence. B)Further analysis of the presence of uAUGs in the sequence of BDNF
exons I, IIc, III, IV, VI, and VIII. In some cases the identified uAUGs may initiate an uORF .C) the BDNF 5’ non
coding RNA have a different free energy content which can be related to the different rate of translation of the
associated BDNF 5’UTR-Fluc construct.
In addition, we used an online software (http://rna.tbi.univie.ac.at//cgi-bin/RNAfold) to
predict the free energy content associated to the different non coding RNA at the 5’UTR of BDNF
gene. RNA is synthesized in cells as single strands of nucleic acids. However, these sequences are not
simply long strands of nucleotides. Rather, intra-strand base pairing will produce secondary
structures, whose stability is quantified as the amount of free energy released or used by forming
base pairs. Generally an RNA molecule is folded in the most thermodynamically stable structure, that
is the one having the minimum free energy, which means that the lower the free energy is, the more
stable and structured is the RNA molecule and the less accessible it is for the cap-dependent
translation complex. The bar graph in Figure 27 C shows the free energy content of the different
BDNF 5’UTR RNAs in comparison with their translation rate measured with the dual luciferase assay.
We observed that the RNAs with the lower free energy (exons I, IIc, III, IV, VI, and VIII free energy < -
10cal/mol) actually correspond to the ones bearing a poor translational efficiency of the luciferase
gene; on the contrary exons III, IIa and V which efficiently drive the translation of the reporter gene,
have a higher free energy content (free energy > -10cal/mol) which indicates a more relaxed and
accessible RNA folding.
Response of BDNF 5’UTR splice variants to different agonists
In order to search for potential pharmacological approaches to restore BDNF levels in RTT,
the different BDNF splice variants were analyzed for their response to receptor agonists in
undifferentiated neuroblastoma SH-SY5Y cells. A cell viability assay was performed on SH-SY5Y cells
to check that the drug concentration used in our experiments was not toxic for the cells and no
appreciable cell death could be detected. MTT is a popular assay, developed by Mossman (1983),
based on the capability of metabolic active cells to reduce the yellow tetrazolium ring of the MTT salt
(3-(4,5-Dimethylthiazol-2-yl)-2,5-diphenyltetrazolium bromide) to purple MTT formazan crystals.
Since the method is dependent on the physiological state of the cells, the assay was always
performed after checking the cellular morphology prior treatment. Moreover, MTT assay was also
performed in two other controls consisting in (1) untreated cells, to set the 100% viability control;
and (2) cells treated with a cytotoxic concentration of KCl (200mM) able to induce massive cell death,
to verify the assay fidelity. The results of MTT assay are shown in Figure 28. We found that, besides
200mM KCl, none of the drugs used at the indicated concentrations caused death of SY-SY5Y human
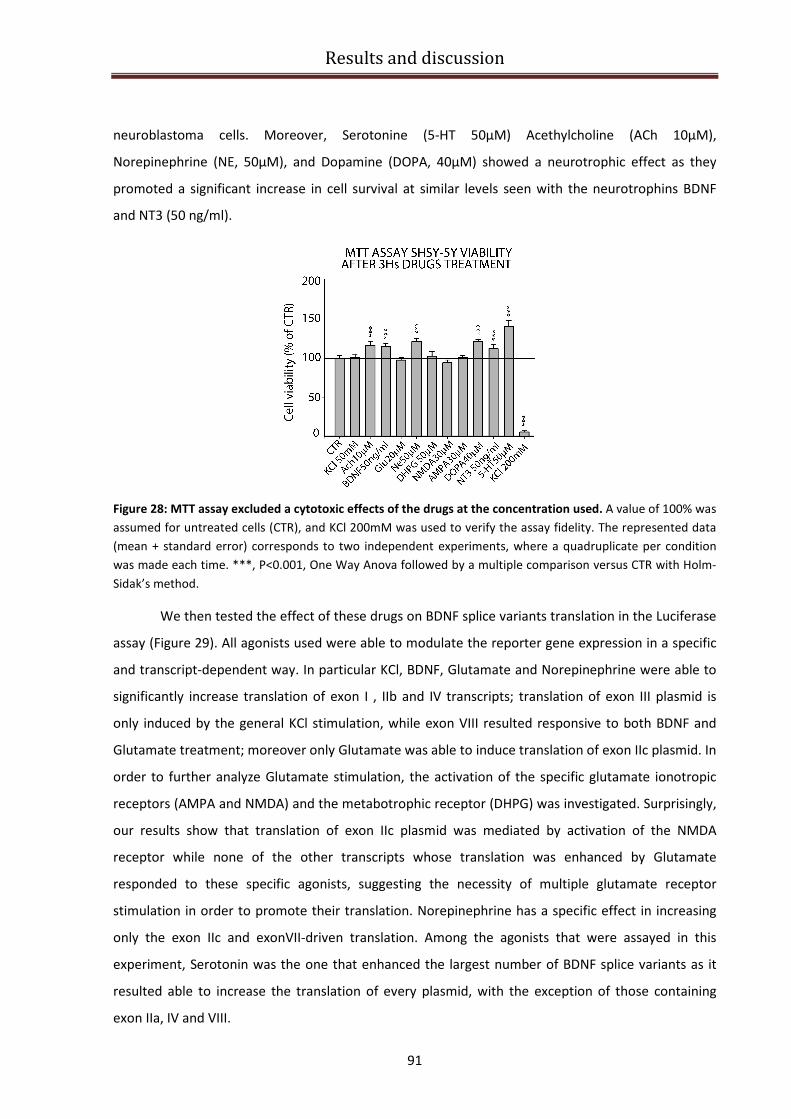
Results and discussion
91
neuroblastoma cells. Moreover, Serotonine (5-HT 50µM) Acethylcholine (ACh 10µM),
Norepinephrine (NE, 50µM), and Dopamine (DOPA, 40µM) showed a neurotrophic effect as they
promoted a significant increase in cell survival at similar levels seen with the neurotrophins BDNF
and NT3 (50 ng/ml).
Figure 28: MTT assay excluded a cytotoxic effects of the drugs at the concentration used. A value of 100% was
assumed for untreated cells (CTR), and KCl 200mM was used to verify the assay fidelity. The represented data
(mean + standard error) corresponds to two independent experiments, where a quadruplicate per condition
was made each time. ***, P<0.001, One Way Anova followed by a multiple comparison versus CTR with Holm-
Sidak’s method.
We then tested the effect of these drugs on BDNF splice variants translation in the Luciferase
assay (Figure 29). All agonists used were able to modulate the reporter gene expression in a specific
and transcript-dependent way. In particular KCl, BDNF, Glutamate and Norepinephrine were able to
significantly increase translation of exon I , IIb and IV transcripts; translation of exon III plasmid is
only induced by the general KCl stimulation, while exon VIII resulted responsive to both BDNF and
Glutamate treatment; moreover only Glutamate was able to induce translation of exon IIc plasmid. In
order to further analyze Glutamate stimulation, the activation of the specific glutamate ionotropic
receptors (AMPA and NMDA) and the metabotrophic receptor (DHPG) was investigated. Surprisingly,
our results show that translation of exon IIc plasmid was mediated by activation of the NMDA
receptor while none of the other transcripts whose translation was enhanced by Glutamate
responded to these specific agonists, suggesting the necessity of multiple glutamate receptor
stimulation in order to promote their translation. Norepinephrine has a specific effect in increasing
only the exon IIc and exonVII-driven translation. Among the agonists that were assayed in this
experiment, Serotonin was the one that enhanced the largest number of BDNF splice variants as it
resulted able to increase the translation of every plasmid, with the exception of those containing
exon IIa, IV and VIII.
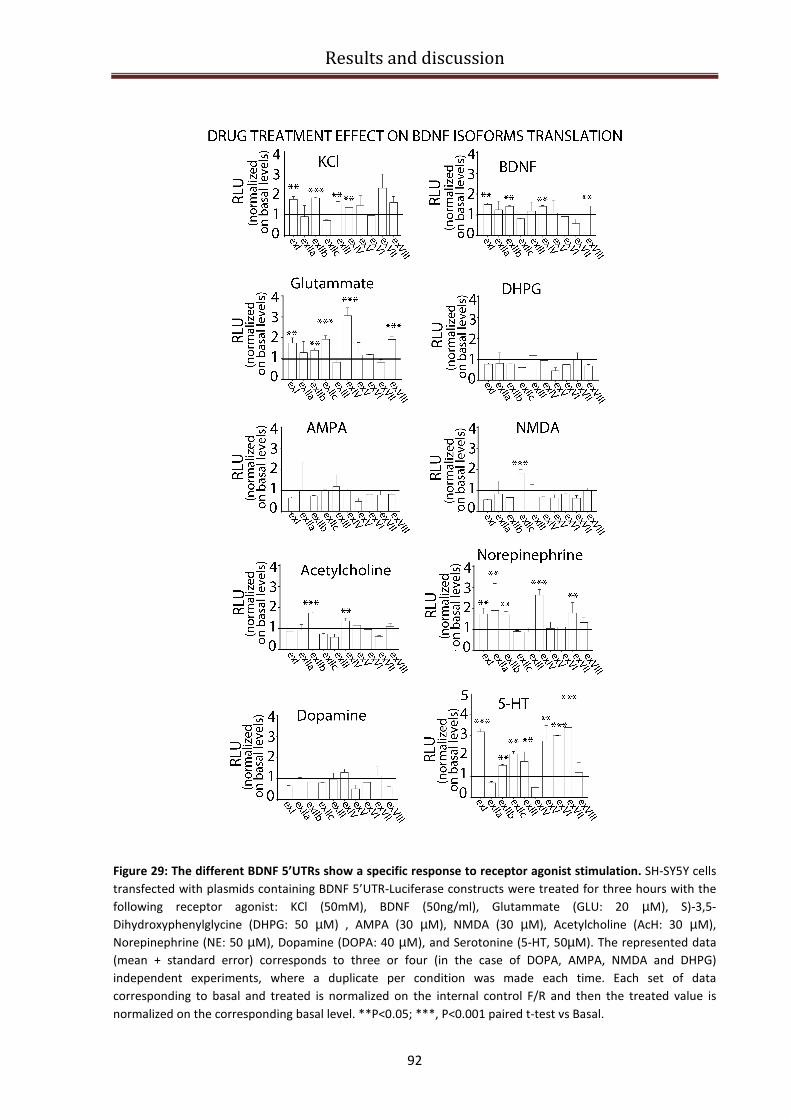
Results and discussion
92
Figure 29: The different BDNF 5’UTRs show a specific response to receptor agonist stimulation. SH-SY5Y cells
transfected with plasmids containing BDNF 5’UTR-Luciferase constructs were treated for three hours with the
following receptor agonist: KCl (50mM), BDNF (50ng/ml), Glutammate (GLU: 20 µM), S)-3,5-
Dihydroxyphenylglycine (DHPG: 50 µM) , AMPA (30 µM), NMDA (30 µM), Acetylcholine (AcH: 30 µM),
Norepinephrine (NE: 50 µM), Dopamine (DOPA: 40 µM), and Serotonine (5-HT, 50µM). The represented data
(mean + standard error) corresponds to three or four (in the case of DOPA, AMPA, NMDA and DHPG)
independent experiments, where a duplicate per condition was made each time. Each set of data
corresponding to basal and treated is normalized on the internal control F/R and then the treated value is
normalized on the corresponding basal level. **P<0.05; ***, P<0.001 paired t-test vs Basal.

Results and discussion
93
Response of BDNF CDS and 3’UTR variants to different agonists
The primary BDNF transcript can be processed at two alternative polyadenylation sites, giving
rise to two pools of BDNF mRNAs that harbor either a short or a long 3′UTR of 0.35 kb and 2.85 kb in
length, respectively (Liu et al. 2006; Liu et al. 2005). Previous studies demonstrated that the relative
abundance of the short and long 3′UTR BDNF mRNAs differ in various brain regions (An et al. 2008).
The different 3′UTRs in BDNF mRNAs presumably interact with distinct trans-acting factors, thus
offering a mechanism to increase the capacity and complexity for regulation of BDNF expression at
posttranscriptional levels, such as translation and subcellular localization. We then investigated the
intriguing question whether the long and short 3′UTRs may also differentially regulate BDNF
translation.
Basal and drug-induced translation of a luciferase reporter gene driven by BDNF short and
long 3’UTR or coding region (CDS) sequences were measured. In unstimulated SH-SY5Y cells, BDNF
CDS resulted to have no regulatory effect on translation, while the short 3’UTR promoted translation
more efficiently than the long 3’UTR (Figure 30). These data are consistent with the result of a recent
study showing that BDNF long 3′UTR is a cis-acting translation suppressor at rest, since it prevents
reporter translation in transfected cells (Lau et al., 2010).
Figure 30: Dual luciferase assay to evaluate the basal translation of BDNF CDS and 3’UTR short and long. The
bar graph shows the different levels of Firefly Luciferase signal for BDNF CDS and 3’UTR short (3’sh) and long
(3’lo) , normalized on the internal F/R value. The represented data (mean + standard error) corresponds to
three independent experiments, where a duplicate per condition was made each time.
In addition we observed that the CDS and the short and long 3’UTR displayed a different profile of
responses to drug stimulations (Figure 31). In particular, translation of the CDS transcripts is
enhanced after the general KCl stimulation and treatment with BDNF, or Glutammate. Translation of
the 3’UTR-short-containing transcript, which in basal condition appeared to be more efficiently
translated compared to CDS and 3’UTR long, was not enhanced, but rather was significantly reduced
after the treatment with all the agonists, except Glutammate, which caused a slight increase of its
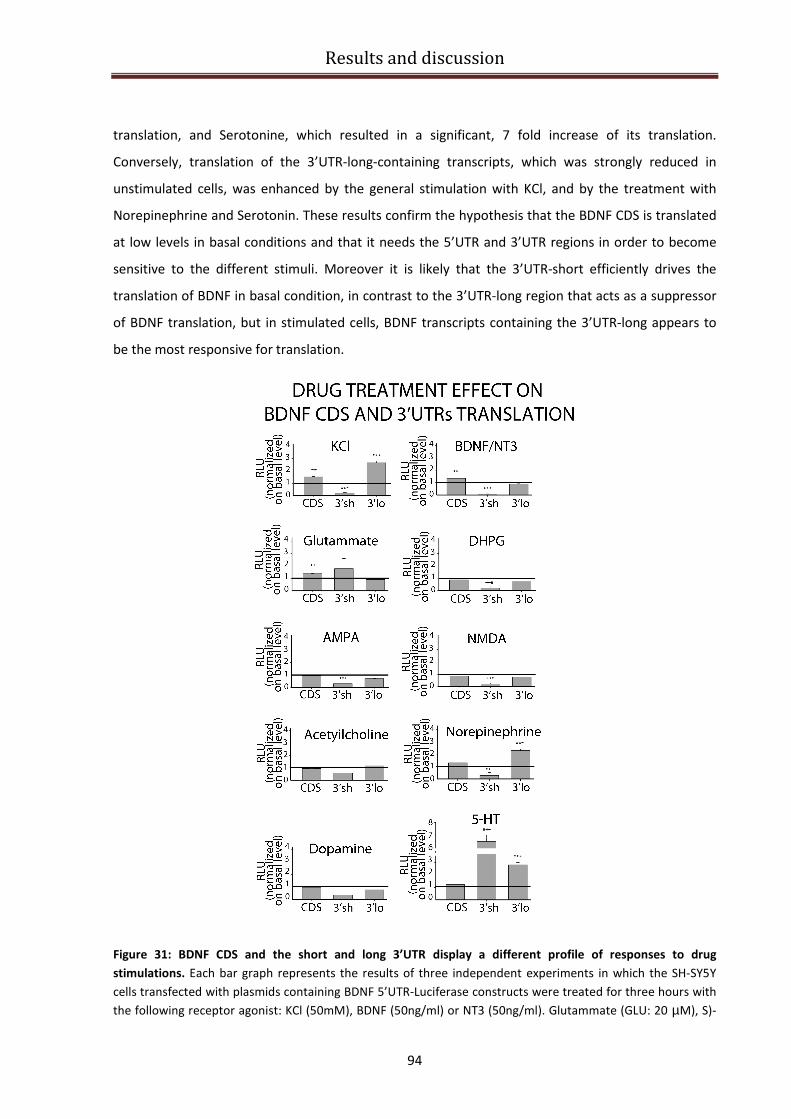
Results and discussion
94
translation, and Serotonine, which resulted in a significant, 7 fold increase of its translation.
Conversely, translation of the 3’UTR-long-containing transcripts, which was strongly reduced in
unstimulated cells, was enhanced by the general stimulation with KCl, and by the treatment with
Norepinephrine and Serotonin. These results confirm the hypothesis that the BDNF CDS is translated
at low levels in basal conditions and that it needs the 5’UTR and 3’UTR regions in order to become
sensitive to the different stimuli. Moreover it is likely that the 3’UTR-short efficiently drives the
translation of BDNF in basal condition, in contrast to the 3’UTR-long region that acts as a suppressor
of BDNF translation, but in stimulated cells, BDNF transcripts containing the 3’UTR-long appears to
be the most responsive for translation.
Figure 31: BDNF CDS and the short and long 3’UTR display a different profile of responses to drug
stimulations. Each bar graph represents the results of three independent experiments in which the SH-SY5Y
cells transfected with plasmids containing BDNF 5’UTR-Luciferase constructs were treated for three hours with
the following receptor agonist: KCl (50mM), BDNF (50ng/ml) or NT3 (50ng/ml). Glutammate (GLU: 20 µM), S)-

Results and discussion
95
3,5-Dihydroxyphenylglycine (DHPG: 50 µM) , AMPA (30 µM), NMDA (30 µM), Acetylcholine (AcH: 30 µM),
Norepinephrine (NE: 50 µM), Dopamine (DOPA: 40 µM), and Serotonine (5-HT, 50µM). Cells transfected with
Fluc-3’UTR short were treated with NT3, since previous experiment showed that this construct was sensitive to
NT3 and not to BDNF stimulation. Each set of data corresponding to basal and treated is normalized on the
internal control F/R and then the treated value is normalized on the corresponding basal level. **P<0.05; ***,
P<0.001 paired t-test vs Basal.
Regulation of the signaling cascade for BDNF protein production
After the identification of the possible agonists that are able to increase BDNF translation of
the different BDNF transcripts, we sought to identify the signaling cascades involved in BDNF protein
production. Translation of a protein is known to be controlled by multiple activity-dependent and
tissue-specific mechanisms. In addition, the translation rate is dictated by elements within the mRNA
sequence especially at the 5’UTR and 3’UTR, which can be regulated by several RNA-binding proteins
and non-coding RNAs. All these are downstream targets of a vast cadre of signaling pathways, several
of which can be selectively inhibited by specific drugs. Figure 32 reports some of these pathways and
the specific inhibitors that we used to study how translation of BDNF transcripts is controlled.
Figure 32: Pharmacological strategy to block putative signaling cascades involved in BDNF translation.
Inhibitors of 5’UTR-dependent translational regulation - rapamycin (rap), mTOR inhibitor (Beretta et al., 1996;
Takei et al., 2001, 2004; Tang et al., 2002); U0126, MEK inhibitor (Cavanaugh et al., 2001; Kanhema et al.,
2006); GF, PKC inhibitor (Heikkilä et al., 1993). Inhibitors of 3’UTR-dependent translational regulation - KN62,
CaMKII inhibitor (Hidaka & Yokura, 1996); Aurora A inhibitor (Soncini et al., 2006) and PP2, Src tyrosine kinase
inhibitor (Perkinton et al., 1999). Figure adapted by Gabriele Baj from Bramham & Wells (2007).
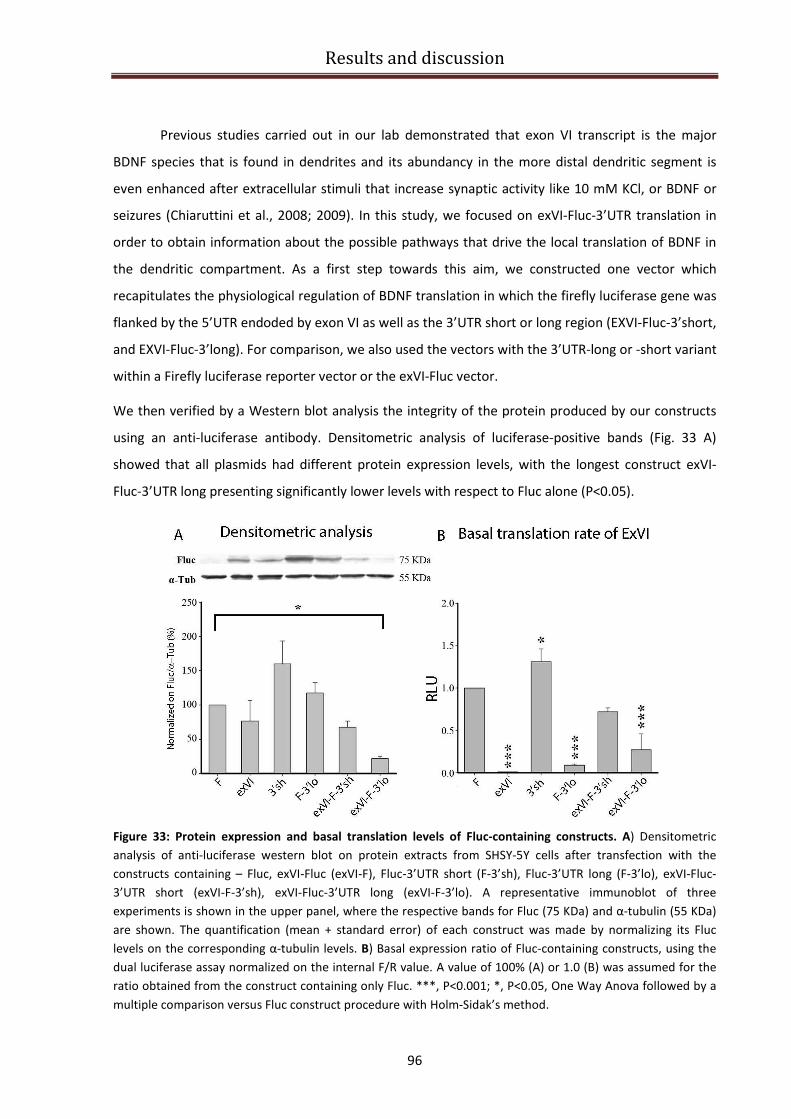
Results and discussion
96
Previous studies carried out in our lab demonstrated that exon VI transcript is the major
BDNF species that is found in dendrites and its abundancy in the more distal dendritic segment is
even enhanced after extracellular stimuli that increase synaptic activity like 10 mM KCl, or BDNF or
seizures (Chiaruttini et al., 2008; 2009). In this study, we focused on exVI-Fluc-3’UTR translation in
order to obtain information about the possible pathways that drive the local translation of BDNF in
the dendritic compartment. As a first step towards this aim, we constructed one vector which
recapitulates the physiological regulation of BDNF translation in which the firefly luciferase gene was
flanked by the 5’UTR endoded by exon VI as well as the 3’UTR short or long region (EXVI-Fluc-3’short,
and EXVI-Fluc-3’long). For comparison, we also used the vectors with the 3’UTR-long or -short variant
within a Firefly luciferase reporter vector or the exVI-Fluc vector.
We then verified by a Western blot analysis the integrity of the protein produced by our constructs
using an anti-luciferase antibody. Densitometric analysis of luciferase-positive bands (Fig. 33 A)
showed that all plasmids had different protein expression levels, with the longest construct exVI-
Fluc-3’UTR long presenting significantly lower levels with respect to Fluc alone (P<0.05).
Figure 33: Protein expression and basal translation levels of Fluc-containing constructs. A) Densitometric
analysis of anti-luciferase western blot on protein extracts from SHSY-5Y cells after transfection with the
constructs containing – Fluc, exVI-Fluc (exVI-F), Fluc-3’UTR short (F-3’sh), Fluc-3’UTR long (F-3’lo), exVI-Fluc-
3’UTR short (exVI-F-3’sh), exVI-Fluc-3’UTR long (exVI-F-3’lo). A representative immunoblot of three
experiments is shown in the upper panel, where the respective bands for Fluc (75 KDa) and α-tubulin (55 KDa)
are shown. The quantification (mean + standard error) of each construct was made by normalizing its Fluc
levels on the corresponding α-tubulin levels. B) Basal expression ratio of Fluc-containing constructs, using the
dual luciferase assay normalized on the internal F/R value. A value of 100% (A) or 1.0 (B) was assumed for the
ratio obtained from the construct containing only Fluc. ***, P<0.001; *, P<0.05, One Way Anova followed by a
multiple comparison versus Fluc construct procedure with Holm-Sidak’s method.

Results and discussion
97
When the same constructs were analyzed using the luciferase assay (Fig. 33 B), the
differences in the basal translation levels were even more accentuated with the constructs
containing the 3’UTR short having the highest translation levels (P<0.001, exVI-Fluc, Fluc-3’UTR long,
exVI-Fluc-3’UTR long; P<0.05, Fluc-3’UTR short), with the exception of exVI-Fluc-3’UTR short which is
not significantly different from Fluc.
Finally, we evaluated the effects of the inhibitors mentioned in Figure 32 on the translation
controlled by either BDNF 5’UTR (exVI) and 3’UTR (short or long) sequences alone or when both are
brought together. Cells were left untreated (basal), stimulated for 3h with 20mM KCl, or pre-treated
with the inhibitors 30min before inducing KCl depolarization. Before performing the luciferase
experiment we used an MTT assay to exclude a possible cell toxicity effect of the inhibitors used in
our experiments and to choose the correct concentration for each inhibitor. We decided to use the
following inhibitors at the indicated concentration: rapamycin at 20nM; U0126 and its negative
control, U0124 at 50µM ; KN62 at 20µM ; GF at 50nM; Aurora A inhibitor at 10µM; and PP2 20µM.
The subsequent bioluminescent assay results are shown in Figure 34. The RLUs of Fluc/Rluc were
firstly assessed as an experimental internal control, where one can see that different treatments do
not interfere with the absolute values of such ratio (Fig.34 A). As for the exVI-Fluc construct (Fig.34
B), all treatments induced a significant difference in its translation levels (p<0.001) in the following
decrescent order: GF, rapamycin, PP2 and, in a lesser extent KCl alone, U0126, and Aurora A
inhibitor. On the other hand, Fluc-3’UTR short (Fig. 34 C), is not affected by any particular treatment;
while Fluc-3’UTR long (Fig. 34 D) is particularly sensitive to rapamycin, GF, Aurora A inhibitor, and
U0126 (p<0.001), to KCl alone (p<0.01), and apparently to KN62 (p<0.05). Conversely, exVI-Fluc-
3’UTR short (Fig.34 E) seems to be unresponsive to all treatments; whereas exVI-Fluc-3’UTR long
(Fig.34 F) acts in response to all treatments (p<0.001), particularly to KCl and GF (ca. 3-fold increase
versus basal conditions).
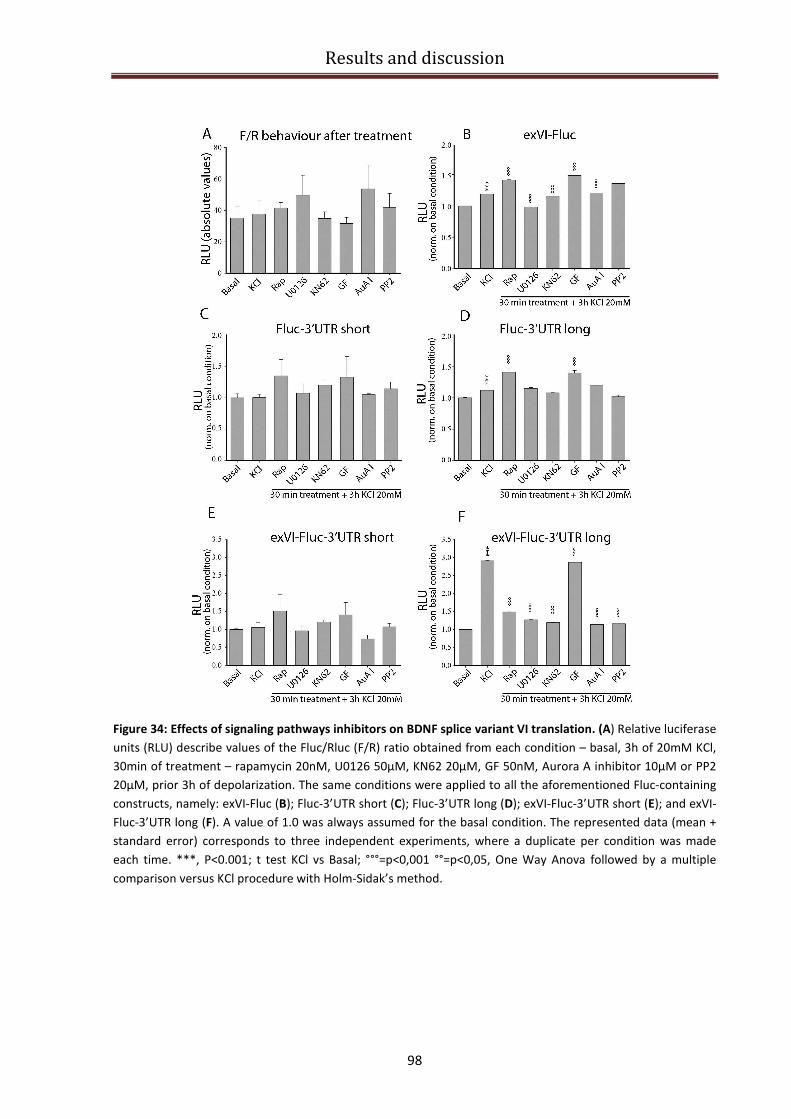
Results and discussion
98
Figure 34: Effects of signaling pathways inhibitors on BDNF splice variant VI translation. (A) Relative luciferase
units (RLU) describe values of the Fluc/Rluc (F/R) ratio obtained from each condition – basal, 3h of 20mM KCl,
30min of treatment – rapamycin 20nM, U0126 50µM, KN62 20µM, GF 50nM, Aurora A inhibitor 10µM or PP2
20µM, prior 3h of depolarization. The same conditions were applied to all the aforementioned Fluc-containing
constructs, namely: exVI-Fluc (B); Fluc-3’UTR short (C); Fluc-3’UTR long (D); exVI-Fluc-3’UTR short (E); and exVI-
Fluc-3’UTR long (F). A value of 1.0 was always assumed for the basal condition. The represented data (mean +
standard error) corresponds to three independent experiments, where a duplicate per condition was made
each time. ***, P<0.001; t test KCl vs Basal; °°°=p<0,001 °°=p<0,05, One Way Anova followed by a multiple
comparison versus KCl procedure with Holm-Sidak’s method.
Results and discussion
99
Desipramine and Mirtazapine effect on BDNF isoforms translation
The increasing knowledge of BDNF gene in rodents has encouraged researches on the
modulation of different BDNF transcripts by pharmacological treatments. Recent studies showed that
different drugs, lengths of treatment and drug/physical exercise combination, as well as stress
paradigms, may selectively influence the transcription of specific BDNF transcripts in rodents
(Castren et al. 2007; Duman and Monteggia 2006; Tardito et al. 2006). In addition, Donnici and
collaborators studied the effect of different antidepressants on BDNF mRNA expression in human
neuroblastoma SH-SY5Y cells, showing biphasic changes in the expression of total and specific BDNF
transcripts in human cells following antidepressant treatments (Donnici et al. 2008). However, no
data are available yet on the effect of antidepressants on human BDNF transcripts translation.
We used the previously described dual luciferase assay to investigate the effect of two
antidepressants (Desipramine, DMI and Mirtazapine, MRT) on translation of the transcripts
containing the BDNF 5’UTRs variants. We decided to test the effect of these two antidepressants on
specific BDNF isoforms translation since they act specifically on Norepinephrine and Serotonin, which
represent the two agonist with the strongest effect on BDNF translation, as reported in Figure 24 and
26. Desipramine is a tricyclic antidepressant (TCA) that inhibits the reuptake of norepinephrine and
to a lesser extent serotonin; Mirtazapine is a tetracyclic piperazino-azepineantidepressant (TeCA),
which has a different structure from any other currently used antidepressant. It enhances central
noradrenergic and serotonergic activity by blocking alpha2 receptors and selectively antagonizing
5HT2 and 5HT3 receptors. Thus, it is being classified as a noradrenergic and specific serotonergic
antidepressant and referred to as an NaSSA.
Firstly a MTT assay was performed in order to choose an appropriate drug concentration,
that did not result in any toxic effect for the cells. Four control conditions consisted in (1) untreated
cells, an internal control to verify the drug-dependent effect; and (2) DMSO 100% treated cells, which
represents a cytotoxic concentration able to induce massive cell death; 3) cells treated with the
vehicle used for Mirtazapine (DMSO 50% in H2O); 4) cells treated with the vehicle used for
Desipramine (H2O). The result of the MTT assay is reported in the bar graph in Figure 35 A. Of note,
both vehicles used for the dilution of Desipramine and Mirtazapine did not cause any cell death and
they did not differ from the untreated cells value. We did not observe any cytotoxic effect after 24
hours treatment with none of Desipramine concentrations used (1 µM, 10 µM, 100 µM). Concerning
Mirtazapine, we could observe that at a concentration of 1 µM promoted cell survival (p<0,001); on
the contrary when used at a concentration of 100 µM it caused a massive cell death (p<0,001).
Therefore we decided to treat the cells with an intermediate concentration of 10 µM. The results of
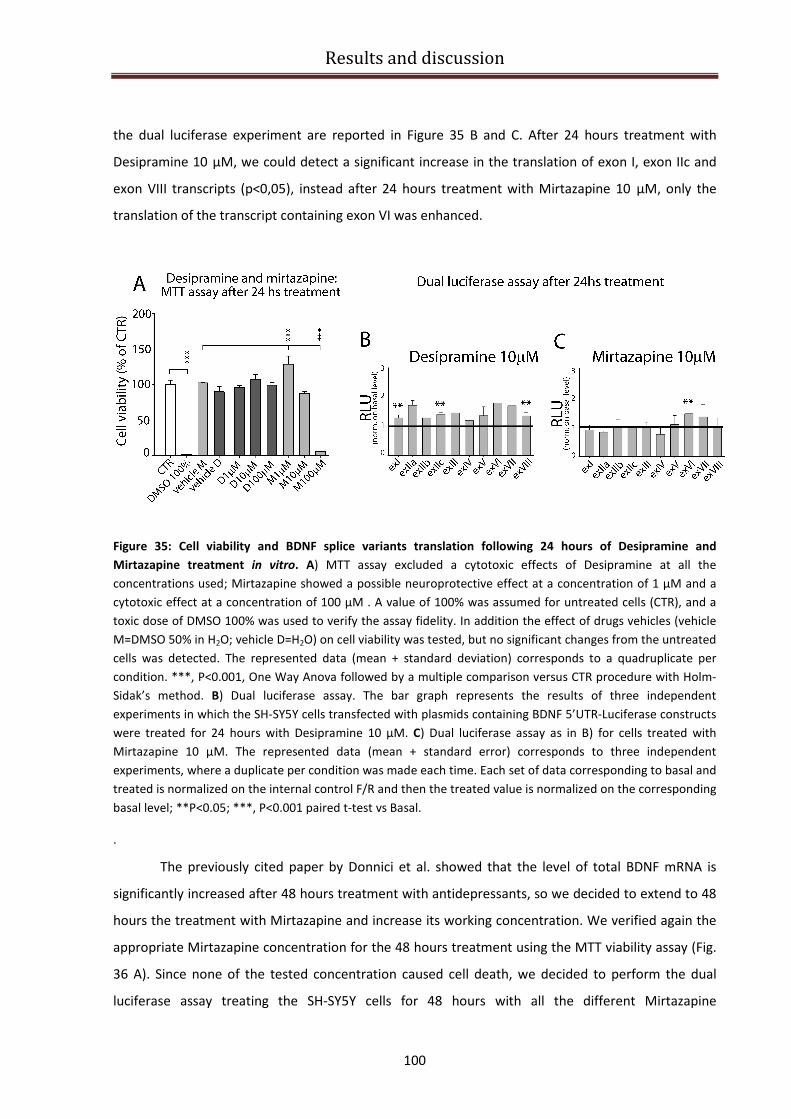
Results and discussion
100
the dual luciferase experiment are reported in Figure 35 B and C. After 24 hours treatment with
Desipramine 10 µM, we could detect a significant increase in the translation of exon I, exon IIc and
exon VIII transcripts (p<0,05), instead after 24 hours treatment with Mirtazapine 10 µM, only the
translation of the transcript containing exon VI was enhanced.
Figure 35: Cell viability and BDNF splice variants translation following 24 hours of Desipramine and
Mirtazapine treatment in vitro. A) MTT assay excluded a cytotoxic effects of Desipramine at all the
concentrations used; Mirtazapine showed a possible neuroprotective effect at a concentration of 1 µM and a
cytotoxic effect at a concentration of 100 µM . A value of 100% was assumed for untreated cells (CTR), and a
toxic dose of DMSO 100% was used to verify the assay fidelity. In addition the effect of drugs vehicles (vehicle
M=DMSO 50% in H2O; vehicle D=H2O) on cell viability was tested, but no significant changes from the untreated
cells was detected. The represented data (mean + standard deviation) corresponds to a quadruplicate per
condition. ***, P<0.001, One Way Anova followed by a multiple comparison versus CTR procedure with Holm-
Sidak’s method. B) Dual luciferase assay. The bar graph represents the results of three independent
experiments in which the SH-SY5Y cells transfected with plasmids containing BDNF 5’UTR-Luciferase constructs
were treated for 24 hours with Desipramine 10 µM. C) Dual luciferase assay as in B) for cells treated with
Mirtazapine 10 µM. The represented data (mean + standard error) corresponds to three independent
experiments, where a duplicate per condition was made each time. Each set of data corresponding to basal and
treated is normalized on the internal control F/R and then the treated value is normalized on the corresponding
basal level; **P<0.05; ***, P<0.001 paired t-test vs Basal.
.
The previously cited paper by Donnici et al. showed that the level of total BDNF mRNA is
significantly increased after 48 hours treatment with antidepressants, so we decided to extend to 48
hours the treatment with Mirtazapine and increase its working concentration. We verified again the
appropriate Mirtazapine concentration for the 48 hours treatment using the MTT viability assay (Fig.
36 A). Since none of the tested concentration caused cell death, we decided to perform the dual
luciferase assay treating the SH-SY5Y cells for 48 hours with all the different Mirtazapine
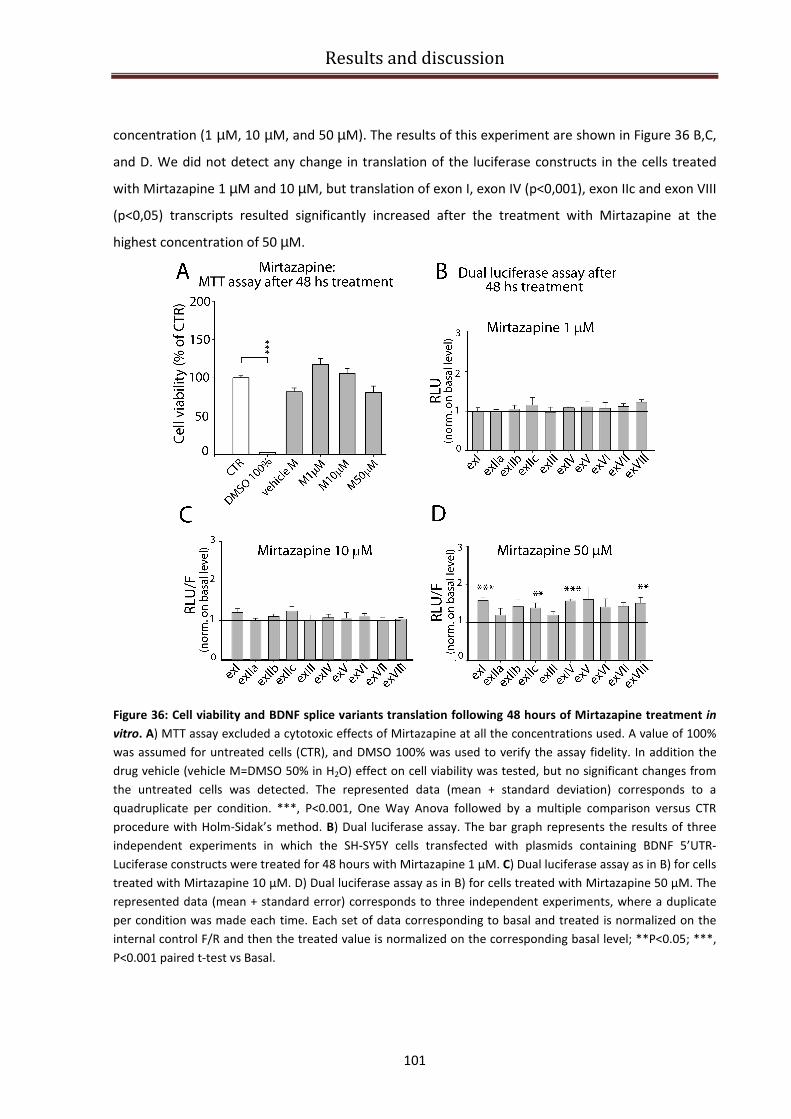
Results and discussion
101
concentration (1 µM, 10 µM, and 50 µM). The results of this experiment are shown in Figure 36 B,C,
and D. We did not detect any change in translation of the luciferase constructs in the cells treated
with Mirtazapine 1 µM and 10 µM, but translation of exon I, exon IV (p<0,001), exon IIc and exon VIII
(p<0,05) transcripts resulted significantly increased after the treatment with Mirtazapine at the
highest concentration of 50 µM.
Figure 36: Cell viability and BDNF splice variants translation following 48 hours of Mirtazapine treatment in
vitro. A) MTT assay excluded a cytotoxic effects of Mirtazapine at all the concentrations used. A value of 100%
was assumed for untreated cells (CTR), and DMSO 100% was used to verify the assay fidelity. In addition the
drug vehicle (vehicle M=DMSO 50% in H2O) effect on cell viability was tested, but no significant changes from
the untreated cells was detected. The represented data (mean + standard deviation) corresponds to a
quadruplicate per condition. ***, P<0.001, One Way Anova followed by a multiple comparison versus CTR
procedure with Holm-Sidak’s method. B) Dual luciferase assay. The bar graph represents the results of three
independent experiments in which the SH-SY5Y cells transfected with plasmids containing BDNF 5’UTR-
Luciferase constructs were treated for 48 hours with Mirtazapine 1 µM. C) Dual luciferase assay as in B) for cells
treated with Mirtazapine 10 µM. D) Dual luciferase assay as in B) for cells treated with Mirtazapine 50 µM. The
represented data (mean + standard error) corresponds to three independent experiments, where a duplicate
per condition was made each time. Each set of data corresponding to basal and treated is normalized on the
internal control F/R and then the treated value is normalized on the corresponding basal level; **P<0.05; ***,
P<0.001 paired t-test vs Basal.
Conclusions
102
Conclusions
The main findings of this study are related to three different models of the Rett syndrome.
1) In MeCP2-/Y mutant mice, we observed a reduction in the brain weight that was linked to a
reduced thickness of cortical layers and we further provide the first complete description of the
expression profile of BDNF and its specific splice variants during post-natal development showing in
p42 MeCP2-/Y mutant mice, a specific downregulation of exons I, II, III, IV, V, VI, and VIII followed by
a partial recovery at p49.
2) In human post mortem cortical samples from RTT patients with different alterations of MeCP2
gene leading to truncation or single aminoacid substitutions, we discovered a different effect on
BDNF CDS and exon IV expression ranging from decrease to upregulation depending on the type of
MeCP2 mutation.
3) We developed a cellular model for RTT through sh-RNA MeCP2 silencing in SHSY-5Y
neuroblastoma cell line, and we demonstrate that this model is a valuable tool to screen for
potentially active compounds for the restoration of BDNF protein levels, which are down regulated in
vivo in absence of MeCP2. Using this model, we provide the first complete characterization of
translatability of all BDNF splice variants both in unstimulated as well as in agonists-treated SHSY-5Y
cells. Following this screening, we assessed that 3h incubation with norepinephrine and serotonine
separately, as well as 24-48h incubation with two antidepressants with dual effects on both
serotonergic and noradrenergic transmission (Desipramine and Mirtazapine), are able to increase
effeciently BDNF protein synthesis from most transcripts, therefore resulting as a promising class of
compounds for the treatment of RTT.
In the first part of this study we examined the effects of MeCP2 deletions in a mouse model
of RTT syndrome, especially focusing on the developing somatosensory neocortex S1 (barrel cortex).
We observed a significant and progressive loss of brain weight at p35, p42 and p49 that correlates
with a reduced thickness of the somatosensory neocortex at the same post-natal ages. This reduction
in cortical thickness was particularly evident in layers II/III and V, and cellular density was increased
in the same layers. These results confirm previous findings by Fukuda and collaborators (Fukuda et al.
2005) and Kishi and Macklis (2004) who showed that the cortical thickness of somatosensory and
motor cortices in mutant mice is decreased as compared to wild-type male mice. Moreover, they also
reported that the density of neurons in those areas are significantly higher in layers II/III and V of
Mecp2(-/y) mice than in wild-type mice, particularly in layers II/III at 4 weeks (p28) of age. In
addition, Kishi and Macklis, showed that layer II/III pyramidal neurons in MECP2 /y mice have smaller
Conclusions
103
somas and less complex dendrites than those in wild-type mice, and Fukuda and colleagues
demonstrated that in layer II/III of the somatosensory cortex of Mecp2(-/y) mice, the diameter of the
apical dendrite was smaller and the number of dendritic spines was reduced. MRI studies on patients
with autism and Rett syndrome have reported the presence of cerebral atrophy (Casanova et al.
1991; Gotoh et al. 2001)and analysis of human postmortem tissue from patients with RTT indicated
that the observed atrophy was not caused by cell loss but rather by the presence of neurons with less
complex dendritic arborization and smaller neuronal size (Armstrong et al., 1995; (Bauman et al.
1995a; Bauman et al. 1995b). Given the association between defects in cortical structures and
behavioral and cognitive effects of MECP2 mutations in RTT mice, it has been hypothesized that
MeCP2 might have an involvement in the control of cerebral development, and particularly of
neocortical development. Our study using MeCP2 mutant mice, strengthens the notion that MECP2
mutation causes cortical dysmorphogenesis and that this morphological alteration precedes the
clinical phenotype.
Formation of dendritic arborization is an important maturation process during the formation
of neuronal circuitry. It has been hypothesized that there is a connection between the observed
reduction in dendritic complexity in MeCP2 null mice and BDNF which represents a target gene for
MECP2 and, at the same time, an important regulator of neuronal development and maturation
(Chen et al., 2003; Martinowich et al., 2003). In agreement with this hypothesis, our data show that
the expression of total BDNF in MeCP2 null mice at p35, p42 and p49 is dysregulated, in particular at
p42 there is a significant reduction of total BDNF expression and most BDNF splice variants.
Surprisingly, although exon I and II transcripts remain significantly downregulated, we found that the
expression levels of total BDNF is recovered at p49 even if there is a worsening of the disease
symptoms in mice. The presence of a compensatory mechanism related to the activation of one of
the four different Methyl-binding proteins (Hendrich and Bird 1998) might be one possible
explanation of this apparently paradoxical result. Another paradoxical result that has been discussed
several times in the literature is the fact that despite some BDNF transcripts are upregulated, MeCP2
deletion leads to a genereal decrease (down to 70% less) of BDNF mRNA and protein (Chang et al.,
2006) although with some regional specificity among different brain areas (Wang et al., 2006).
Indeed, chromatin immunoprecipitation experiments have identified one promoter region within the
BDNF gene as a target of MeCP2 transcriptional control (Chen et al., 2003; Martinowich et al., 2003).
These studies further demonstrated that MeCP2 binds to and maintains repression of mouse BDNF
promoter IV in resting neuronal cultures (Chen et al., 2003). Following neuronal activity and the
ensuing voltage-gated Ca2+
influx, MeCP2 becomes phosphorylated and dissociates from BDNF
Conclusions
104
promoter IV allowing for full transcription of the gene (Tao et al., 1998; Chen et al., 2003). Similarly,
in absence of MeCP2, transcription of this promoter in cultured neurons is enhanced resulting in a
two-fold increase of BDNF transcript IV levels under resting conditions (Chen et al., 2003). However,
in our study in vivo, we did not found any increase in BDNF transcript IV expression at any
developmental stage. Instead, this transcripts remains slightly below the levels observed in wt
control mice. A possible interpretation that is also in agreement with other studies, is that although
the basal level of some BDNF transcripts might be upregulated in absence of MeCP2 (Chen et al.,
2003; Larimore et al., 2009), since neuronal activity in MeCP2 knock-out mice in vivo is dramatically
reduced (Dani et al., 2005), some of the activity-dependent promoters of BDNF gene may not be
sufficiently stimulated and therefore these transcripts result downregulated. In our study, we
provide the first comprehensive analysis of all BDNF transcripts in the cortex and hippocampus
during the progression of the pathology and we shown a dynamic profile characteristic for each
variant with some dramatic differences with respect to the wild type littermates. This dysregulated
BDNF expression in MECP2 mutant mice might account for the cortical dysgenesis that partially
remebers the phenotype observed in BDNF conditional null mice.
The few available studies on BDNF levels in RTT patients have not yielded results consistent
with the “BDNF hypothesis of Rett”, at least at a first approximation. When we analyzed if the
dysregulation of BDNF expression is detectable in RTT patients cerebral cortex, we made the
important finding that the expression levels of total BDNF as well as exon IV transcript (Pruunsild et
al., 2007) depends on the type of MeCP2 mutation. In a patient carrying a base pair transversion at
splice acceptor site which substituted a guanine for an alanine (IVS3-2A>G), and presenting
generalized brain atrophy and multifocal maldevelopment, the expression of total BDNF and of the
transcript containing exon IV was significantly reduced. In contrast, we detected a marked increase in
total BDNF content as well as BDNF exon IV in the cortex of a patient with a missense G415T
mutation in exon 4 of the MeCP2 gene and there was no change with respect to normal in a RTT
patient whose genetics was not available. These results do not reflect differences in the brain tissues
analyzed because our study was carried out in human post mortem brain tissues that were from the
same brain area, corresponding to the dorsomedial cerebral cortex at the junction of the frontal and
parietal cortices (Brodmann’s areas 1–5). The majority of cortical regions in RTT cerebral cortex show
comparable neuropathology (Belichenko et al., 1997; Kaufmann et al., 1998), with similar
neuropathological features which include reductions in cortical thickness, decreased neuronal soma
size, reduced number of identifiable synapses, and dramatically decreased dendritic arborization
with increased neuronal cell packing density, but without a gross reduction in neuronal cell numbers
Conclusions
105
(Bauman et al. 1995a; Bauman et al. 1995b; Belichenko et al. 1997; Belichenko et al. 1994; Jellinger
et al. 1988); Kaufmann et al., 1997). The histological analysis that we carried out, demonstrates a
similar state of tissue preservation and no cell damage or any appreciable differences in cell density
between the different patients. In addition, and most importantly, we found comparable levels of
total BDNF mRNA in the four healthy donors analyzed. Hence, the differences in BDNF expression are
most likely due to a different effect of the different mutations or to individual differences. Our
results are agreement with a previous study which showed that transfection of cortical neurons with
human MeCP2 bearing different mutations or with sh-MeCP2 lead to very different levels of BDNF
protein, that was upregulated with upregulation of knock-down of MecP2 and was not changed
when neurons where transfected with the MeCP2 R106W or T158M mutation (Larimore et al. 2009).
Due to the finding that different MeCP2 mutations can give very different profiles of BDNF
expression, it would be of great interest to extend these preliminary results by measuring the
expression levels of all the other human BDNF splice variants and in a larger number of patients. This
will allow to gain a wider overview of the MeCP2 mediated BDNF regulation, and obtain an indication
of which residual isoforms of BDNF are still present in RTT affected brains. The latter information is of
particular interest with respect to the working hypothesis of this project which aims at identifying
drug treatments able to increase BNDF translation starting from the residual transcripts rather than
attempting to rescue transcription.
In order to find a simple experimental setting to screen for drugs that can enhance BDNF
translation, we decided to build an in vitro model of RTT by silencing MeCP2 expression in a human
neuroblastoma cell line (SHSY-5Y) via RNA interference. The human SHSY-5Y cell line has been
extensively used to study several neurological diseases, such as Alzheimer’s disease (Greco et al.
2008) and Parkinson disease(Lopes et al. 2010). There are at least two compelling reasons for the
choice of the neuroblastoma SH-SY5Y cell line for our study: first of all, these cells express BDNF and
TrkB receptor, secondly the BDNF transcripts expression pattern is very similar to that of human
cortical tissue (Garzon et al., 2002). We successfully knocked down MeCP2 expression using a specific
lentiviral sh-RNA against MeCP2 and then we analyzed the expression profile of BDNF in MeCP2
silenced cells compared to control conditions (scramble transfected cells). Indeed, in agreement with
what we observed in MeCP2 null mice, we found that the expression level of total BDNF and its
specific isoforms is deregulated when MeCP2 expression is disrupted. Total BDNF mRNA was
downregulated by 42% in MeCP2 knocked-down cells, while the expression of BDNF transcripts III
and VI are significantly upregulated. Considering that in human RTT brain sample we observed that
patients with different types of MeCP2 mutation show different profiles of BDNF expression, we
Conclusions
106
believe that the cellular model of RTT should be further improved on the basis of the mutations
occurring in patients. In a recent paper appeared in November 2010, the authors described the
development of a culture system using induced pluripotent stem cells (iPSCs) from RTT patients'
fibroblasts (Marchetto et al. 2011). Briefly, the investigators used retroviral vectors — Sox2, Oc4,
cMyc and Klf4 — to program the fibroblasts from four female Rett syndrome patients with different
MeCP2 mutations and five healthy volunteers to become embryonic stem cells or iPSCs. Then, they
programmed the iPSCs to become mature functional neurons, and confirmed that they were
functional neurons using several techniques, including electrophysiology. Moreover, the phenotypic
validation was done comparing mouse MeCP2 knockout and Rett postmortem brain tissue
(Marchetto et al., 2010). Nevertheless, from comparison of transgenic mice bearing a truncated form
of MeCP2 protein caused by a stop mutation similar to that found in RTT patients (MeCP2308/Y
;
Shahbazian et al., 2002) with MeCP2 knock-out mice it appears that conditions of complete MeCP2
inactivation like those in the latter type of mice, lead to a more severe phenotype (Guy et al., 2001;
Chen et al., 2001). Thus, our cellular model in human SHSY-5Y in which we induced a chronic
silencing of MeCP2, may represent a valuable tool for high-throughput-screening for candidate
compounds to enter the preclinical phase of drug efficacy assessment in MeCP2 null mice, which lack
MeCP2 similarly to the knocked down cells.
Using the same cell line, we carried out a systematic analysis of BDNF translatability both in
unstimulated condition or after treatment with specific receptor agonists or more complex
compounds. Considered the huge number of fundamental neuronal processes in which BDNF is
involved, it can be expected that its expression is a finely regulated process that relies on a
combination of cis and trans acting factor. Using a reporter gene assay based on luminescence we
found that in unstimulated cells, each BDNF 5’UTR region determines a different translatability of the
reporter gene. This was expected since is known that the translation ability of one mRNA resides in
its UTRs regions, in particular in the one located at the 5’. Through a bioinformatic approach we
identified several features in the 5’UTR exons that could be responsible for the differential
expression of the various BDNF isoforms that we observed through the reporter assay. In particular,
we found that the different 5’UTRs have a different GC content and a different number of upstream
ATGs, which in same case may initiate a uORF. In order to confirm the presence of specific regulatory
uORF sequences, it would be interesting to evaluate the effect on BDNF translatability of deletions or
single nucleotide mutations in these 5’UTR sequences and to further investigate the presence of
other putative regulatory sequences like for instance, IRES sequences inside the BDNF 5’exons.
Conclusions
107
To determine which drug can enhance BDNF protein levels, we carried out a systematic
pharmacological analysis of the translation of each BDNF transcript. We found that serotonin and
norepinephrine, are the two most effective stimuli for BDNF synthesis and we observed that not only
the 5’UTR sequences but also the 3’UTR regions are sensitive to the treatment with these agonists.
Using the same luminescent assay, we investigated the possible pathways that drive the local
translation of BDNF in the dendritic compartment. As a first step towards this aim, we constructed
specific vectors that recapitulate the physiological regulation of BDNF translation, containing BDNF
exon VI (exon VI transcript is the major BDNF species that is found in dendrites) in combination with
the 3’UTR short or long version, and we studied the effect of several protein synthesis inhibitors on
this reporter gene translation. We found that the 3’UTR long is a key player in the translational
regulation of BDNF since, differently from the 3’UTR short, it confers to the BDNF exon VI the ability
to become more sensitive to stimulatory KCl depolarizing stimulus. In addition, we observed that the
protein synthesis inhibitors involved in 3’UTR regulation - KN62, Aurora A inhibitor (both affecting
CPEB), and PP2 (involved in ZBP1 modulation), appear to be the most effective in inhibiting the
translation of the reporter gene flanked by exon VI region and 3’UTR long, which instead is
unaffected by the inhibition of the PLC pathways. A recent paper (Ricciardi et al. 2011)
demonstrated that reduced AKT/mTOR signaling and protein synthesis dysregulation is present in
MeCP2 null mice. Since our experiments showed that the translation of at least one BDNF transcripts
(exon VI-BDNF-3’UTR long) could be dependent on mTOR pathway, it is conceivable that impaired
translation through this signaling pathway may explain, at least in part, the finding that BDNF protein
is dowregulated by 70% in MeCP2 mutant mice (Wang et al., 2006). It would be interesting to
investigate if the translation of the other BDNF transcripts is regulated by the same pathway. This
should be helpful for the choice of a candidate drug able to increase the translation of a specific
BDNF transcripts, whose translation is not controlled by AKT/mTOR pathway, which is negatively
affected by MeCP2 mutations.
Our results demonstrated that in RTT animal models there are residual BDNF mRNA levels
and on this basis, we considered that several compounds, including antidepressants, are able to
increase BDNF levels (Coppell et al. 2003; Dias et al. 2003; Fujimaki et al. 2000; Molteni et al. 2006;
Nibuya et al. 1995; Nibuya et al. 1996). As we showed that serotonin and norepinephrine are most
effective in enhancing BDNF transcripts translation, we hypothesized that antidepressants with a
dual effectin enhancing both serotonin and norepinephin, such as Desipramine and Mirtazapine,
would be the best candidate drug to treat RTT. We demonstrate that Desipramine, a tricyclic
antidepressant that inhibits the reuptake of norepinephrine and to a lesser extent serotonin, is able
Conclusions
108
to exert a generalized increase of BDNF translation from transcripts I, IIc and VIII. This could be
functionally related to the improvement in breathing and survival that has been described in MeCP2
null mice treated with this drug (Zanella et al., 2008; Roux et al., 2007). Similarly, Mirtazapine, in our
cellular luciferase assay was able to increase translation of BDNF transcripts I, IIc, IV, and VIII.
Mirtazapine is a tetracyclic antidepressant (TeCA) that enhances central noradrenergic and
serotonergic activity by blocking alpha2 receptors and selectively antagonizing 5HT2 and 5HT3
receptors. Thus, it is being classified as a noradrenergic and specific serotonergic antidepressant and
referred to as NaSSA. Moreover, the efficacy and tolerability of mirtazapine in the treatment of
associated symptoms of autism and other pervasive developmental disorders (PDDs) has yet been
investigated in a paper by Posey published in 2004 (Posey et al. 2001). Twenty-six subjects (5
females, 21 males; ages 3.8 to 23.5 years; mean age 10.1 ± 4.8 years) with PDDs (20 with autistic
disorder, 1 with Asperger's syndrome, 1 with Rett's syndrome, and 4 with PDDs not otherwise
specified) were treated with mirtazapine (dose range, 7.5-45 mg daily; mean 30.3 ± 12.6 mg daily).
Twenty had co-morbid mental retardation, and 17 were taking concomitant psychotropic
medications. At the endpoint, subjects' primary caregivers were interviewed using the Clinical Global
Impressions (CGI) scale, the Aberrant Behavior Checklist, and a side-effect checklist. The results were
the following: twenty-five of 26 subjects completed at least 4 weeks of treatment (mean 150 ± 103
days). Nine of 26 subjects (34.6%) were judged responders ("much improved" or "very much
improved" on the CGI) based on improvement in a variety of symptoms including aggression, self-
injury, irritability, hyperactivity, anxiety, depression, and insomnia. Mirtazapine did not improve core
symptoms of social or communication impairment. Adverse effects were minimal and included
increased appetite, irritability, and transient sedation. We have already started the treatment of
MeCP2 null mice with Mirtazapina (they are treated orally with a dose of 10mg/Kg Mirtazapina daily
for 14 days, starting from an age of p28) and we intend to investigate if Mirtazapina is able to recover
the expression of total BDNF mRNA as well as its specific transcripts, which are particularly affected
in p42 MeCP2 null mice. In addition, we will analyze the effect of the drug treatment on the recovery
of a normal cerebral cortex thickness. Since serotonin-enhancing drugs, including L-tryptophan,
fluoxetine and paroxetine, have been tested as pharmacologic treatments for sleep apnea syndrome
(SAS) and Mirtazapine has been shown to improve sleep-disordered breathing in rats (Carley et al.
2007; Carley and Radulovacki 1999), we planned to investigate the effects of Mirtazapine treatment
on the abnormal breathing phenotype observed in MeCP2 null mice.
Bibliography
109
Bibliography
Abuhatzira L, Makedonski K, Kaufman Y, Razin A, Shemer R. 2007. MeCP2 deficiency in the brain
decreases BDNF levels by REST/CoREST-mediated repression and increases TRKB production.
Epigenetics 2(4):214-22.
Adams VH, McBryant SJ, Wade PA, Woodcock CL, Hansen JC. 2007. Intrinsic disorder and
autonomous domain function in the multifunctional nuclear protein, MeCP2. J Biol Chem
282(20):15057-64.
Aid T, Kazantseva A, Piirsoo M, Palm K, Timmusk T. 2007. Mouse and rat BDNF gene structure and
expression revisited. J Neurosci Res 85(3):525-35.
Akbarian S, Chen RZ, Gribnau J, Rasmussen TP, Fong H, Jaenisch R, Jones EG. 2001. Expression
pattern of the Rett syndrome gene MeCP2 in primate prefrontal cortex. Neurobiol Dis
8(5):784-91.
Amir RE, Van den Veyver IB, Wan M, Tran CQ, Francke U, Zoghbi HY. 1999. Rett syndrome is caused
by mutations in X-linked MECP2, encoding methyl-CpG-binding protein 2. Nat Genet
23(2):185-8.
An JJ, Gharami K, Liao GY, Woo NH, Lau AG, Vanevski F, Torre ER, Jones KR, Feng Y, Lu B and others.
2008. Distinct role of long 3' UTR BDNF mRNA in spine morphology and synaptic plasticity in
hippocampal neurons. Cell 134(1):175-87.
Archer HL, Evans J, Edwards S, Colley J, Newbury-Ecob R, O'Callaghan F, Huyton M, O'Regan M,
Tolmie J, Sampson J and others. 2006a. CDKL5 mutations cause infantile spasms, early onset
seizures, and severe mental retardation in female patients. J Med Genet 43(9):729-34.
Archer HL, Whatley SD, Evans JC, Ravine D, Huppke P, Kerr A, Bunyan D, Kerr B, Sweeney E, Davies SJ
and others. 2006b. Gross rearrangements of the MECP2 gene are found in both classical and
atypical Rett syndrome patients. J Med Genet 43(5):451-6.
Arevalo JC, Wu SH. 2006. Neurotrophin signaling: many exciting surprises! Cell Mol Life Sci
63(13):1523-37.
Ariani F, Hayek G, Rondinella D, Artuso R, Mencarelli MA, Spanhol-Rosseto A, Pollazzon M, Buoni S,
Spiga O, Ricciardi S and others. 2008. FOXG1 is responsible for the congenital variant of Rett
syndrome. Am J Hum Genet 83(1):89-93.
Ariani F, Mari F, Pescucci C, Longo I, Bruttini M, Meloni I, Hayek G, Rocchi R, Zappella M, Renieri A.
2004. Real-time quantitative PCR as a routine method for screening large rearrangements in
Rett syndrome: Report of one case of MECP2 deletion and one case of MECP2 duplication.
Hum Mutat 24(2):172-7.
Armstrong D, Dunn JK, Antalffy B, Trivedi R. 1995. Selective dendritic alterations in the cortex of Rett
syndrome. J Neuropathol Exp Neurol 54(2):195-201.
Armstrong DD. 2002. Neuropathology of Rett syndrome. Ment Retard Dev Disabil Res Rev 8(2):72-6.
Armstrong DD, Dunn JK, Schultz RJ, Herbert DA, Glaze DG, Motil KJ. 1999. Organ growth in Rett
syndrome: a postmortem examination analysis. Pediatr Neurol 20(2):125-9.
Armstrong DD, Dunn K, Antalffy B. 1998. Decreased dendritic branching in frontal, motor and limbic
cortex in Rett syndrome compared with trisomy 21. J Neuropathol Exp Neurol 57(11):1013-7.
Ashraf SI, Kunes S. 2006. A trace of silence: memory and microRNA at the synapse. Curr Opin
Neurobiol 16(5):535-9.
Balkowiec A, Katz DM. 2000. Activity-dependent release of endogenous brain-derived neurotrophic
factor from primary sensory neurons detected by ELISA in situ. J Neurosci 20(19):7417-23.
Balmer D, Goldstine J, Rao YM, LaSalle JM. 2003. Elevated methyl-CpG-binding protein 2 expression is
acquired during postnatal human brain development and is correlated with alternative
polyadenylation. J Mol Med 81(1):61-8.
Bamburg JR, McGough A, Ono S. 1999. Putting a new twist on actin: ADF/cofilins modulate actin
dynamics. Trends Cell Biol 9(9):364-70.
Bibliography
110
Barnard DC, Ryan K, Manley JL, Richter JD. 2004. Symplekin and xGLD-2 are required for CPEB-
mediated cytoplasmic polyadenylation. Cell 119(5):641-51.
Bauman ML, Kemper TL, Arin DM. 1995a. Microscopic observations of the brain in Rett syndrome.
Neuropediatrics 26(2):105-8.
Bauman ML, Kemper TL, Arin DM. 1995b. Pervasive neuroanatomic abnormalities of the brain in
three cases of Rett's syndrome. Neurology 45(8):1581-6.
Bebbington A, Percy A, Christodoulou J, Ravine D, Ho G, Jacoby P, Anderson A, Pineda M, Ben Zeev B,
Bahi-Buisson N and others. Updating the profile of C-terminal MECP2 deletions in Rett
syndrome. J Med Genet 47(4):242-8.
Belichenko PV, Hagberg B, Dahlstrom A. 1997. Morphological study of neocortical areas in Rett
syndrome. Acta Neuropathol 93(1):50-61.
Belichenko PV, Oldfors A, Hagberg B, Dahlstrom A. 1994. Rett syndrome: 3-D confocal microscopy of
cortical pyramidal dendrites and afferents. Neuroreport 5(12):1509-13.
Ben-Zeev B, Aharoni R, Nissenkorn A, Arnon R. 2010. Glatiramer acetate (GA, Copolymer-1) an
hypothetical treatment option for Rett syndrome. Med Hypotheses 76(2):190-3.
Binder DK. 2004. The role of BDNF in epilepsy and other diseases of the mature nervous system. Adv
Exp Med Biol 548:34-56.
Bird A. 2002. DNA methylation patterns and epigenetic memory. Genes Dev 16(1):6-21.
Blue ME, Naidu S, Johnston MV. 1999. Development of amino acid receptors in frontal cortex from
girls with Rett syndrome. Ann Neurol 45(4):541-5.
Bourdon V, Philippe C, Bienvenu T, Koenig B, Tardieu M, Chelly J, Jonveaux P. 2001. Evidence of
somatic mosaicism for a MECP2 mutation in females with Rett syndrome: diagnostic
implications. J Med Genet 38(12):867-71.
Bramham CR. 2007. Control of synaptic consolidation in the dentate gyrus: mechanisms, functions,
and therapeutic implications. Prog Brain Res 163:453-71.
Budden SS, Myer EC, Butler IJ. 1990. Cerebrospinal fluid studies in the Rett syndrome: biogenic
amines and beta-endorphins. Brain Dev 12(1):81-4.
Buschdorf JP, Stratling WH. 2004. A WW domain binding region in methyl-CpG-binding protein
MeCP2: impact on Rett syndrome. J Mol Med 82(2):135-43.
Capsoni S, Tongiorgi E, Cattaneo A, Domenici L. 1999. Dark rearing blocks the developmental down-
regulation of brain-derived neurotrophic factor messenger RNA expression in layers IV and V
of the rat visual cortex. Neuroscience 88(2):393-403.
Carley DW, Olopade C, Ruigt GS, Radulovacki M. 2007. Efficacy of mirtazapine in obstructive sleep
apnea syndrome. Sleep 30(1):35-41.
Carley DW, Radulovacki M. 1999. Mirtazapine, a mixed-profile serotonin agonist/antagonist,
suppresses sleep apnea in the rat. Am J Respir Crit Care Med 160(6):1824-9.
Carnevalli LS, Pereira CM, Jaqueta CB, Alves VS, Paiva VN, Vattem KM, Wek RC, Mello LE, Castilho BA.
2006. Phosphorylation of the alpha subunit of translation initiation factor-2 by PKR mediates
protein synthesis inhibition in the mouse brain during status epilepticus. Biochem J
397(1):187-94.
Carney RM, Wolpert CM, Ravan SA, Shahbazian M, Ashley-Koch A, Cuccaro ML, Vance JM, Pericak-
Vance MA. 2003. Identification of MeCP2 mutations in a series of females with autistic
disorder. Pediatr Neurol 28(3):205-11.
Casanova MF, Naidu S, Goldberg TE, Moser HW, Khoromi S, Kumar A, Kleinman JE, Weinberger DR.
1991. Quantitative magnetic resonance imaging in Rett syndrome. J Neuropsychiatry Clin
Neurosci 3(1):66-72.
Castren E, Pitkanen M, Sirvio J, Parsadanian A, Lindholm D, Thoenen H, Riekkinen PJ. 1993. The
induction of LTP increases BDNF and NGF mRNA but decreases NT-3 mRNA in the dentate
gyrus. Neuroreport 4(7):895-8.
Bibliography
111
Castren E, Rantamaki T. The role of BDNF and its receptors in depression and antidepressant drug
action: Reactivation of developmental plasticity. Dev Neurobiol 70(5):289-97.
Castren E, Voikar V, Rantamaki T. 2007. Role of neurotrophic factors in depression. Curr Opin
Pharmacol 7(1):18-21.
Castren E, Zafra F, Thoenen H, Lindholm D. 1992. Light regulates expression of brain-derived
neurotrophic factor mRNA in rat visual cortex. Proc Natl Acad Sci U S A 89(20):9444-8.
Chahrour M, Jung SY, Shaw C, Zhou X, Wong ST, Qin J, Zoghbi HY. 2008. MeCP2, a key contributor to
neurological disease, activates and represses transcription. Science 320(5880):1224-9.
Chang Q, Khare G, Dani V, Nelson S, Jaenisch R. 2006. The disease progression of Mecp2 mutant mice
is affected by the level of BDNF expression. Neuron 49(3):341-8.
Chao MV. 2003. Neurotrophins and their receptors: a convergence point for many signalling
pathways. Nat Rev Neurosci 4(4):299-309.
Chao MV, Rajagopal R, Lee FS. 2006. Neurotrophin signalling in health and disease. Clin Sci (Lond)
110(2):167-73.
Chapleau CA, Calfa GD, Lane MC, Albertson AJ, Larimore JL, Kudo S, Armstrong DL, Percy AK, Pozzo-
Miller L. 2009. Dendritic spine pathologies in hippocampal pyramidal neurons from Rett
syndrome brain and after expression of Rett-associated MECP2 mutations. Neurobiol Dis
35(2):219-33.
Chen Q, Zhu YC, Yu J, Miao S, Zheng J, Xu L, Zhou Y, Li D, Zhang C, Tao J and others. 2010. CDKL5, a
protein associated with rett syndrome, regulates neuronal morphogenesis via Rac1 signaling.
J Neurosci 30(38):12777-86.
Chen RZ, Akbarian S, Tudor M, Jaenisch R. 2001. Deficiency of methyl-CpG binding protein-2 in CNS
neurons results in a Rett-like phenotype in mice. Nat Genet 27(3):327-31.
Chen WG, Chang Q, Lin Y, Meissner A, West AE, Griffith EC, Jaenisch R, Greenberg ME. 2003.
Derepression of BDNF transcription involves calcium-dependent phosphorylation of MeCP2.
Science 302(5646):885-9.
Cheng Q, Yeh HH. 2003. Brain-derived neurotrophic factor attenuates mouse cerebellar granule cell
GABA(A) receptor-mediated responses via postsynaptic mechanisms. J Physiol 548(Pt 3):711-
21.
Chiaruttini C, Sonego M, Baj G, Simonato M, Tongiorgi E. 2008. BDNF mRNA splice variants display
activity-dependent targeting to distinct hippocampal laminae. Mol Cell Neurosci 37(1):11-9.
Chotiner JK, Khorasani H, Nairn AC, O'Dell TJ, Watson JB. 2003. Adenylyl cyclase-dependent form of
chemical long-term potentiation triggers translational regulation at the elongation step.
Neuroscience 116(3):743-52.
Christodoulou J, Weaving LS. 2003. MECP2 and beyond: phenotype-genotype correlations in Rett
syndrome. J Child Neurol 18(10):669-74.
Cohen D, Lazar G, Couvert P, Desportes V, Lippe D, Mazet P, Heron D. 2002. MECP2 mutation in a boy
with language disorder and schizophrenia. Am J Psychiatry 159(1):148-9.
Cohen DR, Matarazzo V, Palmer AM, Tu Y, Jeon OH, Pevsner J, Ronnett GV. 2003. Expression of
MeCP2 in olfactory receptor neurons is developmentally regulated and occurs before
synaptogenesis. Mol Cell Neurosci 22(4):417-29.
Collins AL, Levenson JM, Vilaythong AP, Richman R, Armstrong DL, Noebels JL, David Sweatt J, Zoghbi
HY. 2004. Mild overexpression of MeCP2 causes a progressive neurological disorder in mice.
Hum Mol Genet 13(21):2679-89.
Conner JM, Lauterborn JC, Yan Q, Gall CM, Varon S. 1997. Distribution of brain-derived neurotrophic
factor (BDNF) protein and mRNA in the normal adult rat CNS: evidence for anterograde
axonal transport. J Neurosci 17(7):2295-313.
Coppell AL, Pei Q, Zetterstrom TS. 2003. Bi-phasic change in BDNF gene expression following
antidepressant drug treatment. Neuropharmacology 44(7):903-10.
Bibliography
112
Coy JF, Sedlacek Z, Bachner D, Delius H, Poustka A. 1999. A complex pattern of evolutionary
conservation and alternative polyadenylation within the long 3"-untranslated region of the
methyl-CpG-binding protein 2 gene (MeCP2) suggests a regulatory role in gene expression.
Hum Mol Genet 8(7):1253-62.
D'Ercole AJ, Ye P, Calikoglu AS, Gutierrez-Ospina G. 1996. The role of the insulin-like growth factors in
the central nervous system. Mol Neurobiol 13(3):227-55.
D'Esposito M, Quaderi NA, Ciccodicola A, Bruni P, Esposito T, D'Urso M, Brown SD. 1996. Isolation,
physical mapping, and northern analysis of the X-linked human gene encoding methyl CpG-
binding protein, MECP2. Mamm Genome 7(7):533-5.
Dani VS, Chang Q, Maffei A, Turrigiano GG, Jaenisch R, Nelson SB. 2005. Reduced cortical activity due
to a shift in the balance between excitation and inhibition in a mouse model of Rett
syndrome. Proc Natl Acad Sci U S A 102(35):12560-5.
del Gaudio D, Fang P, Scaglia F, Ward PA, Craigen WJ, Glaze DG, Neul JL, Patel A, Lee JA, Irons M and
others. 2006. Increased MECP2 gene copy number as the result of genomic duplication in
neurodevelopmentally delayed males. Genet Med 8(12):784-92.
Deng V, Matagne V, Banine F, Frerking M, Ohliger P, Budden S, Pevsner J, Dissen GA, Sherman LS,
Ojeda SR. 2007. FXYD1 is an MeCP2 target gene overexpressed in the brains of Rett
syndrome patients and Mecp2-null mice. Hum Mol Genet 16(6):640-50.
Dias BG, Banerjee SB, Duman RS, Vaidya VA. 2003. Differential regulation of brain derived
neurotrophic factor transcripts by antidepressant treatments in the adult rat brain.
Neuropharmacology 45(4):553-63.
Dintilhac A, Bernues J. 2002. HMGB1 interacts with many apparently unrelated proteins by
recognizing short amino acid sequences. J Biol Chem 277(9):7021-8.
Donnici L, Tiraboschi E, Tardito D, Musazzi L, Racagni G, Popoli M. 2008. Time-dependent biphasic
modulation of human BDNF by antidepressants in neuroblastoma cells. BMC Neurosci 9:61.
Donovan MJ, Lin MI, Wiegn P, Ringstedt T, Kraemer R, Hahn R, Wang S, Ibanez CF, Rafii S, Hempstead
BL. 2000. Brain derived neurotrophic factor is an endothelial cell survival factor required for
intramyocardial vessel stabilization. Development 127(21):4531-40.
Dragich J, Houwink-Manville I, Schanen C. 2000. Rett syndrome: a surprising result of mutation in
MECP2. Hum Mol Genet 9(16):2365-75.
Dragich JM, Kim YH, Arnold AP, Schanen NC. 2007. Differential distribution of the MeCP2 splice
variants in the postnatal mouse brain. J Comp Neurol 501(4):526-42.
Duman RS, Monteggia LM. 2006. A neurotrophic model for stress-related mood disorders. Biol
Psychiatry 59(12):1116-27.
Ellison KA, Fill CP, Terwilliger J, DeGennaro LJ, Martin-Gallardo A, Anvret M, Percy AK, Ott J, Zoghbi H.
1992. Examination of X chromosome markers in Rett syndrome: exclusion mapping with a
novel variation on multilocus linkage analysis. Am J Hum Genet 50(2):278-87.
Ernfors P, Ibanez CF, Ebendal T, Olson L, Persson H. 1990a. Molecular cloning and neurotrophic
activities of a protein with structural similarities to nerve growth factor: developmental and
topographical expression in the brain. Proc Natl Acad Sci U S A 87(14):5454-8.
Ernfors P, Wetmore C, Olson L, Persson H. 1990b. Identification of cells in rat brain and peripheral
tissues expressing mRNA for members of the nerve growth factor family. Neuron 5(4):511-
26.
Frazer A. 2001. Serotonergic and noradrenergic reuptake inhibitors: prediction of clinical effects from
in vitro potencies. J Clin Psychiatry 62 Suppl 12:16-23.
Frerking M, Malenka RC, Nicoll RA. 1998. Brain-derived neurotrophic factor (BDNF) modulates
inhibitory, but not excitatory, transmission in the CA1 region of the hippocampus. J
Neurophysiol 80(6):3383-6.
Friedman WJ, Ernfors P, Persson H. 1991a. Transient and persistent expression of NT-3/HDNF mRNA
in the rat brain during postnatal development. J Neurosci 11(6):1577-84.
Bibliography
113
Friedman WJ, Olson L, Persson H. 1991b. Cells that Express Brain-Derived Neurotrophic Factor mRNA
in the Developing Postnatal Rat Brain. Eur J Neurosci 3(7):688-697.
Friez MJ, Jones JR, Clarkson K, Lubs H, Abuelo D, Bier JA, Pai S, Simensen R, Williams C, Giampietro PF
and others. 2006. Recurrent infections, hypotonia, and mental retardation caused by
duplication of MECP2 and adjacent region in Xq28. Pediatrics 118(6):e1687-95.
Fujimaki K, Morinobu S, Duman RS. 2000. Administration of a cAMP phosphodiesterase 4 inhibitor
enhances antidepressant-induction of BDNF mRNA in rat hippocampus.
Neuropsychopharmacology 22(1):42-51.
Fukuda T, Itoh M, Ichikawa T, Washiyama K, Goto Y. 2005. Delayed maturation of neuronal
architecture and synaptogenesis in cerebral cortex of Mecp2-deficient mice. J Neuropathol
Exp Neurol 64(6):537-44.
Galvao TC, Thomas JO. 2005. Structure-specific binding of MeCP2 to four-way junction DNA through
its methyl CpG-binding domain. Nucleic Acids Res 33(20):6603-9.
Gebauer F, Hentze MW. 2004. Molecular mechanisms of translational control. Nat Rev Mol Cell Biol
5(10):827-35.
Gemelli T, Berton O, Nelson ED, Perrotti LI, Jaenisch R, Monteggia LM. 2006. Postnatal loss of methyl-
CpG binding protein 2 in the forebrain is sufficient to mediate behavioral aspects of Rett
syndrome in mice. Biol Psychiatry 59(5):468-76.
Ghitza UE, Zhai H, Wu P, Airavaara M, Shaham Y, Lu L. 2009. Role of BDNF and GDNF in drug reward
and relapse: a review. Neurosci Biobehav Rev 35(2):157-71.
Ghosh A, Carnahan J, Greenberg ME. 1994. Requirement for BDNF in activity-dependent survival of
cortical neurons. Science 263(5153):1618-23.
Giacometti E, Luikenhuis S, Beard C, Jaenisch R. 2007. Partial rescue of MeCP2 deficiency by
postnatal activation of MeCP2. Proc Natl Acad Sci U S A 104(6):1931-6.
Goodman LJ, Valverde J, Lim F, Geschwind MD, Federoff HJ, Geller AI, Hefti F. 1996. Regulated
release and polarized localization of brain-derived neurotrophic factor in hippocampal
neurons. Mol Cell Neurosci 7(3):222-38.
Gooney M, Messaoudi E, Maher FO, Bramham CR, Lynch MA. 2004. BDNF-induced LTP in dentate
gyrus is impaired with age: analysis of changes in cell signaling events. Neurobiol Aging
25(10):1323-31.
Gotoh H, Suzuki I, Maruki K, Mitomo M, Hirasawa K, Sasaki N. 2001. Magnetic resonance imaging and
clinical findings examined in adulthood-studies on three adults with Rett syndrome. Brain
Dev 23 Suppl 1:S118-21.
Gottschalk W, Pozzo-Miller LD, Figurov A, Lu B. 1998. Presynaptic modulation of synaptic
transmission and plasticity by brain-derived neurotrophic factor in the developing
hippocampus. J Neurosci 18(17):6830-9.
Gray NK, Wickens M. 1998. Control of translation initiation in animals. Annu Rev Cell Dev Biol 14:399-
458.
Greco SJ, Sarkar S, Johnston JM, Zhu X, Su B, Casadesus G, Ashford JW, Smith MA, Tezapsidis N. 2008.
Leptin reduces Alzheimer's disease-related tau phosphorylation in neuronal cells. Biochem
Biophys Res Commun 376(3):536-41.
Gromeier M, Bossert B, Arita M, Nomoto A, Wimmer E. 1999. Dual stem loops within the poliovirus
internal ribosomal entry site control neurovirulence. J Virol 73(2):958-64.
Guideri F, Acampa M, Blardi P, de Lalla A, Zappella M, Hayek Y. 2004. Cardiac dysautonomia and
serotonin plasma levels in Rett syndrome. Neuropediatrics 35(1):36-8.
Guideri F, Acampa M, Cuomo A, Lazzerini PE, Capecchi PL, Giordano A, Pasini FL. 2001a. Cardiac
dysautonomia in patients with superior vena cava syndrome due to compression by lung
cancer. Int J Cardiol 77(2-3):311-3.
Bibliography
114
Guideri F, Acampa M, DiPerri T, Zappella M, Hayek Y. 2001b. Progressive cardiac dysautonomia
observed in patients affected by classic Rett syndrome and not in the preserved speech
variant. J Child Neurol 16(5):370-3.
Guideri F, Acampa M, Hayek G, Zappella M, Di Perri T. 1999. Reduced heart rate variability in patients
affected with Rett syndrome. A possible explanation for sudden death. Neuropediatrics
30(3):146-8.
Guideri F, Acampa M, Hayek Y, Zappella M. 2005. Effects of acetyl-L-carnitine on cardiac
dysautonomia in Rett syndrome: prevention of sudden death? Pediatr Cardiol 26(5):574-7.
Guy J, Gan J, Selfridge J, Cobb S, Bird A. 2007. Reversal of neurological defects in a mouse model of
Rett syndrome. Science 315(5815):1143-7.
Guy J, Hendrich B, Holmes M, Martin JE, Bird A. 2001. A mouse Mecp2-null mutation causes
neurological symptoms that mimic Rett syndrome. Nat Genet 27(3):322-6.
Hagberg B. 1985. Rett syndrome: Swedish approach to analysis of prevalence and cause. Brain Dev
7(3):276-80.
Hagberg B. 2002. Clinical manifestations and stages of Rett syndrome. Ment Retard Dev Disabil Res
Rev 8(2):61-5.
Hagberg B. 2005. Rett syndrome: long-term clinical follow-up experiences over four decades. J Child
Neurol 20(9):722-7.
Hagberg B, Goutieres F, Hanefeld F, Rett A, Wilson J. 1985. Rett syndrome: criteria for inclusion and
exclusion. Brain Dev 7(3):372-3.
Hagberg G, Stenbom Y, Witt Engerstrom I. 2000. Head growth in Rett syndrome. Acta Paediatr
89(2):198-202.
Hamberger A, Gillberg C, Palm A, Hagberg B. 1992. Elevated CSF glutamate in Rett syndrome.
Neuropediatrics 23(4):212-3.
Hammer S, Dorrani N, Dragich J, Kudo S, Schanen C. 2002. The phenotypic consequences of MECP2
mutations extend beyond Rett syndrome. Ment Retard Dev Disabil Res Rev 8(2):94-8.
Harikrishnan KN, Chow MZ, Baker EK, Pal S, Bassal S, Brasacchio D, Wang L, Craig JM, Jones PL, Sif S
and others. 2005. Brahma links the SWI/SNF chromatin-remodeling complex with MeCP2-
dependent transcriptional silencing. Nat Genet 37(3):254-64.
Hendrich B, Bird A. 1998. Identification and characterization of a family of mammalian methyl-CpG
binding proteins. Mol Cell Biol 18(11):6538-47.
Hofer M, Pagliusi SR, Hohn A, Leibrock J, Barde YA. 1990. Regional distribution of brain-derived
neurotrophic factor mRNA in the adult mouse brain. Embo J 9(8):2459-64.
Hohn A, Leibrock J, Bailey K, Barde YA. 1990. Identification and characterization of a novel member of
the nerve growth factor/brain-derived neurotrophic factor family. Nature 344(6264):339-41.
Horch HW, Katz LC. 2002. BDNF release from single cells elicits local dendritic growth in nearby
neurons. Nat Neurosci 5(11):1177-84.
Horike S, Cai S, Miyano M, Cheng JF, Kohwi-Shigematsu T. 2005. Loss of silent-chromatin looping and
impaired imprinting of DLX5 in Rett syndrome. Nat Genet 37(1):31-40.
Huang EJ, Reichardt LF. 2003. Trk receptors: roles in neuronal signal transduction. Annu Rev Biochem
72:609-42.
Huang YS, Carson JH, Barbarese E, Richter JD. 2003. Facilitation of dendritic mRNA transport by CPEB.
Genes Dev 17(5):638-53.
Huopaniemi L, Tyynismaa H, Rantala A, Rosenberg T, Alitalo T. 2000. Characterization of two unusual
RS1 gene deletions segregating in Danish retinoschisis families. Hum Mutat 16(4):307-14.
Ishii T, Makita Y, Ogawa A, Amamiya S, Yamamoto M, Miyamoto A, Oki J. 2001. The role of different
X-inactivation pattern on the variable clinical phenotype with Rett syndrome. Brain Dev 23
Suppl 1:S161-4.
Itoh M, Ide S, Takashima S, Kudo S, Nomura Y, Segawa M, Kubota T, Mori H, Tanaka S, Horie H and
others. 2007. Methyl CpG-binding protein 2 (a mutation of which causes Rett syndrome)
Bibliography
115
directly regulates insulin-like growth factor binding protein 3 in mouse and human brains. J
Neuropathol Exp Neurol 66(2):117-23.
Jaenisch R, Bird A. 2003. Epigenetic regulation of gene expression: how the genome integrates
intrinsic and environmental signals. Nat Genet 33 Suppl:245-54.
Jang SK, Krausslich HG, Nicklin MJ, Duke GM, Palmenberg AC, Wimmer E. 1988. A segment of the 5'
nontranslated region of encephalomyocarditis virus RNA directs internal entry of ribosomes
during in vitro translation. J Virol 62(8):2636-43.
Jefferies HB, Fumagalli S, Dennis PB, Reinhard C, Pearson RB, Thomas G. 1997. Rapamycin suppresses
5'TOP mRNA translation through inhibition of p70s6k. Embo J 16(12):3693-704.
Jellinger K, Armstrong D, Zoghbi HY, Percy AK. 1988. Neuropathology of Rett syndrome. Acta
Neuropathol 76(2):142-58.
Jellinger K, Seitelberger F. 1986. Neuropathology of Rett syndrome. Am J Med Genet Suppl 1:259-88.
Jian L, Nagarajan L, de Klerk N, Ravine D, Bower C, Anderson A, Williamson S, Christodoulou J,
Leonard H. 2006. Predictors of seizure onset in Rett syndrome. J Pediatr 149(4):542-7.
Jiang X, Tian F, Du Y, Copeland NG, Jenkins NA, Tessarollo L, Wu X, Pan H, Hu XZ, Xu K and others.
2008. BHLHB2 controls Bdnf promoter 4 activity and neuronal excitability. J Neurosci
28(5):1118-30.
Jones PL, Veenstra GJ, Wade PA, Vermaak D, Kass SU, Landsberger N, Strouboulis J, Wolffe AP. 1998.
Methylated DNA and MeCP2 recruit histone deacetylase to repress transcription. Nat Genet
19(2):187-91.
Jopling CL, Willis AE. 2001. N-myc translation is initiated via an internal ribosome entry segment that
displays enhanced activity in neuronal cells. Oncogene 20(21):2664-70.
Jung BP, Jugloff DG, Zhang G, Logan R, Brown S, Eubanks JH. 2003. The expression of methyl CpG
binding factor MeCP2 correlates with cellular differentiation in the developing rat brain and
in cultured cells. J Neurobiol 55(1):86-96.
Kaludov NK, Wolffe AP. 2000. MeCP2 driven transcriptional repression in vitro: selectivity for
methylated DNA, action at a distance and contacts with the basal transcription machinery.
Nucleic Acids Res 28(9):1921-8.
Kang H, Schuman EM. 1996. A requirement for local protein synthesis in neurotrophin-induced
hippocampal synaptic plasticity. Science 273(5280):1402-6.
Kang HJ, Schuman EM. 1995. Neurotrophin-induced modulation of synaptic transmission in the adult
hippocampus. J Physiol Paris 89(1):11-22.
Kato Z, Ohnishi H, Kimura T, Kondo N. 2010
Prediction of the pathogenesis of the mutation in MeCP2 C-terminal domain. Brain Dev 32(2):169.
Katoh-Semba R, Semba R, Takeuchi IK, Kato K. 1998. Age-related changes in levels of brain-derived
neurotrophic factor in selected brain regions of rats, normal mice and senescence-
accelerated mice: a comparison to those of nerve growth factor and neurotrophin-3.
Neurosci Res 31(3):227-34.
Katz DM. 2005. Regulation of respiratory neuron development by neurotrophic and transcriptional
signaling mechanisms. Respir Physiol Neurobiol 149(1-3):99-109.
Katz DM, Dutschmann M, Ramirez JM, Hilaire G. 2009. Breathing disorders in Rett syndrome:
progressive neurochemical dysfunction in the respiratory network after birth. Respir Physiol
Neurobiol 168(1-2):101-8.
Kaufmann WE, Naidu S, Budden S. 1995. Abnormal expression of microtubule-associated protein 2
(MAP-2) in neocortex in Rett syndrome. Neuropediatrics 26(2):109-13.
Kaufmann WE, Worley PF, Taylor CV, Bremer M, Isakson PC. 1997. Cyclooxygenase-2 expression
during rat neocortical development and in Rett syndrome. Brain Dev 19(1):25-34.
Kermani P, Rafii D, Jin DK, Whitlock P, Schaffer W, Chiang A, Vincent L, Friedrich M, Shido K, Hackett
NR and others. 2005. Neurotrophins promote revascularization by local recruitment of TrkB+
Bibliography
116
endothelial cells and systemic mobilization of hematopoietic progenitors. J Clin Invest
115(3):653-63.
Kerr AM. 1995. Early clinical signs in the Rett disorder. Neuropediatrics 26(2):67-71.
Kerr AM, Julu PO. 1999. Recent insights into hyperventilation from the study of Rett syndrome. Arch
Dis Child 80(4):384-7.
Kifayathullah LA, Arunachalam JP, Bodda C, Agbemenyah HY, Laccone FA, Mannan AU. MeCP2
mutant protein is expressed in astrocytes as well as in neurons and localizes in the nucleus.
Cytogenet Genome Res 129(4):290-7.
Kimura H, Shiota K. 2003. Methyl-CpG-binding protein, MeCP2, is a target molecule for maintenance
DNA methyltransferase, Dnmt1. J Biol Chem 278(7):4806-12.
Kishi N, Macklis JD. 2004. MECP2 is progressively expressed in post-migratory neurons and is involved
in neuronal maturation rather than cell fate decisions. Mol Cell Neurosci 27(3):306-21.
Kitt CA, Wilcox BJ. 1995. Preliminary evidence for neurodegenerative changes in the substantia nigra
of Rett syndrome. Neuropediatrics 26(2):114-8.
Klann E, Antion MD, Banko JL, Hou L. 2004. Synaptic plasticity and translation initiation. Learn Mem
11(4):365-72.
Klann E, Dever TE. 2004. Biochemical mechanisms for translational regulation in synaptic plasticity.
Nat Rev Neurosci 5(12):931-42.
Klauck SM, Lindsay S, Beyer KS, Splitt M, Burn J, Poustka A. 2002. A mutation hot spot for nonspecific
X-linked mental retardation in the MECP2 gene causes the PPM-X syndrome. Am J Hum
Genet 70(4):1034-7.
Klein ME, Lioy DT, Ma L, Impey S, Mandel G, Goodman RH. 2007. Homeostatic regulation of MeCP2
expression by a CREB-induced microRNA. Nat Neurosci 10(12):1513-4.
Klose RJ, Bird AP. 2004. MeCP2 behaves as an elongated monomer that does not stably associate
with the Sin3a chromatin remodeling complex. J Biol Chem 279(45):46490-6.
Klose RJ, Sarraf SA, Schmiedeberg L, McDermott SM, Stancheva I, Bird AP. 2005. DNA binding
selectivity of MeCP2 due to a requirement for A/T sequences adjacent to methyl-CpG. Mol
Cell 19(5):667-78.
Kokura K, Kaul SC, Wadhwa R, Nomura T, Khan MM, Shinagawa T, Yasukawa T, Colmenares C, Ishii S.
2001. The Ski protein family is required for MeCP2-mediated transcriptional repression. J Biol
Chem 276(36):34115-21.
Konecna A, Heraud JE, Schoderboeck L, Raposo AA, Kiebler MA. 2009. What are the roles of
microRNAs at the mammalian synapse? Neurosci Lett 466(2):63-8.
Koppel I, Aid-Pavlidis T, Jaanson K, Sepp M, Pruunsild P, Palm K, Timmusk T. 2009. Tissue-specific and
neural activity-regulated expression of human BDNF gene in BAC transgenic mice. BMC
Neurosci 10:68.
Korte M, Carroll P, Wolf E, Brem G, Thoenen H, Bonhoeffer T. 1995. Hippocampal long-term
potentiation is impaired in mice lacking brain-derived neurotrophic factor. Proc Natl Acad Sci
U S A 92(19):8856-60.
Korte M, Staiger V, Griesbeck O, Thoenen H, Bonhoeffer T. 1996. The involvement of brain-derived
neurotrophic factor in hippocampal long-term potentiation revealed by gene targeting
experiments. J Physiol Paris 90(3-4):157-64.
Kriaucionis S, Bird A. 2003. DNA methylation and Rett syndrome. Hum Mol Genet 12 Spec No 2:R221-
7.
Kumar A, Kamboj S, Malone BM, Kudo S, Twiss JL, Czymmek KJ, LaSalle JM, Schanen NC. 2008.
Analysis of protein domains and Rett syndrome mutations indicate that multiple regions
influence chromatin-binding dynamics of the chromatin-associated protein MECP2 in vivo. J
Cell Sci 121(Pt 7):1128-37.

Bibliography
117
Lam CW, Yeung WL, Ko CH, Poon PM, Tong SF, Chan KY, Lo IF, Chan LY, Hui J, Wong V and others.
2000. Spectrum of mutations in the MECP2 gene in patients with infantile autism and Rett
syndrome. J Med Genet 37(12):E41.
Lappalainen R, Lindholm D, Riikonen R. 1996. Low levels of nerve growth factor in cerebrospinal fluid
of children with Rett syndrome. J Child Neurol 11(4):296-300.
Larimore JL, Chapleau CA, Kudo S, Theibert A, Percy AK, Pozzo-Miller L. 2009. Bdnf overexpression in
hippocampal neurons prevents dendritic atrophy caused by Rett-associated MECP2
mutations. Neurobiol Dis 34(2):199-211.
LaSalle JM, Goldstine J, Balmer D, Greco CM. 2001. Quantitative localization of heterogeneous
methyl-CpG-binding protein 2 (MeCP2) expression phenotypes in normal and Rett syndrome
brain by laser scanning cytometry. Hum Mol Genet 10(17):1729-40.
Lekman A, Witt-Engerstrom I, Gottfries J, Hagberg BA, Percy AK, Svennerholm L. 1989. Rett
syndrome: biogenic amines and metabolites in postmortem brain. Pediatr Neurol 5(6):357-
62.
Lekman A, Witt-Engerstrom I, Holmberg B, Percy A, Svennerholm L, Hagberg B. 1990. CSF and urine
biogenic amine metabolites in Rett syndrome. Clin Genet 37(3):173-8.
Levi-Montalcini R, Meyer H, Hamburger V. 1954. In vitro experiments on the effects of mouse
sarcomas 180 and 37 on the spinal and sympathetic ganglia of the chick embryo. Cancer Res
14(1):49-57.
Lewis JD, Meehan RR, Henzel WJ, Maurer-Fogy I, Jeppesen P, Klein F, Bird A. 1992. Purification,
sequence, and cellular localization of a novel chromosomal protein that binds to methylated
DNA. Cell 69(6):905-14.
Liao B, Hu Y, Brewer G. 2007. Competitive binding of AUF1 and TIAR to MYC mRNA controls its
translation. Nat Struct Mol Biol 14(6):511-8.
Lin Y, Bloodgood BL, Hauser JL, Lapan AD, Koon AC, Kim TK, Hu LS, Malik AN, Greenberg ME. 2008.
Activity-dependent regulation of inhibitory synapse development by Npas4. Nature
455(7217):1198-204.
Lipani JD, Bhattacharjee MB, Corey DM, Lee DA. 2000. Reduced nerve growth factor in Rett
syndrome postmortem brain tissue. J Neuropathol Exp Neurol 59(10):889-95.
Liu J, Francke U. 2006. Identification of cis-regulatory elements for MECP2 expression. Hum Mol
Genet 15(11):1769-82.
Liu QR, Lu L, Zhu XG, Gong JP, Shaham Y, Uhl GR. 2006. Rodent BDNF genes, novel promoters, novel
splice variants, and regulation by cocaine. Brain Res 1067(1):1-12.
Liu QR, Walther D, Drgon T, Polesskaya O, Lesnick TG, Strain KJ, de Andrade M, Bower JH,
Maraganore DM, Uhl GR. 2005. Human brain derived neurotrophic factor (BDNF) genes,
splicing patterns, and assessments of associations with substance abuse and Parkinson's
Disease. Am J Med Genet B Neuropsychiatr Genet 134B(1):93-103.
Liu X, Ernfors P, Wu H, Jaenisch R. 1995. Sensory but not motor neuron deficits in mice lacking NT4
and BDNF. Nature 375(6528):238-41.
Lohof AM, Ip NY, Poo MM. 1993. Potentiation of developing neuromuscular synapses by the
neurotrophins NT-3 and BDNF. Nature 363(6427):350-3.
Lopes FM, Schroder R, da Frota ML, Jr., Zanotto-Filho A, Muller CB, Pires AS, Meurer RT, Colpo GD,
Gelain DP, Kapczinski F and others. 2010. Comparison between proliferative and neuron-like
SH-SY5Y cells as an in vitro model for Parkinson disease studies. Brain Res 1337:85-94.
Lu B, Chow A. 1999. Neurotrophins and hippocampal synaptic transmission and plasticity. J Neurosci
Res 58(1):76-87.
Lu B, Figurov A. 1997. Role of neurotrophins in synapse development and plasticity. Rev Neurosci
8(1):1-12.
Lubin FD, Ren Y, Xu X, Anderson AE. 2007. Nuclear factor-kappa B regulates seizure threshold and
gene transcription following convulsant stimulation. J Neurochem 103(4):1381-95.
Bibliography
118
Lugtenberg D, Kleefstra T, Oudakker AR, Nillesen WM, Yntema HG, Tzschach A, Raynaud M, Rating D,
Journel H, Chelly J and others. 2009. Structural variation in Xq28: MECP2 duplications in 1%
of patients with unexplained XLMR and in 2% of male patients with severe encephalopathy.
Eur J Hum Genet 17(4):444-53.
Luikenhuis S, Giacometti E, Beard CF, Jaenisch R. 2004. Expression of MeCP2 in postmitotic neurons
rescues Rett syndrome in mice. Proc Natl Acad Sci U S A 101(16):6033-8.
Maisonpierre PC, Belluscio L, Friedman B, Alderson RF, Wiegand SJ, Furth ME, Lindsay RM,
Yancopoulos GD. 1990. NT-3, BDNF, and NGF in the developing rat nervous system: parallel
as well as reciprocal patterns of expression. Neuron 5(4):501-9.
Marchetto MC, Carromeu C, Acab A, Yu D, Yeo GW, Mu Y, Chen G, Gage FH, Muotri AR. 2011. A
model for neural development and treatment of Rett syndrome using human induced
pluripotent stem cells. Cell 143(4):527-39.
Mari F, Azimonti S, Bertani I, Bolognese F, Colombo E, Caselli R, Scala E, Longo I, Grosso S, Pescucci C
and others. 2005. CDKL5 belongs to the same molecular pathway of MeCP2 and it is
responsible for the early-onset seizure variant of Rett syndrome. Hum Mol Genet
14(14):1935-46.
Marin-Padilla M. 1976. Pyramidal cell abnormalities in the motor cortex of a child with Down's
syndrome. A Golgi study. J Comp Neurol 167(1):63-81.
Marin P, Nastiuk KL, Daniel N, Girault JA, Czernik AJ, Glowinski J, Nairn AC, Premont J. 1997.
Glutamate-dependent phosphorylation of elongation factor-2 and inhibition of protein
synthesis in neurons. J Neurosci 17(10):3445-54.
Martinez-Salas E, Fernandez-Miragall O. 2004. Picornavirus IRES: structure function relationship. Curr
Pharm Des 10(30):3757-67.
Martinowich K, Hattori D, Wu H, Fouse S, He F, Hu Y, Fan G, Sun YE. 2003. DNA methylation-related
chromatin remodeling in activity-dependent BDNF gene regulation. Science 302(5646):890-3.
Matarazzo V, Cohen D, Palmer AM, Simpson PJ, Khokhar B, Pan SJ, Ronnett GV. 2004. The
transcriptional repressor Mecp2 regulates terminal neuronal differentiation. Mol Cell
Neurosci 27(1):44-58.
Matsuishi T, Nagamitsu S, Yamashita Y, Murakami Y, Kimura A, Sakai T, Shoji H, Kato H, Percy AK.
1997. Decreased cerebrospinal fluid levels of substance P in patients with Rett syndrome.
Ann Neurol 42(6):978-81.
McAllister AK, Katz LC, Lo DC. 1997. Opposing roles for endogenous BDNF and NT-3 in regulating
cortical dendritic growth. Neuron 18(5):767-78.
McGill BE, Bundle SF, Yaylaoglu MB, Carson JP, Thaller C, Zoghbi HY. 2006. Enhanced anxiety and
stress-induced corticosterone release are associated with increased Crh expression in a
mouse model of Rett syndrome. Proc Natl Acad Sci U S A 103(48):18267-72.
Meehan RR, Lewis JD, Bird AP. 1992. Characterization of MeCP2, a vertebrate DNA binding protein
with affinity for methylated DNA. Nucleic Acids Res 20(19):5085-92.
Meehan RR, Lewis JD, McKay S, Kleiner EL, Bird AP. 1989. Identification of a mammalian protein that
binds specifically to DNA containing methylated CpGs. Cell 58(3):499-507.
Meins M, Lehmann J, Gerresheim F, Herchenbach J, Hagedorn M, Hameister K, Epplen JT. 2005.
Submicroscopic duplication in Xq28 causes increased expression of the MECP2 gene in a boy
with severe mental retardation and features of Rett syndrome. J Med Genet 42(2):e12.
Mencarelli MA, Spanhol-Rosseto A, Artuso R, Rondinella D, De Filippis R, Bahi-Buisson N, Nectoux J,
Rubinsztajn R, Bienvenu T, Moncla A and others. 2009. Novel FOXG1 mutations associated
with the congenital variant of Rett syndrome. J Med Genet 47(1):49-53.
Messaoudi E, Ying SW, Kanhema T, Croll SD, Bramham CR. 2002. Brain-derived neurotrophic factor
triggers transcription-dependent, late phase long-term potentiation in vivo. J Neurosci
22(17):7453-61.
Bibliography
119
Metsis M, Timmusk T, Arenas E, Persson H. 1993. Differential usage of multiple brain-derived
neurotrophic factor promoters in the rat brain following neuronal activation. Proc Natl Acad
Sci U S A 90(19):8802-6.
Milani D, Pantaleoni C, D'Arrigo S, Selicorni A, Riva D. 2005. Another patient with MECP2 mutation
without classic Rett syndrome phenotype. Pediatr Neurol 32(5):355-7.
Minichiello L. 2009. TrkB signalling pathways in LTP and learning. Nat Rev Neurosci 10(12):850-60.
Minichiello L, Korte M, Wolfer D, Kuhn R, Unsicker K, Cestari V, Rossi-Arnaud C, Lipp HP, Bonhoeffer
T, Klein R. 1999. Essential role for TrkB receptors in hippocampus-mediated learning. Neuron
24(2):401-14.
Miyata S, Mori Y, Fujiwara T, Ikenaka K, Matsuzaki S, Oono K, Katayama T, Tohyama M. 2005. Local
protein synthesis by BDNF is potentiated in hippocampal neurons exposed to ephrins. Brain
Res Mol Brain Res 134(2):333-7.
Mnatzakanian GN, Lohi H, Munteanu I, Alfred SE, Yamada T, MacLeod PJ, Jones JR, Scherer SW,
Schanen NC, Friez MJ and others. 2004. A previously unidentified MECP2 open reading frame
defines a new protein isoform relevant to Rett syndrome. Nat Genet 36(4):339-41.
Molteni R, Calabrese F, Bedogni F, Tongiorgi E, Fumagalli F, Racagni G, Riva MA. 2006. Chronic
treatment with fluoxetine up-regulates cellular BDNF mRNA expression in rat dopaminergic
regions. Int J Neuropsychopharmacol 9(3):307-17.
Montini E, Andolfi G, Caruso A, Buchner G, Walpole SM, Mariani M, Consalez G, Trump D, Ballabio A,
Franco B. 1998. Identification and characterization of a novel serine-threonine kinase gene
from the Xp22 region. Genomics 51(3):427-33.
Moretti P, Bouwknecht JA, Teague R, Paylor R, Zoghbi HY. 2005. Abnormalities of social interactions
and home-cage behavior in a mouse model of Rett syndrome. Hum Mol Genet 14(2):205-20.
Mount RH, Charman T, Hastings RP, Reilly S, Cass H. 2002. The Rett Syndrome Behaviour
Questionnaire (RSBQ): refining the behavioural phenotype of Rett syndrome. J Child Psychol
Psychiatry 43(8):1099-110.
Mount RH, Charman T, Hastings RP, Reilly S, Cass H. 2003a. Features of autism in Rett syndrome and
severe mental retardation. J Autism Dev Disord 33(4):435-42.
Mount RH, Hastings RP, Reilly S, Cass H, Charman T. 2001. Behavioural and emotional features in Rett
syndrome. Disabil Rehabil 23(3-4):129-38.
Mount RH, Hastings RP, Reilly S, Cass H, Charman T. 2003b. Towards a behavioral phenotype for Rett
syndrome. Am J Ment Retard 108(1):1-12.
Mullaney BC, Johnston MV, Blue ME. 2004. Developmental expression of methyl-CpG binding protein
2 is dynamically regulated in the rodent brain. Neuroscience 123(4):939-49.
Murakami JW, Courchesne E, Haas RH, Press GA, Yeung-Courchesne R. 1992. Cerebellar and cerebral
abnormalities in Rett syndrome: a quantitative MR analysis. AJR Am J Roentgenol 159(1):177-
83.
Murer MG, Yan Q, Raisman-Vozari R. 2001. Brain-derived neurotrophic factor in the control human
brain, and in Alzheimer's disease and Parkinson's disease. Prog Neurobiol 63(1):71-124.
Nagappan G, Lu B. 2005. Activity-dependent modulation of the BDNF receptor TrkB: mechanisms and
implications. Trends Neurosci 28(9):464-71.
Nagarajan N, Quast C, Boxall AR, Shahid M, Rosenmund C. 2001. Mechanism and impact of allosteric
AMPA receptor modulation by the ampakine CX546. Neuropharmacology 41(6):650-63.
Naidu S. 1997. Rett syndrome: natural history and underlying disease mechanisms. Eur Child Adolesc
Psychiatry 6 Suppl 1:14-7.
Naidu S, Hyman S, Piazza K, Savedra J, Perman J, Wenk G, Kitt C, Troncoso J, Price D, Cassanova M
and others. 1990. The Rett syndrome: progress report on studies at the Kennedy Institute.
Brain Dev 12(1):5-7.
Nan X, Campoy FJ, Bird A. 1997. MeCP2 is a transcriptional repressor with abundant binding sites in
genomic chromatin. Cell 88(4):471-81.
Bibliography
120
Nan X, Hou J, Maclean A, Nasir J, Lafuente MJ, Shu X, Kriaucionis S, Bird A. 2007. Interaction between
chromatin proteins MECP2 and ATRX is disrupted by mutations that cause inherited mental
retardation. Proc Natl Acad Sci U S A 104(8):2709-14.
Nan X, Meehan RR, Bird A. 1993. Dissection of the methyl-CpG binding domain from the
chromosomal protein MeCP2. Nucleic Acids Res 21(21):4886-92.
Nan X, Ng HH, Johnson CA, Laherty CD, Turner BM, Eisenman RN, Bird A. 1998. Transcriptional
repression by the methyl-CpG-binding protein MeCP2 involves a histone deacetylase
complex. Nature 393(6683):386-9.
Nan X, Tate P, Li E, Bird A. 1996. DNA methylation specifies chromosomal localization of MeCP2. Mol
Cell Biol 16(1):414-21.
Narisawa-Saito M, Nawa H. 1996. Differential regulation of hippocampal neurotrophins during aging
in rats. J Neurochem 67(3):1124-31.
Nibuya M, Morinobu S, Duman RS. 1995. Regulation of BDNF and trkB mRNA in rat brain by chronic
electroconvulsive seizure and antidepressant drug treatments. J Neurosci 15(11):7539-47.
Nibuya M, Nestler EJ, Duman RS. 1996. Chronic antidepressant administration increases the
expression of cAMP response element binding protein (CREB) in rat hippocampus. J Neurosci
16(7):2365-72.
Nielsen JB, Bertelsen A, Lou HC. 1992. Low CSF HVA levels in the Rett syndrome: a reflection of
restricted synapse formation? Brain Dev 14 Suppl:S63-5.
Nikitina T, Ghosh RP, Horowitz-Scherer RA, Hansen JC, Grigoryev SA, Woodcock CL. 2007a. MeCP2-
chromatin interactions include the formation of chromatosome-like structures and are
altered in mutations causing Rett syndrome. J Biol Chem 282(38):28237-45.
Nikitina T, Shi X, Ghosh RP, Horowitz-Scherer RA, Hansen JC, Woodcock CL. 2007b. Multiple modes of
interaction between the methylated DNA binding protein MeCP2 and chromatin. Mol Cell
Biol 27(3):864-77.
Nomura Y. 2005. Early behavior characteristics and sleep disturbance in Rett syndrome. Brain Dev 27
Suppl 1:S35-S42.
Nuber UA, Kriaucionis S, Roloff TC, Guy J, Selfridge J, Steinhoff C, Schulz R, Lipkowitz B, Ropers HH,
Holmes MC and others. 2005. Up-regulation of glucocorticoid-regulated genes in a mouse
model of Rett syndrome. Hum Mol Genet 14(15):2247-56.
O'Kusky JR, Ye P, D'Ercole AJ. 2000. Insulin-like growth factor-I promotes neurogenesis and
synaptogenesis in the hippocampal dentate gyrus during postnatal development. J Neurosci
20(22):8435-42.
Ogier M, Wang H, Hong E, Wang Q, Greenberg ME, Katz DM. 2007. Brain-derived neurotrophic factor
expression and respiratory function improve after ampakine treatment in a mouse model of
Rett syndrome. J Neurosci 27(40):10912-7.
Oldfors A, Hagberg B, Nordgren H, Sourander P, Witt-Engerstrom I. 1988. Rett syndrome: spinal cord
neuropathology. Pediatr Neurol 4(3):172-4.
Pain VM. 1996. Initiation of protein synthesis in eukaryotic cells. Eur J Biochem 236(3):747-71.
Pan H, Li MR, Nelson P, Bao XH, Wu XR, Yu S. 2006. Large deletions of the MECP2 gene in Chinese
patients with classical Rett syndrome. Clin Genet 70(5):418-9.
Park CS, Tang SJ. 2009. Regulation of microRNA expression by induction of bidirectional synaptic
plasticity. J Mol Neurosci 38(1):50-6.
Pattabiraman PP, Tropea D, Chiaruttini C, Tongiorgi E, Cattaneo A, Domenici L. 2005. Neuronal
activity regulates the developmental expression and subcellular localization of cortical BDNF
mRNA isoforms in vivo. Mol Cell Neurosci 28(3):556-70.
Patterson SL, Abel T, Deuel TA, Martin KC, Rose JC, Kandel ER. 1996. Recombinant BDNF rescues
deficits in basal synaptic transmission and hippocampal LTP in BDNF knockout mice. Neuron
16(6):1137-45.
Bibliography
121
Patterson SL, Grover LM, Schwartzkroin PA, Bothwell M. 1992. Neurotrophin expression in rat
hippocampal slices: a stimulus paradigm inducing LTP in CA1 evokes increases in BDNF and
NT-3 mRNAs. Neuron 9(6):1081-8.
Peddada S, Yasui DH, LaSalle JM. 2006. Inhibitors of differentiation (ID1, ID2, ID3 and ID4) genes are
neuronal targets of MeCP2 that are elevated in Rett syndrome. Hum Mol Genet 15(12):2003-
14.
Pelka GJ, Watson CM, Christodoulou J, Tam PP. 2005. Distinct expression profiles of Mecp2
transcripts with different lengths of 3'UTR in the brain and visceral organs during mouse
development. Genomics 85(4):441-52.
Pelka GJ, Watson CM, Radziewic T, Hayward M, Lahooti H, Christodoulou J, Tam PP. 2006. Mecp2
deficiency is associated with learning and cognitive deficits and altered gene activity in the
hippocampal region of mice. Brain 129(Pt 4):887-98.
Pelletier J, Sonenberg N. 1988. Internal initiation of translation of eukaryotic mRNA directed by a
sequence derived from poliovirus RNA. Nature 334(6180):320-5.
Percy AK, Neul JL, Glaze DG, Motil KJ, Skinner SA, Khwaja O, Lee HS, Lane JB, Barrish JO, Annese F and
others. Rett syndrome diagnostic criteria: lessons from the Natural History Study. Ann Neurol
68(6):951-5.
Perry TL, Dunn HG, Ho HH, Crichton JU. 1988. Cerebrospinal fluid values for monoamine metabolites,
gamma-aminobutyric acid, and other amino compounds in Rett syndrome. J Pediatr
112(2):234-8.
Phillips HS, Hains JM, Laramee GR, Rosenthal A, Winslow JW. 1990. Widespread expression of BDNF
but not NT3 by target areas of basal forebrain cholinergic neurons. Science 250(4978):290-4.
Pinkstaff JK, Chappell SA, Mauro VP, Edelman GM, Krushel LA. 2001. Internal initiation of translation
of five dendritically localized neuronal mRNAs. Proc Natl Acad Sci U S A 98(5):2770-5.
Poliakov GI. 1961. [On certain structural characteristics of neurons of the central nervous system
demonstrated by different neurohistological methods. II. Contact apparatus formed by
dendrites of the nerve cells]. Zh Nevropatol Psikhiatr Im S S Korsakova 61:271-9.
Posey DJ, Guenin KD, Kohn AE, Swiezy NB, McDougle CJ. 2001. A naturalistic open-label study of
mirtazapine in autistic and other pervasive developmental disorders. J Child Adolesc
Psychopharmacol 11(3):267-77.
Pruunsild P, Kazantseva A, Aid T, Palm K, Timmusk T. 2007. Dissecting the human BDNF locus:
bidirectional transcription, complex splicing, and multiple promoters. Genomics 90(3):397-
406.
Pruunsild P, Sepp M, Orav E, Koppel I, Timmusk T. 2011. Identification of cis-Elements and
Transcription Factors Regulating Neuronal Activity-Dependent Transcription of Human BDNF
Gene. J Neurosci 31(9):3295-308.
Purpura DP. 1974. Dendritic spine "dysgenesis" and mental retardation. Science 186(4169):1126-8.
Quaderi NA, Meehan RR, Tate PH, Cross SH, Bird AP, Chatterjee A, Herman GE, Brown SD. 1994.
Genetic and physical mapping of a gene encoding a methyl CpG binding protein, Mecp2, to
the mouse X chromosome. Genomics 22(3):648-51.
Ramsey MM, Adams MM, Ariwodola OJ, Sonntag WE, Weiner JL. 2005. Functional characterization of
des-IGF-1 action at excitatory synapses in the CA1 region of rat hippocampus. J Neurophysiol
94(1):247-54.
Ravn K, Nielsen JB, Schwartz M. 2005. Mutations found within exon 1 of MECP2 in Danish patients
with Rett syndrome. Clin Genet 67(6):532-3.
Reichwald K, Thiesen J, Wiehe T, Weitzel J, Poustka WA, Rosenthal A, Platzer M, Stratling WH,
Kioschis P. 2000. Comparative sequence analysis of the MECP2-locus in human and mouse
reveals new transcribed regions. Mamm Genome 11(3):182-90.
Reiss AL, Faruque F, Naidu S, Abrams M, Beaty T, Bryan RN, Moser H. 1993. Neuroanatomy of Rett
syndrome: a volumetric imaging study. Ann Neurol 34(2):227-34.
Bibliography
122
Renieri A, Meloni I, Longo I, Ariani F, Mari F, Pescucci C, Cambi F. 2003. Rett syndrome: the complex
nature of a monogenic disease. J Mol Med 81(6):346-54.
Ricciardi S, Boggio EM, Grosso S, Lonetti G, Forlani G, Stefanelli G, Calcagno E, Morello N,
Landsberger N, Biffo S and others. 2011. Reduced AKT/mTOR signaling and protein synthesis
dysregulation in a Rett syndrome animal model. Hum Mol Genet 20(6):1182-96.
Richter JD, Klann E. 2009. Making synaptic plasticity and memory last: mechanisms of translational
regulation. Genes Dev 23(1):1-11.
Riikonen R, Makkonen I, Vanhala R, Turpeinen U, Kuikka J, Kokki H. 2006. Cerebrospinal fluid insulin-
like growth factors IGF-1 and IGF-2 in infantile autism. Dev Med Child Neurol 48(9):751-5.
Riikonen R, Vanhala R. 1999. Levels of cerebrospinal fluid nerve-growth factor differ in infantile
autism and Rett syndrome. Dev Med Child Neurol 41(3):148-52.
Rolando S. 1985. Rett syndrome: report of eight cases. Brain Dev 7(3):290-6.
Ronnett GV, Leopold D, Cai X, Hoffbuhr KC, Moses L, Hoffman EP, Naidu S. 2003. Olfactory biopsies
demonstrate a defect in neuronal development in Rett's syndrome. Ann Neurol 54(2):206-18.
Rosenfeld RD, Zeni L, Haniu M, Talvenheimo J, Radka SF, Bennett L, Miller JA, Welcher AA. 1995.
Purification and identification of brain-derived neurotrophic factor from human serum.
Protein Expr Purif 6(4):465-71.
Rosenthal A, Goeddel DV, Nguyen T, Martin E, Burton LE, Shih A, Laramee GR, Wurm F, Mason A,
Nikolics K and others. 1991. Primary structure and biological activity of human brain-derived
neurotrophic factor. Endocrinology 129(3):1289-94.
Roux JC, Dura E, Moncla A, Mancini J, Villard L. 2007. Treatment with desipramine improves
breathing and survival in a mouse model for Rett syndrome. Eur J Neurosci 25(7):1915-22.
Roze E, Cochen V, Sangla S, Bienvenu T, Roubergue A, Leu-Semenescu S, Vidaihet M. 2007. Rett
syndrome: an overlooked diagnosis in women with stereotypic hand movements,
psychomotor retardation, Parkinsonism, and dystonia? Mov Disord 22(3):387-9.
Russo-Neustadt AA, Chen MJ. 2005. Brain-derived neurotrophic factor and antidepressant activity.
Curr Pharm Des 11(12):1495-510.
Samaco RC, Mandel-Brehm C, Chao HT, Ward CS, Fyffe-Maricich SL, Ren J, Hyland K, Thaller C,
Maricich SM, Humphreys P and others. 2009. Loss of MeCP2 in aminergic neurons causes
cell-autonomous defects in neurotransmitter synthesis and specific behavioral abnormalities.
Proc Natl Acad Sci U S A 106(51):21966-71.
Schecterson LC, Bothwell M. 1992. Novel roles for neurotrophins are suggested by BDNF and NT-3
mRNA expression in developing neurons. Neuron 9(3):449-63.
Scheetz AJ, Nairn AC, Constantine-Paton M. 1997. N-methyl-D-aspartate receptor activation and
visual activity induce elongation factor-2 phosphorylation in amphibian tecta: a role for N-
methyl-D-aspartate receptors in controlling protein synthesis. Proc Natl Acad Sci U S A
94(26):14770-5.
Scheetz AJ, Nairn AC, Constantine-Paton M. 2000. NMDA receptor-mediated control of protein
synthesis at developing synapses. Nat Neurosci 3(3):211-6.
Schratt GM, Nigh EA, Chen WG, Hu L, Greenberg ME. 2004. BDNF regulates the translation of a select
group of mRNAs by a mammalian target of rapamycin-phosphatidylinositol 3-kinase-
dependent pathway during neuronal development. J Neurosci 24(33):7366-77.
Schratt GM, Tuebing F, Nigh EA, Kane CG, Sabatini ME, Kiebler M, Greenberg ME. 2006. A brain-
specific microRNA regulates dendritic spine development. Nature 439(7074):283-9.
Schuman EM. 1999. Neurotrophin regulation of synaptic transmission. Curr Opin Neurobiol 9(1):105-
9.
Segawa M. 2005. Early motor disturbances in Rett syndrome and its pathophysiological importance.
Brain Dev 27 Suppl 1:S54-S58.
Segawa M, Nomura Y. 2005. Rett syndrome. Curr Opin Neurol 18(2):97-104.
Bibliography
123
Sekul EA, Moak JP, Schultz RJ, Glaze DG, Dunn JK, Percy AK. 1994. Electrocardiographic findings in
Rett syndrome: an explanation for sudden death? J Pediatr 125(1):80-2.
Shahbazian M, Young J, Yuva-Paylor L, Spencer C, Antalffy B, Noebels J, Armstrong D, Paylor R, Zoghbi
H. 2002a. Mice with truncated MeCP2 recapitulate many Rett syndrome features and display
hyperacetylation of histone H3. Neuron 35(2):243-54.
Shahbazian MD, Antalffy B, Armstrong DL, Zoghbi HY. 2002b. Insight into Rett syndrome: MeCP2
levels display tissue- and cell-specific differences and correlate with neuronal maturation.
Hum Mol Genet 11(2):115-24.
Shahbazian MD, Sun Y, Zoghbi HY. 2002c. Balanced X chromosome inactivation patterns in the Rett
syndrome brain. Am J Med Genet 111(2):164-8.
Shieh PB, Ghosh A. 1999. Molecular mechanisms underlying activity-dependent regulation of BDNF
expression. J Neurobiol 41(1):127-34.
Shieh PB, Hu SC, Bobb K, Timmusk T, Ghosh A. 1998. Identification of a signaling pathway involved in
calcium regulation of BDNF expression. Neuron 20(4):727-40.
Singh J, Saxena A, Christodoulou J, Ravine D. 2008. MECP2 genomic structure and function: insights
from ENCODE. Nucleic Acids Res 36(19):6035-47.
Sirianni N, Naidu S, Pereira J, Pillotto RF, Hoffman EP. 1998. Rett syndrome: confirmation of X-linked
dominant inheritance, and localization of the gene to Xq28. Am J Hum Genet 63(5):1552-8.
Smart FM, Edelman GM, Vanderklish PW. 2003. BDNF induces translocation of initiation factor 4E to
mRNA granules: evidence for a role of synaptic microfilaments and integrins. Proc Natl Acad
Sci U S A 100(24):14403-8.
Stancheva I, Collins AL, Van den Veyver IB, Zoghbi H, Meehan RR. 2003. A mutant form of MeCP2
protein associated with human Rett syndrome cannot be displaced from methylated DNA by
notch in Xenopus embryos. Mol Cell 12(2):425-35.
Stebbins-Boaz B, Cao Q, de Moor CH, Mendez R, Richter JD. 1999. Maskin is a CPEB-associated factor
that transiently interacts with elF-4E. Mol Cell 4(6):1017-27.
Stenbom Y, Engerstrom IW, Hagberg G. 1995. Gross motor disability and head growth in Rett
syndrome--a preliminary report. Neuropediatrics 26(2):85-6.
Stettner GM, Huppke P, Brendel C, Richter DW, Gartner J, Dutschmann M. 2007. Breathing
dysfunctions associated with impaired control of postinspiratory activity in Mecp2-/y
knockout mice. J Physiol 579(Pt 3):863-76.
Stoneley M, Willis AE. 2004. Cellular internal ribosome entry segments: structures, trans-acting
factors and regulation of gene expression. Oncogene 23(18):3200-7.
Tabuchi A, Yamada T, Sasagawa S, Naruse Y, Mori N, Tsuda M. 2002. REST4-mediated modulation of
REST/NRSF-silencing function during BDNF gene promoter activation. Biochem Biophys Res
Commun 290(1):415-20.
Takei N, Kawamura M, Hara K, Yonezawa K, Nawa H. 2001. Brain-derived neurotrophic factor
enhances neuronal translation by activating multiple initiation processes: comparison with
the effects of insulin. J Biol Chem 276(46):42818-25.
Takei N, Kawamura M, Ishizuka Y, Kakiya N, Inamura N, Namba H, Nawa H. 2009. Brain-derived
neurotrophic factor enhances the basal rate of protein synthesis by increasing active
eukaryotic elongation factor 2 levels and promoting translation elongation in cortical
neurons. J Biol Chem 284(39):26340-8.
Takei N, Numakawa T, Kozaki S, Sakai N, Endo Y, Takahashi M, Hatanaka H. 1998. Brain-derived
neurotrophic factor induces rapid and transient release of glutamate through the non-
exocytotic pathway from cortical neurons. J Biol Chem 273(42):27620-4.
Tan K, Shaw AL, Madsen B, Jensen K, Taylor-Papadimitriou J, Freemont PS. 2003. Human PLU-1 Has
transcriptional repression properties and interacts with the developmental transcription
factors BF-1 and PAX9. J Biol Chem 278(23):20507-13.
Bibliography
124
Tao X, Finkbeiner S, Arnold DB, Shaywitz AJ, Greenberg ME. 1998. Ca2+ influx regulates BDNF
transcription by a CREB family transcription factor-dependent mechanism. Neuron 20(4):709-
26.
Tao X, West AE, Chen WG, Corfas G, Greenberg ME. 2002. A calcium-responsive transcription factor,
CaRF, that regulates neuronal activity-dependent expression of BDNF. Neuron 33(3):383-95.
Tardito D, Perez J, Tiraboschi E, Musazzi L, Racagni G, Popoli M. 2006. Signaling pathways regulating
gene expression, neuroplasticity, and neurotrophic mechanisms in the action of
antidepressants: a critical overview. Pharmacol Rev 58(1):115-34.
Tate P, Skarnes W, Bird A. 1996. The methyl-CpG binding protein MeCP2 is essential for embryonic
development in the mouse. Nat Genet 12(2):205-8.
Temudo T, Santos M, Ramos E, Dias K, Vieira JP, Moreira A, Calado E, Carrilho I, Oliveira G, Levy A and
others. 2011. Rett syndrome with and without detected MECP2 mutations: an attempt to
redefine phenotypes. Brain Dev 33(1):69-76.
Timmusk T, Palm K, Metsis M, Reintam T, Paalme V, Saarma M, Persson H. 1993. Multiple promoters
direct tissue-specific expression of the rat BDNF gene. Neuron 10(3):475-89.
Tongiorgi E. 2008. Activity-dependent expression of brain-derived neurotrophic factor in dendrites:
facts and open questions. Neurosci Res 61(4):335-46.
Tongiorgi E, Armellin M, Giulianini PG, Bregola G, Zucchini S, Paradiso B, Steward O, Cattaneo A,
Simonato M. 2004. Brain-derived neurotrophic factor mRNA and protein are targeted to
discrete dendritic laminas by events that trigger epileptogenesis. J Neurosci 24(30):6842-52.
Tongiorgi E, Baj G. 2008. Functions and mechanisms of BDNF mRNA trafficking. Novartis Found Symp
289:136-47; discussion 147-51, 193-5.
Topcu M, Akyerli C, Sayi A, Toruner GA, Kocoglu SR, Cimbis M, Ozcelik T. 2002. Somatic mosaicism for
a MECP2 mutation associated with classic Rett syndrome in a boy. Eur J Hum Genet 10(1):77-
81.
Tsokas P, Grace EA, Chan P, Ma T, Sealfon SC, Iyengar R, Landau EM, Blitzer RD. 2005. Local protein
synthesis mediates a rapid increase in dendritic elongation factor 1A after induction of late
long-term potentiation. J Neurosci 25(24):5833-43.
Tsokas P, Ma T, Iyengar R, Landau EM, Blitzer RD. 2007. Mitogen-activated protein kinase
upregulates the dendritic translation machinery in long-term potentiation by controlling the
mammalian target of rapamycin pathway. J Neurosci 27(22):5885-94.
Tudor M, Akbarian S, Chen RZ, Jaenisch R. 2002. Transcriptional profiling of a mouse model for Rett
syndrome reveals subtle transcriptional changes in the brain. Proc Natl Acad Sci U S A
99(24):15536-41.
Tyler WJ, Alonso M, Bramham CR, Pozzo-Miller LD. 2002. From acquisition to consolidation: on the
role of brain-derived neurotrophic factor signaling in hippocampal-dependent learning. Learn
Mem 9(5):224-37.
Viemari JC, Roux JC, Tryba AK, Saywell V, Burnet H, Pena F, Zanella S, Bevengut M, Barthelemy-
Requin M, Herzing LB and others. 2005. Mecp2 deficiency disrupts norepinephrine and
respiratory systems in mice. J Neurosci 25(50):11521-30.
Vo N, Klein ME, Varlamova O, Keller DM, Yamamoto T, Goodman RH, Impey S. 2005. A cAMP-
response element binding protein-induced microRNA regulates neuronal morphogenesis.
Proc Natl Acad Sci U S A 102(45):16426-31.
Wan M, Lee SS, Zhang X, Houwink-Manville I, Song HR, Amir RE, Budden S, Naidu S, Pereira JL, Lo IF
and others. 1999. Rett syndrome and beyond: recurrent spontaneous and familial MECP2
mutations at CpG hotspots. Am J Hum Genet 65(6):1520-9.
Wang H, Chan SA, Ogier M, Hellard D, Wang Q, Smith C, Katz DM. 2006. Dysregulation of brain-
derived neurotrophic factor expression and neurosecretory function in Mecp2 null mice. J
Neurosci 26(42):10911-5.
Bibliography
125
Watson P, Black G, Ramsden S, Barrow M, Super M, Kerr B, Clayton-Smith J. 2001. Angelman
syndrome phenotype associated with mutations in MECP2, a gene encoding a methyl CpG
binding protein. J Med Genet 38(4):224-8.
Weaving LS, Ellaway CJ, Gecz J, Christodoulou J. 2005. Rett syndrome: clinical review and genetic
update. J Med Genet 42(1):1-7.
Weese-Mayer DE, Lieske SP, Boothby CM, Kenny AS, Bennett HL, Ramirez JM. 2008. Autonomic
dysregulation in young girls with Rett Syndrome during nighttime in-home recordings.
Pediatr Pulmonol 43(11):1045-60.
Weese-Mayer DE, Lieske SP, Boothby CM, Kenny AS, Bennett HL, Silvestri JM, Ramirez JM. 2006.
Autonomic nervous system dysregulation: breathing and heart rate perturbation during
wakefulness in young girls with Rett syndrome. Pediatr Res 60(4):443-9.
West AE, Chen WG, Dalva MB, Dolmetsch RE, Kornhauser JM, Shaywitz AJ, Takasu MA, Tao X,
Greenberg ME. 2001. Calcium regulation of neuronal gene expression. Proc Natl Acad Sci U S
A 98(20):11024-31.
Wetmore C, Ernfors P, Persson H, Olson L. 1990. Localization of brain-derived neurotrophic factor
mRNA to neurons in the brain by in situ hybridization. Exp Neurol 109(2):141-52.
Yamada K, Mizuno M, Nabeshima T. 2002. Role for brain-derived neurotrophic factor in learning and
memory. Life Sci 70(7):735-44.
Yao J, Lai E, Stifani S. 2001. The winged-helix protein brain factor 1 interacts with groucho and hes
proteins to repress transcription. Mol Cell Biol 21(6):1962-72.
Ying SW, Futter M, Rosenblum K, Webber MJ, Hunt SP, Bliss TV, Bramham CR. 2002. Brain-derived
neurotrophic factor induces long-term potentiation in intact adult hippocampus:
requirement for ERK activation coupled to CREB and upregulation of Arc synthesis. J Neurosci
22(5):1532-40.
Young JI, Hong EP, Castle JC, Crespo-Barreto J, Bowman AB, Rose MF, Kang D, Richman R, Johnson
JM, Berget S and others. 2005. Regulation of RNA splicing by the methylation-dependent
transcriptional repressor methyl-CpG binding protein 2. Proc Natl Acad Sci U S A
102(49):17551-8.
Zafra F, Castren E, Thoenen H, Lindholm D. 1991. Interplay between glutamate and gamma-
aminobutyric acid transmitter systems in the physiological regulation of brain-derived
neurotrophic factor and nerve growth factor synthesis in hippocampal neurons. Proc Natl
Acad Sci U S A 88(22):10037-41.
Zafra F, Hengerer B, Leibrock J, Thoenen H, Lindholm D. 1990. Activity dependent regulation of BDNF
and NGF mRNAs in the rat hippocampus is mediated by non-NMDA glutamate receptors.
Embo J 9(11):3545-50.
Zappella M, Mari F, Renieri A. 2005. Should a syndrome be called by its correct name? The example
of the preserved speech variant of Rett syndrome. Eur J Pediatr 164(11):710; author reply
711-2.
Zappella M, Meloni I, Longo I, Hayek G, Renieri A. 2001. Preserved speech variants of the Rett
syndrome: molecular and clinical analysis. Am J Med Genet 104(1):14-22.
Zheng WH, Quirion R. 2004. Comparative signaling pathways of insulin-like growth factor-1 and
brain-derived neurotrophic factor in hippocampal neurons and the role of the PI3 kinase
pathway in cell survival. J Neurochem 89(4):844-52.
Zhou Z, Hong EJ, Cohen S, Zhao WN, Ho HY, Schmidt L, Chen WG, Lin Y, Savner E, Griffith EC and
others. 2006. Brain-specific phosphorylation of MeCP2 regulates activity-dependent Bdnf
transcription, dendritic growth, and spine maturation. Neuron 52(2):255-69.
Zoghbi H. 1988. Genetic aspects of Rett syndrome. J Child Neurol 3 Suppl:S76-8.
Zoghbi HY, Milstien S, Butler IJ, Smith EO, Kaufman S, Glaze DG, Percy AK. 1989. Cerebrospinal fluid
biogenic amines and biopterin in Rett syndrome. Ann Neurol 25(1):56-60.

Bibliography
126
Zoghbi HY, Percy AK, Glaze DG, Butler IJ, Riccardi VM. 1985. Reduction of biogenic amine levels in the
Rett syndrome. N Engl J Med 313(15):921-4.
Zuccato C, Liber D, Ramos C, Tarditi A, Rigamonti D, Tartari M, Valenza M, Cattaneo E. 2005.
Progressive loss of BDNF in a mouse model of Huntington's disease and rescue by BDNF
delivery. Pharmacol Res 52(2):133-9.