tesserent limited and controlled entities financial report
TRANSCRIPT
TESSERENT LIMITED AND CONTROLLED ENTITIES
FINANCIAL REPORT
30TH JUNE 2018
ABN: 13 605 672 928

Tesserent Limited Financial Report 2018
Page 1
Contents DIRECTORS’ REPORT ............................................................................................................................ 3
REMUNERTATION REPORT - AUDITED ............................................................................................. 11
AUDITOR’S INDEPENDENCE DECLARATION ................................................................................... 22
CONSOLIDATED STATEMENT OF PROFIT OR LOSS AND OTHER COMPREHENSIVE INCOME 23
CONSOLIDATED STATEMENT OF FINANCIAL POSITION ............................................................... 24
CONSOLIDATED STATEMENT OF CHANGES IN EQUITY ................................................................ 26
CONSOLIDATED STATEMENT OF CASH FLOWS ............................................................................. 27
NOTES TO THE FINANCIAL STATEMENTS ....................................................................................... 28
1. Introduction to the Report ............................................................................................................ 28
2. Business Result for the Year ........................................................................................................ 31
2.1 Segment information .................................................................................................................. 31
2.2 Revenue ....................................................................................................................................... 33
2.3 Loss for the year ......................................................................................................................... 34
2.4 Earnings per share ...................................................................................................................... 34
2.5 Business combinations .............................................................................................................. 35
2.6 Taxation ........................................................................................................................................ 36
3. Operating Assets and Liabilities .................................................................................................. 39
3.1 Trade and other receivables ...................................................................................................... 39
3.2 Trade and other payables ........................................................................................................... 40
3.3 Provisions .................................................................................................................................... 40
3.4 Contingent liabilities ................................................................................................................... 41
3.5 Plant and equipment ................................................................................................................... 41
3.6 Intangibles ................................................................................................................................... 43
3.7 Inventory ...................................................................................................................................... 45
3.8 Other financial assets ................................................................................................................. 45
3.9 Other financial liabilities ............................................................................................................. 46
4. Capital Management ...................................................................................................................... 46
4.1 Borrowings .................................................................................................................................. 46
4.2 Financial risk management ........................................................................................................ 47
4.3 Cash and cash equivalents ........................................................................................................ 49
4.4 Contributed equity ...................................................................................................................... 49
4.5 Commitments .............................................................................................................................. 50
4.6 Dividends ..................................................................................................................................... 50
5. Other ............................................................................................................................................... 50
5.1 Related party transactions ......................................................................................................... 50
5.2 Reserves ...................................................................................................................................... 54
5.3 Parent entity information ............................................................................................................ 54

Tesserent Limited Financial Report 2018
Page 2
5.4 Remuneration of auditors .......................................................................................................... 55
5.5 Cash flow information ................................................................................................................ 55
5.6 Events occurring after the reporting period ............................................................................. 56
DIRECTORS’ DECLARATION .............................................................................................................. 57
INDEPENDENT AUDITOR’S REPORT ................................................................................................. 58
Tesserent Limited Financial Report 2018
Page 3
DIRECTORS’ REPORT
Your directors present their report on the consolidated entity (referred to herein as “the Group” or “Tesserent”)
consisting of Tesserent Limited and its controlled entities for the financial year ended 30 June 2018.
1. Directors
The following persons were directors of Tesserent Limited during the whole of the financial year and up to the date
of this report, unless otherwise stated:
Robert Langford Appointed 8 February 2018
Russell Yardley Resigned 8 February 2018
Keith Glennan
Gregory Baxter
Stefano (Steve) Bertamini
Paul Brandling Resigned 2 October 2017
2. Information on Directors
Robert Langford – Non-Executive Chairman – appointed 8 February 2018
Qualifications – Bachelor of Applied Science in Computing
Member of the Australian Computer Society
Experience – Robert has over 40 years of IT experience, starting his career as a
Cobol programmer with Royal Insurance in Melbourne, through to
roles as senior systems architect and project director with Mobil Oil
in the UK European mainland during the early 90’s. Since 2002
Robert has owned and run various businesses in Australia ranging
from IT to cattle farming.
Directorships held in other listed entities
during the three years prior to the current
year
– None
Keith Glennan – Managing Director up to 1 August 2018, becoming Executive
Director from that date.
Qualifications – B. Tech, MACS, MAICD
Experience – Board member since 2015, Managing Director of Tesserent
Australia Pty Ltd (a subsidiary of Tesserent Limited) since 2012.
Keith has been working in the IT industry for three decades, and
has worked in Australia and the United States for companies such
as Hewlett Packard and IBM. He has been involved in the
managed security industry since 2002. In late 2012 Keith acquired
control of and took the Managing Director role at Tesserent
Australia Pty Ltd. In this position he formulated the strategy of
developing the MSSP Platform and the current business strategy.
Special Responsibilities – Chief Executive Officer (CEO) up to 1 August 2018. Appointed to
the role of Chief Technology Officer effective 1 August 2018, and
resigned from CEO role. Julian Challingsworth appointed Interim
CEO 1 August 2018.
Directorships held in other listed entities
during the three years prior to the current
year
– None

Tesserent Limited Financial Report 2018
Page 4
DIRECTORS’ REPORT
Gregory Baxter – Non-Executive Director
Qualifications – BSc MBA
Experience – Board member since 2015. Gregory is currently Chief Digital
Officer at MetLife. Previously he was Global Head of Digital at
Citibank, leading Citi’s digital transformation across businesses and
geographies. He specialises in the development and delivery of
digital strategy, corporate innovation and business transformation.
He has held senior business, consulting and technology roles
across Asia, Europe and North America, with a track record of
high-impact business results. Previously Gregory was a Partner
and U.K. Board member at Booz & Company (formerly Booz Allen
Hamilton), where he held leadership roles across the financial
services, public sector and digital practices. Prior to this he was a
senior project and product manager with IBM, delivering large scale
systems integration projects in financial services and managing the
product lifecycle of leading market solutions. He is a regular
speaker on digital strategy and technology, and the impact of
disruptive innovation on business. Gregory is a council (board)
member of Chatham House (Royal Institute of International Affairs),
a leading international affairs think tank. He holds a BSc from
Monash University and a MBA from the University of Melbourne,
and has been a guest lecturer on strategy at the University of
Oxford, New York University, and American University
(Washington).
Directorships held in other listed entities
during the three years prior to the current
year
– None
Stefano (Steve) Bertamini – Non-Executive Director
Qualifications – BBA MBA
Experience – Board member since 2015. Steve is currently Chief Executive
Officer of Al Rajhi Bank, a bank with total assets in excess of
US$90 billion. Steve previously held the position of Group
Executive Director and CEO for Global Consumer Banking at
Standard Chartered Bank.
Prior to this Steve’s roles included:
• Group Executive Director and CEO Consumer Banking at
Standard Chartered Bank;
• Chairman & Chief Executive Officer of GE North East
Asia;
• Chief Executive Officer and President of GE (China) Co.
Ltd;
• Chief Executive Officer of GE Australia and New Zealand;
• President of GE Capital Asia; and
• Managing Director of GE’s Consumer Finance business in
Asia.
Steve has a BBA, Finance and Management from The University of
Texas at Austin and an MBA, Finance and International Banking
from University of North Texas.

Tesserent Limited Financial Report 2018
Page 5
DIRECTORS’ REPORT
Directorships held in other listed entities
during the three years prior to the current
year
– None
Russell Yardley – Non-Executive Chairman – resigned 8 February 2018
Qualifications – BSc FAICD
Experience – Appointed Chair in 2015 and resigned 8 February 2018.
Directorships held in other listed entities
during the three years prior to the current
year
– Chairman Powerhouse Ventures Limited
Paul Brandling – Non-Executive Director – resigned 2 October 2017
Qualifications – BSc (Hons), MAICD
Experience – Board member since 2015 and resigned 2 October 2017.
Directorships held in other listed entities
during the three years prior to the current
year
– Previously held directorships in Vocus Communications Limited
and Integrated Research Limited.
3. Directors’ Shareholdings
The table below sets out each Director’s relevant interest in shares or options of the Company at the date of this
report:
Director
Number of ordinary
shares Number of options
Robert Langford 24,071,282 -
Keith Glennan 28,761,435 -
Gregory Baxter 1,406,043 1,500,000
Stefano (Steve) Bertamini 1,406,043 1,500,000
Total 55,644,803 3,000,000
4. Company Secretary
Oliver Carton BJuris LLB was appointed Company Secretary on 6 May 2015.
Oliver is a qualified lawyer with over 29 years’ experience in a variety of corporate roles. He currently runs his own
consulting business, and was previously a Director of the Chartered Accounting firm KPMG where he managed its
Corporate Secretarial Group. Prior to that, he was a senior legal officer with ASIC.

Tesserent Limited Financial Report 2018
Page 6
DIRECTORS’ REPORT
5. Directors’ Meetings
The table below sets out the number of meetings held during the 2018 financial year and the number of meetings
attended by each Director. During the year,11 Board meetings were held.
Director Eligible to
attend
Attended
Robert Langford 5 5
Russell Yardley – resigned 8 February 2018 6 5
Keith Glennan 11 11
Gregory Baxter 11 11
Stefano (Steve) Bertamini 11 11
Paul Brandling – resigned 2 October 2017 3 3
At the February 2017 Board meeting, the Board resolved to form an Audit and Risk Committee and a Remuneration
and Nominations Committee as sub committees of the Board. At the December 2017 Board meeting it was agreed
that, due to the size and composition of the Board and sub committees, that the sub committees would be
disbanded with responsibility transferring back to the full Board. Prior to the sub committees responsibility being
transferred back to the Board, membership of these committees was restricted to Non-executive directors and was
as follows:
Directors Audit and Risk
Committee
Remuneration and Nominations
Committee
Robert Langford1 - -
Russell Yardley2 Member Member
Gregory Baxter - Chair
Stefano (Steve) Bertamini Chair -
Paul Brandling3 Member Member
(1) Appointed 8 February 2018 – post recommissioning of the sub committees
(2) Resigned 8 February 2018
(3) Resigned 2 October 2017
One Audit and Risk Committee meeting was held during FY2018, prior to the responsibility being transferred to the
Board – all members attended.
One Remuneration and Nominations Committee meeting was held during FY2018, prior to responsibility being
transferred to the Board – all members attended.
6. Review of Operations
Principal activities
Tesserent provides Internet Security-as-a-Service to a wide range of Australian and international customers,
including education providers, corporate enterprises, and government customers. Security-as-a-Service packages
security services for a customer’s computer infrastructure, including firewall, authentication, anti-virus, anti-
malware/spyware, intrusion detection, and security event management, amongst other services. These services are
provided on the basis of a subscription fee, most commonly as monthly or annual fees. This revenue model delivers
recurring revenues to Tesserent.
Tesserent has also appointed a number of international resellers (Channel partners) that licence the MSSP
Platform to deliver Security-as-a-Service to their own customers.
Group financial performance
The Group recorded a loss after tax of $3,095,670 for the year ended 30 June 2018 (2017: $3,464,036 loss).
Tesserent Limited Financial Report 2018
Page 7
DIRECTORS’ REPORT
Ongoing business revenue has risen by 21.6% year-on-year excluding Customer contracts sold to FZO in FY2017. Reported revenue comparisons to FY2017 include sold Customer contracts and is therefore down 0.9%.
Tesserent raised $500K in Q4 in a placement to clients of Phillip Capital Limited at a share price of $0.07 per share. A Share Purchase Plan (SPP) was also offered to existing shareholders providing an opportunity to buy shares at the same price, netting $304K, with the funds received post year end. The SPP closed after the balance date and this raising falls into FY19. Together this brings the total capital raised to $804K.
Research and Development tax concessions totalling $844K were received in FY18. The funds are a result of the on-going development into Tesserent’s security and networking technology, and future capabilities, which will continue to differentiate and drive the business.
Through the ongoing optimisation of operations and personnel costs, Tesserent was able to significantly reduce operational expenditure.
Following a review of operations of Tesserent, including the restructure of various strategic OEM supplier agreements and the intended acquisition of Asta, a review of the balance sheet has been undertaken, specifically focused on the intangible assets. This has resulted in a write off of goodwill that was recognised on a previous acquisition. By doing so, this will allow for a more informed assessment of FY19 company performance.
TECHNOLOGY
Tesserent’s core security services continue to experience consistent, strong growth. The annuity base of recurring revenue from 24-36 month customer contracts has created stability and linear growth, with the CyberBiz product category contributing positively. Continued R&D and capitalisation of the Tesserent proprietary platform has resulted in new innovative product features including:
- “Zero Touch” deployment technology, simplifying the networking hardware installation process, enabling rapid customer deployment and configuration.
- Proprietary SD-WAN (Software Defined Wide Area Networking) technology enabling every Tesserent network appliance (including CyberBiz) to act as a secure SD-WAN intelligent device.
Secure networking is an area where Tesserent has been able to generate strong new revenue from both new and existing customers. It also presents a significant opportunity to cross-sell networking solutions across our customer base, generating internal commercialisation efficiencies. By adapting and expanding to regulatory changes and market demand, Tesserent experienced strong growth in the SIEM (Security Incident and Event Management) product category. Changes to the Australian Privacy Act resulting in the Notifiable Data Breaches Scheme (NDB Scheme) launched in February 2018. The NDB Scheme established requirements for organisations to report and respond to data breaches. Australian businesses with inadequate cybersecurity and personal information data protection, now face the risk of large fines in the event of a data breach.
ACCELERATING GROWTH
In July 2018, Tesserent appointed Maecenas Capital to refine and drive Tesserent’s growth and go to market strategies, optimise funding arrangements, and evaluate potential acquisition opportunities. On 27 July 2018, Tesserent announced it had signed a binding terms sheet to acquire innovative ICT company, Asta Pty Ltd (Asta) subject to shareholder approval. The acquisition consideration is based on a multiple of normalised EBITDA, and is payable in a mix of cash and shares. Tesserent expects to seek shareholder approval at the 2018 AGM. Asta’s unaudited revenue for FY18 totals $10.9m and therefore combined revenue between the two companies in FY18 is over $17M. This acquisition will consolidate Tesserent’s positioning as a trusted end-to-end provider of secure IT infrastructure and services. The acquisition will extend presence in Melbourne, Sydney and Auckland and increases Tesserent’s active customer base from around 200 to around 450.
As part of Tesserent’s accelerated growth strategy, Julian Challingsworth has been appointed Chief Executive Officer as of 1 August, 2018. Julian joins Tesserent after serving as a Managing Director and Partner of The Litmus Group for over 10 years and a board member of PPB Advisory. In addition to advising over 20 organisations on growth acceleration strategies in Australia, Asia and Europe, Julian was a key driver in growing Litmus multiple business units in Australia and internationally before it was acquired by PPB Advisory.

Tesserent Limited Financial Report 2018
Page 8
DIRECTORS’ REPORT
7. Business Strategies, Prospects and Risks for the Future Financial Years
Tesserent’s strategy includes continued focus on the following areas:
• expanding the number of Channel partners in Australia and internationally;
• increasing the number of direct sales to organisations, in Australian and internationally, through increased
sales and marketing;
• assessing acquisition opportunities; and
• ongoing research and development.
8. Subsequent Events
On 27 July 2018 the Company announced that a binding term sheet, subject to conditions precedent, had been
signed to acquire ICT company Asta Solutions Pty Ltd (Asta). Asta is an Australian based business with more than
200 clients serviced by over 85 staff from offices in Melbourne, Sydney and Auckland. The purchase price is 4 X
EBITDA and expected to result in a purchase price of $3.8m. Purchase consideration will be a combination of cash
and equity. It is anticipated that the transaction will complete no later than end of December 2018.
On the 8 July 2018 the Company announced the results of the share purchase plan(SPP), noting that $304,000 had
been raised from existing shareholders who participated in the SPP. These funds have been received in full.
Apart from the matters noted above, there have been no matters or circumstances other than those referred to in
the financial statements or notes to the financial statements that have arisen since the end of the financial year, that
have significantly affected, or may significantly affect the operations of the Group, the results of those operations or
the state of affairs of the Group in subsequent financial years.
9. Changes in State of Affairs
There were no other significant changes in the state of affairs of the Group other than that referred to in the financial
statements or notes thereto.
10. Environmental Factors
Tesserent is not subject to any significant environmental regulation under Australian Commonwealth or State law.
Tesserent recognises its obligations to its stakeholders (customers, shareholders, employees and the community)
to operate in a way that minimises the impact it has on the environment.
11. Dividends
No dividends were declared or paid during the financial year.
12. Indemnification of Directors, Officers and Auditors
The Directors and Officers of Tesserent Limited are indemnified against liabilities pursuant to agreements with
Tesserent Limited. Tesserent Limited has entered into insurance contracts with a third party insurance provider, in
accordance with normal commercial practices. Under the terms of the insurance contract, the nature of the liabilities
insured against and the amount of premiums paid are confidential. The Group are not aware of any liability that
arose under these indemnities as at the date of this report.
During or since the end of financial period, the company has not indemnified or made a relevant agreement to
indemnify the auditor against a liability incurred as auditor.

Tesserent Limited Financial Report 2018
Page 9
DIRECTORS’ REPORT
13. Proceedings on Behalf of Company
No person has applied for leave of court to bring proceedings on behalf of the company or intervene in any
proceedings to which the company is a party for the purpose of taking responsibility on behalf of the company for all
or any part of those proceedings.
The company was not a party to any such proceedings during the year.
14. Non-audit services
The Board of Directors, is satisfied that the provision of non-audit services during the year is compatible with the
general standard of independence for auditors imposed by the Corporations Act 2001. The directors are satisfied
that the services disclosed below did not compromise the external auditor’s independence, as the nature of the
services provided does not compromise the general principles relating to auditor independence in accordance with
APES 110: Code of Ethics for Professional Accountants set by the Accounting Professional and Ethical Standards
Board.
The following fees were paid or payable to BDO East Coast Partnership for non-audit services provided during the
year ended 30 June 2018:
2018 2017
$ $
Tax services 45,025 99,400
15. Auditor’s Independence Declaration
The lead auditor’s independence declaration for the year ended 30 June 2018 has been received and can be found
on page 22 of the financial report.
16. Options / Deferred shares
At the date of this report, the unissued ordinary shares of Tesserent Limited under option are as follows:
Grant Date Date of Expiry Exercise Price
(Cents)
Number under
option
17 November 2015 31 August 2019 20 2,500,000
17 November 2015 31 August 2019 24 2,500,000
17 November 2015 31 August 2019 28.8 1,000,000
27 Jun 2016 27 Jun 2019 40 500,000
27 Jun 2016 27 Jun 2020 50 500,000
7,000,000
At the date of this report, the unissued ordinary shares of Tesserent Limited under deferred shares are as follows:
Grant date Vesting date Share price at
grant date
Number of
deferred shares
9 May 2016 8 May 2019 $0.16 700,000
24 November 2016 15 June 2019 $0.14 600,000
24 November 2016 3 October 2018 $0.14 450,000
24 November 2016 3 October 2019 $0.14 750,000
2,500,000

Tesserent Limited Financial Report 2018
Page 10
DIRECTORS’ REPORT
Option and deferred share holders do not have any rights to participate in any issues of shares or other interests of
the company or any other entity.
There have been no options granted or deferred shares issued over unissued shares or interests of any controlled
entity within the Group during or since the end of the reporting period.
For details of options issued and deferred shares granted to directors and executives as remuneration, refer to the
remuneration report.
No person entitled to exercise the option had or has any right by virtue of the option to participate in any share issue
of any other body corporate.

Tesserent Limited Financial Report 2018
Page 11
REMUNERTATION REPORT - AUDITED
Remuneration Policy
The directors present the consolidated entity’s 2018 audited remuneration report which details the remuneration
information for Tesserent Limited’s executive director, non-executive directors and other key management
personnel.
For the purposes of this report, Key Management Personnel (KMP) are defined as those persons having authority
and responsibility for planning, directing and controlling the major activities of the business, directly or indirectly, as
an executive.
The names and positions of KMP in the Group during the whole of the financial year unless otherwise stated are:
Name Position Appointment Date Resignation Date
Keith Glennan Managing Director
Robert Langford Non-Executive Chairman 8 February 2018
Russell Yardley Non-Executive Chairman 8 February 2018
Steve Bertamini Non-Executive Director
Gregory Baxter Non-Executive Director
Paul Brandling Non-Executive Director 2 October 2017
Karen Negus1 Head of Sales and Marketing
David Buerckner Head of Security Operations
Justin Owen2 Chief Financial Officer 1 July 2017
(1) Karen Negus resigned 2 July 2018.
(2) Justin Owen undertakes the CFO role on a permanent part time basis, providing this service via an unrelated company. From 1 July 2017 these services
were provided by a company controlled by Justin Owen.
Principles used to determine nature and amount of remuneration
The broad principles for determining the nature and amount of remuneration of KMP has historically been agreed
by the Board. In February 2017 the Board implemented a Nominations and Remuneration Committee, however in a
subsequent Board held December 2017 the Directors agreed that due to the size and structure of the Board and
sub committees that the sub committee responsibility would transition to the Board and the sub committees would
be disbanded.
An annual review of the Board and sub committee structure will be undertaken annually by the Board with changes
made as deemed appropriate to the size, structure and needs of the Company.
The Committee / Board can obtain professional advice where necessary to ensure that the Group attracts and
retains talented and motivated directors and employees who can enhance performance through their contribution
and leadership. No external advice regarding remuneration policy was obtained in the current year.
The guiding principles for determining the nature and amount of remuneration for KMP of the Group is as follows:
• remuneration should include an appropriate mix of fixed and performance based components,
• components of remuneration should be understandable, transparent and easy to communicate; and
• Remuneration Committee / Board to review KMP packages annually by reference to the Group’s performance, executive performance and comparable information from industry sectors.
The Remuneration and Nominations Committee / Board sets out to link remuneration polices with the achievement
of financial and personal objectives.

Tesserent Limited Financial Report 2018
Page 12
REMUNERTATION REPORT - AUDITED
Group financial performance
The earnings of the Group for the three years ending 30 June 2018 are summarised as follows:
Financial performance1 2018 2017 2016
Sales revenue – external customers 5,327,957 5,375,117 4,713,558
Earnings before interest, tax, depreciation,
amortisation and impairment(EBITDA)
(1,529,345) (2,883,644) (130,658)
Loss after income tax (3,095,670) (3,464,036) (218,654)
Basic loss per share (cents) (2.62) (2.99) (0.29)
Share price at year end (cents) 0.06 0.09 0.165
1 Three years of financial information provided as company only listed in February 2016.
No dividends were paid or declared during these financial years
Components of remuneration
Non-executive directors are remunerated with fees within the aggregate limit as approved by shareholders.
Name Annual Approved Fee
Robert Langford1 $90,000
Russell Yardley2 $90,000
Steve Bertamini $45,000
Gregory Baxter $45,000
Paul Brandling3 $45,000
(1) Appointed 8 February 2018
(2) Resigned 8 February 2018
(3) Resigned 2 October 2017
The executive directors and other KMP are remunerated based upon market value of the position and the range of
skills and experience they bring to the company and is split between fixed and performance linked remuneration.
Fixed remuneration consists of base remuneration and employer contributions to superannuation funds.
Performance linked remuneration includes short-term incentives and is designed to reward the Managing Director
(MD) and other KMP’s for meeting and exceeding their financial and personal objectives.
In February 2017 the Board established a Nominations and Remuneration Committee which was subsequently
disbanded in FY2018 with responsibility transferring back to the Board. Previously the Nominations and Review
Committee and now the Board has the responsibility of setting the Key Performance Indicators (KPI’s) for the MD
and have input to the KPI’s for the executives. KPI’s generally include measures relating to the Group, the relevant
business unit and the individual. At the conclusion of the year the Board will assess the performance of the MD,
and the MD assesses the performance of the individual executives against their targets. The MD’s
recommendations were presented to the Nominations and Remuneration Committee and now the Board for
approval.
The Board has implemented a Director Option Plan. The Option Plan is aimed at incentivising the Directors in
retaining key strategic skills. The options have been granted to the Directors vesting over three years with
exercising prices of $0.20, $0.24 and $0.288. Refer to tables on page 17 for options affecting remuneration in the
current and future reporting period.
At the 2017 Annual General Meeting (AGM), 97.3% of the votes received supported the adoption of the
remuneration report for the year ended 30 June 2017. The Company did not receive any specific feedback at the
AGM regarding its remuneration practices.

Tesserent Limited Financial Report 2018
Page 13
REMUNERTATION REPORT - AUDITED
Consolidated entity performance and link to remuneration
2018
Keith Glennan
Performance measures for Keith Glennan were set by the Board to reflect key measures impacting the growth in
revenue, profitability and shareholder value. Mr Glennan was entitled to a bonus of 100% of his base salary and
was set as follows:
• Growth in Total Contract Value over the 12 month period ending 30 June 2018 – 50% weighting
Most contracts sold and renewed are for period up to three years, with total contract value (TCV)
representing the future revenue to be recognised over the three year period. For businesses based on
annuity revenue, this represents a leading indicator for future revenue to be recognised.
• Growth in TCV associated with new product CyberBiz – 30% weighting
The Group launched CyberBiz as a new product in FY18, with growth in TCV recognised as the basis in
success for the launch of the product.
• Growth in share price – 20% weighting
Growth in share price represents the underlying measure in growth in shareholder value.
David Buerckner
• Cash bonus up to $20,000 including superannuation based on the outcome of annual performance review
with CEO – weighting 100%.
Karen Negus
• Cash bonus up to $30,000 including superannuation based on the outcome of annual performance review
with CEO – weighting 100%.
• Participation in the Tesserent sales commission plan with commission based on sales performance.
There were no other performance based remuneration measures.
2017
Keith Glennan
Entitlement to receive a bonus of 100% of base salary based on agreed performance measures. There were no
performance based measures set for Keith Glennan for FY2017.
David Buerckner
• Cash bonus up to $20,000 including superannuation based on the outcome of annual performance review
with CEO – weighting 100%.
Karen Negus
• Cash bonus up to $30,000 including superannuation based on the outcome of annual performance review
with CEO – weighting 100%.
There were no other performance based remuneration measures.
In respect of the current financial year, bonus payments were made to key management personnel and are outlined
on pages 14 and 15.
Tesserent Limited Financial Report 2018
Page 14
REMUNERTATION REPORT - AUDITED
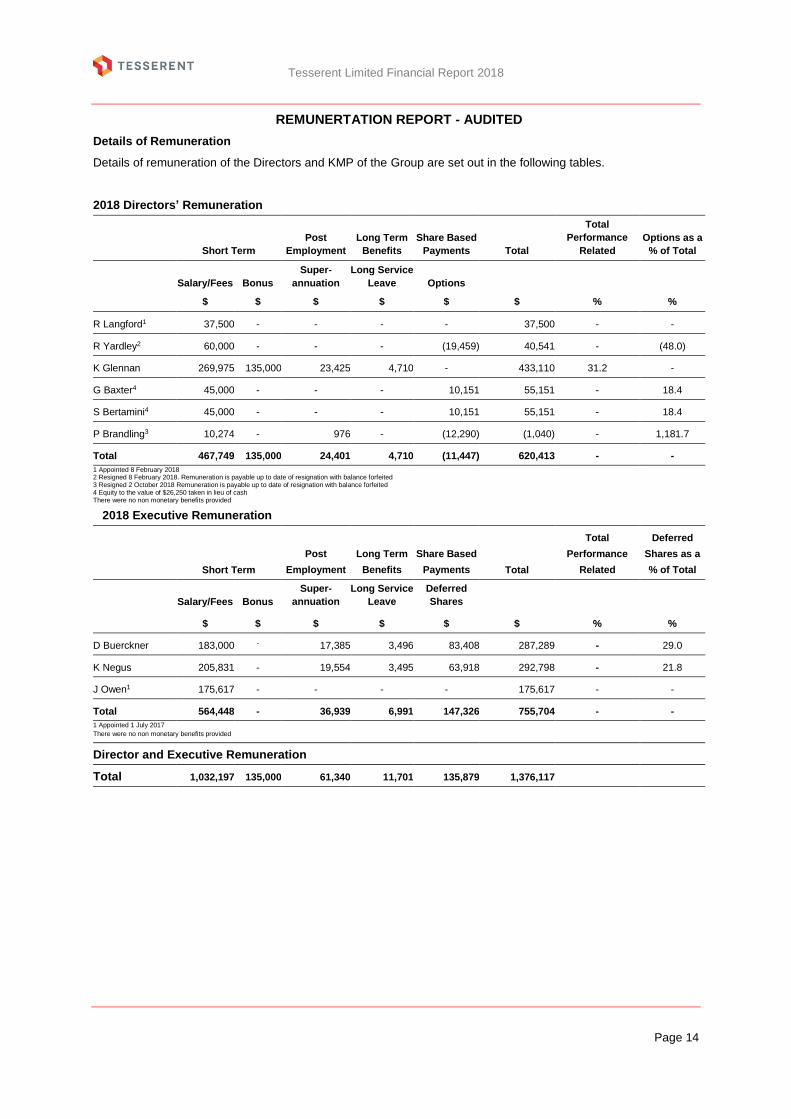
Details of Remuneration
Details of remuneration of the Directors and KMP of the Group are set out in the following tables.
2018 Directors’ Remuneration
Short Term
Post
Employment
Long Term
Benefits
Share Based
Payments Total
Total
Performance
Related
Options as a
% of Total
Salary/Fees
$
Bonus
$
Super-
annuation
$
Long Service
Leave
$
Options
$
$
%
%
R Langford1 37,500 - - - - 37,500 - -
R Yardley2 60,000 - - - (19,459) 40,541 - (48.0)
K Glennan 269,975 135,000 23,425 4,710 - 433,110 31.2 -
G Baxter4 45,000 - - - 10,151 55,151 - 18.4
S Bertamini4 45,000 - - - 10,151 55,151 - 18.4
P Brandling3 10,274 - 976 - (12,290) (1,040) - 1,181.7
Total 467,749 135,000 24,401 4,710 (11,447) 620,413 - -
1 Appointed 8 February 2018 2 Resigned 8 February 2018. Remuneration is payable up to date of resignation with balance forfeited 3 Resigned 2 October 2018 Remuneration is payable up to date of resignation with balance forfeited 4 Equity to the value of $26,250 taken in lieu of cash There were no non monetary benefits provided
2018 Executive Remuneration
Short Term
Post
Employment
Long Term
Benefits
Share Based
Payments Total
Total
Performance
Related
Deferred
Shares as a
% of Total
Salary/Fees
$
Bonus
$
Super-
annuation
$
Long Service
Leave
$
Deferred
Shares
$
$
%
%
D Buerckner 183,000 - 17,385 3,496 83,408 287,289 - 29.0
K Negus 205,831 - 19,554 3,495 63,918 292,798 - 21.8
J Owen1 175,617 - - - - 175,617 - -
Total 564,448 - 36,939 6,991 147,326 755,704 - -
1 Appointed 1 July 2017
There were no non monetary benefits provided
Director and Executive Remuneration
Total 1,032,197 135,000 61,340 11,701 135,879 1,376,117

Tesserent Limited Financial Report 2018
Page 15
REMUNERTATION REPORT - AUDITED
2017 Directors’ Remuneration
Short Term
Post
Employment
Long Term
Benefits
Share Based
Payments Total
Total
Performance
Related
Options as a
% of Total
Salary/Fees
$
Bonus
$
Super-
annuation
$
Long Service
Leave
$
Options
$
$
%
%
R Yardley 90,000 - - - 59,658 149,658 - 39.9
K Glennan 269,975 - 23,425 8,682 - 302,082 - -
G Baxter 45,000 - - - 29,829 74,829 - 39.9
S Bertamini 45,000 - - - 29,829 74,829 - 39.9
P Brandling 41,096 - 3,904 - 29,829 74,829 - 39.9
Total 491,071 - 27,329 8,682 149,145 676,227 - -
There were no non monetary benefits provided
2017 Executive Remuneration
Short Term
Post
Employment
Long Term
Benefits
Share Based
Payments Total
Total
Performance
Related
Deferred
Shares as a
% of Total
Salary/Fees
$
Bonus
$
Super-
annuation
$
Long Service
Leave
$
Deferred
Shares
$
$
%
%
D Buerckner1 124,901 13,6995 13,039 2,592 71,455 225,686 6.7 31.7
N Conolly2 75,592 - 7,158 - 306,687 389,437 - 78.8
K Hansen3 180,929 - 13,699 - 77,500 272,128 - 28.5
K Negus 152,195 22,8305 16,471 3,531 72,571 267,598 9.3 27.1
Total 533,617 36,529 50,367 6,123 528,213 1,154,849 - -
1 Appointed 3 October 2016
2 Resigned 30 November 2016
3 Ceased employment 21 March 2017
4 Performance related remuneration is continuity of employment
5 Cash bonus paid on outcome of annual performance review
There were no non monetary benefits provided
Director and executive remuneration
Total 1,024,688 36,529 77,696 14,805 677,358 1,831,076
Tesserent Limited Financial Report 2018
Page 16
REMUNERTATION REPORT - AUDITED
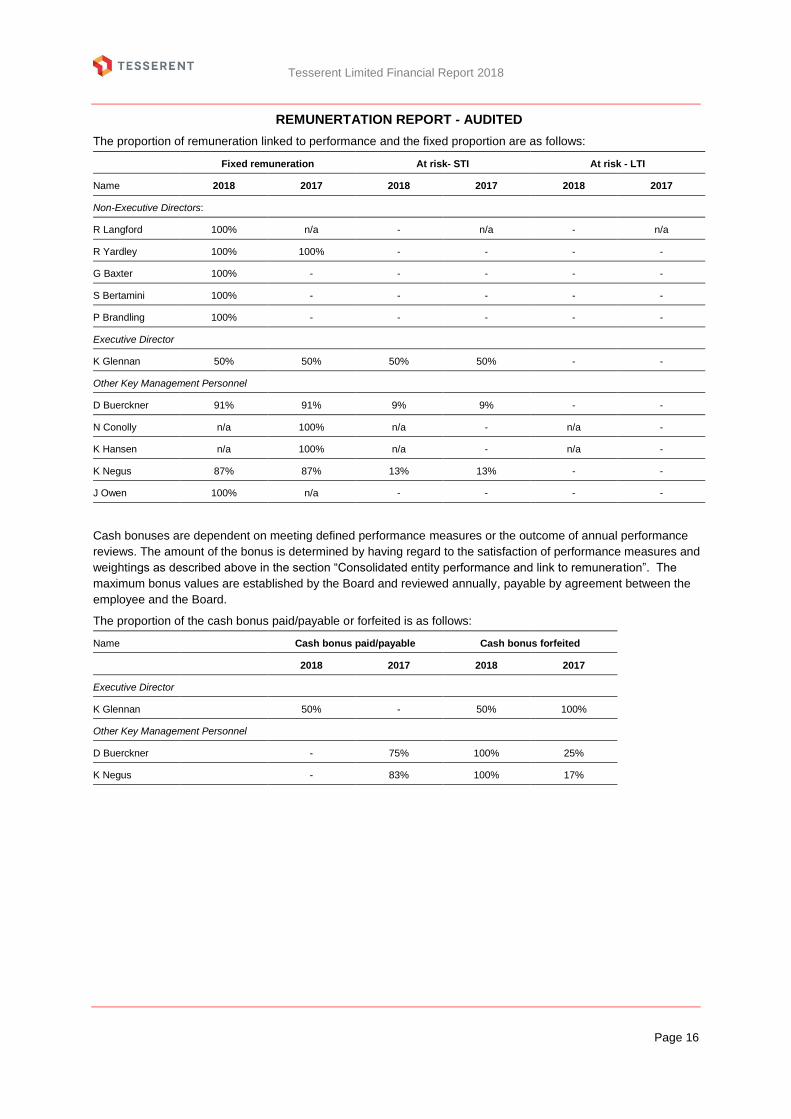
The proportion of remuneration linked to performance and the fixed proportion are as follows:
Fixed remuneration At risk- STI At risk - LTI
Name 2018 2017 2018 2017 2018 2017
Non-Executive Directors:
R Langford 100% n/a - n/a - n/a
R Yardley 100% 100% - - - -
G Baxter 100% - - - - -
S Bertamini 100% - - - - -
P Brandling 100% - - - - -
Executive Director
K Glennan 50% 50% 50% 50% - -
Other Key Management Personnel
D Buerckner 91% 91% 9% 9% - -
N Conolly n/a 100% n/a - n/a -
K Hansen n/a 100% n/a - n/a -
K Negus 87% 87% 13% 13% - -
J Owen 100% n/a - - - -
Cash bonuses are dependent on meeting defined performance measures or the outcome of annual performance
reviews. The amount of the bonus is determined by having regard to the satisfaction of performance measures and
weightings as described above in the section “Consolidated entity performance and link to remuneration”. The
maximum bonus values are established by the Board and reviewed annually, payable by agreement between the
employee and the Board.
The proportion of the cash bonus paid/payable or forfeited is as follows:
Name Cash bonus paid/payable Cash bonus forfeited
2018 2017 2018 2017
Executive Director
K Glennan 50% - 50% 100%
Other Key Management Personnel
D Buerckner - 75% 100% 25%
K Negus - 83% 100% 17%

Tesserent Limited Financial Report 2018
Page 17
REMUNERTATION REPORT - AUDITED
Details of Share Based Compensation
Options
There were no options issued in the current financial year.
The terms and conditions of each grant of options affecting remuneration in the current or future reporting periods
are as follows:
KMP Grant date No of options
Vesting and
exercise date Expiry date Exercise price
Value per option
at grant date % Vested
Steve Bertamini 17 Nov 15 500,000 31 Aug 17 31 Aug 19 $0.24 $0.0539 100
Steve Bertamini 17 Nov 15 500,000 31 Aug 18 31 Aug 19 $0.288 $0.0423 n/a
Gregory Baxter 17 Nov 15 500,000 31 Aug 17 31 Aug 19 $0.24 $0.0539 100
Gregory Baxter 17 Nov 15 500,000 31 Aug 18 31 Aug 19 $0.288 $0.0423 n/a
The number of options over ordinary shares in the company provided as remuneration to key management
personnel is shown below. The options carry no dividends or voting rights. The options will vest if the option holder
remains employed by the company at the relevant vesting date.
The table below shows a reconciliation of options held by each KMP from the beginning to the end of FY 2018.
2018
Name and
grant date
Balance at 1 Jul 2017 Unvested
Granted as compensation Vested Exercised
Lapsed / forfeited during
the year
% forfeited during the
year
Balance at 30 June 2018
Unvested
S Bertamini
17 Nov 15
17 Nov 15
500,000
500,000
-
-
500,000
-
-
-
-
-
-
-
-
500,000
G Baxter
17 Nov 15
17 Nov 15
500,000
500,000
-
-
500,000
-
-
-
-
-
-
-
-
500,000
P Brandling
17 Nov 15
17 Nov 15
500,000
500,000
-
-
500,000
-
-
-
-
500,000
-
50
-
-
R Yardley
17 Nov 15
17 Nov 15
1,000,000
1,000,000
-
-
1,000,000
-
-
-
-
1,000,000
-
50
-
-
Value of options granted as remuneration that have been granted, exercised or lapsed during the year.
2018
Balance
1 July 2017
$
Value Granted
$
Value Exercised
$
Value Lapsed
$
Balance
30 Jun 2018
$
Steve Bertamini 81,424 - - - 81,424
Gregory Baxter 81,424 - - - 81,424
Paul Brandling 81,424 - - (21,169) 60,255
Russell Yardley 162,848 - - (42,339) 120,509
Tesserent Limited Financial Report 2018
Page 18
REMUNERTATION REPORT - AUDITED
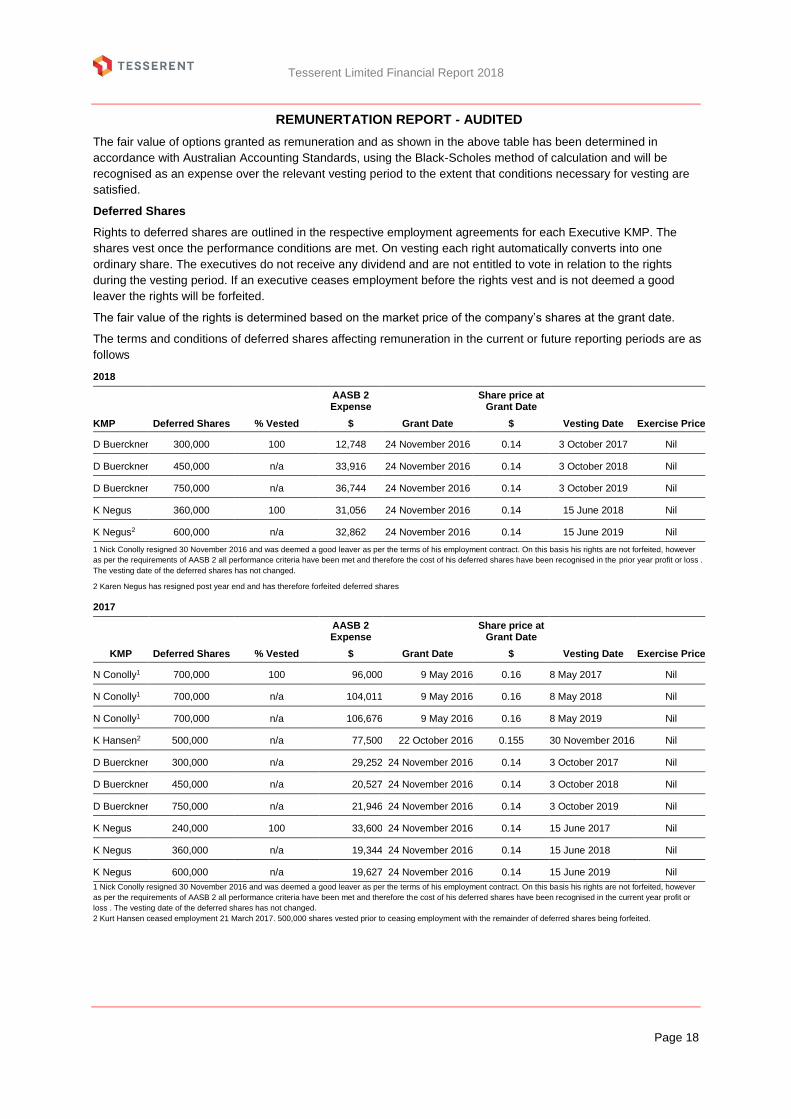
The fair value of options granted as remuneration and as shown in the above table has been determined in
accordance with Australian Accounting Standards, using the Black-Scholes method of calculation and will be
recognised as an expense over the relevant vesting period to the extent that conditions necessary for vesting are
satisfied.
Deferred Shares
Rights to deferred shares are outlined in the respective employment agreements for each Executive KMP. The
shares vest once the performance conditions are met. On vesting each right automatically converts into one
ordinary share. The executives do not receive any dividend and are not entitled to vote in relation to the rights
during the vesting period. If an executive ceases employment before the rights vest and is not deemed a good
leaver the rights will be forfeited.
The fair value of the rights is determined based on the market price of the company’s shares at the grant date.
The terms and conditions of deferred shares affecting remuneration in the current or future reporting periods are as
follows
2018
KMP Deferred Shares % Vested
AASB 2 Expense
$ Grant Date
Share price at Grant Date
$ Vesting Date Exercise Price
D Buerckner 300,000 100 12,748 24 November 2016 0.14 3 October 2017 Nil
D Buerckner 450,000 n/a 33,916 24 November 2016 0.14 3 October 2018 Nil
D Buerckner 750,000 n/a 36,744 24 November 2016 0.14 3 October 2019 Nil
K Negus 360,000 100 31,056 24 November 2016 0.14 15 June 2018 Nil
K Negus2 600,000 n/a 32,862 24 November 2016 0.14 15 June 2019 Nil
1 Nick Conolly resigned 30 November 2016 and was deemed a good leaver as per the terms of his employment contract. On this basis his rights are not forfeited, however
as per the requirements of AASB 2 all performance criteria have been met and therefore the cost of his deferred shares have been recognised in the prior year profit or loss .
The vesting date of the deferred shares has not changed.
2 Karen Negus has resigned post year end and has therefore forfeited deferred shares
2017
KMP Deferred Shares % Vested
AASB 2 Expense
$ Grant Date
Share price at Grant Date
$ Vesting Date Exercise Price
N Conolly1 700,000 100 96,000 9 May 2016 0.16 8 May 2017 Nil
N Conolly1 700,000 n/a 104,011 9 May 2016 0.16 8 May 2018 Nil
N Conolly1 700,000 n/a 106,676 9 May 2016 0.16 8 May 2019 Nil
K Hansen2 500,000 n/a 77,500 22 October 2016 0.155 30 November 2016 Nil
D Buerckner 300,000 n/a 29,252 24 November 2016 0.14 3 October 2017 Nil
D Buerckner 450,000 n/a 20,527 24 November 2016 0.14 3 October 2018 Nil
D Buerckner 750,000 n/a 21,946 24 November 2016 0.14 3 October 2019 Nil
K Negus 240,000 100 33,600 24 November 2016 0.14 15 June 2017 Nil
K Negus 360,000 n/a 19,344 24 November 2016 0.14 15 June 2018 Nil
K Negus 600,000 n/a 19,627 24 November 2016 0.14 15 June 2019 Nil
1 Nick Conolly resigned 30 November 2016 and was deemed a good leaver as per the terms of his employment contract. On this basis his rights are not forfeited, however
as per the requirements of AASB 2 all performance criteria have been met and therefore the cost of his deferred shares have been recognised in the current year profit or
loss . The vesting date of the deferred shares has not changed.
2 Kurt Hansen ceased employment 21 March 2017. 500,000 shares vested prior to ceasing employment with the remainder of deferred shares being forfeited.
Tesserent Limited Financial Report 2018
Page 19
REMUNERTATION REPORT - AUDITED
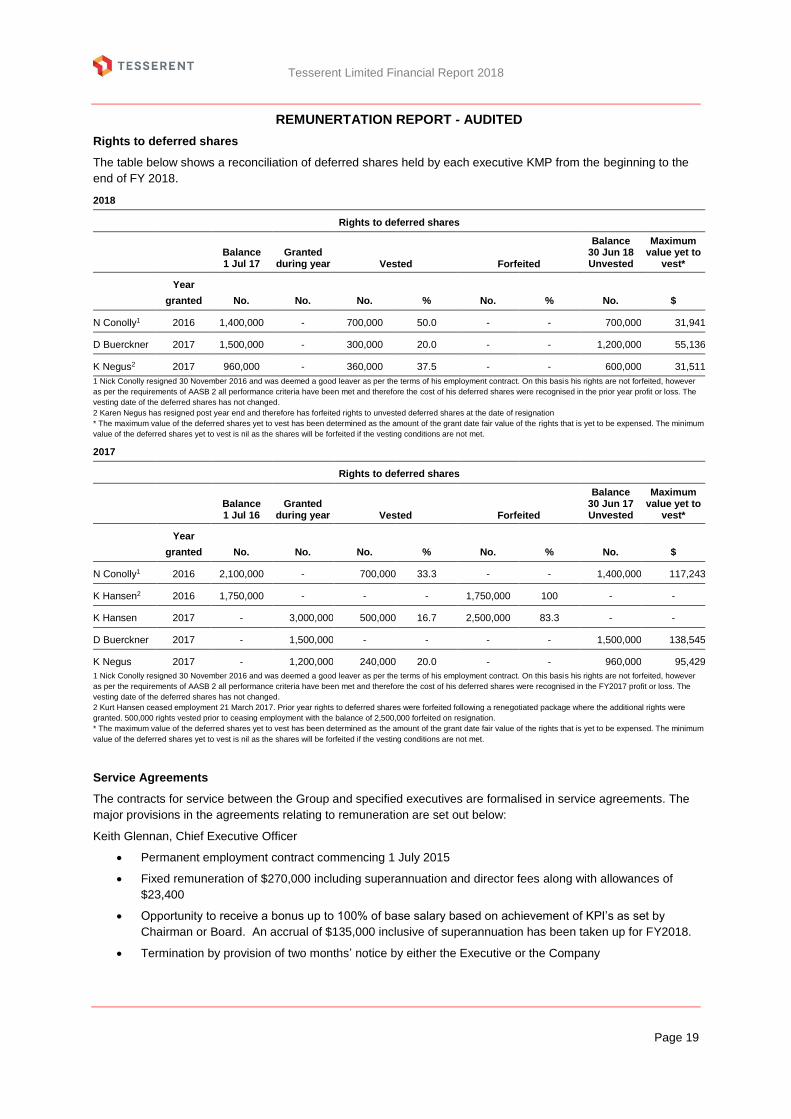
Rights to deferred shares
The table below shows a reconciliation of deferred shares held by each executive KMP from the beginning to the
end of FY 2018.
2018
Rights to deferred shares
Balance 1 Jul 17
Granted during year Vested Forfeited
Balance 30 Jun 18 Unvested
Maximum value yet to
vest*
Year
granted No. No. No. % No. % No. $
N Conolly1 2016 1,400,000 - 700,000 50.0 - - 700,000 31,941
D Buerckner 2017 1,500,000 - 300,000 20.0 - - 1,200,000 55,136
K Negus2 2017 960,000 - 360,000 37.5 - - 600,000 31,511
1 Nick Conolly resigned 30 November 2016 and was deemed a good leaver as per the terms of his employment contract. On this basis his rights are not forfeited, however
as per the requirements of AASB 2 all performance criteria have been met and therefore the cost of his deferred shares were recognised in the prior year profit or loss. The
vesting date of the deferred shares has not changed.
2 Karen Negus has resigned post year end and therefore has forfeited rights to unvested deferred shares at the date of resignation
* The maximum value of the deferred shares yet to vest has been determined as the amount of the grant date fair value of the rights that is yet to be expensed. The minimum
value of the deferred shares yet to vest is nil as the shares will be forfeited if the vesting conditions are not met.
2017
Rights to deferred shares
Balance 1 Jul 16
Granted during year Vested Forfeited
Balance 30 Jun 17 Unvested
Maximum value yet to
vest*
Year
granted No. No. No. % No. % No. $
N Conolly1 2016 2,100,000 - 700,000 33.3 - - 1,400,000 117,243
K Hansen2 2016 1,750,000 - - - 1,750,000 100 - -
K Hansen 2017 - 3,000,000 500,000 16.7 2,500,000 83.3 - -
D Buerckner 2017 - 1,500,000 - - - - 1,500,000 138,545
K Negus 2017 - 1,200,000 240,000 20.0 - - 960,000 95,429
1 Nick Conolly resigned 30 November 2016 and was deemed a good leaver as per the terms of his employment contract. On this basis his rights are not forfeited, however
as per the requirements of AASB 2 all performance criteria have been met and therefore the cost of his deferred shares were recognised in the FY2017 profit or loss. The
vesting date of the deferred shares has not changed.
2 Kurt Hansen ceased employment 21 March 2017. Prior year rights to deferred shares were forfeited following a renegotiated package where the additional rights were
granted. 500,000 rights vested prior to ceasing employment with the balance of 2,500,000 forfeited on resignation.
* The maximum value of the deferred shares yet to vest has been determined as the amount of the grant date fair value of the rights that is yet to be expensed. The minimum
value of the deferred shares yet to vest is nil as the shares will be forfeited if the vesting conditions are not met.
Service Agreements
The contracts for service between the Group and specified executives are formalised in service agreements. The
major provisions in the agreements relating to remuneration are set out below:
Keith Glennan, Chief Executive Officer
• Permanent employment contract commencing 1 July 2015
• Fixed remuneration of $270,000 including superannuation and director fees along with allowances of
$23,400
• Opportunity to receive a bonus up to 100% of base salary based on achievement of KPI’s as set by
Chairman or Board. An accrual of $135,000 inclusive of superannuation has been taken up for FY2018.
• Termination by provision of two months’ notice by either the Executive or the Company

Tesserent Limited Financial Report 2018
Page 20
REMUNERTATION REPORT - AUDITED
David Buerckner, Head of Security Operations
• Permanent employment contract commencing 3 October 2016
• Fixed remuneration of $200,385 including superannuation
• Opportunity to receive an annual bonus up to $20,000 inclusive of superannuation based on outcome of
annual review undertaken by CEO. No bonus was paid or accrued for the current year.
• Termination by provision of two months’ notice by either the Executive or the Company
Karen Negus, Head of Sales and Marketing
• Permanent employment contract commencing 15 June 2016 and updated 1 April 2017 when appointed to
Head of Sales and Marketing.
• Fixed remuneration of $200,385 inclusive of superannuation
• Sales commission of $25,000 inclusive of superannuation
• Opportunity to receive an annual bonus up to $30,000 inclusive of superannuation based on outcome of
annual review undertaken by CEO.
• Termination by provision of one months’ notice by either the Executive or the Company.
Justin Owen, Chief Financial Officer
• Permanent part time contract with CFO Effect Pty Ltd commencing 1 July 2017.
• Monthly retainer based remuneration of $9,650, plus additional fee for other projects undertaken.
Termination by provision of one months’ notice by either CFO Effect Pty Ltd or the Company.
KMP Shareholding 2018
Balance at
Beginning of
year
Deferred shares
vested as
remuneration
during year
Issued on
exercise of
options during
year Other changes during year
Balance at end
of year
On Market Other
R Langford 24,071,2821 - - - - 24,071,282
R Yardley 641,666 - - (639,114) (2,552)2 -
K Glennan 31,711,435 - - 50,000 (3,000,000)3 28,761,435
G Baxter 1,200,000 - - - 206,0434 1,406,043
S Bertamini 1,200,000 - - - 206,0434 1,406,043
P Brandling 1,200,000 - - (183,196) (1,016,804)2 -
D Buerckner - 300,000 - - - 300,000
K Negus 240,000 360,000 - - - 600,000
J Owen - - - 110,000 - 110,000
1) shares held at appointment date
2) shares held at resignation date
3) shares sold off market
4) shares received as share based payment for Director fee remuneration

Tesserent Limited Financial Report 2018
Page 21
REMUNERTATION REPORT - AUDITED
KMP Shareholding 2017
Balance at
Beginning of
year
Deferred shares
vested as
remuneration
during year
Issued on
exercise of
options during
year Other changes during year
Balance at end
of year
On Market Other
R Yardley 600,000 - - 41,666 - 641,666
K Glennan 31,451,435 - - 260,000 - 31,711,435
G Baxter 1,200,000 - - - - 1,200,000
S Bertamini 1,200,000 - - - - 1,200,000
P Brandling 1,200,000 - - - - 1,200,000
K Hansen 30,000 500,000 - 30,000 (560,000)1 -
D Buerckner - - - - - -
K Negus - 240,000 - - - 240,000
1) shares held at resignation date
Transactions with KMP and/or their related party
There were no transactions conducted between the Group and KMP or their related parties, apart from those disclosed
above relating to equity compensation, that were conducted other than in accordance with normal employee, customer
or supplier relationships on terms no more favourable than those reasonably expected under arm’s length dealings with
unrelated persons.
End Remuneration Report
This directors’ report, incorporating the remuneration report, is signed in accordance with a resolution of the Board of
Directors:
Robert Langford, Chairman
30 September 2018

Collins Square, Tower Four Level 18, 727 Collins Street Melbourne VIC 3008 GPO Box 5099 Melbourne VIC 3001 Australia
Tel: +61 3 9603 1700 Fax: +61 3 9602 3870 www.bdo.com.au
BDO East Coast Partnership ABN 83 236 985 726 is a member of a national association of independent entities which are all members of BDO Australia Ltd ABN 77 050 110 275, an Australian company limited by guarantee. BDO East Coast Partnership and BDO Australia Ltd are members of BDO International Ltd, a UK company limited by guarantee, and form part of the international BDO network of independent member firms. Liability limited by a scheme approved under Professional Standards Legislation, other than for the acts or omissions of financial services licensees.
DECLARATION OF INDEPENDENCE BY DAVID GARVEY TO THE DIRECTORS OF TESSERENT LIMITED
As lead auditor of Tesserent Limited for the year ended 30 June 2018, I declare that, to the best of my
knowledge and belief, there have been:
1. No contraventions of the auditor independence requirements of the Corporations Act 2001 in
relation to the audit; and
2. No contraventions of any applicable code of professional conduct in relation to the audit.
This declaration is in respect of Tesserent Limited and the entities it controlled during the period.
David Garvey
Partner
BDO East Coast Partnership
Melbourne, 30 September 2018
Page 22

Tesserent Limited Financial Report 2018
Page 23
CONSOLIDATED STATEMENT OF PROFIT OR LOSS AND OTHER COMPREHENSIVE INCOME
FOR THE YEAR ENDED 30 JUNE 2018
Consolidated
Note 2018
$
2017
$
Revenue from continuing operations 2.2 5,327,957 5,375,117
Other income 2.2 1,103,803 1,788,886
Software licence and connectivity fees (2,372,554) (2,347,575)
Employee benefits expense (2,662,491) (4,127,401)
Depreciation and amortisation expense (277,594) (617,303)
Goodwill written off 3.6 (777,375) -
Intellectual property assets written off 3.6 (67,736) -
Finance costs (68,777) (8,152)
Occupancy costs (458,351) (688,074)
Communication costs (595,152) (507,645)
Consulting and legal costs (568,993) (734,695)
Travel (78,135) (170,231)
Bad and doubtful debts 2.3 (51,185) (40,916)
Other expenses (1,174,244) (1,148,549)
(9,152,587) (10,390,541)
Loss before income tax (2,720,827) (3,226,538)
Tax expense 2.6 374,843 237,498
Net loss for the year (3,095,670) (3,464,036)
Other comprehensive income - -
Total comprehensive income for the year (3,095,670) (3,464,036)
Basic earnings per share (cents) 2.4 (2.62) (2.99)
Diluted earnings per share (cents) 2.4 (2.62) (2.99)
The above Statement of Profit or Loss and Other Comprehensive Income should be read in conjunction with the accompanying
notes

Tesserent Limited Financial Report 2018
Page 24
CONSOLIDATED STATEMENT OF FINANCIAL POSITION
AS AT 30 JUNE 2018
Consolidated
Note 2018
$
2017
$
ASSETS
CURRENT ASSETS
Cash and cash equivalents 4.3 1,717,221 2,860,648
Trade and other receivables 3.1 344,194 799,568
Prepayments 259,231 160,698
Inventories 55,693 25,981
Current tax asset 2.6 361,256 765,430
Other assets 834 834
TOTAL CURRENT ASSETS 2,738,429 4,613,159
NON-CURRENT ASSETS
Other financial assets 3.8 165,810 -
Plant and equipment 3.5 623,882 694,727
Intangible assets 3.6 733,848 867,572
Deferred tax asset 2.6 139,619 514,462
Other non-current assets 257,229 298,598
TOTAL NON-CURRENT ASSETS 1,920,388 2,375,359
TOTAL ASSETS 4,658,817 6,988,518
LIABILITIES
CURRENT LIABILITIES
Trade and other payables 3.2 1,210,577 1,277,767
Other financial liabilities 3.9 61,212 -
Unearned income 678,792 709,463
Provisions 3.3 269,266 646,464
TOTAL CURRENT LIABILITIES 2,219,847 2,633,694
NON-CURRENT LIABILITIES
Other financial liabilities 3.9 352,157 -
Provisions 3.3 365,117 206,541
TOTAL NON-CURRENT LIABILITIES 717,274 206,541
TOTAL LIABILITIES 2,937,121 2,840,235
NET ASSETS 1,721,696 4,148,283

Tesserent Limited Financial Report 2018
Page 25
CONSOLIDATED STATEMENT OF FINANCIAL POSITION
AS AT 30 JUNE 2018
Consolidated
Note 2018
$ 2017
$
EQUITY
Issued capital 4.4 10,875,937 10,140,892
Reserves 5.2 639,385 705,347
Accumulated losses (9,793,626) (6,697,956)
TOTAL EQUITY 1,721,696 4,148,283
The above Statement of Financial Position should be read in conjunction with the accompanying notes.
Tesserent Limited Financial Report 2018
Page 26
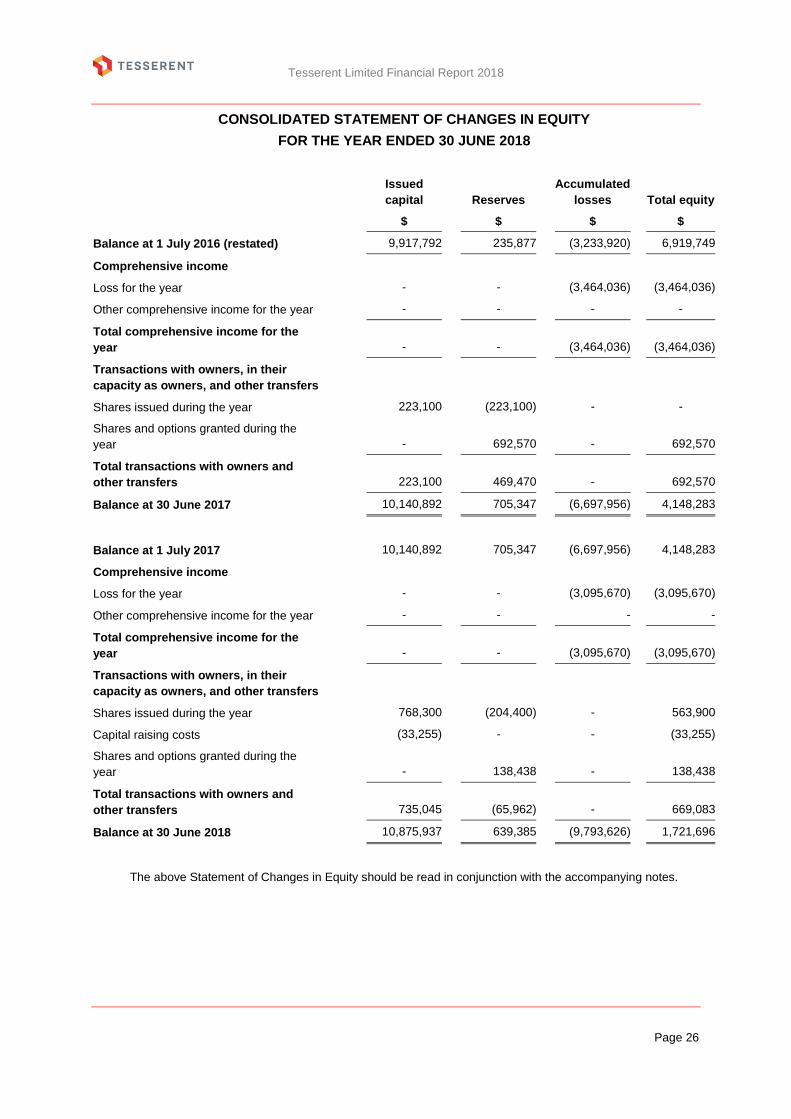
CONSOLIDATED STATEMENT OF CHANGES IN EQUITY
FOR THE YEAR ENDED 30 JUNE 2018
Issued
capital
Reserves
Accumulated
losses
Total equity
$ $ $ $
Balance at 1 July 2016 (restated) 9,917,792 235,877 (3,233,920) 6,919,749
Comprehensive income
Loss for the year - - (3,464,036) (3,464,036)
Other comprehensive income for the year - - - -
Total comprehensive income for the
year
-
-
(3,464,036)
(3,464,036)
Transactions with owners, in their
capacity as owners, and other transfers
Shares issued during the year 223,100 (223,100) - -
Shares and options granted during the
year
-
692,570
-
692,570
Total transactions with owners and
other transfers
223,100
469,470
-
692,570
Balance at 30 June 2017 10,140,892 705,347 (6,697,956) 4,148,283
Balance at 1 July 2017 10,140,892 705,347 (6,697,956) 4,148,283
Comprehensive income
Loss for the year - - (3,095,670) (3,095,670)
Other comprehensive income for the year - - - -
Total comprehensive income for the
year
-
-
(3,095,670)
(3,095,670)
Transactions with owners, in their
capacity as owners, and other transfers
Shares issued during the year 768,300 (204,400) - 563,900
Capital raising costs (33,255) - - (33,255)
Shares and options granted during the
year
-
138,438
-
138,438
Total transactions with owners and
other transfers
735,045
(65,962)
-
669,083
Balance at 30 June 2018 10,875,937 639,385 (9,793,626) 1,721,696
The above Statement of Changes in Equity should be read in conjunction with the accompanying notes.

Tesserent Limited Financial Report 2018
Page 27
CONSOLIDATED STATEMENT OF CASH FLOWS
FOR THE YEAR ENDED 30 JUNE 2018
Consolidated
Note 2018
$
2017
$
Cash flows from operations
Receipts from customers (inclusive of GST) 5,922,560 6,385,337
Payments to suppliers and employees (inclusive of GST) (8,219,859) (9,144,143)
(2,297,299) (2,758,806)
Income tax paid - (17,905)
Interest received 27,804 31,983
Interest and other finance costs paid (6,439) (8,152)
Research & development tax concession 844,010 -
Proceeds from transaction restructure 150,000 -
Net cash outflow from operating activities 5.5 (1,281,924) (2,752,880)
Cash flows from investing activities
Purchase of plant and equipment (84,633) (728,897)
Proceeds on disposal of plant and equipment 2.3 199,779 457,126
Purchase of intangibles – development costs capitalised (370,516) (260,040)
Payment of deferred settlement liability for software additions (215,428) -
Proceeds from deferred consideration on sale of software 250,000 -
Acquisitions of business, net of cash paid out - (500,000)
Payout on sale of customer contracts - (164,401)
Proceeds from sale of available-for-sale financial assets - 429,000
Proceeds from disposal of business - 3,000,000
Net cash (outflow)/inflow from investing activities (220,798) 2,232,788
Cash flows from financing activities
Proceeds from issuing of shares 392,550 -
Payments for issuing of shares (33,255) -
Net cash inflow from financing activities 359,295 -
Net decrease in cash and cash equivalents (1,143,427) (520,092)
Cash and cash equivalents at the beginning of the financial year 2,860,648 3,380,740
Cash and cash equivalents at the end of the financial year 4.3 1,717,221 2,860,648
The above Statement of Cash Flows should be read in conjunction with the accompanying notes
Tesserent Limited Financial Report 2018
Page 28
NOTES TO THE FINANCIAL STATEMENTS
FOR THE YEAR ENDED 30 JUNE 2018
1. Introduction to the Report
Statement of Compliance
These general purpose financial statements of Tesserent Limited and its controlled entities have been prepared in
accordance with the Accounting Standards and Interpretations issued by the Australian Accounting Standards Board
and the Corporations Act 2001. The consolidated financial statements comply with the International Financial
Reporting Standards (IFRS) as issued by the International Accounting Standards Board.
The financial statements were authorised for issue by the Board of Directors on 30 September 2018.
Basis of Preparation
Except for cash flow information, the financial statements have been prepared on an accruals basis and are based on
historical costs, modified, where applicable, by the measurement at fair value of selected non-current assets, financial
assets and financial liabilities.
General Information
Tesserent Limited is a listed public company limited by shares and domiciled in Australia. Its registered office and
place of business are:
Registered office
Level 5
990 Whitehorse Road
Box Hill VIC 3128
Principal place of business
Level 5
990 Whitehorse Road
Box Hill VIC 3128
Going concern
For the year ended 30 June 2018 the consolidated entity incurred a loss of $3,095,670 (2017: loss $3,464,036),
including the write down of intangible assets of $845,111, and had cash outflows from operating activities of
$1,281,924 (2017 outflows from operating activities: $2,752,880).
These financial statements have been prepared on the basis that the consolidated entity is a going concern, which
contemplates the continuity of its business, realisation of assets and settlement of its liabilities in the normal course of
business.
To this end the consolidated entity is expecting to fund its ongoing operations as follows:
• The consolidated entity has cash reserves at 30 June 2018 of $1.717 million and trade receivables of
$344,194.
• Subsequent to balance date the consolidated entity raised additional capital via the issue of shares of
$411,000.
• The consolidated entity is expecting to shortly receive a research & development receivable of $361,256.
• The directors have provided a commitment in writing to the company to provide working capital via loan
funding in the amount of $300,000 if the need arises, or $75,000 per director.
• Additionally, if the need arises, the directors have agreed that they would take remuneration in form of
equity.
• Included in current liabilities of $2,210,577 are amounts for deferred revenue of $678,792 which is not a
liability immediately payable.

Tesserent Limited Financial Report 2018
Page 29
• The Company is expecting an improvement in financial performance in the 30 June 2019 financial year and
the directors have approved a budget reflecting an improved financial performance. The directors also have
a plan to reduce operating costs if the need arises.
• The company has a history of successfully raising capital, and if the need arises, the directors are confident
that additional capital can be raised from existing and new shareholders.
Based on the above and cash flow forecasts prepared, the directors are of the opinion that the consolidated entity is well position to meet its objectives and obligations going forward and therefore that the basis upon which the financial statements are prepare is appropriate in the circumstances.
Critical accounting estimates and assumptions
The preparation of financial statements requires the use of certain critical accounting estimates. It also requires
management to exercise its judgment in the process of applying the Group’s accounting policies.
Accounting estimates and judgments Note Page
Impairment of goodwill 3.6 43
Taxation 2.6 36
Significant accounting policies
The significant accounting policies adopted in the preparation of the financial statements are set out below. Other
significant policies are contained in the notes to the financial statements to which they relate. The financial
statements are for the Group consisting of Tesserent Limited (company) and its controlled entities.
i. Principles of Consolidation
The consolidated financial statements incorporate all of the assets, liabilities and results of the parent
Tesserent Limited and all of the subsidiaries. Subsidiaries are entities the parent controls. A list of the
subsidiaries is provided in Note 5.1.
The assets, liabilities and results of all subsidiaries are fully consolidated into the financial statements of the
Group from the date on which control is obtained by the Group. Intercompany transactions, balances and
unrealised gains or losses on transactions between group entities are fully eliminated on consolidation.
Accounting policies of subsidiaries have been changed and adjustments made where necessary to ensure
uniformity of the accounting policies adopted by the Group.
ii. Foreign currency translation
Functional and presentation currency
The consolidated financial statements are presented in Australian dollars (AUD), which is also the functional
currency of the Company.
Foreign currency transactions and balances
Foreign currency transactions are translated into the functional currency of the respective Group entity,
using the exchange rates prevailing at the dates of the transactions (spot exchange rate). Foreign exchange
gains and losses resulting from the settlement of such transactions and from re-measurement of monetary
items at year end exchange rates are recognised in profit or loss.
Foreign operations
In the Group’s financial statements, all assets, liabilities and transactions of Group entities with a functional
currency other than the AUD are translated into AUD upon consolidation. The functional currency of the
entities in the Group has remained unchanged during the reporting period.
On consolidation, assets and liabilities have been translated into AUD at the closing rate at the reporting
date. Income and expenses have been translated into AUD at the average rate over the reporting period.
Exchange differences are changed or credited to other comprehensive income and recognised in the
currency translation reserve in equity.

Tesserent Limited Financial Report 2018
Page 30
iii. New Accounting Standards and Interpretations not yet adopted by the Group
Australian Accounting Standards and Interpretations that have recently been issued or amended but are not
yet mandatory, have not been early adopted by the company for the reporting period ended 30 June 2018.
Accounting Standards issued by the AASB that are not yet mandatorily applicable to the Group, together
with an assessment of the potential impact of such pronouncements on the Group when adopted in future
periods, are discussed below:
a. AASB 9: Financial Instruments and associated Amending Standards (applicable to annual reporting
periods beginning on or after 1 January 2018).
The Standard will be applicable retrospectively and includes revised requirements for the
classification and measurement of financial instruments, revised recognition and de-recognition
requirements for financial instruments and simplified requirements for hedge accounting.
The Group does not hold any complex financial assets or liabilities. Further, the Group does not
engage in any hedge accounting and as such, the Directors do not anticipate that the adoption of
AASB 9 will have a material impact on the Group’s financial instruments.
b. AASB 15: Revenue from Contracts with Customers (applicable to annual reporting periods
beginning on or after 1 January 2018, as deferred by AASB 2015-8: Amendments to Australian
Accounting Standards – Effective Date of AASB 15).
When effective, this Standard will replace the current accounting requirements applicable to
revenue with a single, principles-based model. Except for a limited number of exceptions, including
leases, the new revenue model in AASB 15 will apply to all contracts with customers as well as
non-monetary exchanges between entities in the same line of business to facilitate sales to
customers and potential customers.
The core principle of the Standard is that an entity will recognise revenue to depict the transfer of
promised goods or services to customers in an amount that reflects the consideration to which the
entity expects to be entitled in exchange for the goods or services. To achieve this objective, AASB
15 provides the following five-step process:
i. Identify the contract(s) with a customer
ii. Identify the performance obligations in the contract(s)
iii. Determine the transaction price
iv. Allocate the transaction price to the performance obligations in the contract(s); and
v. Recognise revenue when (or as) the performance obligations are satisfied.
While the directors are still assessing the impact AASB 15 will have on the Group’s income
recognition under contracts for services, it is expected that there will be no change to the
recognition of sales revenue which will continue to be recognised over the life of a contract as the
Group’s performance obligations are satisfied over time rather than on deployment. These
performance obligations under their contracts are not likely to be distinct and hence will be grouped
together as part of a single contract. This has been applied to all current contracts and agreements
in place and revenue recognised on this basis. Further analysis will be completed prior to the half
year 31 December 2018 financial report being released.
c. AASB 16: Leases (applicable to annual reporting periods beginning on or after 1 January 2019).
When effective, this Standard will replace the current accounting requirements applicable to leases
in AASB 117: Leases and related Interpretations. AASB 16 introduces a single lessee accounting
model that eliminates the requirement for leases to be classified as operating or finance leases.
The main changes introduced by the new Standard include:
i. Recognition of a right to use asset and liability for leases (excluding short term leases with
less than 12 months tenure and lease relating to low value assets)

Tesserent Limited Financial Report 2018
Page 31
ii. Depreciation of right to use assets in line with AASB 116 Property , Plant and Equipment
in profit or loss and unwinding of the liability in principal and interest components
iii. Variable lease payments that depend on an index or a rate are included in the initial
measurement of the lease liability using the index or rate at the commencement date; and
iv. Additional disclosure requirements.
The transitional provisions of AASB 16 allow a lessee to either retrospectively apply the Standard
to comparatives in line with AASB 108 or recognise the cumulative effect of retrospective
application as an adjustment to opening equity on the date of initial application.
The standard will affect primarily the accounting for the Group’s operating leases. As at reporting
date the Group has non-cancellable operating lease commitments of $2,053,010, see Note 4.5.
However, the Group has not yet determined to what extent these commitments will result in the
recognition of an asset and a liability for future payments and how this will affect the Group’s result
and classification of cash flows. Some of the commitments maybe covered by the exemption for
short-term and low value leases and some commitments may relate to arrangements that will not
qualify as leases under AASB16.
2. Business Result for the Year
This section provides the information that is most relevant to understanding the financial performance of the Group during the financial year and, where relevant, the accounting policies applied and the critical judgements and estimates made.
2.1 Segment information
Identification of reportable segments
An operating segment is a component of an entity that engages in business activities from which it may earn revenue and incur expenses, whose operating results are regularly reviewed by the Group’s Chief Operating Decision Maker (CODM) in order to effectively allocate Group resources and assess performance.
The Group has identified its operating segments based on the internal reports that are reviewed and used by the Chief Executive Officer (CEO) in the capacity of CODM. Two operating segments have been identified: IT Security Managed Services and Software Licensing.
The CEO reviews Profit before tax. The accounting policies adopted for internal reporting to the CEO are consistent with those adopted in the financial statements.

Tesserent Limited Financial Report 2018
Page 32
IT Security Managed Services
Software Licensing
Inter Segment
Eliminations
Totals
2018 $ $ $ $
Revenues
Sales to external customers 5,033,889 294,068 - 5,327,957
Inter segment sales 33,820 384,030 (417,850) -
Total sales revenue 5,067,709 678,098 (417,850) 5,327,957
Onerous provision write back - 399,279 - 399,279
Transaction restructure fee 150,000 - - 150,000
Research & development tax concession 457,741 - - 457,741
Other revenue 96,783 - - 96,783
Total revenue 5,772,233 1,077,377 (417,850) 6,431,760
Profit/(loss) before income tax expense (2,858,959) 138,132 - (2,720,827)
Total segment assets 11,356,346 686,832 (7,384,361) 4,658,817
Total segment liabilities 2,793,901 143,220 - 2,937,121
IT Security Managed Services
Software Licensing
Inter Segment
Eliminations
Totals
2017 $ $ $ $
Revenues
Sales to external customers 5,043,856 331,261 - 5,375,117
Inter segment sales 7,530 359,763 (367,293) -
Total sales revenue 5,051,386 691,024 (367,293) 5,375,117
Gain on sale of intellectual property 571,794 - - 571,794
Gain on sale of customer contracts 569,694 - - 569,694
Research & development tax concession 446,398 - - 446,398
Other revenue 201,000 - - 201,000
Total revenue 6,840,272 691,024 (367,293) 7,164,003
Profit/(loss) before income tax expense (3,680,868) 454,330 - (3,226,538)
Total segment assets 12,777,316 1,348,460 (7,137,258) 6,988,518
Total segment liabilities 2,233,724 606,511 - 2,840,235
Intersegment transactions
An internally determined transfer price is set for all intersegment sales. This price is reset quarterly and is based on what would be realised in the event the sale was made to an external party at arm’s length. All such transactions are eliminated on consolidation of the Group’s financial statements.
Corporate charges are allocated to reporting segments based on the segments’ overall proportion of revenue generation within the Group. The Board of Directors believes this is representative of likely consumption of head office expenditure that should be used in assessing segment performance and cost recoveries.
Intersegment loans payable and receivable are initially recognised at the consideration received/to be received net of transaction costs. If intersegment loans receivable and payable are not on commercial terms, these are not adjusted to fair value based on market interest rates. This policy represents a departure from that applied to the statutory financial statements.

Tesserent Limited Financial Report 2018
Page 33
Consolidated
2018
$
2017
$
Revenue from external customers attributable to:
Australia 5,033,889 4,943,686
International 294,068 431,431
Total 5,327,957 5,375,117
2.2 Revenue
Recognition and measurement
The Group recognises revenue when it is probable that the economic benefit will flow to the entity and the revenue can be reliably measured. Revenue is measured at the fair value of the consideration received or receivable.
Sale of Goods
Sale of goods revenue is recognised at the point of sale, which is where the customer has taken delivery of the goods, the risks and rewards are transferred to the customer and there is a valid sales contract. Amounts disclosed as revenue are net of sales returns and trade discounts.
Rendering of services
Revenue derived through licensing arrangements for customers who subscribe to Tesserent’s security infrastructure platform (for the provision of Security-as-a-Service) is recognised as the services are provided over the licensing period. The company has determined that these services are provided evenly over the term of the contract.
Revenue derived from the rental of hardware by customers is recognised consistently over the licensing period, in line with service delivery.
Revenue derived from the connectivity and related support services (including installation and setup of hardware) is recognised at the time the service is provided. On the basis that monthly unused support services do not accumulate, the company recognises revenue evenly over the term of the contract, in line with service delivery.
Other revenue
Other revenue is recognised when it is received or when the right to receive payment is established.
Consolidated
2018 2017
$ $
Revenue from continuing operations
Sales revenue 5,327,957 5,375,117
5,327,957 5,375,117
Other income
Transaction restructure fee1 150,000 -
Onerous provision writeback 399,279 -
Research and development tax concession 457,741 446,398
Interest 27,803 29,387
Gain on sale of intellectual property - 571,794
Gain on sale of customer contracts - 569,694
Other 68,980 171,613
1,103,803 1,788,886
1) The Company entered into a transaction restructure agreement with Family Zone Cyber Security Limited (ASX:FZO) agreeing to a variation of the existing Asset Sale Agreement. The restructure fee was recognised over the term of the restructured payment plan and has been recognised as cash received in operating activities within the statement of cash flows.

Tesserent Limited Financial Report 2018
Page 34
2.3 Loss for the year
Loss before income tax from continuing operations includes the following specific expenses
Consolidated
2018 2017
Employee benefits expense
- Defined contribution superannuation expense 200,119 298,111
- Research and development costs 614,149 1,050,348
Bad and doubtful debts expense
- Trade receivables 51,185 40,916
Occupancy costs
- Minimum lease payments 359,847 418,567
Profit on disposal of plant and equipment - 151,635
2.4 Earnings per share
Basic earnings per share Basic earnings per share is calculated by dividing the loss attributable to the owners of Tesserent Limited, excluding any costs of servicing equity other than ordinary shares, by the weighted average number of ordinary shares outstanding during the financial year, adjusted for bonus elements in ordinary shares issued during the financial year. Consolidated 2018
Cents 2017
Cents From continuing operations attributable to the ordinary equity holders of the company (2.62)
(2.99)
Total basic earnings per share attributable to the ordinary equity holders of the company (2.62)
(2.99)
Diluted earnings per share Diluted earnings per share adjusts the figures used in the determination of basic earnings per share to take into account the after income tax effect of interest and other financing costs associated with dilutive potential ordinary shares and the weighted average number of shares assumed to have been issued for no consideration in relation to dilutive potential ordinary shares. Consolidated 2018
Cents 2017
Cents From continuing operations attributable to the ordinary equity holders of the company1 (2.62)
(2.99)
Total diluted earnings per share attributable to the ordinary equity holders of the company1 (2.62)
(2.99)
1There are 7,000,000 options and 2,500,000 unvested deferred shares that have not been taken into account in determining diluted EPS because their effect is anti-dilutive.
Reconciliation of earnings used in calculating earnings per share Consolidated 2018
$ 2017
$ Basic earnings per share Loss attributable to the ordinary equity holders of the company used in calculating basic earnings per share:
From continuing operations (3,095,670) (3,464,036) Diluted earnings per share Loss attributable to the ordinary equity holders of the company used in calculating basic earnings per share:
From continuing operations (3,095,670) (3,464,036)
Tesserent Limited Financial Report 2018
Page 35
Weighted average number of shares used as the denominator
Consolidated 2018
Number 2017
Number Weighted average number of ordinary shares used as the denominator in calculating basic earnings per share 118, 368,498
115,738,337
Weighted average number of ordinary shares used as the denominator in calculating diluted earnings per share 118, 368,498
115,738,337
2.5 Business combinations
Business combinations occur where an acquirer obtains control over one or more businesses.
A business combination is accounted for by applying the acquisition method, unless it is a combination involving entities or businesses under common control. The business combination will be accounted for from the date that control is obtained, whereby the fair value of the identifiable assets acquired and liabilities (including contingent liabilities) assumed is recognised (subject to certain limited exemptions).
When measuring the consideration transferred in the business combination, any asset or liability resulting from a contingent consideration arrangement is also included. Subsequent to initial recognition, contingent consideration classified as equity is not remeasured and its subsequent settlement is accounted for within equity. Contingent consideration classified as an asset or liability is remeasured in each reporting period to fair value, recognising any change to fair value in profit or loss, unless the change in value can be identified as existing at acquisition date.
All transaction costs incurred in relation to business combinations, other than those associated with the issue of a financial instrument, are recognised as expenses in profit or loss when incurred.
The acquisition of a business may result in the recognition of goodwill or a gain from a bargain purchase.
Goodwill
Goodwill recognised as part of a business combination transaction is recognised in accordance with the
accounting policy note in section 3.6.
2018 There were no business combination transactions impacting Tesserent Limited for the year ended 30 June 2018 or in the prior year.

Tesserent Limited Financial Report 2018
Page 36
2.6 Taxation
The income tax income for the year comprises current tax income and deferred tax income.
Current tax
Current tax assets are measured at the amounts expected to be paid to be recovered from the relevant taxation
authority.
Deferred tax
Deferred income tax expense reflects movements in deferred tax asset and deferred tax liability balances during
the year as well as unused tax losses.
Except for business combinations, no deferred income tax is recognised from the initial recognition of an asset or
liability, where there is no effect on accounting or taxable profit or loss.
Deferred tax assets and liabilities are calculated at the tax rates that are expected to apply to the period when the
asset is realised or the liability is settled and their measurement also reflects the manner in which management
expects to recover or settle the carrying amount of the related asset or liability. With respect to non-depreciable
items of property, plant and equipment measured at fair value and items of investment property measured at fair
value, the related deferred tax liability or deferred tax asset is measured on the basis that the carrying amount of
the asset will be recovered entirely through sale.
Deferred tax assets relating to temporary differences and unused tax losses are recognised only to the extent that
it is probable that future taxable profit will be available against which the benefits of the deferred tax asset can be
utilised. Tax losses have not been recognised in the current year.
Offsetting balances
Current tax assets and liabilities are offset where a legally enforceable right of set-off exists and it is intended that
net settlement or simultaneous realisation and settlement of the respective asset and liability will occur. Deferred
tax assets and liabilities are offset where: (i) a legally enforceable right of set-off exists; and (ii) the deferred tax
assets and liabilities relate to income taxes levied by the same taxation authority on either the same taxable entity
or different taxable entities where it is intended that net settlement or simultaneous realisation and settlement of
the respective asset and liability will occur in future periods in which significant amounts of deferred tax assets or
liabilities are expected to be recovered or settled.
Tesserent Limited and its Australian subsidiaries have applied the tax consolidation legislation, which means that
these entities are taxed as a single entity. As a consequence, the deferred tax assets and deferred tax liabilities of
these entities have been offset in the consolidated financial statements.
i. Reconciliation of income tax expense to prima facie tax payable
Consolidated
2018 2017
$ $
Loss from continuing operations before income tax expense (2,720,827) (3,226,538)
Prima facie tax rate of 27.5% (2017:27.5%) 748,227 887,298
Tax effect of amounts which are not deductible/(taxable) in calculating
taxable income:
Share based payments not deductible (2,444) (46,762)
Amortisation customer contracts not deductible - (8,966)
Impairment of goodwill (213,778) -
Amortisation of intellectual property not deductible (18,628) (96,312)
Current year tax losses not recognised (680,437) (773,418)
Restate temporary differences - 69,497
Other non-deductible / assessable (195,222) (124,744)

Tesserent Limited Financial Report 2018
Page 37
Prior year adjustments (11,911) 17,439
Tax offset for R&D claim (650) (161,530)
Income tax expense (374,843) (237,498)
Income tax comprises of:
Current tax 680,437 333,304
Deferred tax 362,932 115,680
Adjustments to current tax for:
unrecognised temporary differences in prior periods 11,911 17,439
Restatement of deferred tax balances to current tax rate - 69,497
Current year tax losses not recognised (680,437) (773,418)
Income tax expense (374,843) (237,498)
ii. Deferred tax balances
Deferred tax comprises of temporary differences attributable to:
Tax losses - 85,776
Share issue costs 155,994 233,991
Provisions 160,481 224,908
Intangible assets (104,803) -
Other (72,053) (30,213)
139,619 514,462
Movement in balances
Tax
losses
Share
issue costs
Provisions Intangible
assets
Other Total
As at 1 July 2016 122,644 340,351 336,439 - (132,146) 667,288
Charged
- to profit or loss (36,868) (106,360) (111,531) - 101,933 (152,826)
As at 30 June 2017 85,776 233,991 224,908 - (30,213) 514,462
Charged to
- to profit or loss (85,776) (77,997) (64,427) (104,803) (41,840) (374,843)
As at 30 June 2018 - 155,994 160,481 (104,803) (72,053) 139,619
Carried forward tax losses of $5,386,930 have not brought to account as a deferred tax asset of $1,481,406.
Based on the value of tax losses incurred, the directors’ have formed an opinion that the business was not in a
position to satisfy the criteria for recognising these losses as a deferred tax asset. These losses remain available
for the Group to use in the future.
Under normal circumstances, the benefits of deferred tax losses not brought to account can only be realised in the
future if:
• assessable income is derived of a nature, and of an amount sufficient to enable the benefit from the
deductions to be realised
• conditions for deductibility imposed by law are complied with; and
• no changes in tax legislation adversely affect the realisation of the benefit from the deductions.
The directors on a regular basis will assess the recognition of the deferred tax assets.

Tesserent Limited Financial Report 2018
Page 38
iii. Franking credits
Consolidated
2018 2017
$ $
Franked dividends - -
Franking credits available for subsequent financial years based on a tax rate
of 27.5% 25,673 25,673
25,673 25,673
iv. Research and development
Consolidated
2018 2017
$ $
Current tax asset 361,256 765,430
The Group undertakes eligible research and development (R&D) activities and is therefore entitled to claim an R&D
offset under the R&D tax incentive as administered by The Australian Taxation Office and the Department of Industry,
Innovation and Science.
Key estimate and judgment: Taxation
The Group is subject to income taxes in Australia. Significant judgment is required in determining the provision for
income taxes. There are many transactions and calculations undertaken during the ordinary course of business
for which the ultimate tax determination is uncertain. Where the final tax outcome of these matters is different from
the amounts that were initially recorded, such differences will impact the current and deferred tax provisions in the
period in which such determination is made.
Diversity in practice exists around the accounting treatment of refundable R&D incentives, because the Australian
Accounting Standards do not specifically address R&D incentives. The Group has decided to record R&D
refundable tax incentives as other income.
Tesserent Limited Financial Report 2018
Page 39
3. Operating Assets and Liabilities
3.1 Trade and other receivables
Recognition and measurement
Trade and other receivables include amounts due from customers for goods sold and services performed in the
ordinary course of business. Receivables expected to be collected within 12 months of the end of the reporting
period are classified as current assets. All other receivables are classified as non-current assets.
Trade and other receivables are initially recognised at fair value and subsequently measured at amortised cost
using the effective interest method, less any provision for impairment. The amount of the impairment loss is
recognised in profit or loss within impairment losses on loans and receivables. When a trade receivable for which
an impairment allowance had been recognised becomes uncollectable in as subsequent period, it is written off
against the allowance account. Subsequent recoveries of amounts previously written off are credited against the
impairment losses on loans and receivables in profit or loss.
Consolidated
2018
$
2017
$
CURRENT
Trade receivables 253,779 382,734
Provision for impairment (21,185) (33,000)
232,594 349,734
Other receivables 111,600 449,834
111,600 449,834
Total current trade and other receivables 344,194 799,568
Unimpaired past due loans and receivables
Past due under 30 days 59,628 68,516
Past due 30 days to under 60 days 97,547 165,708
Past due 60 days to under 90 days 4,916 18,746
Past due 90 days and over 21,467 77,038
Total unimpaired past due loans and receivables 183,558 330,008
Total unimpaired loans and receivables 344,194 799,568
Unimpaired past due as a percentage of total unimpaired loans and
receivables
53% 41%
Unimpaired past due 30 days and over as a percentage of total
unimpaired loans and receivables
36% 33%
Reconciliation of provision for impairment
Opening provision 33,000 13,020
Additional provision 21,185 19,980
Write back of provision -
Receivables written off as uncollectible (33,000) -
Closing provision 21,185 33,000

Tesserent Limited Financial Report 2018
Page 40
3.2 Trade and other payables
Recognition and measurement
These amounts represent liabilities for goods and services provided to the Group prior to the end of the financial
year which are unpaid. The carrying amounts of trade and other payables are assumed to be the same as their
fair values due to their short term nature.
Consolidated
2018
$
2017
$
CURRENT
Trade payables 609,146 720,392
Sundry payables and accrued expenses 601,431 557,375
1,210,577 1,277,767
3.3 Provisions
Recognition and measurements
Provisions are recognised when the Group has a legal or constructive obligation, as a result of past events, for
which it is probable that an outflow of economic benefits will result and that outflow can be reliably measured.
Provisions are measured using the best estimate of the amounts required to settle the obligation at the end of the
reporting period.
Employee Benefits
The current portion of this liability includes all of the accrued annual leave and the unconditional entitlements to
long service leave where employees have completed the required period of service.
Long service leave
The liability for long service leave is measured as the present value of expected future payments to be made in
respect of services provided by employees up to the end of the reporting period using the projected unit credit
method. Consideration is given to expected future wage and salary levels, experience of employee departures
and periods of service. Expected future payments are discounted to their net present value at the end of the
reporting period using corporate bond rates.
Retirement benefit obligations
The Group makes payments to employees’ superannuation funds in line with the relevant superannuation
legislation. Contributions made are recognised as expenses when they arise.
Bonus schemes
The Group recognises a liability and an expense for bonuses on a formula that takes into consideration the profit
attributable to the Company’s shareholders after certain adjustments. The Group recognises a provision where
contractually obliged or where there is a past practice that has created a constructive obligation.

Tesserent Limited Financial Report 2018
Page 41
Onerous contracts
The Group has previously recognised a provision for contractual services to be provided to the Group which were
taken up as part of business combination transactions in the prior year. The Group is contractually obliged to
make payment for these services within 12 months of the end of the current financial year.
Consolidated
2018
$
2017
$
CURRENT
Employee benefits 269,266 231,904
Onerous contracts - 414,560
269,266 646,464
NON-CURRENT
Employee benefits 74,420 34,352
Onerous contracts - 1,005
Make good - premises 75,000 75,000
Lease incentive 215,697 96,183
365,117 206,540
Movement in provisions
Employee
benefits
Onerous
contracts
Make good
premises
Lease
incentive
Opening balance 266,256 415,565 75,000 96,183
Recognised in profit or loss during period 77,430 (415,565) - 119,514
Closing balance 343,686 - 75,000 215,697
3.4 Contingent liabilities
As at the reporting date, there were no material claims or disputes of a contingent nature against the Company
and its subsidiaries.
3.5 Plant and equipment
Recognition and measurement
Plant and equipment are measured on the cost basis and therefore carried at cost less accumulated depreciation
and any accumulated impairment. In the event the carrying amount of plant and equipment is greater than the
estimated recoverable amount, the carrying amount is written down immediately to the estimated recoverable
amount and impairment losses are recognised either in profit or loss. A formal assessment of recoverable amount
is made when impairment indicators are present.
The carrying amount of plant and equipment is reviewed annually by directors to ensure it is not in excess of the
recoverable amount from these assets. The recoverable amount is assessed on the basis of the expected net
cash flows that will be received from the asset’s employment and subsequent disposal. The expected net cash
flows have been discounted to their present values in determining recoverable amounts.
Subsequent costs are included in the asset’s carrying amount or recognised as a separate asset, as appropriate,
only when it is probable that future economic benefits associated with the item will flow to the Group and the cost
of the item can be measured reliably. All other repairs and maintenance are recognised as expenses in profit or
loss during the financial period in which they are incurred.

Tesserent Limited Financial Report 2018
Page 42
Depreciation
The depreciable amount of all fixed assets is depreciated on a straight-line basis over the asset’s useful life to the
consolidated group commencing from the time the asset is held ready for use. Leasehold improvements are
depreciated over the shorter of either the unexpired period of the lease or the estimated useful lives of the
improvements.
The depreciation rates used for each class of depreciable assets are:
Class of Fixed Asset Depreciation Rate
Furniture & Fixtures 10% to 100%
Leasehold improvements 14.3%
Hardware employed 66.67%
Plant & equipment 7.5% to 66.67%
Equipment leased to external parties 40%
The assets’ residual values and useful lives are reviewed, and adjusted if appropriate, at the end of each reporting
period. An asset’s carrying amount is written down immediately to its recoverable amount if the asset’s carrying
amount is greater than its estimated recoverable amount.
Consolidated
Furniture &
Fixtures
Hardware
employed
Leasehold
improvement
Equipment
for lease
Plant &
Equipment
Total
2018
Opening net book value 85,836 20,370 475,886 - 112,635 694,727
Additions 2,535 6,321 24,067 - 51,710 84,633
Disposals (783) - - - - (738)
Depreciation charge (16,478) (16,509) (65,409) - (56,299) (154,695)
Net book amount 71,110 10,182 434,544 - 108,046 623,882
2018
Cost 113,300 352,272 512,033 16,177 432,984 1,426,766
Accumulated depreciation (42,190) (342,090) (77,489) (16,177) (324,938) (802,884)
Net book amount 71,110 10,182 434,544 - 108,046 623,882
Consolidated
Furniture &
Fixtures
Hardware
employed
Leasehold
improvement
Equipment
for lease
Plant &
Equipment
Total
2017
Opening net book value 40,497 256,129 124,510 - 139,964 561,100
Additions 134,295 153,501 487,966 - 58,910 834,672
Disposals (77,618) (246,013) (122,808) - (20,135) (466,574)
Depreciation charge (11,338) (143,247) (13,782) - (66,104) (234,471)
Net book amount 85,836 20,370 475,886 - 112,635 694,727
2017
Cost 112,062 345,952 487,966 16,177 381,272 1,343,429
Accumulated depreciation (26,226) (325,582) (12,080) (16,177) (268,637) (648,702)
Net book amount 85,836 20,370 475,886 - 112,635 694,727

Tesserent Limited Financial Report 2018
Page 43
3.6 Intangibles
Recognition and measurement
Intangible assets acquired as part of a business combination, other than goodwill, are initially measured at their
fair value at the date of the acquisition. Intangible assets acquired separately are initially recognised at cost.
Indefinite life intangible assets are not amortised and are subsequently measured at cost less any impairment.
Finite life intangible assets are subsequently measured at cost less amortisation and any impairment. The gains or
losses recognised in profit or loss arising from the de-recognition of intangible assets are measured as the
difference between net disposal proceeds and the carrying amount of the intangible asset. The method and useful
lives of finite life intangible assets are reviewed annually. Changes in the expected pattern of consumption or
useful life are accounted for prospectively by changing the amortisation method or period.
Goodwill
Goodwill on acquisition of subsidiaries or businesses is included in intangible assets.
Goodwill is carried at cost less any accumulated impairment losses. Goodwill is calculated as the excess of the
sum of:
i) the consideration transferred;
ii) any non-controlling interest (determined under either the full goodwill or proportionate interest
method); and
iii) the acquisition date fair value of any previously held equity interest;
over the acquisition date fair value of net identifiable assets acquired.
Goodwill and intangible assets with an indefinite useful life are tested for impairment annually and are allocated to
the Group's cash-generating units or groups of cash-generating units, representing the lowest level at which
goodwill is monitored and not larger than an operating segment. Gains and losses on the disposal of an entity
include the carrying amount of goodwill related to the entity disposed of.
Impairment of assets
An impairment loss is recognised for the amount by which the asset’s carrying value exceeds its recoverable amount. The recoverable amount is the higher of an asset’s fair value less costs to sell and value in use. For the purposes of assessing impairment, assets are grouped at the lowest levels for which there are separately identifiable cash inflows which are largely independent of the cash inflows of other assets or groups of assets (CGUs).
The Group has impaired goodwill by $777,375 and intellectual property by $67,736 in 2018 (2017: nil).

Tesserent Limited Financial Report 2018
Page 44
Reconciliation
Reconciliations of the written down values at the beginning and end of the current financial period are set out
below:
Consolidated Goodwill Intellectual
property
Software Customer
contracts
Total
2018 $ $ $ $ $
Opening net book value 777,375 90,197 - - 867,572
Additions - 146 - - 146
Additions – acquisitions1 - - 463,769 - 463,769
Additions – capitalised
development costs
- - 370,370 - 370,370
Amortisation charges - - (122,898) - (122,898)
Impairment2 (777,375) (67,736) - - (845,111)
Balance 30 June 2018 - 22,607 711,241 - 733,848
2018
Cost - 22,607 834,139 - 856,746
Accumulated amortisation - - (122,898) - (122,898)
Net book amount - 22,607 711,241 - 733,848
(1) On 5th July 2017 Tesserent IP Pty Ltd acquired a perpetual licence deed for Software IP. Terms were provided by the vendor whereby payments totalling
USD675,000 are to be paid over a 5-year period. In recognising the intangible asset value, the Company has completed a present value of the payments using a
discount rate of 15.08%. A corresponding liability has also been recognised and disclosed as current and non-current other financial liabilities. The recognised
intangible is being amortised over 5 years.
(2) The company has undertaken a detailed review of all intangible assets at the CGU level. In conjunction with this review, the restructure of various OEM supplier
arrangements and the recently announced acquisition the goodwill capitalised on previous acquisitions has been written off.
Consolidated Goodwill Intellectual
property
Software Customer
contracts
Total
2017 $ $ $ $ $
Opening net book value 777,375 82,601 3,420,197 205,589 4,485,762
Additions - 7,596 252,444 - 260,040
Accumulated amortisation - (353,111) (29,603) (382,714)
Disposal - - (3,319,530) (175,986) (3,495,516)
Balance 30 June 2017 777,375 90,197 - - 867,572
2017
Cost 777,375 90,197 - - 867,572
Accumulated amortisation - - - - -
Net book amount 777,375 90,197 - - 867,572

Tesserent Limited Financial Report 2018
Page 45
Impairment testing
For the purpose of impairment testing, intangible assets with indefinite lives are allocated to the consolidated
entity’s cash generating units (CGU’s) as follows:
Consolidated
2018 2017
$ $
Goodwill – software licencing - 777,375
- 777,375
The Group tests whether there has been any impairment of the goodwill on an annual basis with the most recent
review being completed as at 30 June 2018. In conjunction with this review the performance of the CGU and
associated future cashflows, which have been impacted by the restructure of various OEM supplier arrangements,
the goodwill capitalised on previous acquisition has been written off.
Key estimate and judgment
The recoverable amount of the CGU’s is determined based on value-in-use calculations, determined by discounting
future cash flows to be generated from the continuing use of the business. Management’s determination of cash
flow projections and gross margins are based on past performance and future expectations which require the use of
assumptions.
The calculations use cash flow projections based on actuals covering year 1. The present value of future cash
flows for each CGU for years two to five have been calculated using a terminal growth rate of 2% and a pre-tax
discount rate of 21.74% has been used to determine a value in use.
3.7 Inventory
Inventory is stated at the lower of cost and net realisable value. Costs of purchased inventory are determined after
deducting rebates and discounts. Net realisable value is the estimated selling price in the ordinary course of
business less the estimated costs of completion and the estimated costs necessary to make the sale.
As at 30 June 2018 there had been no write downs and all inventories are stated at cost. (2017:$nil)
3.8 Other financial assets
Call option investment
Recognition and measurement
The call option represents an investment whereby the company has the right but not obligation to acquire the underlying asset. Where this option is exercised by providing notice, the option investment is offset against the predeterminable purchase price of the underlying asset. Where the option is exercised via notice, the counterparty has the right to cancel the option upon notice however must refund the full cost of the option.
The call option has initially been recognised at cost less any impairment. The carrying amount of the option is reviewed annually by the directors to ensure it is not in excess of its recoverable amount. The carrying value of the call option investment has been assessed by the directors to represent fair value.
Where the intention of the company is to exercise the option within 12 months of the balance date, the investment will be recorded as a current asset. If the intention is to exercise after 12 months, the investment will be recorded as a non-current asset.

Tesserent Limited Financial Report 2018
Page 46
Consolidated
2018 2017
$ $
Non-current assets 165,810 -
Call Option investment1 165,810 -
1) During the period the company purchased a call option providing Tesserent with the right but not obligation to acquire a cyber security business based in the United Kingdom. The option expires 21 December 2019 and if exercised prior to expiry the amount paid for the option is offset against the purchase price of the business. If the counterparty decides not to proceed with the sale, the call option investment is redeemed in full by the counterparty.
3.9 Other financial liabilities
Deferred settlement liability
Recognition and measurement
Deferred settlement liability is recognised when the company has a legal or constructive obligation, as a result of a past event, for which an outflow of economic benefits will result and that outflow can be reliably measured. Future payments are discounted to their net present value at contract commencement using a discount rate of 15.08%.
The difference between actual payments and the discounted amount is recognised as a finance cost.
Where the discounted payment is due within 12 months of the balance date, the deferred settlement liability will be recorded as a current liability. The balance is represented as non-current.
Consolidated
2018 2017
$ $
Current 61,212 -
Non-current 352,157 -
4. Capital Management
The Group’s objective when managing capital is to:
• Safeguard their ability to continue as a going concern, so that they can provide returns to shareholders;
and
• Maintain an optimal capital structure to reduce the cost of capital.
In order to maintain or adjust the capital structure, the Group may adjust the amount of dividends paid to shareholders, return capital to shareholders, issue new shares or sell assets to reduce debt.
For the purpose of analysis the Group defines capital as fully paid ordinary shares.
4.1 Borrowings
Recognition and measurement
Borrowings are initially recognised at fair value, net of transaction costs incurred. Borrowings are subsequently
measured at amortised cost. Any difference between the proceeds (net of transaction costs) and the redemption
amount is recognised in profit or loss over the period of the borrowings using the effective interest method.
Borrowings are classified as current liabilities unless the Group has an unconditional right to defer settlement of
the liability for at least 12 months after the end of the reporting period.
The Group has no borrowings for the current year (2017:$nil)

Tesserent Limited Financial Report 2018
Page 47
4.2 Financial risk management
The Group’s activities expose it to a variety of financial risks: market risk (including foreign currency risk and
interest rate risk), credit risk and liquidity risk. The Group’s overall risk management program focuses on the
unpredictability of financial markets and seeks to minimise potential adverse effects on the financial performance
of the Group. The Group uses different methods to measure different types of risk to which it is exposed. These
methods include sensitivity analysis in the case of interest rate, foreign exchange and other price risks, ageing
analysis for credit risk.
Market risk
Foreign currency risk
The Group undertakes certain transactions denominated in foreign currency and is exposed to foreign currency
risk through foreign exchange rate fluctuations.
Foreign exchange risk arises from future commercial transactions and recognised financial assets and financial
liabilities denominated in a currency that is not the entity’s functional currency. The risk is measure using
sensitivity analysis and cash flow forecasting. The risk is not significant as the Group has an immaterial amount of
transactions denominated in foreign currency.
Interest rate risk
Interest rate risk is the risk that the fair value of future cash flows of a financial instrument will fluctuate as a result
of changes in market interest rates.
The table below outlines the variance interest rate on cash at bank.
2018 2017
Weighted
average
interest rate
Balance Weighted
average interest
rate
Balance
% $ % $
Cash at bank 1.47 1,717,221 1.31 2,860,648
Net exposure to cash flow interest rate
risk
1,717,221 2,860,648
Sensitivity analysis
A change of 100 basis points in interest rates at the reporting date would have increased/decreased equity and
profit/loss for the period by the amounts shown below. This analysis assumes that all other variables remain
constant. The analysis is performed on the same basis for the comparative period.
Impact on profit/loss for the period
2018 2017
Increase in interest rates 18,863 21,869
Decrease in interest rates (18,863) (21,869)
Credit risk
Credit risk is the risk that one party to a financial instrument will cause a financial loss for the other party by failing
to discharge an obligation. The maximum exposure to credit risk, excluding the value of any collateral or other
security, at balance date of recognised financial assets is the carrying amount of those assets, net of any
provisions for impairment of those assets, as disclosed in consolidated statement of financial position and notes to
the consolidated financial statements.

Tesserent Limited Financial Report 2018
Page 48
Credit risk arises from cash and cash equivalents, deposits with banks and financial institutions, as well as credit
exposures to customers including receivables and committed transactions.
Collectability of trade receivables is reviewed on an ongoing basis. Debts which are known to be uncollectable are
written off by reducing the carrying amount directly. An allowance account (provision for impairment of trade
receivables) is used when there is objective evidence that the Group will not be able to collect all amounts due
according to the original terms of the receivables. Significant financial difficulties of the debtor, probability that the
debtor will enter bankruptcy or financial reorganisations, and default or delinquency in payments (more than 30
days overdue) are considered indicators that the trade receivable is impaired. The amount of the impairment
allowance is the difference between the asset’s carrying amount and the present value of estimated future cash
flows, discounted at the original effective interest rate. Refer to Note 3.1 for schedule of unimpaired past due
receivables.
The Group does not have any significant credit risk to any single counterparty given the large number of
customers.
Liquidity risk
Prudent liquidity risk management requires the Group to maintain sufficient liquid assets and available borrowing
facilities to be able to pay debts as and when they become due and payable.
The Group manages liquidity risk by maintaining adequate cash reserves and by continuously monitoring actual
and forecast cash flows and matching the maturity profiles of financial assets and liabilities.
Amounts presented below represent the future undiscounted principal and interest cash flows.
Maturity analysis
Consolidated – 2018 1 year or
less
Between
1 and 2
years
Between
2 and 5
years
Over 5
years
Remaining
contractual
maturities
$ $ $ $ $
Non-interest bearing
Trade payables 609,146 - - - 609,146
Other payables 60,827 - - - 60,827
Accrued expenses 540,604 - - - 540,604
Deferred settlement liability 61,212 70,443 281,714 - 413,369
1,271,789 70,443 281,714 - 1,623,946
Consolidated – 2017 1 year or
less
Between
1 and 2
years
Between
2 and 5
years
Over 5
years
Remaining
contractual
maturities
$ $ $ $ $
Non-interest bearing
Trade payables 720,392 - - - 720,392
Other payables 243,144 - - - 243,144
Accrued expenses 314,231 - - - 314,231
1,277,767 - - - 1,277,767
The cash flows in the maturity analysis above are not expected to occur significantly earlier than contractually disclosed
above.
Fair value of financial instruments
Unless otherwise stated, the carrying amounts of financial instruments reflect their fair value.
Tesserent Limited Financial Report 2018
Page 49
4.3 Cash and cash equivalents
Recognition and measurement
For the purpose of presentation in the statement of cash flows, cash and cash equivalents includes cash on hand,
deposits held at call with financial institutions, other short-term, highly liquid investments with original maturity dates of
three months or less that are readily convertible to known amounts of cash and which are subject to an insignificant risk
of changes in value, and bank overdrafts.
Consolidated
2018
$
2017
$
Cash at bank 867,221 2,788,469
Term deposits 850,000 72,179
1,717,221 2,860,648
4.4 Contributed equity
Recognition and measurement
Ordinary fully paid shares are classified as equity. Incremental costs directly attributable to the issue of new shares or options
are show in equity as a deduction, net of tax, from the proceeds.
All issued ordinary shares are fully paid. Holders of these shares are entitled to dividends as declared from time to time and
are entitled to one vote per share at General meetings of the Company. All ordinary shares rank equally with regard to the
Company’s residual assets.
Consolidated
2018 2017 2018 2017
Shares Shares $ $
Ordinary shares – fully paid 126,041,546 116,774,600 10,875,937 10,140,892
Movements in ordinary share capital
Details
Date Shares Issue price
$
$
2017
Balance 1 Jul 2016 115,334,600 9,917,792
Shares issued to employees 30 Nov 2016 500,000 0.16 77,500
Shares issued to employees 8 May 2017 700,000 0.16 112,000
Shares issued to employees 15 Jun 2017 240,000 0.14 33,600
116,774,600 10,140,892
2018
Balance 116,774,600 10,140,892
Shares issued to employees 23 Oct 2017 300,000 42,000
Shares issued to employees 16 May 2018 700,000 0.16 112,000
Shares issued to directors 18 May 2018 412,086 0.91 37,500
Equity settled expense 18 May 2018 352,000 0.075 26,400
Shares issued pursuant to capital raising 4 Jun 2018 7,142,860 0.07 500,000
Capital raise costs (33,255)
Shares issued to employees 21 Jun 2018 360,000 50,400
126,041,546 10,875,937

Tesserent Limited Financial Report 2018
Page 50
4.5 Commitments
Information Technology and Communication (ITC) service commitments
The Group enters into contracts for the provision of ITC services with suppliers for which there are minimum spend
requirements. Service commitments contracted at the end of the reporting period but which are not recognised as
liabilities, are as follows:
Consolidated
2018
$
2017
$
Within one year 580,234 397,383
Later than one year but not later than five years 823,333 382,775
1,403,567 780,158
Lease commitments
The Group leases its offices under a non-cancellable operating lease. Commitments in relation to this lease
contracted for at the end of each reporting period but not recognised as liabilities, are as follows:
Consolidated
2018
$
2017
$
Within one year 237,051 222,723
Later than one year but not later than five years 1,700,090 1,477,852
Greater than five years 115,869 575,158
2,053,010 2,275,733
4.6 Dividends
No dividends were paid or declared for the current or prior period.
5. Other
5.1 Related party transactions
Controlled entities The consolidated financial statements include the financial statements of Tesserent Limited and its controlled entities. The 100% controlled entities are as follows: Tesserent Australia Pty Ltd – acquired 15 July 2015 Tesserent Wholesale Pty Ltd – acquired 15 July 2015 Tesserent IP Pty Ltd (Previously 443 IP Pty Ltd) – acquired 15 July 2015 Tesserent UK Ltd – incorporated in the UK 20 May 2015 (dormant) Apart from Tesserent UK Ltd all companies operate in Australia.
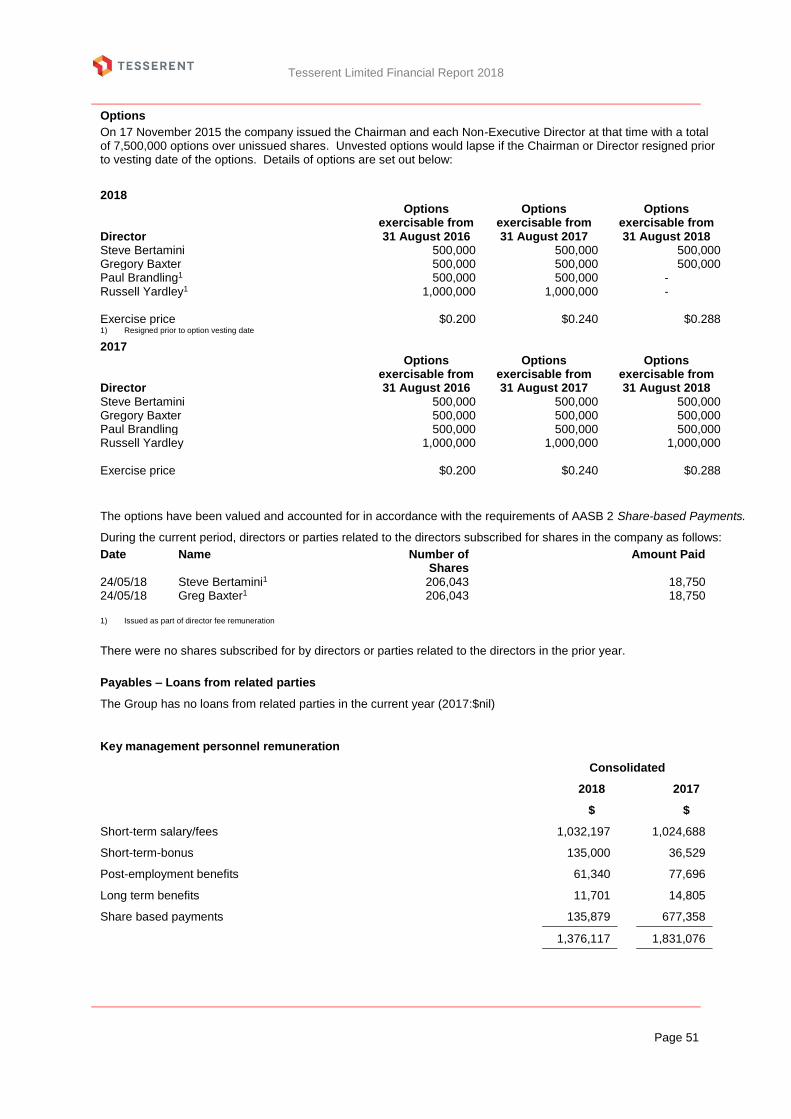
Tesserent Limited Financial Report 2018
Page 51
Options
On 17 November 2015 the company issued the Chairman and each Non-Executive Director at that time with a total of 7,500,000 options over unissued shares. Unvested options would lapse if the Chairman or Director resigned prior to vesting date of the options. Details of options are set out below:
2018
Director
Options exercisable from 31 August 2016
Options exercisable from 31 August 2017
Options exercisable from 31 August 2018
Steve Bertamini 500,000 500,000 500,000 Gregory Baxter 500,000 500,000 500,000 Paul Brandling1 500,000 500,000 - Russell Yardley1 1,000,000 1,000,000 - Exercise price $0.200 $0.240 $0.288 1) Resigned prior to option vesting date 2017
Director
Options exercisable from 31 August 2016
Options exercisable from 31 August 2017
Options exercisable from 31 August 2018
Steve Bertamini 500,000 500,000 500,000 Gregory Baxter 500,000 500,000 500,000 Paul Brandling 500,000 500,000 500,000 Russell Yardley 1,000,000 1,000,000 1,000,000 Exercise price $0.200 $0.240 $0.288
The options have been valued and accounted for in accordance with the requirements of AASB 2 Share-based Payments.
During the current period, directors or parties related to the directors subscribed for shares in the company as follows:
Date Name Number of Shares
Amount Paid
24/05/18 Steve Bertamini1 206,043 18,750 24/05/18 Greg Baxter1 206,043 18,750 1) Issued as part of director fee remuneration
There were no shares subscribed for by directors or parties related to the directors in the prior year.
Payables – Loans from related parties
The Group has no loans from related parties in the current year (2017:$nil)
Key management personnel remuneration
Consolidated
2018
$
2017
$
Short-term salary/fees 1,032,197 1,024,688
Short-term-bonus 135,000 36,529
Post-employment benefits 61,340 77,696
Long term benefits 11,701 14,805
Share based payments 135,879 677,358
1,376,117 1,831,076

Tesserent Limited Financial Report 2018
Page 52
Share based payments
Equity-settled share-based compensation benefits are provided to employees and directors.
Equity-settled transactions are awards of shares, or options over shares, that are provided to employees and directors in exchange for the rendering of services.
The cost of equity-settled transactions are measured at fair value on grant date. Fair value is independently determined using the Black-Scholes option pricing model that takes into account the exercise price, the term of the option, the impact of dilution, the share price at grant date and expected price volatility of the underlying share, the expected dividend yield and the risk free interest rate for the term of the option, together with non-vesting conditions that do not determine whether the consolidated entity receives the services that entitle the employees to receive payment. No account is taken of any other vesting conditions.
The cost of equity-settled transactions are recognised as an expense with a corresponding increase in equity over the vesting period. The cumulative charge to profit or loss is calculated based on the grant date fair value of the award, the best estimate of the number of awards that are likely to vest and the expired portion of the vesting period. The amount recognised in profit or loss for the period is the cumulative amount calculated at each reporting date less amounts already recognised in previous periods.
To determine the value of options issued, an independent valuation was prepared using the Black-Scholes model. In valuing the options a risk-free rate of 2%, a volatility rate of 40%, dividend yield of 0%, share price of $0.20 and time to expiry of four years were used. The 40% volatility rate was determined by reference to a broad set of ASX-listed comparable companies. The value as determined was amortised over the vesting period of the option.
Set out below are summaries of options movements during the year
2018
Grant date
Expiry
date
Exercise
price
$
Balance at
the start of
the year Granted Exercised
Expired/
forfeited/
other
Balance at
the end of
the year
17 Nov 15 31 Aug 19 0.20 2,500,000 - - - 2,500,000
17 Nov 15 31 Aug 19 0.24 2,500,000 - - - 2,500,000
17 Nov 15 31 Aug 19 0.288 2,500,000 - - 1,500,000 1,000,000
9 May 16 8 May 18 0.30 500,000 - - 500,000 -
9 May 16 8 May 19 0.40 500,000 - - - 500,000
9 May 16 8 May 20 0.50 500,000 - - - 500,000
Total 9,000,000 - - 2,000,000 7,000,000
Weighted average exercise price $0.269 $0.00 $0.00 $0.291 $0.263
2017
Grant date
Expiry
date
Exercise
price
$
Balance at
the start of
the year Granted Exercised
Expired/
forfeited/
other
Balance at
the end of
the year
17 Nov 15 31 Aug 19 0.20 2,500,000 - - - 2,500,000
17 Nov 15 31 Aug 19 0.24 2,500,000 - - - 2,500,000
17 Nov 15 31 Aug 19 0.288 2,500,000 - - - 2,500,000
9 May 16 8 May 18 0.30 500,000 - - - 500,000
9 May 16 8 May 19 0.40 500,000 - - - 500,000
9 May 16 8 May 20 0.50 500,000 - - - 500,000
Total 9,000,000 - - - 9,000,000
Weighted average exercise price $0.269 $0.400 $0.00 $0.00 $0.269

Tesserent Limited Financial Report 2018
Page 53
Value of deferred share rights is based on the market price of the share at rights issue date.
Set out below are summaries of deferred share rights movements during the year
2018
Grant date
Vesting
date
Share
price at
grant date
$
Balance at
the start of
the year Granted
Shares
issued
Expired/
forfeited/
other
Balance at
the end of
the year
9 May 16 8 May 18 0.16 700,000 - 700,000 - -
9 May 16 8 May 19 0.16 700,000 - - - 700,000
24 Nov 16 3 Oct 17 0.14 300,000 - 300,000 - -
24 Nov 16 3 Oct 18 0.14 450,000 - - - 450,000
24 Nov 16 3 Oct 19 0.14 750,000 - - - 750,000
24 Nov 16 15 Jun 18 0.14 360,000 - 360,000 - -
24 Nov 16 15 Jun 19 0.14 600,000 - - - 600,000
Total 3,860,000 - (1,360,000) - 2,500,000
2017
Grant date
Vesting
date
Share
price at
grant date
$
Balance at
the start of
the year Granted
Shares
issued
Expired/
forfeited/
other
Balance at
the end of
the year
9 May 16 8 May 17 0.16 700,000 - (700,000) - -
9 May 16 8 May 18 0.16 700,000 - - - 700,000
9 May 16 8 May 19 0.16 700,000 - - - 700,000
16 Jun 16 30 Jun 17 0.17 250,000 - - (250,000) -
16 Jun 16 30 Jun 18 0.17 500,000 - - (500,000) -
16 Jun 16 30 Jun 19 0.17 1,000,000 - - (1,000,000) -
22 Oct 16 30 Nov 16 0.155 - 500,000 (500,000) - -
22 Oct 16 31 Mar 17 0.155 - 250,000 - (250,000) -
22 Oct 16 30 Jun 17 0.155 - 750,000 - (750,000) -
22 Oct 16 30 Sep 17 0.155 - 250,000 - (250,000) -
22 Oct 16 31 Dec 17 0.155 - 250,000 - (250,000) -
22 Oct 16 31 Mar 18 0.155 - 250,000 - (250,000) -
22 Oct 16 30 Jun 18 0.155 - 750,000 - (750,000) -
24 Nov 16 3 Oct 17 0.14 - 300,000 - - 300,000
24 Nov 16 3 Oct 18 0.14 - 450,000 - - 450,000
24 Nov 16 3 Oct 19 0.14 - 750,000 - - 750,000
24 Nov 16 15 Jun 17 0.14 - 240,000 (240,000) - -
24 Nov 16 15 Jun 18 0.14 - 360,000 - - 360,000
24 Nov 16 15 Jun 19 0.14 - 600,000 - - 600,000
Total 3,850,000 5,700,000 (1,440,000) (4,250,000) 3,860,000

Tesserent Limited Financial Report 2018
Page 54
5.2 Reserves
Recognition and measurement
The share-based payment reserve is used to recognise:
• the fair value of options issued to Directors and employees which have not been exercised;
• the fair value of shares issued to Directors and employees; and
• other share-based payment transactions.
The cost of shares and options over shares issued to Directors and employees are measured as set out in the
related parties note in section 5.1.
Consolidated
2018
$
2017
$
Share based payment reserve
Opening balance 705,347 235,877
Share based compensation recognised during the year 138,438 692,570
Shares issued to employees (204,400) (223,100)
Closing balance 639,385 705,347
5.3 Parent entity information
The individual financial statements for the parent entity show the following aggregate amounts:
Consolidated
2018
$
2017
$
Statement of financial position
Current assets 1,951,554 1,798,641
Non-current assets 305,429 5,467,177
Total assets 2,256,983 7,265,818
Current liabilities 378,245 164,204
Total liabilities 378,245 164,204
Issued share capital 9,266,691 8,531,645
Reserves 639,385 705,347
Accumulated loss (8,027,338) (2,135,378)
Total equity 1,878,738 7,101,614
Included with non-current assets is a net intercompany receivable of $4,576,765 that the directors have impaired
in the current year.
Loss for the year 5,764,689 1,343,544
Contingent liabilities of the parent entity
The parent entity did not have any contingent liabilities as at 30 June 2018 or 2017.

Tesserent Limited Financial Report 2018
Page 55
Guarantees entered into by the parent entity
The parent entity did not have any guarantees as at 30 June 2018 or 2017.
5.4 Remuneration of auditors
Consolidated
2018
$
2017
$
Audit and assurance services 89,000 96,000
Tax services 45,025 99,400
Total remuneration 134,025 195,400
5.5 Cash flow information
a) Reconciliation of cash flow from operating activities
Consolidated
2018
$
2017
$
Loss after tax for the year (3,095,670) (3,464,036)
Depreciation and amortisation 277,594 617,303
Goodwill written off 777,375 -
Intellectual property assets written off 67,736 -
Share based payments 175,938 692,570
Bad and doubtful debts 51,185 40,916
Profit on sale of plant and equipment - (29,751)
Profit on sale software intellectual property - (571,794)
Profit on sale customer contracts - (569,694)
Loss on sale of shares - 13,446
Decrease/(increase) in trade and other receivables 88,260 (35,640)
Increase in prepayments (98,533) (71,631)
Increase in inventory (29,711) (61,171)
Decrease/(increase) in current tax asset 404,174 (483,156)
Decrease/(increase) in other assets 41,370 (133,361)
Decrease in deferred tax assets 374,843 197,412
(Decrease)/increase in trade and other liabilities (67,192) 527,396
(Decrease)/increase in unearned income (30,671) 771,785
Decrease in current provisions (377,198) (193,474)
Increase in non-current provision 158,576 -
Net cash outflow from operating activities (1,218,924) (2,752,880)

Tesserent Limited Financial Report 2018
Page 56
5.6 Events occurring after the reporting period
On 27 July 2018 the Company announced that a binding term sheet, subject to conditions precedent, had been
signed to acquire ICT company Asta Solutions Pty Ltd (Asta). Asta is an Australian based business with more
than 200 clients serviced by over 85 staff from offices in Melbourne, Sydney and Auckland. The purchase price is
4 times EBITDA and expected to result in a purchase price of $3.8m. Purchase consideration will be a
combination of cash and equity. It is anticipated that the transaction will complete no later than end of December
2018.
On the 8 July 2018 the Company announced the results of the share purchase plan(SPP), noting that $304,000
had been raised from existing shareholders who participated in the SPP. These funds have been received in full.
Apart from the matters noted above, the directors are not aware of any other significant events since the end of
the reporting period.
Tesserent Limited Financial Report 2018
Page 57
DIRECTORS’ DECLARATION
In the opinion of the Directors’ of Tesserent Limited
a) the financial statements and notes, as set out on pages 23 to 56, are in accordance with the
Corporations Act 2001, including:
(i) giving a true and fair view of the consolidated entity’s financial position as at 30 June 2018
and of its performance for the year ended on that date; and
(ii) complying with Accounting Standards and the Corporations Regulations 2001 and other
mandatory professional reporting requirements; and
(iii) as stated in note 1, the consolidated financial statements also comply with International
Financial Reporting Standards
b) there are reasonable grounds to believe that the company will be able to pay its debts as and when
they become due and payable; and
c) the Directors’ have been given the declarations required by s 295A of the Corporations Act 2001 for
the financial year ended 30 June 2018.
d) the remuneration disclosures included at pages 11 to 21 of the Directors Report (Audited
Remuneration Report) for the year ended 30 June 2018 comply with section 300A of the
Corporations Act 2001
Signed in accordance with a resolution of the Directors’ made pursuant to section 295(5) of the
Corporations Act 2001.
On behalf of the Directors,
Robert Langford
Chairman
Melbourne, 30 September 2018

Collins Square, Tower Four Level 18, 727 Collins Street Melbourne VIC 3008 GPO Box 5099 Melbourne VIC 3001 Australia
Tel: +61 3 9603 1700 Fax: +61 3 9602 3870 www.bdo.com.au
BDO East Coast Partnership ABN 83 236 985 726 is a member of a national association of independent entities which are all members of BDO Australia Ltd ABN 77 050 110 275, an Australian company limited by guarantee. BDO East Coast Partnership and BDO Australia Ltd are members of BDO International Ltd, a UK company limited by guarantee, and form part of the international BDO network of independent member firms. Liability limited by a scheme approved under Professional Standards Legislation, other than for the acts or omissions of financial services licensees.
INDEPENDENT AUDITOR'S REPORT
To the members of Tesserent Limited
Report on the Audit of the Financial Report
Opinion
We have audited the financial report of Tesserent Limited (the Company) and its subsidiaries (the Group), which
comprises the consolidated statement of financial position as at 30 June 2018, the consolidated statement of
profit or loss and other comprehensive income, the consolidated statement of changes in equity and the
consolidated statement of cash flows for the year then ended, and notes to the financial report, including a
summary of significant accounting policies and the directors’ declaration.
In our opinion the accompanying financial report of the Group, is in accordance with the Corporations Act 2001,
including:
(i) Giving a true and fair view of the Group’s financial position as at 30 June 2018 and of its financial
performance for the year ended on that date; and
(ii) Complying with Australian Accounting Standards and the Corporations Regulations 2001.
Basis for opinion
We conducted our audit in accordance with Australian Auditing Standards. Our responsibilities under those
standards are further described in the Auditor’s Responsibilities for the Audit of the Financial Report section of
our report. We are independent of the Group in accordance with the Corporations Act 2001 and the ethical
requirements of the Accounting Professional and Ethical Standards Board’s APES 110 Code of Ethics for
Professional Accountants (the Code) that are relevant to our audit of the financial report in Australia. We have
also fulfilled our other ethical responsibilities in accordance with the Code.
We confirm that the independence declaration required by the Corporations Act 2001, which has been given to the
directors of the Company, would be in the same terms if given to the directors as at the time of this auditor’s
report.
We believe that the audit evidence we have obtained is sufficient and appropriate to provide a basis for our
opinion.
Key audit matters
Key audit matters are those matters that, in our professional judgement, were of most significance in our audit of
the financial report of the current period. These matters were addressed in the context of our audit of the
financial report as a whole, and in forming our opinion thereon, and we do not provide a separate opinion on these
matters. We have determined the matters described below to be the key audit matters to be communicated in our
report.

Impairment of Goodwill
Key audit matter How the matter was addressed in our audit
Refer to Note 3.6 Intangibles of the accompanying
financial statements.
At the beginning of the financial year, the Group had
intangible assets of $867,572, consisting of goodwill of
$777,375 and intellectual property of $90,197.
The Group is required to perform an annual impairment
test of indefinite life intangible assets in accordance
with Australian Accounting Standards. The assessment
of impairment of the Group’s intangible asset balances
incorporates significant judgment in respect of several
factors such as discount rates, revenue growth and cost
assumptions.
The impairment assessment resulted in a non-cash
impairment of goodwill of $867,572 and intellectual
property of $67,736, associated with the Software
Licensing cash-generating-unit.
Given the level of judgment involved by the Group in
preparing the model that assessed impairment and the
quantum of the impairment charge recognised, we
determined that this was a key audit matter.
Our audit procedures included, amongst others:
• Considering the appropriateness of the
methodology applied by the Group in performing
the impairment assessment, including the process
undertaken and rationale supporting the
impairment recognised.
• Evaluating the assumptions and methodologies
used by management, in particular those relating
to the forecasted cash flows and discount rate.
• Challenging management’s assumptions used in
the impairment assessment, including those
relating to forecast revenue, costs, capital
expenditure, discount rate and corroborated the
key market related assumptions to external data.
• Assessing the historical accuracy of forecasting
and performed a sensitivity analysis on the
discount rate, forecasted revenue and terminal
growth assumptions on the Cash Generating Unit.
• Reviewing the adequacy of the Group’s disclosures
in the financial statements surrounding the
impairment of indefinite life intangible assets.
Going Concern
Key audit matter How the matter was addressed in our audit
Refer to Note 1 Going concern of the accompanying
financial statements.
The Group has incurred losses and negative operating
cash flows for the year ended 30 June 2018.
The Group’s use of the going concern basis of
preparation and the associated extent of uncertainty is
a key audit matter. We used a high level of judgement
to evaluate the Group’s assessment of its ability to
continue operating as a going concern.
In Note 1 “Going concern” of the financial report, the
Directors have documented their considerations and
have determined that the going concern basis of
preparation is the appropriate basis of accounting.
The Group’s assessment of going concern was based on
future cash flow forecasts. The preparation of these
Our audit procedures included, amongst others:
• Reviewing cash-flow forecasts and challenging
management’s assumptions around future
revenue, operating costs, and associated cash
flows.
• Analysing the impact of reasonable possible
changes in cash flow forecasts and their timing by
applying sensitivities to key inputs including
future revenue and operating costs.
• Assessing management’s accuracy to forecast
based on previous years’ actual results and our
knowledge of the Group.
• Considering the impact of management’s
assumption around reduction of operating costs.

Key audit matter How the matter was addressed in our audit
forecasts incorporated a number of assumptions and
judgments. The Directors have concluded that the
range of possible outcomes considered in arriving at
this judgment does not give rise to a material
uncertainty casting significant doubt on the Group's
ability to continue as a going concern.
We assessed the Group’s forecasts, including the
Directors’ assumptions regarding the timing of future
cash flows and operating results which are uncertain by
nature. This assessment required significant audit
attention in determining the appropriate conclusion
surrounding going concern.
• Sensitising cash flow forecasts based on actual
results compared to budget.
• Assessing the director’s ability to raise sufficient
funds to support operations based on historic
success of capital raising.
• Considering the Directors’ willingness to provide
funding, if necessary.
• Reviewing subsequent events as they pertain to
actual financial performance and cash levels of
the Group.
• Assessing the adequacy of the Group's disclosures
within the financial statements.
Other information
The directors are responsible for the other information. The other information comprises the information
contained in the Directors’ Report for the year ended 30 June 2018, but does not include the financial report and
our auditor’s report thereon, which we obtained prior to the date of this auditor’s report, and the Annual Report,
which is expected to be made available to us after that date.
Our opinion on the financial report does not cover the other information and we do not express any form of
assurance conclusion thereon.
In connection with our audit of the financial report, our responsibility is to read the other information identified
above and, in doing so, consider whether the other information is materially inconsistent with the financial report
or our knowledge obtained in the audit or otherwise appears to be materially misstated.
If, based on the work we have performed on the other information that we obtained prior to the date of this
auditor’s report, we conclude that there is a material misstatement of this other information, we are required to
report that fact. We have nothing to report in this regard.
When we read the Annual Report, if we conclude that there is a material misstatement therein, we are required to
communicate the matter to the directors and will request that it is corrected. If it is not corrected, we will seek
to have the matter appropriately brought to the attention of users for whom our report is prepared.
Responsibilities of the directors for the Financial Report
The directors of the Company are responsible for the preparation of the financial report that gives a true and fair
view in accordance with Australian Accounting Standards and the Corporations Act 2001 and for such internal
control as the directors determine is necessary to enable the preparation of the financial report that gives a true
and fair view and is free from material misstatement, whether due to fraud or error.
In preparing the financial report, the directors are responsible for assessing the ability of the group to continue as
a going concern, disclosing, as applicable, matters related to going concern and using the going concern basis of
accounting unless the directors either intend to liquidate the Group or to cease operations, or has no realistic
alternative but to do so.
Auditor’s responsibilities for the audit of the Financial Report
Our objectives are to obtain reasonable assurance about whether the financial report as a whole is free from
material misstatement, whether due to fraud or error, and to issue an auditor’s report that includes our opinion.
Reasonable assurance is a high level of assurance, but is not a guarantee that an audit conducted in accordance
with the Australian Auditing Standards will always detect a material misstatement when it exists. Misstatements
can arise from fraud or error and are considered material if, individually or in the aggregate, they could
reasonably be expected to influence the economic decisions of users taken on the basis of this financial report.
A further description of our responsibilities for the audit of the financial report is located at the Auditing and
Assurance Standards Board website (http://www.auasb.gov.au/Home.aspx) at:
http://www.auasb.gov.au/auditors_files/ar2.pdf
This description forms part of our auditor’s report.
Report on the Remuneration Report
Opinion on the Remuneration Report
We have audited the Remuneration Report included in pages 11 to 21 of the directors’ report for the year ended
30 June 2018.
In our opinion, the Remuneration Report of Tesserent Limited, for the year ended 30 June 2018, complies with
section 300A of the Corporations Act 2001.
Responsibilities
The directors of the Company are responsible for the preparation and presentation of the Remuneration Report in
accordance with section 300A of the Corporations Act 2001. Our responsibility is to express an opinion on the
Remuneration Report, based on our audit conducted in accordance with Australian Auditing Standards.
BDO East Coast Partnership
David Garvey
Partner
Melbourne, 1 October 2018