test 12--nchrp report 350 test 3-11 of the modified texas ... · and the posts exceed the plastic...
TRANSCRIPT

Technical Report Documentation Page
1. Report No. I 2. Government Accession No. 3. Recipient's Catalog No. FHW AfTX -00/1804-10
4. Title and Subtitle 5. Report Date TEST 12-NCHRP REPORT 350 TEST 3-11 OF THE MODIFIED TEXAS TYPE February 2000 T6 BRIDGE RAIL ON BRIDGE DECK 6. Performing Organi7.ation Code
7. Author(s) 8. Perfonning Organization Report No. C. Eugene Buth, William F. Williams, Roger P. Bligh, and Letter Report 1804-10 Wanda L. Menges
9. Performing Organization Name and Address 10. Work Unit No. (TRAIS) Texas Transportation Institute The Texas A&M University System II. Contract or Grant No. College Station, Texas 77843-3135 Project No. 0-1804
12. Sponsoring Agency Name and Address 13. Type of Report and Period Covered Texas Department of Transportation Letter Report: Research and Technology Transfer Office September 1997-January 2000 P. O. Box 5080 Austin, Texas 78763-5080
14. Sponsoring Agency Code
15. Supplementary Notes Research performed in cooperation with the Texas Department of Transportation and the U.S. Department of Transportation, Federal Highway Administration. Research Project Title: Evaluation and Testing of Bridge Rails and Transitions to NCHRP Report 350 Criteria
16. Abstract The Texas Type T6 Bridge Rail was developed under a previous Texas Department of Transportation (TxDOT) project
with the Texas Transportation Institute (TTl). The Texas Type T6 was crash tested and evaluated under National Cooperative Highway Research Program (NCHRP) Report 230 guidelines. However, with the adoption of NCHRP Report 350, the bridge rail needed to be reevaluated using the 2000-kg pickup truck specified in NCHRP Report 350 test 3-11.
Earlier in this study NCHRP Report 350 test designation 3-11 (test no. 418048-2) was performed and the Texas Type T6 did not perform satisfactorily. Although the bridge rail contained and redirected the vehicle, some of the anchor bolts pulled out allowing post baseplates to be displaced from the bridge deck. The vehicle rolled onto its left side upon exiting the installation. Static load tests on posts taken from the prototype rail installation showed that the strength of the welds between the baseplates and the posts exceed the plastic moment capacity of the posts.
The project team selected two revised weld details for dynamic testing. In all tests, failure in the welds occulTed before rupture of the post steel. The team then modified the breakaway connection by welding the tension flange to the baseplate with a 10 mm long, IO-mm fillet weld and welding the compression flange with two 19 mm long, IO-mm fillet welds. Results of the second full-scale crash test (test no. 418048-3) on the revised design were similar to the first test and indicated unacceptable performance.
Design of the post welds was further revised. Two welds that were located along the back flange of the T6 Post were relocated along the web of the post. In addition, two slots (6 mm x 29 mm) (1/4 in x 1-1/8 in) were machined in the tension flange of the posts to reduce the ultimate strength of the post. A third full-scale crash test (test no. 418049-8) was then performed. The modified T6 posts broke away readily but allowed the rail element to deflect enough to allow one side of the pickup to go down into the ditch behind the bridge rail. This deflection was considered unacceptable.
Based on results of additional pendulum testing, a full scale crash test was performed on the T6 Bridge Rail with the T6 Posts modified to include the following:
1) a larger and thicker baseplate (241 mm x 304.8 mm x 25 mm plate) 2) two 6.4 mm x 13 mm machine-cut slots on the tension flange of the posts 3) a 51 mm x 83 mm x 13 mm plate welded on the field side of the flange just above the baseplate. Reported herein are the details and results of the full-scale crash test performed with the abovementioned modifications.
The modified Texas Type 1'6 Tubular W-beam Bridge Rail contained and redirected the vehicle; however, the vehicle rolled one complete revolution after exiting the bridge rail.
17. Key Words 18. Distribution Statement
Bridge Rails, Aesthetically Pleasing, Crash Testing, Roadside No restrictions. This document is available to the public Safety through NTIS:
National Technical Information Service 5285 Port Royal Road, Springfield, Virginia 22161
19. Security Classif. (of this report) I 20. Security Classif. (of this page) 21. No. of Pages I 22. Price Unclassified Unclassified 54
Form DOT F 1700.7 (8-72) Reproduchon of completed page authonzcd

TEST 12 - NCHRP REPORT 350 TEST 3-11 OF THE MODIFIED TEXAS TYPE T6 BRIDGE RAIL ON BRIDGE DECK
by
C. Eugene Buth Senior Research Engineer
Texas Transportation Institute
William F. Williams Assistant Research Engineer
Texas Transportation Institute
Roger P. Bligh Assistant Research Engineer
Texas Transportation Institute
and
Wanda L. Menges Associate Research Specialist Texas Transportation Institute
Letter Report 1804-10 Project Number 0-1804
Research Project Title: Evaluation and Testing of Bridge Rails and Transitions to NCHRP Report 350 Criteria
Sponsored by the Texas Department of Transportation
In Cooperation with U.S. Department of Transportation Federal Highway Administration
February 2000
TEXAS TRANSPORTATION INSTITUTE The Texas A&M University System College Station, Texas 77843-3135


DISCLAIMER
The contents of this report reflect the views of the authors who are solely responsible for the facts and accuracy of the data, and the opinions, findings, and conclusions presented herein. The contents do not necessarily reflect the official views or policies of the Texas Department of Transpmiation (TxDOT), Federal Highway Administration (FHW A), The Texas A&M University System, or the Texas Transportation Institute. This repmi does not constitute a standard, specification, or regulation, and its contents are not intended for construction, bidding, or pelmit purposes. In addition, the above listed agencies assume no liability for its contents or use thereof. The use of names of specific products or manufacturers listed herein does not imply endorsement of those products or manufacturers. The engineer in charge of the project was Mr. C. Eugene Buth, P.E. #27579.
v

ACKNOWLEDGMENTS
This research project was conducted under a cooperative program between the Texas Transportation Institute, the Texas Department of Transportation and the U.S. Department of TranspOttation, Federal Highway Administration. The TxDOT project directors for this research were Ms. Dana Honganen and Mr. Mark Bloschock. Their assistance is acknowledged and appreciated.
vi

TABLE OF CONTENTS
Page
LIST OF FIGURES ......................................................... viii
LIST OF TABLES ........................................................... ix
I. INTRODUCTION .......................................................... 1
II. STUDY APPROACH ..................................................... 11 TEST ARTICLE ........................................................ 11 CRASH TEST CONDITIONS ............................................ 11 EVALUATION CRITERIA .............................................. 15 CRASH TEST AND DATA ANALYSIS PROCEDURES ...................... 16
Electronic Instrumentation and Data Processing .......................... 16 Anthropomorphic Dummy Instrumentation .............................. 17 Photographic Instrumentation and Data Pl'ocessing ........................ 17 Test Vehicle Propulsion and Guidance ................................... 17
III. CRASH TEST RESULTS ................................................. 19 TEST 418040-12 (NCHRP REPORT 350 TEST NO. 3-11) ..................... 19
Weather and Soil Conditions ........................................... 19 Test Description ..................................................... 19 Damage to Test Installation ............................................ 23 Vehicle Damage ...................................................... 23 Occupant Risk Values ................................................ 23
IV. SUMMARY OF FINDINGS AND CONCLUSIONS ........................... 39 SUMMARY OF FINDINGS .............................................. 39 CONCLUSIONS ........................................................ 40
REFERENCES .............................................................. 43
vii

LIST OF FIGURES
Figure Page
1 TxDOT Standard T6 Baseplate Details .................................... 3 2 Revised T6 Baseplate Details ........................................... 4 3 Revised Type T6 Post Details ........................................... 8 4 Details of the Texas Type T6 Bridge Railfor Test 418040-12 ................. 12 5 Texas Type T6 Bridge Rail Installation before Test 418040-12 ................ 13 6 Type T6 Post Anchor Bolts and Baseplate Welds before Test 418040-12 ........ 14 7 VehiclelInstallation Geometries for Test 418040-12 ......................... 20 8 Vehicle before Test 418040-12 ......................................... 21 9 Vehicle Properties for Test 418040-12 ................................... 22
10 Sequential Photographs for Test 418040-12 (Overhead and Frontal Views) .......................................... 24
11 Sequential Photographs for Test 418040-12 (Rem' Views) ....................................................... 26
12 AfterImpact Trajectory for Test 418040-12 ............................... 28 13 Installation after Test 418040-12 ........................................ 29 14 Vehicle after Test 418040-12 ........................................... 30 15 Interior of Vehiclefor Test 418040-12 ................................... 31 16 Summary of Results for Test 418040-12, NCHRP Repmt 350 Test 3-11 ......... 34 17 Vehicle Angular Displacements for Test 418040-12 ......................... 35 18 Vehicle Longitudinal Accelerometer Trace for Test 418040-12 ................ 36 19 Vehicle Lateral Accelerometer Trace for Test 418040-12 ..................... 37 20 Vehicle Vettical Accelerometer Trace for Test 418040-12 .................... 38
viii

Table
1
2
3 4 5
LIST OF TABLES
Page
Summary of Strength Analysis on T6 Posts With Drilled Holes and Slots Located on Tension Flange ...................... 6 Summary Of Dynamic Pendulum Testing on October 1 & 14, 1999 ......................................... 9 Exterior Crush Measurements for Test 418040-12 .......................... 32 Occupant Compartment Measurements for Test 418040-12 ................... 33 Pelformance Evaluation Summary for Test 418040-12, NCHRP Report 350 Test 3-11 .......................................... 41
ix


I. INTRODUCTION
On July 16, 1993, the Federal Highway Administration (FHW A) formally adopted the new performance evaluation guidelines for highway safety features set forth in the National Cooperative Highway Research Program (NCHRP) Report 350 as a "guide or reference" document in the Federal Register, Volume 58, Number 135 (1,2). FHW A has also mandated that, on projects let after October 1998, only bridge railings that have successfully met the petformance evaluation guidelines set forth in NCHRP Report 350 may be used on new construction projects on the National Highway System (NHS).
Changes incorporated into the new NCHRP RepOlt 350 guidelines include new design test vehicles, expanded test matrices, and revised impact conditions. Of most significance was the adoption of a 2000 kg (4409Ib) pickup truck as the design test vehicle for structural adequacy tests. This change has necessitated the retesting and reevaluation of the impact performance of many existing roadside safety features. Through vatious pool-funded studies and research projects, FHWA has tested some of the most widely used safety appmtenances, including several bridge rails and transitions. However, this testing will not be all-inclusive. Some bridge rails, unique to the Texas Depmtment of Transportation (TxDOT), have not been crash tested to the new NCHRP Report 350 guidelines. Therefore, there is a need for assessing the safety pelfOlmance of these railings and, if necessary, modifying the designs to meet the requirements of N CHRP Report 350 in order to permit their continued use beyond the October 1998 deadline.
Throughout the years, the Texas TranspOltation Institute (TTl) and TxDOT have worked jointly on the development, evaluation, and testing of many TxDOT standard bridge rail designs. This cooperative research has resulted in many satisfactory designs with demonstrated impact pelformances that TxDOT has successfully implemented. This project is an extension of this previous work. It evaluated, both analytically and experimentally, the performance of selected railing and transition designs through full-scale crash testing to assess compliance with the new NCHRP Report 350 pelformance criteria.
In the first task, TTl researchers identified all bridge rails and transitions similar to those used in Texas that have already been tested or were scheduled to be tested. The researchers reviewed all previous testing on cml'ent TxDOT railing designs and any related tests on other similar designs to document any existing test results that demonstrate acceptability of the railing designs by NCHRP Report 350 standards.
In the second task, TTl researchers presented TxDOT with a list of untested bridge rails and transitions, along with needed testing for these designs. The untested bridge rails and transitions believed to have long-term usage potential to TxDOT were selected and prioritized for full-scale testing.
During task three, the first step of evaluation was a simple analysis of strength and geometJy in accordance with railing provisions of the American Association of State Highway
1

and Transportation Officials (AASHTO) Load and Resistance Factor Design (LRFD) code, supplemented by other information available to the researchers (3).
After all analyses were petformed, the second btidge rail selected for full-scale crash testing was the Texas Type T6 Bridge Rail. This tubular W -beam and steel post bridge rail was developed under a previous TxDOT study with TTl (4). The Texas Type T6 was previously crash tested and evaluated under NCHRP Report 230 guidelines (5). The two tests performed included a test with a 2041 kg (4500 Ib) passenger vehicle traveling at 99.0 kmlh (61.5 mi/h) and 27.5 degrees, and a test with a 1035 kg (2282Ib) passenger vehicle traveling at 93.3 km/h (58.0 mi/h) and 14.0 degrees. The bridge rail performed acceptably during these two tests. However, with the adoption of NCHRP Report 350, TxDOT required reevaluation of the bridge rail using the 2000 kg (4409 Ib) pickup truck.
Earlier in this study NCHRP Report 350 test 3-11 (test no. 418048-2) was performed on the T6 rail (6). According to the specifications set for NCHRP Report 350 test designation 3-11, the Texas Type T6 did not perform satisfactorily. Although the bridge rail contained and redirected the vehicle, some of the anchor bolts pulled out allowing post baseplates to be displaced from the bridge deck. The vehicle rolled onto its left side upon exiting the installation and intruded into adjacent traffic lanes. Posts for this test installation were fabticated using the TxDOT Standard Details as shown in Figure 1. Static load tests on posts taken from the prototype rail installation showed that the welds between the baseplates and the posts exceeded the plastic moment capacity of the posts. Rupture of the post flange OCCUlTed before failure of the baseplate welds. The T6 bridge rail was Oliginally designed so that failure in the weld would occur before rupture of the post steel.
Prior to pelfOlming the second NCHRP 350 compliance crash test (test no. 418048-3), TTl researchers petformed a separate study to redesign the post welds to eliminate the failure in the post steel during crash load conditions. This study involved analyses and full-scale static and dynamic tests on a revised weld detail. Based on the analysis, researchers selected two revised weld details (8 mm (5/16 in) and 10 mm (3/8 in) weld sizes) for testing. These revised weld details incorporated a single weld along the tension flange of the post as shown in Figure 2. Six static tests and six dynamic tests (pendulum) were performed. In each test, failure in the weld OCCUlTed before rupture of the post steel. Based on the results from the static testing of the 8 mm (5/16 in) welds, the rupture force applied to the posts ranged from 56.71 kN to 73.84 kN with an average value of 64.65 kN. Two dynamic pendulum tests were performed on the 8 mm welds and produced ruptun: forces of 67.26 kN and 104.62 kN with an average of 85.94 kN. Based on the results from the static testing of the 10 mm (3/8 in) welds, the rupture force applied to the posts ranged from 61.16 kN to 77.40 kN with an average value of 71.76 kN. Dynamic pendulum tests were performed on the 10 mm welds, with rupture forces ranging from 76.5 1 kN to 98.30 kN with an average of 84.07 kN.
In August 1998, a second crash test (test no. 418048-3) on the Texas Type T6 Btidge Rail (with revised welds) involved a 2000 kg (4409Ib) pickup truck impacting the rail at 100 kmIh (62.1 mi/h) and 25 degrees (7). Texas Type T6 Bridge Rail contained and redirected the vehicle. Posts 7 and 8 broke at the welds to the baseplate and were lying behind the bddge deck. As the
2

10 20
PL 16x 152x240
10
10
<L (4) 25x38 Slotted Holes
Figure 1. TxDOT Standard T6 Baseplate Details.
3

.j>.
Center Welds Along Flange
r 152 ---l 108 :~:: 19 I =-1381-76-138~ 12
240 127 II I
44
PL 1 6x 152x240 8 min. 10 max.
Figure 2. Revised T6 Base Plate Details
Cl (4) 25x38 Slotted Holes
89
Center Weld Along Flange

vehicle exited the installation it was rolling counterclockwise (toward the rail) and subsequently rolled onto its right side. The Texas Type T6 Bridge Rail did not perform acceptably according to specifications of NCHRP Report 350. Testing personnel concluded that additional modifications were required to improve the performance of the T6 bridge rail with respect to the RepOit 350 requirements.
In the crash test performed in August 1998, (test no. 418048-3), the T6 posts in the impact region caused significant damage to the simulated concrete deck. In addition, the posts failed to break away from the baseplates and contributed to snagging the vehicle during impact. Project team members believed This "snagging" effect contributed to the rollover of the vehicle after impact. They decided further improvements in pelformance of the breakaway post were necessary.
Strength analyses, laboratory testing, and DYNA3D computer modeling of the post were pelformed to determine ways to reduce the ultimate strength of the post and to improve breakaway performance during a collision. Reducing the ultimate strength of the post was achieved by removing material from the tension flange of the post either by drilling holes or by machining slots. Several different hole sizes and patterns drilled in the tension flange of the post were investigated. Slotted holes in the tension flange were also evaluated. Results of these tests are summarized in Table 1. A pattern of two 6 mm x 29 mm (1/4 in x 1-118 in) slots machined into the tension flange seemed to result in the desired post characteristics. The calculated ultimate strength of the post with this slot al1'angement was 42.3 kN. Two static strength tests were peIformed on posts with two 6mm x 29 mm (1/4 in x 1-1/8 in) slots machined in the tension flange. These tests yielded ultimate post strengths of 40.2 kN, and 41.2 kN with an average strength of 40.7 kN. Two dynamic pendulum strength tests were pelformed on posts with the two 6mm x 29 mm (1/4 in x 1-1/8 in) slots in the tension flange of the posts. These tests yielded ultimate post strengths of 54.5 kN, and 63.1 kN with an average strength of 58.8 kN. In addition, DYNA3D computer simulation modeling was also performed with the two slots in the posts and this analysis yielded an ultimate post strength of 67.4 kN. The ultimate strength values recorded from these analyses are based on the loads applied at a height of 533 mm (21 in). In addition, the welds located along the back flange of the T6 post were relocated along the web of the post to improve the breakaway performance of the post. The results from the study were presented to TxDOT officials in a separate report dated August 2, 1999.
The Texas Type T6 bridge rail was then tested again (test no. 418049-8) with modified T6 post design incorporating the slots on the tension flange and the relocation of the back flange welds onto the web of the post (Figure 3). The modified T6 posts readily broke away, but allowed the rail element to deflect enough to allow one side of the pickup to go down into the ditch behind the rail. Although the rail redirected the vehicle back onto the bridge deck, researchers considered this deflection unacceptable. (8)
In October 1999, TTl peIformed an additional study to improve the performance of the T6 Post by limiting the ultimate dynamic strength of the T6 post to approximately 80 kN (18 kips) at the rail mid height of 533 mm (21 inches). In addition, a study was performed on the T6
5

Test
lC
2C
3C
4C
0\ 5C I, I
Average I
IE
2E
Average
1D
2D
41S049-P7
Table 1. Summary of Strength Analysis on T6 Posts With Drilled Holes and Slots Located on Tension Flange.*
Calculated Dynamic SlotfHole Pattern Static Load
Load Pendulum Load
Two 13 rum holes 64.5 kN 56.5 kN (two Y, in holes) (14.5 kips) (12.7 kips)
Two 13 rum holes 78.3 kN (two Y, in holes) (17.6 kips)
Two 13 rum holes 59.2kN (two Ih in holes) (13.3 kips)
Two 13 rum holes 63.2kN (two 1/2 in holes) (14.2 kips)
Two 13 rum holes 65.4kN (two Y2 in holes) (14.7 kips)
62.3 kN (14.0 kips)
Four 10 rum holes 60.0kN 60.1 kN (four 3/8 in holes) (13.5 kips) (13.6 kips)
Four 10 rum holes 57.S kN (four 3/8 in holes) (13.0 kips)
59.2kN (13.3 killS)
Four 13 rum holes 46.7 kN 45.0kN (four Y, in holes) (10.5 kips) (10.1 kips)
Four 13 rum holes 50.7kN (four Y, in holes) (11.4 kips)
Four 13 rum holes 72.5 kN (four Y2 in holes) (J6.3 kip.>.)
DYNA3D Simulated Comments
Load
Void: Weld failure
Void: Too high load
I
I
87.2 kN (19.6 kips)
78.3 kN (17.60 kips)

Table 1. Summary of Strength Analysis on T6 Posts With Drilled Holes and Slots Located on Tension Flange (continued).
- - - - - - - - - - - - -----
Test SlotIHole Pattern Calculated
Static Load Dynamic DYNA3D
Comments Load Pendulum Load Simulated Load
418049-PS Four 13 mm holes 71.6 kN (four Y2 in holes) (16.1 kips)
Average 48.0kN 72.1 kN (10.8 kips) (16.1 kips)
10 Four 16 mm holes 37.8 kN 36.0kN 6L4kN (four 5/S in holes) (S.5 kips) (S.1 kips) (13.S1 kips)
2G Four 16 mm holes 4L4kN (four 5/S in holes) (9.3 kips)
41S049-P9 Four 16 mm holes 5S.3 kN (four 5/S in holes) (13.1 kips)
-..1 41S049-PI0 Four 16 mm holes 57.4kN (four 5/S in holes) (12.9 kips)
Average 38.7kN 57.8 kN J8.7 kips) J13.0 kip§)
IF Two 6 rom x 29 rom slots 42.3 kN 40.0kN 67.4kN (two 114 in x 1-I/S in slots) (9.5 kips) (9.0 kips) (15.15 kips)
2F Two 6 rom x 29 mm slots 4L4kN ,
(two 1/4 in x 1-I/S in slots) (9.3 kips) I
41 S049-P 11 Two 6 mm x 29 rom slots 63.2kN I
(two 114 in x 1-I/S in slots) (14.2 kips)
41S049-P12 Two 6 mm x 29 mm slots 54.3 kN (two 1/4 in x 1-I/S in slots) (12.2 kips)
Average 41.0kN 58.7kN (9.2 kips) (13.2 kips)
-------
* Ultimate Load @ 533 (21 in) Post Height

2
15
I
Slot Layout 5X29 Slots G:
1=100-\ 3 RADIUS EACH END MACHINE CUT NO HEAT CUTTING or SAWING (TYP,)
J 10 Weld
1 9-----::=-_.=t-~ T ~t----1f
- 29 29 I 8 8
f----152--
T6 Post(W150X13) Front Foce
-100-PLATE 1
I 12
1 9 TOt'7r9 59 ~ -¥I If~
40 127
44
f'..
/ 10 v
-$- ( h
"~ .1 ~
-~ 38 ~ 75 ~ 38 ~ ~152~
15 o
78
I 24X38 Slotted Holes
REVISED T6 SECTION 8-8
Figure 3. Revised Type T6 Post Details.
8

post baseplate to limit the maximum concrete bearing stress to approximately 27.6 MPa (4000 psi) once the ultimate dynamic strength of the post was achieved. From the study, it was determined that two 6mm x 13 mm slots machine cut on the tension flange of the post would limit the ultimate dynamic strength to approximately 80 kN (18 kips). In order to limit the contact bearing stress to approximately 27.6 MPa, the size and thickness of the baseplate was increased to 304.8 mm x 241 mm and 25 mm, respectively.
Researchers pelformed six dynamic pendulum tests (tests 418040-1 to 6) on October 1, 1999, on T6 Posts with various sizes of slots machine cut on the tension flange. Two tests each were pelformed on posts with machine cut slot widths of 13 mm, 19 mm, and 22 mm. The tests were performed on posts with the standard 152 mm x 240 mm x 16 mm baseplate. Table 2 reports ultimate dynamic pendulum load for each test. The average ultimate dynamic strength of the posts with two 6.4 mm x 13 mm slots (tests 418040-5 & 6) was 77.12 KN (17.34 kips). The 13 mm slots yielded ultimate strengths very close to the target ultimate strength of 80 KN (18 kips).
On October 14, 1999, two additional pendulum tests were performed on T6 Posts with two 6.4 mm x 13 mm machine-cut slots in the tension flange. These posts were modified to include a larger and thicker baseplate with dimensions 304.8 mm x 241 mm x 25 mm thick. In addition, a 13 mm x 51 mm x 83 mm plate was welded to the field side flange of the posts to enhance the breakaway pelformance of the posts after impact. One of the tests was peJformed on the weak axis of the post to determine the weak axis strength of the post, and also to observe the weak axis breakaway characteristics after impact. The ultimate dynamic strength of the post in the strong axis direction from test 418040-7 was 72.69 KN (16.34 kips). The ultimate dynamic strength of the post in the weak axis direction from test 418040-8 was 35.78 KN (8.04 kips). Table 2 lists these results.
Test
418040-1
418040-2
418040-3
418040-4
418040-5
418040-6
418040-7
418040-8
Table 2. Summary Of Dynamic Pendulum Testing on October 1 & 14, 1999.
Slot Pattern Dynamic
Pendulum Load
2 - 6.4mm x 19mm Slots 67.50 KN (15.16 kips)
2 - 6.4mm x 19mm Slots 65.12 KN (14.64 kips)
2 - 6.4mm x 22mm Slots 65.25 KN (14.67 kips)
2 - 6.4mm x 22mm Slots 65.86 KN (14.81 kips)
2 - 6.4mm x 13mm Slots 75.09 KN (16.88 kips)
2 - 6.4mm x 13mm Slots 79.15 KN (17.79 kips)
2 - 6.4mm x 13mm Slots 72.69 KN (16.34 kips)
Comments
2 - 6.4mm x 13mm Slots 35.78 KN (8.04 kips) Test on Weak Axis Strength
9

Based on these results, TIl performed a full scale crash test on the T6 Bridge Rail with the T6 Posts modified to include the following:
1) A larger and thicker baseplate (241 mm x 304.8 mm x 25 mm plate)
2) Two 6.4 mm x 13 mm machine-cut slots on the tension flange of the posts.
3) A 51 mm x 83 mm x 13 mm plate welded on the filed side flange just above the baseplate.
Following chapters of this report give the details and results of the full-scale crash test peJformed with the abovementioned modifications. The modified Texas Type T6 Tubular Wbeam Bridge Rail contained and redirected the vehicle; however, the vehicle rolled one complete revolution after exiting the bridge rail.
10

II. STUDY APPROACH
TEST ARTICLE
TTl constructed a bridge deck cantilever to support the Texas T6 Bridge Rail. The 750 mm (29.5 in) cantilever was 30.5 m (100 feet) long and 200 mm (8.0 in) thick. Transverse reinforcement in the deck consisted of #5 bars at 150 mm (6.0 in) on centers top and bottom. The longitudinal top reinforcement consisted of #4 bars spaced at 225 mm (8.8 in) on centers. The bottom longitudinal reinforcement consisted of three #5 bars spaced at 85 mm (3.3 in) and 300 mm (11.8 in), respectively from the first bar located closest to the field side of the deck. The bars located along the edge of the deck had 40 mm (1.6 in) of end cover. Top and bottom reinforcement cover distances were 50 nun (2.0 in) and 35 mm (1.4 in), respectively. The compressive strength of the concrete at the time of testing averaged approximately 35 MPa (5075 psi).
The T6 bridge posts (WI50x13) spaced at 1905 mm (75 in) were secured to the concrete deck using four 22 mm (7/8 in) diameter A307 bolts. Four 32 mm (1 114 in) fOlmed holes were constructed at each post location. The bolts were secured beneath the deck using 6 mm x 152 mm x 203 mm (IA in x 6 in x 8 in) anchor plates. A tubular W-beam rail element constructed by welding two standard 12-gage W-beam rail elements together back to back is mounted on the T6 bridge rail posts.
Trinity Industries fabticated the posts for this test installation according to the post and baseplate details shown in Figure 4. The baseplates for the posts were 304.8 mm x 241 mm x 25 mm. TTl machine-cut two 6.4 mm x 13 mm slots in the tension flange according to the details shown in Figure 4. In addition, TTl welded a 51 mm x 83 mm x 13 mm plate that was added on the field side flange for each post in accordance to the details shown in Figure 4. For this test installation, the orientation and location of the holes for the anchor bolts and the post to baseplate welds did not change from the present Texas Department of Transportation T6 Bridge Rail Standards. For this test installation, ET2000 LET End Treatment Terminals were constructed on each end of the test installation and were used to anchor the T6 Bridge Rail. Figures 5 and 6 show the completed installation.
CRASH TEST CONDITIONS
NCHRP RepOlt 350 requires two tests for test level 3 evaluation of longitudinal batTiers:
NCHRP Report 350 test designation 3·10: This test involves an 820-kg (1806Ib) passenger vehicle (820C) impacting the critical impact point (CIP) of the length-of-need (LON) of the bmTier at a nominal speed and angle of 100 krnlh (62.0 mi/h) and 20 degrees. The purpose of this test is to evaluate the overall performance of the LON section, in general, and occupant risk, in pmticular.
11

,.... tv
r-------------------"'""' O~ (TYP. Co"' C"")-r-1
tub", •• W-Uoom Roll ",.",b<r
r----1.CT ~~O·~~Ji~(NT----_; PO';! 16 PO:;'! \~ PO',;T \4 !'O';I,' fo
(C."'Ploto L.o,gtn aJ20 "' .. )
PO:;"['2 Pw, 11 PO~ 10 P070 D "",;;"I B -, PO',;T 6 poA:"" :O:;r ~ PiT.'! J PO>! 2 pod, LD ~~ff;CAT~(,.,------, _1_3_'-_1 l _I I I I 1 1\\ , \ \
LA I----__ ,~spo< .... 'oo~ -2S~1~ __ ----I
W':"",l-4 Cl. or ~2 (7/s,) 0 ..... "-"07 OOlT~ (4 R(QUI~CO t:/IC~ PO$Tj
(,;.,:,g "& ().\re:; "'J~ ('-V4, O<A. FORt.Ul ~QC'> rOJO""",,, O.C
FO~ 22 0' .... ANe~OR ~ou~~ I I ~CNT'cr , / 1~D22~",,,, eo;
I A~16C150"'m cc
" 40 (n~ I' ~OO----r--:J'7
I
r;/2~ ~~ ~o~~~ B~ Iw,.(T\'P)
." c",,", l'07~ 76~
L j ~~N. LOU::'-,-e~-,,-=r' I c.o.cH fACe
i----Q20l-----+__
SECTION A-A
~
T6 8RIDGE RAIL PLAN
1-'0°1 WELDS 6mm FROM TOP OF ""'~" ~ ff ~~~;E" 'O;:V 8ASEPLATE S1-=r ~
13xSh83 PLATE
L'''8~-T 16 PQST(W150X13)
BACK FLANGE
6Xl:!i Slot (TYP,) :I RADIUS EACH END MACHINE CUT NO HEAT CuTT1NC or SA~NC (TYP.)
I . T -'-
~3.~' -T 24-1 r-24
304.8
T6 PQST(W1SQX13) FRONT F! ANGE (TRAFFIC SIDE)
1;'\><S1x83 PLATE 1--- 10°1 25~240~305 PLATE J13
n- I 11-1 '" 241 127 [
-i- .~·I T ," (RJ.ll)
'" ., ;0,. '" '''I,n
"",'"'' B ~ I I-'---+-"
1 7.0
~L----'----r--~~--L I 24X38 1'-'14.3 76.2 r-114•3 i SLOTTED
~304.8----i HOLES .wOJ)":i' "'''' .-.0.",",,,,,",,,
"O~~~ ~ SECTION THR\I RAI'
Note~:
1.) 28-DAY Concrete Strength (f'c) Is 28 MPa (4000 psi)
2.) Yield Strength of Reinforcoment (Fy) j::: 420 MPo (60 ksi)
3.) All Reinforcing Steel is Bare (Not [pOKY Cooted)
SECTION 8-8
The Texas A&M University System
TEXAS TRANSPOR.TATION INSTITUTE COLLEGE STATION, TEXAS 77643
!!.vl.:o", N.!Ilo~ I !1!'"!ooIN,x
~80~~' I, ,i~91 Dr~'J'K By I s.,."
1~O"lND' TxOOT H ORloe, R"IL 1 Dr 1
. ,
Figure 4. Details of the Texas Type T6 Bridge Rail for Test 418040-12.
I,ll I,
'I
:Ii:

Figure 5. Texas Type T6 Bridge Rail Installation before Test 418040·12.
l3

Figure 6. Type T6 Post Anchor Bolts and Baseplate Welds before Test 418040·12.
14

NCHRP Report 350 test designation 3-11: The test involves a 2000-kg (4409Ib) pickup truck (2000P) impacting the CIP of the LON of the banier at a nominal speed and angle of 100 km/h (62.0 milh) and 25 degrees. The test is intended to evaluate strength of the section in containing and redirecting the 2000P vehicle.
This report details the results of test 418040-12, which correspond to NCHRP Report 350 test designation 3-11. The critical impact point (CIP) for the test was determined using guidelines in NCHRP Report 350 and BARRIER VII simulation. The CIP selected for the test was mid span between bridge rail posts 5 and 6, or between posts 10 and 11 of the total installation.
EVALUATION CRITERIA
TTl evaluated the crash test in accordance with NCHRP Report 350. As stated in NCHRP Report 350, "Safety pelformance of a highway appUltenance cannot be measured directly but can be judged on the basis of three factors: structural adequacy, occupant risk, and vehicle trajectory after collision." Accordingly, the following safety evaluation criteria from Table 5.1 of NCHRP RepOit 350 were used to evaluate the crash test repOited herein:
• Structural Adequacy
A. Test mticle should contain and redirect the vehicle; the vehicle should not penetrate, underride, or oven'ide the installation, although controlled lateral deflection of the test mticle is acceptable.
• Occupant Risk
D. Detached elements, fragments, or other debris from the test article should not penetrate or show potential for penetrating the occupant compartment, or present an undue hazard to other traffic, pedestrians, or personnel in a work zone. Deformation of or intrusions into the occupant compartment that could cause selious injUlies should not be permitted.
F. The vehicle should remain uptight during and after collision although moderate roll, pitching, and yawing are acceptable.
• Vehicle Trajectory
K. After collision it is preferable that the vehicle's trajectOlY not intrude into adjacent traffic lanes.
15

L. The occupant impact velocity in the longitudinal direction should not exceed 12 mls (39.4 ft/s) and the occupant ridedown acceleration in the longitudinal direction should not exceed 20 g's.
M. The exit angle from the test article preferably should be less than 60 percent of the test impact angle, measured at time of vehicle loss of contact with the test device.
CRASH TEST AND DATA ANALYSIS PROCEDURES
The crash test and data analysis procedures were in accordance with guidelines presented in NCHRP Report 350. The following sections present brief descriptions of these procedures.
Electronic Instrumentation and Data Processing
The test vehicle was instrumented with three solid-state angular rate transducers to measure roll, pitch, and yaw rates; a triaxial accelerometer near the vehicle center-of-gravity to measure longitudinal, lateral, and vertical acceleration levels, and a back-up biaxial accelerometer in the rear of the vehicle to measure longitudinal and lateral acceleration levels. The accelerometers were strain-gauge type with a linear millivolt output proportional to acceleration.
A constant bandwidth FMlFM telemetry link transmitted the electronic signals from the accelerometers and transducers to a base station for recording on magnetic tape and for display on a real-time strip chatt. Calibration signals were recorded before and after the test, and an accurate time reference signal was simultaneously recorded with the data. Pressure- sensitive switches on the bumper of the impacting vehicle were actuated just prior to impact by wooden dowels to indicate the elapsed time over a known distance to provide a measurement of impact velocity. The initial contact also produced an "event" mark on the data record to establish the exact instant of contact with the installation.
The multiplex of data channels, transmitted on one radio frequency, was received at the data acquisition station, and demultiplexed into separate tracks of Inter-Range Insttumentation Group (IRIG) tape recorders. For analysis and evaluation of impact performance, the data were played back from the tape machines, filtered with an SAE 1211 filter, and digitized using a microcomputer.
Two computer programs processed the digitized data: DIGITIZE and PLOT ANGLE. Brief descriptions on the functions of these two computer programs follow.
The DIGITIZE program uses digitized data from vehicle-mounted linear accelerometers to compute occupant/compattment impact velocities, time of occupant/compartment impact after vehicle impact, and the highest lO-ms average ridedown acceleration. The DIGITIZE program
16

also calculates a vehicle impact velocity and the change in vehicle velocity at the end of a given impulse period. In addition, it computed maximum average accelerations over 50-ms intervals in each of the three directions. For repOlting purposes, the data from the vehicle-mounted accelerometers were then filtered with a 60-Hz digital filter and acceleration versus time curves for the longitudinal, lateral, and vertical directions were plotted using a commercially available software package (Excel 7).
The PLOT ANGLE program used the digitized data from the yaw, pitch, and roll rate transducers to compute angular displacement in degrees at 0.0005-s intervals and then instlUcted a plotter to draw a reproducible plot: yaw, pitch, and roll versus time. These displacements are in reference to the vehicle-fixed coordinate system with the initial position and orientation of the vehicle-fixed coordinate system being that which existed at initial impact.
Anthropomorphic Dummy Instrumentation
Use of a dummy in the 2000P vehicle is optional according to NCHRP RepOlt 350, and the tests with the 2000P vehicle did not use a dummy.
Photographic Instrumentation and Data Processing
Photographic coverage of the test included three high-speed cameras: one overhead with a field of view perpendicular to the ground and directly over the impact point; one placed behind the installation at an angle; and a third placed to have a field of view parallel to and aligned with the installation at the downstream end. A flash bulb activated by pressure sensitive tape switches was positioned on the impacting vehicle to indicate the instant of contact with the installation and was visible from each camera. The films from these high-speed cameras were analyzed on a computer-linked Motion Analyzer for observation during the collision and to obtain time-event, displacement, and angular data. A Betacam, a VHS-format video camera and recorder, and still cameras were used to record and document conditions of the test vehicle and installation before and after the test.
Test Vehicle Propulsion and Guidance
The test vehicle was towed into the test installation using a steel cable guidance and reverse tow system. A steel cable for guiding the test vehicle was tensioned along the path, anchored at each end, and threaded through an attachment to the front wheel of the test vehicle. An additional steel cable was connected to the test vehicle, passed around a pulley near the impact point, through a pulley on the tow vehicle, and then anchored to the ground so that the tow vehicle could move away from the test site. A two-to-one speed ratio between the test and tow vehicle existed with this system. Just prior to impact with the installation, the test vehicle was released to be free-wheeling, i.e., no steering or braking inputs, and unrestrained. The
17

vehicle remained free-wheeling until the vehicle cleared the immediate area of the test site, at which time the brakes on the vehicle were activated to bring it to a safe and controlled stop.
18

III. CRASH TEST RESULTS
TEST 418040·12 (NCHRP REPORT 350 TEST NO. 3·11)
A 1994 Chevrolet 2500 pickup, shown in Figures 7 and 8, was used for the crash test. Test ineltia weight of the vehicle was 2000 kg (4409Ib) and its gross static weight was 2000 kg (4409Ib). The height to the lower edge of the vehicle bumper was 420 mm (16.5 in) and it was 650 mm (25.6 in) to the upper edge of the bumper. Figure 9 gives additional dimensions and information on the vehicle. The cable reverse tow and guidance system directed the vehicle into the installation, and it was released to be free-wheeling and unrestrained just prior to impact.
Weather and Soil Conditions
The test was petformed the moming of November 4, 1999. Five days before the test, 20 mm (0.8 in) of rain was recorded. No other rainfall of significance OCCUlTed for the remaining 10 days plior to the test. Moisture content of the NCHRP Report 350 standard soil used on the end tetminal sections was 6.4 percent on the downstream end and 6.8 percent on the upstream end. Weather conditions at the time of testing were as follows: wind speed: 11 km/h (7 mi/h); wind direction: 200 degrees with respect to the vehicle (vehicle was traveling in a northerly direction); temperature: 23°C (73 OF); relative humidity: 43 percent.
Test Description
lha reference for I "Ind direction Is 90' vehlele fbed as
'ho," Eel -"-_. ~ .~ 180'
1270-
The vehicle, traveling at 99.5 kmlh (61.8 mi/h), impacted the Texas Type T6 bridge rail 900 mm (35.4 in) upstream from the splice at post 11 at a 27.0 degree angle. Shottly after impact, the rail and post 12 moved. At 0.027 s, concrete fractured at post 12, and at 0.042 s, the front welds at post 12 fractured. The vehicle began to redirect at 0.045 s. By 0.046 s, the left front tire contacted post 12 and by 0.056 s, the rear welds at post 12 fractured at the base. The concrete fractured at post 13 at 0.062 s, and at 0.076 the front welds at post 11 fractured. At 0.078 s, the front welds at post 13 fractured, and at 0.090 s, the rear welds at post 13 fractured at the base. By 0.112 s, the rear welds at post 11 fractured at the base, and by 0.127 s, the front welds fractured at post 14. The rear welds at post 14 fractured at the base at 0.137 s. At 0.140 s, the right front tire lost contact with the ground. The tight rear tire lost contact with the ground and the front welds at post 15 fractured at 0.160 s. By 0.182 s, the rear welds at post 15 fractured at the base, and by 0.262 s, the left rear tire rode off the rear of the deck. The rear of the vehicle yawed toward the rail at 0.266 s. The vehicle was traveling parallel with the bridge rail at 0.282 s at a speed of 76.3 kmlh (47.4 mi/h). The vehicle lost contact with the bridge rail at 0.528 s and was traveling at a speed of 64.8 km/h (40.3 mi/h) and an exit angle of 27.7 degrees.
19

Figure 7. Vehiclellnstallation Geometries for Test 418040-12.
20

Figure 8. Vehicle before Test 418040-12.
21

OATL ___ 1 ,-1 -'-"0"'4_--->9"'9'----_ TEST NO., .-:"4"1-'08,,0,.4,,0,,,-=---1 ",2 __ _
YEAR: 1994.~ ___ _ fJAK[: _-,C=h"e~Y,-,ro"-l,,e .. t ____ _
TIRE II\'FLATION PRESSURE: ___ _ OOOfJETER: 217878
MASS DISTRIBUTION (kg) IF _~5",6,,7 __ _ RF_-,,5,,5,,6 __
DESCRIBE ANY OA')AGE TO VEHICLE PRiOR TO TEST:
I
f--'- "
'--' ~ I'===f
~N ,<o.,_1,-,G~C",G""C",2",4..,K",O=RCcE",1 0~6,,-,1, 4..,0"--__ _
MODEL: -"2~5",0,,,0,-,Pcci",c,!k,-,u'JP,,--TJ.i.'ru",c<ck,,--___ _
TIRE SIZE: LT 225 75R16
lR _--"4,,,2,,5 __ RR_--"4,,5,,,2 __
• Denotes accelerometer locotion.
NOTES: R-BOmm To LT
"'m'~ l A II .... ~[[L
~ -*-[~
f-= '
-'--' ~ ~ '" ~.
T<!i:E!)'A--,- >-"" "ffi'" ". .... HHl f)'A- - ,-
r1 .d--:J / ~I
"" b -,. ~--=t ' T::;:::: :
I ; ~ ,
"V; 0 -, , ,~
tA, tA, ,
GEOMETRY - (mm)
A 1860 E 1310 1090 N
8 820 F 5480 K 650 0
c 3350 G 1477.7 60 p
0 1810 H tA 420 Q
TEST MASS - (kg) CURB INERTIAL
M, 1188 1123
M, 860 877
M, 2048 2000
-rl
1610 1625
760 445
R 5
u
ENGINE TYPEe.· .!c8,---,C~Y-,-"L __ DIGINE cID:~5,,-, .... 7-,L~ __ _
TRANSMISSION riPE:
_ AUTO
X fJANUAL
OPTION.AL EQUIPMENT,
OUWJY DATA:
TYPE; _______ _
I/A5S: _______ _
SEAT POSlTlotl: ____ _
710 1470 930
3950
GROSS STATIC
Figure 9. Vehicle Properties for Test 418040·12.
22

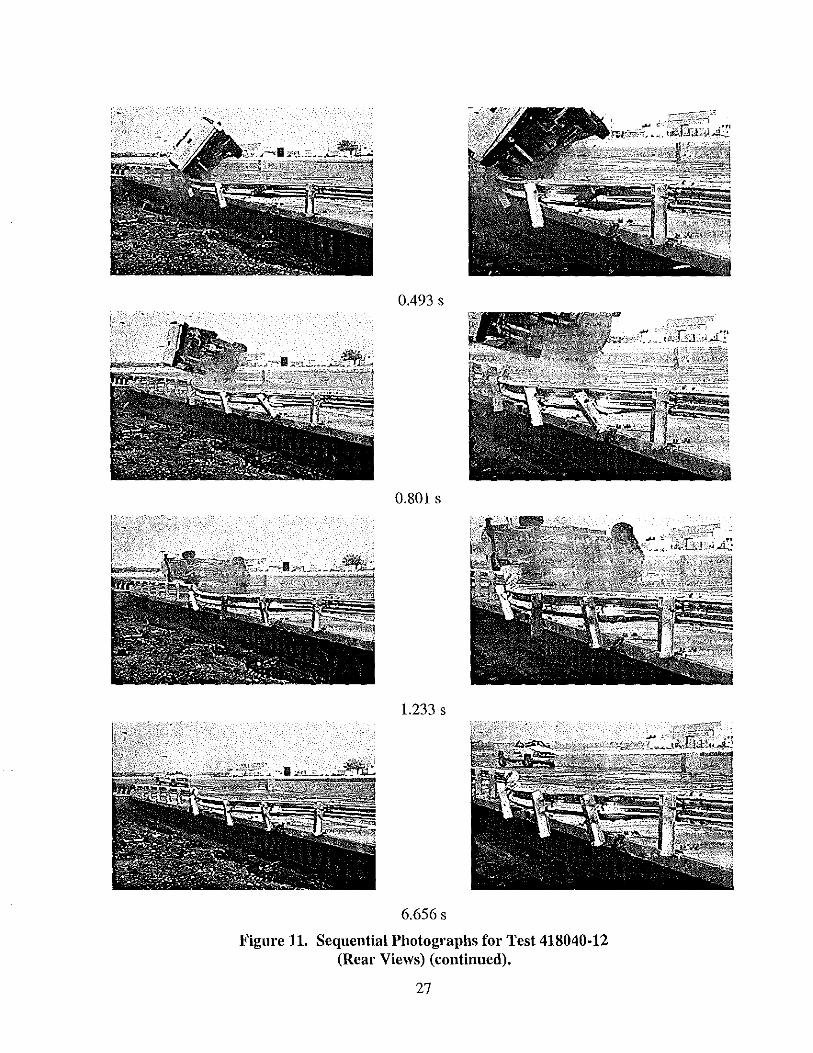
The left rear tire lost contact with the rail and the vehicle was totally airbome at 0.608 s. At 1.071 s, the vehicle contacted the ground on the traffic side of the rail. Brakes on the vehicle were not applied. The vehicle rolled 360 degrees, yawed clockwise, and subsequently came to rest 50.3 m (165.0 ft) from impact and 8.4 m (27.6 ft) toward traffic lanes.
Sequential photographs of the test period are shown in Figures 10 and 11.
Damage to Test Installation
Damage to the Texas Type T6 Bridge Rail can be seen in Figures 12 and 13. The upstream end anchor moved 25 mm (1.0 in), post 2 moved 15 mm, and posts 3 and 4 split longitudinally. Post 6 moved back 28 nun (1.1 in) and posts 7 through 10 rotated. The welds were fractured at the base at posts 11 through 13. Post 14 fractured at the base, separated from the rail and fell below the bridge deck. Post 15 fractured at the base and posts 16 through 32 rotated slightly. Post 33 moved back 23 mm (0.9 in) and posts 34 to the downstream anchor were disturbed. Maximum dynamic deflection of the rail element during the test was 0.92 m (3.0 ft) and maximum permanent deflection after the test was 0.80 m (2.0 ft).
Vehicle Damage
The vehicle after impact with the bridge rail is shown in Figure 14. Structural damage to the vehicle included deformation of the left front of the frame, right upper and lower A-anns, left A and Bposts, and right and left outer tie rod ends. The front and real' bumpers, hood, grill, radiator, fan, roof, left front and rear quarter panels, right front quarter panel, left and right doors and windows, real' window, left front headlight, and the left front tire and rim also sustained damage. The windshield was shattered. Maximum crush to the exterior of the vehicle was 430 mm (16.9 in) at the top of the front bumper on the left side. Maximum occupant compartment deformation was 232 mm (9.1 in) (21 percent reduction in space) in the left side floor pan area and 157 mm (6.2 in) (15 percent reduction of space) in the center floor pan to instrument panel area. These measurements were taken at points of reference taken prior to the test. The interior of the vehicle is shown in Figure 15. Exterior crush and occupant compartment measurements are shown in Tables 3 and 4.
Occupant Risk Values
Data from the tri-axial accelerometer, located at the vehicle center of gravity, were digitized to compute occupant impact velocity and ridedown accelerations. The occupant impact velocity and ridedown accelerations in the longitudinal axis are required for evaluation of criterion L of NCHRP Report 350. In the longitudinal direction, the occupant impact velocity was 5.2 mls (17.1 ftls) at 0.147 s, the highest 0.010-s occupant ridedown acceleration was -9.7 g's from 0.316 to 0.326 s, and the maximum 0.050-s average acceleration -5.3 g's between 0.040 and 0.090 s. In the lateral direction, the occupant impact velocity was 4.5 mls (14.8 ft/s) at 0.147 s, the highest O.OIO-s occupant ridedown acceleration was 9.9 g's from 0.319 to 0.329 s, and the maximum 0.050-s average was 6.4 g's between 0.348 and 0.398 s. These data and other pertinent information from the test are summarized in Figure 16. Vehicle angular displacements are displayed in Figure 17. Vehicular accelerations versus time traces are presented in Figures 18 through 20.
23

0.000 s
0.062 s
0.123 s
0.247 s
Figure 10. Sequential Photographs for Test 418040-12 (Overhead & Frontal Views).
24

0.493 s
0.801 s
1.233 s
Vehicle out of view. Vehicle out of view.
6.656 s
Figure 10. Sequential Photographs for Test 418040-12 (Overhead & Frontal Views) (continued).
25

0.000 s
0.062 s
0.123 s
0.247 s Figul'e 11. Sequential Photogl'aphs fOl' Test 418040·12
(Real' Views).
26
0.493 s
0.801 s
1.233 s
6.656 s
Figure 11. Sequential Photographs for Test 418040·12 (Rear Views) (continued).
27

Figure 12. Aftel' Impact Trajectory for Test 418040·12.
28

29

Figure 14. Vehicle after Test 418040-12.
30

Figure 15. Interior of Vehicle for Test 418040·12.
31

Table 3. Exterior Crush Measurements for Test 418040-12.
VEHICLE CRUSH MEASUREMENT SHEET1
Complete When Applicable
End Damage Side Damage
Undeformed end width B1 Xl Bowing: -- --Corner shift: Al B2 X2 --
A2
End shi ft at frame (CDC) Bowing constant (check one) Xl + X2
= < 4 inches 2 ---> 4 inches
Note: Measure CI to C6 from Driver to Passenger side in Front or Rear impactsRear to Front in Side impacts.
Direct Damage Specific
C, C, c, Impact Plane*" of Width ** Max**-*" Field Number C-Measurcments (CDC) Crush L*'"
1 At front bumper 890 430 700 430 370 270
2 750 mm above ground 890 280 1100 30 80 NlA
'Table taken from National Accident Sampling System (NASS).
--
c, c,
140 40
N/A 100
C, ±D
0 -350
280 +1570
*Identify the plane at which the C-measurements are taken (e.g., at bumper, above bumper, at sill, above sill, at beltline, etc.) or label adjustments (e.g., free space).
Free space value is defined as the distance between the baseline and the original body contour taken at the individual C locations. This may include the following: bumper lead, bumper taper, side protrusion, side taper, etc. Record the value for each C-measurement and maximum crush.
**Measure and document on the vehicle diagram the beginning or end of the direct damage width and field L (e.g., side damage with respect to undamaged axle).
***Measure and document on the vehicle diagram the location of the maximum crush. Note: Use as many lines/columns as necessary to describe each damage profile.
32

Table 4. Occupant Compartment Measurements for Test 418040·12.
Truck
Occupant Compartment Deformation
33
A1
A2
A3
B1
B2
B3
C1
C2
C3
01
02
03
E1
E2
F
G
H
J
BEFORE
1039
1082
1042
1073
1070
1082
1375
1256
1362
307
102
315
1589
1595
1465
1465
900
900
1520
AFTER
1042
1095
1045
1086
913
850
1395
1256
1372
300
85
308
1573
1630
1490
1360
905
935
1462

v.> .j:>.
0.9 m-I(- i 50.3m,---•• ~± .• ± ~~ .••• _.
27' 26' ----~=&C.= ~. ,~,-----
~ f--9.4 m~
General Information Test Agency . .......... .. Texas Transportation Institute Test No ................. 418040-12 Date . . . . . . . . . . . . . . . . . .. 11/04/99
Test Article Type. . . . . . . . . . . . . . . . . .. Bridge Rail Name or Manufacturer .... _ Texas Type T6 Bridge Rail Installation Length (m) ..... 54.0 (177.2 tt) Material or Key Elements .. ' Tubular W~Beam on
W6x9 Steel Posts Soil Type and Condition .... Bridge Deck, Dry Test Vehicle
Type. . . . . . . . . . . . . . . . . .. Production Designation ............. 2000P Model. . . . . . . . . . . . . . . . .. 1994 Chevrolet 2500 Pickup Truck Mass (kg)
Curb ................. 2048 (4515Ib) Test Inertial ........... 2000 (4409 Ib) Dummy .............. No Dummy Gross Static. . . . . . . . . .. 2000 (4409 Ib)
r -81 ~
Impact Conditions Speed (km/h) ............. 99.5 (61.8 milh) Angle (deg) .............. 27.0
Exit Conditions Speed (km/h) . . . . . . . . . . . .. 64.8 (40.3 mi/h) Angle (deg) .............. 27.7
Occupant Risk Values Impact Velocity (m/s)
x-direction ............. 5.2 (17.1 ttls) y~direction ............. 4.5 (14.8 ttls)
THIV (km/h) ............. 23.6 (14.7 milh) Ridedown Accelerations (g's)
x-direction . _ .. ..... _ . " -9.7 y~direction ............. 9.9
PHD (g's) ................ 14.6 ASI .................... 0.74 Max 0.050-5 Average (g's)
x~direction ............. -5.3 y-direction ............. 6.4 z-direction ............. 4.7
Test Article Deflections (m) Dynamic. . . . . . . . . . . . . . . .. 0.92 (3.0 tt) Permanent ............... 0.80 (2.0 tt)
Vehicle Damage Exterior
VDS .................. lIL&T2 CDC . . . . . . . . . . . . . . . . .. 11 FLEK2&
OOLDAO Maximum Exterior
Vehicle Crush (mm) .... " 430 (16.9 in) Interior
OCDI ................. LF0300000 Max. Occ. Compart
Defonmation (mm) ....... 232 (9.1 in) PosHmpact Behavior
(during 1.0 s after impact) Max. Yaw Angle (deg) ...... 86 Max. Pitch Angle (deg) ...... -6 Max. Roll Angle (deg) . . . . . .. -91 (rolled one
revolution after loss of contact)
Figure 16. Summary of Results for Test 418040·12, NCHRP Report 350 Test 3-11.

" • ~ 0> • ::;.
w 0 • v. "E> c ..
Crash Test 418040-12 100
50
0
-SO -
I ., ~I?<:;:""'
__ ~~"'P\l~
Tost Article: Texas T6 Bridge Rail Tost VOhicle: 1994 Chovrolet 2500 pickup truck Inertial Mass: 2000 kg Gross Mass: 2000 kg Impact Speed: 99.5 krn/h Impact Anglo: 27 dogrees
(2 ~, V H
.. Z ! ~'I~W
--100 I I I I I I I I i I I I iii I 01 U U M M M ~ M M ,:0
Time (sec)
F ---;-J Roll - Pitch _ Yaw
Figure 17. Vehicle Angular Displacements for Test 418040-12.

.. :;:, c g e • .. 0 0
'" " c '6 , :a, w c 0 0--'
Crash Test 418040-12 10-r'-----------------------------------------------------------------------------------------------------,
~ 5 -
-10-
Test Articlo: Toxas T6 Bridgo Rail ,I Test Vohicle: 1994 Chevrolet 2500 pickup truck
Inertial Mass: 2000 kg Gross Mass: 2000 kg Impact Spood: 99.5 kmlh Impact Angle: 27 dogrees
-15 -1lh.,.....,-,-,rr.,..."'-r-1rr-rT"r-1--r-rT"r-1--r-r..-OT--,--r-..-OT--,-..,-,-,rr""''''-'-'''''''''''-T"r-1--r-rT"r-1--1 0:1 0:2 0:3 0:4
ESA~-~r --.;..;;.:T~~fOIV(D.1465~1
0:5
Time (sec) 0:6 0:7 0:8
Figure 18. Vehicle Longitudinal Accelerometer Trace for Test 418040-12.
0:9 1:0

'" -.J
7ii :s c 0
~ • -. 0 0
" • ~ • > • c
i!-
15-
-5
-10
SAE Class 60 Filtar -TImoof OIV (0.1465 sec)
Crash Test 418040-12
Tost Article: Texas T6 Bridge Rail Test Vehicle: 1994 Chevrolot 2500 pickup truck Inertial Mass: 2000 kg Gross Mass: 2000 kg . - '; 99.5 kmlh
dogrees
Time (sec)
Figure 19. Vehicle Lateral Accelerometer Trace for Test 418040-12.

-;;;-,!!! c 0
~ m ;; u u
'" ;;; u ;:
W m >
00
20 -
15 -
10- - - , - - - - -
5 -
-5 -
Crash Test 418040-12
Tost Articlo: Toxas T6 Brid~o Rail Test Vohiclo: 1994 Chevrolet 2500 pickup truck I nortlal Mass: 2000 kg G ross Mass: 2000 kg Impact Spood: 99.5 k!"l'll11 Impact Anglo: 27 dOQroos
-104T-r'-~-r'-~-r'-~-r'-~-r'-~-r'-~rT'-~rT'-~rT'-~rT'-~rT'-~rT-r~rT~ 0:1 0:2 0:3 0:4
ESAE-CI~~S~
0:5
Time (sec) 0:6 0:7 0:8
Figure 20. Vehicle Vertical Accelerometer Trace for Test 418040·12.
0:9 1:0

IV. SUMMARY OF FINDINGS AND CONCLUSIONS
SUMMARY OF FINDINGS
As stated previously, the following NCHRP Report 350 safety evaluation criteria were used to evaluate this crash test:
• Structural Adequacy
A. Test article shollid contain and redirect the vehicle; the vehicle shollid not penetrate, llllderride, or override the installation although controlled lateral deflection of the test article is accepta ble.
The Texas T6 Bridge Rail contained and redirected the 2000P vehicle. The vehicle did not penetrate, undellide, or ovenide the installation. Maximum lateral defOlmation was 0.92 m (3.0 ft).
• Occupant Risk
D. Detached elements, fragmellfs or other debris from the test article shollid not penetrate or show potential for penetrating the occllpant compartment, or present an lIndlle hazard to other traffic, pedestrians, or personnel in a 1Vork zone. Defonnation of, or intrusions into, the occllpant compartment that cOllld calise seriolls injllries shollid not be permitted.
Detached posts 11 through 15 did not penetrate nor show potential for penetrating the occupant compartment. All detached posts were lying on the field side of the bridge rail installation. Maximum occupant compartment deformation was 232 mm (9.1 in).
F. The vehicle shollid remainllpright dllring and after collision althollgh moderate roll, pitching and yawing are acceptable.
The 2000P vehicle yawed significantly and then rolled 360 degrees during and after the collision period.
39

• Vehicle Trajectory
K. After collision it is preferable that the vehicle's trajectory not intrude into adjacent traffic lanes.
The vehicle came to rest 50.3 m (165.0 ft) from impact and 8.4 m (27.6 ft) toward traffic lanes.
L. The occupant impact velocity in the longitudinal direction should not exceed 12mls (39.4 ftls) and the occupant ridedown acceleration ill the longitudinal direction should not exceed 20 g's.
Longitudinal occupant impact velocity was 5.2 m1s (17.1 ft/s) and longitudinal ridedown acceleration was -9.7 g's.
M. The exit angle from the test article preferably should be less than 60 percent of the test impact angle, measured at time of vehicle loss of contact with the test device.
The exit angle at loss of contact was 27.7 degrees which was 102 percent greater than the impact angle.
CONCLUSIONS
The modified T6 posts readily yielded to the vehicle. However, the vehicle rolled 360 degrees upon exiting the rail. As shown in Table 5, the modified T6 Btidge Rail does not meet critetia specified for NCHRP Report 350 test 3-11.
40

.,.. ....
I
Table 5. Performance Evaluation Summary for Test 418040-12, NCHRP Report 350 Test 3-11.
Test Agency: Texas Transportation Institute Test No.: 418040-12 Test Date: 11/04/99 ~
NCHRP Report 350 Evaluation Criteria I Test Results I Assessment
Structural Adequacy
A. Test article should contain and redirect the vehicle; the The Texas Type T6 Bridge Rail contained and vehicle should not penetrate. underride. or override the redirected the vehicle. The vehicle did not penetrate, Pass installation, although controlled lateral deflection of the test underride, or override the installation. article is acceptable.
Occupant Risk
D. Detached elements, fragments, or other debris from the test Posts 11 through 15 became detached during the test article should not penetrate or show potential for penetrating but did not penetrate nor show potential for the occupant compartment, or present an undue hazard to penetrating the occupant compartment, nor did they other traffic, pedestrians, or personnel in a work zone. present any undue hazard to others in the area. Fail Deformations of, or intrusions into, the occupant Maximum deformation into the occupant compartment that could cause serious injuries should not be compartment was 232 mm (9.1 in) and was judged to permitted. have potential for causing serious injury.
F. The vehicle should remain upright during and after collision, The vehicle rolled 360 degrees after exiting the bridge Fail
although moderate roll, pitching, and yawing are acceptable. rail.
Vehicle Trajectory
K. After collision, it is preferable that the vehicle's trajectory The vehicle came to rest 50.3 m (165.0 ft) down from Fail*
not intrude into adjacent traffic lanes. impact and 8.4 m (27.6 ft) toward traffic lanes.
L. The occupant impact velocity in the longitudinal direction Longitudinal occupant impact velocity was 5.2 rnfs should not exceed 12 rnfs (39.4 ftls), and the occupant (17.1 ftls) and longitudinal ridedown acceleration was
Pass ridedown acceleration in the longitudinal direction should -9.7 g's. not exceed 20 g's.
M. The exit angle from the test article preferably should be less The exit angle at loss of contact was 27.7 degrees than 60 percent of test impact angle, measured at time of which was 102 percent of the impact angle. Fail* vehicle loss of contact with test device.
*Criterion K and M preferable, not required.


REFERENCES
1. Dwight A. Horne, Crash Testing of Bridge Railings, FHW A Memorandum, May 30, 1997.
2. H. E. Ross, Jr., D. L. Sicking, R. A. Zimmer, and J. D. Michie, Recollllllellded Procedures for the Safety Pelforll/allCe Evaluation of Highway Features, NCHRP Report 350, Transportation Research Board, Washington, D.C., 1993.
3. MSHTO LRFD Bridge Design Specifications, Customary U.S. Units First Edition, American Association of State Highway and Transportation Officials, Washington, D.C., 1994.
4. T. J. Hirsch, John J. Panak, and C. E. Buth, Tubular W-Bealll Bridge Rail, Research Report 230-1 of Research Study 2-5-78-230 for the Texas State Deparlment of Highways and Public Transportation, Texas Transportation Institute, The Texas A&M University System, College Station, Texas, October 1978.
5. J. D. Michie, Recollllllended Procedures for the Safety Peljorlllance Evaluation of Highway Appurtenances, NCHRP Report 230, Transportation Research Board, Washington, D.C., 1980.
6. C. Eugene Buth, Roger P. Bligh, and Wanda L. Menges, NCHRP Repott 350 Test 3-11 of the Texas Type T6 Bridge Rail, Letter Repott 1804-4 of Research Study 0-1804 for the Texas Department of Transportation, Texas Transportation Institute, The Texas A&M University System, College Station, Texas, July 1998.
7. C. Eugene Buth, William F. Williams, Roger P. Bligh, and Wanda L. Menges, Test 3-NCHRP Report 350 Test 3-11 of the Modified Texas Type T6 Bridge Rail on Bridge Deck, Letter Report 1804-5 of Research Study 0-1804 for the Texas Department of Transportation, Texas Transportation Institute, The Texas A&M University System, College Station, Texas, October 1998.
8. C. Eugene Buth, William F. Williams, Roger P. Bligh, and Wanda L. Menges, Test 8 -NCHRP Repolt 350 Test 3-11 of the Modified Texas Type T6 Bridge Rail on Bridge Deck, Letter Report 1804-8 of Research Study 0-1804 for the Texas Department of Transportation, Texas Transportation Institute, The Texas A&M University System, College Station, Texas, November 1999.
43