test document 0.6 - internal.ece.toronto.edu · proposal test document ... our project goal is to...
TRANSCRIPT

Updated Oct. 20, 2014 1
Test Document Guidelines
The test document should be an evolving document that tracks the progression of the project over the year. It will be a guide to what has happened and will change to reflect the true status of the project. You will bring the Test Document to meetings with your Administrators such as the December meeting, and a copy of it will be attached in future documents as an Appendix.
Introduction The Test Document carries on where your Project Proposal left off. As can be seen from the comparison table below, it omits those portions such as the Background that you will only need to revisit towards the end of the project and keeps others such as Project Goal and Requirements that you will need to refer to regularly. They are the sections that capture the essence of your project.
Section Draft
A Draft
B Final
proposal Test
document Executive Summary X Table of Contents X Project Description Background and Motivation X X X Project Goal X X X X Project Requirements X X X X Validation and Acceptance Tests X X X
Technical Design Possible Solutions and Design Alternatives X X X System-level Diagram and Overview X X Module-level Descriptions X Assessment of Proposed Solution X X Work Plan Work breakdown Structure and Gantt Chart X X X Financial Plan X X Feasibility Assessment (resources, risks) X X X Conclusion X References X X X Appendices Appendix A: Student-supervisor agreement form X Appendix B: Report Attribution Table X
Updated Oct. 20, 2014 2
One could arguably carry on using the entire proposal as a guide, but keeping only what you need makes it easier to focus on what's really needed now to successfully execute your project. This gives you room to document what still needs to be flushed out, principally, the areas of Testing and Verification. You will want to review the Testing and Verification section regularly to ensure it is accurate and complete, updating the Test Document, while keeping it short and concise.
Generating the Test Document Creating the initial test document requires no additional work as it is simply extracted from your Project Proposal. What is new is the testing and so it deserves more thought and further discussion. So far, under Validation and Acceptance Test, we've just emphasized having simple validation tests for your goal and the success of the overall project. This is fine as a start, but over time, as you better understand your design, you will need to expand the Validation and Acceptance Test section in order to capture your deeper understanding. As you more clearly understand what function each of your module performs and how they interact, you will need to change some requirements and remove others. Eventually, the requirements that remain are the ones that are truly needed and for each of them, you should have a clear idea of how to verify them. Similarly, have a clear idea of how to validate each of your system modules. It may take some time, but eventually, each Requirement and Module will have a verification test. Use your judgment when writing this section; ignore those requirements where validation is obvious: we don't need you to tell us how you will verify that your prototype is yellow. Verifying that your algorithm is efficient, however, requires quite a bit of work, not the least of which is clarifying what you mean by 'efficient', and by what benchmark you will compare your algorithm to.
Parts of the Test Document
Project Goal The project goal concisely summarizes what the project aims to achieve. It focuses on the desired result and not the implementation, identifies the main criteria for success and links back to the original design problem
Project Requirements The Project Requirements must be verifiable, solution-independent, clearly worded and supports the project goal. The Requirements provide a list of target project requirements, which will be used to evaluate the success of the project. Project requirements are divided into three categories:
• Functional requirements [must-have to fulfill goal expressed in Pass/Fail terms] • Constraints [externally legislated or client-enforced expressed in Pass/Fail terms] • Objectives [nice to have. Traded off against cost, time, other objectives]
Updated Oct. 20, 2014 3
The System-Level Overview
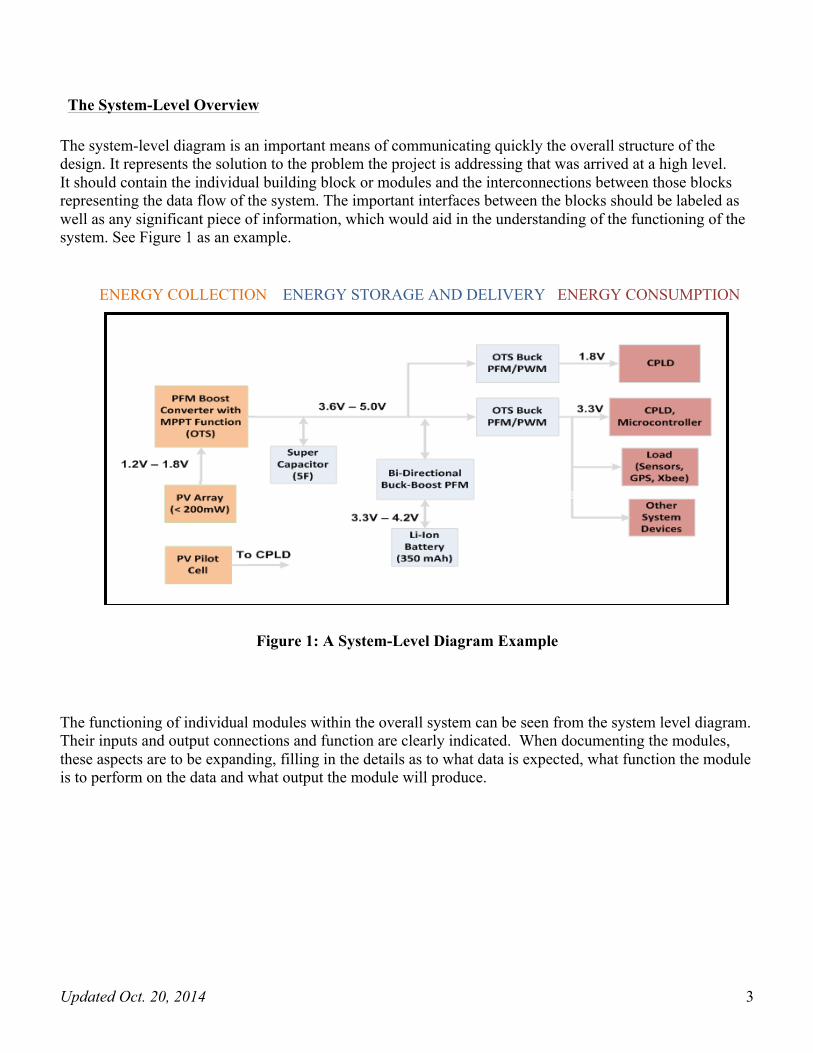
The system-level diagram is an important means of communicating quickly the overall structure of the design. It represents the solution to the problem the project is addressing that was arrived at a high level. It should contain the individual building block or modules and the interconnections between those blocks representing the data flow of the system. The important interfaces between the blocks should be labeled as well as any significant piece of information, which would aid in the understanding of the functioning of the system. See Figure 1 as an example. ENERGY COLLECTION ENERGY STORAGE AND DELIVERY ENERGY CONSUMPTION
Figure 1: A System-Level Diagram Example The functioning of individual modules within the overall system can be seen from the system level diagram. Their inputs and output connections and function are clearly indicated. When documenting the modules, these aspects are to be expanding, filling in the details as to what data is expected, what function the module is to perform on the data and what output the module will produce.

Updated Oct. 20, 2014 4
Validation and Acceptance Tests
The initial Validation and Acceptance tests from the Project Proposal validating the success of the overall project. This is the highest level of validation and for the test document we will be breaking this down by introducing additional tests at the system- and module-level. The reason is for this is that testing a completely new system as a single unit is extremely difficult and the probability of success is very low. Unit Testing is the low-level testing of the individual modules that are outlined in the system-level diagram. As each module has its functions, input and outputs defined, they can be treated as individual black boxes that can be tested independently of the system. Once each of the modules have been tested and verified to be functioning as designed, the next step is System Testing. Here the individual modules are linked and tested as groups. This removes any errors in the interfaces between the modules as more modules are linked together, until the entire system can be tested end-to-end. At this point, overall testing of the system can be done. By starting small and growing outward, the probability of success is much greater. A good method of representing the Validation and Acceptance test is in the form of a table. The table can be broken down into three columns or categories.
• What is being tested – typically an item from the Project Requirements or Module description. • How the test is to be run • The Pass/Fail criteria, which determines how well the Project Requirement was met.
Validation Test Test Procedure Success Criteria
What? How? Result

Updated Oct. 20, 2014 5
Sample Test Document The following is an example from a past project titled: “A Wireless Sensor Node Powered by a PV/SuperCapacitor/Battery Trio” Project Goal
Our project goal is to create a wireless sensor node that uses a unique power management scheme to coordinate power storage and delivery between a small solar panel, and energy storage devices, ensuring long-lasting operation. Project Requirements
Functions The wireless sensor node shall perform the following functions:
1. Collect environmental data including: soil moisture, humidity, temperature, light intensity, and location coordinates.
2. Collect on-board electrical data including: solar panel open-circuit voltage, battery voltage and current, and super capacitor voltage.
3. Transmit the collected data wirelessly to a nearby computer over a distance of 50m. 4. Allow changes to data collection and transmission rates, through software, prior to deployment. 5. Recharge the energy storage devices with surplus solar energy. 6. Implement a Maximum Power Point Tracker for the photovoltaic cells operating at a minimum of 80%
accuracy for Maximum Power Tracking. 7. Implement a DC/DC Converter to regulate the output voltage of the solar array as dictated by the MPPT.
The converter should operate at a minimum of 80% efficiency, and regulate the voltage within a +/- 2% tolerance.
8. Implement a DC/DC Converter that regulates current through Pulse Frequency Modulation to transfer energy amongst the energy storage devices. The converter itself should operate at a minimum of 80% efficiency, and regulate the current within a +/- 5% tolerance.
9. Execute a power management program to maximize the operational lifetime of the WSN. 10. Regulate a main-rail voltage to 3.3V within +/- 5%, at a minimum of 85% efficiency. 11. Regulate a sub-rail voltage to 1.8V within +/- 5%, at a minimum of 85% efficiency. 12. Program the micro controller and CPLD devices for testing and final operation. 13. Allow the on-board micro controller and CPLD to communicate with each other.
Objectives
The wireless sensor node should exhibit the following objectives: 1. Use any number of solar panels of any rating, so long as the instantaneous power generated by the solar
array is no more than 200mW. Constraints
The wireless sensor node must adhere to the following constraints: 1. Operate outdoors during the day under varying lighting conditions and during the night. 2. Measure no larger than 6 inches x 4 inches in size. 3. Remain operational for no less than 7 days. 4. Operate autonomously once deployed. 5. Use a super capacitor as an energy storage device. 6. Use a rechargeable battery as an energy storage device.
Updated Oct. 20, 2014 6
Validation and Acceptance Tests
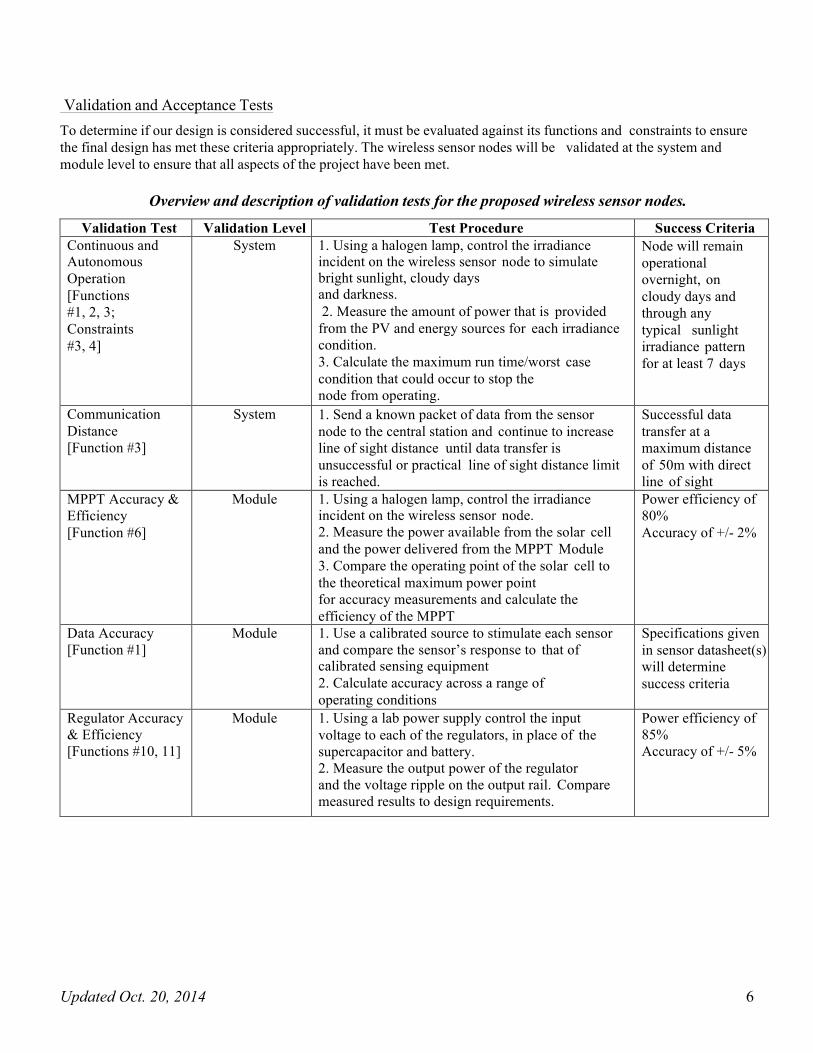
To determine if our design is considered successful, it must be evaluated against its functions and constraints to ensure the final design has met these criteria appropriately. The wireless sensor nodes will be validated at the system and module level to ensure that all aspects of the project have been met.
Overview and description of validation tests for the proposed wireless sensor nodes.
Validation Test Validation Level Test Procedure Success Criteria Continuous and Autonomous Operation [Functions #1, 2, 3; Constraints#3, 4]
System 1. Using a halogen lamp, control the irradiance incident on the wireless sensor node to simulate bright sunlight, cloudy days and darkness. 2. Measure the amount of power that is provided
from the PV and energy sources for each irradiance condition. 3. Calculate the maximum run time/worst case condition that could occur to stop the node from operating.
Node will remain operational overnight, on cloudy days and through any typical sunlight irradiance pattern for at least 7 days
Communication Distance [Function #3]
System 1. Send a known packet of data from the sensor node to the central station and continue to increase line of sight distance until data transfer is unsuccessful or practical line of sight distance limit is reached.
Successful data transfer at a maximum distance of 50m with direct line of sight
MPPT Accuracy & Efficiency [Function #6]
Module 1. Using a halogen lamp, control the irradiance incident on the wireless sensor node. 2. Measure the power available from the solar cell and the power delivered from the MPPT Module 3. Compare the operating point of the solar cell to the theoretical maximum power point for accuracy measurements and calculate the efficiency of the MPPT
Power efficiency of 80% Accuracy of +/- 2%
Data Accuracy [Function #1]
Module 1. Use a calibrated source to stimulate each sensor and compare the sensor’s response to that of calibrated sensing equipment 2. Calculate accuracy across a range of operating conditions
Specifications given in sensor datasheet(s) will determine success criteria
Regulator Accuracy & Efficiency [Functions #10, 11]
Module 1. Using a lab power supply control the input voltage to each of the regulators, in place of the supercapacitor and battery. 2. Measure the output power of the regulator and the voltage ripple on the output rail. Compare measured results to design requirements.
Power efficiency of 85% Accuracy of +/- 5%
Updated Oct. 20, 2014 7
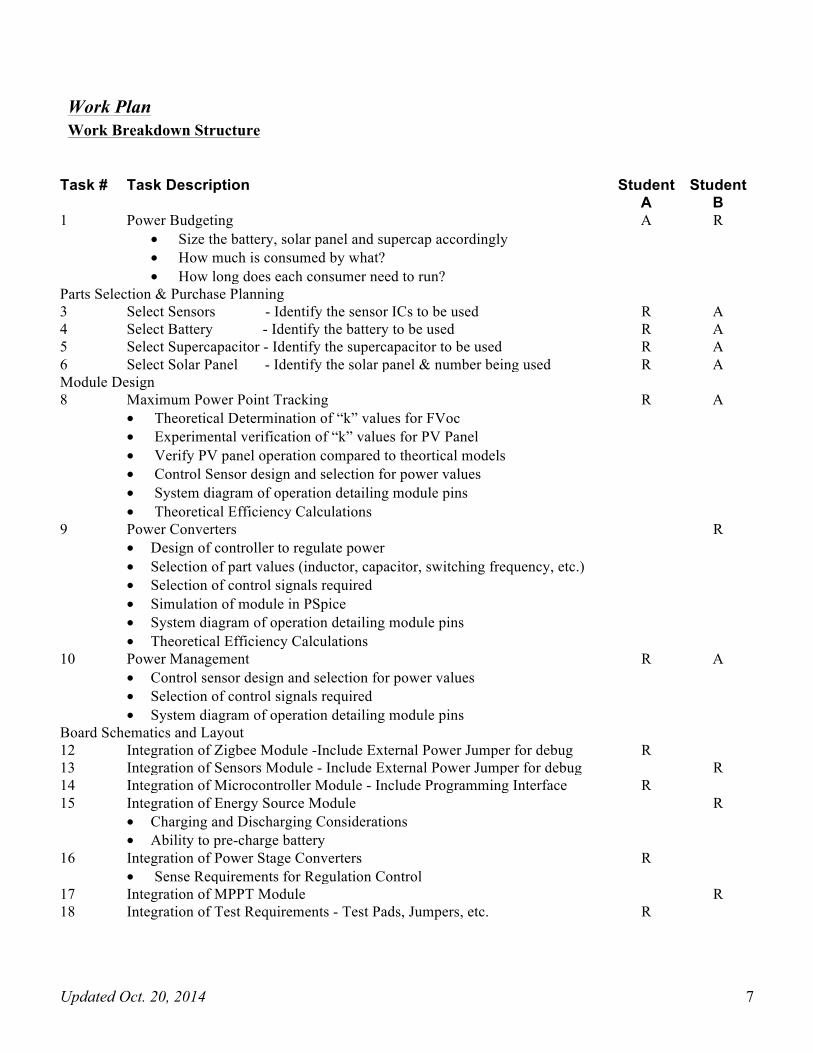
Work Plan Work Breakdown Structure
Task # Task Description Student A
Student B
1 Power Budgeting • Size the battery, solar panel and supercap accordingly • How much is consumed by what? • How long does each consumer need to run?
A R
Parts Selection & Purchase Planning 3 Select Sensors - Identify the sensor ICs to be used R A 4 Select Battery - Identify the battery to be used R A 5 Select Supercapacitor - Identify the supercapacitor to be used R A 6 Select Solar Panel - Identify the solar panel & number being used R A Module Design 8 Maximum Power Point Tracking
• Theoretical Determination of “k” values for FVoc • Experimental verification of “k” values for PV Panel • Verify PV panel operation compared to theortical models • Control Sensor design and selection for power values • System diagram of operation detailing module pins • Theoretical Efficiency Calculations
R A
9 Power Converters • Design of controller to regulate power • Selection of part values (inductor, capacitor, switching frequency, etc.) • Selection of control signals required • Simulation of module in PSpice • System diagram of operation detailing module pins • Theoretical Efficiency Calculations
R
10 Power Management • Control sensor design and selection for power values • Selection of control signals required • System diagram of operation detailing module pins
R A
Board Schematics and Layout 12 Integration of Zigbee Module -Include External Power Jumper for debug R 13 Integration of Sensors Module - Include External Power Jumper for debug R 14 Integration of Microcontroller Module - Include Programming Interface R 15 Integration of Energy Source Module
• Charging and Discharging Considerations • Ability to pre-charge battery
R
16 Integration of Power Stage Converters • Sense Requirements for Regulation Control
R
17 Integration of MPPT Module R 18 Integration of Test Requirements - Test Pads, Jumpers, etc.
R

8
Gantt Chart
Red = Student A, Blue = Student B
Figure 59.Gantt Chart representation of project planning as of October 2011.

9
Sample Unit-Level Test (presented in the Progress Report)
Functional Requirement 11 - Regulating 1.8V
Target Tolerance Actual Tolerance Pass/Fail Target Efficiency Actual Efficiency Pass/Fail
+/- 5% Worst pk-pk is
2.2% Average is
0.87%
PASS > 85%
> 85.5% PASS
Figure 51 below depicts efficiency curves for the 1.8V buck converter that drive the CPLD core. The device was tested at low, mid, and high input voltages representing expected super capacitor voltages. A DC load was used to produce output currents of 1.1mA, 3.1mA, and 5.1mA, though this device will consume less than 1mA. The measured efficiencies meet the minimum 85% requirement. Figure 52 is a screenshot demonstrating the output regulation at worst case input voltage (5V), and Iout = 1mA. Again, the yellow signal is the input voltage from a power supply, and the green signal is the regulated 1.8V output. The captured measurements show a worst-case peak-to-peak variation of 2.2%, with the average voltage falling within 0.87% of 1.8V. Overall this requirement was satisfied.
Figure 51. Efficiency Curves of 1.8V Buck Converter
Figure 52. Screenshot of 1.8V Converter with Vin = 5V, Iout = 1mA, Peak-Peak variation = 2.2%.
10
!
!
!
Sample System-Level Tests (presented in the Final Report)
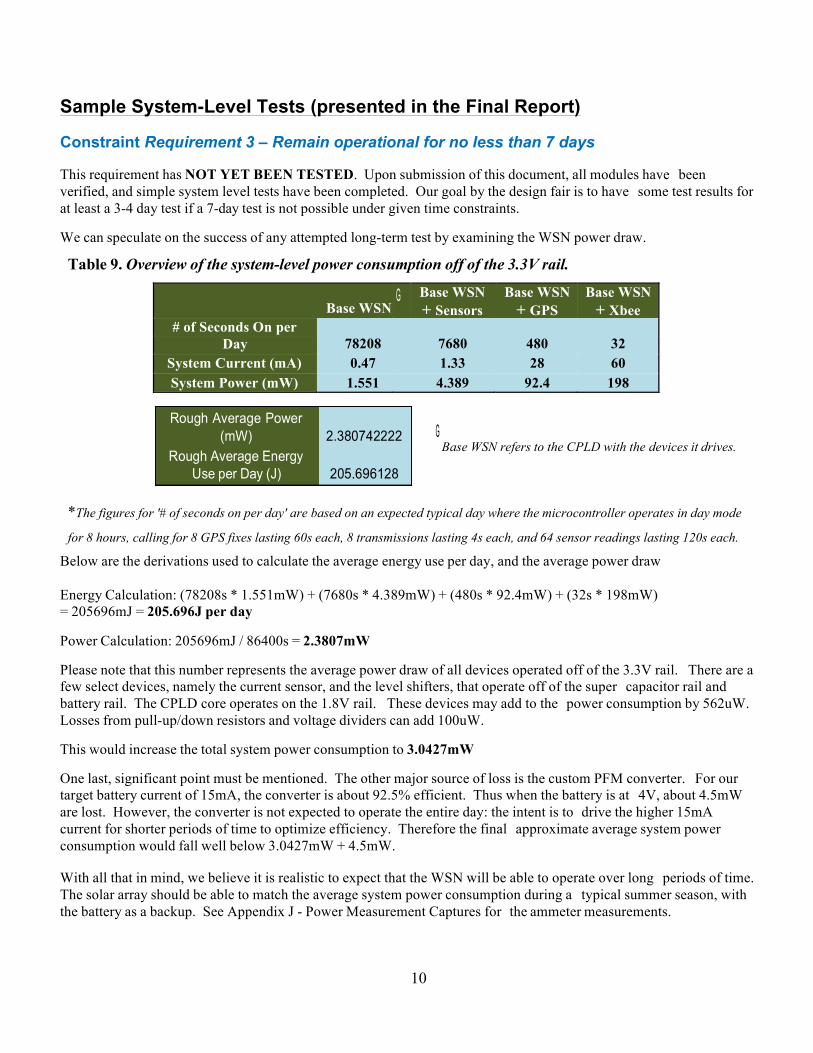
Constraint Requirement 3 – Remain operational for no less than 7 days This requirement has NOT YET BEEN TESTED. Upon submission of this document, all modules have been verified, and simple system level tests have been completed. Our goal by the design fair is to have some test results for at least a 3-4 day test if a 7-day test is not possible under given time constraints. We can speculate on the success of any attempted long-term test by examining the WSN power draw.
Table 9. Overview of the system-level power consumption off of the 3.3V rail.
!Base WSN
G Base WSN + Sensors
Base WSN + GPS
Base WSN + Xbee
# of Seconds On per !78208
!7680
!480
!32 Day
System Current (mA) 0.47 1.33 28 60 System Power (mW) 1.551 4.389 92.4 198
G Base WSN refers to the CPLD with the devices it drives.
*The figures for '# of seconds on per day' are based on an expected typical day where the microcontroller operates in day mode
for 8 hours, calling for 8 GPS fixes lasting 60s each, 8 transmissions lasting 4s each, and 64 sensor readings lasting 120s each.
Below are the derivations used to calculate the average energy use per day, and the average power draw Energy Calculation: (78208s * 1.551mW) + (7680s * 4.389mW) + (480s * 92.4mW) + (32s * 198mW) = 205696mJ = 205.696J per day Power Calculation: 205696mJ / 86400s = 2.3807mW Please note that this number represents the average power draw of all devices operated off of the 3.3V rail. There are a few select devices, namely the current sensor, and the level shifters, that operate off of the super capacitor rail and battery rail. The CPLD core operates on the 1.8V rail. These devices may add to the power consumption by 562uW. Losses from pull-up/down resistors and voltage dividers can add 100uW. This would increase the total system power consumption to 3.0427mW One last, significant point must be mentioned. The other major source of loss is the custom PFM converter. For our target battery current of 15mA, the converter is about 92.5% efficient. Thus when the battery is at 4V, about 4.5mW are lost. However, the converter is not expected to operate the entire day: the intent is to drive the higher 15mA current for shorter periods of time to optimize efficiency. Therefore the final approximate average system power consumption would fall well below 3.0427mW + 4.5mW. With all that in mind, we believe it is realistic to expect that the WSN will be able to operate over long periods of time. The solar array should be able to match the average system power consumption during a typical summer season, with the battery as a backup. See Appendix J - Power Measurement Captures for the ammeter measurements.
11
Flag !
Meaning !
Values
WSN
WSN
O !
Operation !
D: Day, N: Night
N !# of sets of data
per hour > 0
H
0-1024
L
Light
S
Soil
0-1024
T
0-1024
Flag !
Meaning !
Values
I
Battery Current
0 - 1024
V
Battery Voltage
0 - 1024
C !
Super Cap.Voltage0 - 1024
P !
Pilot CellVoltage0 - 1024
R
0 - 23
M
0 - 59
E
0 - 59
Flag !
Meaning !
Values
G !
Is there GPS data?
N: No, Y: Yes
* When G is Y, actual GPS data is sent in terms of latitude and longitude.
** Values 0-1024 represent the output of the 10-bit ADC, which can be post-processed
to equivalent 3.3V - referenced analog values.
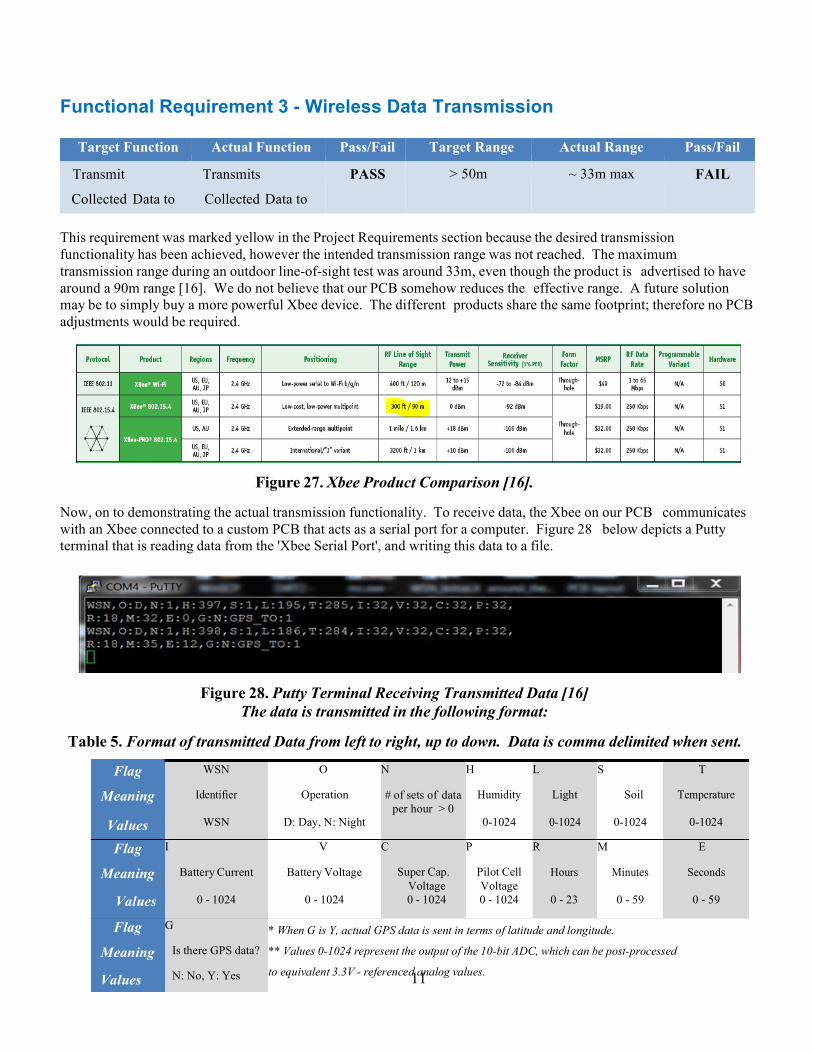
Functional Requirement 3 - Wireless Data Transmission
Target Function Actual Function Pass/Fail Target Range Actual Range Pass/Fail
Transmit
Collected Data to
a Computer
Transmits
Collected Data to
a Computer
PASS > 50m ~ 33m max FAIL
This requirement was marked yellow in the Project Requirements section because the desired transmission functionality has been achieved, however the intended transmission range was not reached. The maximum transmission range during an outdoor line-of-sight test was around 33m, even though the product is advertised to have around a 90m range [16]. We do not believe that our PCB somehow reduces the effective range. A future solution may be to simply buy a more powerful Xbee device. The different products share the same footprint; therefore no PCB adjustments would be required.
Figure 27. Xbee Product Comparison [16]. Now, on to demonstrating the actual transmission functionality. To receive data, the Xbee on our PCB communicates with an Xbee connected to a custom PCB that acts as a serial port for a computer. Figure 28 below depicts a Putty terminal that is reading data from the 'Xbee Serial Port', and writing this data to a file.
Figure 28. Putty Terminal Receiving Transmitted Data [16] The data is transmitted in the following format:
Table 5. Format of transmitted Data from left to right, up to down. Data is comma delimited when sent.
12
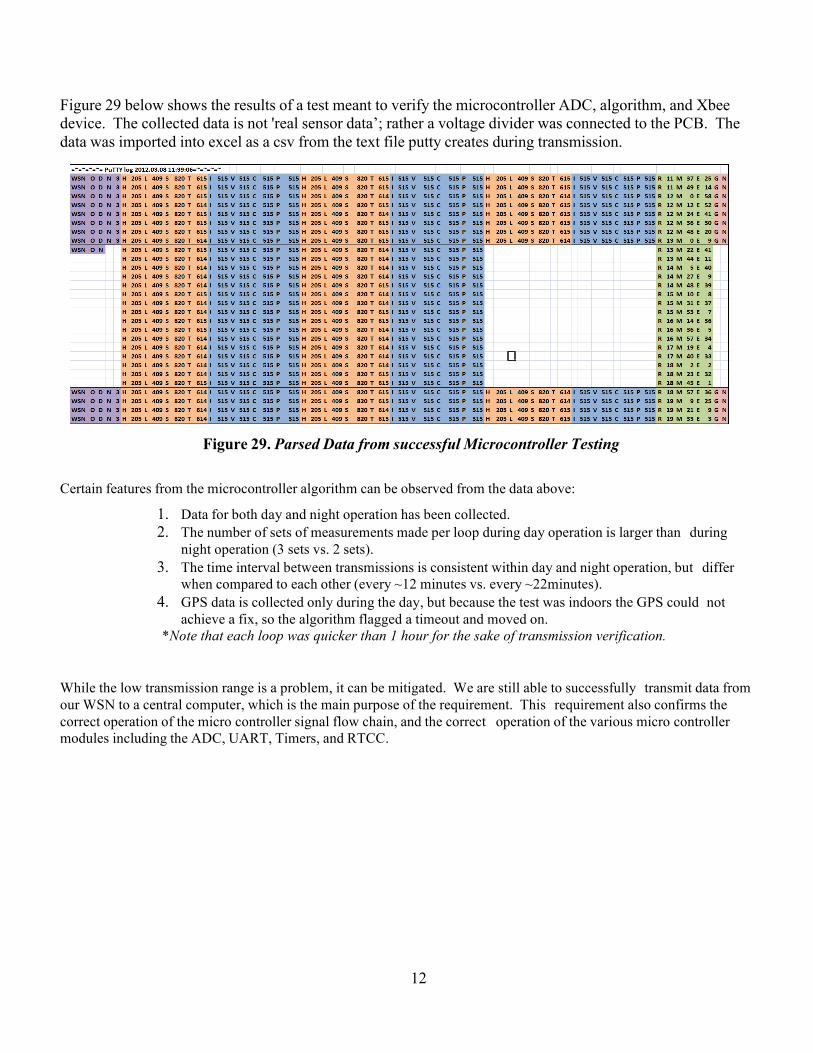
Figure 29 below shows the results of a test meant to verify the microcontroller ADC, algorithm, and Xbee device. The collected data is not 'real sensor data’; rather a voltage divider was connected to the PCB. The data was imported into excel as a csv from the text file putty creates during transmission.
Figure 29. Parsed Data from successful Microcontroller Testing
Certain features from the microcontroller algorithm can be observed from the data above:
1. Data for both day and night operation has been collected. 2. The number of sets of measurements made per loop during day operation is larger than during
night operation (3 sets vs. 2 sets). 3. The time interval between transmissions is consistent within day and night operation, but differ
when compared to each other (every ~12 minutes vs. every ~22minutes). 4. GPS data is collected only during the day, but because the test was indoors the GPS could not
achieve a fix, so the algorithm flagged a timeout and moved on. *Note that each loop was quicker than 1 hour for the sake of transmission verification.
While the low transmission range is a problem, it can be mitigated. We are still able to successfully transmit data from our WSN to a central computer, which is the main purpose of the requirement. This requirement also confirms the correct operation of the micro controller signal flow chain, and the correct operation of the various micro controller modules including the ADC, UART, Timers, and RTCC.