testing protocol for the direct measurement of … savage/permitspage/noc_airpermit/permit...3.3...
TRANSCRIPT
Testing Protocol for the Direct Measurement of
Uncollected Volatile Organic Compound (VOC) Loading Losses
During Marine Vessel Loading
Tesoro Savage
Vancouver Energy Distribution Terminal

Table of Contents
1.0 Introduction ....................................................................................................................................... 1
2.0 Loading Process Description ............................................................................................................ 2
2.1 Loading Loss Determination ......................................................................................................... 3
2.2 VOC Emissions Regulations ......................................................................................................... 3
3.0 Measurements Approach................................................................................................................... 4
3.1 Leak Detection Approach ............................................................................................................. 7
3.1.1 EPA Method 21 Screening (primary leak detection method) ................................................... 7
3.1.2 IR Gas Imaging Device Survey............................................................................................... 11
3.2 Leak Emission Measurement Approach ..................................................................................... 11
3.3 Calculation of VOC Emission Rates and Total Uncollected Emissions ..................................... 12
4.0 Sampling and Measurement Equipment ......................................................................................... 14
4.1 IR Gas Imaging Device ............................................................................................................... 14
4.2 phx21™ Hydrocarbon Analyzer ................................................................................................ 14
4.3 Bacharach Hi Flow Sampler ....................................................................................................... 15
5.0 Other Measurement Data ................................................................................................................ 15
6.0 Quality Assurance and Quality Control (QA/QC) Procedures ....................................................... 16
6.1 FLIR GF320 ................................................................................................................................ 17
6.2 phx21™ Hydrocarbon Analyzer ................................................................................................. 17
6.3 Bacharach Hi Flow Sampler ....................................................................................................... 18
7.0 Data Reduction and Reporting ........................................................................................................ 18
8.0 References ....................................................................................................................................... 19
List of Tables
Table 3-1. General Responsibilities of Field Personnel during Various Phases of Testing .......................... 6
Table 3-2. Summary of General Handheld Leak Detection Screening Procedure ...................................... 10
Table 3-3. Screening Concentrations and Corresponding Emission Leak Rate Values ............................. 13
Table 5-1. Data Collection Needs and Data Format Preference Order ....................................................... 16
Table 7-1. Data Fields in Field Measurements Electronic Data Deliverable .............................................. 19

1
1.0 Introduction
This testing protocol applies to the determination of Volatile Organic Compounds (VOCs) fugitive emission
rates during the controlled loading of inerted tanker ships or ocean-going barges with organic liquids. The
principle of the procedure is as follows. Components on board a ship that may emit VOCs in the course of
a loading activity are identified. These components are screened for leaks of VOCs using EPA Reference
Method 21. When possible, components are also screened using a remote gas imaging device. For
components determined from screening to have leaks, a component-specific emission rate is determined
using a portable device capable of measuring total hydrocarbon mass emission rate. Screening values and
measured emission rates are calculated to estimate uncollected VOC emissions for the entire loading event.
When referenced in a New Source Review (NSR) permit, this protocol specifies necessary procedures for
satisfying applicable compliance demonstration, recordkeeping and reporting requirements of the permit.
The remainder of this protocol is organized as follows. Section 2 of this protocol details the loading process,
summarizes the types of components on a tanker ship that may emit VOCs, and identifies applicable VOC
control requirements for tanker ship loading events. Section 3 identifies requirements for proper sampling,
including work practice and recordkeeping requirements for sampling data. Section 4 identifies approved
instrumentation that may be used in conducting testing in accordance with this protocol. Section 5 identifies
reporting and recordkeeping requirements for non-instrumental data collected during the test. Section 6
identifies quality assurance and quality control requirements for instruments. Section 7 identifies reporting
requirements. Section 8 includes references.
2
2.0 Loading Process Description
Testing shall be restricted to inerted tanker ships or ocean-going barges while they are loaded with volatile
liquid cargo. Inerted tanker ships are those where an inert atmosphere (typically stack gas from an on-board
diesel-fired combustion source) has been delivered to each cargo tank on the vessel prior to loading.
Before loading takes place, Company personnel will board the tanker to review paperwork and ensure that
all of the necessary testing and operational equipment is in place and in working order consistent with the
requirements of the ship’s Captain and governance of the owners of the ship.
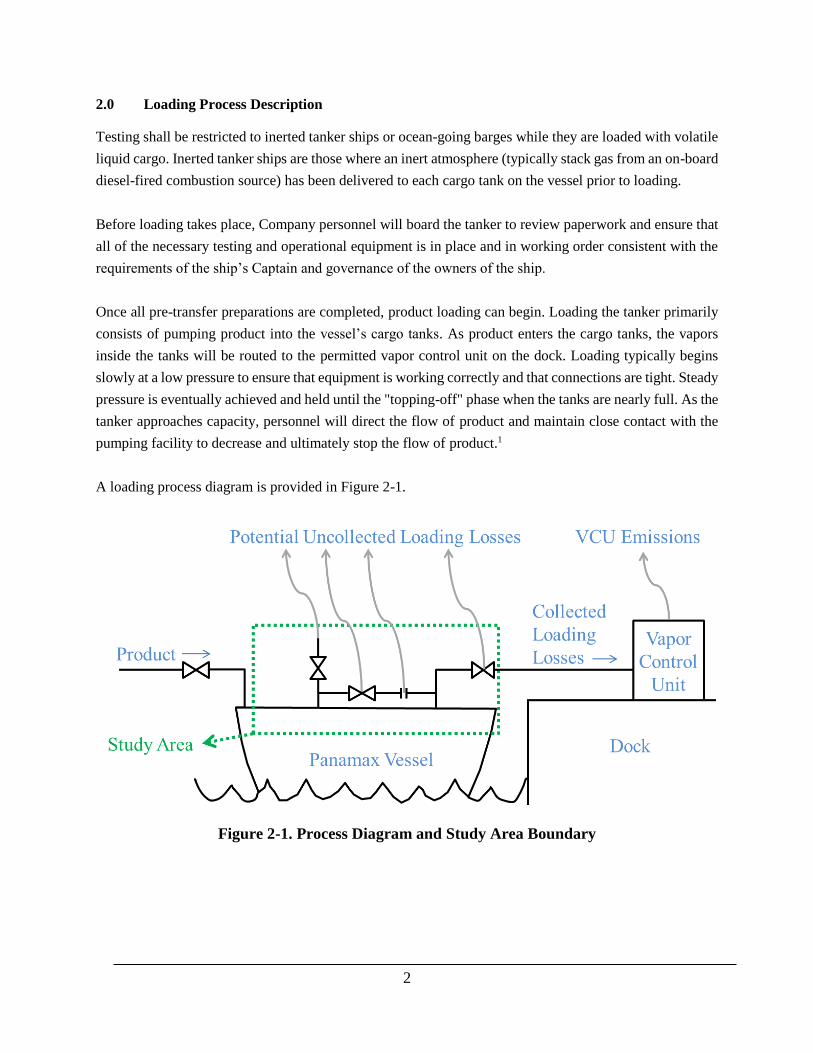
Once all pre-transfer preparations are completed, product loading can begin. Loading the tanker primarily
consists of pumping product into the vessel’s cargo tanks. As product enters the cargo tanks, the vapors
inside the tanks will be routed to the permitted vapor control unit on the dock. Loading typically begins
slowly at a low pressure to ensure that equipment is working correctly and that connections are tight. Steady
pressure is eventually achieved and held until the "topping-off" phase when the tanks are nearly full. As the
tanker approaches capacity, personnel will direct the flow of product and maintain close contact with the
pumping facility to decrease and ultimately stop the flow of product.1
A loading process diagram is provided in Figure 2-1.
Figure 2-1. Process Diagram and Study Area Boundary
3
2.1 Loading Loss Determination
Data collected during testing shall be used to estimate uncollected loading emissions and collection
efficiency for the loading event. Methods for calculation of collection efficiency are detailed in this section.
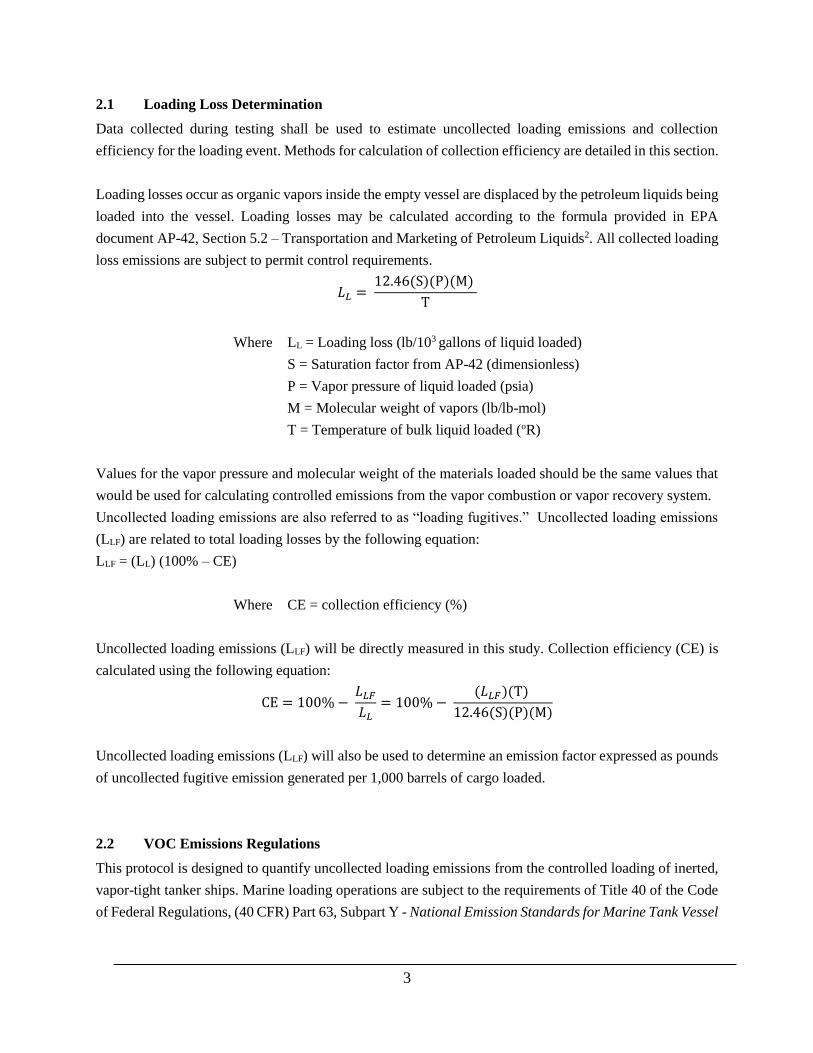
Loading losses occur as organic vapors inside the empty vessel are displaced by the petroleum liquids being
loaded into the vessel. Loading losses may be calculated according to the formula provided in EPA
document AP-42, Section 5.2 – Transportation and Marketing of Petroleum Liquids2. All collected loading
loss emissions are subject to permit control requirements.
𝐿𝐿 = 12.46(S)(P)(M)
T
Where LL = Loading loss (lb/103 gallons of liquid loaded)
S = Saturation factor from AP-42 (dimensionless)
P = Vapor pressure of liquid loaded (psia)
M = Molecular weight of vapors (lb/lb-mol)
T = Temperature of bulk liquid loaded (oR)
Values for the vapor pressure and molecular weight of the materials loaded should be the same values that
would be used for calculating controlled emissions from the vapor combustion or vapor recovery system.
Uncollected loading emissions are also referred to as “loading fugitives.” Uncollected loading emissions
(LLF) are related to total loading losses by the following equation:
LLF = (LL) (100% – CE)
Where CE = collection efficiency (%)
Uncollected loading emissions (LLF) will be directly measured in this study. Collection efficiency (CE) is
calculated using the following equation:
CE = 100% − 𝐿𝐿𝐹
𝐿𝐿= 100% −
(𝐿𝐿𝐹)(T)
12.46(S)(P)(M)
Uncollected loading emissions (LLF) will also be used to determine an emission factor expressed as pounds
of uncollected fugitive emission generated per 1,000 barrels of cargo loaded.
2.2 VOC Emissions Regulations
This protocol is designed to quantify uncollected loading emissions from the controlled loading of inerted,
vapor-tight tanker ships. Marine loading operations are subject to the requirements of Title 40 of the Code
of Federal Regulations, (40 CFR) Part 63, Subpart Y - National Emission Standards for Marine Tank Vessel

4
Loading Operations3. Testing shall be restricted to those tanker ships for which annual vapor-tightness
testing in accordance with 40 CFR §63.565(c) is documented.
Coast Guard regulations for facilities transferring oil or hazardous materials in bulk require that a facility
vapor collection system must maintain the pressure in a vessel’s cargo tanks between 0.2 psig and 80% of
the lowest setting of any of the vessel’s pressure relief valves for an inerted tank vessel 30 CFR 154.2103(b).
Testing shall be restricted to those tanker ships which employ vapor collection systems in accordance with
Coast Guard regulations and applicable permit conditions.
3.0 Measurements Approach
Instrumental measurements taken during testing, and calculations performed following testing shall be
performed as detailed in this section.
The following measurement/calculation methods are covered by this section:
• Identify any leaking components during loading (Section 3.1),
• Measure emission rates of leaking components (Section 3.2), and
• Estimate total VOC emissions from all leaking components to determine the cumulative
uncollected loading emissions (LLF) of VOCs from the vessel during loading (Section 3.3).
Hydrocarbon concentrations in the headspace of the cargo tanks reach their highest levels at the end of the
loading process, representing a worst-case scenario with regard to the generation of fugitive emissions. In
order to calculate a conservative estimate of emissions from any leaking components, field measurements
shall be conducted over a period of approximately six hours as close to the end of the loading process as
practical. Out of concern for worker safety, testing can be scheduled so that it does not take place during
non-daylight hours or during periods of adverse weather.
Testing shall be conducted by a team consisting of no fewer than four qualified persons, with roles and
responsibilities as detailed in Table 3-1.
A “Start-Up” phase shall be conducted as follows. Before leak detection efforts begin, the Project Field
Lead shall consult with ship crew in order to identify all components on the ship that may emit uncollected
loading losses. The Project Lead will develop a Component Master List that includes each component
identified during the Start-Up Phase. Each component on the list is assigned a unique identifier. Testing
and calibration of data collection equipment following Section 6.0 shall also be conducted during the Start-
Up phase.
5
Following completion of the Start-Up phase, the rest of the test is divided into two partially overlapping
periods: one of leak detection (Section 3.1) and another of leak measurement (Section 3.2). During the leak
detection phase the primary emphasis of the testing team is on determining which components are leaking.
During the leak measurement phase the emphasis of the testing team is on quantifying various leak rates as
accurately as possible. Each of the phases of testing, and the general responsibilities of each team member
during each phase, is summarized in Table 3-1.
This protocol concerns the measurement of authorized VOC emissions due to release of uncollected loading
losses. The direct measurement of unauthorized emissions occurring during an emissions event (30 TAC
§101.1(28)) is not required under the protocol. Any process upsets that occur during testing, and that result
in unauthorized emissions, shall be identified in the submitted test report. Any leaks detected during testing
must be included in the calculation, even if they are repaired before the end of the loading activity.
However, if leaks are identified prior to the start of loading, and repaired before loading commences,
emissions from the leaks would not need to be included in the calculation of collection efficiency.

6
Table 3-1. General Responsibilities of Field Personnel during Various Phases of Testing
Testing Phase Phase Description Project Field Lead
(1 person)
Leak Detection Staff
(2 people)
Leak Measurement Staff
(1 person)
Start-Up Phase Pre-sampling preparations
Work with ship personnel to
identify all potential leak
points and fill out the
"Component Count Master
List "
Provide completed
"Component Count Master
List" to other field personnel
Conduct instrument calibration checks to
confirm proper instrument performance and
document results. See Section 6.0 for more
information.
Conduct Bacharach Hi Flow
Sampler calibration check to
confirm proper instrument
performance and document
results.
Leak Detection
Phase
Primary focus is on
leak detection efforts
Phase lasts until each
component has been
screened for leaks at
least twice.
Assist leak detection and leak
measurement personnel and
provide guidance as needed.
Ensure all team members are
aware of significant findings
noted by other testing
personnel.
Assist leak measurement
personnel with bagging any
larger "leaking" components
(e.g., tank tops).
Ensure, to the extent
practicable, that leak detection
and measurement takes place
on cargo tanks actually being
loaded.
Look for leaks as required in Section 3.1.
Screen tank tops, P/V valves and manifold
vapor connection spools first
Notify Project Field Lead and Leak
Measurement Staff when any non-marginal
leaks are detected.
Ensure each component is screened for
leaks at least twice.
Film video of any leaks detected with an IR
gas imaging device
Assist Project Field
Lead and Leak
Detection Staff when
not measuring leak
rates.
Ensure that an emission
rate measurement is
collected on any
component found to be
"leaking" as soon as
possible after leak
detection.
Conduct two or more
emission rate
measurements on any
components identified
as “leaking” by
screening.
Leak Measurement
Phase
Phase may begin
once significant
leaks are identified
by screening.
Once all
components have
been screened twice
during the leak
detection phase, the
focus shifts from
leak detection
efforts to leak
measurement
efforts.
Continue with follow-up, handheld
screening measurements on components
found to be "leaking" or "marginally
leaking".
The IR gas imaging device operator should
work with Leak Measurement Staff as
needed to help demonstrate that total
capture is achieved on any significant leaks
during Hi Flow Sampler Measurements.

7
3.1 Leak Detection Approach
The first method (“Method 21”) is the use of handheld hydrocarbon monitoring devices to monitor for leaks
in accordance with EPA Reference Method 21. Method 21 shall be employed during each test as the means
for determining whether a component is non-leaking, marginally leaking, or leaking. Method 21 handheld
monitors are certified as intrinsically safe and their use on the deck of a marine vessel during loading
generally presents no issues. The second method (“infrared (IR) device for optical gas imaging”) is the use
of a device such as the FLIR GF3201 gas imaging VOC detector. Devices such as the FLIR GF320 may not
be certified as intrinsically safe and are only permitted on the deck of the vessel during loading at the
discretion of the ship’s captain or the captain’s designee.
Handheld monitoring via EPA Method 21 is generally capable of detecting smaller leaks that the IR gas
imaging device may not detect, but it is a more time consuming method. An IR gas imaging device can
detect VOC leak rates as low as six grams per hour at a distance of twenty feet under ideal weather
conditions. It is able to survey a large number of components in a relatively short time period and is
particularly well suited for quickly identifying large leaks. During the leak detection phase, leak detection
using Method 21 and the IR gas imaging device method (if permitted) shall be performed by at least two
members of the field team. When the IR gas imaging device method is not permitted, both testing staff will
perform Method 21 screening.
Since the IR gas imaging device survey method can investigate and identify potential leak points faster than
EPA Method 21, it is anticipated that the Method 21 and IR gas imaging device leak detection teams can
work independent of one another during the leak detection phase. If a leak is identified by the IR gas
imaging device method, personnel conducting Method 21 screening shall be promptly notified in order to
conduct an independent examination of the leak point.
The potential fugitive emission points on the master component list are located on the deck of the vessel
and are suitable for testing using either of these leak detection methods. All components shall be assigned
a unique ID. Testing personnel shall use a component’s unique ID when documenting leak detection and
measurement results. Each potential emission source will be inspected for leaks at least two times during
testing.
3.1.1 EPA Method 21 Screening (primary leak detection method)
EPA Method 21 – Determination of Volatile Organic Compound Leaks – is the standard procedure for the
determination of VOC leaks from process equipment4. This method applies, but is not limited to, valves,
1 Over time, equipment brands, technology and models may change i.e., the FLIR GF320 is not the only acceptable gas imaging device to be used
for this protocol. The Operating Company shall use the same, equivalent or improved equipment technology.
8
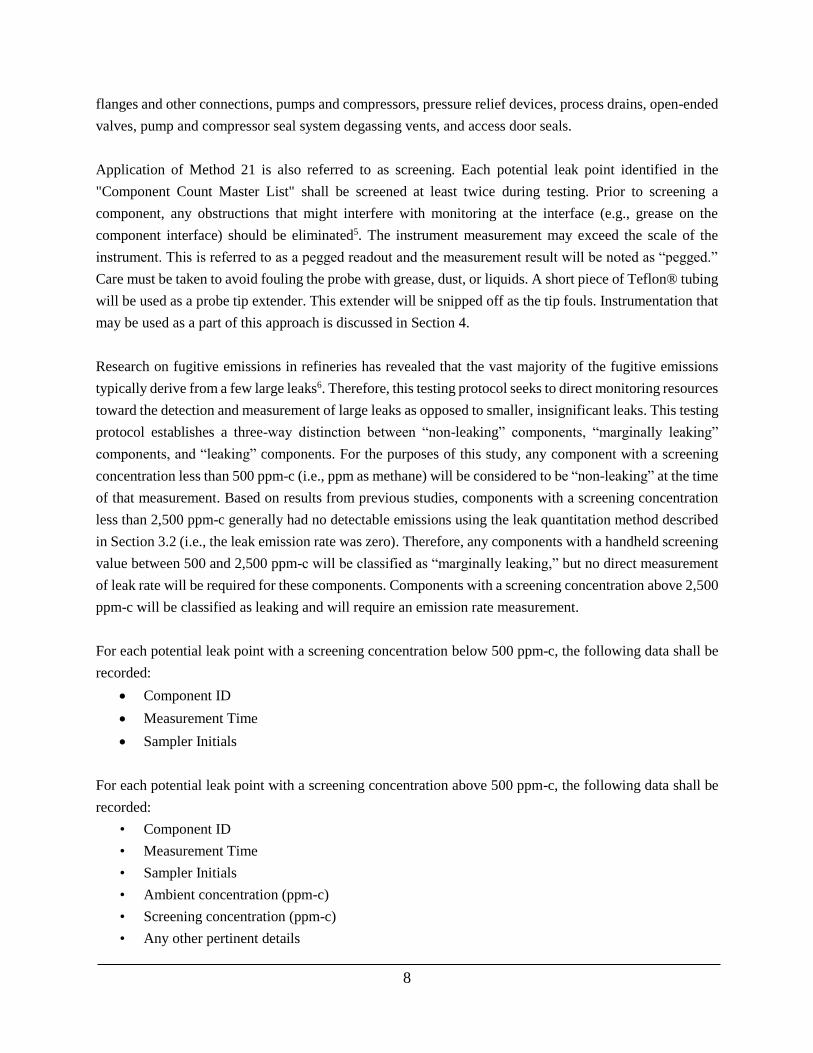
flanges and other connections, pumps and compressors, pressure relief devices, process drains, open-ended
valves, pump and compressor seal system degassing vents, and access door seals.
Application of Method 21 is also referred to as screening. Each potential leak point identified in the
"Component Count Master List" shall be screened at least twice during testing. Prior to screening a
component, any obstructions that might interfere with monitoring at the interface (e.g., grease on the
component interface) should be eliminated5. The instrument measurement may exceed the scale of the
instrument. This is referred to as a pegged readout and the measurement result will be noted as “pegged.”
Care must be taken to avoid fouling the probe with grease, dust, or liquids. A short piece of Teflon® tubing
will be used as a probe tip extender. This extender will be snipped off as the tip fouls. Instrumentation that
may be used as a part of this approach is discussed in Section 4.
Research on fugitive emissions in refineries has revealed that the vast majority of the fugitive emissions
typically derive from a few large leaks6. Therefore, this testing protocol seeks to direct monitoring resources
toward the detection and measurement of large leaks as opposed to smaller, insignificant leaks. This testing
protocol establishes a three-way distinction between “non-leaking” components, “marginally leaking”
components, and “leaking” components. For the purposes of this study, any component with a screening
concentration less than 500 ppm-c (i.e., ppm as methane) will be considered to be “non-leaking” at the time
of that measurement. Based on results from previous studies, components with a screening concentration
less than 2,500 ppm-c generally had no detectable emissions using the leak quantitation method described
in Section 3.2 (i.e., the leak emission rate was zero). Therefore, any components with a handheld screening
value between 500 and 2,500 ppm-c will be classified as “marginally leaking,” but no direct measurement
of leak rate will be required for these components. Components with a screening concentration above 2,500
ppm-c will be classified as leaking and will require an emission rate measurement.
For each potential leak point with a screening concentration below 500 ppm-c, the following data shall be
recorded:
Component ID
Measurement Time
Sampler Initials
For each potential leak point with a screening concentration above 500 ppm-c, the following data shall be
recorded:
• Component ID
• Measurement Time
• Sampler Initials
• Ambient concentration (ppm-c)
• Screening concentration (ppm-c)
• Any other pertinent details

9
As an alternative to recording ambient concentration, an ambient concentration of 0 ppm-c VOC can be
assumed.
Once all components on the Component Count Master List have been screened, the screening process for
all components will be repeated. The classification of components according to the three-way leak
definition outlined in this section, with associated sampling and recordkeeping requirements, is summarized
in Table 3-2.

10
Table 3-2. Summary of General Handheld Leak Detection Screening Procedure
Handheld Screening
Concentration
Leak
Classification Record Keeping Requirements Follow-up requirements
Less than 500 ppm-c Not Leaking Write down the component ID, time, sampler initials
Make sure the component is screened for leaks
at least twice during testing.
No follow-up leak rate measurement is
required.
500 - 2,500 ppm-c Marginally
Leaking
Write down the component ID, time, sampler
initials, screening concentration and any other
pertinent details on the field data sheet, “Handheld
Hydrocarbon Measurements.”
Place a green tag on the component noting the
component ID, the screening concentration and the
time.
No follow-up leak rate measurement is
required.
Continue to screen the component periodically
throughout testing (at least twice, ideally
more).
Greater than 2,500 ppm-c Leaking
Write down the component ID, time, sampler
initials, ambient concentration, screening
concentration and any other pertinent details on the
“Field Data Sheet – Handheld Hydrocarbon
Measurements.”
Place a red tag on the component noting the
component ID, the screening concentration and the
time. If a green tag is already present, locate the red
tag directly next to the green tag.
Leak rate measurement is required – notify leak
measurement personnel and/or field lead as
soon possible so that follow-up Hi Flow
Sampler measurement can be conducted.
Continue to screen component periodically
throughout testing (at least twice, ideally
more).
11
3.1.2 IR Gas Imaging Device Survey
When the IR gas imaging device method is permitted, personnel will perform remote screening using the IR
gas imaging VOC detector to identify potential VOC emission points and qualitatively assess each point’s
relative emissions potential. Once the IR gas imaging device is in the optimal position relative to the potential
leak point and all operating parameters are optimized, at least 20 seconds will be spent inspecting each potential
leak point. If any leaks are detected then video of the leak will be recorded, the leaking component will be
tagged with a yellow tag, and a record of the leak will be documented on the IR gas imaging device field data
sheet, noting:
the filename/number
the component ID
the time, and
any other pertinent details.
Any videos of leaking components will be provided with the final report. Once all of the components of interest
have been surveyed by the IR gas imaging device, the survey process for all components will start again. When
conducting subsequent rounds of surveying, components with previously detected leaks may be evaluated more
frequently than non-leaking components. At least one video will be recorded featuring each component type,
regardless of whether that component type was found to be leaking. For instance, regardless of whether any
tank access plates were found to be leaking, at least one video of a tank access plate will be recorded.
3.2 Leak Emission Measurement Approach
During the leak measurement phase, leak emission rates shall be measured using a Bacharach Hi Flow Sampler.
A detailed description of the Bacharach Hi Flow Sampler is provided in Section 4.3. Quality assurance and
quality control procedures are addressed in Section 6.3. This section provides a description of how this sampler
is expected to be utilized in this study.
Leak rate measurements will be collected on those components classified as “leaking” following the criteria
presented in Section 3.1.1. In cases where multiple “leaking” components are simultaneously active, leaks shall
be measured as soon as practicable, with priority given to measuring whichever leak is believed to be more
significant. Any component with a detected leak rate (i.e., a non-zero leak rate) should have its leak rate
quantified as many times as practicable throughout the loading process, though not less than twice. In the
event that leak measurements are performed only once on a “leaking” component, the report shall contain an
explanation why a second measurement was not made. In the event that no leak measurements are performed
on a “leaking” component, the report shall contain an explanation why no measurements were made, and a
proposed conservative estimate of the emission rate for the leaking component shall be reported.

12
Before measuring emissions from a particular leak point using the Hi Flow Sampler, the appropriate capture
device for the leak/emission source must be selected. Choices include a set of conventional capture tools
(crevice tool, a bag, flange tool, etc.) and a set of “non-conventional” capture tools.
After sampling has started, the emission measurement reading should be monitored until a stable leak
measurement is obtained. At this time, the following information should be recorded on the field data sheet:
component ID,
time,
sampler initials,
sampler flow rate (LPM),
sampler concentration (% as methane),
sampler emission rate (LPM as methane), and
any other pertinent information.
An entire Hi Flow Sampler test run typically lasts between one and five minutes. If IR gas imaging device is
allowed on the deck of the vessel during testing, the leak monitoring process outlined above should be filmed
at least once in the field to help demonstrate that all VOC emissions from the leak in question are being captured
by the Hi Flow Sampler. The purpose of filming the Hi Flow measurement is to demonstrate technique and the
ability of the sampler to capture the entire leak. Performing this observational check once or twice during the
entire test event shall be considered sufficient for this demonstration.
3.3 Calculation of VOC Emission Rates and Total Uncollected Emissions
The Hi Flow Sampler displays emission rate readings in liters of hydrocarbon (as methane) per minute (LPM)
with a measurement resolution (sensitivity) of 0.1 LPM. These emission rate values will be converted to grams
of hydrocarbon per hour using the following equation2:
(3.3-1) THC emission rate (g
hour) =
liters of methane
1 minute ×
1 mole(STP)
22.4 liters×
16 grams
1 mole×
60 minutes
hour
Using this equation, an emission rate reading of 0.1 LPM corresponds to 4.3 grams of hydrocarbon per hour.
For purposes of this testing, VOCs are assumed to account for 100% of the total hydrocarbon concentration.
Any reading of zero may be interpreted to mean that the emission rate was less than the sensitivity of the
sampler (i.e., < 4.3 g/hour). The leak emission rate is equal to the measured concentration multiplied by
volumetric flow rate. Components with low screening values may yield a leak rate reading of zero due to the
low volumetric flow rate of the leak.
If no Hi Flow Sampler measurements are collected on a component because all screening concentrations are
below 2,500 ppm-c then the average leak rate for that component is dependent on the maximum screening
2 Formula assumes standard temperature and pressure (STP) – 22.4 L/mole

13
concentration associated with that component. If the maximum screening concentration for a given component
is less than 500 ppm-c then the average leak rate for that component is assumed to be 0.0 g/hour. If the
maximum concentration for a given component is between 500 ppm-c and 2,500 ppm-c then the average leak
rate for that component is assumed to be equal to one-half of the measurement sensitivity of the Hi Flow
Sampler (2.2 g/hour).
All components with a maximum screening concentration greater than 2,500 ppm-c should have at least two
Hi Flow Sampler measurements. For these components, the average leak rate will be determined by taking the
arithmetic average of all the Hi Flow Sampler measurements collected on that component. In any instance
where a leak rate measurement of 0.0 g/hour is measured, a leak rate measurement equal to one-half of the
measurement sensitivity of the Hi Flow Sampler (2.2 g/hour) will be assumed. This process is summarized in
Table 3-3.
The average leak rate for each component shall be summed to provide the cumulative average leak rate for the
vessel, which is an estimate of the uncollected loading fugitive emissions. This leak rate, expressed in grams
per hour, shall be multiplied by the total loading duration, expressed in hours, to calculate total uncollected
emissions over the course of loading. The cumulative average leak rate for the vessel shall be reported to the
nearest 0.01 lb using units of lb.
Table 3-3. Screening Concentrations and Corresponding Emission Leak Rate Values
Maximum Handheld
Screening Concentration
for the Component
Leak
Classification How Average VOC Leak Rate for Component is Determined
Less than 500 ppm-c Not Leaking The component is assumed to have an emission leak rate average of
0.0 g/hour. No Hi Flow Sampler measurement is required.
500 - 2,500 ppm-c Marginally
Leaking
The component is assumed to have an emission leak rate average of
2.2 g/hour. No Hi Flow Sampler measurement is required.
Greater than 2,500 ppm-c Leaking
If Hi Flow Sampler measurement data are available then the
average emission leak rate is equal to the arithmetic average of
all the Hi Flow Sampler measurement values (where 2.2
g/hour is substituted for any zero readings).
If no Hi Flow Sampler measurement data are available then
provide a conservative estimated emission rate and document
the reason for failure to perform a leak rate measurement.

14
4.0 Sampling and Measurement Equipment
All equipment described in this section is certified as intrinsically safe with the exception of the FLIR
GF320 gas imaging device. Non-intrinsically safe equipment may be permitted on board by discretion of
the ship captain or the captain’s designee.
The following subsections summarize the function of the primary sampling and measurement equipment to
be used in this study. Over time, equipment brands, technology and models may change. The equipment
discussed in Sections 4.1-4.3 is the equipment expected to be used at the time this protocol was developed.
The Operating Company shall use the same, equivalent or improved technology when executing this ship
testing protocol. Quality assurance and quality control procedures for this equipment are addressed in
Section 6.0.
4.1 IR Gas Imaging Device
Infrared gas imaging is conducted using a FLIR GF320. The FLIR GF320 has a spectral range of 1– 5.4
μm. The detector is operated at near liquid nitrogen temperatures using an integral Stirling cooler which
provides the system with an NEDT less than 25 milliKelvins, providing excellent sensitivity.
The spectral range is further limited with the use of a notch filter specifically designed for the detection of
hydrocarbon infrared absorptions in the 3 micron region. The narrow band pass range of the filter is less
than the infrared spectral absorption of gas phase hexane. The filter notch is positioned such that alkane
gases have a significant response within the band pass range.
The use of a narrow band pass filter provides spectral discrimination that allows the detection of compounds
that have a vibration mode in the infrared region of the filter. Not all hydrocarbons have infrared absorptions
within the filter range. Using propane as the reference spectrum with a relative response of 100, methane’s
response is approximately 10% of the same concentration of propane and hexane is 1.5 times the response
of propane at the same concentration. The filter is set to the infrared region of the spectrum that corresponds
to the infrared absorption of alkanes, primarily.
4.2 phx21™ Hydrocarbon Analyzer
Handheld screening for VOCs shall be conducted using a phx21 or a similar handheld VOC monitor (e.g.,
Thermo TVA-1000, etc.) that meets Method 21 requirements. The pxh21™ FID analyzer is a portable,
battery-powered, intrinsically safe hydrocarbon analyzer that utilizes a flame ionization detector (FID).

15
4.3 Bacharach Hi Flow Sampler
The Hi Flow Sampler is a portable, intrinsically safe, battery-powered instrument designed to determine
leak rates around various components. This is accomplished by sampling at a large flow rate (between 140
and 300 LPM) to completely capture all vapors leaking from a component. By measuring the flow rate of
the sampling stream and the hydrocarbon concentration within that stream, the total hydrocarbon leak rate
can be calculated. This protocol requires the use of the Bacharach Hi Flow Sampler or equivalent
technology.
5.0 Other Measurement Data
In addition to field data sheets compiled as required by Section 3, the facility operator, or its designee, shall
collect and report the following data to the extent practicable:
the true vapor pressure of the cargo loaded (psia),
the vapor molecular weight of the cargo loaded (lb/lb-mol),
the average temperature of cargo loaded (oR),
ship particulars (e.g., ship age, dimensions, etc.),
the inspector’s report (e.g., information on prior load, potential for a heel, etc.),
a copy of the last vapor-tightness certification,
loading rates and individual cargo tank loading rates over time,
vapor collection system operating pressures and individual cargo tank pressures over time, and
cargo tank fill levels and ullage over time.
Wherever possible, high time-resolution (e.g., 1-minute average) electronic data should be requested and
collected. Any data directly collected by the facility operator through their computer data historian such as
Supervisory Control and Data Acquisition (SCADA) system during routine loading operations (e.g.,
dockside loading rates) shall be provided in electronic format. Any electronic data files collected during
this study shall be provided with the final report. In some instances, high time-resolution electronic data
may not be available or ship personnel may refuse to provide such data. For example, although loading
rates and pressures for individual cargo tanks are monitored by ship personnel, a request for an electronic
record of these data may not be granted by ship personnel. In instances where a request for electronic data
is denied, the facility operator or its designee shall request for ship personnel to provide hardcopy
documentation of these data (e.g., a table summarizing hourly average data). In instances where a request
for hardcopy documentation is denied, the facility operator or its designee shall periodically (e.g., every 60
minutes) document relevant data (e.g., cargo tank loading rates, cargo tank pressures, cargo tank fill levels
and ullage) to the extent that such collection is practicable and does not significantly interfere with leak
detection and measurement data collection, by manually checking diagnostic monitoring equipment on the
ship and writing down the results. This data format preference order is summarized in Table 5-1.

16
Table 5-1. Data Collection Needs and Data Format Preference Order
Data Type When to obtain
data?
Who should
provide data?
Data format preference
order
True vapor pressure of cargo loaded
(psia)
Prior to testing [facility operator] PDF report
Vapor molecular weight of cargo
loaded (lb/lb-mol)
Ship particulars (Q88)
Copy of last vapor-tightness
certification
Loading rates and individual cargo
tank loading rates over time
During testing or
immediately after
testing
Marine Vessel
1. High-time resolution
electronic data
(SCADA)
2. Hardcopy data summary
3. Periodic manual
documentation of data
by testing personnel
Vapor collection system operating
pressures and individual cargo tank
pressures over time
Cargo tank fill levels and ullage over
time.
Inspector's report
After testing [facility operator]
PDF report
Loading rates over time 1. High-time resolution
electronic data
(SCADA)
2. Hardcopy
documentation
Vapor collection system operating
pressures over time
6.0 Quality Assurance and Quality Control (QA/QC) Procedures
All instruments and equipment to be used in the field will be tested following manufacturer’s specifications
and/or EPA Method 21 (as applicable) prior to deployment to verify proper working condition. During this
testing, all analyzers will be calibrated to verify proper instrument response. Backup parts and/or devices
shall be kept on hand against foreseeable instrument or equipment failures/malfunctions in the field. Any
analyzer or piece of equipment suspected of having performance issues will be promptly removed from
service and repaired or replaced with an equivalent backup unit as soon as possible
For all written field documentation, indelible ink will be used, and any hand corrections will be made by a
single line through the incorrect entry with the author’s initials immediately following the correction. All
work performed during the data collection, review, and validation process must be traceable to the author,
and all data products must be able to be reversed to their original result at all times.
Sections 6.1–6.3 summarize QA/QC procedures which apply to particular device types. Over time,
equipment brands, technology and models may change. The equipment discussed in Sections 6.1-6.3
summarize the equipment used at the time this protocol was developed. The Operating Company shall use
the same, equivalent or improved technology when executing this ship testing protocol.

17
6.1 FLIR GF320
Before testing begins, the FLIR GF320’s operation will be verified on site by releasing a known emission
rate of hydrocarbon vapors (e.g., methane) and measuring the distance from which the release can be
reliably detected. This check will be performed at two emission rates: a low emission rate (e.g.,
approximately 6 grams/hour) and a higher emission rate (e.g., approximately 60 grams/hour). The distance
from which each emission rate can be detected will be recorded and relevant weather conditions will be
noted. These checks will be imaged and recorded on a hard drive for inclusion in the final report.
The performance of the GF320 can be affected by changes in the weather. Below are listed some weather
conditions known to adversely affect the GF320’s performance.
• Overcast/Early Morning Hours – The GF320 requires infrared radiation contrast in order for the
technician to distinguish emissions from the background. If infrared contrast is lower during these
conditions, the performance of the GF320 can be adversely impacted.
• Strong winds – Strong winds can impede the operator’s ability to see a small leak from a distance
as these winds dissipate emissions quicker. However, it is anticipated that most components will
be surveyed within 10 feet of the technician.
• Rainy conditions/high humidity/fog – The GF320 is waterproof so its internal electronics are
unaffected by moisture. However, rain and high humidity have the potential to affect the thermal
properties of the components being surveyed in this study.
Should adverse weather be encountered during testing, the operator will make a professional judgment on
whether conditions are significantly affecting the instrument’s ability to detect leaks.
6.2 phx21™ Hydrocarbon Analyzer
The phx21™ will be calibrated in accordance with EPA Method 21. The phx21™ will be calibrated in the
field before testing takes place. Drift checks will be performed to assess analyzer accuracy. These checks
will be performed by analyzing one of the methane calibration gases (e.g., 500 ppm-c) used to calibrate the
portable monitoring instrument. If the drift check measurement is within 10% of the actual methane
concentration the instrument is considered to have passed the drift check and no adjustment need be made
to the instrument. If the drift check reading is off by more than 10% the instrument shall be recalibrated. If
the analyzer fails to respond to a drift check (i.e., a false negative reading), then the instrument shall be
recalibrated and measurements since the last calibration or passed drift test shall be repeated. All drift check
data will be documented.

18
Periodic ambient air monitoring checks will be performed. If ambient concentrations readings suggest that
analyzer baseline readings are unstable or drifting the analyzer should be re-zeroed and a drift check should
be conducted.
6.3 Bacharach Hi Flow Sampler
The Hi Flow Sampler shall be calibrated and checked before testing following the methodology in the
operation manual. Instrument response should be within 10% of the expected value using 2.5% methane
calibration gas. This is applicable to both the leak (gas) channel and the background channel. If calibration
is necessary, the analyzer will be recalibrated per the Hi Flow Sampler manual and the results will be
documented. The calibration will be checked at six-hour intervals during the test event. If the instrument
has drifted less than 10%, the instrument calibration is acceptable, and testing will continue. If the
instrument has drifted more than 10%, previous data will be flagged, and the instrument will be recalibrated.
In this case, the next calibration check will be performed at a three-hour interval.
For all measurements, the flow rate of the sampler should be lowered and an additional reading should be
collected at this lower flow. This is a test of capture efficiency, in that the flow rate drops and the
concentration should rise, with the product remaining constant. These lower flow rate readings should agree
with the original readings within 10% or 0.1 LPM, whichever is greater. In any instances where the two
emission rate measurements are different the higher emission rate will be used in emissions calculations.
7.0 Data Reduction and Reporting
Data review, validation, and verification procedures are presented in this section. Data shall be declared
invalid whenever documented evidence exists demonstrating that an instrument was malfunctioning. The
testing report shall identify and report any data having been declared invalid, with an explanation for why
data were invalidated. Any data that were not collected under representative conditions shall be flagged.
For instance, were an emission upset to occur during non-routine loading operations (non-representative
conditions) any affected data collected around the time of the emission upset shall be flagged. The impacts
of including or excluding flagged data from the emissions calculations discussed in Section 3.3 will be
evaluated and discussed in the final report.
The activities involved in validation of the data in general include the following:
reviewing the field documentation, calibration data; and
examining the analyzer data for measurement values that seem incongruous with normal
measurement ranges.
19
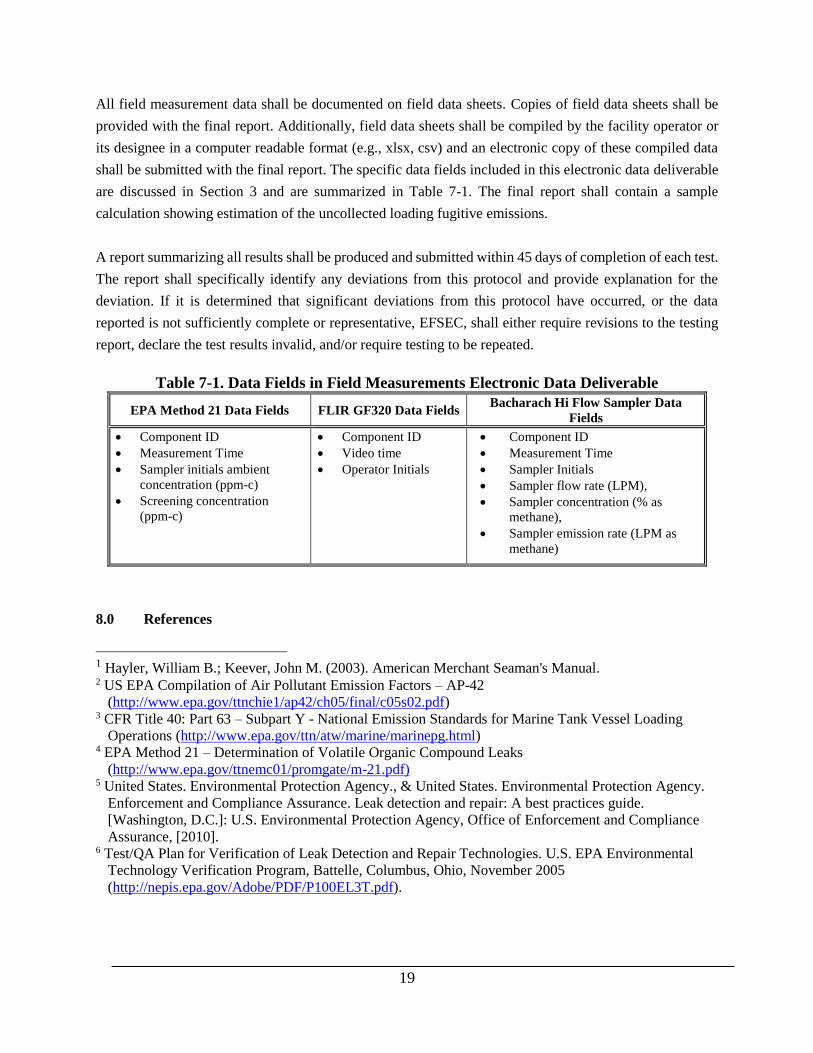
All field measurement data shall be documented on field data sheets. Copies of field data sheets shall be
provided with the final report. Additionally, field data sheets shall be compiled by the facility operator or
its designee in a computer readable format (e.g., xlsx, csv) and an electronic copy of these compiled data
shall be submitted with the final report. The specific data fields included in this electronic data deliverable
are discussed in Section 3 and are summarized in Table 7-1. The final report shall contain a sample
calculation showing estimation of the uncollected loading fugitive emissions.
A report summarizing all results shall be produced and submitted within 45 days of completion of each test.
The report shall specifically identify any deviations from this protocol and provide explanation for the
deviation. If it is determined that significant deviations from this protocol have occurred, or the data
reported is not sufficiently complete or representative, EFSEC, shall either require revisions to the testing
report, declare the test results invalid, and/or require testing to be repeated.
Table 7-1. Data Fields in Field Measurements Electronic Data Deliverable
EPA Method 21 Data Fields FLIR GF320 Data Fields Bacharach Hi Flow Sampler Data
Fields
Component ID
Measurement Time
Sampler initials ambient
concentration (ppm-c)
Screening concentration
(ppm-c)
Component ID
Video time
Operator Initials
Component ID
Measurement Time
Sampler Initials
Sampler flow rate (LPM),
Sampler concentration (% as
methane),
Sampler emission rate (LPM as
methane)
8.0 References
1 Hayler, William B.; Keever, John M. (2003). American Merchant Seaman's Manual. 2 US EPA Compilation of Air Pollutant Emission Factors – AP-42
(http://www.epa.gov/ttnchie1/ap42/ch05/final/c05s02.pdf) 3 CFR Title 40: Part 63 – Subpart Y - National Emission Standards for Marine Tank Vessel Loading
Operations (http://www.epa.gov/ttn/atw/marine/marinepg.html) 4 EPA Method 21 – Determination of Volatile Organic Compound Leaks
(http://www.epa.gov/ttnemc01/promgate/m-21.pdf) 5 United States. Environmental Protection Agency., & United States. Environmental Protection Agency.
Enforcement and Compliance Assurance. Leak detection and repair: A best practices guide.
[Washington, D.C.]: U.S. Environmental Protection Agency, Office of Enforcement and Compliance
Assurance, [2010]. 6 Test/QA Plan for Verification of Leak Detection and Repair Technologies. U.S. EPA Environmental
Technology Verification Program, Battelle, Columbus, Ohio, November 2005
(http://nepis.epa.gov/Adobe/PDF/P100EL3T.pdf).