testing the reliability and flexibility of digitizers
TRANSCRIPT

University of Texas at El Paso University of Texas at El Paso
ScholarWorks@UTEP ScholarWorks@UTEP
Open Access Theses & Dissertations
2020-01-01
Testing The Reliability And Flexibility Of Digitizers Adapting The Testing The Reliability And Flexibility Of Digitizers Adapting The
Rf/if Signals Over Ip Applications Using A Testbed Platform Rf/if Signals Over Ip Applications Using A Testbed Platform
Jose Carlos Sandoval University of Texas at El Paso
Follow this and additional works at: https://scholarworks.utep.edu/open_etd
Part of the Electrical and Electronics Commons
Recommended Citation Recommended Citation Sandoval, Jose Carlos, "Testing The Reliability And Flexibility Of Digitizers Adapting The Rf/if Signals Over Ip Applications Using A Testbed Platform" (2020). Open Access Theses & Dissertations. 3196. https://scholarworks.utep.edu/open_etd/3196
This is brought to you for free and open access by ScholarWorks@UTEP. It has been accepted for inclusion in Open Access Theses & Dissertations by an authorized administrator of ScholarWorks@UTEP. For more information, please contact [email protected].

TESTING THE RELIABILITY AND FLEXIBILITY OF DIGITIZERS ADAPTING THE
RF/IF SIGNALS OVER IP APPLICATIONS USING A
TESTBED PLATFORM.
JOSE CARLOS SANDOVAL
Master’s Program in Electrical Engineering
APPROVED:
Virgilio Gonzalez, Ph.D., Chair
Robert Roberts, Ph.D.
Joel Quintana, Ph.D.
.
Stephen L. Crites, Jr., Ph.D.
Dean of the Graduate School

Copyright: ©
by
Jose Carlos Sandoval
2020

Dedication
I dedicate my work to God for the opportunity by completing another academic achievement
Also, to my loving family
My parents Jose Manuel Sandoval Barrón & Sandra Luz Maese Fernández
My brother Santiago Sandoval and Biby Sandoval
For the unconditional, love, support and effort that kept me focus
My friends whom always believed, inspired and motivated me

TESTING THE RELIABILITY AND FLEXIBILITY OF DIGITIZERS ADAPTING THE
RF/IF SIGNALS OVER IP APPLICATIONS USING
A TESTBED PLATFORM.
by
JOSE CARLOS SANDOVAL, B.S.E.E.
THESIS
Presented to the Faculty of the Graduate School of
The University of Texas at El Paso
in Partial Fulfillment
of the Requirements
for the Degree of
MASTER OF SCIENCE
Department of Electrical and Computer Engineering
THE UNIVERSITY OF TEXAS AT EL PASO
December 2020

v
Acknowledgements
I would like to thank Dr. Virgilio Gonzalez of the Electrical and Computer Engineering
Department at The University of Texas at El Paso for all advice and guidance through this process.
Also, patience and tolerance that he has always shown during thesis meetings and project related
activities. One research saying that will always be in my memory is “Does it work? What time
does it stop working?” which gave me more knowledge and the ability to discover new methods.
Thank you is directed to my committee members Dr. Joel Quintana and Dr. Robert C
Roberts for all the feedback provided and the help through this thesis research.
I would also like to express my gratitude to White Sands Missile Range. Specially to Pabel
Corral and Duke Yasuda. Both are amazing persons full of knowledge and always supportive. In
addition, I appreciate lending us the devices and all infrastructure needed to still work and
developed a research thesis.
Special thanks to my research colleagues, Jose Antonio Castillo and Mirza Mohammad
Maqbule Elahi for all the moments shared through this journey, all the projects together and the
support to each other.
Moreover, I would like to thank the Electrical and Computer Engineering Department at
the University of Texas at El Paso. Professors and staff whom always seem supportive and helpful
guidance for academic steps towards completion of my Master’s degree.
In last, I would like to thank my friends and family for all the support and the motivation
phrases through the entire cycle of my graduate life. My cousin Aldo Isaac Garcia who is a brother
to me for always been there when needed. My mother whom always backed me up through my
entire academic life, my father for all the wisdom and advises and my brother for all sincere advises

vi
that help me focused to complete my thesis. I do not have words to express all my feelings, or
even try to describe them.
The hardest test in my academic life is now completed. I am, deeply thankful for all help
of classmates and friends during this cycle. Special thanks to Vianey Benitez for having the
opportunity to help me and push me in my last semester. For these wonderful last months, I express
my gratitude by continuing to be part of her life.
Thank you.

vii
Abstract
As physical constraints can be challenging for Radio Frequency (RF) telemetry,
a new solution has been exploited to support the demand for RF transmissions. As frequency
spectrum gets crowded with more technologies, a solution to a reliable transmission is needed.
Digitizers can mitigate many of the physical constraints in order to achieve a successful RF
transmission. The method includes the conversion of the RF signals to be sent over IP networks,
transmit and de-convert the signal. IP networks will mitigate many disadvantages over a regular
signal transmission.
The authority in charge to allocate frequency bands is the Federal
Communications Commission (FCC). FCC performs different Advanced Wireless Service
(AWS) a term used to allocate the licensed bands to all users. For example, government, cellular
companies, television, radio and much more. Numerous AWS have been performed to allocate
new services or reallocate existing services due to high demand of the RF spectrum.
The digitizers are also able to preserve both frequency and timing characteristics,
and then accurately reconstructing the original Telemetry signals to enable processing, recording
or retransmission at another location. To characterize the digitizers, a Software Defined Radio
(SDR) testbed with an external reference clock to analyze the impact of signal synchronization is
used. Several experiments were done with different modulation schemes, destination IP, gain,
packet size and others. Also, the utilization of a reference clock to perform testing will be added
to compare result with the reference clock and in absence. The configurations of gain, bandwidth
and frequency are also parameters of interest. In order to compare these results, diverse
parameters were used to qualify and quantify the signal. In addition, the flexibility of SDR’s and
digitizers provide, allow to test several scenarios. Furthermore, using the same concept for RF

viii
over IP, experiments were also done with LTE signals to perform the same process and measure
certain parameters.
To summarize, a set of RF over IP tests yielded results for comparison, mostly
with the reference clock to make this layer as transparent as possible and characterize the
limitations or other challenges that could be present with this solution.

ix
Table of Contents
Acknowledgements ..................................................................................................................... v
Abstract ....................................................................................................................................vii
Table of Contents ....................................................................................................................... ix
List of Tables ............................................................................................................................xii
List of Figures ......................................................................................................................... xiii
List of Illustrations ................................................................................................................... xxi
Chapter 1: Introduction ............................................................................................................... 1
Chapter 2: Literature Review & Background Information ........................................................... 4
2.1 Telemetry history, standards PCM/FM ......................................................................... 4
2.2 Antenna ........................................................................................................................ 5
2.3 Software Defined Radio (SDR) ..................................................................................... 6
2.4 Other techniques ........................................................................................................... 8
2.5 Radio Frequency (RF) over Internet Protocols (IP) ....................................................... 9
2.6 RF Spectrum ............................................................................................................... 10
2.7 Modulation Techniques .............................................................................................. 11
2.8 4G LTE ...................................................................................................................... 17
Chapter 3: Methodology ............................................................................................................ 19
3.1 Frequency Bands of Interest........................................................................................ 19
3.2 Numerical Parameters ................................................................................................. 21
3.3 Visual Parameters ....................................................................................................... 23
3.4 Experiment Description .............................................................................................. 24
3.5 Testbed adjustment and calibration ............................................................................. 28
Chapter 4: Results ..................................................................................................................... 44
4.1 Baseline parameters .................................................................................................... 44
4.2 Telemetry over IP ....................................................................................................... 51
4.2.1 No clock.......................................................................................................... 51
4.2.2 Clock .............................................................................................................. 53
4.3 LTE over IP ................................................................................................................ 55

x
4.3.1 No clock.......................................................................................................... 55
LTE EnB stand-alone ...................................................................................... 56
LTE EnB through the system with LTE UE .................................................... 62
LTE UE .......................................................................................................... 71
4.3.2 Clock .............................................................................................................. 74
LTE EnB stand-alone ...................................................................................... 75
LTE EnB through the system with LTE UE .................................................... 79
LTE UE .......................................................................................................... 89
4.4 Application Scenarios ................................................................................................. 93
Chapter 5: Analysis and Conclusions ...................................................................................... 105
TMoIP ............................................................................................................................ 105
QPSK .................................................................................................................... 106
8-PSK .................................................................................................................... 106
OQPSK.................................................................................................................. 106
LTE over IP.................................................................................................................... 106
LTE EnB stand-alone ............................................................................................. 107
LTE EnB through the system ................................................................................. 107
LTE UE ................................................................................................................. 108
Application Scenarios ............................................................................................ 109
Chapter 6: Final conclusions and Future work. ........................................................................ 111
TMoIP ............................................................................................................................ 111
LTE over IP.................................................................................................................... 111
LTE EnB stand-alone ............................................................................................. 111
LTE EnB through the system ................................................................................. 111
LTE UE ................................................................................................................. 112
Application scenarios ..................................................................................................... 112
Lowest RF input power .......................................................................................... 112
Lowest digitizer conditions .................................................................................... 112
Full Duplex LTE system transmitted ...................................................................... 113
Video transmission ................................................................................................ 113
Future work ........................................................................................................... 113

xi
References .............................................................................................................................. 114
Appendix A............................................................................................................................. 116
A1.1 Baseline Parameters ............................................................................................... 116
A1.2 TMoIP ................................................................................................................... 121
No clock ................................................................................................................ 121
Clock ..................................................................................................................... 124
A1.3 LTE over IP ........................................................................................................... 127
Clock .............................................................................................................................. 127
LTE stand-alone .................................................................................................... 127
Vita 132

xii
List of Tables
Table 3.1.1 L-Band, S-Band and C-Band frequency bands of interest. ....................................... 19 Table 3.5. Typical performance data of splitter/combiner. ......................................................... 31
Table 5.1 Recommended configurations for successful transmission ....................................... 110

xiii
List of Figures
Figure 2.3.1 System Level Diagram NI USRP-2920 Source adapted from: [10] .........................7 Figure 2.3.2 System Level Diagram NI USRP-2954 Source adapted from: [10] ..........................7
Figure 2.5.1 Packetized IF decouples transport and processing from receive/transmit Source
adapted from: [13] ..................................................................................................................... 10
Figure 2.7.1 ASK Analytic, Waveform and Vector representation Source adapted from: [15] ... 12 Figure 2.7.2 FSK signal representation. Source adapted from: [17]............................................ 13
Figure 2.7.3 PSK waveform signal. Source adapted from: [17] .................................................. 13 Figure 2.7.4 Constellation diagram of (a) BPSK and (b) QPSK. Source adapted from: [17] ....... 14
Figure 2.7.5 Rectangular constellation Diagram of 16QAM. Source adapted from: [17]. ........... 15 Figure 2.7.5 Frequency Spectrum of an OFDM signal. Source adapted from: [17]..................... 16
Figure 2.8.1 History of wireless technology. Source: Adapted from [18] ................................... 17 Figure 2.8.2 Frequency Bands. Source adapted from: [19]......................................................... 18
Figure 3.1.1 L-band frequency allocation [4] ............................................................................. 20 Figure 3.1.2 S-band frequency allocation [4] ............................................................................. 20
Figure 3.3 C-band frequency allocation [4] ............................................................................... 21 Figure 3.1 BPSK constellation diagram with a rotation of 90 degrees ........................................ 23
Figure 3.2 ASK Eye Diagram representation for illustration purposes. ...................................... 23 Figure 3.3 Power Spectrum Density representation for illustration purposes. ............................. 24
Figure 3.4.1 Telemetry testbed implementation. ........................................................................ 25 Figure 3.4.2 LTE testbed implementation. ................................................................................. 26
Figure 3.5.1 Telemetry signal measured by Fieldfox handheld RF Analyzer N9914A without
attenuator and no gain. .............................................................................................................. 28
Figure 3.5.2 Telemetry signal measured by Fieldfox handheld RF Analyzer N9914A with
attenuator and no gain. .............................................................................................................. 29
Figure 3.5.3 Telemetry signal measured by Fieldfox handheld RF Analyzer N9914A without
attenuator and 12dB gain. .......................................................................................................... 30
Figure 3.5.4 Telemetry signal measured by Fieldfox handheld RF Analyzer N9914A with
attenuator and 12dB gain. .......................................................................................................... 30
Figure 3.5.5 LTE EnB signal measured by FieldFox RF analyzer N9914A without attenuator and
no gain ...................................................................................................................................... 32
Figure 3.5.6 LTE EnB signal measured by FieldFox RF analyzer N9914A without attenuator and
20 dBm power. .......................................................................................................................... 32
Figure 3.5.7 LTE EnB signal measured by FieldFox RF analyzer N9914A with attenuator and no
gain. .......................................................................................................................................... 33
Figure 3.5.8 LTE EnB signal measure by FieldFox RF analyzer N9914A with attenuator and 20
dBm power. .............................................................................................................................. 34
Figure 3.5.9 LTE EnB signal measure by FieldFox RF analyzer N9914A with attenuator after
first splitter/combiner ZNPD1-63HP-S and no gain. .................................................................. 35
Figure 3.5.10 LTE EnB signal measure by FieldFox RF analyzer N9914A with attenuator after
first splitter/combiner ZNPD1-63HP-S and 20 dBm power. ...................................................... 35
Figure 3.5.11 LTE EnB signal measure by FieldFox RF analyzer N9914A with attenuator after
second splitter/combiner ZNPD1-63HP-S and no gain. ............................................................. 36
Figure 3.5.12 LTE EnB signal measure by FieldFox RF analyzer N9914A with attenuator after
second splitter/combiner ZNPD1-63HP-S and 20 dBm power. .................................................. 37

xiv
Figure 3.5.13 LTE UE signal measured by FieldFox RF analyzer N9914A after second
splitter/combiner at 20dBm gain. ............................................................................................... 38
Figure 3.5.14 LTE UE signal measured by FieldFox RF analyzer N9914A after second
splitter/combiner with no gain. .................................................................................................. 38
Figure 3.5.15 Telemetry signal measured by Fieldfox handheld RF Analyzer N9914A with
attenuator after digitizer and no gain. ........................................................................................ 39
Figure 3.5.16 Telemetry signal measured by Fieldfox handheld RF Analyzer N9914A with
attenuator after digitizer and 12dB gain. .................................................................................... 40
Figure 3.5.17 LTE EnB signal measured by Fieldfox handheld RF Analyzer N9914A with
attenuator after digitizer and no gain. ........................................................................................ 41
Figure 3.5.18 LTE EnB signal measured by Fieldfox handheld RF Analyzer N9914A with
attenuator after digitizer and 20 dBm power. ............................................................................. 41
Figure 3.5.19 LTE UE signal measured by Fieldfox handheld RF Analyzer N9914A with
attenuator after digitizer and no gain. ........................................................................................ 42
Figure 3.5.20 LTE UE signal measured by Fieldfox handheld RF Analyzer N9914A with
attenuator after digitizer and 20 dBm power. ............................................................................. 43
Figure 4.1.1 telemetry QPSK signal, frequency 1.8 GHz, and gain 12dB. From left to right:
constellation diagram, power spectrum, and eye diagram. ......................................................... 44
Figure 4.1.2 telemetry 8-PSK signal, frequency 1.8 GHz and gain 12dB. From left to right:
constellation diagram, power spectrum and eye diagram. .......................................................... 45
Figure 4.1.3 telemetry OQPSK signal, frequency 1.8 GHz and gain 12dB. From left to right:
constellation diagram, power spectrum and eye diagram. .......................................................... 45
Figure 4.1.10 LTE EnB TX to LTE UE RX, frequency 1.8 GHz and 20 dBm power. From left to
right: EnB TX power spectrum, UE RX power spectrum, PDSCH constellation, throughput and
data rate. ................................................................................................................................... 46 Figure 4.1.11 LTE EnB TX to LTE UE RX, frequency 1.8 GHz and 20 dBm power. From left to
right: EnB TX power spectrum, UE RX power spectrum, PDSCH constellation, throughput and
data rate. ................................................................................................................................... 47
Figure 4.1.12 LTE EnB TX to LTE UE RX, frequency 1.8 GHz and 20 dBm power. From left to
right: EnB TX power spectrum, UE RX power spectrum, PDSCH constellation, throughput and
data rate. ................................................................................................................................... 48 Figure 4.1.13 LTE EnB TX to LTE UE RX, frequency 1.8 GHz and 20 dBm power. From left to
right: EnB TX power spectrum, UE RX power spectrum, PDSCH constellation, throughput and
data rate. ................................................................................................................................... 48
Figure 4.1.18 LTE UE TX and LTE EnB RX, frequency 1.8 GHz and 20 dBm power. From left
to right: UE TX power spectrum, EnB RX power spectrum, BLER, PUSCH Throughput and
Reported DL BLER................................................................................................................... 50 Figure 4.1.19 LTE UE TX and LTE EnB RX, frequency 2.2 GHz and 20 dBm power. From left
to right: UE TX power spectrum, EnB RX power spectrum, BLER, PUSCH Throughput and
Reported DL BLER................................................................................................................... 50
Figure 4.2.1.1 telemetry QPSK signal, frequency 1.8 GHz and gain 12dB. From left to right:
constellation diagram, power spectrum and eye diagram. .......................................................... 52
Figure 4.2.1.2 telemetry 8-PSK signal, frequency 1.8 GHz and gain 12dB. From left to right:
constellation diagram, power spectrum and eye diagram ........................................................... 52
Figure 4.2.1.3 telemetry OQPSK signal, frequency 1.8 GHz and gain 12dB. From left to right:
constellation diagram, power spectrum and eye diagram. .......................................................... 53

xv
Figure 4.2.2.1 telemetry QPSK signal, frequency 1.8 GHz and gain 12dB. From left to right:
constellation diagram, power spectrum and eye diagram. .......................................................... 54
Figure 4.2.2.2 telemetry 8-PSK signal, frequency 1.8 GHz and gain 12dB. From left to right:
constellation diagram, power spectrum and eye diagram. .......................................................... 54
Figure 4.2.2.3 telemetry OQPSK signal, frequency 1.8 GHz and gain 12dB. From left to right:
constellation diagram, power spectrum and eye diagram. .......................................................... 55
Figure 4.3.1.1 LTE EnB TX to LTE UE RX, frequency 1.8 GHz and 0 dBm power. From left to
right: EnB TX power spectrum, UE RX power spectrum, PDSCH constellation, throughput and
data rate. ................................................................................................................................... 57 Figure 4.3.1.2 LTE EnB TX to LTE UE RX, frequency 1.8 GHz and 20 dBm power. From left to
right: EnB TX power spectrum, UE RX power spectrum, PDSCH constellation, throughput and
data rate. ................................................................................................................................... 57
Figure 4.3.1.3 LTE EnB TX to LTE UE RX, frequency 1.8 GHz and no gain. From left to right:
EnB TX power spectrum, UE RX power spectrum, PDSCH constellation, throughput and data
rate. ........................................................................................................................................... 58 Figure 4.3.1.4 LTE EnB TX to LTE UE RX, frequency 1.8 GHz and 0 dBm power. From left to
right: EnB TX power spectrum, UE RX power spectrum, PDSCH constellation, throughput and
data rate. ................................................................................................................................... 58
Figure 4.3.1.5 LTE EnB TX to LTE UE RX, frequency 1.8 GHz and 0 dBm power. From left to
right: EnB TX power spectrum, UE RX power spectrum, PDSCH constellation, throughput and
data rate. ................................................................................................................................... 59 Figure 4.3.1.6 LTE EnB TX to LTE UE RX, frequency 1.8 GHz and 20 dBm power. From left to
right:: EnB TX power spectrum, UE RX power spectrum, PDSCH constellation, throughput and
data rate. ................................................................................................................................... 59
Figure 4.3.1.7 LTE EnB TX to LTE UE RX, frequency 1.8 GHz and 0 dBm power. From left to
right: EnB TX power spectrum, UE RX power spectrum, PDSCH constellation, throughput and
data rate. ................................................................................................................................... 60 Figure 4.3.1.8 LTE EnB TX to LTE UE RX, frequency 1.8 GHz and 20 dBm power. From left to
right:: EnB TX power spectrum, UE RX power spectrum, PDSCH constellation, throughput and
data rate. ................................................................................................................................... 60
Figure 4.3.1.9 QPSK LTE DL at frequency 1.8 GHz and 0 dBm power. From left to right: EnB
TX power spectrum, EnB RX power spectrum, BLER, PUSCH throughput and reported DL
BLER. ....................................................................................................................................... 62 Figure 4.3.1.10 QPSK LTE UL at frequency 2.2 GHz and 0 dBm power. From left to right: LTE
UE TX power spectrum, UE RX power spectrum, PDSCH constellation, throughput and data
rate. ........................................................................................................................................... 63
Figure 4.3.1.11 QPSK LTE DL at frequency 1.8 GHz and 20 dBm power. From left to right:
EnB TX power spectrum, EnB RX power spectrum, BLER, PUSCH throughput and reported DL
BLER. ....................................................................................................................................... 63 Figure 4.3.1.12 QPSK LTE UL at frequency 2.2 GHz and 20 dBm power. From left to right:
LTE UE TX power spectrum, UE RX power spectrum, PDSCH constellation, throughput and
data rate. ................................................................................................................................... 64
Figure 4.3.1.13 16QAM LTE DL at frequency 1.8 GHz and 0 dBm power. From left to right:
EnB TX power spectrum, EnB RX power spectrum, BLER, PUSCH throughput and reported DL
BLER. ....................................................................................................................................... 64

xvi
Figure 4.3.1.14 QPSK LTE UL at frequency 2.2 GHz and 0 dBm power. From left to right: LTE
UE TX power spectrum, UE RX power spectrum, PDSCH constellation, throughput and data
rate. ........................................................................................................................................... 65 Figure 4.3.1.15 16QAM LTE DL at frequency 1.8 GHz and 20 dBm power. From left to right:
EnB TX power spectrum, EnB RX power spectrum, BLER, PUSCH throughput and reported DL
BLER. ....................................................................................................................................... 65
Figure 4.3.1.16 QPSK LTE UL at frequency 2.2 GHz and 20 dBm power. From left to right:
LTE UE TX power spectrum, UE RX power spectrum, PDSCH constellation, throughput and
data rate. ................................................................................................................................... 66 Figure 4.3.1.17 64QAM LTE DL at frequency 1.8 GHz and 0 dBm power. From left to right:
EnB TX power spectrum, EnB RX power spectrum, BLER, PUSCH throughput and reported DL
BLER. ....................................................................................................................................... 66
Figure 4.3.1.18 QPSK LTE UL at frequency 2.2 GHz and 0 dBm power. From left to right: LTE
UE TX power spectrum, UE RX power spectrum, PDSCH constellation, throughput and data
rate. ........................................................................................................................................... 67 Figure 4.3.1.19 64QAM LTE DL at frequency 1.8 GHz and 20 dBm power. From left to right:
EnB TX power spectrum, EnB RX power spectrum, BLER, PUSCH throughput and reported DL
BLER. ....................................................................................................................................... 67
Figure 4.3.1.20 QPSK LTE UL at frequency 2.2 GHz and 20 dBm power. From left to right:
LTE UE TX power spectrum, UE RX power spectrum, PDSCH constellation, throughput and
data rate. ................................................................................................................................... 68 Figure 4.3.1.21 64QAM LTE DL at frequency 1.8 GHz and 0 dBm power. From left to right:
EnB TX power spectrum, EnB RX power spectrum, BLER, PUSCH throughput and reported DL
BLER. ....................................................................................................................................... 68
Figure 4.3.1.22 QPSK LTE UL at frequency 2.2 GHz and 0 dBm power. From left to right: LTE
UE TX power spectrum, UE RX power spectrum, PDSCH constellation, throughput and data
rate. ........................................................................................................................................... 69 Figure 4.3.1.23 64QAM LTE DL at frequency 1.8 GHz and 20 dBm power. From left to right:
EnB TX power spectrum, EnB RX power spectrum, BLER, PUSCH throughput and reported DL
BLER. ....................................................................................................................................... 69
Figure 4.3.1.24 QPSK LTE UL at frequency 2.2 GHz and 20 dBm power. From left to right:
LTE UE TX power spectrum, UE RX power spectrum, PDSCH constellation, throughput and
data rate. ................................................................................................................................... 70 Figure 4.3.1.25 64QAM LTE DL at frequency 1.8 GHz and 0 dBm power. From left to right:
EnB TX power spectrum, EnB RX power spectrum, BLER, PUSCH throughput and reported DL
BLER. ....................................................................................................................................... 70
Figure 4.3.1.26 QPSK LTE UL at frequency 2.2 GHz and 20 dBm power. From left to right:
LTE UE TX power spectrum, UE RX power spectrum, PDSCH constellation, throughput and
data rate. ................................................................................................................................... 71 Figure 4.3.1.27 64QAM LTE DL at frequency 1.8 GHz and 20 dBm power. From left to right:
EnB TX power spectrum, EnB RX power spectrum, BLER, PUSCH throughput and reported DL
BLER. ....................................................................................................................................... 72
Figure 4.3.1.28 QPSK LTE UL at frequency 2.2 GHz and 0 dBm power. From left to right: LTE
UE TX power spectrum, UE RX power spectrum, PDSCH constellation, throughput and data
rate. ........................................................................................................................................... 72

xvii
Figure 4.3.1.29 64QAM LTE DL at frequency 1.8 GHz and 20 dBm power. From left to right:
EnB TX power spectrum, EnB RX power spectrum, BLER, PUSCH throughput and reported DL
BLER. ....................................................................................................................................... 73 Figure 4.3.1.30 QPSK LTE UL at frequency 2.2 GHz and 20 dBm power. From left to right:
LTE UE TX power spectrum, UE RX power spectrum, PDSCH constellation, throughput and
data rate. ................................................................................................................................... 73
Figure 4.3.2.1 LTE EnB TX to LTE UE RX, frequency 1.8 GHz and 0 dBm power. From left to
right: EnB TX power spectrum, UE RX power spectrum, PDSCH constellation, throughput and
data rate. ................................................................................................................................... 75 Figure 4.3.2.2 LTE EnB TX to LTE UE RX, frequency 1.8 GHz and 20 dBm power. From left to
right: EnB TX power spectrum, UE RX power spectrum, PDSCH constellation, throughput and
data rate. ................................................................................................................................... 76
Figure 4.3.2.3 LTE EnB TX to LTE UE RX, frequency 1.8 GHz and 0 dBm power. From left to
right: EnB TX power spectrum, UE RX power spectrum, PDSCH constellation, throughput and
data rate. ................................................................................................................................... 76 Figure 4.3.2.4 LTE EnB TX to LTE UE RX, frequency 1.8 GHz and 20 dBm power. From left to
right: EnB TX power spectrum, UE RX power spectrum, PDSCH constellation, throughput and
data rate. ................................................................................................................................... 77
Figure 4.3.2.5 LTE EnB TX to LTE UE RX, frequency 1.8 GHz and 0 dBm power. From left to
right: EnB TX power spectrum, UE RX power spectrum, PDSCH constellation, throughput and
data rate. ................................................................................................................................... 77 Figure 4.3.2.6 LTE EnB TX to LTE UE RX, frequency 1.8 GHz and 20 dBm power. From left to
right: EnB TX power spectrum, UE RX power spectrum, PDSCH constellation, throughput and
data rate. ................................................................................................................................... 78
Figure 4.3.2.7 LTE EnB TX to LTE UE RX, frequency 1.8 GHz and 0 dBm power. From left to
right: EnB TX power spectrum, UE RX power spectrum, PDSCH constellation, throughput and
data rate. ................................................................................................................................... 78 Figure 4.3.2.8 LTE EnB TX to LTE UE RX, frequency 1.8 GHz and 0 dBm power. From left to
right: EnB TX power spectrum, UE RX power spectrum, PDSCH constellation, throughput and
data rate. ................................................................................................................................... 79
Figure 4.3.2.9 QPSK LTE DL at frequency 1.8 GHz and 0 dBm power. From left to right: EnB
TX power spectrum, EnB RX power spectrum, BLER, PUSCH throughput and reported DL
BLER. ....................................................................................................................................... 80 Figure 4.3.2.10 QPSK LTE UL at frequency 2.2 GHz and 0 dBm power. From left to right: LTE
UE TX power spectrum, UE RX power spectrum, PDSCH constellation, throughput and data
rate. ........................................................................................................................................... 80
Figure 4.3.2.11 QPSK LTE DL at frequency 1.8 GHz and 20 dBm power. From left to right:
EnB TX power spectrum, EnB RX power spectrum, BLER, PUSCH throughput and reported DL
BLER. ....................................................................................................................................... 81 Figure 4.3.2.12 QPSK LTE UL at frequency 2.2 GHz and 20 dBm power. From left to right:
LTE UE TX power spectrum, UE RX power spectrum, PDSCH constellation, throughput and
data rate. ................................................................................................................................... 81
Figure 4.3.2.13 16QAM LTE DL at frequency 1.8 GHz and 0 dBm power. From left to right:
EnB TX power spectrum, EnB RX power spectrum, BLER, PUSCH throughput and reported DL
BLER. ....................................................................................................................................... 82

xviii
Figure 4.3.2.14 QPSK LTE UL at frequency 2.2 GHz and 0 dBm power. From left to right: LTE
UE TX power spectrum, UE RX power spectrum, PDSCH constellation, throughput and data
rate. ........................................................................................................................................... 82 Figure 4.3.2.15 16QAM LTE DL at frequency 1.8 GHz and 20 dBm power. From left to right:
EnB TX power spectrum, EnB RX power spectrum, BLER, PUSCH throughput and reported DL
BLER. ....................................................................................................................................... 83
Figure 4.3.2.16 QPSK LTE UL at frequency 2.2 GHz and 20 dBm power. From left to right:
LTE UE TX power spectrum, UE RX power spectrum, PDSCH constellation, throughput and
data rate. ................................................................................................................................... 83 Figure 4.3.2.17 64QAM LTE DL at frequency 1.8 GHz and 0 dBm power. From left to right:
EnB TX power spectrum, EnB RX power spectrum, BLER, PUSCH throughput and reported DL
BLER. ....................................................................................................................................... 84
Figure 4.3.2.18 QPSK LTE UL at frequency 2.2 GHz and 0 dBm power. From left to right: LTE
UE TX power spectrum, UE RX power spectrum, PDSCH constellation, throughput and data
rate. ........................................................................................................................................... 84 Figure 4.3.2.19 64QAM LTE DL at frequency 1.8 GHz and 20 dBm power. From left to right:
EnB TX power spectrum, EnB RX power spectrum, BLER, PUSCH throughput and reported DL
BLER. ....................................................................................................................................... 85
Figure 4.3.2.20 QPSK LTE UL at frequency 2.2 GHz and 20 dBm power. From left to right:
LTE UE TX power spectrum, UE RX power spectrum, PDSCH constellation, throughput and
data rate. ................................................................................................................................... 85 Figure 4.3.2.21 64QAM LTE DL at frequency 1.8 GHz and 0 dBm power. From left to right:
EnB TX power spectrum, EnB RX power spectrum, BLER, PUSCH throughput and reported DL
BLER. ....................................................................................................................................... 86
Figure 4.3.2.22 QPSK LTE UL at frequency 2.2 GHz and 0 dBm power. From left to right: LTE
UE TX power spectrum, UE RX power spectrum, PDSCH constellation, throughput and data
rate. ........................................................................................................................................... 86 Figure 4.3.2.23 64QAM LTE DL at frequency 1.8 GHz and 20 dBm power. From left to right:
EnB TX power spectrum, EnB RX power spectrum, BLER, PUSCH throughput and reported DL
BLER. ....................................................................................................................................... 87
Figure 4.3.2.24 QPSK LTE UL at frequency 2.2 GHz and 20 dBm power. From left to right:
LTE UE TX power spectrum, UE RX power spectrum, PDSCH constellation, throughput and
data rate. ................................................................................................................................... 87 Figure 4.3.2.25 64QAM LTE DL at frequency 1.8 GHz and 0 dBm power. From left to right:
EnB TX power spectrum, EnB RX power spectrum, BLER, PUSCH throughput and reported DL
BLER ........................................................................................................................................ 88
Figure 4.3.2.26 QPSK LTE UL at frequency 2.2 GHz and 20 dBm power. From left to right:
LTE UE TX power spectrum, UE RX power spectrum, PDSCH constellation, throughput and
data rate. ................................................................................................................................... 88 Figure 4.3.2.27 64QAM LTE DL at frequency 1.8 GHz and 20 dBm power. From left to right:
EnB TX power spectrum, EnB RX power spectrum, BLER, PUSCH throughput and reported DL
BLER. ....................................................................................................................................... 89
Figure 4.3.2.28 QPSK LTE UL at frequency 2.2 GHz and 0 dBm power. From left to right: LTE
UE TX power spectrum, UE RX power spectrum, PDSCH constellation, throughput and data
rate. ........................................................................................................................................... 90

xix
Figure 4.3.2.29 64QAM LTE DL at frequency 1.8 GHz and 20 dBm power. From left to right:
EnB TX power spectrum, EnB RX power spectrum, BLER, PUSCH throughput and reported DL
BLER. ....................................................................................................................................... 90 Figure 4.3.2.30 QPSK LTE UL at frequency 2.2 GHz and 20 dBm power. From left to right:
LTE UE TX power spectrum, UE RX power spectrum, PDSCH constellation, throughput and
data rate. ................................................................................................................................... 91
Figure 4.3.2.31 64QAM LTE DL at frequency 1.8 GHz and 20 dBm power. From left to right:
EnB TX power spectrum, EnB RX power spectrum, BLER, PUSCH throughput and reported DL
BLER. ....................................................................................................................................... 91 Figure 4.3.2.32 QPSK LTE UL at frequency 2.2 GHz and 0 dBm power. From left to right: LTE
UE TX power spectrum, UE RX power spectrum, PDSCH constellation, throughput and data
rate. ........................................................................................................................................... 92
Figure 4.3.2.33 64QAM LTE DL at frequency 1.8 GHz and 20 dBm power. From left to right:
EnB TX power spectrum, EnB RX power spectrum, BLER, PUSCH throughput and reported DL
BLER. ....................................................................................................................................... 92 Figure 4.3.2.34 QPSK LTE UL at frequency 2.2 GHz and 20 dBm power. From left to right:
LTE UE TX power spectrum, UE RX power spectrum, PDSCH constellation, throughput and
data rate. ................................................................................................................................... 93
Figure 4.4.1 LTE EnB signal measured by FieldFox RF analyzer N9914A calibrated to -60dBm.
................................................................................................................................................. 94
Figure 4.4.2 LTE EnB TX to LTE UE RX, frequency 2.2 GHz. From left to right: EnB TX
power spectrum, UE RX power spectrum, PDSCH constellation, throughput and data rate. ...... 95
Figure 4.4.3 LTE EnB TX to LTE UE RX, frequency 2.2 GHz. From left to right: EnB TX
power spectrum, UE RX power spectrum, PDSCH constellation, throughput and data rate. ...... 96
Figure 4.4.4 LTE EnB TX to LTE UE RX, frequency 2.2 GHz. From left to right: EnB TX
power spectrum, UE RX power spectrum, PDSCH constellation, throughput and data rate. ...... 96
Figure 4.4.5 LTE EnB TX to LTE UE RX, frequency 2.2 GHz. From left to right: EnB TX
power spectrum, UE RX power spectrum, PDSCH constellation, throughput and data rate. ...... 97
Figure 4.4.6 LTE EnB TX to LTE UE RX, ideal conditions and 4-bits. From left to right: EnB
TX power spectrum, UE RX power spectrum, PDSCH constellation, throughput and data rate. 98
Figure 4.4.7 LTE EnB TX to LTE UE RX, ideal conditions and 4-bits. From left to right: EnB
TX power spectrum, UE RX power spectrum, PDSCH constellation, throughput and data rate. 99
Figure 4.4.8 LTE EnB TX to LTE UE RX, ideal conditions and 4-bits. From left to right: EnB
TX power spectrum, UE RX power spectrum, PDSCH constellation, throughput and data rate. 99
Figure 4.4.9 LTE EnB TX to LTE UE RX, ideal conditions and 4-bits. From left to right: EnB
TX power spectrum, UE RX power spectrum, PDSCH constellation, throughput and data rate.
............................................................................................................................................... 100 Figure 4.4.10 LTE EnB TX to LTE UE RX, ideal conditions and 6-bits. From left to right: EnB
TX power spectrum, UE RX power spectrum, PDSCH constellation, throughput and data rate.
............................................................................................................................................... 100
Figure 4.4.11 64QAM LTE DL at frequency 1.8 GHz and 20 dBm power. From left to right:
EnB TX power spectrum, EnB RX power spectrum, BLER, PUSCH throughput and reported DL
BLER. ..................................................................................................................................... 102 Figure 4.4.12 QPSK LTE UL frequency 1.82 GHz and 20 dBm power. From left to right: LTE
UE TX power spectrum, UE RX power spectrum, PDSCH constellation, throughput and data
rate. ......................................................................................................................................... 102

xx
Figure 4.4.13 LTE DL with video reproduction. ...................................................................... 103 Figure 4.4.14 LTE UL with video reproduction. ...................................................................... 104

xxi
List of Illustrations
Illustration 1. Physical Testbed design with front (left) and back (right:) views without spectrum
analyzer. ................................................................................................................................... 26
Illustration 2. Physical LTE Testbed design with digitizers and LTE SDR’s. ............................. 27 Illustration 3. Complete physiscal testebed including telemetry and LTE SDR’s. In addition,
Digitizers at bottom. .................................................................................................................. 27

1
Chapter 1: Introduction
Physical limitations are a challenge for radio frequency transmission. Moreover, Telemetry
(TM) signals have disadvantages, for example the degradation of signal over long distances. Not
only degradation, but also, the noise due to other signals spectrum can affect the TM signal [1]. In
addition, Radio Frequency (RF) spectrum is overcrowded due to high demand by several
commercial users. As new technologies evolve and others emerge, RF spectrum is needed for
internet of things or other services offer by commercial companies. Furthermore, different
Advanced Wireless Services (AWS) auctions to deliver more reliability to the mobile users [2].
These auctions reallocate several mobile carries adjacent to TM signals. TM signals are being
affected by these auctions; new solutions are explored to fit the needs of spectrum users. Mobile
carriers’ modulation is Orthogonal Frequency Divide Multiplexing (OFDM) a very aggressive
modulation compared to a TM signal modulation. OFDM modulation can cause degradation in
TM signal [3]. RF over IP is an innovative solution that mitigates the physical constraints and
enhance a successful transmission. The mitigation of the physical constraints for TM signal
transmission will improve with RF over IP. Physical limitations are an immense disadvantage for
many RF spectrum users, especially TM because of the modulation used for transmission. In
addition, other RF spectrum users will create noise for the transmission. RF over IP will transmit
in a different environment that will benefit and make a feasible transmission.
The Federal Communications Commission (FCC) is in charge of the control, distribution
and supervision of the RF spectrum. Due to AWS auctions TM frequencies band have been
reduced for commercial use. The bands of interest are the L-band (from 1-2GHz), S-band (from
2-4 GHz) and C-band (4-8 GHz) [4]. These bands are affected by the AWS auction with adjacent
mobile carriers. As discussed in Interference Analysis and Mitigation of Telemetry and 4G LTE

2
systems in adjacent spectrum bands [3] there are certain limitations to transmit if signals TM and
4G LTE are adjacent. Due to OFDM modulation, 4G LTE does not have massive impact in the
noise raise caused by TM signals. On the contrary, TM signal are affected severally by 4G LTE
signals.
Digitizers are the devices used to create the conversion from RF to IP networks and perform
the transmission. TM signal is digitally manipulated and transported in IP networks, repeating the
process backwards to unconvert the signal. Capability of these devices include the preservation of
frequency, configuration of bandwidth stream, and option for additional gain. Also, configuration
of IP source and destination. In order, to test the digitizers a Software Defined Radio (SDR),
testbed will emulate telemetry signals with diverse modulation schemes. SDR’s are controlled by
a software called LabVIEW Communications, which generates a simulation of several signal
transmission without affecting the RF spectrum. Different SDR’s have the capability and
flexibility to test various scenarios including LTE signals. SDR’s will generate TM signal
transmission with several changing parameters in order to have a deep analysis of the quality of
signal after transmission. TM signal generated by the SDR will be sent to the digitizers to be
converted and transmitted, after, signal is transmitted, thus it will be unconverted and received by
another SDR, to prove that the digitizers could be added as a transparent layer of signal
transmission.
RF over IP is an innovative solution for the extreme RF spectrum problem. RF spectrum
has limited resources, also, RF spectrum demand has increased over the past few years. In
consequence, as demand increases allocation for new users is needed and reallocation for existing
users. Government agencies, such as, Department of Defense (DoD) has been a historical large
user of RF spectrum. Due to AWS, parts of RF spectrum are sold forcing DoD to reallocate several

3
applications. DoD existing users are mostly legacy applications that still need to be supported. RF
over IP technology is a possible solution that will support legacy applications using workarounds,
such as, removing backhaul by moving the RF signal into a Data network.
To summarize, to perform a successful TM, signal transmission RF over IP technology
could be added to the process to ensure reliability and flexibility of the system. Due to AWS
auctions, need to different solutions is required from White Sands Missile Range (WSMR). RF
over IP is a feasible mitigation technique interference to TM signals.

4
Chapter 2: Literature Review & Background Information
2.1 TELEMETRY HISTORY, STANDARDS PCM/FM
In order to understand telemetry history, going back to 1950’s when telemetry was invented
many applications were implemented. According to Barculo the definition is “Telemetry is a
technology that allows the remote measurement and reporting of information of interest to the
system designer or operator. Telemetry typically refers to wireless communications, but can also
refer to data transferred over other media, such as a telephone or computer network or via an
optical link” [5].
Early telemetry was used in different fields of study. Biomedical is one important field in
which telemetry has many applications. Telemetry has now become a vital constituent in the field
of medical sciences to remote measurement of biological parameters. Biomedical telemetry
provides a means for monitoring and studying human and animal physiologic functions from a
remote site with wireless transmission for the goals of minimally disturbing normal activity or free
restraint of target’s subject to allow ambulatory freedom. Signals derived from physiologic
transducers have been encoded and formatted in many different ways in an effort to improve
transmission reliability in air space and water and carrier signals have included radio, sound and
light. [5]
In addition, there are several other fields of study for telemetry. For this research we focus
on the telemetry that was applied in the topic of missiles and other fields that are relevant in signal
transmission. Most of this telemetry systems were developed during cold war, around 1950.
Telemetry intelligence (TELINT) (later to be called FISINT) was a critical source of performance
information on foreign missiles and space vehicles while they were being developed and tested, as
well as a source of telemetry from military aircraft during their development. TELINT could also
provide much operational information on foreign satellites and space vehicles. The National
Security Agency (NSA) became responsible for U.S. TELINT under a Department of Defense
(DoD) directive in 1959 as part of NSA’s electronic intelligence (ELINT) responsibilities.

5
TELINT prior to 1959 was being conducted by all of the DoD military department, this is disputed
by Smithsonian Air and Space Museum [6]
2.2 ANTENNA
This section is mainly to gain knowledge in how antennas work. Since, antennas play a big
role in transmitting the signal, it is encouraged to understand how several antennas work. Antennas
radiate power and that is how they distribute the signal. The main purpose of an antenna is to make
a successful transmission over a media, either transmitting or receiving. According to Balanis, “An
antenna radiation pattern or antenna pattern is defined as “a mathematical function or a graphical
representation of the radiation properties of the antenna as a function of space coordinates. In most
cases, the radiation pattern is determined in the far-field region and is represented as a function of
the directional coordinates. Radiation properties include power flux density, radiation intensity,
field strength, directivity, phase or polarization.” The radiation property of most concern is the two
or three-dimensional spatial distribution of radiated energy as a function of the observer’s position
along a path or surface of constant radius”. [7]
There are several types of antennas that could be used for transmission. Depending of the
purpose of the antenna the type could be defined. Also, some antennas perform better in different
tasks than others. Antennas have different radiation patterns, “Various parts of a radiation pattern
are referred to as lobes, which may be subclassified into major or main, minor, side, and back
lobes” as noted in [7].
Several antennas have several radiation patterns, which vary their lobes. Antennas are a
limiting factor in terms of a successful and reliable transmission, due to physical constraints and
radiation pattern problems. As mentioned in Balanis “Minor lobes usually represent radiation in
undesired directions, and they should be minimized. Side lobes are normally the largest of the
minor lobes”. Antennas waste some of the power due to this radiation loss of power.

6
To conclude, antennas are a limiting factor due to loss of radiation power. On the other
hand, antennas play a big role in transmission despite its constraints in nowadays transmissions.
Antennas could perform a good transmission, but if users overcrowd the antenna there are limiting
factors that compromise the transmission. Also, if there are other transmission, they could interfere
or degrade the signal transmission since they are considered as noise.
2.3 Software Defined Radio (SDR)
A Software Defined Radio (SDR) is a radio communication system in which its hardware
it is replaced by software components. SDR Forum defines as a “Radio in which some or all of the
physical layer functions are Software Defined” [8]. Several devices are used for the experiments
throughout history measuring several parameters to qualify and quantify signal transmission, one
of them is the SDR. SDR’s not only can transmit and receive a signal, also, they can qualify and
quantify a signal with the right: tools to be measured. According to “SDR usually is compared to
a radio PC, which can host different air interface applications and the major focus is on the access
system. However, it is necessary to broaden the scope and to include all layers for optimizing
network resources and improving user satisfaction. The traditional SDR concept introduces
flexible terminal reconfiguration by replacing radios completely implemented in hardware by
those that are configurable or even programmable in software to a large extent. These concepts
include reconfiguration of the antenna, the radio transceiver and the baseband” [9].
SDR’s will facilitate the communication and provide reliability to the signal transmission.
In addition, SDR could replicate real scenarios with the right: parameters to be inputted. Now,
National Instruments (NI) Universal Software Radio Peripheral (USRP) are the SDR used for RF
applications [10]. Also, USRP’s are a feasible device and will be used for experiments in this
thesis. Figure 2.3.1 shows a system level diagram of the NI USRP-2920. NI USRP-2920 will be
used to generate Telemetry (TM) signal.

7
Figure 2.3.1 System Level Diagram NI USRP-2920 Source adapted from: [10]
Furthermore, Figure 2.3.2 shows the system level diagram from an NI USRP-2954 that
will be used to generate the 4G LTE signal for other experiments. This is a more complex SDR
because it includes the input for a GPS antenna, also, frequency capability is higher than the NI
USRP-2920.
Figure 2.3.2 System Level Diagram NI USRP-2954 Source adapted from: [10]

8
To conclude, SDR’s play a big role in the experiments for several applications. Since,
legacy technology through latest technology as 4G LTE. In addition, for the set of experiments to
be presented, it is fundamental to have SDR’s to replicate the scenarios and give a detailed
understanding. SDR’s facilitate the scenarios and experiments to describe the behavior of signal
transmissions.
2.4 OTHER TECHNIQUES
Several techniques have been researched in order to optimize transmission. Specially as
RF Spectrum is overcrowded, different techniques are explored. Several techniques in order to
mitigate interferences between adjacent frequency bands. Previous techniques involve the same
testbed using SDR’s to simulate several environments to provide knowledge.
The first technique is to set boundaries or rules to transmit within a safe range of other
frequency bands. Gonzalez proposed in “Interference analysis and mitigation of Telemetry (TM)
and 4G Long-Term Evolution (LTE) systems in adjacent spectrum bands” research that “focus of
this document is to explore what solutions there are to adjacent interfering bands. This to be able
to operate normally without any hindrance from external systems; meaning that the wireless
systems from WSMR are to not interfere with the 4G LTE Uplink and Downlink bands, and vice-
versa” [3]. In order, to have a reliable transmission research, safe frequency will not be affected
by other adjacent frequency bands. Gonzalez’s technique involves a testbed that was created in
order to simulate several signal transmissions. Understand how these signals could interfere with
each other and qualify and quantify the transmission.
Another technique that has been researched is the “Interference mitigation of adjacent radio
frequency signals on a flexible software-defined radio testbed platform” which proposes a digital
filtering in order to mitigate the interferences between adjacent frequency bands. According to
Elahi, “Digital filtering technique is a very effective application in mitigating interference between
adjacent spectrum users. It rejects the adjacent interfering signal by reducing its signal power. This

9
can be achieved in the laboratory by designing filters with the desired rejection levels on a flexible
testbed” [11].
2.5 RADIO FREQUENCY (RF) OVER INTERNET PROTOCOLS (IP)
One feasible mitigation technique to transmit RF signals is RF over IP networks. RF over
IP will help to decongest the RF Spectrum. RF over IP could mitigate the physical problems that
regular transmissions could be affecting and degrade the signal. Telemetry (TM) have several
physical constraints when performing a long transmission. According to Chengyu, “By digitizing
the signal, Radio Frequency over IP (RFoIP) reduces the signal degradation of the RF signal during
long-distance transmission and reduces the effect from noise” [12]. RFoIP is innovative solution
that has been exploited for the last years. As cited by Chengyu, “In order to meet the compatibility
between networks, RFoIP technology is an effective solution. RFoIP is a technology that converts
RF signal generated by an RF-based device into digital signal and implements transmission of the
RF signal using IP network” [12]. Many companies have developed devices to convert the legacy
systems RF signals to IP packets. These devices are called Digitizers, capable of converting and
de-converting the signal in order to perform a transmission over the IP network.
RT Logic, a Kratos company, developed a digitizer in order to fulfill customers necessities.
Digitizers have complexity to ensure a successful transmission. In addition, other technologies are
added to have control over the transmission and perform a feasible reconstruction of the RF signal.
Also, digitizers include the ability to manage the IP for the interface and the source and destination
IP. RFoIP, an innovative solution could be described as RT logic cites “This technology extends
the transport of analog RF or intermediate frequency (IF) data to IP-based networks, e.g., the
Internet. Using specialized techniques packetized IF can move digitized spectrum deterministically
anywhere over an IP network, and reconstruct it at the destination so it can be processed by either
digital or analog equipment. The specialized techniques achieve this with minimal added latency
and no lost data all while being agnostic to the spectral content being transported. Since IP network

10
protocols provide neither deterministic data transport nor minimal latency, the implementation of
packetized IF requires several innovations to achieve these objectives” [13]. Understanding the
process for the digitizers when performing conversion and transmission is easier if it is explained
step by step. Furthermore, a reference clock is added to synchronize the digitizers. Figure 2.5.1
shows how RF signal is converted to IP packets and de-converted back to RF signal.
Figure 2.5.1 Packetized IF decouples transport and processing from receive/transmit Source
adapted from: [13]
In conclusion, RFoIP is a feasible technology that could mitigate physical constraints of
TM signal transmission. In addition, SDR’s are included on the testbed generating the TM signal,
which will be converted, transmitted, de-converted by the digitizers. Finally, TM signal will be
received by the second SDR which will qualify and quantify the signal received. To summarize,
RFoIP is a feasible technology to mitigate disadvantages of RF signal transmission over the air.
2.6 RF SPECTRUM
According to National Telecommunications and Information Administration (NTIA), the
RF spectrum ranges from 3 kHz up to 300 kHz [4]. RF Spectrum is controlled by the FCC, but,
supervise and ensure everything complies by the FCC Enforcement Bureau (FCCEB). This

11
department will check that all RF spectrum companies do not go beyond or below of the frequency
allocated for its services. If any company will infringe the rules stablished it could result in fines
applied by the FCCEB [14].
As the demmand for newer technology increases, the users of the RF spectrum increase as
well. Now, Internet of Things (IoT) will increase even more the demmand for RF spectrum space.
IoT refers to several technologies, for example, smart home security systems, autonomous cars,
autonomous farming equipment and more. Any smart device will require connection, RF spectrum
will be overcrowded. In addition, users are using many smart devices and all require a separate
connection. In order to fullfill this demmands readjustments to the RF spectrum are in progress,
Advanced Wireless Services (AWS) auctions are taking place to reallocate certain frequency
bands.
2.7 MODULATION TECHNIQUES
The process to transmit data is called modulation. Data needs to be transformed into a
signal which later will be demodulated and converted back to data. There are several modulation
techniques. They are divided into analog and digital modulations. For example, analog
modulations are the common radio signals, Amplitude Modulation (AM) and Frequency
Modulation (FM). AM and FM are the radio stations that can be listened in a car. Now, digital
modulations are more complex. According to Sklar, “Digital modulation is the process by which
digital symbols are transformed in waveforms that are compatible with the characteristics of the
channel” [15] . Three basic digital modulations are:
• Amplitude Shift Keying (ASK)
• Frequency Shift Keying (FSK)
• Phase Shift Keying (PSK)

12
ASK is the first basic Digital modulation. ASK will vary the amplitude of the signal in
order to transmit different data. Fuqin cites that “In ASK, the modulator puts out a burst of carrier
for every symbol 1, and no signal for every symbol 0” [16]. Figure 2.7.1 shows ASK representation
of the analytic, waveform and vector representation. In the waveform, we can appreciate the
representation of the symbol 1 then a symbol 0 and at the end again a symbol 1. In order to
represent the two symbols, it is necessary to change the amplitude. This example could be also
called On and Off keying (OOK) since there is no amplitude at the time symbol 0 is sent [16].
Figure 2.7.1 ASK Analytic, Waveform and Vector representation Source adapted from: [15]
FSK is the second basic digital Modulation. FSK will vary the frequency in order to send
symbols 1 and 0. Different frequency had to be denoted in order to know which will be for symbol
0 and symbol 1. According to Dharma, “Frequency shift keying (FSK) is used for modulating a
digital signal over two carriers by using a different frequency for a “1” or a “0” the carriers is
known as the frequency shift” [17]. The difference betweenFigure 2.7.2 shows first the frequency
signal for the symbol 1, then the frquency signal for symbol 0. In addition, message signals to
represent what symbols are being sent, finally, the FSK signal with both frequency symbols
representing the mesaage.

13
Figure 2.7.2 FSK signal representation. Source adapted from: [17]
PSK is the final basic modulation. According to Dharma, “In digital transmission, the phase
of the carrier is discretely varied with respect to a reference phase and according to the data being
transmitted. PSK is a method of transmitting and receiving digital signals in which the phase of a
transmitted signal is varied to convey information. For example, when encoding, the phase shift
could be 0◦ for encoding a “0” and 180◦ for encoding a “1,” thus making the representations for
“0” and “1” apart by a total of 180◦. This kind of PSK is also called binary phase shift keying
(BPSK) since 1 bit is transmitted in a single modulation symbol” [17]. Figure 2.7.3 shows the
waveform signal of PSK.
Figure 2.7.3 PSK waveform signal. Source adapted from: [17]

14
Now, using the same concept of PSK several derivations could be used in order to send
more symbols. Quadrature Phase Shift Keying (QPSK) is created in order to send more symbols.
Dharma cites, “Quadrature phase shift keying (QPSK) takes the concept of PSK a step further as
it assumes that the number of phase shifts is not limited to only two states. The transmitted carrier
can undergo any number of phase changes. This is indeed the case in quadrature phase shift keying.
With QPSK, the carrier undergoes four changes in phase and can thus represent four binary bit
patterns of data, effectively doubling the bandwidth of the carrier. The following are the phase
shifts with the four different combinations of input bits. Figure 2.7.4 shows the comparison of
BPSK and QPSK in the constellation diagram.
Figure 2.7.4 Constellation diagram of (a) BPSK and (b) QPSK. Source adapted from: [17]
Moreover, Quadrature Amplitude Modulation (QAM) is another modulation to research.
“The majority of the passband modulation schemes we have studied in previous chapters are
constant envelope schemes. The constant envelope property of these schemes is especially
important to systems with power amplifiers which must operate in the nonlinear region of the
input-output characteristic for maximum power efficiency, like the satellite transponders. For some
ot her communication systems, constant envelope may not be a crucial requirement, whereas
bandwidth efficiency is more important. QAM is a class of nonconstant envelope schemes that can
achieve higher bandwidth efficiency than M-PSK with the same average signal power. QAM is
widely used in modems designed for telephone channels” [16]. In addition, Dharma describes as
“ simply a combination of AM and PSK, in which two carriers out of phase by 90◦ are amplitude
modulated” [17]. Also, there are several QAM variations. For example, “16QAM involves

15
splitting the signal into 12 different phases and 3 different amplitudes for a total of 16 different
possible values, each encoding 4 bits” [17]. Figure 2.7.5 shows the constellation diagram of
16QAM, also bit combination distributed along the constellation.
Figure 2.7.5 Rectangular constellation Diagram of 16QAM. Source adapted from: [17].
In last, one of the latest and most reliable modulations is the Orthogonal Frequency Divide
Multiplexing (OFDM). According to Fuqin, “Recently multicarrier modulations (MCM) are
getting more and more attention and are used in many applications because of their many
advantages. One obvious advantage is that transmitting N data symbols on N carriers
simultaneously reduces the symbol rate to one N-th of the original symbol rate of the serial data,
or increases the symbol duration by N times. Thus, the effect of inversible interference due to time
dispersion of the channel will be reduced and equalization in the receiver will be easier or even
unnecessary. The multiple carriers in MCM are called subcarriers. The frequency band occupied
by the signal carried by a subcarrier is called a sub-band. To separate the signals of sub-bands at
receiver, the earliest method, which is borrowed from ‘‘frequency division multiplexing (FDM),’’

16
is to space the subcarrier center frequencies far apart so that the spectra of N sub-bands are virtually
nonoverlapped, and N bandpass filters are used in the receiver to separate the sub-bands. This
method requires each bandpass filter to have a very sharp frequency response” [16]. Figure 2.7.6
shows the comparison of a single carrier of OFDM modulation and multiple carries of OFDM
modulation.
Figure 2.7.5 Frequency Spectrum of an OFDM signal. Source adapted from: [17].
In conclusion, there are different modulation techniques that are able to transmit data. Each
modulation has its advantages and disadvantages. Depending on the needs for the transmission a
modulation technique could fit best. OFDM modulation is one of the latest modulations. OFDM
can transmit several data. Also, OFDM modulation provides reliability to the user’s due to the
aggressive modulation. To finalize, basic and complex modulations are described in order to
provide knowledge and understand the process of transmission.

17
2.8 4G LTE
One of the latest technologies that proven to ensure a successful transmission is 4G LTE
technology. Cellular companies are the most common technology to transmit and receive data. 4G
LTE was the replacement of 3G technology and came with new features for the user’s including
flexibility and reliability. According to Dalhman and others, “The 4G LTE technology was from
the beginning developed for packet-data support and has no support for circuit-switched voice,
unlike the 3G where HSPA was an “add-on” to provide high-performance packet data on top of
an existing technology. Mobile broadband services were the focus, with tough requirements on
high data rates, low latency, and high capacity. Spectrum flexibility and maximum commonality
between FDD and TDD solutions were other important requirements” [18].
4G LTE was designed to unify the technologies developed by several companies. “One
significant aspect of LTE is the worldwide acceptance of a single technology, unlike previous
generations for which there has been several competing technologies” [18]. In addition, Figure
2.8.1 shows a path from early technologies developed by several companies merging to 4G LTE
and unify technologies in order to accelerate progress and also taking a path to the future 5G
technology [18].
Figure 2.8.1 History of wireless technology. Source: Adapted from [18]

18
4G LTE technology uses two frequencies in order to separate the uplink and the downlink
bands. Figure 2.8.2 shows how the uplink frequency band and downlink frequency band are
separated by a gap, also, Figure shows that 4G LTE is a full duplex communication.
Figure 2.8.2 Frequency Bands. Source adapted from: [19]
Furthermore, Rumney cites, “OFDM is the modulation scheme chosen for the LTE
downlink. It is a digital multicarrier scheme that uses a large number of closely spaced subcarriers
to carry data and control information. Each individual subcarrier is modulated at a low symbol rate
with a conventional modulation format such as QAM. The combination of the many low-rate
subcarriers provides overall data rates similar to conventional single-carrier modulations schemes
using the same bandwidth” [19]. In addition, “The high peak-to-average ratio (PAPR) associated
with OFDM led 3GPP to look for an alternative modulation scheme for the LTE uplink. SC-FDMA
was chosen since it combines the low PAPR techniques of single carrier transmission systems such
as GSM and CDMA with the multipath resistance and flexible frequency allocation of OFDMA”
[19].
In conclusion, 4G LTE is one of the latest technologies to be used by all companies. Legacy
systems are affected by this technology due to its modulation as mentioned in [3]. On the other
hand, 4G LTE could be used for a successful transmission. Legacy systems, such as, telemetry
could be converted in to IP networks and later be transmitted 4G LTE, since it is wireless IP
network. This technique will be also explored in order to achieve another possible solution.

19
Chapter 3: Methodology
In order to perform a deep analysis on Radio Frequency over Internet Protocols (RFoIP)
several experiment scenarios need to be designed. Testbed platform could be configured in many
ways delivering enough flexibility to perform a feasible testing. The testbed is composed of three
main devices, which are, SDR from NI called Universal Software Radio Peripheral, NI Reference
clock and the RT Logic Digitizer. Many parameters will vary for these three devices depending on
the testing set up. To qualify and quantify results there are other parameters that could interpret a
good or bad signal transmission, and likewise will explain and deliver knowledge of signal
transmission results.
3.1 Frequency Bands of Interest
The experiments focused on specific bands, which were the bands of interest. The
frequency bands of interest were the L-band, S-band, and C-band, and the experiment consisted in
comparing each case of the bands. Table 1 shows the frequency bands of interest.
Table 3.1.1 L-Band, S-Band and C-Band frequency bands of interest.
The interested bands for testing reliability are the L-band, S-band and C-band. Figure 3.1.1
shows L-band frequency allocation, Figure 3.1.2 shows the S-band, another band of interest for
the testbed experiments, and in addition, Figure 3.1.3 shows C-band the last frequency band of
interest.
Table 1. L-band, S-band, C-band frequency bands of interest
Band Frequency Range (MHz) Application
L Lower 1435 – 1525 Mobile and Telemetry
Upper 1710 – 1990 Telemetry: 1780 – 1850 MHz
S Lower 2200 – 2290 Telemetry
Upper 2360 – 2395 Telemetry
C Lower 4400 – 4940 Telemetry
Mid 5090 – 5150 Telemetry

20
Figure 3.1.1 L-band frequency allocation [4]
Figure 3.1.2 S-band frequency allocation [4]

21
Figure 3.3 C-band frequency allocation [4]
3.2 Numerical Parameters
In order to quantify the signal, there are several parameters that needed to be considered.
The testbed was set to have parameters in the USRP and the digitizer. There, were many parameters
defined in both devices. Some parameters were repeated in order to achieve a synchronization
between both testbed platforms.
Numerical Parameters for USRP’s:
• Antenna Gain
o G/t
• Bandwidth (BW) of the Transmitted Signal
• Center Frequency (fc)
• Data Rate
• BER or BLER (in LTE systems)
o Typically required to be ≤ 10−6

22
• I/Q Rate
• Modulation Scheme
• Noise Floor
o Calculated by a Spectrum Analyzer
• RX Power
o RX Sensitivity Level (detection threshold)
• SNR
• TX Power
Numerical Parameters for Digitizers:
• A/D Bits
• Center Frequency (fc)
• Destination IP
• Digitizer Utilization
• Gain Mode
o Automatic or Manual
o Current/Min Gain
• Max Packet size
• Min Delay
• Output Enabled
• Packet Protection
• Stream Bandwidth
• Stream Offset
• System Bandwidth (BW)
This Parameters are fixed.
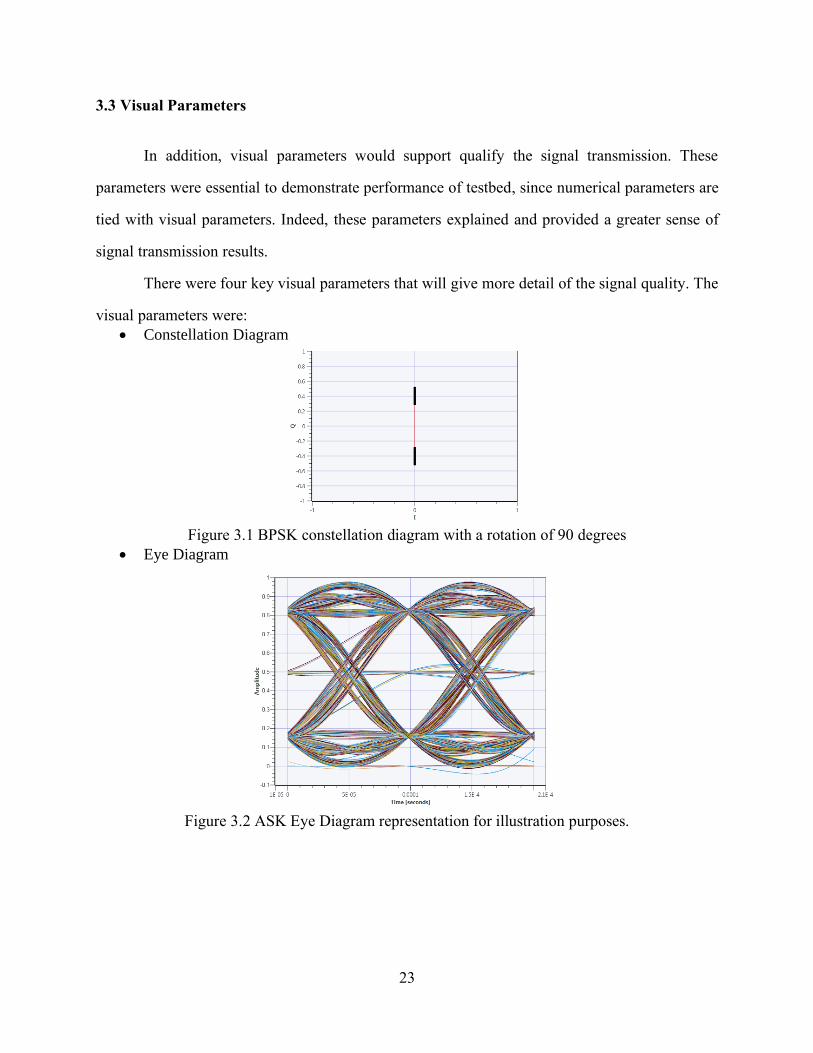
23
3.3 Visual Parameters
In addition, visual parameters would support qualify the signal transmission. These
parameters were essential to demonstrate performance of testbed, since numerical parameters are
tied with visual parameters. Indeed, these parameters explained and provided a greater sense of
signal transmission results.
There were four key visual parameters that will give more detail of the signal quality. The
visual parameters were:
• Constellation Diagram
Figure 3.1 BPSK constellation diagram with a rotation of 90 degrees
• Eye Diagram
Figure 3.2 ASK Eye Diagram representation for illustration purposes.

24
• Spectrum Graph (Display SNR)
Figure 3.3 Power Spectrum Density representation for illustration purposes.
Visual parameters qualify the signal transmission and can allow for classification of the
signal by observing visual contemplation of how the signal is performing. In addition, visual
parameters identify Power of signal, SNR and much more. Several parameters were used in order
to obtain a complete and thorough experiment for the testbed. To conclude, the testbed had many
different parameters which provides a more detailed analysis of the signal transmission.
Furthermore, signal should be classified by the experiment results, and help define rules or
procedures to follow for a better signal transmission.
3.4 Experiment Description
Experiments consisted of sending a signal directly from TX SDR to the RX SDR, which is
the ideal case of signal transmission. Now, compare this signal transmission to the following set
ups:
• SDR-SDR (ideal case)

25
• SDR TM-Digitizer-Digitizer-SDR TM (No clock)
• SDR TM -Digitizer-Digitizer-SDR TM (Clock)
• SDR LTE-Digitizer-Digitizer- SDR LTE (No Clock)
• SDR LTE-Digitizer-Digitizer- SDR LTE (Clock)
A signal is sent from TX SDR, converted from RF to IP by a digitizer, de-converted back
from IP to a RF signal by another digitizer, and finally received by the RX SDR. This signal
conversion and transmission could add some noise to the signal, by quantifying and qualifying this
signal through the use of numerical and visual parameters to determine and classify the
transmission. Figure 3.4.1 shows the testbed implementation of telemetry with clock connections.
Figure 3.4.2 shows the testbed implementation of LTE with clock connections. Illustration 1 shows
the physical layout of the testbed with SDRs for telemetry representation and digitizers. Illustration
2 shows the physical layout of the testbed with SDRs for LTE representation and digitizers for
LTE transmission including splitters/combiners. Illustration 3 shows the complete physical testbed
including telemetry SDRs, LTE SDRs, splitters/combiners and digitizers.
Figure 3.4.1 Telemetry testbed implementation.

26
Figure 3.4.2 LTE testbed implementation.
Illustration 1. Physical Telemetry Testbed design with front (left) and back (right:) views without
spectrum analyzer.

27
Illustration 2. Physical LTE Testbed design with digitizers and LTE SDR’s.
Illustration 3. Complete physiscal testebed including telemetry and LTE SDR’s. In addition,
Digitizers at bottom.

28
3.5 TESTBED ADJUSTMENT AND CALIBRATION
In order to calibrate the testbed, it is necessary to measure initial power sent by TX SDR
with a spectrum analyzer to quantify the real power sent. In addition, the power levels measured
by the RX SDR were compared. These measurements included the digitizer power level, since
parameters of power were also manipulated on these devices. Several scenarios of testing have to
be measured, such as Telemetry and LTE platforms being tested with and without Digitizers.
First, telemetry platform was measured with and without the 30dB attenuator, and also,
with and without two gain parameters. Figure 3.5.1 shows a TM signal with no attenuator and no
gain measured by FieldFox RF analyzer N9914A at 2 GHz with a channel power at -25.11dBm.
In addition, to measure the real effect of the 30 dB attenuator. Figure 3.5.2 shows a TM signal with
attenuator and no gain measured by FieldFox RF analyzer N9914A at 2GHZ with channel power
of -55.45 dBm. In conclusion, there is an accurate attenuation of 30 dB.
Figure 3.5.1 Telemetry signal measured by Fieldfox handheld RF Analyzer N9914A without
attenuator and no gain.

29
Figure 3.5.2 Telemetry signal measured by Fieldfox handheld RF Analyzer N9914A with
attenuator and no gain.
Nevertheless, to measure the real gain of the NI USRP 2920 in the telemetry platform.
Figure 3.5.3 shows a telemetry signal with no attenuator and a gain of 12 dB measured by the
FieldFox RF analyzer N9914A. Comparing Figure 3.5.1 measurement and Figure 3.5.3 there is a
real gain of 11.75 dB. Furthermore, Figure 3.5.4 shows a telemetry signal with attenuator and a
gain of 12 dB measured by the FieldFox RF analyzer N9914A. Comparing Figure 3.5.2
measurement with Figure 3.5.4 measurement there is a real gain of -11.72 dB. In conclusion there
is a real gain of 11.72-11.75 dB from the NI USRP 2920.

30
Figure 3.5.3 Telemetry signal measured by Fieldfox handheld RF Analyzer N9914A without
attenuator and 12dB gain.
Figure 3.5.4 Telemetry signal measured by Fieldfox handheld RF Analyzer N9914A with
attenuator and 12dB gain.

31
In second, LTE EnB signal will be measured by the FieldFox RF analyzer. LTE EnB could
work as a stand-alone signal, but LTE UE is a slave of LTE EnB it is necessary to mix the signals
through a splitter/combiner. Splitter/combiner will generate a loss in power. Splitter combiners is
a Mini-circuits ZNPD1-63HP-S. According to Mini-circuits datasheet in the frequency bands of
interest loss in dB ranges from 6.59 to 6.78 [20]. Table 2 shows the loss in dB corresponding to
each frequency range. It is necessary to measure the real loss through each stage of the signal
transmission [20].
Table 3.5. Typical performance data of splitter/combiner.
Moreover, Figure 3.5.5 shows an LTE EnB measurement with no attenuator and no
gain measured by the FieldFox RF analyzer N9914A with a channel power of -18.65 dBm. Figure
3.5.6 shows an LTE EnB measurement with no attenuator and 20dBm gain. FieldFox RF analyzer
N9914A shows a 0.01 dBm. Comparing the two Figures there is a difference of -18.66 dBm.
Frequency (MHz) Total loss (dB)
s-1 s-2 s-3 s-4
1500 6.59 6.59 6.57 6.58
2000 6.63 6.65 6.62 6.64
2500 6.77 6.83 6.77 6.78

32
Figure 3.5.5 LTE EnB signal measured by FieldFox RF analyzer N9914A without attenuator and
no gain
Figure 3.5.6 LTE EnB signal measured by FieldFox RF analyzer N9914A without attenuator and
20 dBm power.

33
In addition, Figure 3.5.7 shows an LTE EnB signal measured by FieldFox RF analyzer
N9914A with attenuator and no gain with a channel power of -49.30 dBm. Also, Figure 3.5.8
shows an LTE EnB signal measured by FieldFox RF analyzer N9914A with attenuator and 20
dBm power with channel power of -29.46 dBm. In comparison, Figures 3.5.7 and 3.5.8 show a
difference of -19.84 dBm.
Figure 3.5.7 LTE EnB signal measured by FieldFox RF analyzer N9914A with attenuator and no
gain.

34
Figure 3.5.8 LTE EnB signal measure by FieldFox RF analyzer N9914A with attenuator and 20
dBm power.
Nevertheless, Figure 3.5.9 shows an LTE EnB signal measured by FieldFox RF analyzer
N9914A with attenuator after the first splitter/combiner ZNPD1-63HP-S with no gain with a
channel power of -56.92 dBm. Figure 3.5.10 shows an LTE EnB signal measured by FieldFox RF
analyzer N9914A with attenuator after the first splitter/combiner ZNPD1-63HP-S with 20dBm
gain with a channel power of -37.64 dBm. Figure 3.5.10 shows a difference of -19.28 dBm over
Figure 3.5.9.

35
Figure 3.5.9 LTE EnB signal measure by FieldFox RF analyzer N9914A with attenuator after
first splitter/combiner ZNPD1-63HP-S and no gain.
Figure 3.5.10 LTE EnB signal measure by FieldFox RF analyzer N9914A with attenuator after
first splitter/combiner ZNPD1-63HP-S and 20 dBm power.

36
In last, Figure 3.5.11 shows an LTE EnB signal measured by FieldFox RF analyzer
N9914A with attenuator after the second splitter/combiner ZNPD1-63HP-S with no gain with a
channel power of -61.51 dBm. Figure 3.5.12 shows an LTE EnB signal measured by FieldFox RF
analyzer N9914A with attenuator after the second splitter/combiner ZNPD1-63HP-S with 20dBm
gain with a channel power of -43.32 dBm. Figure 3.5.11 shows a difference of -19.19 dBm over
Figure 3.5.12.
Figure 3.5.11 LTE EnB signal measure by FieldFox RF analyzer N9914A with attenuator after
second splitter/combiner ZNPD1-63HP-S and no gain.

37
Figure 3.5.12 LTE EnB signal measure by FieldFox RF analyzer N9914A with attenuator after
second splitter/combiner ZNPD1-63HP-S and 20 dBm power.
In conclusion, there is consistency on the loss of power of each component according to
the specifications. In addition, the real gain of the NI USRP 2954 is consistent with the
measurements performed by the FieldFox RF analyzer N9914A.
In fourth, LTE UE will be measured by the FieldFox RF analyzer repeating the same
process as the LTE EnB. LTE UE is a slave of the LTE EnB; therefore, LTE EnB needs to be
active in order to have a successful LTE UE transmission. LTE UE only be measured after the
second splitter/combiner since other scenarios in LTE EnB show a consistency in the
measurements previously performed by FieldFox RF analyzer N9914A. Figure 3.5.13 shows LTE
UE signal measured by FieldFox RF analyzer N9914A after second splitter/combiner with 20dBm
gain with a channel power of -52.61dBm. Figure 3.5.14 shows LTE UE signal measured by

38
FieldFox RF analyzer N9914A after second splitter/combiner with no gain with a channel power
of -65.24dBm.
Figure 3.5.13 LTE UE signal measured by FieldFox RF analyzer N9914A after second
splitter/combiner at 20dBm gain.
Figure 3.5.14 LTE UE signal measured by FieldFox RF analyzer N9914A after second
splitter/combiner with no gain.

39
In conclusion, LTE UE will need a gain of 20dBm in order to perform correctly. Another
approach will be to remove the 30 dB attenuator to perform an LTE UE signal transmission with
no gain at the TX.
In last, digitizers are included in each testbed setup, because there a gain manipulation by
the device that could vary some parameters at the qualification and quantification of the signal
transmission. Telemetry platform will be tested with no gain and a 12dB gain. Figure 3.5.15 shows
a telemetry signal after the attenuator and digitizer with no gain. Figure 3.5.16 shows a telemetry
signal after the attenuator and digitizer with 12 dB gain. Comparing Figure 3.5.15 and 3.5.16 we
see a difference of 11.91 dB.
Figure 3.5.15 Telemetry signal measured by Fieldfox handheld RF Analyzer N9914A with
attenuator after digitizer and no gain.

40
Figure 3.5.16 Telemetry signal measured by Fieldfox handheld RF Analyzer N9914A with
attenuator after digitizer and 12dB gain.
In addition, Figure 3.5.4 shows a channel power of -43.73 and Figure 3.5.16 shows a
channel power of -52.81. Digitizer adds 9.08 dB into the channel power. In conclusion, there is
some channel power loss during the digitizer transmission. Channel power loss could affect signal
transmission if the signal does not have enough gain to transmit.
Now, LTE EnB will be measured after the second splitter/combiner in order to compare
the last scenario of the LTE EnB. Figure 3.5.17 shows an LTE EnB with attenuator after the second
splitter/combiner with no gain. Figure 3.5.18 shows an LTE EnB with attenuator after the second
splitter/combiner with 20 dBm power.
Figure 3.5.17 shows a channel power of -65.66 dBm. LTE EnB could be able to transmit
but the SNR is minimum. On the other hand, Figure 3.5.18 20 dBm power is enough to have a
high SNR with a channel power of -54.99 dBm. In conclusion, digitizer represents a power loss in
LTE EnB signal. Figure 3.5.17 compared with Figure 3.5.11 shows a difference of -4.15 dBm.
Figure 3.5.12 and Figure 3.5.18 show a difference of -11.67 dBm.

41
Figure 3.5.17 LTE EnB signal measured by Fieldfox handheld RF Analyzer N9914A with
attenuator after digitizer and no gain.
Figure 3.5.18 LTE EnB signal measured by Fieldfox handheld RF Analyzer N9914A with
attenuator after digitizer and 20 dBm power.

42
In last, LTE UE will be measured after the digitizer, which is placed after the second
splitter/combiner, following the same procedure as the previous measurements. Figure 3.5.19
shows an LTE UE after digitizer at frequency 2GHz with no gain. Figure 3.5.20 shows an LTE
UE after digitizer at frequency 2 GHz with 20 dBm power.
Figure 3.5.19 LTE UE signal measured by Fieldfox handheld RF Analyzer N9914A with
attenuator after digitizer and no gain.

43
Figure 3.5.20 LTE UE signal measured by Fieldfox handheld RF Analyzer N9914A with
attenuator after digitizer and 20 dBm power.
In conclusion, LTE UE suffers some power loss due to digitizers. Figure 3.5.19 has a los
SNR and it is possible that signal transmission could not be performed as expected. Figure 3.5.20
shows enough SNR to perform a good signal transmission. Figure 3.5.19 compared to Figure
3.5.14 shows a difference of -0.83 dBm. On the contrary, Figure 3.5.20 compared to Figure 3.5.13
shows a difference of -7.78 dBm. To summarize, digitizer presents a power loss in the LTE UE
signal.

44
Chapter 4: Results
After several experiments the qualitative and quantitative parameters, such as, eye diagram,
constellation, power spectrum, throughput and more were collected. Also, the use of a reference
clock will be tested in each scenario to prove if it is necessary. In order, to compare the experiments
results, ideal cases have been tested first to set the baseline parameters.
4.1 BASELINE PARAMETERS
First, telemetry platform ideal cases are recorded with the following parameters.
• Carrier frequency: 1.8 GHz, 2 GHz and 2.2 GHz
• Modulation: QPSK, 8-PSK and OQPSK
• Gain: 12 dB
• Include a 30 dB attenuator
The generated figures show the quality of the testbed for the telemetry signal transmission. Figure
4.1.1 shows a telemetry QPSK signal at a frequency of 1.8 GHz and a gain of 12 dB. This includes
constellation diagram, power spectrum (SNR) and eye diagram.
Figure 4.1.1 telemetry QPSK signal, frequency 1.8 GHz, and gain 12dB. From left to right:
constellation diagram, power spectrum, and eye diagram.

45
Figure 4.1.2 shows a telemetry 8-PSK signal at a frequency of 1.8 GHz and gain of 12 dB.
This includes constellation diagram, power spectrum (SNR) and eye diagram.
Figure 4.1.2 telemetry 8-PSK signal, frequency 1.8 GHz and gain 12dB. From left to right:
constellation diagram, power spectrum and eye diagram.
Figure 4.1.3 shows a telemetry OQPSK signal at a frequency of 1.8 GHz and gain of 12
dB. This includes constellation diagram, power spectrum (SNR) and eye diagram.
Figure 4.1.3 telemetry OQPSK signal, frequency 1.8 GHz and gain 12dB. From left to right:
constellation diagram, power spectrum and eye diagram.

46
In conclusion, there is no change of qualitative results between frequencies. In addition, a
clean constellation diagram is displayed. Power spectrum has a high SNR and an open eye diagram
in each scenario. For more experiments including other frequencies please go to Appendix A.
Second, testbed LTE platform will include the following parameters:
• Carrier frequency: 1.8 GHz and 2.2 GHz
• Modulation Coding Scheme (MCS): QPSK, 16-QAM and 64-QAM (different
rates)
• TX power: 20dBm
• Include a 30 dB attenuator
For this experiment, the LTE EnB signal transmission is tested as a stand-alone without
traveling through the two splitter/combiner, reflecting no channel power loss that
splitter/combiners could cause. Figure 4.1.10 shows an EnB to UE signal transmission with an
MCS 0 QPSK MCS at a frequency of 1.8 GHz and 20 dBm power. This includes power spectrum
of the EnB TX and UE RX power spectrum. Also includes, PDSCH constellation, throughput and
data rate.
Figure 4.1.10 LTE EnB TX to LTE UE RX, frequency 1.8 GHz and 20 dBm power. From left to
right: EnB TX power spectrum, UE RX power spectrum, PDSCH constellation,
throughput and data rate.

47
Figure 4.1.11 shows an EnB to UE signal transmission with a MCS 12 16-QAM rate at a
frequency of 1.8 GHz and 20 dBm power. This includes power spectrum of the EnB TX and UE
RX power spectrum. Also, PDSCH constellation, throughput and data rate.
Figure 4.1.11 LTE EnB TX to LTE UE RX, frequency 1.8 GHz and 20 dBm power. From left to
right: EnB TX power spectrum, UE RX power spectrum, PDSCH constellation,
throughput and data rate.
Figure 4.1.12 shows an EnB to UE signal transmission with an MCS 17 64-QAM at a
frequency of 1.8 GHz and 20 dBm power. This includes power spectrum of the EnB TX and UE
RX power spectrum. Also, PDSCH constellation, throughput and data rate.

48
Figure 4.1.12 LTE EnB TX to LTE UE RX, frequency 1.8 GHz and 20 dBm power. From left to
right: EnB TX power spectrum, UE RX power spectrum, PDSCH constellation,
throughput and data rate.
Figure 4.1.13 shows an EnB to UE signal transmission with an MCS 28 64-QAM rate at a
frequency of 1.8 GHz and 20 dBm power. This includes power spectrum of the EnB TX and UE
RX power spectrum. Also, PDSCH constellation, throughput and data rate.
Figure 4.1.13 LTE EnB TX to LTE UE RX, frequency 1.8 GHz and 20 dBm power. From left to
right: EnB TX power spectrum, UE RX power spectrum, PDSCH constellation,
throughput and data rate.

49
In conclusion, there is no change in qualitative or quantitative result between carrier
frequencies and MCS. Also, we have a high SNR in both power spectrums, clean PDSCH
constellation, good throughput depending on the MCS and excellent data rate in each scenario.
Other frequencies experiments can be found in Appendix A.
Next, LTE UE TX experiment as an ideal case is presented in different frequency scenarios.
In addition, LTE UE is a dependent signal of LTE EnB, therefore, LTE EnB signal must be
transmitting to establish an LTE UE TX transmission. LTE EnB TX will remain with any of the
ideal cases in order for LTE UE TX to perform several experiments. Figure 4.1.18 shows LTE UE
TX and LTE EnB RX with an MCS 0 QPSK at a frequency 1.8GHz and 20 dBm power. This
includes power spectrum of the UE TX and EnB RX power spectrum. Also, Block Error Rate
(BLER), PUSCH Throughput and Reported Downlink (DL) BLER. Figure 4.1.19 shows LTE UE
TX and LTE EnB RX with an MCS 0 QPSK at a frequency 2.2 GHz and 20 dBm power. This
includes power spectrum of the UE TX and EnB RX power spectrum. Also includes, Block Error
Rate (BLER), PUSCH Throughput and Reported Downlink (DL) BLER.

50
Figure 4.1.18 LTE UE TX and LTE EnB RX, frequency 1.8 GHz and 20 dBm power. From left
to right: UE TX power spectrum, EnB RX power spectrum, BLER, PUSCH
Throughput and Reported DL BLER.
Figure 4.1.19 LTE UE TX and LTE EnB RX, frequency 2.2 GHz and 20 dBm power. From left
to right: UE TX power spectrum, EnB RX power spectrum, BLER, PUSCH
Throughput and Reported DL BLER.

51
In conclusion, there is no change in qualitative or quantitative parameters. Power spectrum
in LTE UE TX and LTE EnB RX show high SNR. BLER over time show zero errors and PUSCH
throughput is at 0.31 Mbps, which corresponded to the MCS 0 QPSK modulation. In addition, the
reported DL BLER is zero. To conclude, there is no difference in results from both frequencies.
4.2 TELEMETRY OVER IP
The first experiment scenario is TMoIP. TMoIP will be tested with and without a reference
clock, in order, to determine if a reference clock is necessary to perform a signal transmission
through IP. Several parameters will be adjusted to qualify the behavior of telemetry signals over
the network. Parameters to qualify telemetry signal transmission are constellation diagram, power
spectrum (SNR) and eye diagram. In addition, digitizers will perform in an automatic mode, if
necessary, digitizer parameters will be adjusted manually to ensure a good telemetry signal
transmission.
4.2.1 No clock
The first scenario experiment is to test without a reference clock. Testing TMoIP will
require to vary several parameters. Parameters to be adjusted are:
• Carrier frequency: 1.8 GHz, 2 GHz and 2.2 GHz
• Modulation: QPSK, 8-PSK and OQPSK
• Gain: 0 dB and 12 dB
• Include a 30 dB attenuator
In addition, digitizers will operate in an automatic mode. Important parameters to be
consider are the following:
• Stream Bandwidth: 2 MHz
• Center Frequency: frequency to be tested
• A/D bits: 12-bits
• System Bandwidth: 10 MHz (lowest)

52
• Gain mode: automatic
• Max Packet size: 1500 bytes
• Data source: network using a programmed buffer
• Attenuation: 0 dB
Figure 4.2.1.1 shows a QPSK telemetry signal at a frequency of 1.8 GHz and gain of 12
dB. This includes constellation diagram, power spectrum and eye diagram.
Figure 4.2.1.1 telemetry QPSK signal, frequency 1.8 GHz and gain 12dB. From left to right:
constellation diagram, power spectrum and eye diagram.
Figure 4.2.1.2 shows an 8-PSK telemetry signal at a frequency of 1.8 GHz and gain of 12
dB. This includes constellation diagram, power spectrum and eye diagram.
Figure 4.2.1.2 telemetry 8-PSK signal, frequency 1.8 GHz and gain 12dB. From left to right:
constellation diagram, power spectrum and eye diagram
Figure 4.2.1.3 shows an OQPSK telemetry signal at a frequency of 1.8GHz and gain of 12
dB. This includes constellation diagram, power spectrum and eye diagram.

53
Figure 4.2.1.3 telemetry OQPSK signal, frequency 1.8 GHz and gain 12dB. From left to right:
constellation diagram, power spectrum and eye diagram.
In conclusion, there was no change on qualitative parameters between frequencies or gain.
Compared to baseline parameters, there is a more jittery constellation diagram in all experiments.
In addition, the power spectrum has a 10 dB difference from baseline parameters and eye diagram
changes the aperture. More experiments in other frequencies are found in Appendix A.
4.2.2 Clock
The second scenario experiment is to test with a reference clock. Testing TMoIP will
require variation of several parameters. Parameters to be adjusted are:
• Carrier frequency: 1.8 GHz, 2 GHz and 2.2 GHz
• Modulation: QPSK, 8-PSK and OQPSK
• Gain: 12 dB
• Include a 30 dB attenuator
In addition, digitizers will operate in an automatic mode. Important parameters to consider
are the following:
• Stream Bandwidth: 2 MHz
• Center Frequency: frequency to be tested
• A/D bits: 12-bits
• System Bandwidth: 10 MHz (lowest)

54
• Gain mode: automatic
• Max Packet size: 1500 bytes
• Data source: network using a programmed delay1
• Attenuation or Serial Path Gain (SPG): 0 dB
Figure 4.2.2.1 shows a QPSK telemetry signal at frequency 1.8 GHz and 12 dB gain. This
includes constellation diagram, power spectrum and eye diagram.
Figure 4.2.2.1 telemetry QPSK signal, frequency 1.8 GHz and gain 12dB. From left to right:
constellation diagram, power spectrum and eye diagram.
Figure 4.2.2.2 shows an 8-PSK telemetry signal at frequency 1.8 GHz and 12 dB gain. This
includes constellation diagram, power spectrum and eye diagram.
Figure 4.2.2.2 telemetry 8-PSK signal, frequency 1.8 GHz and gain 12dB. From left to right:
constellation diagram, power spectrum and eye diagram.
1 Programmed delay is set to 10 milliseconds.

55
Figure 4.2.2.3 shows an OQPSK telemetry signal at frequency 1.8 GHz and 12 dB gain.
This includes constellation diagram, power spectrum and eye diagram.
Figure 4.2.2.3 telemetry OQPSK signal, frequency 1.8 GHz and gain 12dB. From left to right:
constellation diagram, power spectrum and eye diagram.
In conclusion, there is no change between frequencies in qualitative results, constellation
diagram is jittery and power spectrum shows a good SNR. Reference clock improved the aperture
of the eye diagram. More experiments in other frequencies are found in Appendix A.
4.3 LTE OVER IP
The next scenario is to test LTE platform over the digitizers. In order to test LTE over IP
there are several scenarios to be included. The following scenarios are:
• LTE EnB stand-alone
• LTE EnB through the system with LTE UE
• LTE UE
These three scenarios will vary different parameters in the LTE platform and digitizers in
order to acquire a successful transmission. Digitizer will be tested with and without reference clock
to realize if it is essential to be used. Inf necessary, digitizer parameters will be adjusted manually,
again, to acquire a good signal transmission.
4.3.1 No clock
First, experiments in LTE platform will be without the use of a reference clock. LTE
scenarios will be varying in the following parameters:

56
• Carrier frequency: 1.8 GHz and 2.2 GHz.
• Modulation Coding Scheme (MCS): QPSK, 16-QAM and 64-QAM.
• Power: 0 dBm and 20 dBm.
• Include a 30 dB attenuator.
Furthermore, digitizers are operating in automatic mode. Some parameters to consider for
the following scenarios are:
• Stream Bandwidth: 20 MHz
• Center Frequency: frequency to be tested
• A/D bits: 12-bits
• System Bandwidth: 22 MHz
• Gain mode: automatic
• Max Packet size: 1500 bytes
• Data source: network using a programmed delay2
• Attenuation or serial path gain (SPG): 0 dB
LTE EnB stand-alone
For these sets of experiments, LTE EnB will only be used as a stand-alone and without the
use of a reference clock. Also, there is no loss in the path due to the two splitter/combiners used in
the full system. Moreover, other parameters will be modified in order to describe the behavior of
the LTE EnB signal transmission in order to qualify and quantify this signal transmission. Figure
4.3.1.1 shows a MCS 0 QPSK LTE EnB signal at a frequency of 1.8 GHz with 0 dBm power. This
includes power spectrum of the LTE EnB TX and LTE UE RX power spectrum. Also, includes
PDSCH constellation, throughput and data rate.
2 Programmed delay is set to 10 milliseconds

57
Figure 4.3.1.1 LTE EnB TX to LTE UE RX, frequency 1.8 GHz and 0 dBm power. From left to
right: EnB TX power spectrum, UE RX power spectrum, PDSCH constellation,
throughput and data rate.
Figure 4.3.1.2 shows MCS 0 QPSK LTE EnB signal at a frequency of 1.8 GHz with 20
dBm power. This includes power spectrum of the EnB TX and UE RX power spectrum. Also,
includes PDSCH constellation, throughput and data rate.
Figure 4.3.1.2 LTE EnB TX to LTE UE RX, frequency 1.8 GHz and 20 dBm power. From left to
right: EnB TX power spectrum, UE RX power spectrum, PDSCH constellation,
throughput and data rate.

58
Figure 4.3.1.3 shows MCS 12 16QAM LTE EnB signal and frequency of 1.8 GHz with 0
dBm power. This includes power spectrum of the EnB TX and UE RX power spectrum. Also,
includes PDSCH constellation, throughput and data rate.
Figure 4.3.1.3 LTE EnB TX to LTE UE RX, frequency 1.8 GHz and no gain. From left to right:
EnB TX power spectrum, UE RX power spectrum, PDSCH constellation,
throughput and data rate.
Figure 4.3.1.4 shows MCS 12 16QAM LTE EnB signal and a frequency of 1.8 GHz with
20 dBm power. This includes power spectrum of the EnB TX and UE RX power spectrum. Also,
includes PDSCH constellation, throughput and data rate.
Figure 4.3.1.4 LTE EnB TX to LTE UE RX, frequency 1.8 GHz and 0 dBm power. From left to
right: EnB TX power spectrum, UE RX power spectrum, PDSCH constellation,
throughput and data rate.

59
Figure 4.3.1.5 shows MCS 17 64QAM LTE EnB signal and a frequency of 1.8 GHz with
0 dBm power. This includes power spectrum of the EnB TX and UE RX power spectrum. Also,
includes PDSCH constellation, throughput and data rate.
Figure 4.3.1.5 LTE EnB TX to LTE UE RX, frequency 1.8 GHz and 0 dBm power. From left to
right: EnB TX power spectrum, UE RX power spectrum, PDSCH constellation,
throughput and data rate.
Figure 4.3.1.6 shows MCS 17 64QAM LTE EnB signal at a frequency of 1.8 GHz with 20
dBm power. This includes power spectrum of the EnB TX and UE RX power spectrum. Also,
includes PDSCH constellation, throughput and data rate.
Figure 4.3.1.6 LTE EnB TX to LTE UE RX, frequency 1.8 GHz and 20 dBm power. From left to
right:: EnB TX power spectrum, UE RX power spectrum, PDSCH constellation,
throughput and data rate.

60
Figure 4.3.1.7 shows MCS 28 64QAM LTE EnB signal at a frequency of 1.8 GHz with 0
dBm power. This includes power spectrum of the EnB TX and UE RX power spectrum. Also,
includes PDSCH constellation, throughput and data rate.
Figure 4.3.1.7 LTE EnB TX to LTE UE RX, frequency 1.8 GHz and 0 dBm power. From left to
right: EnB TX power spectrum, UE RX power spectrum, PDSCH constellation,
throughput and data rate.
In last, Figure 4.3.1.8 shows MCS 28 64QAM LTE EnB signal at a frequency of 1.8 GHz
with 20 dBm power. This includes power spectrum of the EnB TX and UE RX power spectrum.
Also, includes PDSCH constellation, throughput and data rate.
Figure 4.3.1.8 LTE EnB TX to LTE UE RX, frequency 1.8 GHz and 20 dBm power. From left to
right:: EnB TX power spectrum, UE RX power spectrum, PDSCH constellation,
throughput and data rate.
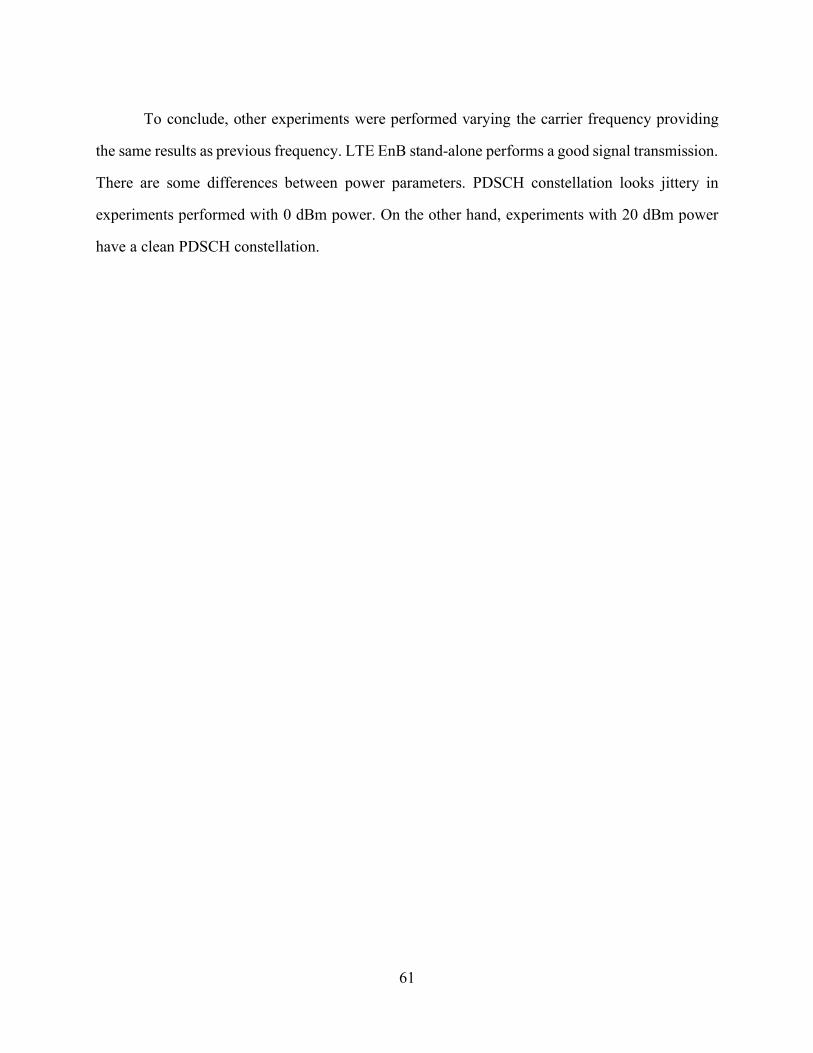
61
To conclude, other experiments were performed varying the carrier frequency providing
the same results as previous frequency. LTE EnB stand-alone performs a good signal transmission.
There are some differences between power parameters. PDSCH constellation looks jittery in
experiments performed with 0 dBm power. On the other hand, experiments with 20 dBm power
have a clean PDSCH constellation.

62
LTE EnB through the system with LTE UE
Next, experiments scenarios will be performed using full system. These experiments
involve signal transmission traveling through the attenuators, two splitter/combiner and digitizer.
In addition, experiments are performed without the use of a reference clock. LTE EnB TX is the
platform that is traveling through the digitizers. For this section LTE EnB TX and RX or Downlink
(DL) are qualified and quantify in the same platform. In addition, LTE UE TX and RX or Uplink
(UL) are qualified and quantified equal to LTE EnB. LTE UE will remain with same parameters
only varying power according to LTE DL.
Figure 4.3.1.9 shows LTE Downlink with MCS 0 QPSK at a frequency 1.8 GHz and 0
dBm power. This includes EnB TX power spectrum, EnB RX power spectrum, BLER, PUSCH
throughput and reported DL BLER. Figure 4.3.1.10 shows LTE Uplink with MCS 0 QPSK at a
frequency 2.2 GHz and 0 dBm power. This includes LTE UE TX power spectrum, UE RX power
spectrum, PDSCH constellation, throughput and data rate.
Figure 4.3.1.9 QPSK LTE DL at frequency 1.8 GHz and 0 dBm power. From left to right: EnB
TX power spectrum, EnB RX power spectrum, BLER, PUSCH throughput and
reported DL BLER.

63
Figure 4.3.1.10 QPSK LTE UL at frequency 2.2 GHz and 0 dBm power. From left to right: LTE
UE TX power spectrum, UE RX power spectrum, PDSCH constellation, throughput
and data rate.
Figure 4.3.1.11 shows LTE Downlink with MCS 0 QPSK at a frequency 1.8 GHz and 20
dBm power. This includes EnB TX power spectrum, EnB RX power spectrum, BLER, PUSCH
throughput and reported DL BLER. Figure 4.3.1.12 shows LTE Uplink with MCS 0 QPSK at a
frequency 2.2 GHz and 20 dBm power. This includes LTE UE TX power spectrum, UE RX power
spectrum, PDSCH constellation, throughput and data rate.
Figure 4.3.1.11 QPSK LTE DL at frequency 1.8 GHz and 20 dBm power. From left to right:
EnB TX power spectrum, EnB RX power spectrum, BLER, PUSCH throughput and
reported DL BLER.

64
Figure 4.3.1.12 QPSK LTE UL at frequency 2.2 GHz and 20 dBm power. From left to right:
LTE UE TX power spectrum, UE RX power spectrum, PDSCH constellation,
throughput and data rate.
Now LTE DL will increase to a more complex MCS. LTE UL will remain with the same
MCS. Figure 4.3.1.13 shows LTE Downlink with MCS 12 16QAM at a frequency 1.8 GHz and 0
dBm power. This includes EnB TX power spectrum, EnB RX power spectrum, BLER, PUSCH
throughput and reported DL BLER. Figure 4.3.1.14 shows LTE Uplink with MCS 0 QPSK at a
frequency 2.2 GHz and 0 dBm power. This includes LTE UE TX power spectrum, UE RX power
spectrum, PDSCH constellation, throughput and data rate.
Figure 4.3.1.13 16QAM LTE DL at frequency 1.8 GHz and 0 dBm power. From left to right:
EnB TX power spectrum, EnB RX power spectrum, BLER, PUSCH throughput and
reported DL BLER.

65
Figure 4.3.1.14 QPSK LTE UL at frequency 2.2 GHz and 0 dBm power. From left to right: LTE
UE TX power spectrum, UE RX power spectrum, PDSCH constellation, throughput
and data rate.
Figure 4.3.1.15 shows LTE Downlink with MCS 12 16QAM at a frequency 1.8 GHz and
20 dBm power. This includes EnB TX power spectrum, EnB RX power spectrum, BLER, PUSCH
throughput and reported DL BLER. Figure 4.3.1.16 shows LTE Uplink with MCS 0 QPSK at a
frequency 2.2 GHz and 20 dBm power. This includes LTE UE TX power spectrum, UE RX power
spectrum, PDSCH constellation, throughput and data rate.
Figure 4.3.1.15 16QAM LTE DL at frequency 1.8 GHz and 20 dBm power. From left to right:
EnB TX power spectrum, EnB RX power spectrum, BLER, PUSCH throughput and
reported DL BLER.

66
Figure 4.3.1.16 QPSK LTE UL at frequency 2.2 GHz and 20 dBm power. From left to right:
LTE UE TX power spectrum, UE RX power spectrum, PDSCH constellation,
throughput and data rate.
Figure 4.3.1.17 shows LTE Downlink with MCS 17 64QAM at a frequency 1.8 GHz and
0 dBm power. This includes EnB TX power spectrum, EnB RX power spectrum, BLER, PUSCH
throughput and reported DL BLER. Figure 4.3.1.18 shows LTE Uplink with MCS 0 QPSK at a
frequency 2.2 GHz and 0 dBm power. This includes LTE UE TX power spectrum, UE RX power
spectrum, PDSCH constellation, throughput and data rate.
Figure 4.3.1.17 64QAM LTE DL at frequency 1.8 GHz and 0 dBm power. From left to right:
EnB TX power spectrum, EnB RX power spectrum, BLER, PUSCH throughput and
reported DL BLER.

67
Figure 4.3.1.18 QPSK LTE UL at frequency 2.2 GHz and 0 dBm power. From left to right: LTE
UE TX power spectrum, UE RX power spectrum, PDSCH constellation, throughput
and data rate.
Figure 4.3.1.19 shows LTE Downlink with MCS 17 64QAM at a frequency 1.8 GHz and
20 dBm power. This includes EnB TX power spectrum, EnB RX power spectrum, BLER, PUSCH
throughput and reported DL BLER. Figure 4.3.1.20 shows LTE Uplink with MCS 0 QPSK at a
frequency 2.2 GHz and 20 dBm power. This includes LTE UE TX power spectrum, UE RX power
spectrum, PDSCH constellation, throughput and data rate.
Figure 4.3.1.19 64QAM LTE DL at frequency 1.8 GHz and 20 dBm power. From left to right:
EnB TX power spectrum, EnB RX power spectrum, BLER, PUSCH throughput and
reported DL BLER.

68
Figure 4.3.1.20 QPSK LTE UL at frequency 2.2 GHz and 20 dBm power. From left to right:
LTE UE TX power spectrum, UE RX power spectrum, PDSCH constellation,
throughput and data rate.
Figure 4.3.1.21 shows LTE Downlink with MCS 28 64QAM at a frequency 1.8 GHz and
0 dBm power. This includes EnB TX power spectrum, EnB RX power spectrum, BLER, PUSCH
throughput and reported DL BLER. Figure 4.3.1.22 shows LTE Uplink with MCS 0 QPSK at a
frequency 2.2 GHz and 0 dBm power. This includes LTE UE TX power spectrum, UE RX power
spectrum, PDSCH constellation, throughput and data rate.
Figure 4.3.1.21 64QAM LTE DL at frequency 1.8 GHz and 0 dBm power. From left to right:
EnB TX power spectrum, EnB RX power spectrum, BLER, PUSCH throughput and
reported DL BLER.

69
Figure 4.3.1.22 QPSK LTE UL at frequency 2.2 GHz and 0 dBm power. From left to right: LTE
UE TX power spectrum, UE RX power spectrum, PDSCH constellation, throughput
and data rate.
Figure 4.3.1.23 shows LTE Downlink with MCS 28 64QAM at a frequency 1.8 GHz and
20 dBm power. This includes EnB TX power spectrum, EnB RX power spectrum, BLER, PUSCH
throughput and reported DL BLER. Figure 4.3.1.24 shows LTE Uplink with MCS 0 QPSK at a
frequency 2.2 GHz and 20 dBm power. This includes LTE UE TX power spectrum, UE RX power
spectrum, PDSCH constellation, throughput and data rate.
Figure 4.3.1.23 64QAM LTE DL at frequency 1.8 GHz and 20 dBm power. From left to right:
EnB TX power spectrum, EnB RX power spectrum, BLER, PUSCH throughput and
reported DL BLER.
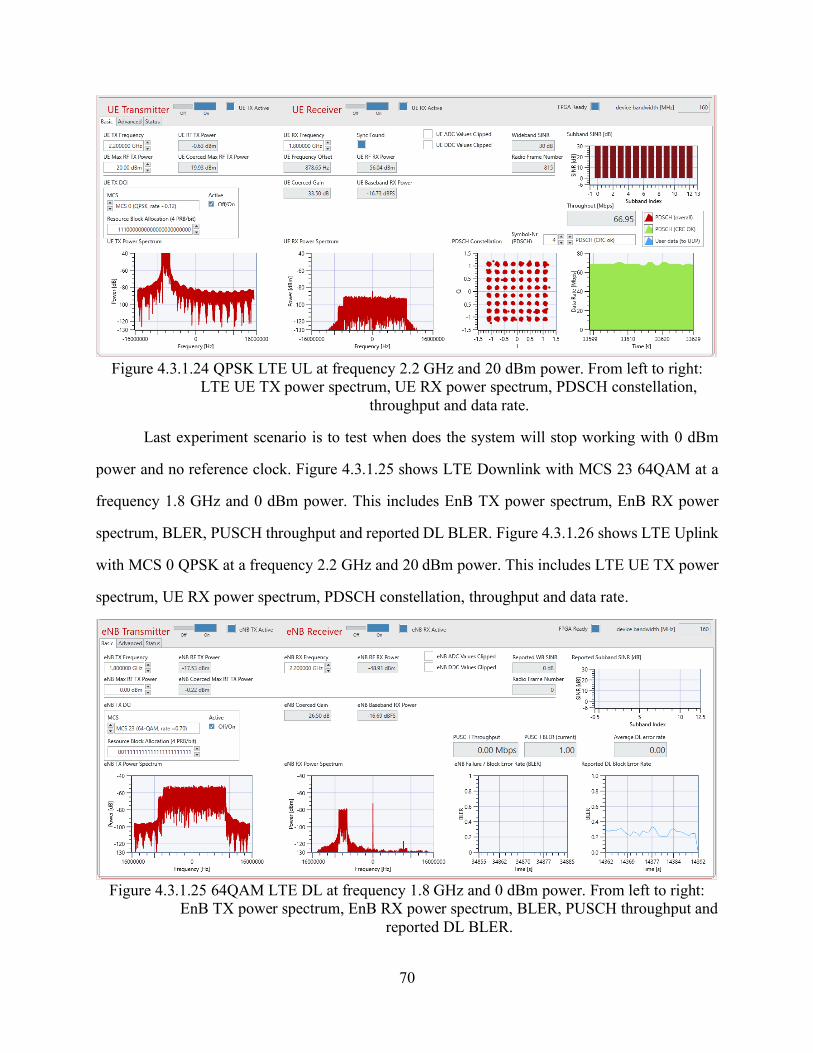
70
Figure 4.3.1.24 QPSK LTE UL at frequency 2.2 GHz and 20 dBm power. From left to right:
LTE UE TX power spectrum, UE RX power spectrum, PDSCH constellation,
throughput and data rate.
Last experiment scenario is to test when does the system will stop working with 0 dBm
power and no reference clock. Figure 4.3.1.25 shows LTE Downlink with MCS 23 64QAM at a
frequency 1.8 GHz and 0 dBm power. This includes EnB TX power spectrum, EnB RX power
spectrum, BLER, PUSCH throughput and reported DL BLER. Figure 4.3.1.26 shows LTE Uplink
with MCS 0 QPSK at a frequency 2.2 GHz and 20 dBm power. This includes LTE UE TX power
spectrum, UE RX power spectrum, PDSCH constellation, throughput and data rate.
Figure 4.3.1.25 64QAM LTE DL at frequency 1.8 GHz and 0 dBm power. From left to right:
EnB TX power spectrum, EnB RX power spectrum, BLER, PUSCH throughput and
reported DL BLER.

71
Figure 4.3.1.26 QPSK LTE UL at frequency 2.2 GHz and 20 dBm power. From left to right:
LTE UE TX power spectrum, UE RX power spectrum, PDSCH constellation,
throughput and data rate.
To conclude, other carrier frequencies delivered same results as frequency 1.8 GHz.
Additionally, power improves the quality of the signal specially in higher MCS’s. Also,
experiments performed with 0 dBm power had a jittery PDSCH constellation. Highest MCS 28
64QAM will require 20 dBm in order to perform a signal transmission. Furthermore, LTE EnB
system stops working at MCS 23 64QAM. LTE EnB TX through entire system requires a good
power in order to be transmitted through digitizers. LTE EnB RX maintained a low BLER at zero,
regardless of gain modifications. All experiments were performed without the use of a reference
clock.
LTE UE
Lastly, LTE UL will be digitized in order to qualify and quantify signal transmission. LTE
DL will now be fixed at a certain MCS. Following experiments will be performed without the use
of a reference clock. Frequency and power parameters will vary in order to describe behavior of
signal transmission under different scenarios.

72
Figure 4.3.1.27 shows LTE Downlink with MCS 17 64QAM at a frequency 1.8 GHz and
20 dBm power. This includes EnB TX power spectrum, EnB RX power spectrum, BLER, PUSCH
throughput and reported DL BLER. Figure 4.3.1.28 shows LTE Uplink with MCS 0 QPSK at a
frequency 2.2 GHz and 0 dBm power. This includes LTE UE TX power spectrum, UE RX power
spectrum, PDSCH constellation, throughput and data rate.
Figure 4.3.1.27 64QAM LTE DL at frequency 1.8 GHz and 20 dBm power. From left to right:
EnB TX power spectrum, EnB RX power spectrum, BLER, PUSCH throughput and
reported DL BLER.
Figure 4.3.1.28 QPSK LTE UL at frequency 2.2 GHz and 0 dBm power. From left to right: LTE
UE TX power spectrum, UE RX power spectrum, PDSCH constellation, throughput
and data rate.

73
Figure 4.3.1.29 shows LTE Downlink with MCS 17 64QAM at a frequency 1.8 GHz and
20 dBm power. This includes EnB TX power spectrum, EnB RX power spectrum, BLER, PUSCH
throughput and reported DL BLER Figure 4.3.1.30 shows LTE Uplink with MCS 0 QPSK at a
frequency 2.2 GHz and 20 dBm power. This includes LTE UE TX power spectrum, UE RX power
spectrum, PDSCH constellation, throughput and data rate.
Figure 4.3.1.29 64QAM LTE DL at frequency 1.8 GHz and 20 dBm power. From left to right:
EnB TX power spectrum, EnB RX power spectrum, BLER, PUSCH throughput and
reported DL BLER.
Figure 4.3.1.30 QPSK LTE UL at frequency 2.2 GHz and 20 dBm power. From left to right:
LTE UE TX power spectrum, UE RX power spectrum, PDSCH constellation,
throughput and data rate.

74
Several adjustments in the LTE platform were made, such as frequency, power, MCS and
others with no success to transmit. In addition, digitizers were adjusted manually with no success
also. This is due to a synchronization problem. Since, there is no reference clock in these
experiments, program buffer will not deliver the correct delay. To summarize LTE UE needs a
reference clock in order to be transmitted over IP networks.
4.3.2 Clock
Next, experiments in LTE platform will be with the use of a reference clock. LTE scenarios
will be varying the following parameters:
• Carrier frequency: 1.8 GHz and 2.2 GHz.
• Modulation Coding Scheme (MCS): QPSK, 16-QAM and 64-QAM.
• TX Power: 0 dBm and 20 dBm.
• Include a 30 dB attenuator.
Furthermore, digitizers are operating in automatic mode. Some parameters to consider for
the following scenarios are:
• Stream Bandwidth: 20 MHz
• Center Frequency: frequency to be tested
• A/D bits: 12-bits
• System Bandwidth: 22 MHz
• Gain mode: Automatic
• Max Packet size: 1500 bytes
• Data source: network using a programmed delay3
• Attenuation or serial path gain (SPG): 0 dB
3 Programmed delay is set to 10 milliseconds

75
LTE EnB stand-alone
First experiment is to test LTE EnB stand-alone with a reference clock. Figure 4.3.2.1
shows MCS 0 QPSK LTE EnB signal at a frequency of 1.8 GHz with 0 dBm power. This includes
power spectrum of the EnB TX and UE RX power spectrum. Also, includes PDSCH constellation,
throughput and data rate.
Figure 4.3.2.1 LTE EnB TX to LTE UE RX, frequency 1.8 GHz and 0 dBm power. From left to
right: EnB TX power spectrum, UE RX power spectrum, PDSCH constellation,
throughput and data rate.
Figure 4.3.2.2 shows MCS 0 QPSK LTE EnB signal at a frequency of 1.8 GHz with 20
dBm power. This includes power spectrum of the EnB TX and UE RX power spectrum. Also,
includes PDSCH constellation, throughput and data rate.

76
Figure 4.3.2.2 LTE EnB TX to LTE UE RX, frequency 1.8 GHz and 20 dBm power. From left to
right: EnB TX power spectrum, UE RX power spectrum, PDSCH constellation,
throughput and data rate.
Figure 4.3.2.3 shows MCS 12 16QAM LTE EnB signal and a frequency of 1.8 GHz with
0 dBm power. This includes power spectrum of the EnB TX and UE RX power spectrum. Also,
includes PDSCH constellation, throughput and data rate.
Figure 4.3.2.3 LTE EnB TX to LTE UE RX, frequency 1.8 GHz and 0 dBm power. From left to
right: EnB TX power spectrum, UE RX power spectrum, PDSCH constellation,
throughput and data rate.

77
Figure 4.3.2.4 shows MCS 12 16QAM LTE EnB signal and a frequency of 1.8 GHz with
20dBm gain. This includes power spectrum of the EnB TX and UE RX power spectrum. Also,
includes PDSCH constellation, throughput and data rate.
Figure 4.3.2.4 LTE EnB TX to LTE UE RX, frequency 1.8 GHz and 20 dBm power. From left to
right: EnB TX power spectrum, UE RX power spectrum, PDSCH constellation,
throughput and data rate.
Figure 4.3.2.5 shows MCS 17 64QAM LTE EnB signal and a frequency of 1.8 GHz with
0 dBm power. This includes power spectrum of the EnB TX and UE RX power spectrum. Also,
includes PDSCH constellation, throughput and data rate.
Figure 4.3.2.5 LTE EnB TX to LTE UE RX, frequency 1.8 GHz and 0 dBm power. From left to
right: EnB TX power spectrum, UE RX power spectrum, PDSCH constellation,
throughput and data rate.

78
Figure 4.3.2.6 shows MCS 17 64QAM LTE EnB signal and a frequency of 1.8 GHz with
20 dBm power. This includes power spectrum of the EnB TX and UE RX power spectrum. Also,
includes PDSCH constellation, throughput and data rate.
Figure 4.3.2.6 LTE EnB TX to LTE UE RX, frequency 1.8 GHz and 20 dBm power. From left to
right: EnB TX power spectrum, UE RX power spectrum, PDSCH constellation,
throughput and data rate.
Figure 4.3.2.7 shows MCS 28 64QAM LTE EnB signal and a frequency of 1.8 GHz with
0 dBm power. This includes power spectrum of the EnB TX and UE RX power spectrum. Also,
includes PDSCH constellation, throughput and data rate.
Figure 4.3.2.7 LTE EnB TX to LTE UE RX, frequency 1.8 GHz and 0 dBm power. From left to
right: EnB TX power spectrum, UE RX power spectrum, PDSCH constellation,
throughput and data rate.

79
Figure 4.3.2.8 shows MCS 28 64QAM LTE EnB signal and a frequency of 1.8 GHz with
20 dBm power. This includes power spectrum of the EnB TX and UE RX power spectrum. Also,
includes PDSCH constellation, throughput and data rate.
Figure 4.3.2.8 LTE EnB TX to LTE UE RX, frequency 1.8 GHz and 0 dBm power. From left to
right: EnB TX power spectrum, UE RX power spectrum, PDSCH constellation,
throughput and data rate.
In conclusion, LTE EnB as a stand-alone will perform a good signal transmission. There
was no difference on qualitative or quantitate measurements between carrier frequencies. In
addition, there is some jittery in PDSCH constellation that occurred with the adjustment of the
power parameter in each pair of experiments performed.
LTE EnB through the system with LTE UE
Moreover, experiments scenarios will be performed using full system. These experiments
involve signal transmission traveling through the attenuators, two splitter/combiner and digitizer.
In addition, experiments are performed with the use of a reference clock. LTE EnB TX is the
platform that is traveling through the digitizers. For this section LTE EnB TX and RX or Downlink
(DL) are qualified and quantify in the same platform. In addition, LTE UE TX and RX or Uplink
(UL) are qualified and quantified equal to LTE EnB. LTE UE will remain with same parameters
only varying gain according to LTE DL.

80
Figure 4.3.2.9 shows LTE Downlink with MCS 0 QPSK at a frequency 1.8 GHz and 0
dBm power. This includes EnB TX power spectrum, EnB RX power spectrum, BLER, PUSCH
throughput and reported DL BLER. Figure 4.3.2.10 shows LTE Uplink with MCS 0 QPSK at a
frequency 2.2 GHz and 0 dBm power. This includes LTE UE TX power spectrum, UE RX power
spectrum, PDSCH constellation, throughput and data rate.
Figure 4.3.2.9 QPSK LTE DL at frequency 1.8 GHz and 0 dBm power. From left to right: EnB
TX power spectrum, EnB RX power spectrum, BLER, PUSCH throughput and
reported DL BLER.
Figure 4.3.2.10 QPSK LTE UL at frequency 2.2 GHz and 0 dBm power. From left to right: LTE
UE TX power spectrum, UE RX power spectrum, PDSCH constellation, throughput
and data rate.

81
Figure 4.3.2.11 shows LTE Downlink with MCS 0 QPSK at a frequency 1.8 GHz and 20
dBm power. This includes EnB TX power spectrum, EnB RX power spectrum, BLER, PUSCH
throughput and reported DL BLER. Figure 4.3.2.12 shows LTE Uplink with MCS 0 QPSK at a
frequency 2.2 GHz and 20 dBm power. This includes LTE UE TX power spectrum, UE RX power
spectrum, PDSCH constellation, throughput and data rate.
Figure 4.3.2.11 QPSK LTE DL at frequency 1.8 GHz and 20 dBm power. From left to right:
EnB TX power spectrum, EnB RX power spectrum, BLER, PUSCH throughput and
reported DL BLER.
Figure 4.3.2.12 QPSK LTE UL at frequency 2.2 GHz and 20 dBm power. From left to right:
LTE UE TX power spectrum, UE RX power spectrum, PDSCH constellation,
throughput and data rate.

82
Now LTE DL will increase to a more complex MCS. LTE UL will remain with the same
MCS. Figure 4.3.2.13 shows LTE Downlink with MCS 12 16QAM at a frequency 1.8 GHz and 0
dBm power. This includes EnB TX power spectrum, EnB RX power spectrum, BLER, PUSCH
throughput and reported DL BLER. Figure 4.3.2.14 shows LTE Uplink with MCS 0 QPSK at a
frequency 2.2 GHz and 0 dBm power. This includes LTE UE TX power spectrum, UE RX power
spectrum, PDSCH constellation, throughput and data rate.
Figure 4.3.2.13 16QAM LTE DL at frequency 1.8 GHz and 0 dBm power. From left to right:
EnB TX power spectrum, EnB RX power spectrum, BLER, PUSCH throughput and
reported DL BLER.
Figure 4.3.2.14 QPSK LTE UL at frequency 2.2 GHz and 0 dBm power. From left to right: LTE
UE TX power spectrum, UE RX power spectrum, PDSCH constellation, throughput
and data rate.

83
Figure 4.3.2.15 shows LTE Downlink with MCS 12 16QAM at a frequency 1.8 GHz and
20 dBm power. This includes EnB TX power spectrum, EnB RX power spectrum, BLER, PUSCH
throughput and reported DL BLER. Figure 4.3.2.16 shows LTE Uplink with MCS 0 QPSK at a
frequency 2.2 GHz and 20 dBm power. This includes LTE UE TX power spectrum, UE RX power
spectrum, PDSCH constellation, throughput and data rate.
Figure 4.3.2.15 16QAM LTE DL at frequency 1.8 GHz and 20 dBm power. From left to right:
EnB TX power spectrum, EnB RX power spectrum, BLER, PUSCH throughput and
reported DL BLER.
Figure 4.3.2.16 QPSK LTE UL at frequency 2.2 GHz and 20 dBm power. From left to right:
LTE UE TX power spectrum, UE RX power spectrum, PDSCH constellation,
throughput and data rate.

84
Figure 4.3.2.17 shows LTE Downlink with MCS 17 64QAM at a frequency 1.8 GHz and
0 dBm power. This includes EnB TX power spectrum, EnB RX power spectrum, BLER, PUSCH
throughput and reported DL BLER. Figure 4.3.2.18 shows LTE Uplink with MCS 0 QPSK at a
frequency 2.2 GHz and 0 dBm power. This includes LTE UE TX power spectrum, UE RX power
spectrum, PDSCH constellation, throughput and data rate.
Figure 4.3.2.17 64QAM LTE DL at frequency 1.8 GHz and 0 dBm power. From left to right:
EnB TX power spectrum, EnB RX power spectrum, BLER, PUSCH throughput and
reported DL BLER.
Figure 4.3.2.18 QPSK LTE UL at frequency 2.2 GHz and 0 dBm power. From left to right: LTE
UE TX power spectrum, UE RX power spectrum, PDSCH constellation, throughput
and data rate.

85
Figure 4.3.2.19 shows LTE Downlink with MCS 17 64QAM at a frequency 1.8 GHz and
20 dBm power. This includes EnB TX power spectrum, EnB RX power spectrum, BLER, PUSCH
throughput and reported DL BLER. Figure 4.3.2.20 shows LTE Uplink with MCS 0 QPSK at a
frequency 2.2 GHz and 20 dBm power. This includes LTE UE TX power spectrum, UE RX power
spectrum, PDSCH constellation, throughput and data rate.
Figure 4.3.2.19 64QAM LTE DL at frequency 1.8 GHz and 20 dBm power. From left to right:
EnB TX power spectrum, EnB RX power spectrum, BLER, PUSCH throughput and
reported DL BLER.
Figure 4.3.2.20 QPSK LTE UL at frequency 2.2 GHz and 20 dBm power. From left to right:
LTE UE TX power spectrum, UE RX power spectrum, PDSCH constellation,
throughput and data rate.

86
Figure 4.3.2.21 shows LTE Downlink with MCS 28 64QAM at a frequency 1.8 GHz and
0 dBm power. This includes EnB TX power spectrum, EnB RX power spectrum, BLER, PUSCH
throughput and reported DL BLER. Figure 4.3.2.22 shows LTE Uplink with MCS 0 QPSK at a
frequency 2.2 GHz and 0 dBm power. This includes LTE UE TX power spectrum, UE RX power
spectrum, PDSCH constellation, throughput and data rate.
Figure 4.3.2.21 64QAM LTE DL at frequency 1.8 GHz and 0 dBm power. From left to right:
EnB TX power spectrum, EnB RX power spectrum, BLER, PUSCH throughput and
reported DL BLER.
Figure 4.3.2.22 QPSK LTE UL at frequency 2.2 GHz and 0 dBm power. From left to right: LTE
UE TX power spectrum, UE RX power spectrum, PDSCH constellation, throughput
and data rate.

87
Figure 4.3.2.23 shows LTE Downlink with MCS 28 64QAM at a frequency 1.8 GHz and
20 dBm power. This includes EnB TX power spectrum, EnB RX power spectrum, BLER, PUSCH
throughput and reported DL BLER. Figure 4.3.2.24 shows LTE Uplink with MCS 0 QPSK at a
frequency 2.2 GHz and 20 dBm power. This includes LTE UE TX power spectrum, UE RX power
spectrum, PDSCH constellation, throughput and data rate.
Figure 4.3.2.23 64QAM LTE DL at frequency 1.8 GHz and 20 dBm power. From left to right:
EnB TX power spectrum, EnB RX power spectrum, BLER, PUSCH throughput and
reported DL BLER.
Figure 4.3.2.24 QPSK LTE UL at frequency 2.2 GHz and 20 dBm power. From left to right:
LTE UE TX power spectrum, UE RX power spectrum, PDSCH constellation,
throughput and data rate.

88
Last experiment scenario is to test when does the system will stop working with 0 dBm
power and no reference clock. Figure 4.3.1.25 shows LTE Downlink with MCS 24 64QAM at a
frequency 1.8 GHz and 0 dBm power. This includes EnB TX power spectrum, EnB RX power
spectrum, BLER, PUSCH throughput and reported DL BLER. Figure 4.3.1.26 shows LTE Uplink
with MCS 0 QPSK at a frequency 2.2 GHz and 20 dBm power. This includes LTE UE TX power
spectrum, UE RX power spectrum, PDSCH constellation, throughput and data rate.
Figure 4.3.2.25 64QAM LTE DL at frequency 1.8 GHz and 0 dBm power. From left to right:
EnB TX power spectrum, EnB RX power spectrum, BLER, PUSCH throughput and
reported DL BLER
Figure 4.3.2.26 QPSK LTE UL at frequency 2.2 GHz and 20 dBm power. From left to right:
LTE UE TX power spectrum, UE RX power spectrum, PDSCH constellation,
throughput and data rate.

89
To conclude, other carrier frequencies delivered same results as frequency 1.8 GHz.
Additionally, power improves the quality of the signal specially in higher MCS’s. Also,
experiments performed with 0 dBm power had a jittery PDSCH constellation. Highest MCS 28
64QAM will require 20 dBm in order to perform a signal transmission. Furthermore, LTE EnB
system stops working at MCS 24 64QAM. LTE EnB TX through entire system requires a good
power in order to be transmitted through digitizers. LTE EnB RX maintained a low BLER at zero,
regardless of gain modifications. All experiments were performed with the use of a reference clock.
LTE UE
Lastly, LTE UL will be digitized in order to qualify and quantify signal transmission. LTE
DL will now be fixed at a certain MCS. Following experiments will be performed with the use of
a reference clock. Frequency and gain parameters will vary in order to describe behavior of signal
transmission under different scenarios.
Figure 4.3.2.27 shows LTE Downlink with MCS 17 64QAM at a frequency 1.8 GHz and
20 dBm power. This includes EnB TX power spectrum, EnB RX power spectrum, BLER, PUSCH
throughput and reported DL BLER. Figure 4.3.2.28 shows LTE Uplink with MCS 0 QPSK at a
frequency 2.2 GHz and 0 dBm power. This includes LTE UE TX power spectrum, UE RX power
spectrum, PDSCH constellation, throughput and data rate.
Figure 4.3.2.27 64QAM LTE DL at frequency 1.8 GHz and 20 dBm power. From left to right:
EnB TX power spectrum, EnB RX power spectrum, BLER, PUSCH throughput and
reported DL BLER.

90
Figure 4.3.2.28 QPSK LTE UL at frequency 2.2 GHz and 0 dBm power. From left to right: LTE
UE TX power spectrum, UE RX power spectrum, PDSCH constellation, throughput
and data rate.
Figure 4.3.2.29 shows LTE Downlink with MCS 17 64QAM at a frequency 1.8 GHz and
20 dBm power. This includes EnB TX power spectrum, EnB RX power spectrum, BLER, PUSCH
throughput and reported DL BLER Figure 4.3.1.30 shows LTE Uplink with MCS 0 QPSK at a
frequency 2.2 GHz and 20 dBm power. This includes LTE UE TX power spectrum, UE RX power
spectrum, PDSCH constellation, throughput and data rate.
Figure 4.3.2.29 64QAM LTE DL at frequency 1.8 GHz and 20 dBm power. From left to right:
EnB TX power spectrum, EnB RX power spectrum, BLER, PUSCH throughput and
reported DL BLER.

91
Figure 4.3.2.30 QPSK LTE UL at frequency 2.2 GHz and 20 dBm power. From left to right:
LTE UE TX power spectrum, UE RX power spectrum, PDSCH constellation,
throughput and data rate.
Figure 4.3.2.31 shows LTE Downlink with MCS 17 64QAM at a frequency 1.8 GHz and
20 dBm power. This includes EnB TX power spectrum, EnB RX power spectrum, BLER, PUSCH
throughput and reported DL BLER. Figure 4.3.2.32 shows LTE Uplink with MCS 9 QPSK at a
frequency 2.2 GHz and 0 dBm power. This includes LTE UE TX power spectrum, UE RX power
spectrum, PDSCH constellation, throughput and data rate.
Figure 4.3.2.31 64QAM LTE DL at frequency 1.8 GHz and 20 dBm power. From left to right:
EnB TX power spectrum, EnB RX power spectrum, BLER, PUSCH throughput and
reported DL BLER.

92
Figure 4.3.2.32 QPSK LTE UL at frequency 2.2 GHz and 0 dBm power. From left to right: LTE
UE TX power spectrum, UE RX power spectrum, PDSCH constellation, throughput
and data rate.
Figure 4.3.2.33 shows LTE Downlink with MCS 17 64QAM at a frequency 1.8 GHz and
20 dBm power. This includes EnB TX power spectrum, EnB RX power spectrum, BLER, PUSCH
throughput and reported DL BLER. Figure 4.3.2.34 shows LTE Uplink with MCS 9 QPSK at a
frequency 2.2 GHz and 20 dBm power. This includes LTE UE TX power spectrum, UE RX power
spectrum, PDSCH constellation, throughput and data rate.
Figure 4.3.2.33 64QAM LTE DL at frequency 1.8 GHz and 20 dBm power. From left to right:
EnB TX power spectrum, EnB RX power spectrum, BLER, PUSCH throughput and
reported DL BLER.

93
Figure 4.3.2.34 QPSK LTE UL at frequency 2.2 GHz and 20 dBm power. From left to right:
LTE UE TX power spectrum, UE RX power spectrum, PDSCH constellation,
throughput and data rate.
In conclusion, other carrier frequencies were tested delivering same results as frequency
1.8 GHz. LTE UE performs a good signal transmission regardless of gain. Highest MCS tested
was MCS 9 QPSK. To conclude, LTE UE must have a reference clock in order to perform a good
signal transmission.
4.4 APPLICATION SCENARIOS
Last section of experiment scenarios is to test how good a digitizer could work under
particular conditions and parameters. Special scenarios will vary parameters in the LTE platform
and on the digitizer. Each scenario will have unique conditions to ensure digitizers can work under
the specifications denoted.
First scenario will test the capabilities of digitizers to transmit an LTE EnB signal with a
power of -60 dBm. According to digitizer specifications RF input ranges from -60dBm to 0dBm.
For this scenario LTE EnB is used as a stand-alone signal. In order to calibrate channel power to
the desired real power, it must be measured by FieldFox RF analyzer N9914A before transmission
can be tested. Calibration purposes included the addition of two 30dB attenuators at the LTE EnB

94
TX and a power of 20 dBm in the LTE platform. Figure 4.4.1 shows measurement of channel
power of LTE EnB at 2.2 GHz.
Figure 4.4.1 LTE EnB signal measured by FieldFox RF analyzer N9914A calibrated to -60dBm.
Furthermore, following experiment scenarios are to achieve signal transmission according
to specifications. In addition, if signal transmission is achieved, determine the highest MCS that
could be transmitted with the lowest gain. LTE EnB parameters are set to the following:
• Carrier frequency: 2.2 GHz.
• Modulation Coding Scheme (MCS): QPSK, 16-QAM and 64-QAM (different
rates).
• TX power: 20 dBm.
• Include two 30 dB attenuators.
• Reference clock required.

95
Furthermore, digitizers are operating in automatic mode. Some parameters to consider for
the following scenarios are:
• Stream Bandwidth: 20 MHz
• Center Frequency: 2.2 GHz
• A/D bits: 12-bits
• System Bandwidth: 22 MHz
• Gain mode: Automatic
• Max Packet size: 1500 bytes
• Data source: network using a programmed delay4
• Attenuation or serial path gain (SPG): 0 dB
Figure 4.4.2 shows LTE EnB stand-alone platform with MCS 0 QPSK, frequency 2.2 GHz
and real power of -60 dBm.
Figure 4.4.2 LTE EnB TX to LTE UE RX, frequency 2.2 GHz. From left to right: EnB TX
power spectrum, UE RX power spectrum, PDSCH constellation, throughput and
data rate.
4 Programmed delay is set to 10 milliseconds

96
Next, Figure 4.4.3 shows LTE EnB stand-alone platform with MCS 12 16QAM, frequency
2.2 GHz and real power of -60 dBm.
Figure 4.4.3 LTE EnB TX to LTE UE RX, frequency 2.2 GHz. From left to right: EnB TX
power spectrum, UE RX power spectrum, PDSCH constellation, throughput and
data rate.
Moreover, Figure 4.4.4 shows the highest modulation to be achieved by a real power of -
60 dBm. Figure 4.4.4 shows LTE EnB stand-alone platform with MCS 27 64QAM, frequency 2.2
GHz and real gain of -60 dBm.
Figure 4.4.4 LTE EnB TX to LTE UE RX, frequency 2.2 GHz. From left to right: EnB TX
power spectrum, UE RX power spectrum, PDSCH constellation, throughput and
data rate.

97
In last, Figure 4.4.5 shows an LTE EnB stand-alone platform with MCS 28 64QAM,
frequency 2.2 GHz and real power of -60 dBm. This last scenario is a failed scenario for the
digitizer RF input condition.
Figure 4.4.5 LTE EnB TX to LTE UE RX, frequency 2.2 GHz. From left to right: EnB TX
power spectrum, UE RX power spectrum, PDSCH constellation, throughput and
data rate.
In conclusion, first application scenario tests the capability of the RF input to be transmitted
at a channel power of -60 dBm. Digitizer is able to transmit up to MCS 27 64QAM showing a
throughput of 59.26 Mbps. Digitizers are limited to transmit MCS 28 64QAM showing a
throughput of .41 Mbps.
Second application scenario is to test the limits to send an LTE EnB signal with the least
amount of A/D bits. LTE EnB stand-alone system will be used for this application scenario. This
application scenario could be applied if there are some network constraints. The parameters for
LTE EnB are the ideal, while digitizers will vary parameters to the lowest conditions. LTE EnB
parameters are:
• Carrier frequency: 2.2 GHz.
• Modulation Coding Scheme (MCS): QPSK, 16-QAM and 64-QAM.
• TX Power: 20 dBm.
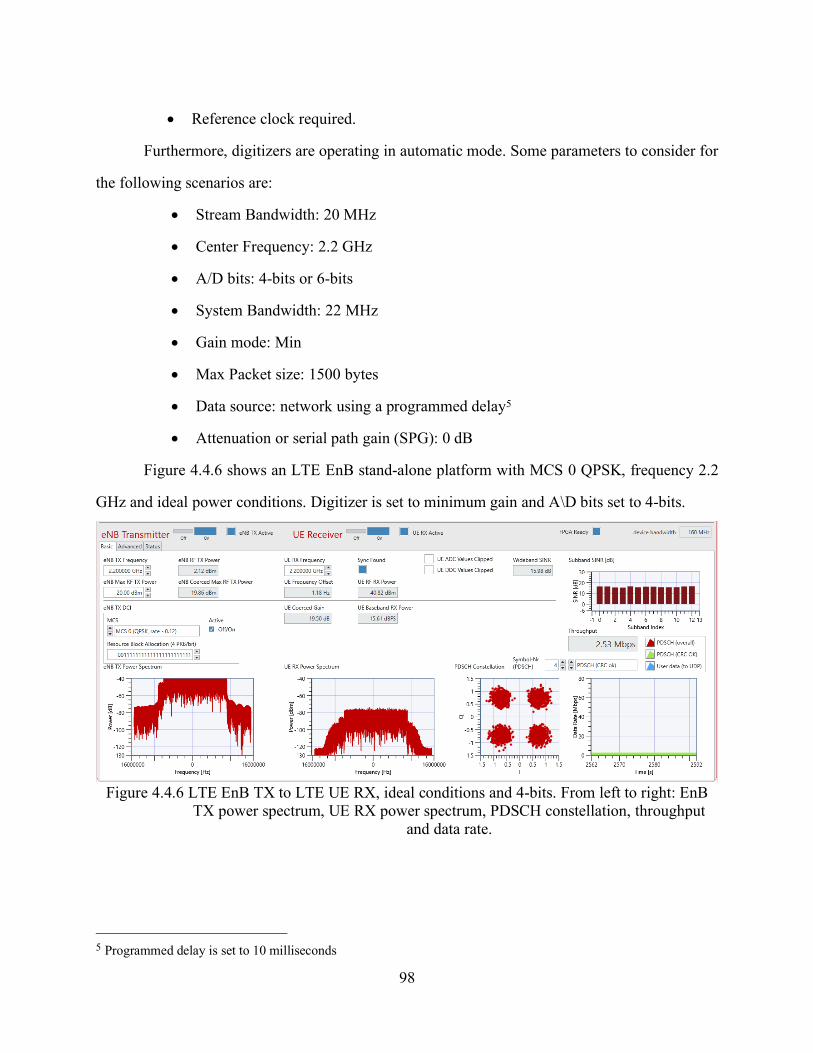
98
• Reference clock required.
Furthermore, digitizers are operating in automatic mode. Some parameters to consider for
the following scenarios are:
• Stream Bandwidth: 20 MHz
• Center Frequency: 2.2 GHz
• A/D bits: 4-bits or 6-bits
• System Bandwidth: 22 MHz
• Gain mode: Min
• Max Packet size: 1500 bytes
• Data source: network using a programmed delay5
• Attenuation or serial path gain (SPG): 0 dB
Figure 4.4.6 shows an LTE EnB stand-alone platform with MCS 0 QPSK, frequency 2.2
GHz and ideal power conditions. Digitizer is set to minimum gain and A\D bits set to 4-bits.
Figure 4.4.6 LTE EnB TX to LTE UE RX, ideal conditions and 4-bits. From left to right: EnB
TX power spectrum, UE RX power spectrum, PDSCH constellation, throughput
and data rate.
5 Programmed delay is set to 10 milliseconds

99
Figure 4.4.7 shows an LTE EnB stand-alone platform with MCS 12 16QAM, frequency
2.2 GHz and ideal power conditions. Digitizer is set to minimum gain and A\D bits set to 4-bits.
Figure 4.4.7 LTE EnB TX to LTE UE RX, ideal conditions and 4-bits. From left to right: EnB
TX power spectrum, UE RX power spectrum, PDSCH constellation, throughput
and data rate.
Figure 4.4.8 shows an LTE EnB stand-alone platform with MCS 22 64QAM, frequency
2.2 GHz and ideal power conditions. Digitizer is set to minimum gain and A\D bits set to 4-bits.
Figure 4.4.8 LTE EnB TX to LTE UE RX, ideal conditions and 4-bits. From left to right: EnB
TX power spectrum, UE RX power spectrum, PDSCH constellation, throughput
and data rate.

100
Figure 4.4.9 shows an LTE EnB stand-alone platform with MCS 23 64QAM, frequency
2.2 GHz and ideal power conditions. Digitizer is set to minimum gain and A\D bits set to 4-bits.
This experiment scenario is a failed test, throughput decreases to at least half.
Figure 4.4.9 LTE EnB TX to LTE UE RX, ideal conditions and 4-bits. From left to right: EnB
TX power spectrum, UE RX power spectrum, PDSCH constellation, throughput
and data rate.
In last, to transmit the highest modulation with the lowest conditions of digitizers is
required to set A\D to 6-bits. Figure 4.4.10 shows an LTE EnB stand-alone platform with MCS 28
64QAM, frequency 2.2 GHz and ideal gain conditions.
Figure 4.4.10 LTE EnB TX to LTE UE RX, ideal conditions and 6-bits. From left to right: EnB
TX power spectrum, UE RX power spectrum, PDSCH constellation, throughput
and data rate.

101
In conclusion, digitizers could operate using the minimum gain. Highest modulation to
transmit with A\D 4-bits is MCS 22 64QAM. In addition, the minimum required to transmit MCS
28 64QAM is A\D 6-bits.
Next application scenario is to send both signals through the digitizer. Digitizer will be
connected in the middle of each splitter/combiner. Also, frequency is modified to be adjacent to
each other following recommendations of Interference analysis and mitigation of telemetry and
4G LTE systems in adjacent spectrum bands [3]. This application scenario will require the use of
the full duplex LTE system. Moreover, LTE parameters are the following:
• Carrier frequency: 1.8 GHz and 1.82 GHz.
• Modulation Coding Scheme (MCS): QPSK and 64-QAM.
• TX power: 20 dBm.
• Reference clock required.
Furthermore, digitizers are operating in automatic mode. Some parameters to consider for
the following scenarios are:
• Stream Bandwidth: 40 MHz
• Center Frequency: 1.81 GHz
• A/D bits: 10-bits (Max due to digitizer physical constraints)
• System Bandwidth: 54 MHz
• Gain mode: Automatic
• Max Packet size: 1500 bytes
• Data source: network using a programmed delay6
• Attenuation or serial path gain (SPG): 0 dB
LTE platform and digitizers will be using full capabilities in order to perform the highest
MCS possible for the system. Digitizers will be transmitting both signals combined by the first
splitter/combiner and delivered to both systems by second splitter/combiner.
6 Programmed delay is set to 10 milliseconds

102
Figure 4.4.11 shows LTE Downlink with MCS 28 64QAM at frequency 1.8 GHz and 20
dBm power. This includes EnB TX power spectrum, EnB RX power spectrum, BLER, PUSCH
throughput and reported DL BLER. Figure 4.4.12 shows LTE Uplink with MCS 9 QPSK at a
frequency 1.82 GHz and 20 dBm power. This includes LTE UE TX power spectrum, UE RX
power spectrum, PDSCH constellation, throughput and data rate.
Figure 4.4.11 64QAM LTE DL at frequency 1.8 GHz and 20 dBm power. From left to right:
EnB TX power spectrum, EnB RX power spectrum, BLER, PUSCH throughput and
reported DL BLER.
Figure 4.4.12 QPSK LTE UL frequency 1.82 GHz and 20 dBm power. From left to right: LTE
UE TX power spectrum, UE RX power spectrum, PDSCH constellation, throughput
and data rate.

103
In conclusion, digitizers are capable to transmit a full duplex LTE system in Downlink and
Uplink. Digitizers were used in full capability according to specifications. Also, LTE system
platform had ideal case scenarios in order to transmit this application scenario.
Last application scenario is to test a video transmission through the digitizers using the
LTE system platform. This scenario is a real application to be able to send a video transmission
through the signal transmission established. In order to perform a transmission, VLC media
program is needed to send and play the video.
Figure 4.4.13 shows the LTE DL with a fragment of video been played. LTE DL at a
frequency of 1.8 GHz, power of 20 dBm and MCS 17 64QAM. Figure 4.4.14 shows LTE UL with
a fragment of video been played. Also, there is some changes in the data-rate graph showing user
data been utilized. Frequency is 2.2GHz, power of 20dBm and MCS 0.
Figure 4.4.13 LTE DL with video reproduction.

104
Figure 4.4.14 LTE UL with video reproduction.
In conclusion, digitizer is able to send a video through the LTE system. This last application
scenario performs a real signal transmission. To conclude, digitizers perform as the specifications
are proven.

105
Chapter 5: Analysis and Conclusions
Final section includes analysis on experiments of TMoIP and LTE over IP transmission.
Certain behaviors and recommendations in order to perform a good signal transmission with
different adjustment of parameters and observation. All scenarios will be compared to the baseline
parameters to perform a qualitative and quantitative analysis. Due to digitizer physical constraints
and specifications C-band was not able to be tested.
TMoIP
In first, TMoIP is tested with and without a reference clock. Behavior of signal
transmission description is provided in the following sections. In order to achieve a good signal
transmission. Experiments scenarios were focused on the L-band and S-band for TM bands given.
This section will qualify signal transmission with three main visual parameters. Constellation
graph, Power spectrum (SNR) and Eye diagram.
TMoIP signal transmission changed certain parameters. In addition, adjusted parameters
are in the telemetry platform. Digitizers were set to automatic in the following scenarios. Telemetry
parameters adjusted are the following:
• Carrier frequency: 1.8GHz, 2.0 GHz and 2.2 GHz.
• Gain: 0 dB and 12 dB.
• Modulation: QPSK, 8-PSK and OQPSK
• Reference clock
In first, frequency presented equal results between carrier frequencies. In addition, gain
presented same results. Moreover, modulation scheme presented several changes. Next, each
scenario will be compared to baseline parameters. Furthermore, the use of a reference clock is not
essential for telemetry transmission. Both, experiment scenarios presented equal qualitative
results.

106
QPSK
QPSK modulation presented a small jittery constellation graph compared to baseline
parameters. Eye diagram aperture was reduced by 10%. To summarize, QPSK modulation was
transmitted delivering some qualitative differences, but a proper signal transmission.
8-PSK
8-PSK modulation presented jittery in constellation graph. Power spectrum suffers no
change compared to baseline parameters. On the contrary, eye diagram suffers a decrease in
apertures. Main aperture is reduced by 33%, a considerable loss.
OQPSK
OQPSK modulation presents high jittery in the constellation diagram. OQPSK signal
transmitted over IP is not able to show difference in each symbol concentration. Eye diagram
presents a reduced in aperture.
In conclusion, lower modulation schemes show a proper signal transmission. High order
modulation schemes present jittery constellations and a considerable reduced in eye diagram
aperture. Further analysis could be performed in order to quantify the signal transmission.
LTE OVER IP
In second LTE over IP had several scenarios to test. In addition, LTE over IP was tested
with and without the use of a reference clock. Experiments scenarios are focused on the L-band
and S-band. For qualification and quantification purposes there are several parameters to describe
the behavior of the signal.
LTE over IP tested several scenarios for EnB and UE. Following scenarios are:
• LTE EnB stand-alone
• LTE EnB through the system with LTE UE
• LTE UE

107
Nevertheless, other parameters are adjusted in order to describe the signal behavior.
Digitizer parameters will remain to be set in automatic. LTE platform parameters to be adjusted
are:
• Carrier frequency: 1.8 GHz and 2.2 GHz.
• Modulation Coding Scheme (MCS): QPSK, 16-QAM and 64-QAM.
• TX power: 0 dBm and 20 dBm.
• Reference clock
Frequency is a parameter that show consistent results across the multiple frequencies. Gain
presented some changes on signal behavior on the different scenarios. The use of a reference clock
is essential in some scenarios. Experiment results are compared to the baseline parameters.
LTE EnB stand-alone
First scenario, is LTE EnB stand-alone with and without a reference clock. There was
consistency in results across parameters. LTE over IP as stand- alone performs a good signal
transmission. MCS variation performs equally compared to baseline parameters with or without
reference clock. Quantitative results show no changed compared to the baseline parameters.
Qualitative measurements show only some jittery in PDSCH constellation due to gain adjustment
in each pair of experiments.
In conclusion, LTE EnB as a stand-alone will perform a good signal transmission. There
was no difference in the use of the reference clock for this matter of experiment scenarios.
LTE EnB through the system
Second scenario, is to test LTE DL through the system using the splitter/combiners. LTE
DL and LTE UL is used as a full duplex communication. LTE DL will be sent through IP networks
while LTE UL will remain as a regular RF transmission. After several experiment scenarios there
are many channel power losses through the attenuators and the splitter/combiners.

108
First set of experiments are without the use of a reference clock. There was no difference
in results across frequencies, delivering equal results. Gain parameter is a factor through due to
channel power losses. 0 dBm power parameters show a jittery PDSCH constellation. On the
contrary, 20 dBm power perform a good signal transmission and clean PDSCH constellation. In
last, highest MCS 28 64QAM requires a 20 dBm power in order to be transmitted.
Second set of experiments are performed with the use of a reference clock. Second set of
experiments demonstrate the same results as previous results. Showing consistency of results
across multiple frequencies. Again, 0 dBm power experiment results present a jittery PDSCH
constellation. Highest MCS 28 64QAM will require 20 dBm in order to perform a signal
transmission. Furthermore, LTE eNB through the system stop working with 0 dBm power and
different MCS with and without the use of a reference clock. Without the use of a reference clock
and 0 dBm power highest MCS achieved is MCS 22 64QAM. On the other hand, with the use of
a reference clock highest MCS achieved is MCS 23 64QAM.
In last, both scenarios LTE EnB RX maintained a low BLER at zero, regardless of gain
modifications. Meaning that LTE UL worked across the entire sets of experiment scenarios.
LTE UE
Lastly, LTE UL platform will be sent over to IP. Since, LTE UL is a slave of the LTE DL,
LTE DL must remain active. LTE DL remained with a fixed MCS, gain and frequency. Moreover,
experiment scenarios will be performed with and without the use of a reference clock.
First experiment scenarios were performed without the use of a reference clock. After
several adjustments in LTE UL with no success of transmission. In addition, several adjustments
in the digitizers were performed with no success. This is due to a synchronization problem between
the LTE DL and the LTE UL.
Second experiments scenarios were performed with the use of a reference clock. To
conclude, other carrier frequencies were tested delivering equal results. Highest MCS tested was

109
MCS 9. To summarize LTE UL must have a reference clock in order to perform a signal
transmission through the digitizers.
Application Scenarios
In last, application scenarios are focused on particular cases that could be presented. These
application scenarios will vary parameters in LTE platform and digitizer to accomplish the desired
environment for signal transmission. Each scenario will have unique conditions to ensure digitizers
can perform a signal transmission as denoted in the specifications.
First scenario is to perform a signal transmission with a channel power of -60 dBm.
Parameters included a calibration through FieldFox RF analyzer N9914A. Along with, digitizer
automatic parameters. In conclusion, digitizer is able to transmit up to MCS 27 64QAM showing
a throughput of 59.26 Mbps highest MCS to be transmitted. Digitizers are limited to transmit MCS
28 64QAM showing a throughput of .41 Mbps
Second scenario is to perform signal transmission with the lowest digitizer conditions.
Second application scenario is tested due to ethernet constraints. LTE platform had ideal
conditions, while digitizer had lowest conditions. In conclusion, digitizers could operate using the
minimum gain. Highest modulation to transmit with A\D 4-bits is MCS 22 64QAM. In addition,
the minimum required to transmit MCS 28 64QAM is A\D 6-bits.
Third scenario is to perform both signal transmission through the digitizer. Third scenario
demonstrates the capability of digitizers to send enough bandwidth. In conclusion, digitizers are
capable to transmit a full duplex LTE system with highest modulations in Downlink and Uplink.
Digitizers were used in full capability according to specifications.
Last scenario is to perform a video transmission in LTE platform through the digitizers.
Last scenario, demonstrates a real application that could be given to the digitizers. Besides, this
application scenario proves that digitizer perform as expected with specifications denoted.

110
To conclude, table 5.1 shows recommendations for each type of transmission. Table
includes, signal type and configurations for both SDR’s and digitizers. In addition, some
parameters are required, recommended and the minimum required.
Table 5.1 Recommended configurations for successful transmission
SDR
Configurations Digitizer Configurations
Transmissio
n Type Signal Type Modulation
Gain or
Power
level
System
BW
Stream
BW
RF
Inpu
t min
A\D
bits
Min Gain mode
Reference
clock
TM QPSK
12 dB recommended 10 MHz 2 MHz
-60 dBm 4-bits Automatic No
TM OQPSK
12 dB recommended 10 MHz 2 MHz
-60 dBm 4-bits Automatic No
TM 8-PSK
12 dB recommended 10 MHz 2 MHz
-60 dBm 4-bits Automatic Yes
LTE EnB
stand-alone LTE EnB
MCS 1 -MCS 28
0 dBm minimum 22 MHz
20 MHz
-60 dBm 4-bits Automatic No
LTE EnB
Through the
system LTE EnB
MCS 1 - MCS 23
0 dBm minimum 22 MHz
20 MHz
-60 dBm 4-bits Automatic No
LTE EnB MCS 24 0 dBm minimum 22 MHz
20 MHz
-60 dBm 4-bits Automatic Yes
LTE EnB MCS 27 0 dBm minimum 22 MHz
20 MHz
-60 dBm 4-bits Automatic Yes
LTE EnB MCS 28
20 dBm
required 22 MHz
20
MHz
-60
dBm 6 -bits Automatic Yes
LTE UE LTE UE MCS 1 0 dBm 22 MHz 20 MHz
-60 dBm 12-bits Automatic Yes
LTE UE MCS 9 0 dBm 22 MHz 20 MHz
-60 dBm 12-bits Automatic Yes
Application
scenarios
Full duplex
LTE EnB
MCS 1 -
MCS 9
20 dBm
required 54 MHz
40
MHz
-60
dBm 10-bits Automatic Yes
Full duplex
LTE UE
MCS 1- MCS 28
20 dBm required 54 MHz
40 MHz
-60 dBm 10-bits Automatic Yes
Video
stream UE MCS 9 20 dBm required 22 MHz
20 MHz
-60 dBm 12-bits Automatic Yes
Video
stream EnB MCS 17
20 dBm
required 22 MHz
20
MHz
-60
dBm 12-bits Automatic Yes

111
Chapter 6: Final conclusions and Future work.
This section will summarize rules and recommendations for each scenario. In addition,
main points that should be consider according to each scenario are denoted as follow.
TMOIP
• Lower modulation schemes are properly transmitted.
• Qualitative parameters show better results with lower modulation schemes.
• Gain was not a parameter to affect the signal transmission.
• Carrier frequency was not a parameter to affect signal transmission.
• The use of a reference clock is not essential for telemetry transmission.
o Has small impact with lower data-rate tested at 500k symbols/second.
• High order modulation schemes present jittery constellations and noticeable
reduced in eye diagram aperture. Recommend to have a clock in those schemes
LTE OVER IP
LTE EnB stand-alone
• LTE EnB will perform a good signal transmission.
• LTE EnB performed good signal transmission without the use of a reference clock.
• Gain is not a parameter to consider due to small channel power loss.
• Frequency was not a parameter to affect the signal transmission.
LTE EnB through the system
• LTE EnB will perform a good signal transmission.
• LTE EnB performed good signal transmission with and without the use of a
reference clock with certain constraints.
o No clock MCS 23 64QAM and 0 dBm.
o Clock MCS 24 64QAM and 0 dBm.
• Gain is a parameter to be consider due multiple channel power losses.

112
o Ensure that the input power to the digitizer satisfy the minimum level of -
60dBm.
• 0 dBm TX power in SDR scenarios show a jittery PDSCH constellation
• Highest MCS 28 64 QAM will require 20 dBm in order to perform a signal
transmission.
• Carrier frequency was not a parameter to affect the signal transmission.
o Within digitizer limits (2.5GHz).
LTE UE
• Carrier frequency was not a parameter to affect the signal transmission.
• Reference power tested at 0 dBm is not a parameter to be consider.
o LTE UE will automatically set to LTE EnB control.
• The use of a reference clock is essential to perform a signal transmission.
• Highest MCS to be transmitted was MCS 9 QPSK.
APPLICATION SCENARIOS
Lowest RF input power
• Digitizer is able to transmit up to MCS 27 64QAM showing a throughput of 59.26
Mbps highest MCS to be transmitted.
• Digitizers are limited to transmit MCS 28 64QAM showing a throughput of .41
Mbps
• MCS 27 is supported, MCS 28 is not supported.
Lowest digitizer conditions
• Highest modulation to transmit with A\D 4-bits is MCS 22 64QAM.
• The minimum required to transmit MCS 28 64QAM is A\D 6-bits.

113
Full Duplex LTE system transmitted
• Digitizer is able to transmit full duplex LTE system.
• Requires a stream bandwidth of 40 MHz
• System bandwidth must be 54 MHz
• Digitizers are capable to transmit a full duplex LTE system.
Video transmission
• Demonstrates a real application.
• Video is able to be transmitted.
• Performance specifications are proven.
• Digitizers are capable to transmit an LTE video Downlink direction.
Future work
Future work will be to perform further analysis in TMoIP. Not only to qualify the
parameters, but also, quantify parameters. For example, Bit-error-rate (BER) or other parameters
to quantify errors during signal transmission.
Second, digitizer physical constraints are not able to test higher frequencies, such as, C-
band. Analysis on C-band could be performed with another digitizer that fit the necessity.
Third, these results are based only on RT logic digitizer. There are other companies with
several variation of digitizers. Future work could include the comparison to other digitizers.
The 5G concept is now been deployed into different parts of the world. As frequency
spectrum is getting crowded the necessity of other alternatives is urgent. Future work could include
5G technology over IP networks.

114
References
[1] J. C. Sandoval, E. M. M and V. Gonzalez, "Testing Reliability and flexibility of Digitizers
adapting the RF/IF signals over IP applications using a testbed Platform," El Paso, 2019.
[2] Federal Communications Commission (FCC), "Advanced Wireless Services (AWS),"
2017. [Online]. Available: https://www.fcc.gov/general/advanced-wireless-services-aws.
[3] J. F. Gonzalez, "Interference Analysis and Mitigation of Telemetry (TM) and 4G Long-
Term Evolution (LTE) Systems in Adjacent Spectrum Bands," ProQuest, El Paso, 2018.
[4] National Telecommunications and Information Administration, "United States Frequency
Allocations," 2016. [Online]. Available: https://www.ntia.doc.gov/page/2011/united-states-
frequency-allocation-chart.
[5] D. Barculo and J. Daniels, Telemetry : Research, Technology and Applications, New York:
Nova Science Publisher, 2009.
[6] R. L. Bernard, "Telemetry Intelligence (TELINT)," Smithsonian Air and Space Museum,
2016.
[7] C. A. Balanis, Antenna Theory Analysis and Design, New Jersey: John Wiley & Sons, Inc.,
2016.
[8] S. Forum, "SDRF Cognitive Radio Definitions," 8 November 2007. [Online]. Available:
http://www.sdrforum.org/pages/documentLibrary/documents/SDRF-06-R-0011-
V1_0_0.pdf. [Accessed 29 October 2020].
[9] M. Dillinger, K. Madani and N. Alonistioti, Software Defined Radio: Architecthures,
Systems and Functions, Chichester: John Wiley & Sons Ltd, 2003.
[10] N. Instruments, "National Instruments," National Instrumens, 5 March 2019. [Online].
Available: https://www.ni.com/en-us/innovations/white-papers/11/what-is-ni-usrp-
hardware-.html#section--817443112. [Accessed 29 October 2020].
[11] M. M. Elahi, J. C. Sandoval and V. Gonzalez, "Interference mitigation of adjacent radio
frequency signals using digital filtering techniques on a flexible software defined radio
testbed," El Paso, 2019.
[12] C. Chengyu, P. Sunkwon, J. Jun and J. Lee, "The Application of Linear Predictive Coding
for RoIP data transmission in the HFC network," in International Conference on Network
Infrastructure and Digital Content (IC-NIDC), Guiyang, 2018.
[13] R. Logic, "RT Logic a Kratos Company," 30 October 2015. [Online]. Available:
https://www.kratosdefense.com/~/media/datasheets/whitepapers/rtl-mwp-
079_adapting%20rfif%20over%20ip%20within%20range%20applications.pdf. [Accessed
29 October 2020].
[14] Federal Communication Commission Internet Services Staff, "Enforcement Bureau," 2015.
[Online]. Available: http://transition.fcc.gov/eb/.
[15] B. Sklar, Digital Communications Fundamentals and Applications, New Jersey: Prentice
Hall, 2001.
[16] F. Xiong, Digital Modulation Techniques, Norwood: Artech House, 2006.
[17] D. P. Agrawal and Q.-A. Zeng, Introduction to Wireless and Mobile Systems, Stamford:
Cenage Leaning, 2011.

115
[18] E. Dahlman, S. Parkvall and J. Skold, 4G, LTE-Advanced Pro and The Road to 5G,
Cambridge: Elseiver, 2016.
[19] M. Rumney, LTE and the Evolution to 4G Wireless, Chichester: Jhon Wiley & Sons, 2013.
[20] Mini-circuits, "Mini-circuits.com," [Online]. Available:
https://www.minicircuits.com/pdfs/ZN4PD1-63HP-S+.pdf. [Accessed 27 November 2020].
[21] National Telecommunications and Information Administration, "United States Frequency
Allocations," 2016. [Online]. Available: https://www.ntia.doc.gov/page/2011/united-states-
frequency-allocation-chart.
[22] M. M. M. Elahi, "Interference Mitigation of Adjacent Radio Frequency Signals on a
Flexible Software-Defined Radio Testbed Platform," ProQuest, El Paso, 2019.

116
Appendix A
This section includes information on testbed adjustment and calibration. These
experiments are part of Chapter 4: Results.
A1.1 BASELINE PARAMETERS
These are other parameters for telemetry platform. Figure 4.1.4 shows a telemetry QPSK
signal at a frequency of 2 GHz and gain of 12 dB. This includes constellation diagram, power
spectrum (SNR) and eye diagram.
Figure 4.1.4 telemetry QPSK signal, frequency 2 GHz and gain 12dB. From left to right:
constellation diagram, power spectrum and eye diagram.
Figure 4.1.5 shows a telemetry 8-PSK signal at a frequency of 2 GHz and gain of 12 dB.
This includes constellation diagram, power spectrum (SNR) and eye diagram.
Figure 4.1.5 telemetry 8-PSK signal, frequency 2 GHz and gain 12dB. From left to right:
constellation diagram, power spectrum and eye diagram.

117
Figure 4.1.6 shows a telemetry OQPSK signal at a frequency of 2 GHz and gain of 12 dB.
This includes constellation diagram, power spectrum (SNR) and eye diagram.
Figure 4.1.6 telemetry OQPSK signal, frequency 2 GHz and gain 12dB. From left to right:
constellation diagram, power spectrum and eye diagram.
Figure 4.1.7 shows a telemetry QPSK signal at a frequency of 2.2 GHz and gain of 12 dB.
This includes constellation diagram, power spectrum (SNR) and eye diagram.
Figure 4.1.7 telemetry QPSK signal, frequency 2.2 GHz and gain 12dB. From left to right:
constellation diagram, power spectrum and eye diagram.
Figure 4.1.8 shows a telemetry 8-PSK signal at a frequency of 2.2 GHz and gain of 12 dB.
This includes constellation diagram, power spectrum (SNR) and eye diagram.

118
Figure 4.1.8 telemetry 8-PSK signal, frequency 2.2 GHz and gain 12dB. From left to right:
constellation diagram, power spectrum and eye diagram.
Figure 4.1.9 shows a telemetry 8-PSK signal at a frequency of 2.2 GHz and gain of 12 dB.
This includes constellation diagram, power spectrum (SNR) and eye diagram.
Figure 4.1.9 telemetry OQPSK signal, frequency 2.2 GHz and gain 12dB. From left to right:
constellation diagram, power spectrum and eye diagram.

119
Figure 4.1.14 shows an EnB to UE signal transmission with an QPSK MCS at a 0.12 rate
at a frequency of 2.2 GHz and 20 dBm power. This includes power spectrum of the EnB TX and
UE RX power spectrum. Also, includes PDSCH constellation, throughput and data rate.
Figure 4.1.14 LTE EnB TX to LTE UE RX, frequency 2.2 GHz and 20 dBm power. From left to
right: EnB TX power spectrum, UE RX power spectrum, PDSCH constellation,
throughput and data rate.
Figure 4.1.15 shows an EnB to UE signal transmission with a 16-QAM MCS at a 0.42 rate
at a frequency of 2.2 GHz and 20 dBm power. This includes power spectrum of the EnB TX and
UE RX power spectrum. Also, includes PDSCH constellation, throughput and data rate.

120
Figure 4.1.15 LTE EnB TX to LTE UE RX, frequency 2.2 GHz and 20 dBm power. From left to
right: EnB TX power spectrum, UE RX power spectrum, PDSCH constellation,
throughput and data rate.
Figure 4.1.16 shows an EnB to UE signal transmission with a 64-QAM MCS at a 0.43 rate
at a frequency of 2.2 GHz and 20 dBm power. This includes power spectrum of the EnB TX and
UE RX power spectrum. Also, includes PDSCH constellation, throughput and data rate.
Figure 4.1.16 LTE EnB TX to LTE UE RX, frequency 2.2 GHz and 20 dBm power. From left to
right: EnB TX power spectrum, UE RX power spectrum, PDSCH constellation,
throughput and data rate.
Figure 4.1.17 shows an EnB to UE signal transmission with a 64-QAM MCS at a 0.93 rate
at a frequency of 2.2 GHz and 20 dBm power. This includes power spectrum of the EnB TX and
UE RX power spectrum. Also, includes PDSCH constellation, throughput and data rate.

121
Figure 4.1.17 LTE EnB TX to LTE UE RX, frequency 2.2 GHz and 20 dBm power. From left to
right: EnB TX power spectrum, UE RX power spectrum, PDSCH constellation,
throughput and data rate.
A1.2 TMOIP
No clock
Frequency is 2 GHz and other parameters will remain as before. Figure 4.2.1.4 shows a
QPSK telemetry signal at a frequency of 2GHz and 12 dB gain. This includes constellation
diagram, power spectrum and eye diagram.
Figure 4.2.1.4 telemetry QPSK signal, frequency 2 GHz and gain 12dB. From left to right:
constellation diagram, power spectrum and eye diagram.

122
Figure 4.2.1.5 shows an 8-PSK telemetry signal at a frequency 2GHz and gain of 12 dB.
This includes constellation diagram, power spectrum and eye diagram.
Figure 4.2.1.5 telemetry 8-PSK signal, frequency 2 GHz and gain 12 dB. From left to right:
constellation diagram, power spectrum and eye diagram
In last, for the frequency of 2 GHz. Figure 4.2.1.6 shows a OQPSK telemetry signal at a
frequency of 2 GHz and 12 dB gain. This includes constellation diagram, power spectrum and eye
diagram.
Figure 4.2.1.6 telemetry OQPSK signal, frequency 2 GHz and gain 12dB. From left to right:
constellation diagram, power spectrum and eye diagram.
Last experiment scenario is frequency at 2.2 GHz. All other parameters will remain as
before. Figure 4.2.1.7 shows a QPSK telemetry signal at a frequency of 2.2 GHz and gain of 12
dB. This includes constellation diagram, power spectrum and eye diagram.

123
Figure 4.2.1.7 telemetry QPSK signal, frequency 2.2 GHz and gain 12dB. From left to right:
constellation diagram, power spectrum and eye diagram.
Figure 4.2.1.8 shows an 8-PSK telemetry signal at a frequency of 2.2 GHz and gain of 12
dB. This includes constellation diagram, power spectrum and eye diagram.
Figure 4.2.1.8 telemetry 8-PSK signal, frequency 2.2 GHz and gain 12dB. From left to right:
constellation diagram, power spectrum and eye diagram.

124
Finally, Figure 4.2.1.9 shows a OQPSK telemetry signal at a frequency of 2 GHz and 12
dB gain. This includes constellation diagram, power spectrum and eye diagram.
Figure 4.2.1.9 telemetry OQPSK signal, frequency 2.2 GHz and gain 12dB. From left to right:
constellation diagram, power spectrum and eye diagram
Clock
Next, these are other experiments using a reference clock at 2 GHz frequency. Figure
4.2.2.4 shows a QPSK telemetry signal at frequency 2 GHz and 12 dB gain. This includes
constellation diagram, power spectrum and eye diagram.
Figure 4.2.2.4 telemetry QPSK signal, frequency 2 GHz and gain 12dB. From left to right:
constellation diagram, power spectrum and eye diagram.

125
Figure 4.2.2.5 shows an 8-PSK telemetry signal at frequency 2 GHz and 12 dB gain. This
includes constellation diagram, power spectrum and eye diagram.
Figure 4.2.2.5 telemetry 8-PSK signal, frequency 2 GHz and gain 12dB. From left to right:
constellation diagram, power spectrum and eye diagram.
In last, Figure 4.2.2.6 shows an OQPSK telemetry signal at frequency 2 GHz and 12 dB
gain. This includes constellation diagram, power spectrum and eye diagram.
Figure 4.2.2.6 telemetry OQPSK signal, frequency 2 GHz and gain 12dB. From left to right:
constellation diagram, power spectrum and eye diagram.

126
To conclude, experiments for the frequency at 2.2 GHz. Figure 4.2.2.7 shows a QPSK
telemetry signal at frequency 2.2 GHz and 12 dB gain. This includes constellation diagram, power
spectrum and eye diagram.
Figure 4.2.2.7 telemetry QPSK signal, frequency 2.2 GHz and gain 12dB. From left to right:
constellation diagram, power spectrum and eye diagram.
Figure 4.2.2.8 shows an 8-PSK telemetry signal at frequency 2.2 GHz and 12 dB gain. This
includes constellation diagram, power spectrum and eye diagram.
Figure 4.2.2.8 telemetry 8-PSK signal, frequency 2.2 GHz and gain 12dB. From left to right:
constellation diagram, power spectrum and eye diagram.

127
Lastly, Figure 4.2.2.9 shows an OQPSK telemetry signal at frequency 2.2 GHz and 12 dB
gain. This includes constellation diagram, power spectrum and eye diagram.
Figure 4.2.2.9 telemetry OQPSK signal, frequency 2.2 GHz and gain 12dB. From left to right:
constellation diagram, power spectrum and eye diagram.
A1.3 LTE OVER IP
CLOCK
LTE STAND-ALONE
Now, frequency will change to 2.2 GHz all other parameters will remain as before. Figure
4.3.2.9 shows QPSK LTE EnB signal at a frequency of 2.2 GHz with 0 dBm power. This includes
power spectrum of the EnB TX and UE RX power spectrum. Also, includes PDSCH constellation,
throughput and data rate.
Figure 4.3.2.9 LTE EnB TX to LTE UE RX, frequency 2.2 GHz and 0 dBm power. From left to
right: EnB TX power spectrum, UE RX power spectrum, PDSCH constellation,
throughput and data rate.

128
Figure 4.3.2.10 shows QPSK LTE EnB signal at a frequency of 2.2 GHz with 20 dBm
power. This includes power spectrum of the EnB TX and UE RX power spectrum. Also, includes
PDSCH constellation, throughput and data rate.
Figure 4.3.2.10 LTE EnB TX to LTE UE RX, frequency 2.2 GHz and 20 dBm power. From left
to right: EnB TX power spectrum, UE RX power spectrum, PDSCH constellation,
throughput and data rate.
Figure 4.3.2.11 shows 16QAM LTE EnB signal at a rate of 0.42 and a frequency of 2.2
GHz with 0 dBm power. This includes power spectrum of the EnB TX and UE RX power
spectrum. Also, includes PDSCH constellation, throughput and data rate.
Figure 4.3.2.11 LTE EnB TX to LTE UE RX, frequency 2.2 GHz and 0 dBm power. From left to
right: EnB TX power spectrum, UE RX power spectrum, PDSCH constellation,
throughput and data rate.

129
Figure 4.3.2.12 shows 16QAM LTE EnB signal at a rate of 0.42 and a frequency of 2.2
GHz with 20 dBm power. This includes power spectrum of the EnB TX and UE RX power
spectrum. Also, includes PDSCH constellation, throughput and data rate.
Figure 4.3.2.12 LTE EnB TX to LTE UE RX, frequency 2.2 GHz and 20 dBm power. From left
to right: EnB TX power spectrum, UE RX power spectrum, PDSCH constellation,
throughput and data rate.

130
Figure 4.3.2.13 shows 64QAM LTE EnB signal at a rate of 0.43 and a frequency of 2.2
GHz with 0 dBm power. This includes power spectrum of the EnB TX and UE RX power
spectrum. Also, includes PDSCH constellation, throughput and data rate.
Figure 4.3.2.13 LTE EnB TX to LTE UE RX, frequency 2.2 GHz and 0 dBm power. From left to
right: EnB TX power spectrum, UE RX power spectrum, PDSCH constellation,
throughput and data rate.
Figure 4.3.2.14 shows 64QAM LTE EnB signal at a rate of 0.43 and a frequency of 2.2
GHz with 20 dBm power. This includes power spectrum of the EnB TX and UE RX power
spectrum. Also, includes PDSCH constellation, throughput and data rate.
Figure 4.3.2.14 LTE EnB TX to LTE UE RX, frequency 2.2 GHz and 20 dBm power. From left
to right: EnB TX power spectrum, UE RX power spectrum, PDSCH constellation,
throughput and data rate.

131
Figure 4.3.2.15 shows 64QAM LTE EnB signal at a rate of 0.93 and a frequency of 2.2
GHz with 0 dBm power. This includes power spectrum of the EnB TX and UE RX power
spectrum. Also, includes PDSCH constellation, throughput and data rate.
Figure 4.3.2.15 LTE EnB TX to LTE UE RX, frequency 2.2 GHz and 20 dBm power. From left
to right: EnB TX power spectrum, UE RX power spectrum, PDSCH constellation,
throughput and data rate.
Figure 4.3.2.16 shows 64QAM LTE EnB signal at a rate of 0.93 and a frequency of 2.2
GHz with 20 dBm power. This includes power spectrum of the EnB TX and UE RX power
spectrum. Also, includes PDSCH constellation, throughput and data rate.
Figure 4.3.2.16 LTE EnB TX to LTE UE RX, frequency 2.2 GHz and 20 dBm power. From left
to right: EnB TX power spectrum, UE RX power spectrum, PDSCH constellation,
throughput and data rate.

132
Vita
Jose Carlos Sandoval was born on August 8, 1993. First child of Jose Manuel Sandoval
Barron and Sandra Luz Maese Fernandez. Both parents of Mexican nationality. Enrolled as an
undergraduate student at the University of Texas at El Paso (UTEP) in 2012. Pursuing a Bachelor’s
degree in Electrical Engineering. During bachelor’s degree he worked 4 years for the Technology
Support Center at UTEP library in the role of Information Technology (IT) assistant. He obtained
his Bachelor of science in Electrical Engineering with Cum Laude honors on May 2016.
In Fall 2018, he began his graduate studies at UTEP to pursue a Master’s degree in
Electrical Engineering. Worked as a Teacher Assistant for Electronics I and later as a Research
Assistant under supervision of Dr. Virgilio Gonzalez assisting on a White Sands Missile Range
Project. Published a research paper for the International Telemetry Conference (ITC) 2019 which
was the beginning of the research thesis.
Thesis typed by Jose Carlos Sandoval.