tetratec - amazon simple storage service · tetratec.com tetra technologies, inc. ... chairman of...
TRANSCRIPT
te t ratec.com
TETRA Technologies, Inc.GLOBAL HEADQUARTERS24955 Interstate 45 North
The Woodlands, TX 77380
281.367.1983
TETRA Techno logies , Inc.2014 AnnuAl RepoRt
®
®
DEDICATED TO THE CØRE
EMP
LO Y EE
S
CEØ
CU
S
T OM ER
S
DRIV
E to ZER
O
TETRA
Technolo
gies, Inc. 2014 A
nn
uA
l R
ep
oR
t
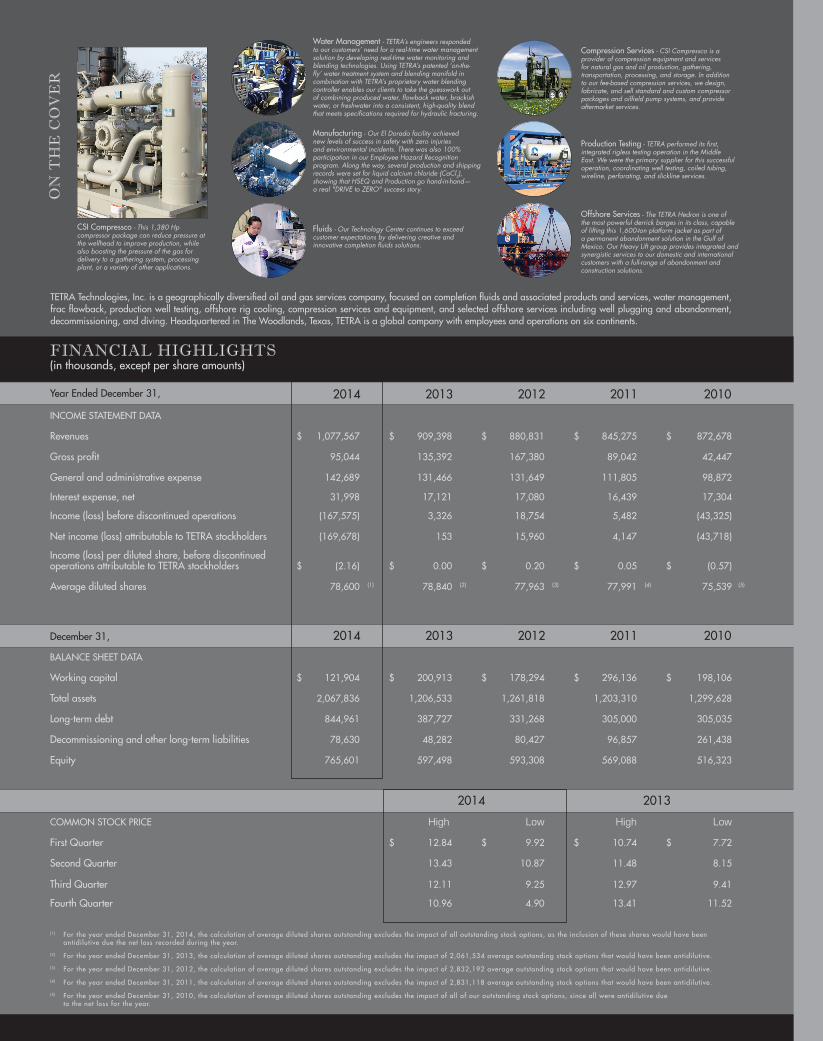
Financial HigHligHts(in thousands, except per share amounts)
(1) For the year ended December 31, 2014, the calculation of average diluted shares outstanding excludes the impact of all outstanding stock options, as the inclusion of these shares would have been antidilutive due the net loss recorded during the year.
(2) For the year ended December 31, 2013, the calculation of average diluted shares outstanding excludes the impact of 2,061,534 average outstanding stock options that would have been antidilutive.
(3) For the year ended December 31, 2012, the calculation of average diluted shares outstanding excludes the impact of 2,832,192 average outstanding stock options that would have been antidilutive.
(4) For the year ended December 31, 2011, the calculation of average diluted shares outstanding excludes the impact of 2,831,118 average outstanding stock options that would have been antidilutive.
(5) For the year ended December 31, 2010, the calculation of average diluted shares outstanding excludes the impact of all of our outstanding stock options, since all were antidilutive due to the net loss for the year.
On
tH
e c
Ov
er
Year Ended December 31, 2014 2013 2012 2011 2010
IncomE StatEmEnt Data
Revenues $ 1,077,567 $ 909,398 $ 880,831 $ 845,275 $ 872,678
Gross profit 95,044 135,392 167,380 89,042 42,447
General and administrative expense 142,689 131,466 131,649 111,805 98,872
Interest expense, net 31,998 17,121 17,080 16,439 17,304
Income (loss) before discontinued operations (167,575) 3,326 18,754 5,482 (43,325)
net income (loss) attributable to tEtRa stockholders (169,678) 153 15,960 4,147 (43,718)
Income (loss) per diluted share, before discontinued operations attributable to tEtRa stockholders $ (2.16) $ 0.00 $ 0.20 $ 0.05 $ (0.57)
average diluted shares 78,600 (1) 78,840 (2) 77,963 (3) 77,991 (4) 75,539 (5)
December 31, 2014 2013 2012 2011 2010
BalancE ShEEt Data
Working capital $ 121,904 $ 200,913 $ 178,294 $ 296,136 $ 198,106
total assets 2,067,836 1,206,533 1,261,818 1,203,310 1,299,628
long-term debt 844,961 387,727 331,268 305,000 305,035
Decommissioning and other long-term liabilities 78,630 48,282 80,427 96,857 261,438
Equity 765,601 597,498 593,308 569,088 516,323
2014 2013
common Stock PRIcE High Low High Low
First Quarter $ 12.84 $ 9.92 $ 10.74 $ 7.72
Second Quarter 13.43 10.87 11.48 8.15
third Quarter 12.11 9.25 12.97 9.41
Fourth Quarter 10.96 4.90 13.41 11.52
BOard OF directOrs
maRk E. BalDWIn (1*)
Retired Executive Vice President and chief Financial officer of Dresser-Rand Group, Inc. Director of kBR, Inc. Director of nine Energy Service. Director of tEtRa technologies, Inc. since 2014.
thomaS R. BatES, JR. (2*)
chairman of the Board of Directors of hercules offshore, Inc. chairman of the Board of Directors of Independence contract Drilling, Inc. adjunct Professor at the neely School of Business, texas christian University. Director of tEtRa technologies, Inc. since 2011.
StUaRt m. BRIGhtmanPresident and chief Executive officer of tEtRa technologies, Inc. chairman of the Board of Directors of cSI compressco GP Inc. Director of tEtRa technologies, Inc. since 2009.
PaUl D. coomBS (3) Director of Balchem corporation. Director of tEtRa technologies, Inc. since 1994.
RalPh S. cUnnInGham (1) chairman of the Board of Directors of tEtRa technologies, Inc. Vice-chairman of the Board of Directors of Enterprise Products company. Director of cenovus Energy Inc. Director of tEtRa technologies, Inc. since 1999.
John F. GlIck (2, 3)
Retired President, chief Executive officer, and a Director of lufkin Industries, Inc. Director of hunting Plc. Director of tEtRa technologies, Inc. since 2014.
kEnnEth P. mItchEll (1, 3)
Retired President and chief Executive officer of oakite Products, Inc. Director of tEtRa technologies, Inc. since 1997.
WIll Iam D. SUll IVan (2, 3*)
Retired Executive Vice President, E&P, anadarko Petroleum corporation. chairman of the Board of Directors of Sm Energy company. Director of legacy Reserves GP, llc. Director of targa Resources Partners GP, llc. Director of cSI compressco GP Inc. Director of tEtRa technologies, Inc. since 2007.
kEnnEth E. WhItE, JR. (1, 2) Retired President and chief operating officer of torch Energy advisors. Director of tEtRa technologies, Inc. since 2002.
cOrpOrate OFFicers
StUaRt m. BRIGhtmanPresident and chief Executive officer
JoSEPh ElkhoURYSenior Vice President and chief operating officer
El IJ Io V. SERRanoSenior Vice President and chief Financial officer
PEtER J. P IntaRSenior Vice President
kEIth l. SchIll InGSenior Vice President
BaSS c. WallacE, JR.Senior Vice President and General counsel
t ImothY a. knoxPresident – cSI compressco GP Inc.
(1 ) m e m b e r, a u d i t c o m m i t t e e(2 ) m e m b e r, c o m p e n s a t i o n c o m m i t t e e(3 ) m e m b e r, n o m i n a t i n g a n d c o r p o r a t e G o v e r n a n c e c o m m i t t e e( * ) I n d i c a t e s c o m m i t t e e c h a i r m a n s h i p
BEn c. chamBERSVice President – accounting and controller
JoSEPh J. mEYERVice President – Finance and treasurer
El ISaBEth k. EVanSVice President – human Resources
stOckHOlder inFOrmatiOn
coRPoRatE hEaDQUaRtERStEtRa technologies, Inc. 24955 Interstate 45 north the Woodlands, tx 77380 281.367.1983 tetratec.com
StockholDER RElatIonStEtRa technologies, Inc. 24955 Interstate 45 north the Woodlands, tx 77380
tRanSFER aGEnt anD REGIStRaRcomputershare Investor Services 350 Indiana Street, Suite 800 Golden, co 80401 303.262.0600
Stock l IStInGShares of common stock of tEtRa technologies, Inc. trade on the new York Stock Exchange under the ticker symbol: ttI.
InDEPEnDEnt aUDItoRSErnst & Young llP 5 houston center 1401 mckinney Street, Suite 1200 houston, tx 77010
FoRm 10-kthe company’s Form 10-k for the year ended December 31, 2014 is included in this annual Report. additional copies may be obtained free of charge by visiting the company’s website (tetratec.com) or by writing to:
Stockholder Relations tEtRa technologies, Inc. 24955 Interstate 45 north the Woodlands, tx 77380
annUal mEEtInGthe annual meeting of stockholders will be held at 11:00 a.m. local time on tuesday, may 5, 2015, at our corporate headquarters in the Woodlands, texas.
DIScloSURE cERtIF IcatIonas required by the nYSE listing standards, Stuart m. Brightman, our chief Executive officer, certified on may 24, 2014, that he was not aware of any violation by the company of nYSE corporate governance listing standards. the certification required by Section 302 of the Sarbanes-oxley act was filed with the SEc on march 2, 2015, as an exhibit to our annual Report on Form 10-k.
copyright © 2015 tEtRa technologies, Inc. all Rights Reserved.
Water management - TETRA’s engineers responded to our customers’ need for a real-time water management solution by developing real-time water monitoring and blending technologies. Using TETRA’s patented ‘on-the-fly’ water treatment system and blending manifold in combination with TETRA’s proprietary water blending controller enables our clients to take the guesswork out of combining produced water, flowback water, brackish water, or freshwater into a consistent, high-quality blend that meets specifications required for hydraulic fracturing.
manufacturing - Our El Dorado facility achieved new levels of success in safety with zero injuries and environmental incidents. There was also 100% participation in our Employee Hazard Recognition program. Along the way, several production and shipping records were set for liquid calcium chloride (CaCl2), showing that HSEQ and Production go hand-in-hand— a real "DRIVE to ZERO" success story.
Fluids - Our Technology Center continues to exceed customer expectations by delivering creative and innovative completion fluids solutions.
compression Services - CSI Compressco is a provider of compression equipment and services for natural gas and oil production, gathering, transportation, processing, and storage. In addition to our fee-based compression services, we design, fabricate, and sell standard and custom compressor packages and oilfield pump systems, and provide aftermarket services.
offshore Services - The TETRA Hedron is one of the most powerful derrick barges in its class, capable of lifting this 1,600-ton platform jacket as part of a permanent abandonment solution in the Gulf of Mexico. Our Heavy Lift group provides integrated and synergistic services to our domestic and international customers with a full-range of abandonment and construction solutions.
Production testing - TETRA performed its first, integrated rigless testing operation in the Middle East. We were the primary supplier for this successful operation, coordinating well testing, coiled tubing, wireline, perforating, and slickline services.
tEtRa technologies, Inc. is a geographically diversified oil and gas services company, focused on completion fluids and associated products and services, water management, frac flowback, production well testing, offshore rig cooling, compression services and equipment, and selected offshore services including well plugging and abandonment, decommissioning, and diving. headquartered in the Woodlands, texas, tEtRa is a global company with employees and operations on six continents.
cSI compressco - This 1,380 Hp compressor package can reduce pressure at the wellhead to improve production, while also boosting the pressure of the gas for delivery to a gathering system, processing plant, or a variety of other applications.
For the second year in a row, our continuing
businesses generated in excess of $80
million in free cash flow. We achieved this
result through a combination of working
capital improvements and efficiencies,
better operational performance, and
increased discipline on capital spending.
This demonstrated ability to generate cash
from our existing businesses positions us
well to succeed in a very challenging market
environment.
We also introduced a Customer-Centric
framework that was built on existing TETRA
values. This program will allow us to drive
essential behaviors to develop a strong
performance culture. Being ‘Dedicated to
the CØRE’ will be demonstrated by building
lasting relationships with our CUSTOMERS
and understanding their needs to provide
solutions, exceed expectations, and grow
share and new business. We must DRIVE to
ZERO HSE, Quality and Ethics incidents and
must live by this same conduct everywhere.
Our goal for better RETURNS will be
achieved by focusing on costs, streamlining
our operations, and proactively managing
our suppliers. We will, as one team with
our EMPLOYEES, train and develop career
opportunities, improve communications,
provide feedback, and reward outstanding
performance. Our collective and individual
behaviors will enable continuous
improvement and positive change.
As we move into 2015, we are clearly faced
with a very demanding market. Commodity
price reductions have significantly curtailed
planned spending by our customers. We
are responding to this pressure by being
proactive in managing costs, focusing on the
customers that recognize the value that we
provide, and identifying new opportunities
to grow our businesses—particularly
with regard to opportunistic international
expansion and technological innovations
based on our existing products and services.
We believe we have the underlying financial
strength to succeed in this challenging
market and can take advantage of strategic
growth opportunities as they present
themselves.
As always, I would like to thank our
dedicated employees for their contributions.
Our leadership team and our exceptional
employees have created the foundation
that will allow us to execute through a
challenging 2015 and continue to create and
deliver shareholder value as we emerge in a
more favorable cycle.
Thank you for your support and confidence,
S t u a r t M . B r i g h t m a n
President and CEO
During 2014, we completed the largest
acquisition in TETRA’s history. The structure
of our publicly traded partnership,
formerly Compressco Partners, L.P.,
enabled us to raise $1.1 billion with which
to fund the $825 million acquisition of
Compressor Systems, Inc. (“CSI”). This
transformational acquisition created a
leading, global provider of compression
services, with capabilities in fabrication,
unit sales, and aftermarket services.
CSI Compressco LP, the combined and
renamed entity, has successfully united the
leadership of both legacy organizations to
create a world-class management team.
Working with them, we have leveraged
TETRA’s global infrastructure to successfully
integrate our legacy operations and offer
our customers a more comprehensive
solution through an optimal business
structure.
One of our largest, original TETRA
businesses, our Fluids Division, has
grown significantly over the years, both
organically and through strategic, targeted
acquisitions. This growth strategy was
demonstrated in 2014 by our acquisition of
the remaining interest in our joint venture
in Saudi Arabia and our acquisition of water
transfer assets in the U.S. Beyond these
acquisitions, during 2014, we continued
to focus on technological innovation, as
evidenced by some of the new, proprietary
products that we have introduced for
deepwater completion fluids and onshore
water management markets. We have
evolved our Fluids Division strategy over
many years and still believe that our core
competencies of chemical and completion
fluids manufacturing combined with service
expertise have been, and will continue to
be, key factors driving the success of this
business. In a market environment that will
continue to present challenges in multiple
North American basins, our existing
footprint and infrastructure gives us a
unique capability.
During the year, we implemented an
improvement plan for our Production
Testing Division that was based on revenue
enhancement through expansion of our
customer base, optimization of existing
assets, and disciplined cost focus. This
tactical execution allowed us to improve
results over the course of the year and exit
2014 with margins that are consistent with
our historical performance.
Our Offshore Services segment continued
to face significant market demand
challenges during 2014. In spite of these
pressures, we continued to focus on
delivering high-value solutions to our
customers by leveraging our suite of
services, including abandonment and
decommissioning, and diving.
®
We are responding to this pressure by being proactive in managing costs, focusing on the customers that recognize the value that we provide, and identifying new opportunities to grow our businesses.”
”Letter to Stockholders
...during 2014, we continued to focus on technological innovation, as evidenced by some of the new, proprietary products that we have introduced for deepwater completion fluids and onshore water management markets.”
”

UNITED STATES
SECURITIES AND EXCHANGE COMMISSION WASHINGTON D.C. 20549
FORM 10-K (MARK ONE)
[ X ] ANNUAL REPORT PURSUANT TO SECTION 13 OR 15(d) OF THE SECURITIES EXCHANGE ACT OF 1934 FOR THE FISCAL YEAR ENDED DECEMBER 31, 2014
OR
[ ] TRANSITION REPORT PURSUANT TO SECTION 13 OR 15(d) OF THE SECURITIES EXCHANGE ACT OF 1934 FOR THE TRANSITION PERIOD FROM TO .
COMMISSION FILE NUMBER 1-13455
TETRA Technologies, Inc. (EXACT NAME OF THE REGISTRANT AS SPECIFIED IN ITS CHARTER)
DELAWARE 74-2148293 (STATE OR OTHER JURISDICTION OF (I.R.S. EMPLOYER INCORPORATION OR ORGANIZATION) IDENTIFICATION NO.)
24955 INTERSTATE 45 NORTH THE WOODLANDS, TEXAS 77380
(ADDRESS OF PRINCIPAL EXECUTIVE OFFICES) (ZIP CODE)
REGISTRANT’S TELEPHONE NUMBER, INCLUDING AREA CODE: (281) 367-1983
SECURITIES REGISTERED PURSUANT TO SECTION 12(b) OF THE ACT:
COMMON STOCK, PAR VALUE $.01 PER SHARE NEW YORK STOCK EXCHANGE(TITLE OF CLASS) (NAME OF EXCHANGE ON WHICH REGISTERED)
SECURITIES REGISTERED PURSUANT TO SECTION 12(g) OF THE ACT: NONEINDICATE BY CHECK MARK IF THE REGISTRANT IS A WELL-KNOWN SEASONED ISSUER (AS DEFINED IN RULE 405 OF THE SECURITIES ACT). YES [ X ] NO [ ]
INDICATE BY CHECK MARK IF THE REGISTRANT IS NOT REQUIRED TO FILE REPORTS PURSUANT TO SECTION 13 OR SECTION 15(d) OF THE ACT. YES [ ] NO [ X ]
INDICATE BY CHECK MARK WHETHER THE REGISTRANT (1) HAS FILED ALL REPORTS REQUIRED TO BE FILED BY SECTION 13 OR 15(d) OF THE SECURITIES EXCHANGE ACT OF 1934 DURING THE PRECEDING 12 MONTHS (OR FOR SUCH SHORTER PERIOD THAT THE REGISTRANT WAS REQUIRED TO FILE SUCH REPORTS) AND (2) HAS BEEN SUBJECT TO SUCH FILING REQUIREMENTS FOR THE PAST 90 DAYS. YES [ X ] NO [ ] INDICATE BY CHECK MARK WHETHER THE REGISTRANT HAS SUBMITTED ELECTRONICALLY AND POSTED ON ITS CORPORATE WEB SITE, IF ANY, EVERY INTERACTIVE DATA FILE REQUIRED TO BE SUBMITTED AND POSTED PURSUANT TO RULE 405 OF REGULATION S-T DURING THE PRECEDING 12 MONTHS (OR FOR SUCH SHORTER PERIOD THAT THE REGISTRANT WAS REQUIRED TO SUBMIT AND POST SUCH FILES). YES [ X ] NO [ ]
INDICATE BY CHECK MARK IF DISCLOSURE OF DELINQUENT FILERS PURSUANT TO ITEM 405 OF REGULATION S-K IS NOT CONTAINED HEREIN, AND WILL NOT BE CONTAINED, TO THE BEST OF REGISTRANT’S KNOWLEDGE, IN DEFINITIVE PROXY OR INFORMATION STATEMENTS INCORPORATED BY REFERENCE IN PART III OF THIS FORM 10-K OR ANY AMENDMENT TO THIS FORM 10-K. [ ] INDICATE BY CHECK MARK WHETHER THE REGISTRANT IS A LARGE ACCELERATED FILER, AN ACCELERATED FILER, A NON-ACCELERATED FILER, OR A SMALLER REPORTING COMPANY. SEE THE DEFINITIONS OF “LARGE ACCELERATED FILER,” “ACCELERATED FILER,” AND “SMALLER REPORTING COMPANY” IN RULE 12b-2 OF THE EXCHANGE ACT. (CHECK ONE):
LARGE ACCELERATED FILER [ X ] ACCELERATED FILER [ ] NON-ACCELERATED FILER [ ] SMALLER REPORTING COMPANY [ ]
INDICATE BY CHECK MARK WHETHER THE REGISTRANT IS A SHELL COMPANY (AS DEFINED IN RULE 12b-2 OF THE EXCHANGE ACT).
YES [ ] NO [ X ]
THE AGGREGATE MARKET VALUE OF COMMON STOCK HELD BY NON-AFFILIATES OF THE REGISTRANT WAS $911,481,175.36 AS OF JUNE 30, 2014, THE LAST BUSINESS DAY OF THE REGISTRANT’S MOST RECENTLY COMPLETED SECOND FISCAL QUARTER.
NUMBER OF SHARES OUTSTANDING OF THE ISSUER’S COMMON STOCK AS OF FEBRUARY 27, 2015 WAS 79,649,946 SHARES.
DOCUMENTS INCORPORATED BY REFERENCE
PART III INFORMATION IS INCORPORATED BY REFERENCE TO THE REGISTRANT’S PROXY STATEMENT FOR ITS ANNUAL MEETING OF STOCKHOLDERS TO BE HELD MAY 5, 2015 TO BE FILED WITH THE SECURITIES AND EXCHANGE COMMISSION WITHIN 120 DAYS OF THE END OF THE REGISTRANT’S FISCAL YEAR.
TABLE OF CONTENTS
Part I Item 1. Business 1Item 1A. Risk Factors 12Item 1B. Unresolved Staff Comments 23Item 2. Properties 23Item 3. Legal Proceedings 25Item 4. Mine Safety Disclosures 25
Part II Item 5. Market for Registrant’s Common Equity, Related Stockholder Matters, and Issuer Purchases of Equity
Securities 25
Item 6. Selected Financial Data 27Item 7. Management’s Discussion and Analysis of Financial Condition and Results of Operation 29
Item 7A. Quantitative and Qualitative Disclosures about Market Risk 63Item 8. Financial Statements and Supplementary Data 65Item 9. Changes in and Disagreements with Accountants on Accounting and Financial Disclosure 65Item 9A. Controls and Procedures 65Item 9B. Other Information 66
Part III Item 10. Directors, Executive Officers, and Corporate Governance 67Item 11. Executive Compensation 67Item 12. Security Ownership of Certain Beneficial Owners and Management and Related Stockholder Matters 67Item 13. Certain Relationships and Related Transactions, and Director Independence 67Item 14. Principal Accounting Fees and Services 67
Part IV Item 15. Exhibits, Financial Statement Schedules 68
1
Forward-Looking Statements
This Annual Report on Form 10-K contains “forward-looking statements” within the meaning of Section 27A of the Securities Act of 1933, as amended and Section 21E of the Securities Exchange Act of 1934, as amended. Forward-looking statements in this annual report are identifiable by the use of the following words and other similar words: “anticipates”, “assumes”, “believes”, “budgets”, “could”, “estimates”, “expects”, “forecasts”, “goal”, “intends”, “may”, “might”, “plans”, “predicts”, “projects”, “schedules”, “seeks”, “should, “targets”, “will” and “would”. Such forward-looking statements reflect our current views with respect to future events and financial performance and are based on assumptions that we believe to be reasonable but such forward-looking statements are subject to numerous risks, and uncertainties, including, but not limited to:
• economic and operating conditions that are outside of our control, including the supply, demand, and prices of crude oil and natural gas;
• the levels of competition we encounter;
• the activity levels of our customers;
• the availability of adequate sources of capital to us;
• our ability to comply with contractual obligations, including those under our financing arrangements;
• our operational performance;
• risks related to acquisitions and our growth strategy;
• the availability of raw materials and labor at reasonable prices;
• risks related to our foreign operations;
• the effect and results of litigation, regulatory matters, settlements, audits, assessments, and contingencies; and
• other risks and uncertainties under “Item 1A. Risk Factors” in this Annual Report and as included in our other filings with the U.S. Securities and Exchange Commission (“SEC”), which are available free of charge on the SEC website at www.sec.gov.
The risks and uncertainties referred to above are generally beyond our ability to control and we cannot predict all the risks and uncertainties that could cause our actual results to differ from those indicated by the forward-looking statements. If any of these risks or uncertainties materialize, or if any of the underlying assumptions prove incorrect, actual results may vary from those indicated by the forward-looking statements, and such variances may be material.
All subsequent written and oral forward-looking statements made by or attributable to us or to persons
acting on our behalf are expressly qualified in their entirety by reference to these risks and uncertainties. You should not place undue reliance on forward-looking statements. Each forward-looking statement speaks only as of the date of the particular statement, and we undertake no obligation to update or revise any forward-looking statements we may make, except as may be required by law.
1
PART I
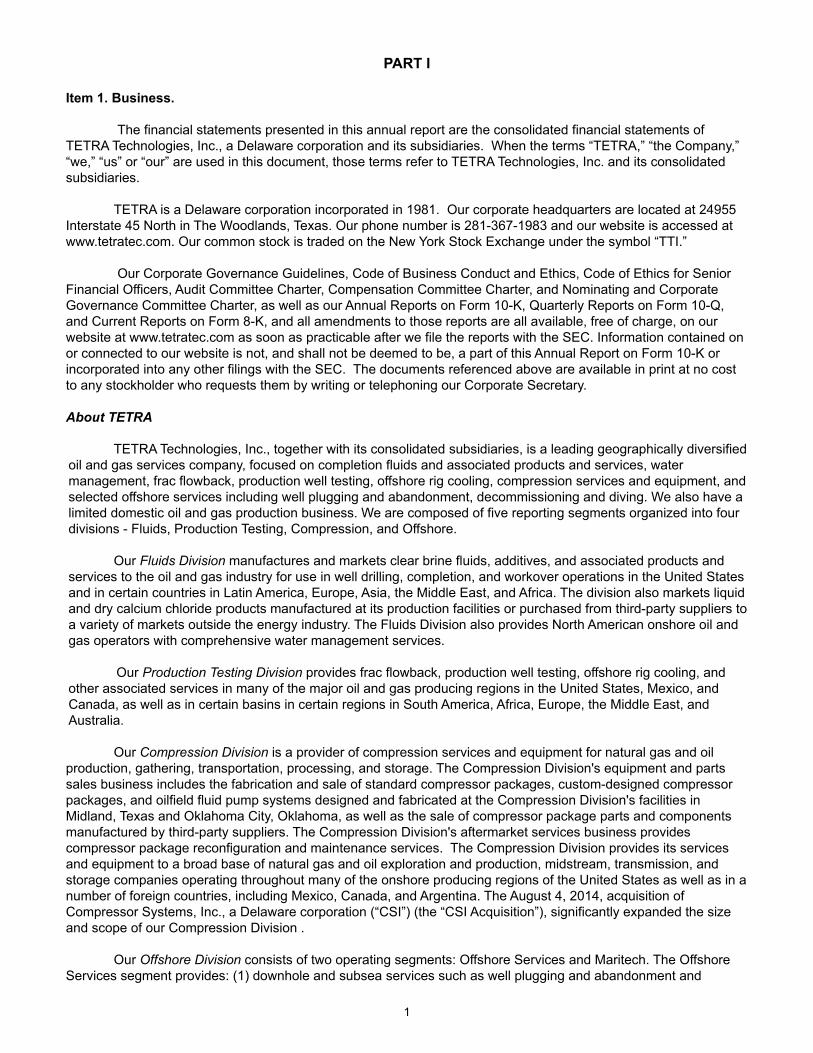
Item 1. Business.
The financial statements presented in this annual report are the consolidated financial statements of TETRA Technologies, Inc., a Delaware corporation and its subsidiaries. When the terms “TETRA,” “the Company,” “we,” “us” or “our” are used in this document, those terms refer to TETRA Technologies, Inc. and its consolidated subsidiaries.
TETRA is a Delaware corporation incorporated in 1981. Our corporate headquarters are located at 24955
Interstate 45 North in The Woodlands, Texas. Our phone number is 281-367-1983 and our website is accessed at www.tetratec.com. Our common stock is traded on the New York Stock Exchange under the symbol “TTI.”
Our Corporate Governance Guidelines, Code of Business Conduct and Ethics, Code of Ethics for Senior
Financial Officers, Audit Committee Charter, Compensation Committee Charter, and Nominating and Corporate Governance Committee Charter, as well as our Annual Reports on Form 10-K, Quarterly Reports on Form 10-Q, and Current Reports on Form 8-K, and all amendments to those reports are all available, free of charge, on our website at www.tetratec.com as soon as practicable after we file the reports with the SEC. Information contained on or connected to our website is not, and shall not be deemed to be, a part of this Annual Report on Form 10-K or incorporated into any other filings with the SEC. The documents referenced above are available in print at no cost to any stockholder who requests them by writing or telephoning our Corporate Secretary. About TETRA
TETRA Technologies, Inc., together with its consolidated subsidiaries, is a leading geographically diversified oil and gas services company, focused on completion fluids and associated products and services, water management, frac flowback, production well testing, offshore rig cooling, compression services and equipment, and selected offshore services including well plugging and abandonment, decommissioning and diving. We also have a limited domestic oil and gas production business. We are composed of five reporting segments organized into four divisions - Fluids, Production Testing, Compression, and Offshore.
Our Fluids Division manufactures and markets clear brine fluids, additives, and associated products and
services to the oil and gas industry for use in well drilling, completion, and workover operations in the United States and in certain countries in Latin America, Europe, Asia, the Middle East, and Africa. The division also markets liquid and dry calcium chloride products manufactured at its production facilities or purchased from third-party suppliers to a variety of markets outside the energy industry. The Fluids Division also provides North American onshore oil and gas operators with comprehensive water management services.
Our Production Testing Division provides frac flowback, production well testing, offshore rig cooling, and other associated services in many of the major oil and gas producing regions in the United States, Mexico, and Canada, as well as in certain basins in certain regions in South America, Africa, Europe, the Middle East, and Australia.
Our Compression Division is a provider of compression services and equipment for natural gas and oil production, gathering, transportation, processing, and storage. The Compression Division's equipment and parts sales business includes the fabrication and sale of standard compressor packages, custom-designed compressor packages, and oilfield fluid pump systems designed and fabricated at the Compression Division's facilities in Midland, Texas and Oklahoma City, Oklahoma, as well as the sale of compressor package parts and components manufactured by third-party suppliers. The Compression Division's aftermarket services business provides compressor package reconfiguration and maintenance services. The Compression Division provides its services and equipment to a broad base of natural gas and oil exploration and production, midstream, transmission, and storage companies operating throughout many of the onshore producing regions of the United States as well as in a number of foreign countries, including Mexico, Canada, and Argentina. The August 4, 2014, acquisition of Compressor Systems, Inc., a Delaware corporation (“CSI”) (the “CSI Acquisition”), significantly expanded the size and scope of our Compression Division .
Our Offshore Division consists of two operating segments: Offshore Services and Maritech. The Offshore
Services segment provides: (1) downhole and subsea services such as well plugging and abandonment and
2
workover services; (2) decommissioning and certain construction services utilizing heavy lift barges and various cutting technologies with regard to offshore oil and gas production platforms and pipelines; and (3) conventional and saturation diving services.
The Maritech segment is a limited oil and gas production operation. During 2011 and the first quarter of 2012, Maritech sold substantially all of its oil and gas producing property interests. Maritech’s operations consist primarily of the ongoing abandonment and decommissioning associated with its remaining offshore wells and production platforms. Maritech intends to acquire a significant portion of these services from the Offshore Division’s Offshore Services segment.
We continue to pursue a long-term growth strategy that includes expanding our existing core businesses, with the exception of the Maritech segment, through internal growth and acquisitions, domestically and internationally. For financial information for each of our segments, including information regarding revenues and total assets, see “Note P - Industry Segments and Geographic Information” contained in the Notes to Consolidated Financial Statements. 2014 Strategic Growth
We have expanded certain divisions through acquisitions, which are discussed further in Note C to the Consolidated Financial Statements.
Acquisition of Limited Liability Company Interest. On January 16, 2014, we acquired the 50% ownership
interest of Ahmad Albinali & TETRA Arabia Company Ltd., a Saudi Arabian limited liability company (“TETRA Arabia”) that we did not previously own for a purchase price of $25.2 million. The closing of this transaction was pursuant to the terms of the Share Sale and Purchase Agreement entered into as of October 1, 2013, with the other shareholder in TETRA Arabia. TETRA Arabia is a provider of production testing services, offshore rig cooling services and clear brine fluids products and related services, to its customer in Saudi Arabia.
Acquisition of TD Water Transfer. On January 29, 2014, we acquired the assets and business of WIT Water
Transfer, LLC (doing business as TD Water Transfer) for a cash purchase price of $15.0 million. In addition, contingent consideration of up to $8.0 million in cash may be paid, depending on a defined measure of earnings over each of the two twelve month periods subsequent to closing. TD Water Transfer is a provider of water management services to oil and gas operators in the South Texas and North Dakota regions.
Acquisition of Compressor Systems, Inc. On August 4, 2014, pursuant to a stock purchase agreement
dated July 20, 2014, our CSI Compressco LP subsidiary ("CCLP", formerly named Compressco Partners, L.P.) acquired all of the outstanding capital stock of Compressor Systems, Inc. (“CSI”), a Delaware corporation, for $825.0 million cash (the “CSI Acquisition”). CSI owns one of the largest fleets of natural gas compressor packages in the United States. Headquartered in Midland, Texas, CSI fabricates, sells, and maintains natural gas compressor packages and provides a full-range of compression products and services that covers compression needs throughout the entire natural gas production and transmission cycle to natural gas and oil clients. CSI derives revenues through three primary business lines: service operations; equipment sales; and aftermarket services. Strategically, the acquisition is expected to afford our Compression Division the opportunity to capture significant synergies associated with its product and service offerings and its fabrication operations, to further penetrate new and existing markets, and to achieve administrative efficiencies and other strategic benefits. Products and Services Fluids Division
Liquid calcium chloride, calcium bromide, zinc bromide, zinc calcium bromide, sodium bromide, and blends
of such products manufactured by our Fluids Division are referred to as clear brine fluids ("CBFs") in the oil and gas industry. CBFs are salt solutions that have variable densities and are used to control bottomhole pressures during oil and gas completion and workover operations. Although they are used in many types of wells, demand for CBFs is greater in offshore well operations. The Fluids Division sells CBFs and various CBF additives to U.S. and foreign oil and gas exploration and production companies and distributes them to other companies that service customers in the oil and gas industry.
3
The Fluids Division provides both stock and custom-blended CBFs based on our customers’ specific needs and the proposed application. We also provide a broad range of associated services, including onsite fluids filtration, handling and recycling; wellbore cleanup; fluid engineering consultation; fluid management services; and high-volume water management services for fracturing operations. We offer to repurchase (buyback) certain used CBFs from customers, which we are able to recondition and recycle. Selling used CBFs back to us reduces the net cost of the CBFs to our customers and minimizes our customers’ need to dispose of used fluids. We recondition used CBFs through filtration, blending, and the use of proprietary chemical processes, and then market the reconditioned CBFs.
By blending different stock CBFs and using various additives, we are able to modify the specific density,
crystallization temperature, and chemical composition of the CBFs as necessary. The division’s fluid engineering personnel determine the optimal CBF blend for a customer’s particular application to maximize its effectiveness and lifespan. Our filtration services use a variety of techniques and equipment to remove particulates from CBFs at the customer’s site so that the CBFs can be reused. Filtration also enables recovery of a greater percentage of used CBFs for reconditioning.
The Fluids Division provides domestic onshore oil and gas operators with comprehensive frac water
management services, including selection, analysis, treatment, storage, transfer, recycling, and environmental risk mitigation. These services include the division’s BioRid® and other above-ground frac water treatment technologies, some of which are patented, and its proprietary TETRA STEELTM 1200 rapid deployment water transfer system. The Fluids Division's water management personnel seek to design environmentally friendly solutions for the unique needs of each customer’s wellsite in order to maximize operational performance and efficiency.
The Fluids Division manufactures liquid and dry calcium chloride, liquid calcium bromide, zinc bromide, zinc
calcium bromide, and sodium bromide for distribution primarily into energy markets. Liquid and dry calcium chloride are also sold into the water treatment, industrial, cement, food processing, road maintenance, ice melt, agricultural and consumer products markets. Liquid sodium bromide is also sold into the industrial water treatment markets, where it is used as a biocide in recirculated cooling tower waters and in other applications.
Our liquid and dry calcium chloride manufacturing facilities are located in the United States and Finland. We
also acquire liquid and dry calcium chloride inventory from other producers. In the United States, we manufacture calcium chloride at five manufacturing plant facilities, the largest of which is our plant near El Dorado, Arkansas, which produces liquid and flake calcium chloride products. Liquid and flake calcium chloride are also produced at our Kokkola, Finland, plant. We operate our European calcium chloride operations under the name TETRA Chemicals Europe. We also manufacture liquid calcium chloride at our facilities in Parkersburg, West Virginia and Lake Charles, Louisiana, and we have two solar evaporation plants located in San Bernardino County, California, that produce liquid calcium chloride from underground brine reserves. All of our calcium chloride production facilities have a combined production capacity of more than 1.5 million equivalent liquid tons per year.
Our Fluids Division manufactures liquid calcium bromide, zinc bromide, zinc calcium bromide, and sodium bromide at our West Memphis, Arkansas facility. A patented and proprietary process utilized at this facility uses bromine and zinc to manufacture zinc bromide. This facility also uses proprietary processes to manufacture calcium bromide and sodium bromide and to recondition and upgrade used CBFs that we have repurchased from our customers.
See “Note P - Industry Segments and Geographic Information” in the Notes to Consolidated Financial
Statements for financial information about the Fluids Division.
Production Testing Division
Our Production Testing Division provides frac flowback services, early production facilities and services, production well testing services, offshore rig cooling, and other associated services. The Production Testing Division provides well flow management and evaluation services and data that enables operators to quantify reserves, optimize production, and minimize oil and gas reservoir damage. Early production services typically include sophisticated evaluation techniques for reservoir management, including unconventional shale reservoir exploitation and optimization of well workover programs. Frac flowback and production well testing services may include well control, well cleanup and laboratory analysis. These services are utilized in the completion process after fracking and in the production phase of oil and gas wells.
4
Our Production Testing Division maintains one of the largest fleets of high-pressure production testing equipment in the United States, including equipment designed to work in environments where high levels of hydrogen sulfide gas are present. The division has domestic operating locations in Colorado, Louisiana, North Dakota, Oklahoma, Pennsylvania, Texas, West Virginia, and Wyoming. Internationally, the division has locations in Argentina, Brazil, Canada, Kurdistan, Mexico, Saudi Arabia, and certain countries in Europe, Africa, and the Middle East. Production Testing operations in Canada are provided through Greywolf Production Systems and GPS Ltd. (together, "Greywolf").
Through our Optima Solutions Holdings Limited subsidiary ("OPTIMA"), the Production Testing Division is a
provider of offshore oil and gas rig cooling services and associated products that suppress heat generated by high rate flaring of hydrocarbons during offshore oil and gas well test operations.
See “Note P - Industry Segments and Geographic Information” in the Notes to Consolidated Financial
Statements for financial information about the Production Testing Division. Compression Division Our Compression Division is a provider of compression services and equipment for natural gas and oil
production, gathering, transportation, processing, and storage. The Compression Division fabricates and sells standard and custom designed compressor packages as well as oilfield fluid pump systems, and provides aftermarket services and compressor package parts and components manufactured by third-party suppliers. The Compression Division provides its compression services and equipment to a broad base of natural gas and oil exploration and production, midstream, transmission, and storage companies operating throughout many of the onshore producing regions of the United States as well as in a number of foreign countries, including Mexico, Canada, and Argentina.
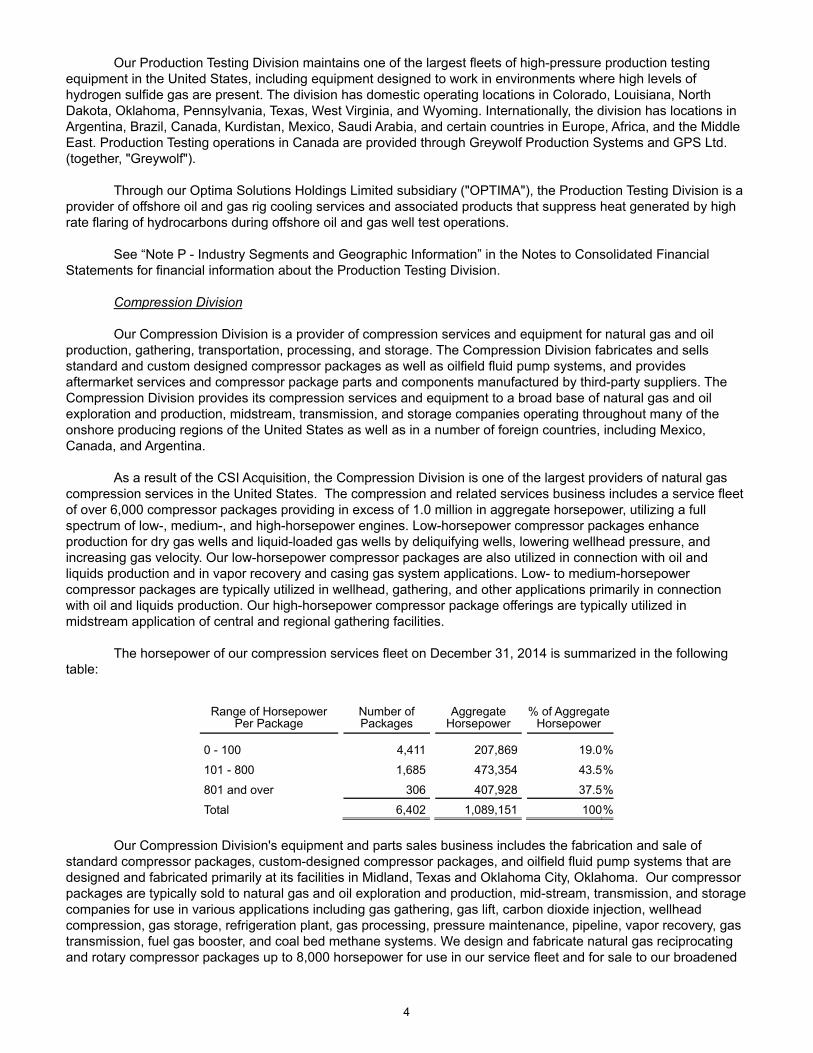
As a result of the CSI Acquisition, the Compression Division is one of the largest providers of natural gas compression services in the United States. The compression and related services business includes a service fleet of over 6,000 compressor packages providing in excess of 1.0 million in aggregate horsepower, utilizing a full spectrum of low-, medium-, and high-horsepower engines. Low-horsepower compressor packages enhance production for dry gas wells and liquid-loaded gas wells by deliquifying wells, lowering wellhead pressure, and increasing gas velocity. Our low-horsepower compressor packages are also utilized in connection with oil and liquids production and in vapor recovery and casing gas system applications. Low- to medium-horsepower compressor packages are typically utilized in wellhead, gathering, and other applications primarily in connection with oil and liquids production. Our high-horsepower compressor package offerings are typically utilized in midstream application of central and regional gathering facilities. The horsepower of our compression services fleet on December 31, 2014 is summarized in the following table:
Range of Horsepower Per Package
Number of Packages
Aggregate Horsepower
% of Aggregate Horsepower
0 - 100 4,411 207,869 19.0%
101 - 800 1,685 473,354 43.5%
801 and over 306 407,928 37.5%
Total 6,402 1,089,151 100%
Our Compression Division's equipment and parts sales business includes the fabrication and sale of standard compressor packages, custom-designed compressor packages, and oilfield fluid pump systems that are designed and fabricated primarily at its facilities in Midland, Texas and Oklahoma City, Oklahoma. Our compressor packages are typically sold to natural gas and oil exploration and production, mid-stream, transmission, and storage companies for use in various applications including gas gathering, gas lift, carbon dioxide injection, wellhead compression, gas storage, refrigeration plant, gas processing, pressure maintenance, pipeline, vapor recovery, gas transmission, fuel gas booster, and coal bed methane systems. We design and fabricate natural gas reciprocating and rotary compressor packages up to 8,000 horsepower for use in our service fleet and for sale to our broadened
5
customer base. Our pump systems can be utilized in numerous applications including oil production, transfer, and pipelines as well as water injection and disposal. The Compression Division's aftermarket services business provides a full-range of services to customers who own compression equipment. The services include: (i) the sale of parts and components and (ii) operation, maintenance, overhaul, and reconfiguration services, some of which are provided under turnkey engineering, procurement, and construction contracts. This business employs factory trained sales and support personnel in most of the major oil and natural gas producing basins in the United States to perform these services.
Virtually all of our Compression Division's operations are conducted through CCLP. As a result of the transactions by which we financed the CSI Acquisition, our ownership of CCLP was reduced from approximately 82% to approximately 44%. Through our wholly owned subsidiary, CSI Compressco GP Inc., we continue to manage and control CCLP, and accordingly, will continue to consolidate CCLP results of operation in our consolidated results of operation, despite the decreased ownership percentage in CCLP. As of December 31, 2014, common units held by the public represent approximately a 56% ownership interest in CCLP.
See “Note P - Industry Segments and Geographic Information” in the Notes to Consolidated Financial
Statements for financial information about the Compression Division. Offshore Division
Our Offshore Division consists of two operating segments: Offshore Services and Maritech. Offshore Services Segment. The Offshore Services segment provides: (1) downhole and subsea services
such as well plugging and abandonment, and workover services; (2) decommissioning and certain construction services utilizing heavy lift barges and various cutting technologies with regard to offshore oil and gas production platforms and pipelines; and (3) conventional and saturation diving services. We provide these services to offshore oil and gas operators, primarily in the U.S. Gulf of Mexico. We offer comprehensive, integrated services, including individualized engineering consultation and project management services.
In providing services, our Offshore Services segment utilizes rigless offshore plugging and abandonment
equipment packages, two heavy lift barges, several dive support vessels and other dive support assets that we own. In addition, we lease other assets from third parties and engage third-party contractors whenever necessary. The Offshore Services segment provides a wide variety of conventional and saturation diving services to its customers through its Epic Diving & Marine Services subsidiary ("Epic"). Well abandonment, decommissioning, diving, and certain construction services are performed primarily in the U.S. Gulf of Mexico. The Offshore Services segment provides offshore cutting services and tool rentals through its EOT Cutting Services ("EOT") subsidiary. The Offshore Services segment also utilizes specialized equipment and engineering expertise to address a variety of specific platform construction and decommissioning issues, including those associated with platforms that have been toppled or severely damaged by hurricanes and other windstorms. The Offshore Services segment provides services to major oil and gas companies and independent operators, including Maritech, through its facilities located in Broussard, Belle Chasse, Fourchon, and Houma, Louisiana.
Our Offshore Services segment’s fleet of service vessels has expanded and contracted in size in recent
years in response to changing demands for its services. With the TETRA Hedron, a 1,600-metric-ton heavy lift derrick barge, and the TETRA Arapaho, a 725-metric-ton heavy lift derrick barge, we perform heavy lift decommissioning and construction projects and integrated operations on oil and gas production platforms. The Offshore Services segment also performs contract diving operations, utilizing its owned dive service vessels, as well as vessels obtained under long- and short- term leases as needed. Diving services include saturation diving for up to 1,000 foot dive depths as well as mixed gas and surface diving for shallower dives.
Among other factors, demand for our Offshore Service segment’s operations in the U.S. Gulf of Mexico is
affected by federal regulations governing the abandonment and decommissioning of offshore wells, production platforms and pipelines, particularly following the April 2010 Macondo well oil spill. These regulations include Notice To Lessees 2010-G05: “Decommissioning Guidance for Wells and Platforms” (NTL 2010-G05, known as the “Idle Iron Guidance”). The Bureau of Safety and Environmental Enforcement ("BSEE") issues offshore permits, regulates offshore contractors, and oversees the provisions of the Idle Iron Guidance. The Idle Iron Guidance became effective October 15, 2010, and requires that operators perform and report decommissioning and abandonment plans and activities in accordance with BSEE requirements. The Idle Iron Guidance provides specific guidelines for
6
when an operator has to permanently plug and abandon wells and decommission platforms and related facilities after the occurrence of certain events, including the end of useful operations, cessation of commercial production and expiration of the lease.
Maritech Segment. The Maritech segment is a limited oil and gas production operation in the offshore U.S.
Gulf of Mexico. During 2011 and the first quarter of 2012, Maritech sold substantially all of its proved reserves. Maritech’s remaining operations consist primarily of the ongoing abandonment and decommissioning of its remaining offshore wells, facilities and production platforms. Maritech intends to acquire a significant portion of these services with regard to such assets that it operates from the Offshore Division’s Offshore Services segment.
The sales of substantially all of Maritech’s oil and gas producing properties during 2011 and 2012 have
essentially removed us from the oil and gas exploration and production business, and significantly all of Maritech’s oil and gas acquisition, development, and exploitation activities have ceased. Following these sales, Maritech’s remaining oil and gas reserves and production are negligible. Maritech’s operations consist primarily of the well abandonment and decommissioning of its remaining offshore oil and gas platforms and facilities. During the three year period ended December 31, 2014, Maritech spent approximately $271.8 million on such efforts. Approximately $54.3 million of Maritech decommissioning liabilities remain as of December 31, 2014, and approximately $12.8 million of this amount is planned to be performed during 2015, with the timing of a portion of this work being discretionary.
Maritech’s decommissioning liabilities are established based on what it estimates a third party would charge to plug and abandon the wells, decommission the pipelines and platforms, and clear the sites associated with its properties. We review the adequacy of Maritech’s decommissioning liabilities whenever indicators suggest that the estimated cash flows underlying the liabilities have changed materially. The timing and amounts of these cash flows are subject to changes in the energy industry environment and may result in additional liabilities being recorded. For a further discussion of Maritech’s adjustments to its decommissioning liabilities, see “Note H - Decommissioning and Other Asset Retirement Obligations” in the Notes to Consolidated Financial Statements.
See “Note P - Industry Segments and Geographic Information” in the Notes to Consolidated Financial
Statements for financial information about the Offshore Division.
Sources of Raw Materials Our Fluids Division manufactures calcium chloride, calcium bromide, zinc bromide, zinc calcium bromide,
and sodium bromide for sale to its customers. The Fluids Division also recycles used calcium bromide and zinc bromide CBFs repurchased from its oil and gas customers.
The Fluids Division manufactures liquid calcium chloride, either from underground brine reserves or by
reacting hydrochloric acid with limestone. The Fluids Division also purchases liquid and dry calcium chloride from a number of U.S. and foreign chemical manufacturers. Our El Dorado, Arkansas, plant produces liquid and flake calcium chloride, utilizing underground brine (tail brine) obtained from Chemtura Corporation ("Chemtura") that contains calcium chloride. We also produce calcium chloride at our two plants in San Bernardino County, California, by solar evaporation of pumped underground brine reserves that contain calcium chloride. The underground reserves of this brine are deemed adequate to supply our foreseeable need for calcium chloride at those plants.
The Fluids Division's primary sources of hydrochloric acid are co-product streams obtained from chemical
manufacturers. Substantial quantities of limestone are also consumed when converting hydrochloric acid into calcium chloride. Currently, hydrochloric acid and limestone are generally available from multiple sources.
To produce calcium bromide, zinc bromide, zinc calcium bromide, and sodium bromide at our West
Memphis, Arkansas, facility, we use bromine, hydrobromic acid, zinc, and lime as raw materials. There are multiple sources of zinc that we can use in the production of zinc bromide and zinc calcium bromide. We have a long-term supply agreement with Chemtura, under which the Fluids Division purchases its requirements of raw material bromine from Chemtura’s Arkansas bromine facilities. In addition, we have a long-term agreement with Chemtura under which Chemtura supplies the Fluids’ El Dorado, Arkansas, calcium chloride plant with raw material tail brine from its Arkansas bromine production facilities.
We also own a calcium bromide manufacturing plant near Magnolia, Arkansas that was constructed in
1985. This plant was acquired in 1988 and is not operable. We currently lease approximately 33,000 gross acres of
7
bromine-containing brine reserves in the vicinity of this plant. While this plant is designed to produce calcium bromide, it could be modified to produce elemental bromine or select bromine compounds. Development of the brine field, construction of necessary pipelines, and reconfiguration of the plant would require a substantial capital investment. The long-term Chemtura bromine supply agreement discussed above provides us with a secure supply of bromine to support the division’s current operations. We do, however, continue to evaluate our strategy related to the Magnolia, Arkansas, assets and their future development. Chemtura holds certain rights to participate in future development of the Magnolia, Arkansas assets.
The Fluids and Production Testing Divisions purchase their water management, production testing, and rig
cooling equipment and components from third-party manufacturers. CCLP designs and fabricates its reciprocating and rotary screw compressor packages and pumps with components obtained from third party suppliers. These components represent a significant portion of the cost of the compressor packages and pump systems. Some of the components used in the assembly of compressor packages, well monitoring, sand separation, production testing, and rig cooling equipment are obtained from a single supplier or a limited group of suppliers. We do not have long-term contracts with these suppliers or manufacturers. Should we experience unavailability of the components we use to assemble our equipment, we believe that there are adequate alternative suppliers and that any impact to us would not be severe. CCLP occasionally experiences long-lead times for components from suppliers and, therefore, may at times make purchases in anticipation of future orders.
Market Overview and Competition Fluids Division
Our Fluids Division provides its products and services to oil and gas exploration and production
companies in the United States and certain foreign markets. Current areas of market presence include the onshore U.S., the U.S. Gulf of Mexico, the North Sea, Mexico, and certain countries in South America, Europe, Asia, the Middle East, and Africa. Customers with deepwater operations frequently utilize high volumes of CBFs, which can be subject to harsh downhole conditions, such as high pressure and high temperatures. Demand for CBF products offshore is generally driven by completion activity.
During the past three years, a portion of the growth of the Fluids Division's U.S. operations has been due to
increased industry demand for onshore water management services in unconventional shale gas and oil reservoirs. The Fluids Division provides water management services to a wide range of onshore oil and gas operators located in the most significant domestic shale gas and oil reservoirs, including the Barnett, Cana Woodford, Eagle Ford, Fayetteville, Granite Wash, Haynesville, Marcellus, and Utica. The January 2014 acquisition of TD Water Transfer expanded the Fluids Division’s water management operations into the South Texas and North Dakota markets.
Our Fluids Division’s principal competitors in the sale of CBFs to the oil and gas industry are Baker Hughes,
Baroid, a subsidiary of Halliburton, and M-I Swaco, a subsidiary of Schlumberger. This market is highly competitive, and competition is based primarily on service, availability, and price. Major customers of the Fluids Division include Anadarko, BHP Billiton, Chesapeake, Devon, ENI Petroleum, Saudi ARAMCO, Shell, Southwestern Energy, Tullow, and TOTAL. The Fluids Division also sells its CBF products through various distributors. Competitors for the division’s water management services include large multinational providers as well as small, privately owned operators.
Our liquid and dry calcium chloride products have a wide range of uses outside the energy industry. Non-
energy market segments where these products are used include water treatment, industrial, food processing, road maintenance, ice melt, agricultural, and consumer products. We also sell sodium bromide into industrial water treatment markets as a biocide under the BioRid® tradename. Most of these markets are highly competitive. The Fluids Division’s European calcium chloride operations market our calcium chloride products to certain European markets. Our principal competitors in the non-energy related calcium chloride markets include Occidental Chemical Corporation and Vitro in North America, and Brunner Mond, Solvay, and NedMag in Europe. Production Testing Division
In certain gas producing basins, water, sand, and other abrasive materials commonly accompany the initial production of natural gas, often under high pressure and high temperature conditions and, in some cases, from reservoirs containing high levels of hydrogen sulfide gas. The division provides the specialized equipment and qualified personnel to address these impediments to production. The Production Testing Division also provides
8
certain services designed to accommodate the unique frac flowback and testing demands of shale gas reservoirs. During 2012, the Production Testing Division expanded its frac flowback and production testing equipment fleet, acquiring operations in new geographic markets to serve the rapidly growing demand for these services. Through Greywolf, the division serves the western Canada market. In addition, the Production Testing Division continues to serve the continuing demand for services associated with many of the domestic shale gas reservoirs, including the Bakken, Barnett, Cana Woodford, Eagle Ford, Fayetteville, Haynesville, Marcellus, and Niobrara. In addition, through our OPTIMA subsidiary, the Production Testing Division offers offshore oil and gas rig cooling services and associated products that suppress heat generated by high-rate flaring of hydrocarbons during offshore well test operations. OPTIMA primarily serves markets in the North Sea, Australia, and Asia-Pacific, the Middle East, and South America.
The U.S. and Canadian production testing markets are highly competitive, and competition is based on
availability of appropriate equipment and qualified personnel, as well as price, quality of service, and safety record. We believe that our skilled personnel, operating procedures, and safety record give us a competitive advantage in the marketplace. The Production Testing Division plans to continue growing its foreign operations in order to serve major oil and gas markets worldwide, both organically and through additional strategic acquisitions. Competition in onshore U.S. production testing markets is primarily dominated by numerous small, privately owned operators. Expro International, Halliburton, Schlumberger, and Weatherford are major competitors in the foreign markets we serve. The major customers for this division include BHP Billiton, Cabot, Carrizo Oil & Gas, Chesapeake, ConocoPhillips, Consol Energy, Encana, EP Energy, Halliburton, Noble Energy, Pioneer Natural Resources, Range Resources, Schlumberger, Shell Oil, Saudi ARAMCO, and other national oil companies in foreign countries.
Compression Division
The Compression Division provides its products and services to a broad base of natural gas and oil
exploration and production companies, as well as midstream, pipeline transmission, and storage companies, operating throughout many of the onshore producing regions of the United States. The Compression Division also has operations in Latin America and other foreign regions. While most of the Compression Division's services are performed throughout Texas, the San Juan Basin, the Rocky Mountain region, and the Mid-Continent region of the United States, we also have a presence in other U.S. producing regions. The Compression Division continues to seek opportunities to further expand its operations into other regions in the Western Hemisphere and elsewhere in the world.
The Division’s strategy is to compete on the basis of superior services at a competitive price. The
Compression Division believes that it is competitive because of the significant increases in the value of natural gas wells that result from the use of its services, its superior customer service, its highly trained field personnel, and the quality of the compressor packages we use to provide our services. The Compression Division’s major customers include Anadarko, BP, Cimarex Energy, ConocoPhillips, and DCP Midstream.
The compression services and fabrication business is highly competitive. The Compression Division experiences competition from companies that may be able to more quickly adapt to changes within our industry and changes in economic conditions as a whole, more readily take advantage of available opportunities and adopt more aggressive pricing policies. Primary competition for our low-horsepower compression services business comes from various local and regional companies that utilize packages consisting of a screw compressor with a separate engine driver or a reciprocating compressor with a separate engine driver. These local and regional competitors tend to compete with us on the basis of price rather than equipment specifications. Competition for our mid- and high-horsepower compression services business comes primarily from large national and multinational companies who may have greater financial resources than ours. Such competitors include Exterran, USA Compression, CDM Resource Management, J-W Power, and AXIP Energy Services. Our competition in the standard equipment market includes several large companies and a large number of small, regional fabricators, including some of those who we compete with for compression services, as well as AG Equipment Company, SEC Energy Products & Services, Enerflex, and others. The Compression Division's competition in the custom-designed market usually consists of larger companies with the ability to provide integrated projects and product support after the sale, including some of the competitors noted above. The ability to fabricate these large custom-designed packages at the Compression Division's facilities near the point of end-use of many customers is often a competitive advantage.
9
Offshore Division
Offshore Services Segment. Demand for the Offshore Services segment’s offshore well abandonment and decommissioning services in the Gulf of Mexico is primarily driven by the maturity and decline of producing fields, aging offshore platform infrastructure, damage to platforms and pipelines from hurricanes and other windstorms, and government regulations, among other factors. Demand for the Offshore Services segment’s construction and other services is driven by the general level of offshore activity of its customers, which is affected by oil and natural gas prices and government regulation. We believe that the enforcement of government regulations, including the Idle Iron Guidance, may accelerate the pace at which offshore Gulf of Mexico abandonment and decommissioning will be done in the future. The increased government focus on removing aging offshore platform infrastructure in the Gulf of Mexico has resulted in an increase in the number of wells to be plugged and abandoned, and platforms and pipelines to be decommissioned.
Offshore activities in the Gulf of Mexico are seasonal, with the majority of work occurring during the months
of April through October when weather conditions are most favorable. Critical factors required to compete in this market include, among other factors: (i) the proper equipment, including vessels and heavy lift barges; (ii) qualified, experienced personnel; (iii) technical expertise to address varying downhole, surface, and subsea conditions, particularly those related to damaged wells and platforms; and (iv) a comprehensive health, safety, and environmental program. Our Offshore Services segment's fleet of owned equipment includes two heavy lift derrick barges, the TETRA Hedron, which has a 1,600-metric-ton lift capacity, fully revolving crane, and the TETRA Arapaho, which has a 725-metric-ton lift capacity. We believe that the integrated services that we offer and our vessel and equipment fleets satisfy current market requirements in the Gulf of Mexico and allow us to successfully compete in that market.
The Offshore Services segment markets its services primarily to major oil and gas companies and
independent operators. The Offshore Services segment’s most significant customer during the past three years has been Maritech; however, the amount of work performed for Maritech has been reduced and the amount of work to be performed in the future for Maritech is expected to continue to decline. Other major customers include Chevron, Fieldwood, McMoRan, Nexen, Shell and Williams. The Offshore Services segment’s services are performed primarily in the U.S. Gulf of Mexico, however, the segment is also seeking to expand its operations to international markets. Our principal competitors in the U.S. Gulf of Mexico market are Bisso, Cal Dive International, Inc., Express Energy, Harkand, Oceaneering, Offshore Specialty Fabricators, Inc. and Superior Energy Services, Inc. This market is highly competitive, and competition is based primarily on service, equipment availability, safety record, and price. Other Business Matters Marketing and Distribution
The Fluids Division markets its CBF products through its distribution facilities located in the U.S. Gulf Coast
region, the North Sea region of Europe, and certain other foreign markets, including Brazil, West Africa, and the Middle East.
Non-oilfield calcium chloride products are also marketed through the Fluids Division’ sales offices in
California, Missouri, Pennsylvania, and Texas, as well as through a network of distributors in the United States and northern and central Europe. In addition to production facilities in the United States and Finland, the division has distribution facilities strategically located to provide efficient product distribution.
No single customer provided 10% or more of our total consolidated revenues during the year ended
December 31, 2014.
Backlog The Compression Division’s equipment and parts sales business includes the fabrication and sale of
standard compressor packages, custom-designed compressor packages, and oilfield fluid pump systems that are fabricated to customer specifications and standard specifications, as applicable. Our custom designed compressor packages are typically greater in size and scope than standard fabrication packages, requiring more labor, materials, and overhead resources. Our fabrication and sales business requires diligent planning of those resources and project and backlog management in order to meet the customer's desired delivery dates and performance criteria, and achieve fabrication efficiencies. As of December 31, 2014, Compression Division's fabrication and
10
sales backlog was approximately $120.0 million. This fabrication and sales backlog consists of firm customer orders for which a purchase or work order has been received, satisfactory credit or financing arrangements exist, and delivery has been scheduled. Our fabrication and sales backlog is a measure of marketing effectiveness that allows us to plan future labor and raw material needs and measure our success in winning bids from our customers. Excluding these Compression Division operations, our products and services either are not sold under long-term contracts or do not require long lead times to procure or deliver.
Employees
As of December 31, 2014, we had approximately 3,800 employees. None of our U.S. employees are
presently covered by a collective bargaining agreement other than the eight employees of our Lake Charles, Louisiana, calcium chloride production facility, who are represented by the United Steelworkers Union. Our foreign employees are generally members of labor unions and associations in the countries in which we operate. We believe that our relations with our employees are good.
Patents, Proprietary Technology and Trademarks
As of December 31, 2014, we owned or licensed thirty-five (35) issued U.S. patents and had sixteen (16)
patent applications pending in the United States. We also had thirty-nine (39) owned or licensed foreign patents and thirty-four (34) foreign patent applications pending in various other countries. The foreign patents and patent applications are primarily foreign counterparts to U.S. patents or patent applications. The issued patents expire at various times through 2032. We have elected to maintain certain other internally developed technologies, know-how, and inventions as trade secrets. While we believe that our patents and trade secrets are important to our competitive positions in our businesses, we do not believe any one patent or trade secret is essential to our success.
It is our practice to enter into confidentiality agreements with key employees, consultants, and third parties
to whom we disclose our confidential and proprietary information, and we have typical policies and procedures designed to maintain the confidentiality of such information. There can be no assurance, however, that these measures will prevent the unauthorized disclosure or use of our trade secrets and expertise, or that others may not independently develop similar trade secrets or expertise.
We sell various products and services under a variety of trademarks and service marks, some of which are
registered in the United States or other countries.
Health, Safety, and Environmental Affairs Regulations We believe that our service and sales operations and manufacturing plants are in substantial compliance
with all applicable U.S. and foreign health, safety, and environmental laws and regulations. We are committed to conducting all of our operations under the highest standards of safety and respect for the environment. However, risks of substantial costs and liabilities are inherent in certain of our operations and in the development and handling of certain products and equipment produced or used at our plants, well locations, and worksites. Because of these risks, there can be no assurance that significant costs and liabilities will not be incurred in the future. Changes in environmental and health and safety regulations could subject us to more rigorous standards. We cannot predict the extent to which our operations may be affected by future regulatory and enforcement policies.
We are subject to various federal, state, local, and foreign laws and regulations relating to health, safety,
and the environment, including regulations regarding air emissions, wastewater and storm water discharges, and the disposal of certain hazardous and nonhazardous wastes. Compliance with laws and regulations may expose us to significant costs and liabilities, and cause us to incur significant capital expenditures in our operations. Failure to comply with these laws and regulations or associated permits may result in the assessment of fines and penalties and the imposition of other obligations.
Our operations in the United States are subject to various evolving environmental laws and regulations that
are enforced by the U.S. Environmental Protection Agency ("EPA"); the BSEE of the U.S. Department of the Interior; the U.S. Coast Guard; and various other federal, state, and local environmental authorities. Similar laws and regulations, designed to protect the health and safety of our employees and visitors to our facilities, are enforced by the U.S. Occupational Safety and Health Administration, and other state and local agencies and authorities. Specific environmental laws and regulations applicable to our operations include: (i) the Federal Water

11
Pollution Control Act of 1972; (ii) the Resource Conservation and Recovery Act of 1976; (iii) the Clean Air Act of 1977; (iv) the Comprehensive Environmental Response, Compensation and Liability Act of 1980 ("CERCLA"); (v) the Superfund Amendments and Reauthorization Act of 1986; (vi) the Federal Insecticide, Fungicide, and Rodenticide Act of 1947; (vii) the Toxic Substances Control Act of 1976; (viii) the Hazardous Materials Transportation Act of 1975; (ix) and the Pollution Prevention Act of 1990. Our operations outside the United States are subject to various foreign governmental laws and regulations relating to the environment, health and safety, and other regulated activities in the countries in which we operate.
The EPA has determined that greenhouse gases present an endangerment to public health and the
environment, because, according to the EPA, they contribute to global warming and climate change. As a result, the EPA has begun to regulate certain sources of greenhouse gases, including air emissions associated with oil and gas production particularly as they relate to the hydraulic fracturing of natural gas wells. In addition, the EPA has issued regulations requiring the reporting of greenhouse gas emissions from certain sources which include onshore and offshore oil and natural gas production facilities and onshore oil and gas processing, transmission, storage, and distribution facilities. Reporting of greenhouse gas emissions from such facilities is required on an annual basis. The EPA’s rules relating to emissions of greenhouse gases from large stationary sources of emissions are currently subject to a number of legal challenges, but the federal courts have thus far declined to issue any injunctions to prevent the EPA or state environmental agencies from implementing the rules. Further, Congress has considered, and almost one-half of the states have adopted, legislation that seeks to control or reduce emissions of greenhouse gases from a wide range of sources. Offshore Operations
During the past four years, several Notices to Lessees ("NTLs"), Safety and Environmental Management Systems ("SEMS") regulations, and other safety regulations implementing additional safety and certification requirements applicable to offshore activities in the Gulf of Mexico were issued. These NTLs and SEMS regulations include requirements by operators to:
• submit well blowout prevention measures and contingency plans, including demonstrating access to subsea blowout containment resources;
• abide by new permitting standards requiring detailed, independently certified descriptions of well design, casing, and cementing;
• follow new performance-based standards for offshore drilling and production operations • enhance the safety of operations by reducing the frequency and severity of accidents; and • certify that the operator has complied with all regulations.
The “Idle Iron Guidance” regulations, which were adopted in 2010 and govern the plugging, abandonment,
and decommissioning of U.S. Gulf of Mexico offshore wells and production platforms, are overseen by BSEE. This agency's scope of responsibility includes maintaining an investigation and review unit, providing for public forums, conducting comprehensive environmental analyses, and creating implementation teams to analyze various aspects of the regulatory structure and to help implement the reform agenda.
We maintain various types of insurance intended to reimburse certain costs in the event of an explosion or
similar event involving our offshore operations. Our insurance program is reviewed not less than annually with our insurance brokers and underwriters. As part of our insurance program for offshore operations, we maintain general liability and protection and indemnity policies that provide third-party liability coverage, up to applicable policy limits, for risks of an accidental nature, including but not limited to death and personal injury, collision, damage to fixed and floating objects, pollution, and wreck removal. We also maintain a vessel pollution liability policy that provides coverage for oil or hazardous substance pollution emanating from a vessel, addressing both Oil Pollution Act of 1990 ("OPA") and CERCLA obligations. This policy also provides coverage for cost of defense, fines, and penalties.
We provide services and products to customers in the Gulf of Mexico, generally pursuant to written master
services agreements that create insurance and indemnity obligations for both parties. If there was an explosion or similar catastrophic event on an offshore location where we are providing services and products, under the majority of our master services agreements with our customers:
(1) We would be required to indemnify our customer for any claims for injury, death, or property loss or
destruction made against them by us or our subcontractors or our subcontractor’s employees. The
12
customer would be required to indemnify us for any claims for injury, death, or property loss or destruction made against us by the customer or its other subcontractors or the employees of the customer or its other subcontractors. These indemnities are intended to apply regardless of the cause of such claims, including but not limited to, the negligence of the indemnified party. Our insurance is structured to cover the cost of defense and any resulting liability from all indemnified claims, up to policy limits.
(2) The customer would be required to indemnify us for all claims for injury, death, or property loss or
destruction made against us by a third party that arise out of the catastrophic event, regardless of the cause of such claims, including but not limited to, our negligence or our subcontractors’ negligence. Our insurance is structured to cover the cost of defense and any resulting liability from all such claims; however, our insurance would be applicable to the claim only if the customer defaulted or otherwise breached its indemnity obligations to us.
(3) The customer would be required to indemnify us for all claims made against us for environmental
pollution or contamination that arise out of the catastrophic event, regardless of the cause of such claims, including our negligence or the negligence of our subcontractors. Our insurance is structured to cover the cost of defense and any resulting liability from all such claims; however, our insurance would be applicable to the claim only if the customer defaulted or otherwise breached its indemnity obligations to us.
Following the 2011 and 2012 sales of substantially all of Maritech’s offshore producing properties, we no
longer participate in offshore drilling activities. However, Maritech and our Offshore Services segment engage contractors to provide well abandonment and related services and products on Maritech’s remaining offshore oil and gas production platforms and associated wells, generally pursuant to written master services agreements that create insurance and indemnity obligations for both parties. If there was an environmental event on an offshore Maritech location where a Maritech contractor was providing services and products, under a majority of Maritech’s master services agreements with its contractors, Maritech would be required to indemnify its contractor for any claims against the contractor for injury, death, or property loss or destruction brought by Maritech, its other subcontractors or its or their respective employees. The contractor would be required to indemnify Maritech for any claims for injury, death, or property loss or destruction made against Maritech by the contractor or its subcontractors or the employees of the contractor or its subcontractors. These indemnities would apply regardless of the cause of such claims, including the negligence of the indemnified party. Maritech’s insurance is structured to cover the cost of defense and any resulting liability from all indemnified claims, up to policy limits.
In accordance with applicable regulations, Maritech maintains an oil spill response plan with the BSEE and
has designated contractors who are trained as qualified individuals and are prepared to coordinate a response to any spill or leak. Maritech also has contracts in place to assure that a complete and experienced resource team is available as required. Item 1A. Risk Factors. Certain Business Risks
Although it is not possible to identify all of the risks we encounter, we have identified the following
significant risk factors that could affect our actual results and cause actual results to differ materially from any such results that might be projected, forecasted, or estimated by us in this report.
Market Risks
The demand and prices for our products and services are affected by several factors, including the supply,
demand, and prices for oil and natural gas. Demand for our products and services is materially dependent on the supply, demand, and prices for oil,
natural gas, and competing energy sources, and is more specifically dependent on the supply, demand, and prices for the products and services we offer, both in the United States and in the foreign countries in which we operate. These factors are also influenced by the U.S., foreign, and regional economic, financial, business, political, and social conditions within the markets we serve. Oil and gas prices and, therefore, the levels of well drilling, completion, workover, and production activities, tend to fluctuate. Worldwide economic and political events,
13
including initiatives by the Organization of Petroleum Exporting Countries and increasing or decreasing demand in other large world economies as well as tremendous growth in natural gas supplies in the U.S. from shale reserves, have contributed to, and are likely to continue to contribute to, price volatility. The expansion of alternative energy supplies that compete with oil and gas, improvements in energy conservation, and improvements in the energy efficiency of vehicles, plants, equipment, and devices will also reduce oil and gas consumption or slow its growth.
During 2014, West Texas Intermediate oil prices ranged from a high of $107.50 per barrel in June 2014 to a
low of $52.44 per barrel in December 2014. U.S. natural gas prices were volatile in 2014, with Henry Hub prices ranging from a high of $6.49 per million British thermal units (“MMBtu”) in February 2014 to a low of $2.88 per MMBtu in December 2014. Low oil and natural gas prices have negatively affected the operating cash flows and exploration and development activities and plans of many of our customers and could continue to have a negative impact on the demand for many of our products and services.
If economic conditions or energy prices further deteriorate, there may be additional constraints on oil and
gas industry spending levels. Reduced spending levels would negatively impact the demand for many of our products and services and the prices we charge for these products and services, which would negatively affect our revenues and future growth.
During times when oil or natural gas prices are low, many of our customers are more likely to experience a
downturn in their financial condition. Poor economic conditions may also lead to additional constraints on the operating cash flows of our customers, potentially impacting their ability to pay us in a timely manner, which could result in increased customer bankruptcies and uncollectible receivables.
We encounter, and expect to continue to encounter, intense competition in the sale of our products and services.
We compete with numerous companies in each of our operating segments, many of which have
substantially greater financial and other resources than we have. Certain of our competitors have lower standards of quality and older equipment and safety, and offer services at lower prices than we do. Other competitors have newer equipment that is better suited to our customers' needs. To the extent competitors offer products or services at lower prices or higher quality, or more cost-effective products or services, our business could be materially and adversely affected. In addition, certain of our customers may elect to perform services internally in lieu of using our services, which could also materially and adversely affect our operations.
The profitability of our operations is dependent on other numerous factors beyond our control. Our operating results in general, and gross profit in particular, are determined by market conditions and the
products and services we sell in any period. Other factors, such as heightened competition, changes in sales and distribution channels, availability of skilled labor and contract services, shortages in raw materials, or inability to obtain supplies at reasonable prices, may also affect the cost of sales and the fluctuation of gross margin in future periods.
Other factors affecting our operating results and activity levels include oil and natural gas industry spending
levels for exploration and production, development, and acquisition activities and plugging, abandonment, and decommissioning costs on Maritech’s remaining offshore production platforms, wells, and pipelines. Several of our customers have publicly announced reductions in their capital expenditure plans in light of the recent decline in the prices of oil and natural gas and such reductions are expected to affect the demand for many of our products and services, which is expected to negatively affect our revenues and results of operations. A large concentration of our operating activities is located in the onshore and offshore U.S. Gulf Coast region. Our revenues and profitability are particularly dependent upon oil and natural gas industry activity and spending levels in this region. Our operations may also be affected by technological advances, cost of capital, and tax policies. Adverse changes in any of these other factors may have a material adverse effect on our revenues and profitability.
The demand for our products and services in the U.S. Gulf of Mexico could continue to be adversely
impacted by increased regulation and continuing regulatory uncertainty. Operations in the U.S. Gulf of Mexico have been subject to an increasingly stringent regulatory environment
including government regulations focused on offshore operating requirements, spill cleanup, and enforcement matters. These regulations also implement additional safety and certification requirements applicable to offshore
14
activities in the U.S. Gulf of Mexico. Demand for our products and services in the U.S. Gulf of Mexico continues to be affected by these regulations. Future regulatory requirements could delay our customers’ activities, reduce our revenues, and increase our operating costs, including the cost to insure offshore operations, resulting in reduced cash flows and profitability.
We are dependent on third-party suppliers for specific products and equipment necessary to provide certain
of our products and services. We sell a variety of clear brine fluids to the oil and gas industry and non-energy markets, including calcium
chloride, calcium bromide, zinc bromide, zinc calcium bromide, sodium bromide, and formate-based brines, some of which we manufacture and some of which are purchased from third parties. Sales of these compound products contribute significantly to our revenues. In our manufacture of calcium chloride, we use brines, hydrochloric acid, and other raw materials purchased from third parties. In our manufacture of bromide compound products, we use elemental bromine, hydrobromic acid, and other raw materials which are purchased from third parties. We rely on Chemtura Corporation as a supplier of raw materials for our bromide compound products as well as for our El Dorado, Arkansas, calcium chloride plant. Although we have long-term supply agreements with Chemtura, if we were unable to acquire these raw materials at reasonable prices for a prolonged period, our business could be materially and adversely affected.
Some of the well plugging, abandonment, and decommissioning services performed by our Offshore
Services segment require the use of vessels, diving, cutting, and other equipment and services provided by third parties. We lease equipment and obtain services from certain providers, and there can be no assurance that this equipment and these services will be available at reasonable prices in the future.
The fabrication of our compression packages, pump systems, and production testing, well monitoring, and
rig cooling equipment requires the purchase of many types of components, some of which we obtain from a single source or a limited group of suppliers. Our reliance on these suppliers exposes us to the risk of price increases, inferior component quality, or an inability to obtain an adequate supply of required components in a timely manner. The profitability or future growth of our Compression and Production Testing Divisions may be adversely affected due to our dependence on these key suppliers.
Further changes in the economic environment could result in significant impairments of certain of our long-lived assets and goodwill.
During the fourth quarter of 2014, primarily as a result of the significant decrease in oil and natural gas
prices and also as part of the goodwill impairment process for our Production Testing and Offshore Services reporting units, we recorded certain consolidated long-lived asset impairments of approximately $34.8 million. Further changes in the economic environment could result in decreased demand for many of our products and services, which could impact the expected utilization rates of certain of our long-lived assets, including plant facilities, operating locations, barges and vessels, and other operating equipment. Under generally accepted accounting principles, we review the carrying value of our long-lived assets when events or changes in circumstances indicate that the carrying value of these assets may not be recoverable, based on their expected future cash flows. The impact of reduced expected future cash flow could require the write-down of all or a portion of the carrying value for these assets, which would result in an impairment charge to earnings, resulting in increased earnings volatility.
Due to decreases in our stock price and the expected future cash flows from certain of our reporting units,
we recorded approximately $64.3 million of goodwill impairments during the fourth quarter of 2014. Under generally accepted accounting principles, we review the carrying value of our goodwill for possible impairment annually or when events or changes in circumstances indicate the carrying value may not be recoverable. Changes in circumstances indicating the carrying value of our goodwill may not be recoverable include a decline in our stock price or future cash flows and slower growth rates in our industry. If economic and market conditions decline further, we may be required to record additional charges to earnings during the period in which any impairment of our goodwill is determined, resulting in a negative impact on our results of operations.

15
Our success depends upon the continued contributions of our personnel, many of whom would be difficult to replace, and the continued ability to attract new employees.
Our success depends on our ability to attract, train, and retain skilled management and employees at
reasonable compensation levels. The delivery of our products and services requires personnel with specialized skills and experience. In addition, our ability to expand our operations depends in part on our ability to increase the size of our skilled labor force. The demand for skilled managers and workers in the U.S. Gulf Coast region and other regions in which we operate is high and the supply is limited. A lack of qualified personnel, could adversely affect operating results.
The majority of our business in Mexico is performed for Petróleos Mexicanos (PEMEX), and any cutbacks
by the Mexican Government on PEMEX’s annual spending budget or security disruptions in Mexico could adversely affect our business, financial condition, results of operations, and cash flows.
The majority of our business in Mexico is performed for PEMEX. For the twelve months ended December
31, 2014, PEMEX accounted for approximately 4.0% of our consolidated revenues. No work or services are guaranteed to be ordered by PEMEX under our contracts with PEMEX, which typically range from six months to two years in length. PEMEX is a decentralized public entity of the Mexican Government, and, therefore, the Mexican Government controls PEMEX, as well as its annual budget, which is approved by the Mexican Congress. The Mexican Government may cut spending in the future. Additionally, at the expiration of our current contracts, we may be required to participate in an open auction to renew them.
During the past several years, incidents of security disruptions in many regions of Mexico have increased, including drug-related gang activity. Certain incidents of violence have occurred in regions served by us and have resulted in the interruption of our operations. These interruptions could continue or increase in the future. To the extent that such security disruptions continue or increase, our operations will continue to be affected, and the levels of revenue and operating cash flow from our operations in Mexico could be reduced.
Operating, Technological, and Strategic Risks
We have technological and age-obsolescence risk, both with our products and services as well as with our
equipment assets. New drilling, completion, and production technologies and equipment are constantly evolving. If we are
unable to adapt to new advances in technology or replace older assets with new assets, we are at risk of losing customers and market share. In particular, many of our significant equipment assets, including one of our heavy lift barges and certain dive support vessels, are approaching the end of their useful lives, which may adversely affect our ability to serve certain customers. Other equipment, such as a portion of our production testing equipment fleet, may be inadequate to meet the needs of our customers in certain markets. The permanent replacement or upgrade of any of our vessels or equipment will require significant capital. Due to the unique nature of many of these assets, finding a suitable or acceptable replacement may be difficult and/or cost prohibitive. The replacement or enhancement of these assets over the next several years may be necessary in order for us to effectively compete in the current marketplace.
We face risks related to our growth strategy. Our growth strategy includes both internal growth and growth through acquisitions. Internal growth may
require significant capital expenditures, some of which may become unrecoverable or fail to generate an acceptable level of cash flows. Internal growth also requires financial resources (including the use of available cash or additional long-term debt) and management and personnel resources. Acquisitions also require significant management resources, both at the time of the transaction and during the process of integrating the newly acquired business into our operations. If we overextend our current financial resources by growing too aggressively, we could face liquidity problems or have difficulty obtaining additional financing. Acquisitions could adversely affect our operations if we are unable to successfully integrate the newly acquired companies into our operations, are unable to hire adequate personnel, or are unable to retain existing personnel. We may not be able to consummate future acquisitions on favorable terms. Acquisition or internal growth assumptions developed to support our decisions could prove to be overly optimistic. Future acquisitions by us could result in issuances of equity securities, or the rights associated with the equity securities, which could potentially dilute earnings per share. Future acquisitions
16
could result in the incurrence of additional debt or contingent liabilities and amortization expenses related to intangible assets. These factors could adversely affect our future operating results and financial position.
We may not have accurately estimated the benefits to be realized from the CSI Acquisition. The expected benefits to our Compression Division from the CSI Acquisition may not be realized if our estimates of the potential net cash flows associated with CSI's assets are materially inaccurate or if we failed to identify operating problems or liabilities in our due diligence prior to closing. We performed an inspection of the assets to be acquired, which we believe to be generally consistent with industry practices. However, the accuracy of our assessments of the assets and our estimates are inherently uncertain. There could also be environmental or other problems that are not necessarily observable even when the inspection is undertaken. If problems are identified after closing of the CSI Acquisition, the stock purchase agreement provides for limited recourse against the seller. In addition, our estimate of the required working capital for the CSI business and targeted working capital set forth in the stock purchase agreement may not be sufficient for actual working capital needs of the CSI business. If our estimate and the targeted working capital were lower than the actual needs of the acquired business, the Compression Division may be required to fund such additional working capital needs out of its operating cash flows or borrowings under the CCLP Credit Agreement. The CSI Acquisition has substantially expanded the scope and size of our Compression Division's business, with larger manufacturing and unit sales and aftermarket service operations. Additionally, CSI’s business includes operations and equipment that we have not historically provided. Consequently, we may not be able to integrate CSI’s operations into our Compression Division's operations or to realize the expected economic benefits of the CSI Acquisition.
Our operations involve significant operating risks and insurance coverage may not be available or cost-effective.
We are subject to operating hazards normally associated with the oilfield service industry, including
automobile accidents, fires, explosions, blowouts, formation collapse, mechanical problems, abnormally pressured formations, and environmental accidents. Environmental accidents could include, but are not limited to oil spills, gas leaks or ruptures, uncontrollable flows of oil, gas, or well fluids, or discharges of CBFs or toxic gases or other pollutants. These operating hazards may also include injuries to employees and third parties during the performance of our operations. Our operation of marine barges and vessels, heavy equipment, offshore production platforms, chemical manufacturing plants, and the performance of heavy lift and diving services involve particularly high levels of risk. In addition, certain of our employees who perform services on offshore platforms and vessels are covered by the provisions of the Jones Act, the Death on the High Seas Act, and general maritime law. These laws make the liability limits established by state workers’ compensation laws inapplicable to these employees and, instead, permit our affected employees or their representatives to pursue actions against us for damages for job-related injuries. Whenever possible, we obtain agreements from customers and suppliers that limit our exposure. However, the occurrence of certain operating hazards, including storms, could result in substantial losses to us due to injury or loss of life, damage to or destruction of property and equipment, pollution or environmental damage, and suspension of operations.
We have maintained a policy of insuring our risks of operational hazards that we believe is typical in the
industry. We believe that the limits of insurance coverage we have purchased are consistent with the exposures we face and the nature of our products and services. Due to economic conditions in the insurance industry, from time to time, we have increased our self-insured retentions for certain policies in order to minimize the increased costs of coverage or we have reduced our limits of insurance coverage for, or not procured, named windstorm coverage. In certain areas of our business, we, from time to time, have elected to assume the risk of loss for specific assets. Due to the sale of substantially all of Maritech's oil and gas properties, typical operational risk coverage for its remaining properties, such as removal of debris, operators extra expense, control of well, and pollution and cleanup coverage, is not available at economical rates. To the extent we suffer losses or claims that are not covered, or are only partially covered by insurance, our results of operations could be adversely affected.
We could incur losses on fixed price contracts. Due to competitive market conditions, a portion of our well abandonment and decommissioning projects
may be performed on a lump sum basis. Pursuant to these types of contracts, defined work is delivered for a fixed price, and extra work, which is subject to customer approval, is charged separately. The revenue, cost, and gross profit realized on these types of contracts can vary from the estimated amount because of changes in offshore conditions, increases in the scope of the work to be performed, increased site clearance efforts required, labor and

17
equipment availability, cost and productivity levels, and the performance level of other contractors. In addition, unanticipated events, such as accidents, work delays, significant changes in the condition of platforms or wells, downhole problems, weather, and environmental or other technical issues, could result in significant losses on these types of projects. These variations and risks may result in our experiencing reduced profitability or losses on these types of projects.
The valuation of decommissioning liabilities is based on estimated data that may be materially incorrect. Our estimates of future well abandonment and decommissioning liabilities are imprecise and are subject to
change due to: (i) changes in the forecasts of the supply, demand, cost and timing of well abandonment and decommissioning services; (ii) additional remediation work required on previously completed well abandonment projects; (iii) damage to wells and infrastructure caused by hurricanes and other natural events; (iv) changes in governmental regulations governing well abandonment and decommissioning work; and (v) other factors. In particular, a portion of the remaining decommissioning liabilities for our Maritech subsidiary relates to offshore production platforms that were toppled and destroyed by hurricanes and the estimates to perform the remaining decommissioning and debris removal work on these properties is particularly imprecise due to the unique nature of the work to be performed for each affected property. During 2014, Maritech increased its combined decommissioning liability by a total of approximately $74.4 million, consisting of $35.2 million of revisions to its existing liabilities as well as $39.2 million from adding new liabilities for remediation work required on projects previously thought to have been completed.
During 2014, Maritech adjusted its existing decommissioning liabilities, increasing them by approximately
$35.2 million, either for work performed during the year or related to adjusted estimates of the cost of future work to be performed. This adjustment was directly charged to earnings as an operating expense during 2014. If the actual cost of future abandonment and decommissioning work is materially greater than our current estimates, such additional costs could have an adverse effect on future earnings.
As noted above, Maritech has encountered situations where previously plugged and abandoned wells on its properties have later exhibited a build-up of pressure that is evidenced by gas bubbles coming from the plugged well head. We refer to this situation as “wells under pressure” and this can either be discovered by us when we perform additional work at the property or by notification from a third party. Wells under pressure require Maritech to return to the site to perform additional plug and abandonment procedures that were not originally anticipated or included in the estimate of the asset retirement obligation for such property. Remediation work at previously abandoned well sites is particularly costly due to the lack of a platform from which to base these activities. During 2014, Maritech added new decommissioning liabilities of approximately $39.2 million for work performed during the year or related to the estimated cost of future work to be performed on previously plugged and abandoned wells. This additional amount was directly charged to earnings as an operating expense during 2014. Maritech is the last operator of record for its plugged wells and bears the risk of additional future work required as a result of wells becoming under pressure in the future.
Weather-Related Risks
Certain of our operations are seasonal and depend, in part, on weather conditions. The Offshore Division's Offshore Services segment has historically enjoyed its highest vessel utilization
rates during the period from April to October, when weather conditions are typically more favorable for offshore activities, and has experienced its lowest utilization rates in the period from November to March. Under certain lump sum and other contracts, this segment may bear the risk of delays caused by adverse weather conditions. In addition, demand for other products and services we provide are subject to seasonal fluctuations, due in part to weather conditions that cannot be predicted. Accordingly, our operating results may vary from quarter to quarter, depending on weather conditions in applicable areas.
In certain markets, the Fluids Division’s onshore water management services can be dependent on
adequate water supplies being available to its customers. To the extent severe drought or other weather-related conditions prevent our customers from obtaining needed water, frac water operations may not be possible, and our Fluids Division business may be negatively affected.
18
Severe weather, including named windstorms, can cause significant damage and disruption to our businesses.
A significant portion of our operations is susceptible to adverse weather conditions in the Gulf of Mexico,
including hurricanes and other extreme weather conditions. High winds, storm surge, and turbulent seas can cause significant damage and curtail our operations for extended periods during and after such weather conditions, while damage is being assessed and remediated. Even if we do not experience direct damage from storms, we may experience disruptions in our operations because we are unable to operate or our customers or suppliers may curtail their activities due to damage to their wells, platforms, pipelines, and facilities. From time to time, our onshore operations are also negatively affected by adverse weather conditions, including sustained rain and flooding.
A portion of the costs resulting from damages from previous hurricanes has yet to be incurred and may
result in significant charges to earnings. During the past four years, Maritech has performed an extensive amount of well intervention,
abandonment, decommissioning, debris removal, and platform construction associated with its offshore platforms that were destroyed by hurricanes. As of December 31, 2014, Maritech has remaining hurricane damage response work associated with one of the downed platforms, and the estimated cost to perform this remaining abandonment, decommissioning, and debris removal work is approximately $8.7 million net to our interest. Due to the unique nature of the remaining work to be performed, actual costs could greatly exceed these estimates and, depending on the nature of any excess costs incurred, could result in significant charges to earnings in future periods. All of this $8.7 million estimated amount has been accrued as part of Maritech’s decommissioning liabilities. Our estimates of the remaining costs to be incurred may be imprecise.
For a further discussion of the remaining costs resulting from damages from the 2005 and 2008 hurricanes,
see Notes to Consolidated Financial Statements, “Note B – Summary of Significant Accounting Policies, Repair Costs and Insurance Recoveries.”
We have elected to self-insure windstorm damage to our remaining Maritech assets in the Gulf of Mexico,
and hurricane damages could result in significant uninsured losses. Despite the sales of substantially all of Maritech’s oil and gas reserves during 2011 and 2012, and
expending approximately $63.3 million of decommissioning work during 2014, we have remaining decommissioning liabilities of approximately $54.3 million associated with offshore platforms and associated wells to be decommissioned and abandoned. We have discontinued insurance coverage for windstorm damage and have elected to self-insure these risks. To the extent the remaining offshore platforms and associated wells are not decommissioned and abandoned prior to a windstorm occurring, Maritech would be exposed to losses from windstorm damages and storms in the future. Depending on the severity and location of the storms, such losses could be significant and could have a material adverse effect on our financial position, results of operation, and cash flows. Financial Risks
Deterioration of our financial ratios could result in covenant defaults under our long-term debt agreements and result in decreased credit availability.
As of December 31, 2014, our total debt outstanding of approximately $395.1 million consisted of
approximately $90.0 million under our bank revolving credit agreement (the "Credit Agreement") and approximately $305.0 million of our Senior Notes. In addition, our consolidated balance sheet includes approximately $540.0 million of long-term debt of CCLP (consisting of approximately $195.0 million under the CCLP Credit Agreement and approximately $345.0 million carrying amount under the CCLP Senior Notes). Additional growth could result in increased debt levels to support our or CCLP's capital expenditure needs or acquisition activities. Debt service costs related to outstanding long-term debt represent a significant use of our operating cash flow and could increase our vulnerability to general adverse economic and industry conditions.
These long-term debt agreements contain customary covenants and other restrictions and requirements. In
addition, the agreements require us to maintain certain financial ratios, including a minimum interest charge coverage ratio and a maximum leverage ratio, both of which are defined in our Credit Agreement and in the note
19
purchase agreements relating to our Senior Notes. Deterioration of these ratios could result in a default under the agreements. These agreements also include cross-default provisions relating to any other indebtedness we have that is greater than a defined amount. If any such indebtedness is not paid or is accelerated and such event is not remedied in a timely manner, a default will occur under our long-term debt agreements. Any event of default, if not timely remedied, could result in a termination of all commitments of the lenders and an acceleration of any outstanding loans and credit obligations.
Access to our revolving credit line is dependent upon our compliance with the financial ratio covenants set
forth in the Credit Agreement. These financial ratios include a minimum interest charge coverage ratio (ratio of a defined measure of earnings to interest) of 3.0 and a maximum leverage ratio (ratio of debt and letters of credit outstanding to a defined measure of earnings) of 3.5. The maximum leverage ratio decreases to 3.25 as of September 30, 2015, and it will decrease further to 3.0 as of March 31, 2016. Consolidated net earnings under the credit facility is the aggregate of our net income (or loss) and the net income (or loss) of our consolidated restricted subsidiaries, including cash dividends and distributions (not the return of capital) received from persons other than consolidated restricted subsidiaries (such as distributions from CCLP) and after allowances for taxes for such period determined on a consolidated basis in accordance with GAAP, excluding certain items more specifically described therein. This definition of consolidated net earnings was modified from excluding, among other things, all extraordinary and nonrecurring gains and losses from such calculation, to only excluding an amount of extraordinary and nonrecurring gains and losses up to 25% of a measure of earnings beginning with the four quarter period ended September 30, 2015. In addition, the note purchase agreements relating to our Senior Notes include similar financial covenants. Under these note purchase agreements, the financial ratio requirements include a minimum interest coverage ratio of 2.5 and a maximum leverage ratio of 3.5. At December 31, 2014, the Company’s leverage ratio was 2.94 to 1.
Our continuing ability to comply with these financial covenants depends largely upon our ability to generate
adequate cash flow. Historically, our financial performance has been more than adequate to meet these covenants. Due to the expected decreased demand for our products and services from our customers in response to decreased oil and natural gas prices, we are taking strategic cost reduction efforts, including headcount reductions and other efforts to reduce costs and generate cash in anticipation of the reduced demand for our products and services. Based on our projections for each of the quarterly periods in 2015, and including the impact of these cost reduction efforts to increase operating cash flows, we anticipate that we will be in compliance with the financial covenants under our revolving credit facility through December 31, 2015. We are also pursuing the sale of selected assets and additional financing alternatives as potential sources of proceeds to repay a portion of our outstanding borrowings. Any asset sales proceeds, borrowing proceeds, and available capacity under our revolving Credit Agreement are expected to provide resources to repay the $90.0 million of outstanding 2008 Series B Senior Notes, which are scheduled to mature on April 30, 2015. However, there is a remote possibility that we may fail to be in compliance with these financial covenants going forward, and would consequently be in default under our Credit Agreement and our Senior Notes. There can be no assurances that these cost reduction or cash generation plans will be successful, or that market conditions and our operating performance will not further decrease compared to our projections.
In February 2015, we entered into a commitment letter agreement for the sale of $50.0 million aggregate
principal amount of senior secured notes to be issued in April 2015. The proceeds from these notes are expected to provide a portion of the funds necessary to repay the $90.0 million principal amount repayment of the Series 2008-B Senior Notes that mature in April 2015. The new notes would be secured by our accounts receivable (excluding CCLP accounts receivable) and our limited partner interest in CCLP, would mature on April 1, 2017, and would include financial covenants consistent with our existing bank revolving credit facility. Closing of the sale and issuance of the notes is subject to the execution of a definitive note purchase agreement and customary conditions.
CCLP's long-term debt levels may limit the amount of cash available to be distributed, which will affect our
cash flows. As of December 31, 2014, CCLP had approximately $195 million outstanding under the CCLP Credit
Agreement, $350 million aggregate principal amount outstanding under the CCLP 7.25% Senior Notes, and it may incur significant additional indebtedness in the future. As of February 27, 2015, the amount outstanding under the CCLP Credit Agreement had increased to approximately $208.0 million. The level of CCLP indebtedness could have important consequences to us, including the following:

20
• CCLP's ability to obtain additional financing, if necessary, for its working capital, capital expenditures (including acquisitions), or other purposes, may be impaired or such financing may not be available on favorable terms;
• covenants contained in CCLP's existing and future credit and debt arrangements will require it to meet financial tests that may affect its flexibility in planning for and reacting to changes in its business, including possible acquisition opportunities;
• CCLP's use of a portion of its cash flow to make principal and interest payments on its indebtedness will reduce the funds that would otherwise be available for distributions to unitholders, including to us;
• CCLP may be more vulnerable to competitive pressures or a downturn in its business or the economy generally; and
• CCLP's flexibility in responding to changing business and economic conditions may be affected. Increases in CCLP's indebtedness would increase its total interest expense, which would in turn reduce its
forecasted cash available for distribution. CCLP's ability to service its indebtedness will depend upon, among other things, its future financial and operating performance, which will be affected by prevailing economic conditions and financial, business, regulatory and other factors, some of which are beyond its control. If CCLP's operating results are not sufficient to service its current or future indebtedness, CCLP will be forced to take actions such as reducing distributions, reducing or delaying its business activities, acquisitions, investments and/or capital expenditures, selling assets, restructuring or refinancing its indebtedness, or seeking additional equity capital or bankruptcy protection. CCLP may not be able to effect any of these remedies on satisfactory terms, or at all.
We may have continuing exposure on abandonment and decommissioning obligations associated with oil
and gas properties sold by Maritech. During 2011, in connection with the sale of a significant majority of Maritech’s oil and gas producing
properties, the buyers of the properties assumed associated decommissioning liabilities having a value at the time of sale of approximately $122.0 million pursuant to the purchase and sale agreements. For oil and gas properties for which Maritech was previously the operator, the buyer of the properties has now generally become the successor operator and has assumed the financial responsibilities associated with the properties’ operations. However, to the extent that purchasers of these oil and gas properties fail to perform the abandonment and decommissioning work required and there is insufficient bonding and we have insufficient other security, the previous owners and operators of the properties, including Maritech, may be required to assume responsibility for the abandonment and decommissioning obligation. To the extent Maritech is required to assume or perform a significant portion of the abandonment and decommissioning obligations associated with these previously owned oil and gas properties, our financial condition and results of operations may be negatively affected.
We are exposed to significant credit risks. We face credit risk associated with the significant amounts of accounts receivable we have with our
customers in the energy industry. Many of our customers, particularly those associated with our onshore operations, are small- to medium-sized oil and gas operators that may be more susceptible to fluctuating oil and gas commodity prices or generally increased operating expenses than larger companies. Our ability to collect from our customers may be impacted by the current decreased oil and natural gas price environment.
As the owner and operator of its oil and gas property interests, Maritech is liable for the proper
abandonment and decommissioning of these properties. We have guaranteed a portion of the abandonment and decommissioning liabilities of Maritech. With respect to certain properties, Maritech is entitled to be paid in the future for all or a portion of these obligations by the previous owner of the property once the liability is satisfied. We and Maritech are subject to the risk that the previous owner(s) will be unable to make these future payments. In addition, for certain remaining Maritech properties to be decommissioned or abandoned, the co-owners of such properties are responsible for the payment of their portions of the associated operating expenses and abandonment liabilities. However, if one or more co-owners do not pay their portions, Maritech and any other nondefaulting co-owners may be liable for the defaulted amount. If any required payment is not made by a previous owner or a co-owner and any security is not sufficient to cover the required payment, we could suffer material losses.
21
Our operating results and cash flows for certain of our subsidiaries are subject to foreign currency risk. The operations of certain of our subsidiaries are exposed to fluctuations between the U.S. dollar and certain
foreign currencies, particularly the euro, the British pound, the Mexican peso, and the Argentinian peso. Our plans to grow our international operations could cause this exposure from fluctuating currencies to increase. Historically, exchange rates of foreign currencies have fluctuated significantly compared to the U.S. dollar, and this exchange rate volatility is expected to continue. Significant fluctuations in foreign currencies against the U.S. dollar could adversely affect our balance sheet and results of operations.
We are exposed to interest rate risk with regard to our indebtedness. As of December 31, 2014, we and CCLP have a total of $285.0 million outstanding under our respective
revolving credit facilities. Our revolving credit facilities were amended on September 30, 2014, when we and certain of our subsidiaries entered into an Agreement and Third Amendment to Credit Agreement (the "Third Amendment") with JP Morgan Chase Bank, N.A. and lenders thereto. These revolving credit facilities consist of floating rate loans that bear interest at an agreed upon percentage rate spread (which is determined on our leverage ratio) above LIBOR. Accordingly, our cash flows and results of operations could be subject to interest rate risk exposure associated with the level of the variable rate debt balance outstanding. We currently are not a party to an interest rate swap contract or other derivative instrument designed to hedge our exposure to interest rate fluctuation risk.
The Third Amendment amends the Company's revolving credit facility that was set to expire on October 29,
2015, by extending the maturity date of the credit facility until September 30, 2019. CCLP's revolving credit facility is scheduled to mature in 2017. Our Senior Notes and CCLP's Senior Notes bear interest at fixed interest rates and are scheduled to mature at various dates between April 2015 and August 2022. There can be no assurance that the financial market conditions or borrowing terms at the times these existing debt agreements are renegotiated will be as favorable as the current terms and interest rates. Legal, Regulatory, and Political Risks
Our operations are subject to extensive and evolving U.S. and foreign federal, state and local laws and
regulatory requirements that increase our operating costs and expose us to potential fines, penalties, and litigation. Laws and regulations govern our operations, including those relating to corporate governance, employees,
taxation, fees, importation and exportation restrictions, environmental affairs, health and safety, and the manufacture, storage, handling, transportation, use, and sale of chemical products. Certain foreign countries impose additional restrictions on our activities, such as currency restrictions and restrictions on various labor practices. Our operation and decommissioning of offshore properties are subject to and affected by various government regulations, including numerous federal and state environmental, health and safety laws and regulations. These laws and regulations are becoming increasingly complex and stringent, and compliance is becoming increasingly expensive. Governmental authorities have the power to enforce compliance with these regulations, and violators are subject to civil and criminal penalties, including civil fines, and injunctions. Third parties may also have the right to pursue legal actions to enforce compliance with certain laws and regulations. It is possible that increasingly strict environmental, health and safety laws, regulations, and enforcement policies could result in substantial costs and liabilities to us.
The EPA is studying the environmental impact of hydraulic fracturing, a process used by the U.S. oil and
gas industry in the development of certain oil and gas reservoirs. Specifically, the EPA is reviewing the impact of hydraulic fracturing on drinking water resources. Certain environmental and other groups have suggested that additional federal, state, and local laws and regulations may be needed to more closely regulate the hydraulic fracturing process. Several states have adopted regulations that require operators to disclose the chemical constituents in hydraulic fracturing fluids. We cannot predict whether any federal, state or local laws or regulations will be enacted regarding hydraulic fracturing, and, if so, what actions any such laws or regulations would require or prohibit. If additional levels of regulation or permitting requirements were imposed on oil and gas operators through the adoption of new laws and regulations, the domestic demand for certain of our products and services could be decreased or subject to delays, particularly for our Production Testing, Compression, and Fluids Divisions.
A large portion of the services performed by our Offshore Division's Offshore Services segment and all of
Maritech’s remaining well abandonment and decommissioning operations are conducted on offshore federal leases and are governed by increasing U.S. government regulations. Government regulations also establish construction
22
requirements for production facilities located on federal offshore leases and govern the plugging and abandonment of wells and the removal of production facilities from these leases. Operators must abide by Idle Iron Guidance regulations that regulate the permanent plugging of nonproducing wells and the dismantling of oil and gas production platforms within a certain period of time after they are no longer being used. BSEE oversees the provisions of the Idle Iron Guidance. Under limited circumstances, the BSEE could require Maritech or our Offshore Services segment to suspend or terminate their operations on a federal lease, and both Maritech and our Offshore Services segment could be subject to fines and penalties.
We have significant operations that are either ongoing or scheduled to commence in the U.S. Gulf of
Mexico. At this time, we cannot predict the full impact that other regulatory actions that may be mandated by the federal government may have on our operations or the operations of our customers. Other governmental or regulatory actions could further reduce our revenues and increase our operating costs, including the cost to insure offshore operations, resulting in reduced cash flows and profitability.
Our onshore and offshore operations expose us to risks such as the potential for harmful substances
escaping into the environment and causing damages or injuries, which could be substantial. Although we maintain general liability and pollution liability insurance, these policies are subject to exceptions and coverage limits. We maintain limited environmental liability insurance covering named locations and environmental risks associated with contract services for oil and gas operations. We could be materially and adversely affected by an enforcement proceeding or a claim that is not covered or is only partially covered by insurance.
Because our business depends on the level of activity in the oil and natural gas industry, existing or future
laws, regulations, treaties, or international agreements that impose additional restrictions on the industry may adversely affect our financial results. Regulators are becoming more focused on air emissions from oil and gas operations, including volatile organic compounds, hazardous air pollutants, and greenhouse gases. In particular, the focus on greenhouse gases and climate change, including incentives to conserve energy or use alternative energy sources, could have a negative impact on our financial results if such laws, regulations, treaties, or international agreements reduce the worldwide demand for oil and natural gas or otherwise result in reduced economic activity generally. In addition, such laws, regulations, treaties, or international agreements could result in increased compliance costs, capital spending requirements, or additional operating restrictions for us, which may have a negative impact on our financial results.
In addition to increasing our risk of environmental liability, the rigorous enforcement of environmental laws
and regulations has accelerated the growth of some of the markets we serve. Decreased regulation and enforcement in the future could materially and adversely affect the demand for certain of the services offered by our Offshore Services operations and, therefore, materially and adversely affect our business.
Our expansion into foreign countries exposes us to complex regulations and may present us with new
obstacles to growth. We plan to continue to grow both in the United States and in foreign countries. We have established
operations in, among other countries, Argentina, Brazil, Canada, Finland, Ghana, Iraq, Mexico, Norway, Saudi Arabia, Sweden, and the United Kingdom. Foreign operations carry special risks. Our business in the countries in which we currently operate and those in which we may operate in the future could be limited or disrupted by:
• restrictions on repatriating cash back to the United States; • the impact of compliance with anti-corruption laws on our operations and competitive position in affected
countries and the risk that actions taken by us or our agents may violate those laws; • government controls and government actions, such as expropriation of assets and changes in legal and
regulatory environments; • import and export license requirements; • political, social, or economic instability; • trade restrictions; • changes in tariffs and taxes; and • our limited knowledge of these markets or our inability to protect our interests.
We and our affiliates operate in countries where governmental corruption has been known to exist. While
we and our subsidiaries are committed to conducting business in a legal and ethical manner, there is a risk of
23
violating either the U.S. Foreign Corrupt Practices Act, the U.K Bribery Act, or laws or legislation promulgated pursuant to the 1997 OECD Convention on Combating Bribery of Foreign Public Officials in International Business Transactions or other applicable anti-corruption regulations that generally prohibit the making of improper payments to foreign officials for the purpose of obtaining or keeping business. Violation of these laws could result in monetary penalties against us or our subsidiaries and could damage our reputation and, therefore, our ability to do business.
Foreign governments and agencies often establish permit and regulatory standards different from those in
the U.S. If we cannot obtain foreign regulatory approvals, or if we cannot obtain them in a timely manner, our growth and profitability from foreign operations could be adversely affected.
Our growing operations in Argentina expose us to the changing economic, legal, and political environments
in that country, including the changing regulations over repatriation of cash generated from our operations in Argentina.
The current economic, legal, and political environment in Argentina and recent devaluation of the
Argentinian peso have created increased economic instability for foreign investment in Argentina. The Argentinian government is currently attempting to address the current high rate of inflation and the continuing devaluations pressure. Fiscal and monetary expansion in Argentina has led to devaluations of the Argentinian peso, particularly in late 2013 and early 2014. Additional currency adjustment may be necessary to help boost the current Argentina economy, but may be accompanied by fiscal and monetary tightening, including additional restrictions on the purchase of U.S. dollars in Argentina.
As a result of our expanding operations in Argentina, consolidated revenues and operating cash flow
generated in Argentina have increased over the past three years. As of December 31, 2014, approximately $2.0 million of our consolidated cash balance is located in Argentina, and the process of repatriating this cash to the U.S. is subject to increasingly complex regulations. There can be no assurances that our growing Argentinian operations will not expose us to a loss of liquidity, foreign exchange losses, and other potential financial impacts.
Climate change legislation or regulations restricting emissions of “greenhouse gases” could result in
increased operating costs and reduced demand for the oil and natural gas our customers produce, while the physical effects of climate change could disrupt production and cause us to incur costs in preparing for or responding to those effects.
The EPA has determined that “greenhouse gases” ("GHGs") present an endangerment to public health and
the environment, because emissions of such gases are, according to the EPA, contributing to warming of the earth’s atmosphere and other climatic changes. These findings allow the EPA to adopt and implement regulations that would restrict emissions of GHGs under existing provisions of the federal Clean Air Act ("CAA"). Based on these findings, the EPA has begun adopting and implementing regulations to restrict emissions of GHGs under existing provisions of the CAA. The EPA rules regulate GHG emissions under the CAA and require a reduction in emissions of GHGs from motor vehicles and from certain large stationary sources as well as requiring so-called “green” completions at hydraulically fractured natural gas wells beginning in 2015. The EPA also requires the annual reporting of GHG emissions from specified large GHG emission sources in the United States, including petroleum refineries, as well as from certain oil and gas production facilities.
The adoption and implementation of any regulations imposing reporting obligations on, or limiting emissions
of GHGs from, our facilities and operations could require us to incur costs. Further, Congress has considered and almost one-half of the states have adopted legislation that seeks to control or reduce emissions of GHGs from a wide range of sources. Any such legislation could adversely affect demand for the oil and natural gas our customers produce and, in turn, demand for our products and services. Finally, it should be noted that some scientists have concluded that increasing concentrations of GHGs in the Earth’s atmosphere may produce climate changes that have significant physical effects, such as increased frequency and severity of storms, floods, and other climatic events; if any such effects were to occur, they could have an adverse effect on our operations and cause us to incur costs in preparing for or responding to those effects.
Our proprietary rights may be violated or compromised, which could damage our operations. We own numerous patents, patent applications, and unpatented trade secret technologies in the U.S. and
certain foreign countries. There can be no assurance that the steps we have taken to protect our proprietary rights
24
will be adequate to deter misappropriation of these rights. In addition, independent third parties may develop competitive or superior technologies.
Item 1B. Unresolved Staff Comments.
None.
Item 2. Properties. Our properties consist primarily of our corporate headquarters facility, chemical plants, processing plants,
distribution facilities, heavy lift barge rigs, and dive support vessels. The following information describes facilities that we leased or owned as of December 31, 2014. We believe our facilities are adequate for our present needs.
Facilities Fluids Division
Our Fluids Division facilities include seven chemical production plants located in the states of Arkansas,
California, Louisiana, and West Virginia, and the country of Finland, having a total production capacity of more than 1.5 million equivalent liquid tons per year. The two California locations consist of 29 square miles of leased mineral acreage and solar evaporation ponds, and related owned production and storage facilities.
As an inducement to locate our calcium chloride production plant in Union County, Arkansas, we received
certain ad valorem property tax incentives. Our facility is located just outside the city of El Dorado, Arkansas, on property that is leased from Union County, Arkansas. We have the option of purchasing the property at any time during the term of the lease for a nominal price. The term of the lease expires in 2035, at which time we also have the option to purchase the property at a nominal price. Under the terms of the lease, we are responsible for all costs incurred related to the facility.
In addition to the production facilities described above, the Fluids Division owns or leases multiple service
center facilities in the United States and in other countries. The Fluids Division also leases several offices and numerous terminal locations in the United States and in other countries.
We lease approximately 33,000 gross acres of bromine-containing brine reserves in Magnolia, Arkansas,
for possible future development and as a source of supply for our bromine and other raw materials.
Production Testing Division The Production Testing segment conducts its operations through production testing service centers (most of
which are leased) in the United States, located in Colorado, Louisiana, North Dakota, Oklahoma, Pennsylvania, Texas, West Virginia, and Wyoming. In addition, the Production Testing segment has leased facilities in Brazil, Mexico, United Arab Emirates, United Kingdom, Saudi Arabia, Iraq, Argentina, Australia, Canada, and Colombia.
Compression Division
The Compression Division’s facilities include owned headquarters and fabrication facilities in Midland, Texas and Oklahoma City, Oklahoma, a leased administration facility in Oklahoma City, Oklahoma, and several owned and leased service and sales facilities in the United States, Mexico, Canada, and Argentina. All obligations under the bank revolving credit facility for CCLP are secured by a first lien security interest in substantially all of CCLP’ s assets, including the Midland, Texas and Oklahoma City, Oklahoma fabrication facilities.
For a profile of our compression fleet, see "Item 1. Business "Products and Services - Compression."
Offshore Division The Offshore Division conducts its operations through four offices and service facility locations (three of
which are leased) located in Texas and Louisiana. In addition, the Offshore Services segment owns the following fleet of vessels that it uses in performing its well abandonment, decommissioning, construction, and contract diving operations:
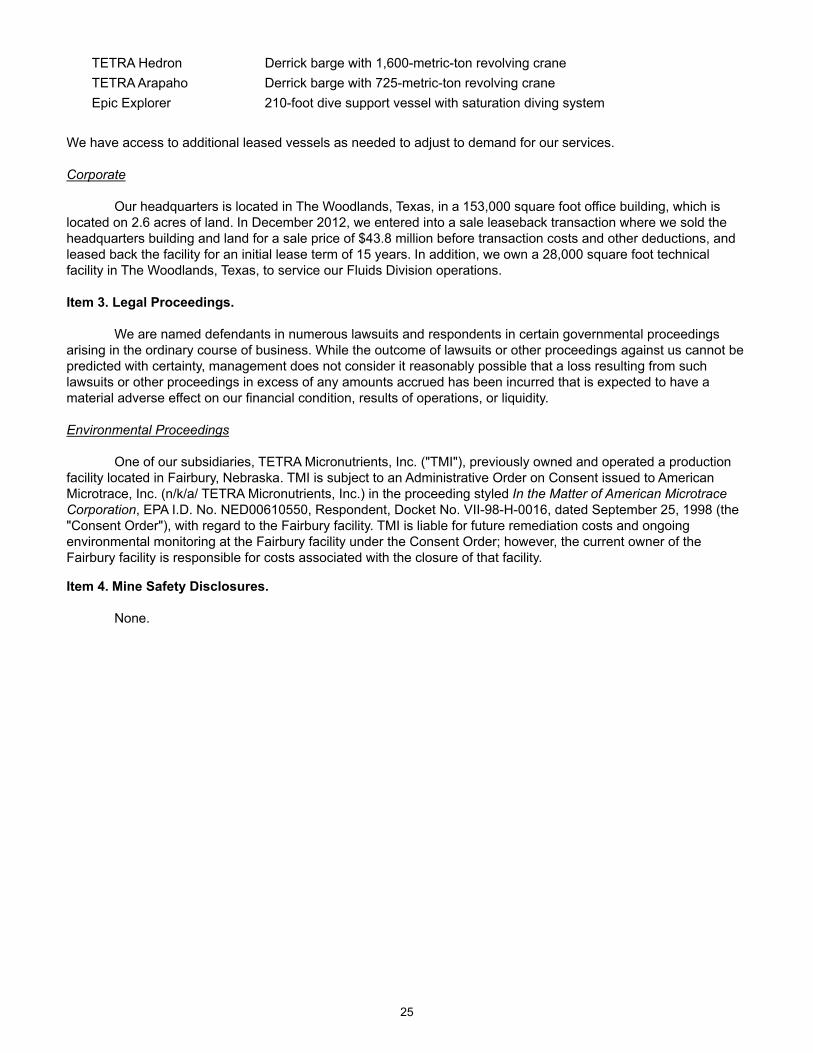
25
TETRA Hedron Derrick barge with 1,600-metric-ton revolving craneTETRA Arapaho Derrick barge with 725-metric-ton revolving craneEpic Explorer 210-foot dive support vessel with saturation diving system
We have access to additional leased vessels as needed to adjust to demand for our services. Corporate
Our headquarters is located in The Woodlands, Texas, in a 153,000 square foot office building, which is
located on 2.6 acres of land. In December 2012, we entered into a sale leaseback transaction where we sold the headquarters building and land for a sale price of $43.8 million before transaction costs and other deductions, and leased back the facility for an initial lease term of 15 years. In addition, we own a 28,000 square foot technical facility in The Woodlands, Texas, to service our Fluids Division operations.
Item 3. Legal Proceedings.
We are named defendants in numerous lawsuits and respondents in certain governmental proceedings arising in the ordinary course of business. While the outcome of lawsuits or other proceedings against us cannot be predicted with certainty, management does not consider it reasonably possible that a loss resulting from such lawsuits or other proceedings in excess of any amounts accrued has been incurred that is expected to have a material adverse effect on our financial condition, results of operations, or liquidity.
Environmental Proceedings
One of our subsidiaries, TETRA Micronutrients, Inc. ("TMI"), previously owned and operated a production
facility located in Fairbury, Nebraska. TMI is subject to an Administrative Order on Consent issued to American Microtrace, Inc. (n/k/a/ TETRA Micronutrients, Inc.) in the proceeding styled In the Matter of American Microtrace Corporation, EPA I.D. No. NED00610550, Respondent, Docket No. VII-98-H-0016, dated September 25, 1998 (the "Consent Order"), with regard to the Fairbury facility. TMI is liable for future remediation costs and ongoing environmental monitoring at the Fairbury facility under the Consent Order; however, the current owner of the Fairbury facility is responsible for costs associated with the closure of that facility. Item 4. Mine Safety Disclosures.
None.
26
PART II
Item 5. Market for Registrant’s Common Equity, Related Stockholder Matters, and Issuer Repurchases of Equity Securities. Price Range of Common Stock
Our common stock is traded on the New York Stock Exchange under the symbol “TTI.” As of March 2,
2015, there were approximately 8,234 holders of record of the common stock. The following table sets forth the high and low sale prices of the common stock for each calendar quarter in the two years ended December 31, 2014, as reported by the New York Stock Exchange.
High Low2014 First Quarter $ 12.84 $ 9.92Second Quarter 13.43 10.87Third Quarter 12.11 9.25Fourth Quarter 10.96 4.90
2013 First Quarter $ 10.74 $ 7.72Second Quarter 11.48 8.15Third Quarter 12.97 9.41Fourth Quarter 13.41 11.52
Market Price of Common Stock
The following graph compares the five-year cumulative total returns of our common stock, the Standard &
Poor’s 500 Composite Stock Price Index (S&P 500), and the Philadelphia Oil Service Sector Index (PHLX Oil Service), assuming $100 invested in each stock or index on December 31, 2009, all dividends reinvested, and a fiscal year ending December 31. This information shall be deemed furnished, and not filed, in this Form 10-K and shall not be deemed incorporated by reference into any filing under the Securities Act of 1933 or the Securities Exchange Act of 1934 as a result of this furnishing, except to the extent we specifically incorporate it by reference.
Dividend Policy We have never paid cash dividends on our common stock. We currently intend to retain earnings to finance
the growth and development of our business. Any payment of cash dividends in the future will depend upon our financial condition, capital requirements, and earnings, as well as other factors the Board of Directors may deem

27
relevant. See “Item 7. Management’s Discussion and Analysis of Financial Condition and Results of Operation – Liquidity and Capital Resources” for a discussion of potential restrictions on our ability to pay dividends. Purchases of Equity Securities by the Issuer and Affiliated Purchasers
In January 2004, our Board of Directors authorized the repurchase of up to $20 million of our common
stock. Purchases may be made from time to time in open market transactions at prevailing market prices. The repurchase program may continue until the authorized limit is reached, at which time the Board of Directors may review the option of increasing the authorized limit. During 2004 through 2005, we repurchased 340,950 shares of our common stock pursuant to the repurchase program at a cost of approximately $5.7 million. There were no repurchases made during 2006 through 2014 pursuant to the repurchase program. Shares repurchased during the fourth quarter of 2014 other than pursuant to our repurchase program are as follows:
Period
Total Number of Shares
Purchased
Average Price
Paid per Share
Total Number of SharesPurchased as Part of Publicly Announced Plans or Programs(1)
Maximum Number (or Approximate Dollar Value) of
Shares that May Yet be Purchased Under the Publicly
Announced Plans or Programs(1) Oct 1 – Oct 31, 2014 6,761 (2) $ 10.17 — $ 14,327,000Nov 1 – Nov 30, 2014 19,040 (2) 8.40 — 14,327,000Dec 1 – Dec 31, 2014 376 (2) 6.78 — 14,327,000
Total 26,177 — $ 14,327,000(1) In January 2004, our Board of Directors authorized the repurchase of up to $20 million of our common stock. Purchases will be made from
time to time in open market transactions at prevailing market prices. The repurchase program may continue until the authorized limit is reached, at which time the Board of Directors may review the option of increasing the authorized limit.
(2) Shares we received in connection with the exercise of certain employee stock options or the vesting of certain employee restricted stock. These shares were not acquired pursuant to the stock repurchase program.
Item 6. Selected Financial Data.
The following tables set forth our selected consolidated financial data for the years ended December 31,
2014, 2013, 2012, 2011, and 2010. The selected consolidated financial data does not purport to be complete and should be read in conjunction with, and is qualified by, the more detailed information, including the Consolidated Financial Statements and related Notes and “Item 7. Management’s Discussion and Analysis of Financial Condition and Results of Operation” appearing elsewhere in this report. Please read “Item 1A. Risk Factors” beginning on page 11 for a discussion of the material uncertainties which might cause the selected consolidated financial data not to be indicative of our future financial condition or results of operations. During 2014, we recorded significant impairments of long-lived assets and goodwill. During 2014 and 2013, we recorded significant charges to earnings associated with Maritech's decommissioning liabilities. During 2014, our Compression Division acquired CSI. During 2012, our Production Testing Division acquired OPTIMA, ERS, and Greywolf. During 2010, we recorded significant impairments of our oil and gas properties, a dive support vessel, and a calcium chloride manufacturing plant, as well as significant charges to earnings associated with adjustments to Maritech’s decommissioning liabilities. During 2011, Maritech sold approximately 95% of the oil and gas proved reserves it held as of December 31, 2010. These acquisitions, dispositions, and impairments significantly impact the comparison of our financial statements for 2014 to earlier years.
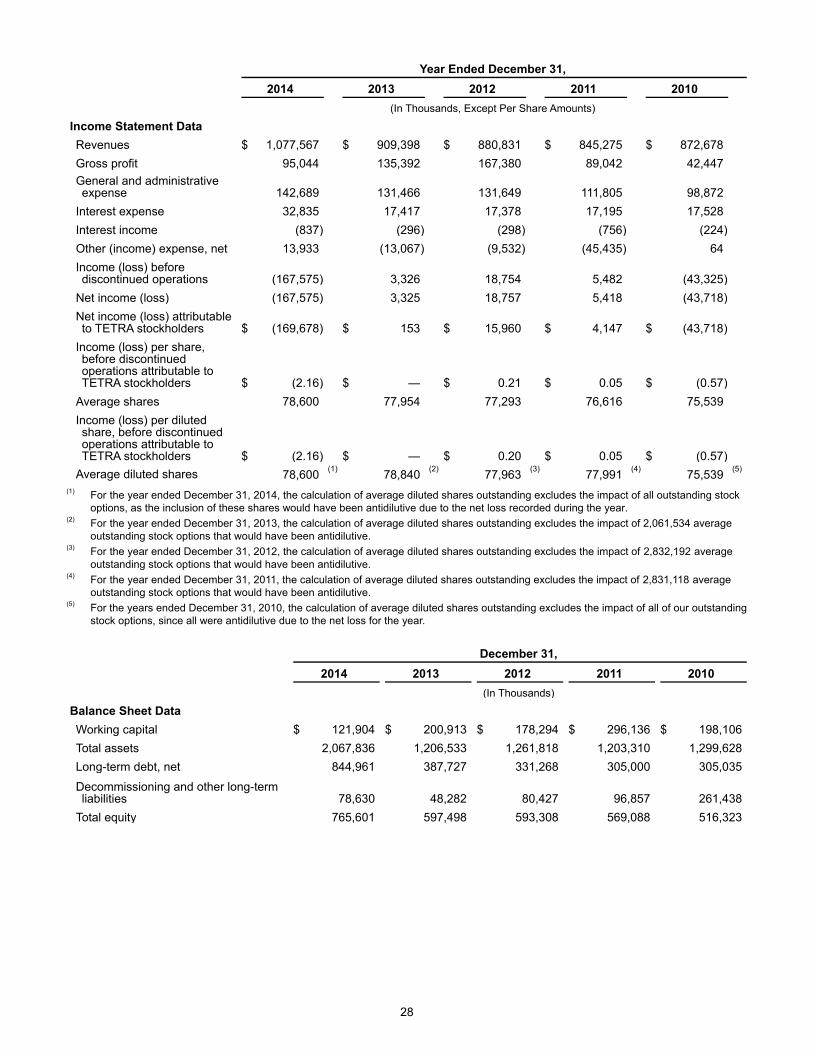
28
Year Ended December 31, 2014 2013 2012 2011 2010 (In Thousands, Except Per Share Amounts)
Income Statement Data Revenues $ 1,077,567 $ 909,398 $ 880,831 $ 845,275 $ 872,678 Gross profit 95,044 135,392 167,380 89,042 42,447 General and administrative expense 142,689
131,466 131,649 111,805
98,872
Interest expense 32,835 17,417 17,378 17,195 17,528 Interest income (837) (296) (298) (756) (224) Other (income) expense, net 13,933 (13,067) (9,532) (45,435) 64 Income (loss) before discontinued operations (167,575) 3,326 18,754 5,482
(43,325)
Net income (loss) (167,575) 3,325 18,757 5,418 (43,718) Net income (loss) attributable to TETRA stockholders $ (169,678) $ 153 $ 15,960 $ 4,147
$ (43,718)
Income (loss) per share, before discontinued operations attributable to TETRA stockholders $ (2.16) $ — $ 0.21 $ 0.05
$ (0.57) Average shares 78,600 77,954 77,293 76,616 75,539 Income (loss) per diluted share, before discontinued operations attributable to TETRA stockholders $ (2.16) $ — $ 0.20 $ 0.05
$ (0.57) Average diluted shares 78,600 (1) 78,840 (2) 77,963 (3) 77,991 (4) 75,539 (5)
(1) For the year ended December 31, 2014, the calculation of average diluted shares outstanding excludes the impact of all outstanding stock options, as the inclusion of these shares would have been antidilutive due to the net loss recorded during the year.
(2) For the year ended December 31, 2013, the calculation of average diluted shares outstanding excludes the impact of 2,061,534 average outstanding stock options that would have been antidilutive.
(3) For the year ended December 31, 2012, the calculation of average diluted shares outstanding excludes the impact of 2,832,192 average outstanding stock options that would have been antidilutive.
(4) For the year ended December 31, 2011, the calculation of average diluted shares outstanding excludes the impact of 2,831,118 average outstanding stock options that would have been antidilutive.
(5) For the years ended December 31, 2010, the calculation of average diluted shares outstanding excludes the impact of all of our outstanding stock options, since all were antidilutive due to the net loss for the year.
December 31, 2014 2013 2012 2011 2010 (In Thousands)
Balance Sheet Data Working capital $ 121,904 $ 200,913 $ 178,294 $ 296,136 $ 198,106Total assets 2,067,836 1,206,533 1,261,818 1,203,310 1,299,628Long-term debt, net 844,961 387,727 331,268 305,000 305,035
Decommissioning and other long-term liabilities 78,630 48,282 80,427 96,857
261,438
Total equity 765,601 597,498 593,308 569,088 516,323
29
Item 7. Management’s Discussion and Analysis of Financial Condition and Results of Operation. The following discussion is intended to analyze major elements of our consolidated financial statements
and provide insight into important areas of management’s focus. This section should be read in conjunction with the Consolidated Financial Statements and the accompanying Notes included elsewhere in this Annual Report.
Statements in the following discussion may include forward-looking statements. These forward-looking
statements involve risks and uncertainties. See “Item 1A. Risk Factors,” for additional discussion of these factors and risks. Business Overview Increasingly competitive market environments, compounded by the late 2014 decline in oil and natural gas prices, have resulted in further challenges for many of our businesses domestically and in certain international regions. We are responding to these market conditions through a series of strategic cost reduction steps and other measures. Although consolidated revenue levels reflect the growth of our Compression and Fluids businesses, our Offshore Services and Production Testing businesses experienced decreased demand and revenues throughout most of 2014 compared to the prior year. Our Compression Division reported significantly increased revenues and gross profit as a result of the August 4, 2014 acquisition of Compression Services, Inc. ("CSI"), which, with a purchase price of $825 million, was the most significant acquisition in our history. Headquartered in Midland, Texas, CSI fabricates, sells, and maintains natural gas compressors and provides a full range of compression products and services that cover compression needs throughout the entire natural gas production and transportation cycle. Supplementing this growth, our Fluids Division also reported record revenues and gross profit, primarily through the growth of its water management services business and increased sales of calcium chloride and other manufactured products. Despite this growth, all of our businesses reflected the impact of increased competition, and this trend is expected to continue as oil and gas customers decrease their capital expenditure and operating plans for 2015 in response to dramatically reduced prices for oil and, to a lesser extent, natural gas. Decreased domestic drilling activity is expected throughout the industry, and we are making strategic cost reduction efforts, including headcount reductions, asset redeployment, and other efforts to reduce costs in anticipation of further reduced demand for our products and services. During 2014, our Offshore Services segment and Production Testing Division reflected decreased revenues and profitability, and both businesses recorded significant asset impairments during the fourth quarter of 2014. Despite their growth, both Fluids and Compression Divisions have also experienced decreased activity and the impact of project delays by some of their customers. The impact of asset impairments and valuation allowances, decreased Offshore Services and Production Testing activity, and the excess decommissioning and abandonment charges to Maritech results, combined to generate a consolidated net loss attributable to our stockholders of $169.7 million for the year ended December 31, 2014. With the August 4, 2014, acquisition by our Compression Division of CSI (the "CSI Acquisition"), we effected a significant change in the composition of our consolidated operations and our consolidated capital structure. Consolidated results of operations for the year ended December 31, 2014, reflect the impact of the CSI Acquisition, as the operations of CSI contributed revenues of approximately $152.5 million and pretax earnings of approximately $15.2 million. Primarily as a result of increased borrowings by CSI Compressco LP ("CCLP", formerly known as Compressco Partners, L.P.) to fund the purchase price of the CSI Acquisition, net interest expense for the year ended December 31, 2014, also increased by approximately $14.9 million compared to the prior year. In connection with the CSI Acquisition, interim financing commitment fees totaling approximately $9.3 million, as well as other transaction costs totaling approximately $8.7 million were incurred and charged to earnings during 2014. The acquisition of CSI has increased our Compression Division's total horsepower ("HP") from approximately 187,000 to over 1,089,000 and allows the Compression Division to utilize an expanded range of compressor packages (with engines from 20 HP to 2,370 HP) for compression services to customers. This expansion of the Compression Division's service offerings allows it to participate in the compression market at a broader level. Strategically, the acquisition is expected to afford the Compression Division the opportunity to capture significant synergies associated with its product and service offerings and its fabrication operations, further penetrate new and existing markets, and to achieve administrative efficiencies and other strategic benefits. The CSI Acquisition purchase price of $825.0 million was funded from (i) the issuance of 7.25% Senior Notes due 2022 in the aggregate principal amount of $350.0 million by CCLP and its subsidiary, CSI Compressco Finance, Inc. (the "CCLP Senior Notes") resulting in net proceeds of $337.8 million (after deducting a $5.2 million discount and certain transaction related fees), (ii) CCLP's issuance of 15,280,000 common units (the "New Units") at a public offering price of $23.50 per common unit (the "Offering Price") in an underwritten public offering resulting
30
in net proceeds of $346.0 million, and (iii) a portion of the $210.0 million initially borrowed under CCLP's new $400 million bank revolving credit facility (the "New CCLP Credit Agreement"). In connection with CCLP's offering of the New Units, it granted an option to the underwriters to purchase up to an additional 2,292,000 common units at the Offering Price, less the underwriting discount. On August 11, 2014, the underwriters exercised their option and purchased all 2,292,000 additional common units resulting in additional net proceeds of $51.7 million ($53.9 million gross proceeds less underwriting discount). Proceeds from this option exercise were used by CCLP to pay down a portion of its balance outstanding under the New CCLP Credit Agreement. A subsidiary of our CSI Compressco GP Inc. subsidiary (formerly known as Compressco Partners GP Inc.) purchased 1,390,290 of the New Units for approximately $32.7 million and CSI Compressco GP Inc. contributed approximately $8.4 million in order to maintain its approximately 2% general partner interest in CCLP. These investments were funded by approximately $40.0 million borrowed under our existing Credit Agreement. The issuance of the New Units and the additional units issued pursuant to the exercise of the underwriters' option, together with the contribution by our CSI Compressco GP Inc. subsidiary of additional capital, resulted in the net reduction of our ownership of CCLP from approximately 82% to approximately 44%. Through our wholly owned subsidiary, CSI Compressco GP Inc., we continue to manage and control CCLP, and accordingly, we continue to consolidate the results of CCLP as part of our consolidated results of operations. Despite the decreased ownership percentage in CCLP, our quarterly distributions from CCLP following the CSI Acquisition are expected to increase compared to the amount of distributions prior to the acquisition as a result of the increased operations of CCLP and the incentive distribution rights held by our CSI Compressco GP Inc. subsidiary. The issuance of the CCLP Senior Notes and the New CCLP Credit Agreement have resulted in increased levels of our consolidated long-term debt. However, we do not analyze or manage our capital structure on a consolidated basis, as there are no cross default provisions, cross collateralization provisions, or cross guarantees between CCLP's long-term debt and our long-term debt. Approximately $540.0 million of our consolidated long-term debt balance is owned by CCLP, and is to be serviced and repaid from the assets and operations of CCLP. The following table provides condensed consolidating balance sheet information reflecting our net assets and CCLP's net assets that service our and their respective capital debt structures.
December 31, 2014Condensed Consolidating
Balance Sheet TETRA CCLP Eliminations Consolidated (In Thousands)
Cash, excluding restricted cash $ 14,318 $ 34,066 — $ 48,384
Affiliate receivables 6,480 — (6,480) —
Other current assets 254,743 197,421 452,164
Property, plant and equipment, net 438,196 686,427 — 1,124,623Other assets, including investment in CCLP 282,308 314,750 (154,393) 442,665
Total assets $ 996,045 $ 1,232,664 $ (160,873) $ 2,067,836 Affiliate payables $ — $ 6,480 $ (6,480) —
Current portion of long-term debt 90,074 — — 90,074
Other current liabilities 154,479 134,091 288,570
Long-term debt, net 305,000 539,961 — 844,961
Other non-current liabilities 76,779 1,851 78,630
Total equity 369,713 550,281 (154,393) 765,601
Total liabilities and equity $ 996,045 $ 1,232,664 $ (160,873) $ 2,067,836
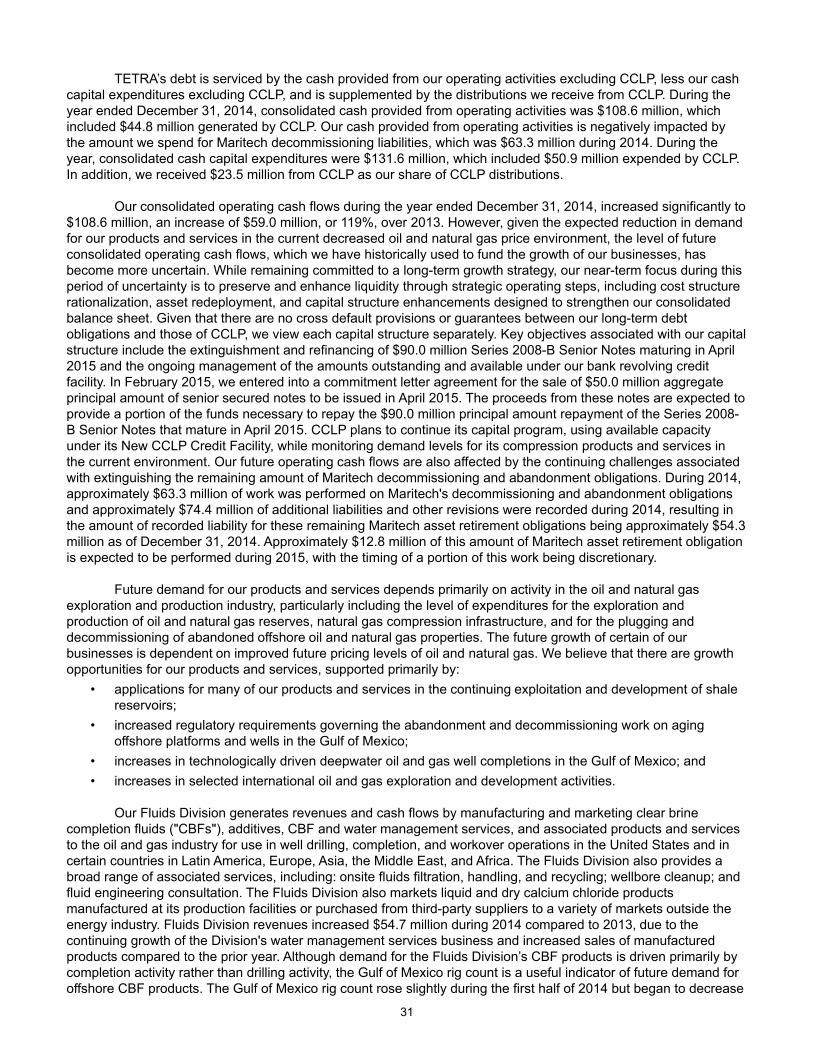
31
TETRA’s debt is serviced by the cash provided from our operating activities excluding CCLP, less our cash capital expenditures excluding CCLP, and is supplemented by the distributions we receive from CCLP. During the year ended December 31, 2014, consolidated cash provided from operating activities was $108.6 million, which included $44.8 million generated by CCLP. Our cash provided from operating activities is negatively impacted by the amount we spend for Maritech decommissioning liabilities, which was $63.3 million during 2014. During the year, consolidated cash capital expenditures were $131.6 million, which included $50.9 million expended by CCLP. In addition, we received $23.5 million from CCLP as our share of CCLP distributions. Our consolidated operating cash flows during the year ended December 31, 2014, increased significantly to $108.6 million, an increase of $59.0 million, or 119%, over 2013. However, given the expected reduction in demand for our products and services in the current decreased oil and natural gas price environment, the level of future consolidated operating cash flows, which we have historically used to fund the growth of our businesses, has become more uncertain. While remaining committed to a long-term growth strategy, our near-term focus during this period of uncertainty is to preserve and enhance liquidity through strategic operating steps, including cost structure rationalization, asset redeployment, and capital structure enhancements designed to strengthen our consolidated balance sheet. Given that there are no cross default provisions or guarantees between our long-term debt obligations and those of CCLP, we view each capital structure separately. Key objectives associated with our capital structure include the extinguishment and refinancing of $90.0 million Series 2008-B Senior Notes maturing in April 2015 and the ongoing management of the amounts outstanding and available under our bank revolving credit facility. In February 2015, we entered into a commitment letter agreement for the sale of $50.0 million aggregate principal amount of senior secured notes to be issued in April 2015. The proceeds from these notes are expected to provide a portion of the funds necessary to repay the $90.0 million principal amount repayment of the Series 2008-B Senior Notes that mature in April 2015. CCLP plans to continue its capital program, using available capacity under its New CCLP Credit Facility, while monitoring demand levels for its compression products and services in the current environment. Our future operating cash flows are also affected by the continuing challenges associated with extinguishing the remaining amount of Maritech decommissioning and abandonment obligations. During 2014, approximately $63.3 million of work was performed on Maritech's decommissioning and abandonment obligations and approximately $74.4 million of additional liabilities and other revisions were recorded during 2014, resulting in the amount of recorded liability for these remaining Maritech asset retirement obligations being approximately $54.3 million as of December 31, 2014. Approximately $12.8 million of this amount of Maritech asset retirement obligation is expected to be performed during 2015, with the timing of a portion of this work being discretionary.
Future demand for our products and services depends primarily on activity in the oil and natural gas exploration and production industry, particularly including the level of expenditures for the exploration and production of oil and natural gas reserves, natural gas compression infrastructure, and for the plugging and decommissioning of abandoned offshore oil and natural gas properties. The future growth of certain of our businesses is dependent on improved future pricing levels of oil and natural gas. We believe that there are growth opportunities for our products and services, supported primarily by:
• applications for many of our products and services in the continuing exploitation and development of shale reservoirs;
• increased regulatory requirements governing the abandonment and decommissioning work on aging offshore platforms and wells in the Gulf of Mexico;
• increases in technologically driven deepwater oil and gas well completions in the Gulf of Mexico; and • increases in selected international oil and gas exploration and development activities.
Our Fluids Division generates revenues and cash flows by manufacturing and marketing clear brine
completion fluids ("CBFs"), additives, CBF and water management services, and associated products and services to the oil and gas industry for use in well drilling, completion, and workover operations in the United States and in certain countries in Latin America, Europe, Asia, the Middle East, and Africa. The Fluids Division also provides a broad range of associated services, including: onsite fluids filtration, handling, and recycling; wellbore cleanup; and fluid engineering consultation. The Fluids Division also markets liquid and dry calcium chloride products manufactured at its production facilities or purchased from third-party suppliers to a variety of markets outside the energy industry. Fluids Division revenues increased $54.7 million during 2014 compared to 2013, due to the continuing growth of the Division's water management services business and increased sales of manufactured products compared to the prior year. Although demand for the Fluids Division’s CBF products is driven primarily by completion activity rather than drilling activity, the Gulf of Mexico rig count is a useful indicator of future demand for offshore CBF products. The Gulf of Mexico rig count rose slightly during the first half of 2014 but began to decrease
32
beginning in September 2014. Demand for the Fluids Division's products and services, particularly for its offshore CBF products, has also been affected by regulatory restrictions in the past and may continue to be affected by future regulatory restrictions. The Fluids onshore water management business is affected by domestic drilling activity, particularly in unconventional shale gas and oil reservoirs. North American onshore rig counts also increased during the first three quarters of 2014, but beginning in October 2014, began to decrease and have continued to decrease in early 2015.
Our Production Testing Division generates revenues and cash flows by performing frac flowback,
production well testing, offshore rig cooling, early production facilities, and other associated services. The primary markets served by the Production Testing Division include many of the major oil and gas producing regions in the United States, Mexico, and Canada, as well as in certain oil and gas basins in certain regions in South America, Africa, Europe, the Middle East, and Australia. The Production Testing Division’s production testing operations are generally driven by the demand for natural gas and oil and the resulting levels of drilling and completion activities in the markets that the Production Testing Division serves. Many of the markets served by the Production Testing Division are characterized by high lifting costs for oil and natural gas, such as in certain unconventional shale gas and oil reservoirs, and located in certain basins in the U.S., Canada, and certain other international markets. As a result of recent decreased oil and natural gas commodity prices, Production Testing activity levels are vulnerable to drilling and capital expenditure plans of its customers, particularly in certain markets in which it operates that are characterized by higher lifting costs. The Production Testing segment’s revenues decreased by $3.2 million in 2014 compared to 2013, due to decreased activity by the segment's primary customers in Mexico and South Texas and the impact of increasing competition, particularly in North America. As a result of recent decreased oil and natural gas prices, many of the Production Testing Division's customers have announced reductions in their drilling and capital expenditure plans and this is expected to reduce demand for services.
Our Compression Division generates revenues and cash flows by providing compression services and
equipment for natural gas and oil production, gathering, transportation, processing, and storage. The Compression Division also sells standard and custom-designed compressor packages and oilfield fluid pump systems, and provides aftermarket services and compressor package parts and components manufactured by third-party suppliers. The Compression Division provides these compression services and equipment to a broad base of natural gas and oil exploration and production, midstream, transmission, and storage companies operating throughout many of the onshore producing regions of the United States as well as in a number of foreign countries, including Mexico, Canada and Argentina. Compression Division revenues increased $161.2 million in 2014 as compared to 2013, primarily due to the August 4, 2014 acquisition of CSI, by which the Compression Division significantly expanded its scope of operations. Given the diversified applications of the Compression Division's products and services, and its dependency on natural gas consumption rather than drilling or completion activities, we expect continued demand for compressor packages and compression services despite current prices for oil and natural gas. Due to the acquisition of CSI, we expect that 2015 revenues for Compression Division will continue to be increased compared to 2014.
Our Offshore Division consists of two operating segments: Offshore Services and Maritech. The Offshore
Services segment generates revenues and cash flows by performing (1) downhole and subsea oil and gas well plugging and abandonment services, (2) decommissioning and certain construction services utilizing heavy lift barges and various cutting technologies with regard to offshore oil and gas production platforms and pipelines, and (3) conventional and saturated air diving services. The services provided by the Offshore Services segment are marketed to offshore operators, primarily in the U.S. Gulf of Mexico. Gulf of Mexico platform decommissioning and well abandonment activity levels are driven primarily by BSEE regulations; the declining production levels of producing fields; the age of production platforms and other structures; oil and natural gas commodity prices; sales activity of mature oil and gas producing properties; and overall oil and gas company activity levels. Offshore Services revenues decreased by $60.4 million during 2014 compared to 2013, due to the continuing challenges in the U.S. Gulf of Mexico market, including decreased heavy lift, abandonment, and cutting services activity, customer project delays, weather disruptions, and pricing pressures during the past year. A portion of the decreased revenues during 2014 compared to 2013 was due to decreased decommissioning and abandonment work performed for Maritech, and we expect that this decreased Maritech activity will continue in 2015. The Offshore Services segment is focused on replacing work performed for Maritech with work for third party customers; however, demand for services in 2014 and projected work for 2015 reflects the impact of increased competition, and in early 2015, the impact of reduced customer activity resulting from decreased oil and natural gas prices.
The sale of substantially all of Maritech’s oil and gas producing properties during 2011 and 2012 has
essentially removed us from the oil and gas exploration and production business. Maritech’s revenues are minimal
33
and are expected to continue to be minimal going forward. Maritech’s current operations primarily consist of the ongoing plugging, abandonment, and decommissioning associated with its remaining offshore wells, facilities, and production platforms. We expect to complete the majority of this remaining work by the end of 2016.
Critical Accounting Policies and Estimates
This discussion and analysis of our financial condition and results of operations is based upon our
consolidated financial statements. We prepared these financial statements in conformity with United States generally accepted accounting principles. In preparing our consolidated financial statements, we make assumptions, estimates, and judgments that affect the amounts reported. We base these estimates on historical experience, available information, and various other assumptions that we believe are reasonable. We periodically evaluate these estimates and judgments, including those related to potential impairments of long-lived assets (including goodwill), the collectability of accounts receivable, and the current cost of future abandonment and decommissioning obligations. “Note B – Summary of Significant Accounting Policies” to the Consolidated Financial Statements contains the accounting policies governing each of these matters. The fair values of portions of our total assets and liabilities are measured using significant unobservable inputs. The combination of these factors forms the basis for our judgments made about the carrying values of assets and liabilities that are not readily apparent from other sources. These judgments and estimates may change as new events occur, as new information is acquired, and as changes in our operating environment are encountered. Actual results are likely to differ from our current estimates, and those differences may be material. The following critical accounting policies reflect the most significant judgments and estimates used in the preparation of our financial statements.
Impairment of Long-Lived Assets
The determination of impairment of long-lived assets, including identified intangible assets, is conducted
periodically whenever indicators of impairment are present. If such indicators are present, the determination of the amount of impairment is based on our judgments as to the future operating cash flows to be generated from these assets throughout their estimated useful lives. If an impairment of a long-lived asset is warranted, we estimate the fair value of the asset based on a present value of these cash flows or the value that could be realized from disposing of the asset in a transaction between market participants. The oil and gas industry is cyclical, and our estimates of the amount of future cash flows, the period over which these estimated future cash flows will be generated, as well as the fair value of an impaired asset, are imprecise. Our failure to accurately estimate these future operating cash flows or fair values could result in certain long-lived assets being overstated, which could result in impairment charges in periods subsequent to the time in which the impairment indicators were first present. Alternatively, if our estimates of future operating cash flows or fair values are understated, impairments might be recognized unnecessarily or in excess of the appropriate amounts. During 2014, primarily as a result of the significant decrease in oil and natural gas prices and also as part of the goodwill impairment process for our Production Testing and Offshore Services reporting units, we recorded consolidated long-lived asset impairments of $34.8 million. During periods of economic uncertainty, the likelihood of additional material impairments of long-lived assets is higher due to the possibility of decreased demand for our products and services.
Impairment of Goodwill
The impairment of goodwill is also assessed whenever impairment indicators are present, but not less than
once annually. The annual assessment for goodwill impairment begins with a qualitative assessment of whether it is “more likely than not” that the fair value of each reporting unit is less than its carrying value. This qualitative assessment requires the evaluation, based on the weight of evidence, of the significance of all identified events and circumstances for each reporting unit. Based on this qualitative assessment, we determined that due to the significant decrease in oil and natural gas commodity prices and the resulting expected negative impact on demand for the products and services for each of our reporting units, it was “more likely than not” that the fair value of each of our reporting units were less than their carrying values as of December 31, 2014. When the qualitative analysis indicates that it is “more likely than not” that a reporting unit’s fair value is less than its carrying value, the resulting goodwill impairment test consists of a two-step accounting test performed on a reporting unit basis. The first step of the impairment test is to compare the estimated fair value with the recorded net book value (including goodwill) of our business. If the estimated fair value is higher than the recorded net book value, no impairment is deemed to exist and no further testing is required. If, however, the carrying amount of the reporting unit exceeds its estimated fair value, an impairment loss is calculated by comparing the carrying amount of the reporting unit’s goodwill to our estimated implied fair value of that goodwill. Our estimates of reporting unit fair value, if required, are based on a
34
combination of an income and market approach. These estimates are imprecise and are subject to our estimates of the future cash flows of each business and our judgment as to how these estimated cash flows translate into each business’ estimated fair value. These estimates and judgments are affected by numerous factors, including the general economic environment at the time of our assessment, which affects our overall market capitalization. If we overestimate the fair value of our reporting units, the balance of our goodwill asset may be overstated. Alternatively, if our estimated reporting unit fair values are understated, impairments might be recognized unnecessarily or in excess of the appropriate amounts.
During the last half of 2014, global oil and natural gas commodity prices, particularly crude oil, decreased significantly. This decrease in commodity prices has had, and is expected to continue to have, a negative impact on industry drilling and capital expenditure activity, which affects the demand for products and services of each of our reporting units. The accompanying decrease in our stock price during the last half of 2014 has also indicated an overall reduction in our market capitalization. As part of our internal annual business outlook for each of our reporting units that we performed during the fourth quarter, we considered changes in the global economic environment which affected our stock price and market capitalization. As part of the first step of goodwill impairment testing, we updated our assessment of the future cash flows for each of our reporting units, applying expected long-term growth rates, discount rates, and terminal values that we consider reasonable for each reporting unit. Our Maritech reporting unit is excluded because it does not contain goodwill. We have calculated a present value of the respective cash flows for each of the other reporting units to arrive at an estimate of fair value under the income approach, and then used the market approach to corroborate these values. Based on these assumptions, we determined that the fair value of our Fluids Division was significantly in excess of its carrying value, which includes approximately $6.6 million of goodwill. Because the fair value of our Compression Division exceeded its carrying value by approximately 4%, there is a reasonable possibility that the $235.7 million of goodwill for this reporting unit may be impaired in a future period, and the amount of such impairment may be material. Specific uncertainties affecting the estimated fair value of our Compression reporting unit includes the impact of competition, prices of oil and natural gas, and future overall activity levels in the regions in which we operate, the activity levels of our significant customers, and other factors affecting the rate of future growth of this reporting unit. These factors will continue to be reviewed and assessed going forward. Negative developments with regard to these factors could have a further negative effect on the fair value of our Compression reporting unit.
Throughout 2014, challenging market conditions for our Production Testing and Offshore Services reporting
units have resulted in both of these reporting units performing below the expectations we had as of December 31, 2013. The late 2014 decrease in commodity prices has further weakened these market conditions. Pricing and activity levels in many of the markets that the Production Testing reporting unit serves have been affected by increased levels of competition. Our Offshore Services reporting unit has experienced decreasing demand for its decommissioning, well abandonment, and contract diving services in the U.S. Gulf of Mexico, the primary market that it serves. Customer delays with regard to significant decommissioning and abandonment projects and the diminished pricing as a result of increased competition for customer projects combined to negatively affect current year profitability for the Offshore Services reporting unit. Accordingly, the fair values for the Production Testing and Offshore Services reporting units were less than their respective carrying values as of December 31, 2014. As part of the second step of goodwill impairment testing, we used the estimated fair value for the Production Testing and Offshore Services reporting units in a hypothetical purchase price allocation of these reporting units. The allocation of the purchase price to these reporting units includes hypothetical adjustments to the carrying values of several asset carrying values, including adjustments to long-lived property, plant and equipment assets, certain intangible assets, and the deferred income taxes associated with these assets. After making these purchase price adjustments, there was $53.3 million residual purchase price to be allocated to the goodwill of Production Testing reporting unit, and no residual purchase price to be allocated to the goodwill of Offshore Services. Based on this analysis, we concluded that an impairment of $60.1 million of the $114.8 million of recorded goodwill for Production Testing was required, and an impairment of the entire $3.9 million of recorded goodwill for Offshore Services was required. Specific uncertainties affecting the estimated fair value of our Production Testing reporting unit include the impact of continued competition, prices of oil and natural gas, future overall activity levels in the regions in which we operate, the activity levels of our significant customers, and other factors affecting the rate of future growth of these reporting units. These factors will continue to be reviewed and assessed during future periods. Negative developments with regard to these factors could have a further negative effect on the fair value of our Production Testing reporting unit and could result in future additional impairment of its goodwill.
35
Decommissioning Liabilities Maritech records a liability associated with the costs of abandoning and decommissioning the wells,
platforms, and pipelines located on its oil and gas leases, as well as removing associated debris. Maritech’s decommissioning liabilities are established based on what Maritech estimates a third party would charge to perform these services. These well abandonment and decommissioning liabilities (referred to as decommissioning liabilities) are recorded net of amounts allocable to joint interest owners. In estimating the decommissioning liabilities, we perform detailed estimating procedures, analysis, and engineering studies. Whenever practical, Maritech settles these decommissioning liabilities by utilizing the services of its affiliated companies to perform well abandonment and decommissioning work. This practice saves us the profit margin that a third party would charge for such services. When these services are performed by an affiliated company, all recorded intercompany revenues are eliminated in the consolidated financial statements. Any difference between our own internal costs to settle the decommissioning liability and the recorded liability is recognized in the period in which we perform the work. The recorded decommissioning liability associated with a specific property is fully extinguished when the property is completely abandoned. Once a Maritech well abandonment and decommissioning project is performed, any remaining decommissioning liability in excess of the actual cost of the work performed is recorded as a gain and is included in earnings in the period in which the project is completed. Conversely, estimated or actual costs in excess of the decommissioning liability are charged against earnings in the period in which the work is estimated or performed.
We review the adequacy of our decommissioning liabilities whenever indicators suggest that either the
amount or timing of the estimated cash flows underlying the liabilities have changed materially. The amount of cash flows necessary to abandon and decommission the property is subject to changes due to seasonal demand, increased demand following hurricanes, regulatory changes, and other general changes in the energy industry environment. Accordingly, the estimation of our decommissioning liabilities is imprecise. Asset retirement obligations are recorded in accordance with FASB ASC 410, whereby the estimated fair value of a liability for asset retirement obligations is recorded in the period in which it is incurred and in which a reasonable estimate can be made. Such estimates are based on relevant assumptions that we believe are reasonable. The cost estimates for Maritech asset retirement obligations are considered reasonable estimates consistent with market conditions at the time they are made, and we believe they reflect the amount of work legally obligated to be performed in accordance with BSEE standards, as revised from time to time. The amount of work performed or estimated to be performed on a Maritech property asset retirement obligation may often exceed amounts previously estimated for numerous reasons. Property conditions encountered, including subsea, geological, or downhole conditions, may be different from those anticipated at the time of estimation due to the age of the property and the quality of information available about the particular property conditions. Maritech’s remaining oil and gas properties and production platforms were drilled and constructed by other operators many years ago, and frequently there is not a great deal of detailed documentation on which to base the estimated asset retirement obligation for these properties. Appropriate underwater surveys are performed to determine the condition of such properties as part of our due diligence in estimating the costs, but not all conditions have been able to be determined prior to the commencement of the actual work. Certain remaining Maritech properties were damaged by hurricanes in the past, leaving their production platforms leaning or toppled on the seabed and production tubing from the wells (which may be under high pressure) bent under the water. While the basic procedures involved in the plugging and abandonment of wells and decommissioning of platforms and pipelines and removal of debris is generally similar for these properties, the cost of performing work at these damaged locations is particularly difficult to estimate due to the unique conditions encountered, including the uncertainty regarding the extent of physical damage to many of the structures. During the performance of asset retirement activities, unforeseen weather or other conditions may extend the duration and increase the cost of the projects, which are normally not done on a fixed price basis, thereby resulting in costs in excess of the original estimate. In addition, Maritech has encountered situations where previously plugged and abandoned wells on its properties have later exhibited a build-up of pressure, which is evidenced by gas bubbles coming from the plugged well head. We refer to this situation as “wells under pressure” and this can either be discovered when performing additional work at the property or by notification from a third party. Wells under pressure require Maritech to return to the site to perform additional plug and abandonment procedures that were not originally anticipated and included in the estimate of the asset retirement obligation for such property. Remediation work at previously abandoned well sites is particularly costly, due to the lack of a platform from which to base these activities. Maritech is the last
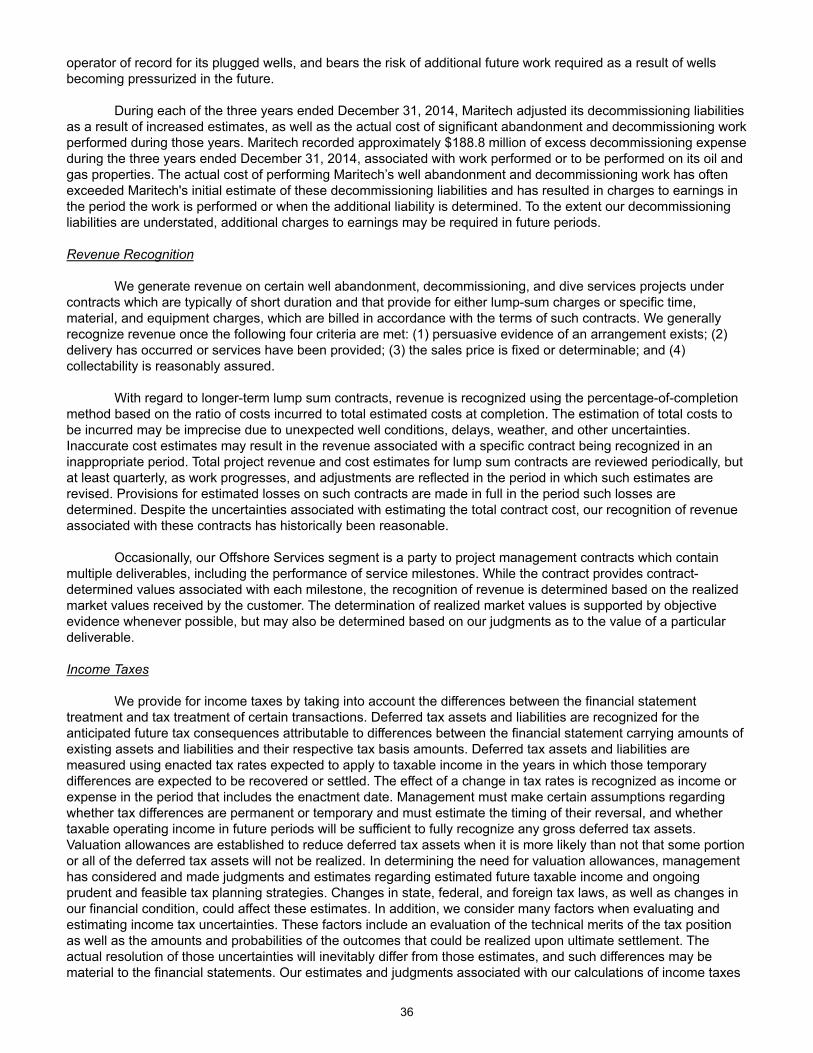
36
operator of record for its plugged wells, and bears the risk of additional future work required as a result of wells becoming pressurized in the future.
During each of the three years ended December 31, 2014, Maritech adjusted its decommissioning liabilities as a result of increased estimates, as well as the actual cost of significant abandonment and decommissioning work performed during those years. Maritech recorded approximately $188.8 million of excess decommissioning expense during the three years ended December 31, 2014, associated with work performed or to be performed on its oil and gas properties. The actual cost of performing Maritech’s well abandonment and decommissioning work has often exceeded Maritech's initial estimate of these decommissioning liabilities and has resulted in charges to earnings in the period the work is performed or when the additional liability is determined. To the extent our decommissioning liabilities are understated, additional charges to earnings may be required in future periods.
Revenue Recognition
We generate revenue on certain well abandonment, decommissioning, and dive services projects under
contracts which are typically of short duration and that provide for either lump-sum charges or specific time, material, and equipment charges, which are billed in accordance with the terms of such contracts. We generally recognize revenue once the following four criteria are met: (1) persuasive evidence of an arrangement exists; (2) delivery has occurred or services have been provided; (3) the sales price is fixed or determinable; and (4) collectability is reasonably assured.
With regard to longer-term lump sum contracts, revenue is recognized using the percentage-of-completion
method based on the ratio of costs incurred to total estimated costs at completion. The estimation of total costs to be incurred may be imprecise due to unexpected well conditions, delays, weather, and other uncertainties. Inaccurate cost estimates may result in the revenue associated with a specific contract being recognized in an inappropriate period. Total project revenue and cost estimates for lump sum contracts are reviewed periodically, but at least quarterly, as work progresses, and adjustments are reflected in the period in which such estimates are revised. Provisions for estimated losses on such contracts are made in full in the period such losses are determined. Despite the uncertainties associated with estimating the total contract cost, our recognition of revenue associated with these contracts has historically been reasonable.
Occasionally, our Offshore Services segment is a party to project management contracts which contain
multiple deliverables, including the performance of service milestones. While the contract provides contract-determined values associated with each milestone, the recognition of revenue is determined based on the realized market values received by the customer. The determination of realized market values is supported by objective evidence whenever possible, but may also be determined based on our judgments as to the value of a particular deliverable.
Income Taxes
We provide for income taxes by taking into account the differences between the financial statement
treatment and tax treatment of certain transactions. Deferred tax assets and liabilities are recognized for the anticipated future tax consequences attributable to differences between the financial statement carrying amounts of existing assets and liabilities and their respective tax basis amounts. Deferred tax assets and liabilities are measured using enacted tax rates expected to apply to taxable income in the years in which those temporary differences are expected to be recovered or settled. The effect of a change in tax rates is recognized as income or expense in the period that includes the enactment date. Management must make certain assumptions regarding whether tax differences are permanent or temporary and must estimate the timing of their reversal, and whether taxable operating income in future periods will be sufficient to fully recognize any gross deferred tax assets. Valuation allowances are established to reduce deferred tax assets when it is more likely than not that some portion or all of the deferred tax assets will not be realized. In determining the need for valuation allowances, management has considered and made judgments and estimates regarding estimated future taxable income and ongoing prudent and feasible tax planning strategies. Changes in state, federal, and foreign tax laws, as well as changes in our financial condition, could affect these estimates. In addition, we consider many factors when evaluating and estimating income tax uncertainties. These factors include an evaluation of the technical merits of the tax position as well as the amounts and probabilities of the outcomes that could be realized upon ultimate settlement. The actual resolution of those uncertainties will inevitably differ from those estimates, and such differences may be material to the financial statements. Our estimates and judgments associated with our calculations of income taxes
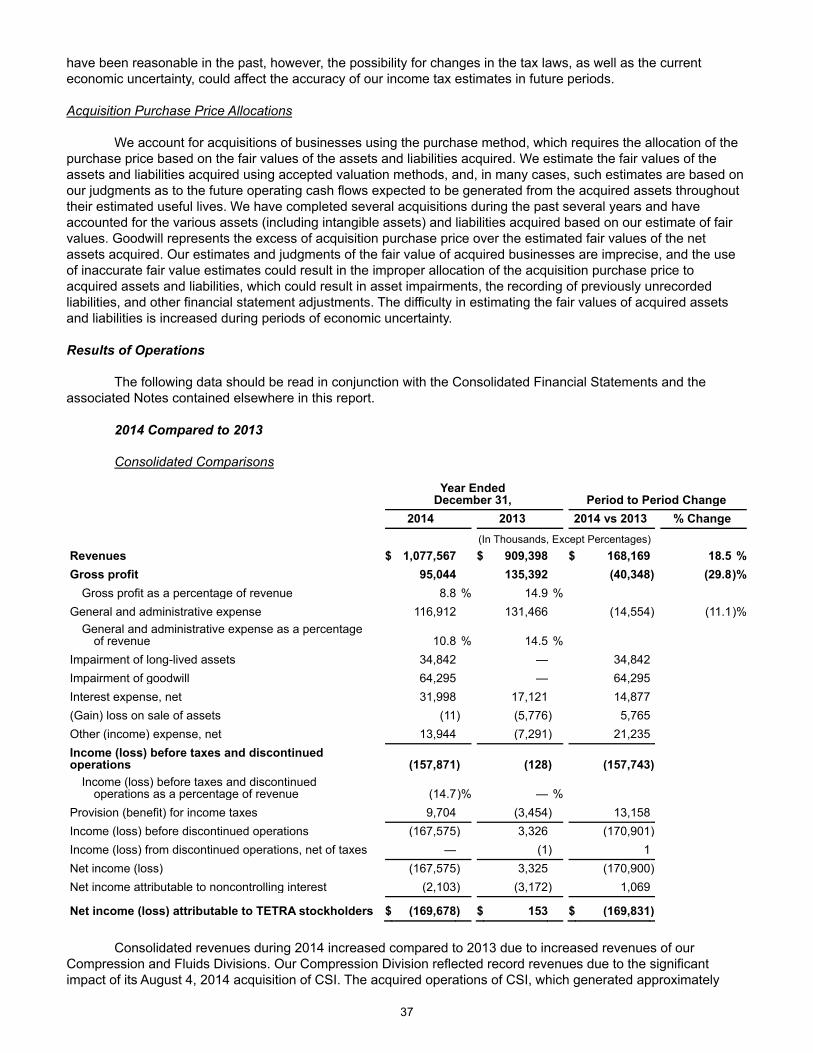
37
have been reasonable in the past, however, the possibility for changes in the tax laws, as well as the current economic uncertainty, could affect the accuracy of our income tax estimates in future periods.
Acquisition Purchase Price Allocations
We account for acquisitions of businesses using the purchase method, which requires the allocation of the
purchase price based on the fair values of the assets and liabilities acquired. We estimate the fair values of the assets and liabilities acquired using accepted valuation methods, and, in many cases, such estimates are based on our judgments as to the future operating cash flows expected to be generated from the acquired assets throughout their estimated useful lives. We have completed several acquisitions during the past several years and have accounted for the various assets (including intangible assets) and liabilities acquired based on our estimate of fair values. Goodwill represents the excess of acquisition purchase price over the estimated fair values of the net assets acquired. Our estimates and judgments of the fair value of acquired businesses are imprecise, and the use of inaccurate fair value estimates could result in the improper allocation of the acquisition purchase price to acquired assets and liabilities, which could result in asset impairments, the recording of previously unrecorded liabilities, and other financial statement adjustments. The difficulty in estimating the fair values of acquired assets and liabilities is increased during periods of economic uncertainty. Results of Operations
The following data should be read in conjunction with the Consolidated Financial Statements and the associated Notes contained elsewhere in this report.
2014 Compared to 2013 Consolidated Comparisons
Year Ended
December 31, Period to Period Change 2014 2013 2014 vs 2013 % Change (In Thousands, Except Percentages) Revenues $ 1,077,567 $ 909,398 $ 168,169 18.5 %Gross profit 95,044 135,392 (40,348) (29.8)%
Gross profit as a percentage of revenue 8.8 % 14.9 % General and administrative expense 116,912 131,466 (14,554) (11.1)%
General and administrative expense as a percentage of revenue 10.8 % 14.5 %
Impairment of long-lived assets 34,842 — 34,842 Impairment of goodwill 64,295 — 64,295 Interest expense, net 31,998 17,121 14,877 (Gain) loss on sale of assets (11) (5,776) 5,765 Other (income) expense, net 13,944 (7,291) 21,235 Income (loss) before taxes and discontinued operations (157,871) (128) (157,743)
Income (loss) before taxes and discontinued operations as a percentage of revenue (14.7)% — %
Provision (benefit) for income taxes 9,704 (3,454) 13,158 Income (loss) before discontinued operations (167,575) 3,326 (170,901)Income (loss) from discontinued operations, net of taxes — (1) 1 Net income (loss) (167,575) 3,325 (170,900)Net income attributable to noncontrolling interest (2,103) (3,172) 1,069
Net income (loss) attributable to TETRA stockholders $ (169,678) $ 153 $ (169,831)
Consolidated revenues during 2014 increased compared to 2013 due to increased revenues of our
Compression and Fluids Divisions. Our Compression Division reflected record revenues due to the significant impact of its August 4, 2014 acquisition of CSI. The acquired operations of CSI, which generated approximately
38
$152.5 million of revenues subsequent to the August 4, 2014 acquisition closing date, significantly expands the scope of our Compression Division, which now provides a full range of compression products and services that cover compression needs throughout the entire natural gas production and transportation cycle. Growth of the Fluids Division's onshore water management business and the increased sales of its manufactured products resulted in record revenues for this segment during 2014. However, these increases were partially offset by decreased activity by our Offshore Services and Production Testing Divisions. Offshore Services experienced decreased demand throughout 2014 for all of its services, including heavy lift, contract diving, and well abandonment businesses. Production Testing showed improved revenues during the last half of 2014 compared to 2013, as it continued to replace decreased activity by certain significant customers. Consolidated gross profit decreased, despite the increased profitability of the Compression Division, primarily due to the decreased Offshore Services and Production Testing profitability that reflected the decreased demand for services and the impact of approximately $34.8 million of asset impairments during the fourth quarter of 2014. Similar to 2013, Maritech recorded charges to earnings of approximately $73.2 million for excess decommissioning costs during 2014, largely due to remediation work determined to be required on previously abandoned wells. We continue to critically review our consolidated cost structure, particularly in response to expected lower activity levels as a result of lower oil and natural gas commodity pricing.
Consolidated general and administrative expenses increased during 2014 compared to the prior year due
to increased Compression Division expenses associated with the acquired operations of CSI, as well as approximately $8.7 million of consolidated transaction costs, primarily for the CSI Acquisition. Decreased general and administrative expenses during 2014 for our Production Testing, Maritech, Offshore Services, and Corporate Divisions compared to 2013 reflect overall cost reduction efforts, which consisted of headcount reductions and other reduced employee-related expenses. Such cost reduction efforts are expected to continue during 2015 in response to anticipated decreased activity levels.
Following the fourth quarter of 2014, we performed an annual test of goodwill impairment in accordance with Accounting Standards Codification 350-20 "Goodwill" ("ASC 350-20"). During the last half of 2014, global oil and natural gas commodity prices, particularly oil, decreased significantly. This decrease in commodity prices is expected to have a negative impact on industry drilling and capital expenditure activity, which affects the demand for products and services of each of our reporting units. This expected decreased demand particularly affects the future levels of revenues and cash flows of our Production Testing and Offshore Services reporting units, which were experiencing challenging market conditions prior to mid-2014. The accompanying decrease in our stock price during the last half of 2014 has also caused an overall reduction in our market capitalization. As part of the test of goodwill impairment, we have estimated the fair value of each our reporting units, and have determined, based on these estimated values, that an impairment of the goodwill of our Production Testing and Offshore Services reporting units was necessary, primarily due to the market factors discussed above. Accordingly, during the fourth quarter of 2014, we recorded total impairment charges of $64.3 million associated with the goodwill of these reporting units.
Consolidated interest expense increased due to increased borrowings, primarily related to Compression
borrowings under CCLP's new revolving credit facility and 7.25% Senior Notes, which were used to fund a portion of the CSI Acquisition purchase price. Compression Division interest expense levels going forward are expected to continue to be increased significantly compared to 2014 as a result of CCLP borrowings.
Consolidated gains on sale of assets decreased during 2014 primarily due to the sale by Maritech of one of its remaining oil and gas properties during 2013.
Consolidated other expense was approximately $13.9 million during 2014 compared to $6.3 million of other
income during the prior year. In connection with the CSI Acquisition, our Compression Division incurred approximately $9.3 million of one-time interim financing costs during 2014. The current year other expense was recorded despite a $5.7 million gain associated with the first quarter of 2014 acquisition of the interest in TETRA Arabia that we did not previously own. This gain was partially offset by a $2.9 million charge associated with the settlement of the pre-existing relationship with the other shareholder. Other income was recorded during 2013, as prior to the acquisition of the remaining interest of TETRA Arabia, the net earnings from TETRA Arabia were included in other income.
Despite the significant pre-tax loss for the year ended December 31, 2014, we recorded a provision for
income tax during the year, primarily due to the recording of a valuation allowance on U.S. federal deferred tax assets in the amount of approximately $69.9 million as well as an additional valuation allowance on a portion of our
39
state and foreign deferred tax assets. We establish a valuation allowance to reduce the deferred tax assets when it is more likely than not that some portion or all of the deferred tax assets will not be realized. We considered all available evidence, both positive and negative, in determining whether, based on the weight of that evidence, a valuation allowance is needed for some portion or all of our deferred tax assets. In determining the need for a valuation allowance on our deferred tax assets we placed greater weight on recent and objectively verifiable current information, as compared to more forward-looking information that is used in valuing other assets on the balance sheet or making going concern determinations.
Divisional Comparisons Fluids Division
Year Ended
December 31, Period to Period Change 2014 2013 2014 vs 2013 % Change (In Thousands, Except Percentages) Revenues $ 437,362 $ 382,663 $ 54,699 14.3 %Gross profit 97,806 100,106 (2,300) (2.3)%
Gross profit as a percentage of revenue 22.4% 26.2% General and administrative expense 35,625 32,648 2,977 9.1 %
General and administrative expense as a percentage of revenue 8.1% 8.5%
Interest (income) expense, net (250) (148) (102) Other (income) expense, net (2,274) (1,832) (442)
Income before taxes and discontinued operations $ 64,705 $ 69,438 $ (4,733) (6.8)%Income before taxes and discontinued operations as a
percentage of revenue 14.8% 18.1%
The increase in Fluids Division revenues during 2014 compared to 2013 was primarily due to approximately
$41.1 million of increased services revenues, largely due to increased water management services revenue, which includes the impact of the January 2014 acquisition of TD Water Transfer and the continuing growth of our water management business, despite increased competition. Fluids Division revenues also increased due to the growth of our foreign completion services revenues, including approximately $13.3 million due to the January 2014 acquisition of the additional 50% interest in TETRA Arabia that resulted in this entity becoming a wholly owned consolidated subsidiary. The Fluids Division also reported approximately $13.6 million of increased product sales revenues, due to increased demand for calcium chloride products, both in the U.S. and in Europe. This increase in manufactured products sales revenues was partially offset by decreased CBF product sales, as increases in foreign and U.S. onshore CBF product sales revenues were more than offset by decreased U.S. offshore CBF product sales revenues that were primarily caused by customer operational delays.
Fluids Division gross profit decreased compared to 2013, primarily due to the impact of the reduced Gulf of Mexico CBF activity, as well as from increased competition and operating costs for our water management business. This decrease more than offset the increased gross profit associated with foreign CBF product sales and the consolidation of TETRA Arabia. In addition, gross profit was negatively impacted by approximately $2.1 million of charges to earnings for unused water management inventory and $6.5 million of long-lived asset impairments, primarily associated with expected decreased utilization of certain water management equipment and our Brazil CBF facility, which has suspended its operation due to the termination of its customer CBF product sales contract during 2014. The Fluids Division is reviewing its cost structure in light of expected decreasing activity levels for its oil and gas industry customers as a result of decreased commodity prices.
Fluids Division income before taxes decreased compared to the prior year due to the decrease in gross
profit discussed above and due to increased general and administrative costs. Fluids Division administrative costs increased primarily due to increased personnel-related costs, partially offset by decreased professional fee expenses. Other income increased during the current year period, due to a $2.7 million allocated portion of the remeasurement gain recorded from the January 2014 acquisition of the remaining interest in TETRA Arabia. In connection with this acquisition, we recorded a $5.7 million consolidated gain from the fair value remeasurement of
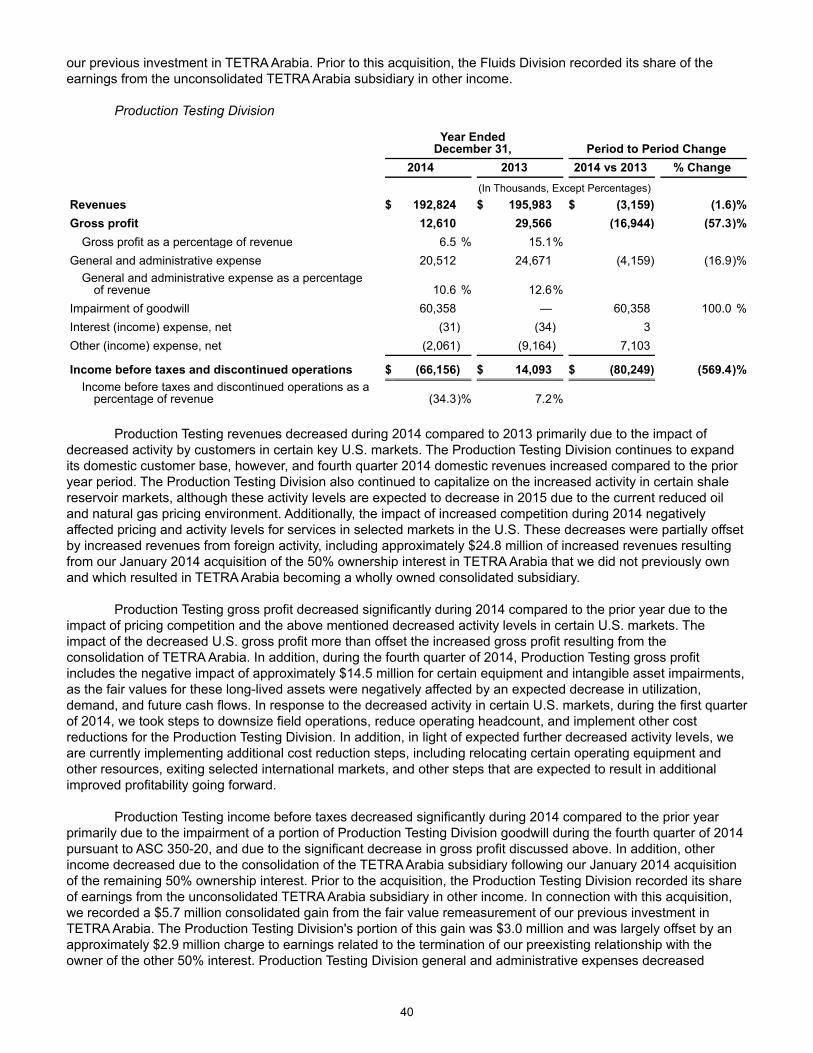
40
our previous investment in TETRA Arabia. Prior to this acquisition, the Fluids Division recorded its share of the earnings from the unconsolidated TETRA Arabia subsidiary in other income.
Production Testing Division
Year Ended
December 31, Period to Period Change 2014 2013 2014 vs 2013 % Change (In Thousands, Except Percentages) Revenues $ 192,824 $ 195,983 $ (3,159) (1.6)%Gross profit 12,610 29,566 (16,944) (57.3)%
Gross profit as a percentage of revenue 6.5 % 15.1% General and administrative expense 20,512 24,671 (4,159) (16.9)%
General and administrative expense as a percentage of revenue 10.6 % 12.6%
Impairment of goodwill 60,358 — 60,358 100.0 %Interest (income) expense, net (31) (34) 3 Other (income) expense, net (2,061) (9,164) 7,103
Income before taxes and discontinued operations $ (66,156) $ 14,093 $ (80,249) (569.4)%Income before taxes and discontinued operations as a
percentage of revenue (34.3)% 7.2%
Production Testing revenues decreased during 2014 compared to 2013 primarily due to the impact of decreased activity by customers in certain key U.S. markets. The Production Testing Division continues to expand its domestic customer base, however, and fourth quarter 2014 domestic revenues increased compared to the prior year period. The Production Testing Division also continued to capitalize on the increased activity in certain shale reservoir markets, although these activity levels are expected to decrease in 2015 due to the current reduced oil and natural gas pricing environment. Additionally, the impact of increased competition during 2014 negatively affected pricing and activity levels for services in selected markets in the U.S. These decreases were partially offset by increased revenues from foreign activity, including approximately $24.8 million of increased revenues resulting from our January 2014 acquisition of the 50% ownership interest in TETRA Arabia that we did not previously own and which resulted in TETRA Arabia becoming a wholly owned consolidated subsidiary.
Production Testing gross profit decreased significantly during 2014 compared to the prior year due to the impact of pricing competition and the above mentioned decreased activity levels in certain U.S. markets. The impact of the decreased U.S. gross profit more than offset the increased gross profit resulting from the consolidation of TETRA Arabia. In addition, during the fourth quarter of 2014, Production Testing gross profit includes the negative impact of approximately $14.5 million for certain equipment and intangible asset impairments, as the fair values for these long-lived assets were negatively affected by an expected decrease in utilization, demand, and future cash flows. In response to the decreased activity in certain U.S. markets, during the first quarter of 2014, we took steps to downsize field operations, reduce operating headcount, and implement other cost reductions for the Production Testing Division. In addition, in light of expected further decreased activity levels, we are currently implementing additional cost reduction steps, including relocating certain operating equipment and other resources, exiting selected international markets, and other steps that are expected to result in additional improved profitability going forward.
Production Testing income before taxes decreased significantly during 2014 compared to the prior year
primarily due to the impairment of a portion of Production Testing Division goodwill during the fourth quarter of 2014 pursuant to ASC 350-20, and due to the significant decrease in gross profit discussed above. In addition, other income decreased due to the consolidation of the TETRA Arabia subsidiary following our January 2014 acquisition of the remaining 50% ownership interest. Prior to the acquisition, the Production Testing Division recorded its share of earnings from the unconsolidated TETRA Arabia subsidiary in other income. In connection with this acquisition, we recorded a $5.7 million consolidated gain from the fair value remeasurement of our previous investment in TETRA Arabia. The Production Testing Division's portion of this gain was $3.0 million and was largely offset by an approximately $2.9 million charge to earnings related to the termination of our preexisting relationship with the owner of the other 50% interest. Production Testing Division general and administrative expenses decreased
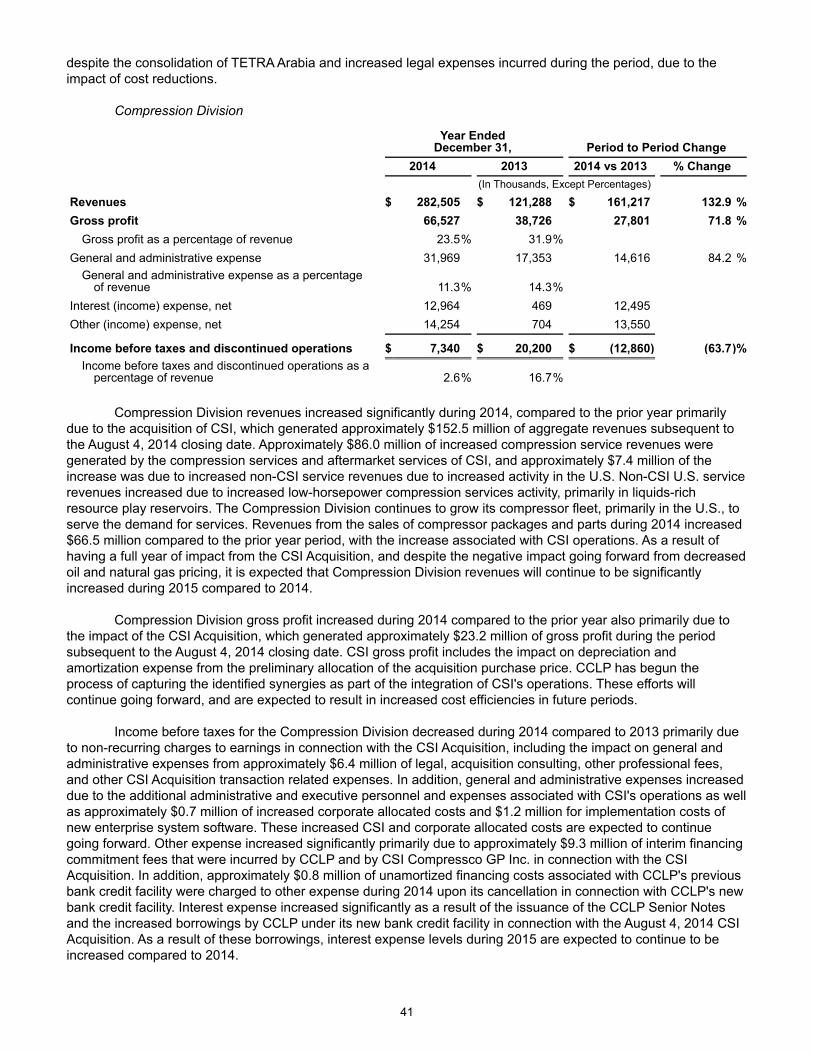
41
despite the consolidation of TETRA Arabia and increased legal expenses incurred during the period, due to the impact of cost reductions.
Compression Division
Year Ended
December 31, Period to Period Change 2014 2013 2014 vs 2013 % Change (In Thousands, Except Percentages)
Revenues $ 282,505 $ 121,288 $ 161,217 132.9 %Gross profit 66,527 38,726 27,801 71.8 %
Gross profit as a percentage of revenue 23.5% 31.9% General and administrative expense 31,969 17,353 14,616 84.2 %
General and administrative expense as a percentage of revenue 11.3% 14.3%
Interest (income) expense, net 12,964 469 12,495 Other (income) expense, net 14,254 704 13,550
Income before taxes and discontinued operations $ 7,340 $ 20,200 $ (12,860) (63.7)%Income before taxes and discontinued operations as a
percentage of revenue 2.6% 16.7%
Compression Division revenues increased significantly during 2014, compared to the prior year primarily due to the acquisition of CSI, which generated approximately $152.5 million of aggregate revenues subsequent to the August 4, 2014 closing date. Approximately $86.0 million of increased compression service revenues were generated by the compression services and aftermarket services of CSI, and approximately $7.4 million of the increase was due to increased non-CSI service revenues due to increased activity in the U.S. Non-CSI U.S. service revenues increased due to increased low-horsepower compression services activity, primarily in liquids-rich resource play reservoirs. The Compression Division continues to grow its compressor fleet, primarily in the U.S., to serve the demand for services. Revenues from the sales of compressor packages and parts during 2014 increased $66.5 million compared to the prior year period, with the increase associated with CSI operations. As a result of having a full year of impact from the CSI Acquisition, and despite the negative impact going forward from decreased oil and natural gas pricing, it is expected that Compression Division revenues will continue to be significantly increased during 2015 compared to 2014.
Compression Division gross profit increased during 2014 compared to the prior year also primarily due to the impact of the CSI Acquisition, which generated approximately $23.2 million of gross profit during the period subsequent to the August 4, 2014 closing date. CSI gross profit includes the impact on depreciation and amortization expense from the preliminary allocation of the acquisition purchase price. CCLP has begun the process of capturing the identified synergies as part of the integration of CSI's operations. These efforts will continue going forward, and are expected to result in increased cost efficiencies in future periods.
Income before taxes for the Compression Division decreased during 2014 compared to 2013 primarily due to non-recurring charges to earnings in connection with the CSI Acquisition, including the impact on general and administrative expenses from approximately $6.4 million of legal, acquisition consulting, other professional fees, and other CSI Acquisition transaction related expenses. In addition, general and administrative expenses increased due to the additional administrative and executive personnel and expenses associated with CSI's operations as well as approximately $0.7 million of increased corporate allocated costs and $1.2 million for implementation costs of new enterprise system software. These increased CSI and corporate allocated costs are expected to continue going forward. Other expense increased significantly primarily due to approximately $9.3 million of interim financing commitment fees that were incurred by CCLP and by CSI Compressco GP Inc. in connection with the CSI Acquisition. In addition, approximately $0.8 million of unamortized financing costs associated with CCLP's previous bank credit facility were charged to other expense during 2014 upon its cancellation in connection with CCLP's new bank credit facility. Interest expense increased significantly as a result of the issuance of the CCLP Senior Notes and the increased borrowings by CCLP under its new bank credit facility in connection with the August 4, 2014 CSI Acquisition. As a result of these borrowings, interest expense levels during 2015 are expected to continue to be increased compared to 2014.
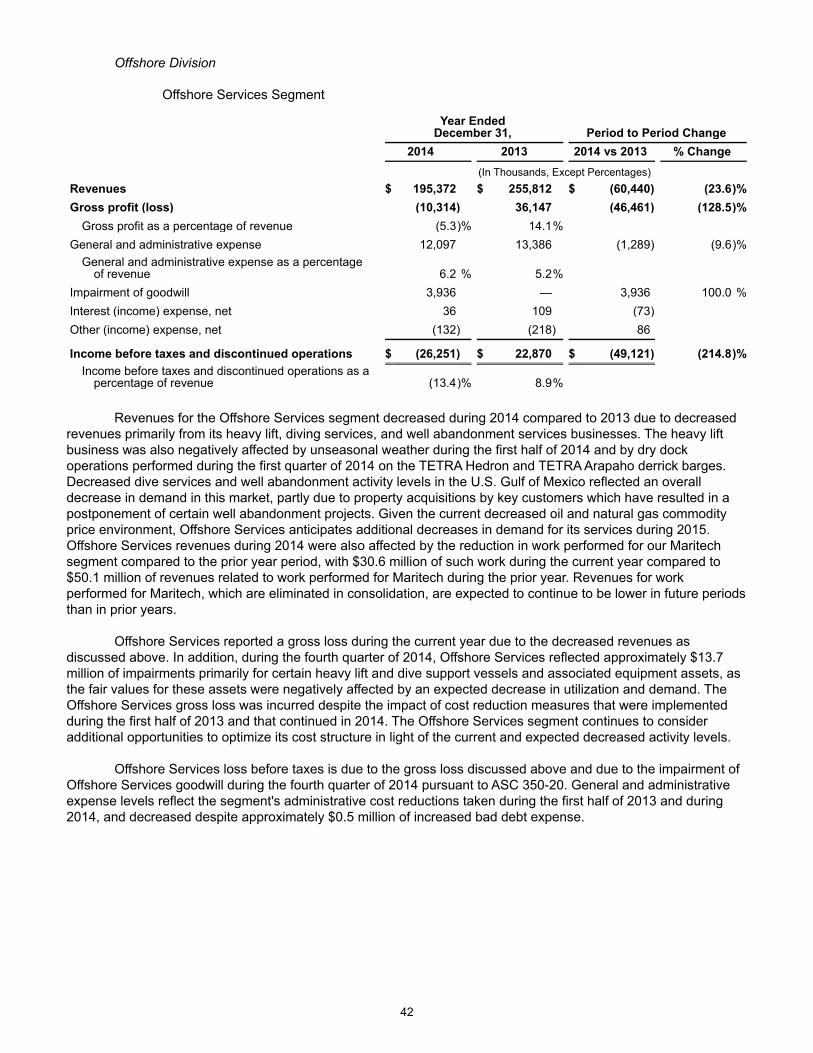
42
Offshore Division
Offshore Services Segment
Year Ended
December 31, Period to Period Change 2014 2013 2014 vs 2013 % Change (In Thousands, Except Percentages) Revenues $ 195,372 $ 255,812 $ (60,440) (23.6)%Gross profit (loss) (10,314) 36,147 (46,461) (128.5)%
Gross profit as a percentage of revenue (5.3)% 14.1% General and administrative expense 12,097 13,386 (1,289) (9.6)%
General and administrative expense as a percentage of revenue 6.2 % 5.2%
Impairment of goodwill 3,936 — 3,936 100.0 %Interest (income) expense, net 36 109 (73) Other (income) expense, net (132) (218) 86
Income before taxes and discontinued operations $ (26,251) $ 22,870 $ (49,121) (214.8)%Income before taxes and discontinued operations as a
percentage of revenue (13.4)% 8.9%
Revenues for the Offshore Services segment decreased during 2014 compared to 2013 due to decreased
revenues primarily from its heavy lift, diving services, and well abandonment services businesses. The heavy lift business was also negatively affected by unseasonal weather during the first half of 2014 and by dry dock operations performed during the first quarter of 2014 on the TETRA Hedron and TETRA Arapaho derrick barges. Decreased dive services and well abandonment activity levels in the U.S. Gulf of Mexico reflected an overall decrease in demand in this market, partly due to property acquisitions by key customers which have resulted in a postponement of certain well abandonment projects. Given the current decreased oil and natural gas commodity price environment, Offshore Services anticipates additional decreases in demand for its services during 2015. Offshore Services revenues during 2014 were also affected by the reduction in work performed for our Maritech segment compared to the prior year period, with $30.6 million of such work during the current year compared to $50.1 million of revenues related to work performed for Maritech during the prior year. Revenues for work performed for Maritech, which are eliminated in consolidation, are expected to continue to be lower in future periods than in prior years.
Offshore Services reported a gross loss during the current year due to the decreased revenues as discussed above. In addition, during the fourth quarter of 2014, Offshore Services reflected approximately $13.7 million of impairments primarily for certain heavy lift and dive support vessels and associated equipment assets, as the fair values for these assets were negatively affected by an expected decrease in utilization and demand. The Offshore Services gross loss was incurred despite the impact of cost reduction measures that were implemented during the first half of 2013 and that continued in 2014. The Offshore Services segment continues to consider additional opportunities to optimize its cost structure in light of the current and expected decreased activity levels.
Offshore Services loss before taxes is due to the gross loss discussed above and due to the impairment of
Offshore Services goodwill during the fourth quarter of 2014 pursuant to ASC 350-20. General and administrative expense levels reflect the segment's administrative cost reductions taken during the first half of 2013 and during 2014, and decreased despite approximately $0.5 million of increased bad debt expense.
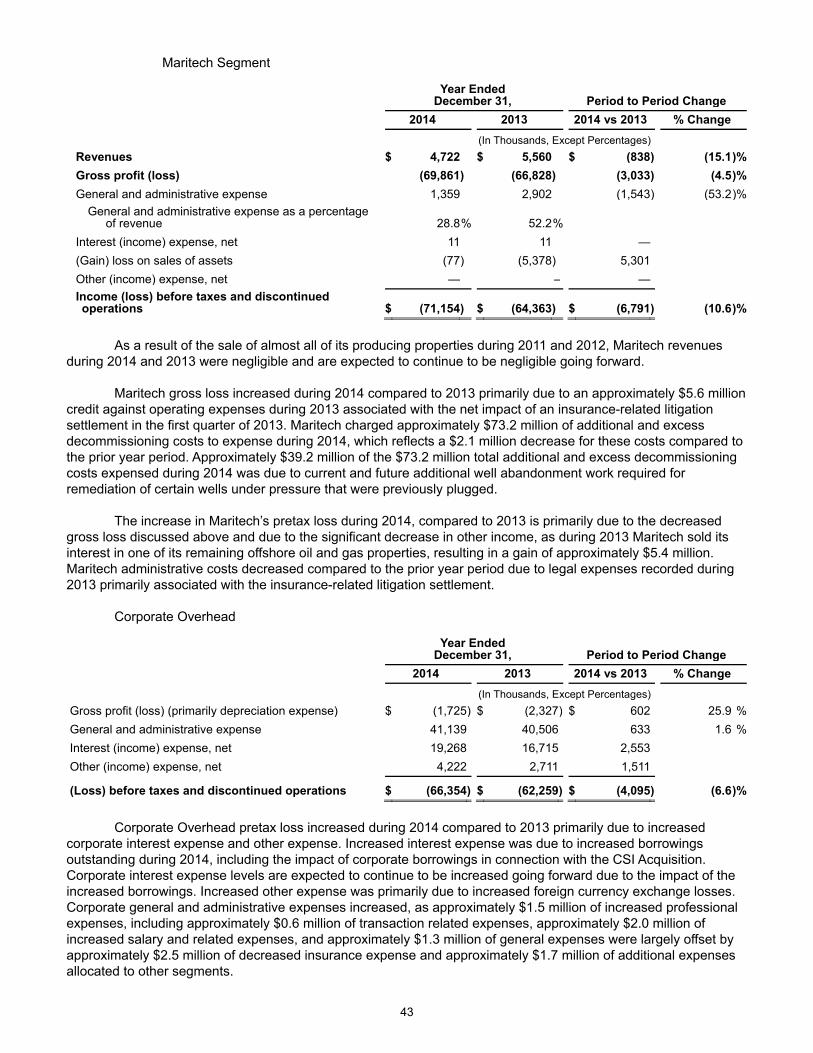
43
Maritech Segment
Year Ended
December 31, Period to Period Change 2014 2013 2014 vs 2013 % Change (In Thousands, Except Percentages) Revenues $ 4,722 $ 5,560 $ (838) (15.1)%Gross profit (loss) (69,861) (66,828) (3,033) (4.5)%General and administrative expense 1,359 2,902 (1,543) (53.2)%
General and administrative expense as a percentage of revenue 28.8% 52.2%
Interest (income) expense, net 11 11 — (Gain) loss on sales of assets (77) (5,378) 5,301 Other (income) expense, net — – — Income (loss) before taxes and discontinued operations $ (71,154) $ (64,363) $ (6,791) (10.6)%
As a result of the sale of almost all of its producing properties during 2011 and 2012, Maritech revenues
during 2014 and 2013 were negligible and are expected to continue to be negligible going forward. Maritech gross loss increased during 2014 compared to 2013 primarily due to an approximately $5.6 million
credit against operating expenses during 2013 associated with the net impact of an insurance-related litigation settlement in the first quarter of 2013. Maritech charged approximately $73.2 million of additional and excess decommissioning costs to expense during 2014, which reflects a $2.1 million decrease for these costs compared to the prior year period. Approximately $39.2 million of the $73.2 million total additional and excess decommissioning costs expensed during 2014 was due to current and future additional well abandonment work required for remediation of certain wells under pressure that were previously plugged.
The increase in Maritech’s pretax loss during 2014, compared to 2013 is primarily due to the decreased
gross loss discussed above and due to the significant decrease in other income, as during 2013 Maritech sold its interest in one of its remaining offshore oil and gas properties, resulting in a gain of approximately $5.4 million. Maritech administrative costs decreased compared to the prior year period due to legal expenses recorded during 2013 primarily associated with the insurance-related litigation settlement.
Corporate Overhead
Year Ended
December 31, Period to Period Change 2014 2013 2014 vs 2013 % Change (In Thousands, Except Percentages) Gross profit (loss) (primarily depreciation expense) $ (1,725) $ (2,327) $ 602 25.9 %General and administrative expense 41,139 40,506 633 1.6 %Interest (income) expense, net 19,268 16,715 2,553 Other (income) expense, net 4,222 2,711 1,511
(Loss) before taxes and discontinued operations $ (66,354) $ (62,259) $ (4,095) (6.6)%
Corporate Overhead pretax loss increased during 2014 compared to 2013 primarily due to increased
corporate interest expense and other expense. Increased interest expense was due to increased borrowings outstanding during 2014, including the impact of corporate borrowings in connection with the CSI Acquisition. Corporate interest expense levels are expected to continue to be increased going forward due to the impact of the increased borrowings. Increased other expense was primarily due to increased foreign currency exchange losses. Corporate general and administrative expenses increased, as approximately $1.5 million of increased professional expenses, including approximately $0.6 million of transaction related expenses, approximately $2.0 million of increased salary and related expenses, and approximately $1.3 million of general expenses were largely offset by approximately $2.5 million of decreased insurance expense and approximately $1.7 million of additional expenses allocated to other segments.
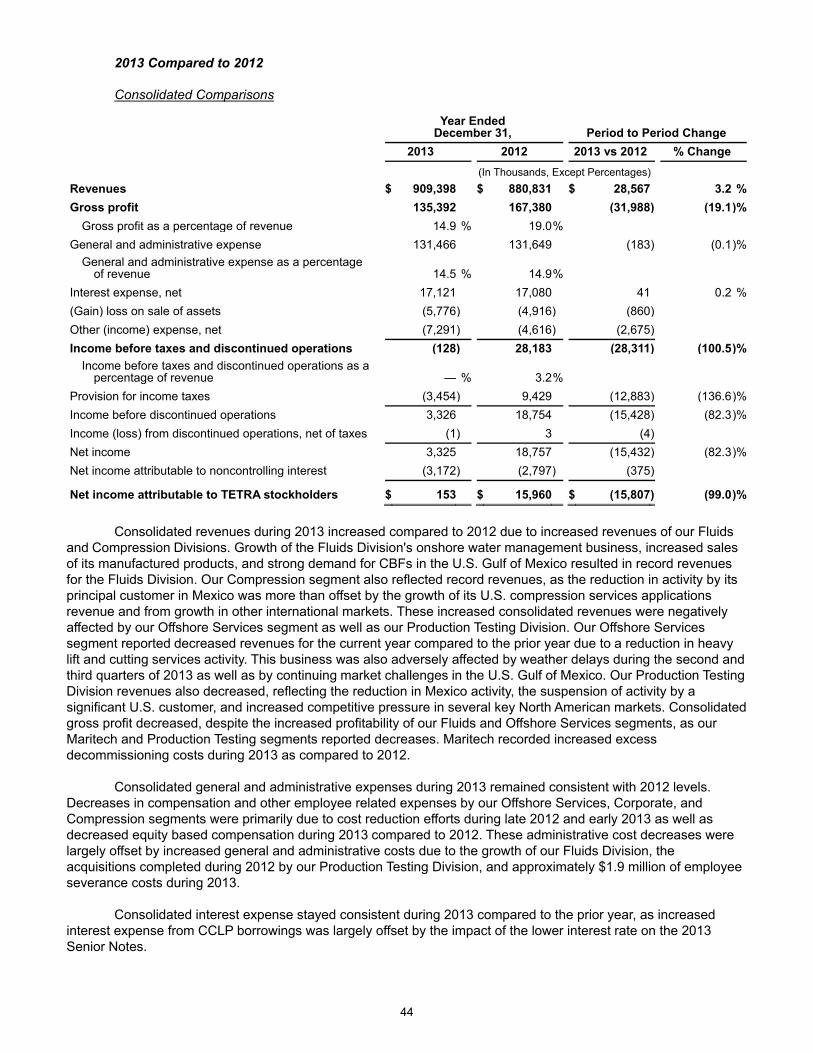
44
2013 Compared to 2012 Consolidated Comparisons
Year Ended
December 31, Period to Period Change 2013 2012 2013 vs 2012 % Change (In Thousands, Except Percentages) Revenues $ 909,398 $ 880,831 $ 28,567 3.2 %Gross profit 135,392 167,380 (31,988) (19.1)%
Gross profit as a percentage of revenue 14.9 % 19.0% General and administrative expense 131,466 131,649 (183) (0.1)%
General and administrative expense as a percentage of revenue 14.5 % 14.9%
Interest expense, net 17,121 17,080 41 0.2 %(Gain) loss on sale of assets (5,776) (4,916) (860) Other (income) expense, net (7,291) (4,616) (2,675) Income before taxes and discontinued operations (128) 28,183 (28,311) (100.5)%
Income before taxes and discontinued operations as a percentage of revenue — % 3.2%
Provision for income taxes (3,454) 9,429 (12,883) (136.6)%Income before discontinued operations 3,326 18,754 (15,428) (82.3)%Income (loss) from discontinued operations, net of taxes (1) 3 (4) Net income 3,325 18,757 (15,432) (82.3)%Net income attributable to noncontrolling interest (3,172) (2,797) (375)
Net income attributable to TETRA stockholders $ 153 $ 15,960 $ (15,807) (99.0)%
Consolidated revenues during 2013 increased compared to 2012 due to increased revenues of our Fluids
and Compression Divisions. Growth of the Fluids Division's onshore water management business, increased sales of its manufactured products, and strong demand for CBFs in the U.S. Gulf of Mexico resulted in record revenues for the Fluids Division. Our Compression segment also reflected record revenues, as the reduction in activity by its principal customer in Mexico was more than offset by the growth of its U.S. compression services applications revenue and from growth in other international markets. These increased consolidated revenues were negatively affected by our Offshore Services segment as well as our Production Testing Division. Our Offshore Services segment reported decreased revenues for the current year compared to the prior year due to a reduction in heavy lift and cutting services activity. This business was also adversely affected by weather delays during the second and third quarters of 2013 as well as by continuing market challenges in the U.S. Gulf of Mexico. Our Production Testing Division revenues also decreased, reflecting the reduction in Mexico activity, the suspension of activity by a significant U.S. customer, and increased competitive pressure in several key North American markets. Consolidated gross profit decreased, despite the increased profitability of our Fluids and Offshore Services segments, as our Maritech and Production Testing segments reported decreases. Maritech recorded increased excess decommissioning costs during 2013 as compared to 2012.
Consolidated general and administrative expenses during 2013 remained consistent with 2012 levels.
Decreases in compensation and other employee related expenses by our Offshore Services, Corporate, and Compression segments were primarily due to cost reduction efforts during late 2012 and early 2013 as well as decreased equity based compensation during 2013 compared to 2012. These administrative cost decreases were largely offset by increased general and administrative costs due to the growth of our Fluids Division, the acquisitions completed during 2012 by our Production Testing Division, and approximately $1.9 million of employee severance costs during 2013.
Consolidated interest expense stayed consistent during 2013 compared to the prior year, as increased interest expense from CCLP borrowings was largely offset by the impact of the lower interest rate on the 2013 Senior Notes.
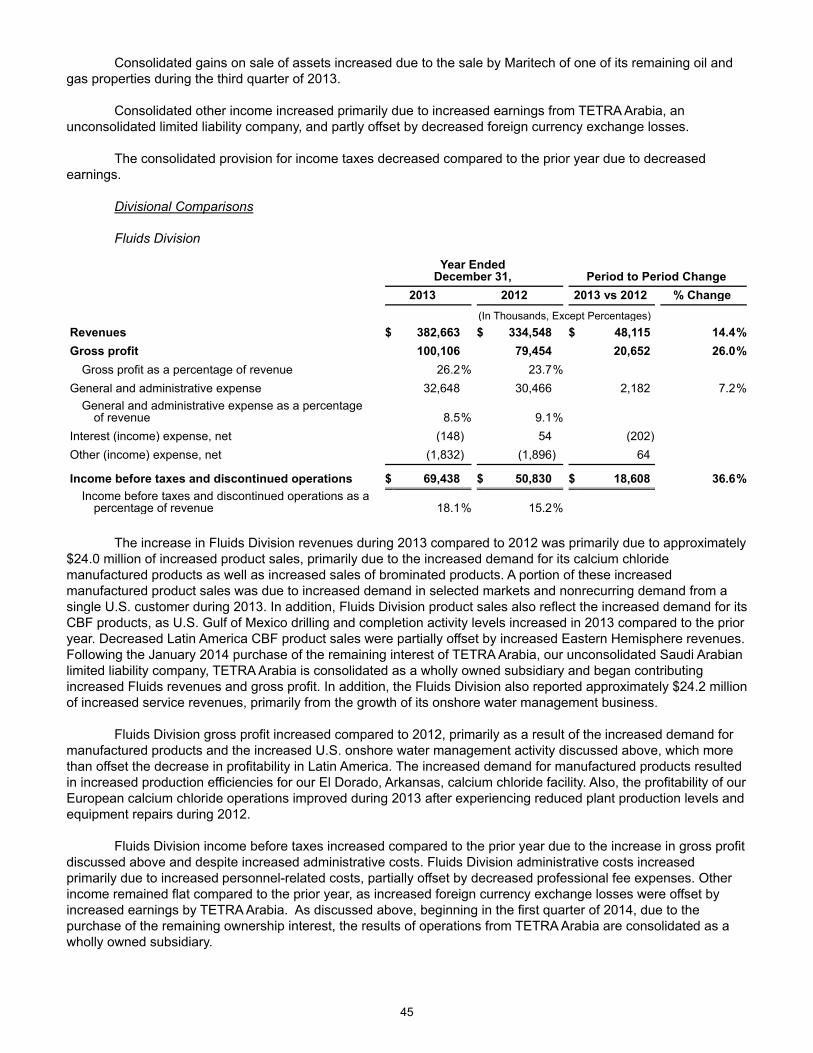
45
Consolidated gains on sale of assets increased due to the sale by Maritech of one of its remaining oil and gas properties during the third quarter of 2013.
Consolidated other income increased primarily due to increased earnings from TETRA Arabia, an
unconsolidated limited liability company, and partly offset by decreased foreign currency exchange losses. The consolidated provision for income taxes decreased compared to the prior year due to decreased
earnings.
Divisional Comparisons Fluids Division
Year Ended
December 31, Period to Period Change 2013 2012 2013 vs 2012 % Change (In Thousands, Except Percentages) Revenues $ 382,663 $ 334,548 $ 48,115 14.4%Gross profit 100,106 79,454 20,652 26.0%
Gross profit as a percentage of revenue 26.2% 23.7% General and administrative expense 32,648 30,466 2,182 7.2%
General and administrative expense as a percentage of revenue 8.5% 9.1%
Interest (income) expense, net (148) 54 (202) Other (income) expense, net (1,832) (1,896) 64
Income before taxes and discontinued operations $ 69,438 $ 50,830 $ 18,608 36.6%Income before taxes and discontinued operations as a
percentage of revenue 18.1% 15.2%
The increase in Fluids Division revenues during 2013 compared to 2012 was primarily due to approximately $24.0 million of increased product sales, primarily due to the increased demand for its calcium chloride manufactured products as well as increased sales of brominated products. A portion of these increased manufactured product sales was due to increased demand in selected markets and nonrecurring demand from a single U.S. customer during 2013. In addition, Fluids Division product sales also reflect the increased demand for its CBF products, as U.S. Gulf of Mexico drilling and completion activity levels increased in 2013 compared to the prior year. Decreased Latin America CBF product sales were partially offset by increased Eastern Hemisphere revenues. Following the January 2014 purchase of the remaining interest of TETRA Arabia, our unconsolidated Saudi Arabian limited liability company, TETRA Arabia is consolidated as a wholly owned subsidiary and began contributing increased Fluids revenues and gross profit. In addition, the Fluids Division also reported approximately $24.2 million of increased service revenues, primarily from the growth of its onshore water management business.
Fluids Division gross profit increased compared to 2012, primarily as a result of the increased demand for
manufactured products and the increased U.S. onshore water management activity discussed above, which more than offset the decrease in profitability in Latin America. The increased demand for manufactured products resulted in increased production efficiencies for our El Dorado, Arkansas, calcium chloride facility. Also, the profitability of our European calcium chloride operations improved during 2013 after experiencing reduced plant production levels and equipment repairs during 2012.
Fluids Division income before taxes increased compared to the prior year due to the increase in gross profit
discussed above and despite increased administrative costs. Fluids Division administrative costs increased primarily due to increased personnel-related costs, partially offset by decreased professional fee expenses. Other income remained flat compared to the prior year, as increased foreign currency exchange losses were offset by increased earnings by TETRA Arabia. As discussed above, beginning in the first quarter of 2014, due to the purchase of the remaining ownership interest, the results of operations from TETRA Arabia are consolidated as a wholly owned subsidiary.

46
Production Testing Division
Year Ended
December 31, Period to Period Change 2013 2012 2013 vs 2012 % Change (In Thousands, Except Percentages) Revenues $ 195,983 $ 207,984 $ (12,001) (5.8)%Gross profit 29,566 58,009 (28,443) (49.0)%
Gross profit as a percentage of revenue 15.1% 27.9% General and administrative expense 24,671 23,386 1,285 5.5 %
General and administrative expense as a percentage of revenue 12.6% 11.2%
Interest (income) expense, net (34) (43) 9 Other (income) expense, net (9,164) (5,181) (3,983)
Income before taxes and discontinued operations $ 14,093 $ 39,847 $ (25,754) (64.6)%Income before taxes and discontinued operations as a
percentage of revenue 7.2% 19.2%
Production Testing Division revenues decreased during 2013 compared to 2012 due to the decreases in activity by the Division's primary customer in Mexico. In addition, revenues decreased in the U.S. as a result of the suspension of activity in South Texas by a significant U.S. customer and increased competitive pressure in several key North American markets. These decreases in U.S. revenues more than offset the increased revenues as a result of including a full year of activity from the 2012 acquisitions of ERS and Greywolf. These decreases in the U.S. and Mexico were partially offset by increased revenues in Canada, as a result of the Greywolf acquisition, and in the Eastern Hemisphere, which contributed growth due to increased Middle East activity as well as due to the 2012 acquisition of the segment's OPTIMA offshore rig cooling business. As discussed above, in January 2014, we acquired the remaining ownership interest of TETRA Arabia. Beginning in the first quarter of 2014, TETRA Arabia is consolidated as a wholly owned subsidiary, and results in increased revenues and gross profit.
Production Testing Division gross profit decreased during 2013 compared to the prior year, despite the
2012 acquisitions of OPTIMA, ERS, and Greywolf. The gross profit increase from the acquired businesses and the growth in certain of the segment's foreign operations was more than offset by the impact of the decreased activity and pricing levels in certain U.S. markets, increased labor costs, and the impact of the decreased production testing activity in Mexico compared to the prior year. Beginning in the second quarter of 2013, we took steps to downsize field operations and implement other cost reductions for the Production Testing Division, including the relocation of equipment and other resources, that resulted in decreased operating expenses.
Production Testing Division income before taxes decreased due to the decreased gross profit discussed
above as well as from increased administrative expenses compared to the prior year. The increased administrative expenses were primarily due to the increased personnel-related and other administrative costs associated with the acquired OPTIMA, ERS, and Greywolf businesses. These increases more than offset the decrease in professional services expenses, which included approximately $2.8 million of acquisition related costs during 2012. Partially offsetting the decreased gross profit and increased general and administrative expenses, other income increased primarily due to increased earnings from TETRA Arabia. As discussed above, beginning in the first quarter of 2014, the results of operations from TETRA Arabia are consolidated as a wholly owned subsidiary.

47
Compression Division
Year Ended
December 31, Period to Period Change 2013 2012 2013 vs 2012 % Change (In Thousands, Except Percentages) Revenues $ 121,288 $ 109,466 $ 11,822 10.8 %Gross profit 38,726 38,991 (265) (0.7)%
Gross profit as a percentage of revenue 31.9% 35.6% General and administrative expense 17,353 17,424 (71) (0.4)%
General and administrative expense as a percentage of revenue 14.3% 15.9%
Interest (income) expense, net 469 25 444 Other (income) expense, net 704 944 (240)
Income before taxes and discontinued operations $ 20,200 $ 20,598 $ (398) (1.9)%Income before taxes and discontinued operations as a
percentage of revenue 16.7% 18.8%
The increase in Compression Division revenues compared to the prior year was due to an increase of $9.9 million of service revenues, resulting primarily from increased activity in the U.S., Canada, and Argentina. The increase in the U.S. reflects the increased demand for compression services applications as a result of increased activity primarily in shale resource play reservoirs. These increases were partially offset by decreased revenues in Mexico. As a result of the budget re-evaluations by the Compression Division's primary customer in Mexico, in March 2013 the Compression Division began to experience a decline in demand for its oil and gas services in the northern region of Mexico. The Compression Division has continued to increase its compressor fleet, both in the U.S. and in certain foreign markets, to serve increasing demand. Revenues from the sales of compressor packages and parts during 2013 increased $2.0 million compared to the prior year.
Compression Division gross profit decreased slightly during 2013 compared to the prior year, as the
increased U.S., Canada, and Argentina revenues were largely offset by increased operating expenses, particularly labor, maintenance, and fuel costs. Gross profit as a percentage of revenue decreased compared to the prior year as a result of these cost increases. Primarily as a result of the current reduced activity in Mexico described above, the Compression Division has aggressively reduced its Mexico operating headcount and relocated certain equipment to the U.S. from Mexico.
Income before taxes for the Compression Division decreased during 2013 compared to the prior year,
primarily due to the increased interest expense as a result of the increased borrowings under the Compression Division's bank credit facilities during 2013. The Compression Division's administrative expense levels also increased slightly compared to the prior year, as decreases in salaries and other employee related costs were largely offset by increased allocated costs and professional services. These increases were partially offset by decreased other expense, largely due to decreased foreign currency losses compared to the prior year.
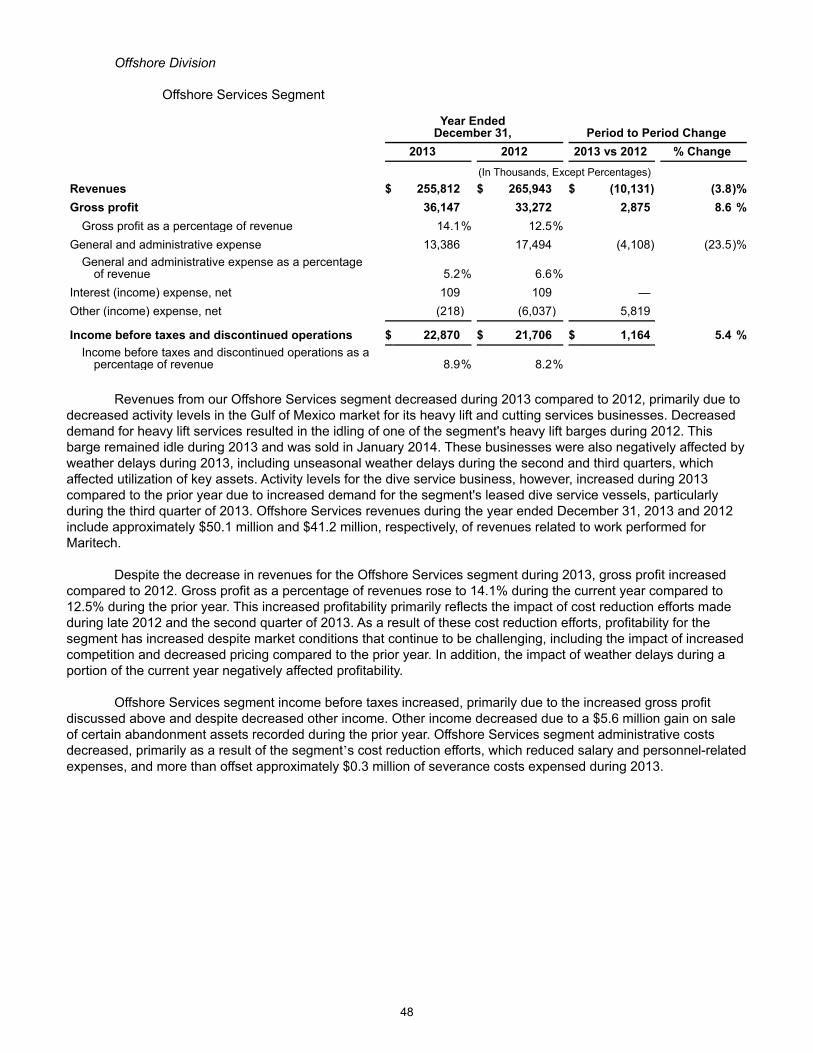
48
Offshore Division
Offshore Services Segment
Year Ended
December 31, Period to Period Change 2013 2012 2013 vs 2012 % Change (In Thousands, Except Percentages) Revenues $ 255,812 $ 265,943 $ (10,131) (3.8)%Gross profit 36,147 33,272 2,875 8.6 %
Gross profit as a percentage of revenue 14.1% 12.5% General and administrative expense 13,386 17,494 (4,108) (23.5)%
General and administrative expense as a percentage of revenue 5.2% 6.6%
Interest (income) expense, net 109 109 — Other (income) expense, net (218) (6,037) 5,819
Income before taxes and discontinued operations $ 22,870 $ 21,706 $ 1,164 5.4 %Income before taxes and discontinued operations as a
percentage of revenue 8.9% 8.2%
Revenues from our Offshore Services segment decreased during 2013 compared to 2012, primarily due to decreased activity levels in the Gulf of Mexico market for its heavy lift and cutting services businesses. Decreased demand for heavy lift services resulted in the idling of one of the segment's heavy lift barges during 2012. This barge remained idle during 2013 and was sold in January 2014. These businesses were also negatively affected by weather delays during 2013, including unseasonal weather delays during the second and third quarters, which affected utilization of key assets. Activity levels for the dive service business, however, increased during 2013 compared to the prior year due to increased demand for the segment's leased dive service vessels, particularly during the third quarter of 2013. Offshore Services revenues during the year ended December 31, 2013 and 2012 include approximately $50.1 million and $41.2 million, respectively, of revenues related to work performed for Maritech.
Despite the decrease in revenues for the Offshore Services segment during 2013, gross profit increased
compared to 2012. Gross profit as a percentage of revenues rose to 14.1% during the current year compared to 12.5% during the prior year. This increased profitability primarily reflects the impact of cost reduction efforts made during late 2012 and the second quarter of 2013. As a result of these cost reduction efforts, profitability for the segment has increased despite market conditions that continue to be challenging, including the impact of increased competition and decreased pricing compared to the prior year. In addition, the impact of weather delays during a portion of the current year negatively affected profitability.
Offshore Services segment income before taxes increased, primarily due to the increased gross profit
discussed above and despite decreased other income. Other income decreased due to a $5.6 million gain on sale of certain abandonment assets recorded during the prior year. Offshore Services segment administrative costs decreased, primarily as a result of the segment’s cost reduction efforts, which reduced salary and personnel-related expenses, and more than offset approximately $0.3 million of severance costs expensed during 2013.
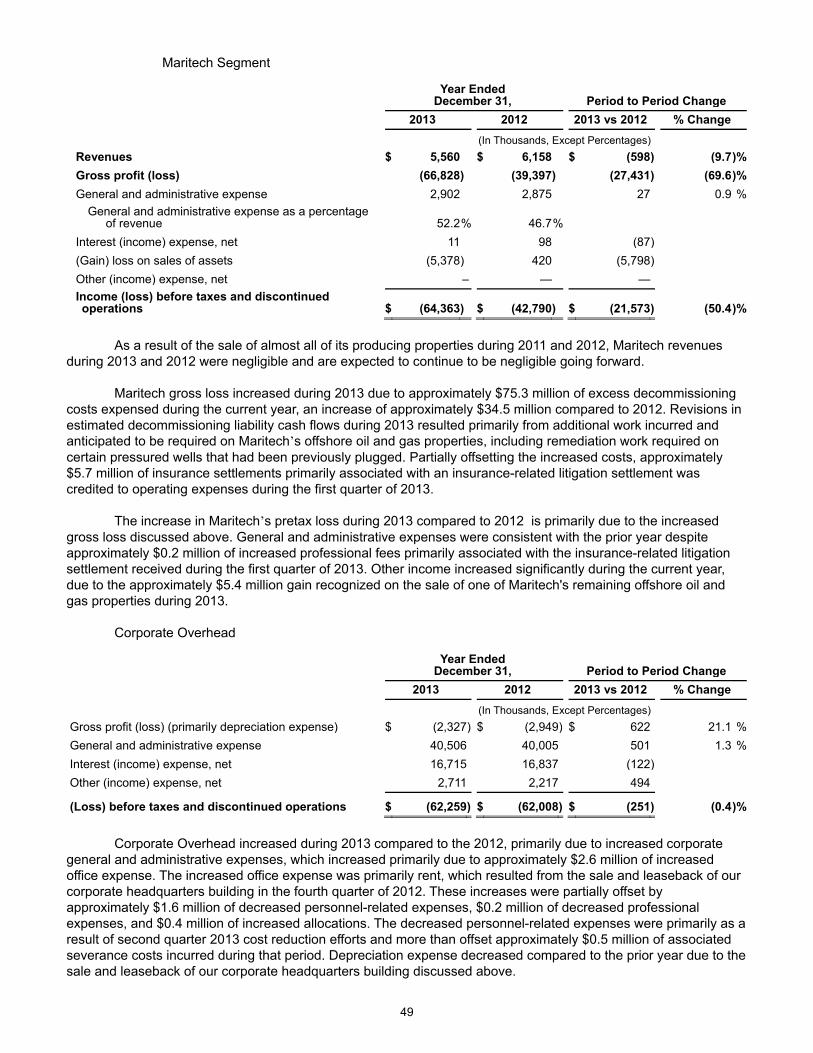
49
Maritech Segment
Year Ended
December 31, Period to Period Change 2013 2012 2013 vs 2012 % Change (In Thousands, Except Percentages) Revenues $ 5,560 $ 6,158 $ (598) (9.7)%Gross profit (loss) (66,828) (39,397) (27,431) (69.6)%General and administrative expense 2,902 2,875 27 0.9 %
General and administrative expense as a percentage of revenue 52.2% 46.7%
Interest (income) expense, net 11 98 (87) (Gain) loss on sales of assets (5,378) 420 (5,798) Other (income) expense, net – — — Income (loss) before taxes and discontinued operations $ (64,363) $ (42,790) $ (21,573) (50.4)%
As a result of the sale of almost all of its producing properties during 2011 and 2012, Maritech revenues
during 2013 and 2012 were negligible and are expected to continue to be negligible going forward. Maritech gross loss increased during 2013 due to approximately $75.3 million of excess decommissioning
costs expensed during the current year, an increase of approximately $34.5 million compared to 2012. Revisions in estimated decommissioning liability cash flows during 2013 resulted primarily from additional work incurred and anticipated to be required on Maritech’s offshore oil and gas properties, including remediation work required on certain pressured wells that had been previously plugged. Partially offsetting the increased costs, approximately $5.7 million of insurance settlements primarily associated with an insurance-related litigation settlement was credited to operating expenses during the first quarter of 2013.
The increase in Maritech’s pretax loss during 2013 compared to 2012 is primarily due to the increased
gross loss discussed above. General and administrative expenses were consistent with the prior year despite approximately $0.2 million of increased professional fees primarily associated with the insurance-related litigation settlement received during the first quarter of 2013. Other income increased significantly during the current year, due to the approximately $5.4 million gain recognized on the sale of one of Maritech's remaining offshore oil and gas properties during 2013.
Corporate Overhead
Year Ended
December 31, Period to Period Change 2013 2012 2013 vs 2012 % Change (In Thousands, Except Percentages) Gross profit (loss) (primarily depreciation expense) $ (2,327) $ (2,949) $ 622 21.1 %General and administrative expense 40,506 40,005 501 1.3 %Interest (income) expense, net 16,715 16,837 (122) Other (income) expense, net 2,711 2,217 494
(Loss) before taxes and discontinued operations $ (62,259) $ (62,008) $ (251) (0.4)%
Corporate Overhead increased during 2013 compared to the 2012, primarily due to increased corporate
general and administrative expenses, which increased primarily due to approximately $2.6 million of increased office expense. The increased office expense was primarily rent, which resulted from the sale and leaseback of our corporate headquarters building in the fourth quarter of 2012. These increases were partially offset by approximately $1.6 million of decreased personnel-related expenses, $0.2 million of decreased professional expenses, and $0.4 million of increased allocations. The decreased personnel-related expenses were primarily as a result of second quarter 2013 cost reduction efforts and more than offset approximately $0.5 million of associated severance costs incurred during that period. Depreciation expense decreased compared to the prior year due to the sale and leaseback of our corporate headquarters building discussed above.
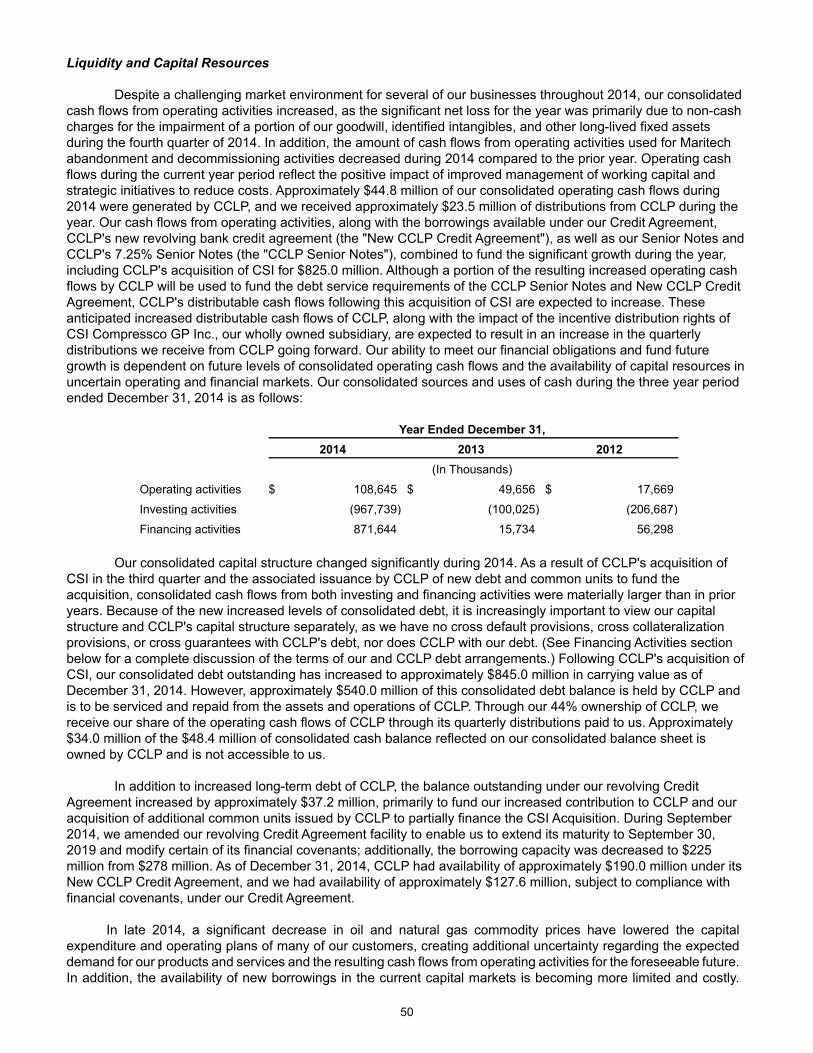
50
Liquidity and Capital Resources Despite a challenging market environment for several of our businesses throughout 2014, our consolidated cash flows from operating activities increased, as the significant net loss for the year was primarily due to non-cash charges for the impairment of a portion of our goodwill, identified intangibles, and other long-lived fixed assets during the fourth quarter of 2014. In addition, the amount of cash flows from operating activities used for Maritech abandonment and decommissioning activities decreased during 2014 compared to the prior year. Operating cash flows during the current year period reflect the positive impact of improved management of working capital and strategic initiatives to reduce costs. Approximately $44.8 million of our consolidated operating cash flows during 2014 were generated by CCLP, and we received approximately $23.5 million of distributions from CCLP during the year. Our cash flows from operating activities, along with the borrowings available under our Credit Agreement, CCLP's new revolving bank credit agreement (the "New CCLP Credit Agreement"), as well as our Senior Notes and CCLP's 7.25% Senior Notes (the "CCLP Senior Notes"), combined to fund the significant growth during the year, including CCLP's acquisition of CSI for $825.0 million. Although a portion of the resulting increased operating cash flows by CCLP will be used to fund the debt service requirements of the CCLP Senior Notes and New CCLP Credit Agreement, CCLP's distributable cash flows following this acquisition of CSI are expected to increase. These anticipated increased distributable cash flows of CCLP, along with the impact of the incentive distribution rights of CSI Compressco GP Inc., our wholly owned subsidiary, are expected to result in an increase in the quarterly distributions we receive from CCLP going forward. Our ability to meet our financial obligations and fund future growth is dependent on future levels of consolidated operating cash flows and the availability of capital resources in uncertain operating and financial markets. Our consolidated sources and uses of cash during the three year period ended December 31, 2014 is as follows:
Year Ended December 31, 2014 2013 2012 (In Thousands)
Operating activities $ 108,645 $ 49,656 $ 17,669
Investing activities (967,739) (100,025) (206,687)
Financing activities 871,644 15,734 56,298
Our consolidated capital structure changed significantly during 2014. As a result of CCLP's acquisition of CSI in the third quarter and the associated issuance by CCLP of new debt and common units to fund the acquisition, consolidated cash flows from both investing and financing activities were materially larger than in prior years. Because of the new increased levels of consolidated debt, it is increasingly important to view our capital structure and CCLP's capital structure separately, as we have no cross default provisions, cross collateralization provisions, or cross guarantees with CCLP's debt, nor does CCLP with our debt. (See Financing Activities section below for a complete discussion of the terms of our and CCLP debt arrangements.) Following CCLP's acquisition of CSI, our consolidated debt outstanding has increased to approximately $845.0 million in carrying value as of December 31, 2014. However, approximately $540.0 million of this consolidated debt balance is held by CCLP and is to be serviced and repaid from the assets and operations of CCLP. Through our 44% ownership of CCLP, we receive our share of the operating cash flows of CCLP through its quarterly distributions paid to us. Approximately $34.0 million of the $48.4 million of consolidated cash balance reflected on our consolidated balance sheet is owned by CCLP and is not accessible to us.
In addition to increased long-term debt of CCLP, the balance outstanding under our revolving Credit
Agreement increased by approximately $37.2 million, primarily to fund our increased contribution to CCLP and our acquisition of additional common units issued by CCLP to partially finance the CSI Acquisition. During September 2014, we amended our revolving Credit Agreement facility to enable us to extend its maturity to September 30, 2019 and modify certain of its financial covenants; additionally, the borrowing capacity was decreased to $225 million from $278 million. As of December 31, 2014, CCLP had availability of approximately $190.0 million under its New CCLP Credit Agreement, and we had availability of approximately $127.6 million, subject to compliance with financial covenants, under our Credit Agreement.
In late 2014, a significant decrease in oil and natural gas commodity prices have lowered the capital
expenditure and operating plans of many of our customers, creating additional uncertainty regarding the expected demand for our products and services and the resulting cash flows from operating activities for the foreseeable future. In addition, the availability of new borrowings in the current capital markets is becoming more limited and costly.
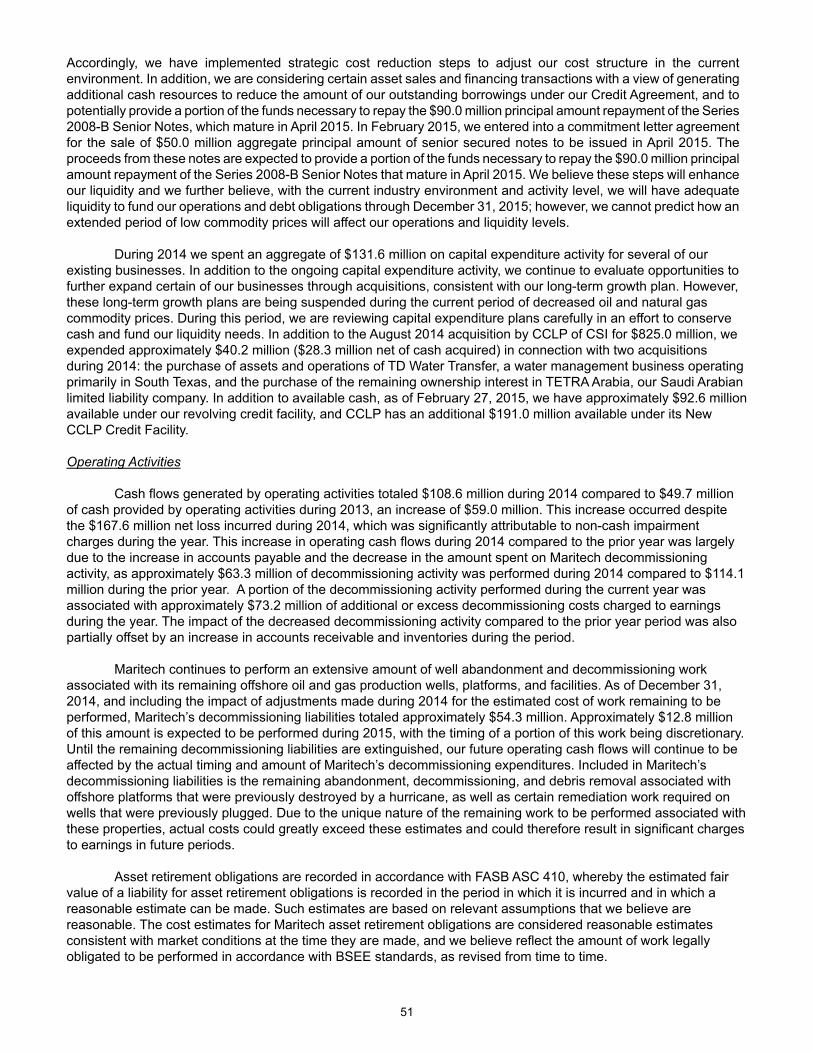
51
Accordingly, we have implemented strategic cost reduction steps to adjust our cost structure in the current environment. In addition, we are considering certain asset sales and financing transactions with a view of generating additional cash resources to reduce the amount of our outstanding borrowings under our Credit Agreement, and to potentially provide a portion of the funds necessary to repay the $90.0 million principal amount repayment of the Series 2008-B Senior Notes, which mature in April 2015. In February 2015, we entered into a commitment letter agreement for the sale of $50.0 million aggregate principal amount of senior secured notes to be issued in April 2015. The proceeds from these notes are expected to provide a portion of the funds necessary to repay the $90.0 million principal amount repayment of the Series 2008-B Senior Notes that mature in April 2015. We believe these steps will enhance our liquidity and we further believe, with the current industry environment and activity level, we will have adequate liquidity to fund our operations and debt obligations through December 31, 2015; however, we cannot predict how an extended period of low commodity prices will affect our operations and liquidity levels. During 2014 we spent an aggregate of $131.6 million on capital expenditure activity for several of our existing businesses. In addition to the ongoing capital expenditure activity, we continue to evaluate opportunities to further expand certain of our businesses through acquisitions, consistent with our long-term growth plan. However, these long-term growth plans are being suspended during the current period of decreased oil and natural gas commodity prices. During this period, we are reviewing capital expenditure plans carefully in an effort to conserve cash and fund our liquidity needs. In addition to the August 2014 acquisition by CCLP of CSI for $825.0 million, we expended approximately $40.2 million ($28.3 million net of cash acquired) in connection with two acquisitions during 2014: the purchase of assets and operations of TD Water Transfer, a water management business operating primarily in South Texas, and the purchase of the remaining ownership interest in TETRA Arabia, our Saudi Arabian limited liability company. In addition to available cash, as of February 27, 2015, we have approximately $92.6 million available under our revolving credit facility, and CCLP has an additional $191.0 million available under its New CCLP Credit Facility. Operating Activities
Cash flows generated by operating activities totaled $108.6 million during 2014 compared to $49.7 million
of cash provided by operating activities during 2013, an increase of $59.0 million. This increase occurred despite the $167.6 million net loss incurred during 2014, which was significantly attributable to non-cash impairment charges during the year. This increase in operating cash flows during 2014 compared to the prior year was largely due to the increase in accounts payable and the decrease in the amount spent on Maritech decommissioning activity, as approximately $63.3 million of decommissioning activity was performed during 2014 compared to $114.1 million during the prior year. A portion of the decommissioning activity performed during the current year was associated with approximately $73.2 million of additional or excess decommissioning costs charged to earnings during the year. The impact of the decreased decommissioning activity compared to the prior year period was also partially offset by an increase in accounts receivable and inventories during the period.
Maritech continues to perform an extensive amount of well abandonment and decommissioning work
associated with its remaining offshore oil and gas production wells, platforms, and facilities. As of December 31, 2014, and including the impact of adjustments made during 2014 for the estimated cost of work remaining to be performed, Maritech’s decommissioning liabilities totaled approximately $54.3 million. Approximately $12.8 million of this amount is expected to be performed during 2015, with the timing of a portion of this work being discretionary. Until the remaining decommissioning liabilities are extinguished, our future operating cash flows will continue to be affected by the actual timing and amount of Maritech’s decommissioning expenditures. Included in Maritech’s decommissioning liabilities is the remaining abandonment, decommissioning, and debris removal associated with offshore platforms that were previously destroyed by a hurricane, as well as certain remediation work required on wells that were previously plugged. Due to the unique nature of the remaining work to be performed associated with these properties, actual costs could greatly exceed these estimates and could therefore result in significant charges to earnings in future periods.
Asset retirement obligations are recorded in accordance with FASB ASC 410, whereby the estimated fair
value of a liability for asset retirement obligations is recorded in the period in which it is incurred and in which a reasonable estimate can be made. Such estimates are based on relevant assumptions that we believe are reasonable. The cost estimates for Maritech asset retirement obligations are considered reasonable estimates consistent with market conditions at the time they are made, and we believe reflect the amount of work legally obligated to be performed in accordance with BSEE standards, as revised from time to time.
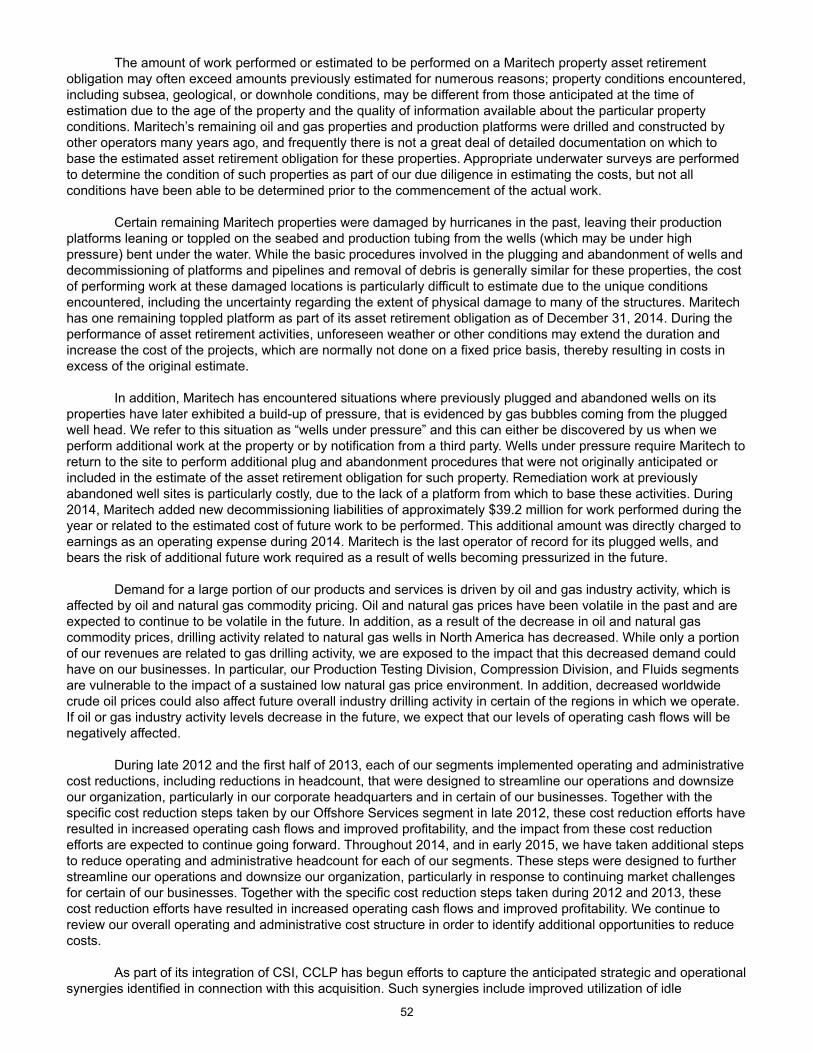
52
The amount of work performed or estimated to be performed on a Maritech property asset retirement obligation may often exceed amounts previously estimated for numerous reasons; property conditions encountered, including subsea, geological, or downhole conditions, may be different from those anticipated at the time of estimation due to the age of the property and the quality of information available about the particular property conditions. Maritech’s remaining oil and gas properties and production platforms were drilled and constructed by other operators many years ago, and frequently there is not a great deal of detailed documentation on which to base the estimated asset retirement obligation for these properties. Appropriate underwater surveys are performed to determine the condition of such properties as part of our due diligence in estimating the costs, but not all conditions have been able to be determined prior to the commencement of the actual work. Certain remaining Maritech properties were damaged by hurricanes in the past, leaving their production platforms leaning or toppled on the seabed and production tubing from the wells (which may be under high pressure) bent under the water. While the basic procedures involved in the plugging and abandonment of wells and decommissioning of platforms and pipelines and removal of debris is generally similar for these properties, the cost of performing work at these damaged locations is particularly difficult to estimate due to the unique conditions encountered, including the uncertainty regarding the extent of physical damage to many of the structures. Maritech has one remaining toppled platform as part of its asset retirement obligation as of December 31, 2014. During the performance of asset retirement activities, unforeseen weather or other conditions may extend the duration and increase the cost of the projects, which are normally not done on a fixed price basis, thereby resulting in costs in excess of the original estimate. In addition, Maritech has encountered situations where previously plugged and abandoned wells on its properties have later exhibited a build-up of pressure, that is evidenced by gas bubbles coming from the plugged well head. We refer to this situation as “wells under pressure” and this can either be discovered by us when we perform additional work at the property or by notification from a third party. Wells under pressure require Maritech to return to the site to perform additional plug and abandonment procedures that were not originally anticipated or included in the estimate of the asset retirement obligation for such property. Remediation work at previously abandoned well sites is particularly costly, due to the lack of a platform from which to base these activities. During 2014, Maritech added new decommissioning liabilities of approximately $39.2 million for work performed during the year or related to the estimated cost of future work to be performed. This additional amount was directly charged to earnings as an operating expense during 2014. Maritech is the last operator of record for its plugged wells, and bears the risk of additional future work required as a result of wells becoming pressurized in the future.
Demand for a large portion of our products and services is driven by oil and gas industry activity, which is
affected by oil and natural gas commodity pricing. Oil and natural gas prices have been volatile in the past and are expected to continue to be volatile in the future. In addition, as a result of the decrease in oil and natural gas commodity prices, drilling activity related to natural gas wells in North America has decreased. While only a portion of our revenues are related to gas drilling activity, we are exposed to the impact that this decreased demand could have on our businesses. In particular, our Production Testing Division, Compression Division, and Fluids segments are vulnerable to the impact of a sustained low natural gas price environment. In addition, decreased worldwide crude oil prices could also affect future overall industry drilling activity in certain of the regions in which we operate. If oil or gas industry activity levels decrease in the future, we expect that our levels of operating cash flows will be negatively affected.
During late 2012 and the first half of 2013, each of our segments implemented operating and administrative
cost reductions, including reductions in headcount, that were designed to streamline our operations and downsize our organization, particularly in our corporate headquarters and in certain of our businesses. Together with the specific cost reduction steps taken by our Offshore Services segment in late 2012, these cost reduction efforts have resulted in increased operating cash flows and improved profitability, and the impact from these cost reduction efforts are expected to continue going forward. Throughout 2014, and in early 2015, we have taken additional steps to reduce operating and administrative headcount for each of our segments. These steps were designed to further streamline our operations and downsize our organization, particularly in response to continuing market challenges for certain of our businesses. Together with the specific cost reduction steps taken during 2012 and 2013, these cost reduction efforts have resulted in increased operating cash flows and improved profitability. We continue to review our overall operating and administrative cost structure in order to identify additional opportunities to reduce costs.
As part of its integration of CSI, CCLP has begun efforts to capture the anticipated strategic and operational
synergies identified in connection with this acquisition. Such synergies include improved utilization of idle

53
equipment, field level cost reductions, and reductions in combined general and administrative expenses. These efforts are designed to improve the efficiency of the combined operations, and are expected to increase operating cash flows.
We are subject to operating hazards normally associated with onshore and offshore oilfield service
operations, including fires, explosions, blowouts, cratering, mechanical problems, abnormally pressured formations, and accidents that cause harm to the environment. In addition, in the performance of each of our operations we are exposed to additional hazards, including personal injuries and vehicle-related accidents. We maintain various types of insurance that are designed to be applicable in the event of an explosion or other catastrophic event involving our offshore operations. This insurance includes third-party liability, workers’ compensation and employers’ liability, automobile liability, general liability, and vessel pollution liability. Our insurance coverage is subject to deductibles that must be satisfied prior to recovery. Additionally, the levels of our insurance coverage are subject to certain exclusions and limitations, and we have additional exposure from certain risks that we elect to self-insure. We believe our policy of insuring against such risks, as well as the levels of insurance we maintain, is typical in the industry. In addition, we provide services and products in the offshore Gulf of Mexico generally pursuant to agreements that create insurance and indemnity obligations for both parties. Our Maritech subsidiary maintains a formalized oil spill response plan that is submitted to the BSEE. Maritech has designated third-party contractors in place to ensure that resources are available as required in the event of an environmental accident. While it is impossible to anticipate every potential accident or incident involving our offshore operations, we believe we have taken appropriate steps to mitigate the potential impact of such an event on the environment in the regions in which we operate.
Investing Activities During 2014, the total amount of our net cash utilized on investing activities was $967.7 million, the
significant majority of which was the $825.0 million purchase price for the CSI Acquisition. Total cash capital expenditures during 2014 were $131.6 million. Approximately $41.3 million of our capital expenditures during 2014 was spent by our Fluids Division, the majority of which related to the purchase of new equipment to support its water management services business. Our Production Testing Division spent approximately $31.2 million on capital expenditures to add or replace a portion of its production testing equipment fleet. Our Compression Division spent approximately $37.6 million primarily for the expansion of its compressor and equipment fleet, including expenditures by its CSI subsidiary. Our Offshore Services segment spent approximately $20.0 million for costs on its various heavy lift and dive support vessels, primarily for required drydock expenditures. Corporate capital expenditures were approximately $1.5 million, primarily relates to third-party consulting services for new system software.
In January 2014, we completed two acquisition transactions. Pursuant to an October 2013 agreement, we acquired the remaining 50% ownership interest of TETRA Arabia that we did not previously own in exchange for $15.0 million paid at closing and $10.2 million that was paid in July 2014. TETRA Arabia is a provider of clear brine fluids products and related services, production testing services, and offshore rig cooling services to its customer in Saudi Arabia. As a result of this transaction, beginning in the first quarter of 2014, TETRA Arabia has become a wholly owned consolidated subsidiary. Also in January 2014, we acquired the assets and operations of TD Water Transfer for a cash purchase price of $15.0 million along with additional contingent consideration of up to approximately $8.0 million to be paid based on a measure of earnings and other considerations over the two years subsequent to closing. TD Water Transfer is a provider of water management services to oil and gas operators in the South Texas and North Dakota regions.
On August 4, 2014, pursuant to a stock purchase agreement dated July 20, 2014, a subsidiary of CCLP acquired all of the outstanding capital stock of CSI for approximately $825.0 million cash. The CSI Acquisition purchase price was funded from (i) the issuance of the CCLP Senior Notes resulting in net proceeds of $337.8 million (after deducting a $5.2 million discount and certain transaction related fees), (ii) CCLP's issuance of the New Units in an underwritten public offering resulting in net proceeds of $346.0 million ($359.1 million gross proceeds less commissions) and (iii) a portion of the $210.0 million initially borrowed under the New CCLP Credit Agreement. In connection with CCLP's issuance of the New Units, a subsidiary of our CSI Compressco GP Inc. subsidiary purchased 1,390,290 of the New Units. In addition, CSI Compressco GP Inc. contributed approximately $8.4 million to CCLP in order to maintain its approximately 2% general partner interest in CCLP. On August 11, 2014, the underwriters exercised their option and purchased 2,292,000 additional common units for the Offering Price of $23.50 resulting in additional net proceeds of $51.7 million ($53.9 million gross proceeds less underwriting
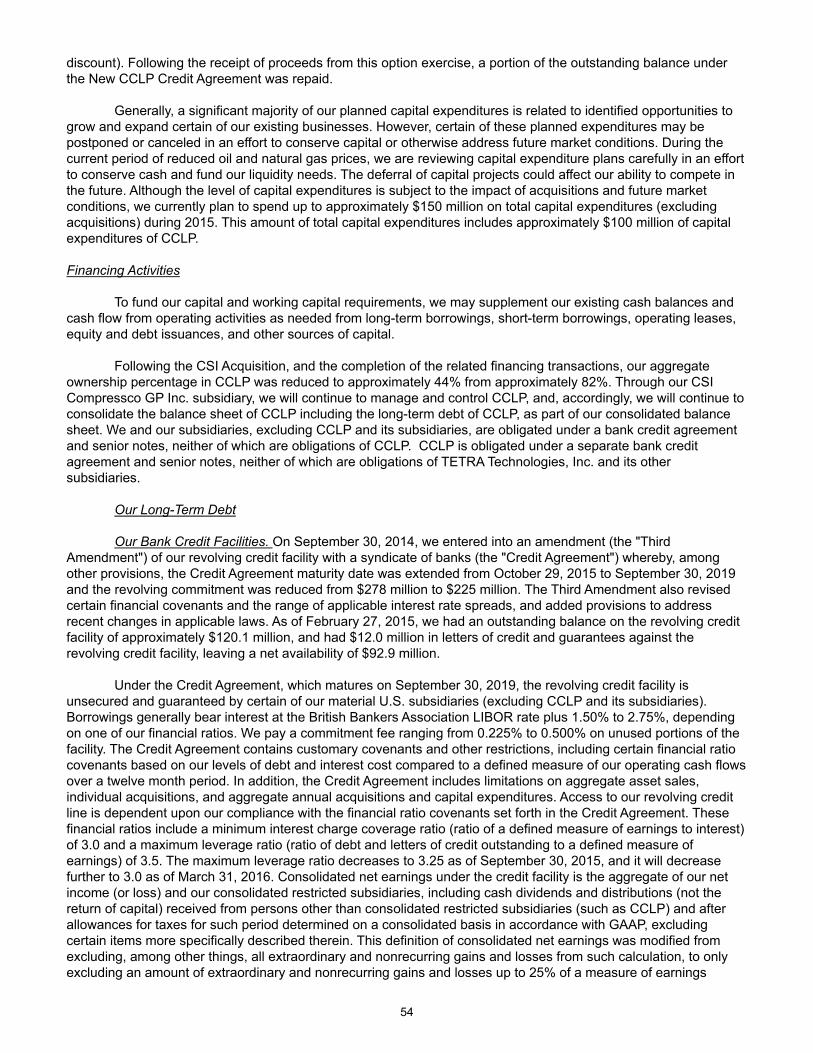
54
discount). Following the receipt of proceeds from this option exercise, a portion of the outstanding balance under the New CCLP Credit Agreement was repaid.
Generally, a significant majority of our planned capital expenditures is related to identified opportunities to
grow and expand certain of our existing businesses. However, certain of these planned expenditures may be postponed or canceled in an effort to conserve capital or otherwise address future market conditions. During the current period of reduced oil and natural gas prices, we are reviewing capital expenditure plans carefully in an effort to conserve cash and fund our liquidity needs. The deferral of capital projects could affect our ability to compete in the future. Although the level of capital expenditures is subject to the impact of acquisitions and future market conditions, we currently plan to spend up to approximately $150 million on total capital expenditures (excluding acquisitions) during 2015. This amount of total capital expenditures includes approximately $100 million of capital expenditures of CCLP. Financing Activities
To fund our capital and working capital requirements, we may supplement our existing cash balances and
cash flow from operating activities as needed from long-term borrowings, short-term borrowings, operating leases, equity and debt issuances, and other sources of capital.
Following the CSI Acquisition, and the completion of the related financing transactions, our aggregate ownership percentage in CCLP was reduced to approximately 44% from approximately 82%. Through our CSI Compressco GP Inc. subsidiary, we will continue to manage and control CCLP, and, accordingly, we will continue to consolidate the balance sheet of CCLP including the long-term debt of CCLP, as part of our consolidated balance sheet. We and our subsidiaries, excluding CCLP and its subsidiaries, are obligated under a bank credit agreement and senior notes, neither of which are obligations of CCLP. CCLP is obligated under a separate bank credit agreement and senior notes, neither of which are obligations of TETRA Technologies, Inc. and its other subsidiaries.
Our Long-Term Debt Our Bank Credit Facilities. On September 30, 2014, we entered into an amendment (the "Third
Amendment") of our revolving credit facility with a syndicate of banks (the "Credit Agreement") whereby, among other provisions, the Credit Agreement maturity date was extended from October 29, 2015 to September 30, 2019 and the revolving commitment was reduced from $278 million to $225 million. The Third Amendment also revised certain financial covenants and the range of applicable interest rate spreads, and added provisions to address recent changes in applicable laws. As of February 27, 2015, we had an outstanding balance on the revolving credit facility of approximately $120.1 million, and had $12.0 million in letters of credit and guarantees against the revolving credit facility, leaving a net availability of $92.9 million.
Under the Credit Agreement, which matures on September 30, 2019, the revolving credit facility is unsecured and guaranteed by certain of our material U.S. subsidiaries (excluding CCLP and its subsidiaries). Borrowings generally bear interest at the British Bankers Association LIBOR rate plus 1.50% to 2.75%, depending on one of our financial ratios. We pay a commitment fee ranging from 0.225% to 0.500% on unused portions of the facility. The Credit Agreement contains customary covenants and other restrictions, including certain financial ratio covenants based on our levels of debt and interest cost compared to a defined measure of our operating cash flows over a twelve month period. In addition, the Credit Agreement includes limitations on aggregate asset sales, individual acquisitions, and aggregate annual acquisitions and capital expenditures. Access to our revolving credit line is dependent upon our compliance with the financial ratio covenants set forth in the Credit Agreement. These financial ratios include a minimum interest charge coverage ratio (ratio of a defined measure of earnings to interest) of 3.0 and a maximum leverage ratio (ratio of debt and letters of credit outstanding to a defined measure of earnings) of 3.5. The maximum leverage ratio decreases to 3.25 as of September 30, 2015, and it will decrease further to 3.0 as of March 31, 2016. Consolidated net earnings under the credit facility is the aggregate of our net income (or loss) and our consolidated restricted subsidiaries, including cash dividends and distributions (not the return of capital) received from persons other than consolidated restricted subsidiaries (such as CCLP) and after allowances for taxes for such period determined on a consolidated basis in accordance with GAAP, excluding certain items more specifically described therein. This definition of consolidated net earnings was modified from excluding, among other things, all extraordinary and nonrecurring gains and losses from such calculation, to only excluding an amount of extraordinary and nonrecurring gains and losses up to 25% of a measure of earnings
55
beginning with the four quarter period ended September 30, 2015. At December 31, 2014, the Company’s leverage ratio was 2.94 to 1.
Both the minimum interest charge ratio and the maximum leverage ratio are further defined in the Credit
Agreement. Deterioration of the financial ratios could result in a default by us under the Credit Agreement and, if not remedied, could result in termination of the Credit Agreement and acceleration of any outstanding balances. CCLP is an unrestricted subsidiary and is not a borrower or a guarantor under the Credit Agreement.
On August 4, 2014, in connection with the CSI Acquisition, we borrowed $40 million under our Credit Agreement to fund our purchase of 1,390,290 common units of CCLP and to fund a contribution of $8.4 million by our wholly owned subsidiary CSI Compressco Partners GP Inc. to maintain its approximately 2% general partners interest in CCLP.
The Credit Agreement includes cross-default provisions relating to any other indebtedness (not including indebtedness of CCLP) greater than a defined amount. If any such indebtedness is not paid or is accelerated and such event is not remedied in a timely manner, a default will occur under the Credit Agreement. Our Credit Agreement also contains a covenant that restricts us from paying dividends in the event of a default or if such payment would result in an event of default. We are in compliance with all covenants and conditions of our Credit Agreement as of December 31, 2014. Our continuing ability to comply with these financial covenants depends largely upon our ability to generate adequate cash flow. Historically, our financial performance has been more than adequate to meet these covenants. Due to the expected decreased demand for our products and services by our customers in response to decreased oil and natural gas prices, we have taken strategic cost reduction efforts, including headcount reductions and other efforts to reduce costs and generate cash in anticipation of the reduced demand for our products and services. Based on our projections for each of the quarterly periods in 2015, and including the impact of these cost reduction efforts to increase operating cash flows, we anticipate that we will be in compliance with the financial covenants under our revolving credit facility through December 31, 2015. We are also pursuing the sale of selected assets and additional financing alternatives as a source of proceeds to repay a portion of our outstanding borrowings. Any asset sales proceeds, borrowing proceeds and available capacity under our revolving Credit Agreement are expected to provide resources to repay the $90.0 million of 2008 Series B Senior Notes outstanding, which are scheduled to mature on April 30, 2015. However, there is a remote possibility that we may fail to be in compliance with these financial covenants going forward, and would consequently be in condition of default under the Credit Agreement. There can be no assurances that these cost reduction or cash generation plans will be successful, or that market conditions and our operating performance will not further decrease compared to our projections.
Our European Credit Agreement. We also have a bank line of credit agreement to cover the day to day
working capital needs of certain of our European operations (the "European Credit Agreement"). The European Credit Agreement provides borrowing capacity of up to 5 million euros (approximately $6.1 million equivalent as of December 31, 2014), with interest computed on any outstanding borrowings at a rate equal to the lender’s Basis Rate plus 0.75%. The European Credit Agreement is cancellable by either party with 14 business days' notice and contains standard provisions in the event of default. As of December 31, 2014, we had no borrowings outstanding pursuant to the European Credit Agreement.
Our Senior Notes. In April 2006, we issued $90.0 million in aggregate principal amount of Series 2006-A
Senior Notes pursuant to our existing Master Note Purchase Agreement dated September 2004, as supplemented as of April 18, 2006. The Series 2006-A Senior Notes bear interest at a fixed rate of 5.90% and mature on April 30, 2016. Interest on the 2006-A Senior Notes is due semiannually on April 30 and October 30 of each year.
In April 2008, we issued $35.0 million in aggregate principal amount of Series 2008-A Senior Notes and
$90.0 million in aggregate principal amount of Series 2008-B Senior Notes (collectively the Series 2008 Senior Notes) pursuant to a Note Purchase Agreement dated April 30, 2008. The Series 2008-A Senior Notes bore interest at a fixed rate of 6.30% and matured and were repaid on April 30, 2013. The Series 2008-B Senior Notes bear interest at a fixed rate of 6.56% and mature on April 30, 2015. Interest on the Series 2008 Senior Notes is due semiannually on April 30 and October 31 of each year. The repayment of the Series 2008-B Senior Notes is expected to be funded from borrowings under our revolving credit facility, cash provided by operations or sales of assets, or through other financing sources.
In December 2010, we issued $65.0 million in aggregate principal amount of Series 2010-A Senior Notes
and $25.0 million in aggregate principal amount of Series 2010-B Senior Notes (collectively, the 2010 Senior Notes)

56
pursuant to a Note Purchase Agreement dated September 30, 2010. The Series 2010-A Senior Notes bear interest at a fixed rate of 5.09% and mature on December 15, 2017. The Series 2010-B Senior Notes bear interest at a fixed rate of 5.67% and mature on December 15, 2020. Interest on the Series 2010 Senior Notes is due semiannually on June 15 and December 15 of each year.
In April 2013, we issued $35.0 million in aggregate principal amount of Series 2013 Senior Notes pursuant
to a Note Purchase Agreement. The Series 2013 Senior Notes bear interest at a fixed rate of 4.0% and mature on April 29, 2020. On April 30, 2013, we utilized the proceeds from the issuance to repay the 2008-A Senior Notes. Interest on the 2013 Senior Notes is due semiannually on April 29 and October 29 of each year.
Each of the Senior Notes was sold in the United States to accredited investors pursuant to an exemption
from the Securities Act of 1933. We may prepay the Senior Notes, in whole or in part, at any time at a price equal to 100% of the principal amount outstanding, plus accrued and unpaid interest and a “make-whole” prepayment premium. The Senior Notes are unsecured and are guaranteed by substantially all of our wholly owned U.S. subsidiaries. The Note Purchase Agreements and the Master Note Purchase Agreement, as supplemented, contain customary covenants and restrictions and require us to maintain certain financial ratios, including a minimum level of net worth and a ratio between our long-term debt balance and a defined measure of operating cash flow over a twelve month period. These financial ratios include a maximum leverage ratio (ratio of debt and letters of credit outstanding to a defined measure of earnings) of 3.5. Consolidated net earnings under the Note Purchase Agreements and Master Note Purchase Agreement is the aggregate of our net income (or loss) and our consolidated restricted subsidiaries, including cash dividends and distributions (not the return of capital) received from persons other than consolidated restricted subsidiaries (such as CCLP) and after allowances for taxes for such period determined on a consolidated basis in accordance with GAAP, excluding certain items more specifically described therein. Under these note purchase agreements, the financial ratio requirements include a minimum interest coverage ratio of 2.5 and a maximum leverage ratio of 3.5. At December 31, 2014, our leverage ratio was 2.94 to 1.
Both the minimum net worth and the maximum leverage ratio are further defined in our Note Purchase
Agreements and Master Note Purchase Agreement. Deterioration of the financial ratios could result in a default by us under the Note Purchase Agreements and Master Note Purchase Agreement and, if not remedied, could result in termination of the Note Purchase Agreements and Master Note Purchase Agreement and acceleration of any outstanding balances. CCLP is an unrestricted subsidiary and is not a borrower or a guarantor under our Note Purchase Agreements and Master Note Purchase Agreement.
The Note Purchase Agreements and the Master Note Purchase Agreement also contain customary default
provisions as well as a cross-default provision relating to any other of our indebtedness of $20 million or more. We are in compliance with all covenants and conditions of the Note Purchase Agreements and the Master Note Purchase Agreement as of December 31, 2014. Our continuing ability to comply with these financial covenants depends largely upon our ability to generate adequate cash flow. Historically, our financial performance has been more than adequate to meet these covenants, and we expect this trend to continue. However, given the expected decreased demand by for our products and services our customers in response to decreased oil and natural gas prices, we are taking strategic cost reduction efforts, including headcount reductions, salary cost reductions, and other efforts to reduce costs and generate cash in anticipation of the reduced demand for our products and services. Based on our projections for each of the quarterly periods in 2015, and including the impact of these cost reduction efforts to increase operating cash flows, we anticipate that we will be in compliance with the financial covenants under our Note Purchase Agreements and Master Note Purchase Agreement through December 31, 2015. We are also pursuing the sale of selected assets and additional financing alternatives as a source of proceeds to repay a portion of our outstanding borrowings. Any asset sales proceeds, along with additional borrowings proceeds and available capacity under our revolving Credit Agreement are expected to provide resources to repay the $90.0 million of 2008 Series B Senior Notes outstanding, which are scheduled to mature on April 30, 2015. However, there is a remote possibility that we may fail to be in compliance with these financial covenants in a future period, and would consequently be in condition of default under our Note Purchase Agreements and Master Note Purchase Agreement. There can be no assurances that these cost reduction or cash generation plans will be successful, or that market conditions and our operating performance will not be further decreased compared to our projections. Upon the occurrence and during the continuation of an event of default under the Note Purchase Agreements and the Master Note Purchase Agreements, as supplemented, the Senior Notes may become immediately due and payable, either automatically or by declaration of holders of more than 50% in principal amount of the Senior Notes outstanding at the time.
57
Secured Note Purchase Commitment. In February 2015, we entered into a commitment letter agreement for the sale of $50.0 million aggregate principal amount of senior secured notes to be issued in April 2015. The proceeds from these notes are expected to provide a portion of the funds necessary to repay the $90.0 million principal amount repayment of the Series 2008-B Senior Notes that mature in April 2015. The notes would be secured by our accounts receivable (excluding CCLP accounts receivable) and our limited partner units in CCLP, would mature on April 1, 2017, and would include financial covenants consistent with our existing bank revolving credit facility. Closing of the sale and issuance of the notes is subject to the execution of the definitive note purchase agreement and customary conditions.
CCLP Long-Term Debt CCLP Bank Credit Facilities. On October 15, 2013, CCLP entered into an asset-based revolving credit
facility with a syndicate of lenders including JPMorgan Chase Bank, N.A. as administrative agent. Under this credit agreement, CCLP, along with certain of its subsidiaries, were named as borrowers, and all obligations under the credit agreement were guaranteed by all of its existing and future, direct and indirect, domestic subsidiaries. We were not a borrower or a guarantor under this credit agreement. The credit agreement included a maximum credit commitment of $100.0 million that was available for letters of credit (with a sublimit of $20.0 million) and included an uncommitted $30.0 million expansion feature. On August 4, 2014, in connection with the CSI Acquisition, CCLP entered into a new credit agreement (the "New CCLP Credit Agreement") and used a portion of the initial $210.0 million borrowing to repay the $38.1 million balance outstanding under CCLP's previous credit agreement dated October 15, 2013, which was then terminated. Approximately $0.8 million of deferred financing costs associated with that terminated credit agreement was expensed and charged to income during the third quarter of 2014. Under the New CCLP Credit Agreement, CCLP and CSI Compressco Sub, Inc. are named as the borrowers, and all obligations under the New CCLP Credit Agreement are guaranteed by all of CCLP's existing and future, direct and indirect, domestic restricted subsidiaries (other than domestic subsidiaries that are wholly owned by foreign subsidiaries). We are not a borrower or a guarantor under the New CCLP Credit Agreement. The New CCLP Credit Agreement includes a maximum credit commitment of $400.0 million, and included within such amount is availability for letters of credit (with a sublimit of $20.0 million) and swingline loans (with a sublimit of $60.0 million). On August 19, 2014, following the underwriters' exercise of their option to purchase 2,292,000 additional common units for $23.50 per common unit, resulting in additional net proceeds of $51.7 million ($53.9 million gross proceeds less underwriting discount), $55.0 million of the current balance of the New CCLP Credit Agreement was repaid. As of February 27, 2015, CCLP has a balance outstanding under the New CCLP Credit Agreement of $208.0 million, has $1.0 million letters of credit and performance bonds outstanding, and has availability under the New CCLP Credit Agreement of $191.0 million. The New CCLP Credit Agreement was used to fund, in part, CCLP's $825.0 million CSI Acquisition purchase price and fees and expenses related to the CSI acquisition, the CCLP's Senior Notes offering, and the New CCLP Credit Agreement, and to repay in full all borrowings outstanding under the previous CCLP credit agreement. The New CCLP Credit Agreement is available to provide CCLP's working capital needs, letters of credit, and for general partnership purposes, including capital expenditures and potential future expansions or acquisitions. So long as CCLP is not in default thereunder, the New CCLP Credit Agreement can also be used to fund CCLP’s quarterly distributions at the option of the board of directors of CCLP's general partner (provided, that after giving effect to such distributions, the borrowers will be in compliance with the financial covenants). Borrowings under the New CCLP Credit Agreement are subject to the satisfaction of customary conditions, including the absence of a default. The maturity date of the New CCLP Credit Agreement is August 4, 2019. Borrowings under the New CCLP Credit Agreement bear interest at a rate per annum equal to, at CCLP's option, either (a) LIBOR (adjusted to reflect any required bank reserves) for an interest period equal to one, two, three, or six months (as selected by CCLP), plus a leverage-based margin or (b) a base rate plus a leverage-based margin; such base rate shall be determined by reference to the highest of (1) the prime rate of interest per annum announced from time to time by Bank of America, N.A. (2) the Federal Funds rate plus 0.50% per annum and (3) LIBOR (adjusted to reflect any required bank reserves) for a one-month interest period on such day plus 1.00% per annum. Initially, from the closing date until the delivery of the financial statements for the first full fiscal quarter after closing, LIBOR based loans will have an applicable margin of 2.75% per annum and base rate loans will have an applicable margin of 1.75% per annum; thereafter, the applicable margin will range between 1.75% and 2.50% per annum for LIBOR based loans and 0.75% and 1.50% per annum for base rate loans based on CCLP's consolidated total leverage ratio when financial statements are delivered. In addition to paying interest on outstanding principal under the New CCLP Credit Agreement, CCLP is required to pay a commitment fee in respect of the unutilized commitments thereunder initially at the rate of 0.50% per annum until the delivery of the financial statements for the
58
first full quarter after the closing date and thereafter at the applicable rate ranging from 0.375% to 0.50% per annum, paid quarterly in arrears based on CCLP's consolidated total leverage ratio. CCLP is also required to pay a customary letter of credit fee equal to the applicable margin on revolving credit LIBOR loans, fronting fees and other fees agreed to with the administrative agent and lenders.
The New CCLP Credit Agreement requires CCLP to maintain (i) a minimum consolidated interest coverage ratio (ratio of consolidated earnings before interest, taxes, depreciation, and amortization ("EBITDA") to consolidated interest charges) of 3.0 to 1.0, (ii) a maximum consolidated total leverage ratio (ratio of consolidated total indebtedness to consolidated EBITDA) of 5.5 to 1.0 (with step downs to 5.0 to 1.0), and (iii) a maximum consolidated secured leverage ratio (consolidated secured indebtedness to consolidated EBITDA) of 4.0 to 1.0, in each case, as of the last day of each fiscal quarter, calculated on a trailing four quarters basis. In addition, the New CCLP Credit Agreement includes customary negative covenants that, among other things, limit CCLP's ability to incur additional debt, incur, or permit certain liens to exist, or make certain loans, investments, acquisitions, or other restricted payments. The New CCLP Credit Agreement provides that CCLP can make distributions to holders of its common units, but only if there is no default or event of default under the facility. CCLP is in compliance with all covenants and conditions of the New CCLP Credit Agreement as of December 31, 2014.
All obligations under the New CCLP Credit Agreement and the guarantees of those obligations are secured,
subject to certain exceptions, by a first lien security interest in substantially all of CCLP's assets and the assets of its existing and future domestic subsidiaries, and all of the capital stock of its existing and future subsidiaries (limited in the case of foreign subsidiaries, to 65% of the voting stock of first tier foreign subsidiaries).
CCLP 7.25% Senior Notes. On July 29, 2014, CCLP, CSI Compressco Finance Inc., a Delaware
corporation and indirect wholly owned subsidiary of CCLP (CSI Compressco Finance and, together with CCLP, the "Issuers"), and the guarantors named therein (the "Guarantors" and, together with the Issuers, the "Obligors"), entered into the Note Purchase Agreement (the "Note Purchase Agreement") with Merrill Lynch, Pierce, Fenner & Smith Incorporated on behalf of the initial purchasers named therein (collectively, the "Initial Purchasers") related to the issuance and sale by the Issuers to the Initial Purchasers of $350.0 million aggregate principal amount of the Issuers’ 7.25% Senior Notes due 2022 (the "CCLP Senior Notes") in a private offering (the "Offering") exempt from the registration requirements under the Securities Act of 1933, as amended (the "Securities Act"). The Note Purchase Agreement contains customary representations and warranties of the parties thereto and indemnification and contribution provisions under which the Obligors, on one hand, and the Initial Purchasers, on the other, have agreed to indemnify each other against certain liabilities, including liabilities under the Securities Act.
The Issuers closed the Offering on August 4, 2014. Their obligations under the CCLP Senior Notes are
jointly and severally, and fully and unconditionally, guaranteed on a senior unsecured basis initially by each of CCLP’s domestic restricted subsidiaries (other than CSI Compressco Finance) that guarantee CCLP’s other indebtedness. The CCLP Senior Notes and the subsidiary guarantees thereof (together, the "CCLP Securities") were issued pursuant to an indenture described below.
CCLP used the net proceeds of the Offering of approximately $337.8 million (consisting of $350.0 million
aggregate principal amount net of a $5.2 million discount and certain fees and offering expenses) to fund a portion of the $825.0 million cash purchase price for the CSI Acquisition, to pay certain acquisition expenses and to repay a portion of outstanding borrowings under the previous CCLP credit agreement.
Pursuant to the Note Purchase Agreement, CSI and any domestic subsidiaries of CSI required to guarantee
the CCLP Senior Notes pursuant to the indenture governing the CCLP Senior Notes were joined as parties to the Note Purchase Agreement pursuant to a purchase agreement joinder, dated August 4, 2014.
The Obligors issued the CCLP Securities pursuant to the Indenture dated as of August 4, 2014 (the
"Indenture") by and among the Obligors and U.S. Bank National Association, as trustee (the "Trustee"). The CCLP Senior Notes accrue interest at a rate of 7.25% per annum. Interest on the CCLP Senior Notes is payable semi-annually in arrears on February 15 and August 15 of each year, beginning February 15, 2015. The CCLP Senior Notes are scheduled to mature on August 15, 2022.
On and after August 15, 2017, CCLP may on one or more occasions redeem the CCLP Senior Notes, in
whole or in part, upon not less than 30-days’ nor more than 60-days’ prior notice, at the following redemption prices (expressed as a percentage of principal amount), plus accrued and unpaid interest and liquidated damages thereon, if any, to the applicable redemption date, subject to the right of holders of record on the relevant record
59
date to receive interest due on the relevant interest payment date, if redeemed during the 12-month period beginning on August 15 of the years indicated below:
Date Price2017 105.438%2018 103.625%2019 101.813%2020 and thereafter 100.000%
In addition, any time or from time to time before August 15, 2017, CCLP may redeem all or a part of the
CCLP Senior Notes at a redemption price equal to 100% of the principal amount of the CCLP Senior Notes redeemed, plus an applicable “make whole” prepayment premium and interest up to the redemption date.
Prior to August 15, 2017, CCLP may on one or more occasions redeem up to 35% of the principal amount
of the CCLP Senior Notes with an amount of cash not greater than the amount of the net cash proceeds from one or more equity offerings at a redemption price equal to 107.250% of the principal amount of the CCLP Senior Notes to be redeemed, plus accrued and unpaid interest and liquidated damages, if any, to the date of redemption, subject to the right of holders of record on the relevant record date to receive interest due on the relevant interest payment date, as long as (a) at least 65% of the aggregate principal amount of the CCLP Senior Notes originally issued on the issue date (excluding notes held by CCLP and its subsidiaries) remains outstanding after each such redemption; and (b) the redemption occurs within 180 days after the date of the closing of the equity offering.
The Indenture contains customary covenants restricting CCLP’s ability and the ability of its restricted
subsidiaries to: (i) pay dividends and make certain distributions, investments and other restricted payments; (ii) incur additional indebtedness or issue certain preferred shares; (iii) create certain liens; (iv) sell assets; (v) merge, consolidate, sell or otherwise dispose of all or substantially all of its assets; (vi) enter into transactions with affiliates; and (vii) designate its subsidiaries as unrestricted subsidiaries under the Indenture. These covenants are subject to a number of important limitations and exceptions, including certain provisions permitting CCLP, subject to the satisfaction of certain conditions, to transfer assets to certain of its unrestricted subsidiaries. Moreover, if the CCLP Senior Notes receive an investment grade rating from at least two rating agencies and no default has occurred and is continuing under the Indenture, many of the restrictive covenants in the Indenture will be terminated. The Indenture also contains customary events of default and acceleration provisions relating to such events of default, which provide that upon an event of default under the Indenture, the Trustee or the holders of at least 25% in aggregate principal amount of the CCLP Senior Notes then outstanding may declare all amounts owing under the CCLP Senior Notes to be due and payable. CCLP is in compliance with all covenants and conditions of the CCLP Senior Note Purchase Agreement as of December 31, 2014.
The offer and sale of the CCLP Securities have not been registered under the Securities Act or applicable
state securities laws, and the CCLP Securities may not be offered or sold in the U.S. absent registration or an applicable exemption from the registration requirements of the Securities Act and applicable state laws. In connection with the Offering of the CCLP Senior Notes, the Obligors entered into the Registration Rights Agreement dated as of August 4, 2014 (the "Registration Rights Agreement") with Merrill Lynch, Pierce, Fenner & Smith Incorporated, as representative of the Initial Purchasers, obligating the Obligors to use commercially reasonable efforts to file a registration statement with the Securities and Exchange Commission (the "SEC") registering an exchange offer by the Obligors that would allow holders of the CCLP Securities to exchange their restricted CCLP Securities for registered freely tradable notes and guarantees having substantially the same terms as the CCLP Securities and evidencing the same indebtedness as the restricted CCLP Securities. Under certain circumstances, in lieu of a registered exchange offer, the Obligors must use commercially reasonable efforts to file a shelf registration statement for the resale of the CCLP Securities. If, among other things, such exchange offer registration statement is not declared effective by the SEC on or prior to 365 days after the closing of the Offering, or the exchange offer has not been consummated within 30 business days following the expiration of the 365-day period following the closing of the Offering to have an exchange offer registration statement declared effective by the SEC, the Obligors will be required to pay to the holders of the CCLP Senior Notes liquidated damages in an amount equal to 0.25% per annum on the principal amount of the CCLP Senior Notes held by such holder during the 90-day period immediately following the occurrence of such registration default, and if such registration default is not cured, such amount of liquidated damages shall increase by 0.25% per annum at the end of such 90-day period, such that the maximum amount of liquidated damages for all registration defaults would be one-half of one percent (0.5%) per annum.
60
Other Sources and Uses In addition to the aforementioned revolving credit facilities, we fund our short-term liquidity requirements
from cash generated by operations, operating leases, and from short-term vendor financing. Should additional capital be required, we believe that we have the ability to raise such capital through the issuance of additional debt or equity. However, instability or volatility in the capital markets at the times we need to access capital may affect the cost of capital and the ability to raise capital for an indeterminable length of time. As discussed above, our Credit Agreement, as amended, matures in September 2019, the New CCLP Credit Agreement matures in August 2019, our Senior Notes mature at various dates between April 2015 and December 2020, and the CCLP Senior Notes mature on August 15, 2022. The replacement of these capital sources at similar or more favorable terms is not certain. If it is necessary to issue equity to fund our capital needs, dilution to our common stockholders will occur.
Although near-term growth plans have been suspended and are subject to our efforts to conserve cash and
rationalize our cost structure during the current period of low oil and natural gas prices, we maintain a long-term growth strategy for our core businesses. As part of our strategic growth plans, we will evaluate opportunities to acquire businesses and assets that may involve the payment of cash. Such acquisitions may be funded with existing cash balances, funds under credit facilities, or cash generated from the issuance of securities. CCLP also continues to pursue its long-term growth objectives, with funding available under its credit facilities, other borrowings, cash generated from the issuance of its common units, as well as its available cash.
CCLP’s Partnership Agreement requires that within 45 days after the end of each quarter, it distribute all of its available cash, as defined in the Partnership Agreement, to its unitholders of record on the applicable record date. For the year ended December 31, 2014, net of distributions paid to us, CCLP distributed approximately $12.6 million to its public unitholders.
Off Balance Sheet Arrangements
An “off balance sheet arrangement” is defined as any contractual arrangement to which an entity that is not
consolidated with us is a party, under which we have, or in the future may have: • any obligation under a guarantee contract that requires initial recognition and measurement under U.S.
Generally Accepted Accounting Principles; • a retained or contingent interest in assets transferred to an unconsolidated entity or similar arrangement
that serves as credit, liquidity, or market risk support to that entity for the transferred assets; • any obligation under certain derivative instruments; or • any obligation under a material variable interest held by us in an unconsolidated entity that provides
financing, liquidity, market risk or credit risk support to us, or engages in leasing, hedging, or research and development services with us. As of December 31, 2014 and 2013, we had no “off balance sheet arrangements” that may have a current
or future material effect on our consolidated financial condition or results of operations. For a discussion of operating leases, including the lease of our corporate headquarters facility, see “Note D – Leases” in the Notes to Consolidated Financial Statements.
Commitments and Contingencies
Litigation
We are named defendants in several lawsuits and respondents in certain governmental proceedings arising
in the ordinary course of business. While the outcome of lawsuits or other proceedings against us cannot be predicted with certainty, management does not consider it reasonably possible that a loss resulting from such lawsuits or other proceedings in excess of any amounts accrued has been incurred that is expected to have a material adverse impact on our financial condition, results of operations, or liquidity.
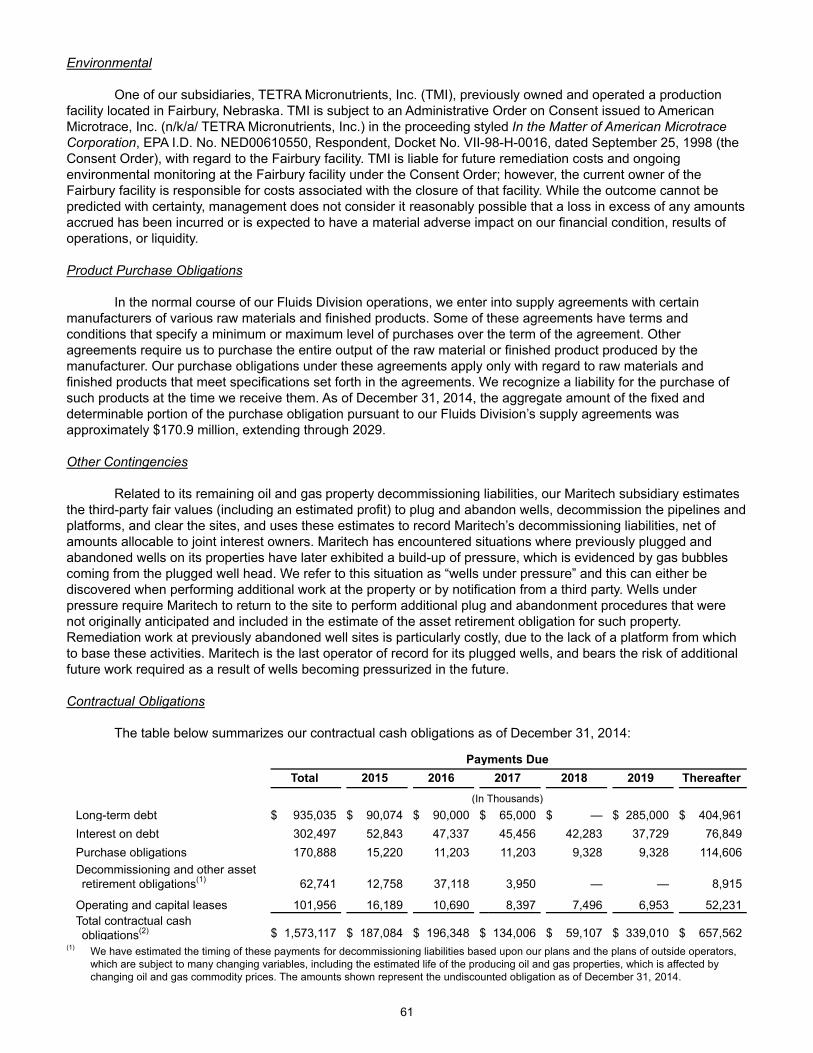
61
Environmental One of our subsidiaries, TETRA Micronutrients, Inc. (TMI), previously owned and operated a production
facility located in Fairbury, Nebraska. TMI is subject to an Administrative Order on Consent issued to American Microtrace, Inc. (n/k/a/ TETRA Micronutrients, Inc.) in the proceeding styled In the Matter of American Microtrace Corporation, EPA I.D. No. NED00610550, Respondent, Docket No. VII-98-H-0016, dated September 25, 1998 (the Consent Order), with regard to the Fairbury facility. TMI is liable for future remediation costs and ongoing environmental monitoring at the Fairbury facility under the Consent Order; however, the current owner of the Fairbury facility is responsible for costs associated with the closure of that facility. While the outcome cannot be predicted with certainty, management does not consider it reasonably possible that a loss in excess of any amounts accrued has been incurred or is expected to have a material adverse impact on our financial condition, results of operations, or liquidity. Product Purchase Obligations
In the normal course of our Fluids Division operations, we enter into supply agreements with certain
manufacturers of various raw materials and finished products. Some of these agreements have terms and conditions that specify a minimum or maximum level of purchases over the term of the agreement. Other agreements require us to purchase the entire output of the raw material or finished product produced by the manufacturer. Our purchase obligations under these agreements apply only with regard to raw materials and finished products that meet specifications set forth in the agreements. We recognize a liability for the purchase of such products at the time we receive them. As of December 31, 2014, the aggregate amount of the fixed and determinable portion of the purchase obligation pursuant to our Fluids Division’s supply agreements was approximately $170.9 million, extending through 2029.
Other Contingencies
Related to its remaining oil and gas property decommissioning liabilities, our Maritech subsidiary estimates
the third-party fair values (including an estimated profit) to plug and abandon wells, decommission the pipelines and platforms, and clear the sites, and uses these estimates to record Maritech’s decommissioning liabilities, net of amounts allocable to joint interest owners. Maritech has encountered situations where previously plugged and abandoned wells on its properties have later exhibited a build-up of pressure, which is evidenced by gas bubbles coming from the plugged well head. We refer to this situation as “wells under pressure” and this can either be discovered when performing additional work at the property or by notification from a third party. Wells under pressure require Maritech to return to the site to perform additional plug and abandonment procedures that were not originally anticipated and included in the estimate of the asset retirement obligation for such property. Remediation work at previously abandoned well sites is particularly costly, due to the lack of a platform from which to base these activities. Maritech is the last operator of record for its plugged wells, and bears the risk of additional future work required as a result of wells becoming pressurized in the future.
Contractual Obligations
The table below summarizes our contractual cash obligations as of December 31, 2014:
Payments Due Total 2015 2016 2017 2018 2019 Thereafter (In Thousands)Long-term debt $ 935,035 $ 90,074 $ 90,000 $ 65,000 $ — $ 285,000 $ 404,961Interest on debt 302,497 52,843 47,337 45,456 42,283 37,729 76,849Purchase obligations 170,888 15,220 11,203 11,203 9,328 9,328 114,606Decommissioning and other asset retirement obligations(1) 62,741 12,758 37,118 3,950 —
— 8,915
Operating and capital leases 101,956 16,189 10,690 8,397 7,496 6,953 52,231Total contractual cash obligations(2) $ 1,573,117 $ 187,084 $ 196,348 $ 134,006 $ 59,107
$ 339,010 $ 657,562
(1) We have estimated the timing of these payments for decommissioning liabilities based upon our plans and the plans of outside operators, which are subject to many changing variables, including the estimated life of the producing oil and gas properties, which is affected by changing oil and gas commodity prices. The amounts shown represent the undiscounted obligation as of December 31, 2014.
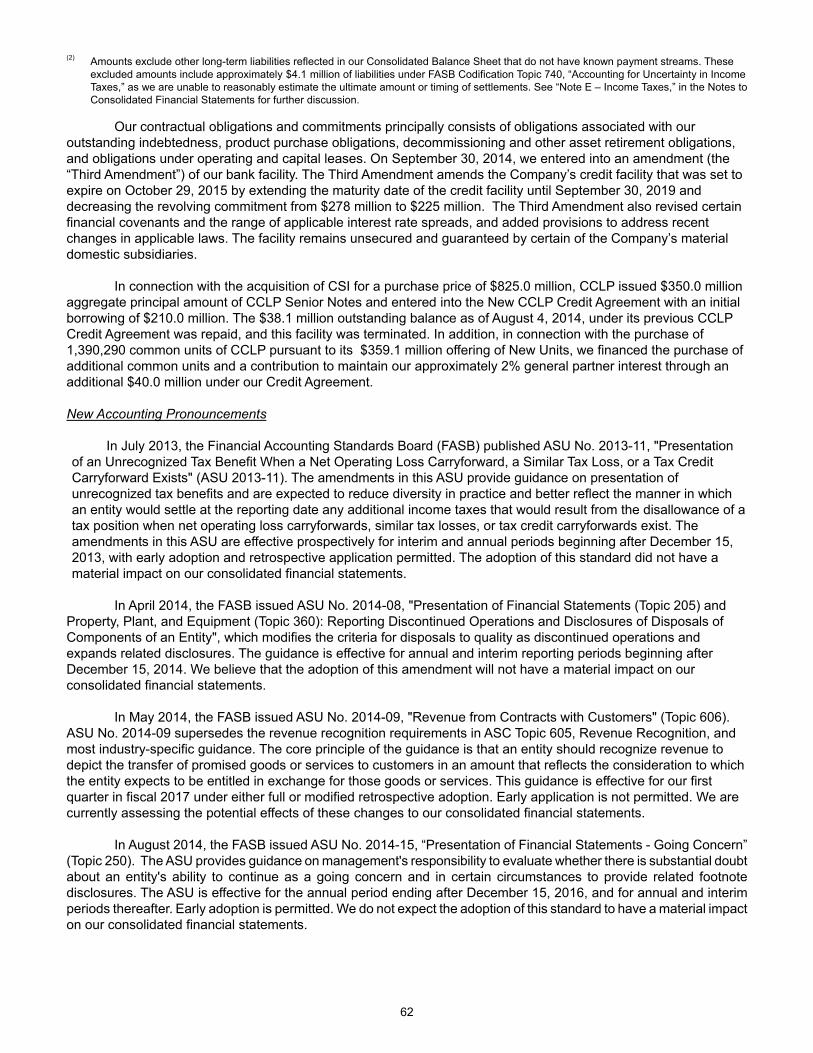
62
(2) Amounts exclude other long-term liabilities reflected in our Consolidated Balance Sheet that do not have known payment streams. These excluded amounts include approximately $4.1 million of liabilities under FASB Codification Topic 740, “Accounting for Uncertainty in Income Taxes,” as we are unable to reasonably estimate the ultimate amount or timing of settlements. See “Note E – Income Taxes,” in the Notes to Consolidated Financial Statements for further discussion.
Our contractual obligations and commitments principally consists of obligations associated with our
outstanding indebtedness, product purchase obligations, decommissioning and other asset retirement obligations, and obligations under operating and capital leases. On September 30, 2014, we entered into an amendment (the “Third Amendment”) of our bank facility. The Third Amendment amends the Company’s credit facility that was set to expire on October 29, 2015 by extending the maturity date of the credit facility until September 30, 2019 and decreasing the revolving commitment from $278 million to $225 million. The Third Amendment also revised certain financial covenants and the range of applicable interest rate spreads, and added provisions to address recent changes in applicable laws. The facility remains unsecured and guaranteed by certain of the Company’s material domestic subsidiaries.
In connection with the acquisition of CSI for a purchase price of $825.0 million, CCLP issued $350.0 million
aggregate principal amount of CCLP Senior Notes and entered into the New CCLP Credit Agreement with an initial borrowing of $210.0 million. The $38.1 million outstanding balance as of August 4, 2014, under its previous CCLP Credit Agreement was repaid, and this facility was terminated. In addition, in connection with the purchase of 1,390,290 common units of CCLP pursuant to its $359.1 million offering of New Units, we financed the purchase of additional common units and a contribution to maintain our approximately 2% general partner interest through an additional $40.0 million under our Credit Agreement. New Accounting Pronouncements
In July 2013, the Financial Accounting Standards Board (FASB) published ASU No. 2013-11, "Presentation
of an Unrecognized Tax Benefit When a Net Operating Loss Carryforward, a Similar Tax Loss, or a Tax Credit Carryforward Exists" (ASU 2013-11). The amendments in this ASU provide guidance on presentation of unrecognized tax benefits and are expected to reduce diversity in practice and better reflect the manner in which an entity would settle at the reporting date any additional income taxes that would result from the disallowance of a tax position when net operating loss carryforwards, similar tax losses, or tax credit carryforwards exist. The amendments in this ASU are effective prospectively for interim and annual periods beginning after December 15, 2013, with early adoption and retrospective application permitted. The adoption of this standard did not have a material impact on our consolidated financial statements.
In April 2014, the FASB issued ASU No. 2014-08, "Presentation of Financial Statements (Topic 205) and
Property, Plant, and Equipment (Topic 360): Reporting Discontinued Operations and Disclosures of Disposals of Components of an Entity", which modifies the criteria for disposals to quality as discontinued operations and expands related disclosures. The guidance is effective for annual and interim reporting periods beginning after December 15, 2014. We believe that the adoption of this amendment will not have a material impact on our consolidated financial statements. In May 2014, the FASB issued ASU No. 2014-09, "Revenue from Contracts with Customers" (Topic 606). ASU No. 2014-09 supersedes the revenue recognition requirements in ASC Topic 605, Revenue Recognition, and most industry-specific guidance. The core principle of the guidance is that an entity should recognize revenue to depict the transfer of promised goods or services to customers in an amount that reflects the consideration to which the entity expects to be entitled in exchange for those goods or services. This guidance is effective for our first quarter in fiscal 2017 under either full or modified retrospective adoption. Early application is not permitted. We are currently assessing the potential effects of these changes to our consolidated financial statements. In August 2014, the FASB issued ASU No. 2014-15, “Presentation of Financial Statements - Going Concern” (Topic 250). The ASU provides guidance on management's responsibility to evaluate whether there is substantial doubt about an entity's ability to continue as a going concern and in certain circumstances to provide related footnote disclosures. The ASU is effective for the annual period ending after December 15, 2016, and for annual and interim periods thereafter. Early adoption is permitted. We do not expect the adoption of this standard to have a material impact on our consolidated financial statements.
63
Item 7A. Quantitative and Qualitative Disclosures about Market Risk. Interest Rate Risk
During 2014, we borrowed $90.0 million, net of repayments, pursuant to our revolving credit facility. During
2014, CCLP borrowed $195.0 million, net of repayments, to finance a portion of the purchase price for the acquisition of CSI and to fund the expansion and upgrade of its compressor and equipment fleet. Each of these borrowings bears interest at an agreed-upon percentage rate spread above LIBOR, and is therefore subject to market risk exposure related to changes in applicable interest rates.
The following table sets forth as of December 31, 2014, our principal cash flows for our long-term debt
obligations (which bear a variable rate of interest) and weighted average effective interest rate by their expected maturity dates. We are not a party to an interest rate swap contract or other derivative instrument designed to hedge our exposure to interest rate fluctuation risk.
Expected Maturity Date Fair Market Value 2015 2016 2017 2018 2019 Thereafter Total
As of December 31, 2014 Long-term debt: U.S. dollar variable rate $ — $ — $ — $ — $ 285,00
0$ — $ 285,000 $ 285,000
Euro variable rate (in $US) — — — — — — — —Weighted average interest rate
(variable) — — — 2.981% —
2.981%
U.S. dollar fixed rate $ 90,074 $ 90,000 $ 65,000 $ — $ — $ 404,961 $ 650,035 $ 665,663Weighted average interest rate
(fixed) — 5.900% 5.090% —% — 6.872% 6.509%
Variable to fixed swaps — — — — — — — —Fixed pay rate — — — — — — — —Variable receive rate — — — — — — — —
Exchange Rate Risk
We are exposed to fluctuations between the U.S. dollar and the euro with regard to our euro-denominated operating activities. In July 2012, we borrowed 10.0 million euros and designated the borrowing as a hedge of our net investment in our European operations. Changes in the foreign currency exchange rate have resulted in a cumulative change to the cumulative translation adjustment account of $1.1 million net of taxes, at December 31, 2014, with no ineffectiveness recorded. This 10.0 million euros borrowing was repaid in September 2014. We also have currency exchange rate risk exposure related to revenues, expenses, operating receivables, and payables denominated in foreign currencies. In October 2013, we and CCLP began entering into 30-day foreign currency forward derivative contracts as part of a program designed to mitigate the currency exchange rate risk exposure on selected transactions of certain foreign subsidiaries. As of December 31, 2014, we and CCLP had the following foreign currency derivative contracts outstanding relating to a portion of our foreign operations:
Derivative Contracts US Dollar Notional Amount
Traded Exchange Rate Settlement Date
(In Thousands)
Forward purchase pounds sterling $ 4,484 1.56 1/16/2015
Forward purchase Brazilian real 1,958 2.66 1/16/2015
Forward purchase Canadian dollar 3,770 1.16 1/16/2015
Forward sale Mexican peso 8,427 14.74 1/16/2015
Forward purchase Canadian dollar 1,150 1.16 1/16/2015
Under this program, we and CCLP may enter into similar derivative contracts from time to time. Although contracts pursuant to this program will serve as an economic hedge of the cash flow of our currency exchange risk exposure, they will not be formally designated as hedge contracts or qualify for hedge accounting treatment. Accordingly, any change in the fair value of these derivative instruments during a period will be included in the determination of earnings for that period.
64
The fair value of foreign currency derivative instruments are based on quoted market values as reported to
us by our counterparty. The fair values of our foreign currency derivative instruments as of December 31, 2014, are as follows:
Foreign currency derivative instrumentsBalance Sheet Location
Fair Value at December 31, 2014
(In Thousands)
Forward purchase contracts Current assets $ —
Forward sale contracts Current assets —
Forward sale contracts Current liabilities (91)
Forward purchase contracts Current liabilities (83)
Total $ (174)
Based on the derivative contracts that were in place as of December 31, 2014, a five percent devaluation of the British pound sterling compared to the U.S. dollar would result in a decrease in the market value of our forward sale contract of $0.2 million. A five percent devaluation of the Brazilian real compared to the U.S. dollar would result in a decrease in the market value of our forward sale contract of $0.03 million. A five percent devaluation of the Canadian dollar compared to the U.S. dollar would result in a decrease in the market value of our forward purchase contract of $0.2 million. A five percent devaluation of the Mexican peso compared to the U.S. dollar would result in a decrease in the market value of our forward purchase contract of $0.001 million. A five percent devaluation of the Canadian dollar compared to the U.S. dollar would result in a decrease in the market value of our forward purchase contracts of $0.05 million. Commodity Price Risk
We are exposed to the commodity price risk associated with Maritech’s oil and natural gas production on its remaining properties. Due to the minimal amount of production, such commodity price risk exposure is not significant.
Item 8. Financial Statements and Supplementary Data.
Our financial statements and supplementary data for us and our subsidiaries required to be included in this
Item 8 are set forth in Item 15 of this Report.
Item 9. Changes in and Disagreements with Accountants on Accounting and Financial Disclosure. None.
Item 9A. Controls and Procedures. Conclusion Regarding the Effectiveness of Disclosure Controls and Procedures
Under the supervision and with the participation of our management, including our Chief Executive Officer
and Chief Financial Officer, we conducted an evaluation of our disclosure controls and procedures, as such term is defined under Rule 13a-15(e) promulgated under the Securities Exchange Act of 1934, as amended (the "Exchange Act"). Based on this evaluation, the Chief Executive Officer and Chief Financial Officer concluded that our disclosure controls and procedures were effective as of December 31, 2014, the end of the period covered by this Annual Report.
Management’s Report on Internal Control over Financial Reporting
Our management is responsible for establishing and maintaining adequate internal control over financial
reporting, as such term is defined in Exchange Act Rule 13a-15(f). Under the supervision and with the participation of management, including our Chief Executive Officer and Chief Financial Officer, an evaluation of the effectiveness of our internal control over financial reporting was conducted based on the framework in Internal Control – Integrated Framework issued by the Committee of Sponsoring Organizations of the Treadway Commission (2013

65
framework) ("COSO"). Based on that evaluation under the framework in Internal Control – Integrated Framework issued by the COSO, our management concluded that our internal control over financial reporting was effective as of December 31, 2014.
Management's evaluation of our internal control over financial reporting excludes Compressor Systems,
Inc. ("CSI"), which was acquired on August 4, 2014 by a subsidiary of CCLP. Total assets and net assets of CSI represented approximately 46.5% and 62.7%, respectively, of our consolidated total assets as of December 31, 2014, and CSI's revenues following the August 4, 2014 acquisition date represented approximately 14.2% of our consolidated revenues for the year ended December 31, 2014. In accordance with guidance issued by the SEC, companies are allowed to exclude acquisitions from their assessment of internal control over financial reporting during the first year subsequent to an acquisition while integrating the acquired operations.
An assessment of the effectiveness of our internal control over financial reporting as of December 31, 2014,
has been performed by Ernst & Young LLP, an independent registered public accounting firm, as stated in their report which is included as part of Item 15.
Changes in Internal Control over Financial Reporting
As discussed above in this Annual Report on Form 10-K, on August 4, 2014, a subsidiary of CCLP
completed the acquisition of CSI. We are currently integrating CSI into our internal control over financial reporting processes. In executing this integration, we are analyzing, evaluating and, where necessary, making changes in controls and procedures related to the CSI business, which we expect to be completed in fiscal year 2015. We have excluded CSI from our assessment of internal control over financial reporting as of December 31, 2014, as permitted by guidance provided by the staff of the SEC.
Other than the changes described above, there were no changes in our internal control over financial
reporting during the fiscal quarter ending December 31, 2014 that have materially affected, or are reasonably likely to materially affect, our internal control over financial reporting.
Item 9B. Other Information.
During the fourth quarter of 2014, as part of our annual assessment of goodwill impairment conducted in
connection with the preparation of our financial statements for the period ended December 31, 2014, we determined that our Production Testing and Offshore Services reporting units had carrying values in excess of their estimated fair values as a result of expected reduced demand for their products and services in response to decreased oil and natural gas prices. Based on our analysis, we concluded that an impairment of $60.1 million of recorded goodwill for Production Testing was required and an impairment of the entire $3.9 million of recorded goodwill for Offshore Services was required. Each of these impairments was recorded during the fourth quarter of 2014.
Also during the fourth quarter of 2014, and in connection with the preparation of our financial statements for
the period ended December 31, 2014, our Offshore Services segment recorded impairments of approximately $13.3 million, primarily associated with a portion of the carrying value of certain of its dive services vessels and equipment and other long lived assets due to expected decreased demand. Our Production Testing segment also recorded impairments of approximately $14.5 million, primarily associated with a portion of the carrying value of certain of its production testing equipment and certain identified intangible assets. Our Fluids Division also recorded impairments of approximately $5.2 million associated with certain of its water management business assets.
The impairment charges described above are not expected to result in future capital expenditures. For
additional information, see "Goodwill" and "Impairment of Long-Lived Assets" in Note B - "Summary of Significant Accounting Policies" contained in the Notes to Consolidated Financial Statements.
66
PART III
Item 10. Directors, Executive Officers, and Corporate Governance. The information required by this Item is hereby incorporated by reference from the information appearing
under the captions “Proposal No. 1: Election of Directors,” “Executive Officers,” “Corporate Governance,” “Board Meetings and Committees,” and “Section 16(a) Beneficial Ownership Reporting Compliance” in our definitive proxy statement (the "Proxy Statement") for the annual meeting of stockholders to be held on May 5, 2015, which involves the election of directors and is to be filed with the Securities and Exchange Commission ("SEC") pursuant to the Securities Exchange Act of 1934 as amended (the "Exchange Act") within 120 days of the end of our fiscal year on December 31, 2014.
Item 11. Executive Compensation.
The information required by this Item is hereby incorporated by reference from the information appearing
under the captions “Management and Compensation Committee Report,” “Management and Compensation Committee Interlocks and Insider Participation,” “Compensation Discussion and Analysis,” “Compensation of Executive Officers,” and “Director Compensation” in our Proxy Statement. Notwithstanding the foregoing, in accordance with the instructions to Item 407 of Regulation S-K, the information contained in our Proxy Statement under the subheading “Management and Compensation Committee Report” shall be deemed furnished, and not filed, in this Form 10-K, and shall not be deemed incorporated by reference into any filing under the Securities Act of 1933, or the Exchange Act, as a result of this furnishing, except to the extent we specifically incorporate it by reference.
Item 12. Security Ownership of Certain Beneficial Owners and Management and Related Stockholder Matters.
The information required by this Item is hereby incorporated by reference from the information appearing
under the captions “Beneficial Stock Ownership of Certain Stockholders and Management” and “Equity Compensation Plan Information” in our Proxy Statement.
Item 13. Certain Relationships and Related Transactions, and Director Independence.
The information required by this Item is hereby incorporated by reference from the information appearing
under the captions “Certain Transactions” and “Director Independence” in our Proxy Statement.
Item 14. Principal Accounting Fees and Services. The information required by this Item is hereby incorporated by reference from the information appearing
under the caption “Fees Paid to Principal Accounting Firm” in our Proxy Statement.
67
PART IV
Item 15. Exhibits and Financial Statement Schedules. (a) List of documents filed as part of this Report
1. Financial Statements of the Company Page
Reports of Independent Registered Public Accounting Firm F-1
Consolidated Balance Sheets at December 31, 2013 and 2012 F-3
Consolidated Statements of Operations for the years ended December 31, 2013, 2012, and 2011 F-5
Consolidated Statements of Comprehensive Income (Loss) for the years ended December 31, 2013, 2012, and 2011
F-6
Consolidated Statements of Equity for the years ended December 31, 2013, 2012, and 2011 F-7
Consolidated Statements of Cash Flows for the years ended December 31, 2013, 2012, and 2011 F-8
Notes to Consolidated Financial Statements F-92. Financial statement schedules Schedule I - Condensed Financial Information of Registrant (Parent Only) F-56
All other schedules for which provision is made in the applicable accounting regulation of the Securities and Exchange Commission are not required under the related instructions or are inapplicable and therefore have been omitted.
3. List of Exhibits
2.1 Asset Purchase Agreement, dated as of July 18, 2012, by and among Greywolf Production Systems Inc., GPS
Limited, Greywolf USA Holdings, Inc., 1554531 Alberta Ltd., the shareholders designated therein, Greywolf Energy Services Ltd. And TETRA Production Testing Services, LLC (incorporated by reference to Exhibit 2.1 to the Company’s Form 8-K filed on July 20, 2012 (SEC File No. 001-13455)).
3.1 Restated Certificate of Incorporation of TETRA Technologies, Inc. (incorporated by reference to Exhibit 3.1 to the Company’s Registration Statement on Form S-4 filed on December 27, 1995 (SEC File No. 33-80881)).
3.2 Certificate of Amendment of Restated Certificate of Incorporation of TETRA Technologies, Inc. (incorporated by reference to Exhibit 3.1 to the Company’s Registration Statement on Form S-4 filed on December 27, 1995 (SEC File No. 33-80881)).
3.3 Certificate of Amendment of Restated Certificate of Incorporation of TETRA Technologies, Inc. (incorporated by reference to Exhibit 3.1(ii) to the Company’s Annual Report on Form 10-K for the year ended December 31, 2003 filed on March 15, 2004 (SEC File No. 001-13455)).
3.4 Certificate of Amendment of Restated Certificate of Incorporation of TETRA Technologies, Inc. (incorporated by reference to Exhibit 4.4 to the Company’s Registration Statement on Form S-4 filed on May 25, 2004 (SEC File No. 333-115859)).
3.5 Certificate of Amendment of Restated Certificate of Incorporation of TETRA Technologies, Inc. (incorporated by reference to Exhibit 4.5 to the Company’s Registration Statement on Form S-8 filed on May 4, 2006 (SEC File No. 333-133790)).
3.6 Amended and Restated Bylaws of TETRA Technologies, Inc. (incorporated by reference to Exhibit 4.6 to the Company’s Registration Statement on Form S-8 filed on May 4, 2006 (SEC File No. 333-133790)).
3.7 Certificate of Elimination, dated March 13, 2013, relating to the Series One Junior Participating Preferred Stock (incorporated by reference to Exhibit 3.1 to the Company’s Form 8-K filed on March 13, 2013 (SEC File No. 001-13455)).
4.1 Master Note Purchase Agreement, dated September 27, 2004 by and among TETRA Technologies, Inc. and Jackson National Life Insurance Company, Massachusetts Mutual Life Insurance Company, C.M. Life Insurance Company, Allstate Life Insurance Company, Teachers Insurance and Annuity Association of America, Pacific Life Insurance Company, the Prudential Assurance Company Limited (PAC), and Panther CDO II, B.V. (incorporated by reference to Exhibit 4.1 to the Company’s Form 8-K filed on September 30, 2004 (SEC File No. 001-13455)).
68
4.2 Form of Subsidiary Guaranty dated September 27, 2004, executed by TETRA Applied Holding Company, TETRA International Incorporated, TETRA Micronutrients, Inc., TETRA Process Services, Inc., TETRA Thermal, Inc., Maritech Resources, Inc., Seajay Industries, Inc., TETRA Investment Holding Co., Inc., TETRA Financial Services, Inc., Compressco, Inc., Providence Natural Gas, Inc., TETRA Applied LP, LLC, TETRA Applied GP, LLC, TETRA Production Testing GP, LLC, TPS Holding Company, LLC, T Production Testing, LLC, TETRA Real Estate, LLC, TETRA Real Estate, LP, Compressco Testing, L.L.C., Compressco Field Services, Inc., TETRA Production Testing Services, L.P., and TETRA Applied Technologies, L. P., for the benefit of the holders of the Notes (incorporated by reference to Exhibit 4.4 to the Company’s Form 8-K filed on September 30, 2004 (SEC File No. 001-13455)).
4.3 First Supplement to Master Note Purchase Agreement, dated April 18, 2006, by and among TETRA Technologies, Inc. and Jackson National Life Insurance Company, Allianz Life Insurance Company of North America, United of Omaha Life Insurance Company, Mutual of Omaha Insurance Company, CUNA Mutual Life Insurance Company, CUNA Mutual Insurance Society, CUMIS Insurance Society, Inc., Members Life Insurance Company, and Modern Woodmen of America, attaching the form of the 5.90% Senior Notes, Series 2006-A, due April 30, 2016 as an exhibit thereto (incorporated by reference to Exhibit 4.1 to the Company’s Form 8-K filed on April 20, 2006 (SEC File No. 001-13455)).
4.4 Note Purchase Agreement, dated April 30, 2008, by and among TETRA Technologies, Inc. and The Prudential Insurance Company of America, Physicians Mutual Insurance Company, The Lincoln National Life Insurance Company, The Guardian Life Insurance Company of America, The Guardian Insurance & Annuity Company, Inc., Massachusetts Mutual Life Insurance Company, Hakone Fund II LLC, C.M. Life Insurance Company, Pacific Life Insurance Company, United of Omaha Life Insurance Company, Companion Life Insurance Company, United World Life Insurance Company, Country Life Insurance Company, The Ohio National Life Insurance Company and Ohio National Life Assurance Corporation (incorporated by reference to Exhibit 4.1 to the Company’s Form 8-K filed on May 5, 2008 (SEC File No. 001-13455)).
4.5 Form of 6.30% Senior Notes, Series 2008-A, due April 30, 2013 (incorporated by reference to Exhibit 4.2 to the Company’s Form 8-K filed on May 5, 2008 (SEC File No. 001-13455)).
4.6 Form of 6.56% Senior Notes, Series 2008-B, due April 30, 2015 (incorporated by reference to Exhibit 4.3 to the Company’s Form 8-K filed on May 5, 2008 (SEC File No. 001-13455)).
4.7 Form of Subsidiary Guarantee dated as of April 30, 2008, executed by Beacon Resources, LLC, Compressco Field Services, Inc., EPIC Diving and Marine Services, LLC, Maritech Resources, Inc., TETRA Applied Technologies, LLC, TETRA International Incorporated, TETRA Process Services, L.C., TETRA Production Testing Services, LLC, and Maritech Timbalier Bay, LP, for the benefit of the holders of the Notes (incorporated by reference to Exhibit 4.4 to the Company’s Form 8-K filed on May 5, 2008 (SEC File No. 0001-13455)).
4.80 Note Purchase Agreement, dated September 30, 2010, by and among TETRA Technologies, Inc. and The Lincoln National Life Insurance Company, Teachers Insurance and Annuity Association of America, Wells Fargo Bank, N.A., The Guardian National Life Insurance Company of America, The Guardian Insurance & Annuity Company, Inc., Southern Farm Bureau Life Insurance Company, Primerica Life Insurance Company, Prime Reinsurance Company, Inc., Senior Health Insurance Company of Pennsylvania, The Union Central Life Insurance Company, Ameritas Life Insurance Corp., Acacia Life Insurance Company and First Ameritas Life Insurance Corp. of New York (incorporated by reference to Exhibit 4.1 to the Company’s Current Report on Form 8-K filed on October 8, 2010 (SEC File No. 001-13455)).
4.90 Form of 5.09% Senior Notes, Series 2010-A, due December 15, 2017 (incorporated by reference to Exhibit 4.2 to the Company’s Current Report on Form 8-K filed on October 8, 2010 (SEC File No. 001-13455)).
4.10 Form of 5.67% Senior Notes, Series 2010-B, due December 15, 2020 (incorporated by reference to Exhibit 4.3 to the Company’s Current Report on Form 8-K filed on October 8, 2010 (SEC File No. 001-13455)).
4.11 Note Purchase Agreement, dated April 29, 2013, by and among TETRA Technologies, Inc. and The Lincoln National Life Insurance Company and Lincoln Life & Annuity Company of New York (incorporated by reference to Exhibit 4.1 to the Company’s Form 8-K filed on May 3, 2013 (SEC File No. 001-13455)).
4.12 First Amendment to Note Purchase Agreement dated and effective as of April 29, 2013, by and among TETRA Technologies, Inc. and The Lincoln National Life Insurance Company and Lincoln Life & Annuity Company of New York (incorporated by reference to Exhibit 4.2 to the Company’s Form 8-K filed on May 3, 2013 (SEC File No. 001-13455)).
4.13 Form of 4.00% Senior Notes due April 29, 2020 (incorporated by reference to Exhibit 4.3 to the Company’s Form 8-K filed on May 3, 2013 (SEC File No. 001-13455)).
4.14 Subsidiary Guaranty dated April 29, 2013, executed by Compressco Field Services, L.L.C., EPIC Diving & Marine Services, LLC, TETRA Applied Technologies, LLC, TETRA International Incorporated and TETRA Production Testing Services, LLC, in favor of the holders of the 4.00% Senior Notes due April 29, 2020 (incorporated by reference to Exhibit 4.4 to the Company’s Form 8-K filed on May 3, 2013 (SEC File No. 001-13455)).
69
10.1*** 1990 Stock Option Plan, as amended through January 5, 2001 (incorporated by reference to Exhibit 10.8 to the Company’s Form 10-K for the year ended December 31, 2000 filed on March 30, 2001 (SEC File No. 001-13455)).
10.2*** 1996 Stock Option Plan for Nonexecutive Employees and Consultants (incorporated by reference to Exhibit 99.1 to the Company’s Registration Statement on Form S-8 filed on November 19, 1997 (SEC File No. 333-61988)).
10.3*** Form of Incentive Stock Option Agreement, dated as of December 28, 2004 (incorporated by reference to Exhibit 10.1 to the Company’s Form 8-K filed on January 7, 2005 SEC File No. 001-13455)).
10.4*** TETRA Technologies, Inc. 2006 Equity Incentive Compensation Plan (incorporated by reference to Exhibit 4.12 to the Company’s Registration Statement on Form S-8 filed on May 4, 2006 (SEC File No. 333-133790)).
10.5*** Forms of Employee Incentive Stock Option Agreement, Employee Nonqualified Stock Option Agreement, and Employee Restricted Stock Agreement under the TETRA Technologies, Inc. 2006 Equity Incentive Compensation Plan (incorporated by reference to Exhibits 10.1, 10.2, and 10.3 to the Company’s Form 8-K filed on May 8, 2006 (SEC File No. 001-13455)).
10.6*** Nonqualified Stock Option Agreement between TETRA Technologies, Inc. and Stuart M. Brightman, dated April 20, 2005 (incorporated by reference to Exhibit 10.1 to the Company’s Form 8-K filed on April 22, 2005 (SEC File No. 001-13455)).
10.7 Credit Agreement, as amended and restated, dated as of June 27, 2006, among TETRA Technologies, Inc. and certain of its subsidiaries, as borrowers, JPMorgan Chase Bank, N.A., as administrative agent, Bank of America, National Association and Wells Fargo Bank, N.A., as syndication agents, and Comerica Bank, as documentation agent, and the lenders party thereto (incorporated by reference to Exhibit 10.1 to the Company’s Form 8-K filed on June 30, 2006 (SEC File No. 001-13455)).
10.8 Agreement and First Amendment to Credit Agreement, dated as of December 15, 2006, among TETRA Technologies, Inc. and certain of its subsidiaries, as borrowers, JPMorgan Chase Bank, N.A., as administrative agent, Bank of America, National Association and Wells Fargo Bank, N.A., as syndication agents, and Comerica Bank, as documentation agent, and the lenders party thereto (incorporated by reference to Exhibit 10.1 to the Company’s Form 8-K filed on January 10, 2007 (SEC File No. 001-13455)).
10.9+*** Summary Description of the Compensation of Non-Employee Directors of TETRA Technologies, Inc.
10.10+*** Summary Description of Named Executive Officer Compensation.
10.11*** TETRA Technologies, Inc. Nonqualified Deferred Compensation Plan (incorporated by reference to Exhibit 10.9 to the Company’s Form 10-Q filed on August 13, 2002 (SEC File No. 001-13455)).
10.12*** TETRA Technologies, Inc. Nonqualified Deferred Compensation Plan and The Executive Excess Plan Adoption Agreement effective on June 30, 2005 (incorporated by reference to Exhibit 10.2 to the Company’s Form 10-Q/A filed on March 16, 2006 (SEC File No. 001-13455)).
10.13*** TETRA Technologies, Inc. 2007 Equity Incentive Compensation Plan (incorporated by reference to Exhibit 4.12 to the Company’s Registration Statement on Form S-8 filed on May 4, 2007 (SEC File No. 333-142637)).
10.14*** Forms of Employee Incentive Stock Option Agreement, Employee Nonqualified Stock Option Agreement, and Employee Restricted Stock Agreement under the TETRA Technologies, Inc. 2007 Equity Incentive Compensation Plan (incorporated by reference to Exhibits 4.13, 4.14, and 4.15 to the Company’s Registration Statement on Form S-8 filed on May 4, 2007 (SEC File No. 333-142637)).
10.15*** TETRA Technologies, Inc. 401(k) Retirement Plan, as amended and restated (incorporated by reference to Exhibit 99.1 to the Company’s Registration Statement on Form S-8 filed on February 22, 2008 (SEC File No. 333-149348)).
10.16*** TETRA Technologies, Inc. Amended and Restated 2007 Equity Incentive Compensation Plan (incorporated by reference to Exhibit 4.12 to the Company’s Registration Statement on Form S-8 filed on May 9, 2008 (SEC File No. 333-150783)).
10.17*** Forms of Employee Incentive Stock Option Agreement, Employee Nonqualified Stock Option Agreement, Employee Restricted Stock Agreement, and Non-Employee Director Restricted Stock Agreement under the TETRA Technologies, Inc. Amended and Restated 2007 Equity Incentive Compensation Plan (incorporated by reference to Exhibits 4.13, 4.14, 4.15 and 4.16 to the Company’s Registration Statement on Form S-8 filed on May 9, 2008 (SEC File No. 333-150783)).
10.18 Form of Senior Indenture (including form of senior debt security) (incorporated by reference to Exhibit 4.21 to the Company’s Registration Statement on Form S-3 filed on November 30, 2009 (SEC File No. 333-163409)).
70
10.19 Form of Subordinated Indenture (including form of subordinated debt security) (incorporated by reference to Exhibit 4.22 to the Company’s Registration Statement on Form S-3 filed on November 30, 2009 (SEC File No. 333-163409)).
10.20*** TETRA Technologies, Inc. Cash Incentive Compensation Plan (incorporated by reference to Exhibit 4.1 to the Company’s Form 10-Q filed on May 10, 2010 (SEC File No. 001-13455)).
10.21*** TETRA Technologies, Inc. 2007 Long Term Incentive Compensation Plan (incorporated by reference to Exhibit 4.11 to the Company’s Registration Statement on Form S-8 filed on May 5, 2010 (SEC File No. 333-166537)).
10.22*** Forms of Employee Incentive Stock Option Agreement, Employee Nonqualified Stock Option Agreement, Employee Restricted Stock Agreement, Non-Employee Consultant Nonqualified Stock Option Agreement, Non-Employee Consultant Restricted Stock Agreement, and Non-Employee Director Restricted Stock Agreement under the TETRA Technologies, Inc. 2007 Long Term Incentive Compensation Plan (incorporated by reference to Exhibits 4.12, 4.13, 4.14, 4.15, 4.16 and 4.17 to the Company’s Registration Statement on Form S-8 filed on May 5, 2010 (SEC File No. 333-166537)).
10.23 Agreement and Second Amendment to Credit Agreement dated as of October 29, 2010, among TETRA Technologies, Inc. and certain of its subsidiaries, as borrowers, JPMorgan Chase Bank, N.A., as administrative agent, Bank of America, National Association and Wells Fargo Bank, N.A. as syndication agents, and Comerica Bank, as documentation agent, and the lenders party thereto (incorporated by reference to Exhibit 10.1 to the Company’s Form 8-K filed on November 3, 2010 (SEC File No. 001-13455)).
10.24 Contribution, Conveyance and Assumption Agreement, dated June 20, 2011, by and among Compressco, Inc., Compressco Field Services, Inc., Compressco Canada, Inc., Compressco de Mexico, S. de R.L. de C.V., Compressco Partners GP Inc., Compressco Partners, L.P., Compressco Partners Operating, LLC, Compressco Netherlands B.V., Compressco Holdings, LLC, Compressco Netherlands Cooperatief U.A., Compressco Partners Sub, Inc., TETRA International Incorporated, Production Enhancement Mexico, S. de R.L. de C.V. and TETRA Technologies, Inc. (incorporated by reference to Exhibit 10.1 to the Company’s Form 8-K filed on June 30, 2011 (SEC File No. 001-13455)).
10.25 Omnibus Agreement dated June 20, 2011, by and among Compressco Partners, L.P., TETRA Technologies, Inc. and Compressco Partners GP Inc. (incorporated by reference to Exhibit 10.2 to the Company’s Form 8-K filed on June 30, 2011 (SEC File No. 001-13455)).
10.26 Purchase and Sale Agreement, dated April 1, 2011, by and between Maritech Resources, Inc. as Seller and Tana Exploration Company LLC as Buyer (incorporated by reference to Exhibit 10.3 to the Company’s Form 10-Q filed on August 9, 2011 (SEC File No. 001-13455)).
10.27*** TETRA Technologies, Inc. 2011 Long-Term Incentive Compensation Plan (incorporated by reference to Exhibit 4.11 to the Company’s Registration Statement on Form S-8 filed on May 10, 2011 (SEC File No. 333-174090)).
10.28*** Forms of Employee Incentive Stock Option Agreement, Employee Nonqualified Stock Option Agreement, Employee Restricted Stock Agreement, Non-Employee Consultant Nonqualified Stock Option Agreement, Non-Employee Consultant Restricted Stock Agreement and Non-Employee Director Restricted Stock Agreement under the TETRA Technologies, Inc. 2011 Long Term Incentive Compensation Plan (incorporated by reference to Exhibits 4.12, 4.13, 4.14, 4.15, 4.16 and 4.17 to the Company’s Registration Statement on Form S-8 filed on May 10, 2011 (SEC File No. 333-174090)).
10.29*** Employee Restricted Stock Agreement between TETRA Technologies, Inc. and Peter J. Pintar dated November 15, 2011 (incorporated by reference to Exhibit 4.11 to the Company’s Registration Statement on Form S-8 filed on November 15, 2011 (SEC File No. 333-177995)).
10.30*** Separation and Release Agreement dated July 31, 2012 by and between TETRA Technologies, Inc. and Joseph M. Abell (incorporated by reference to Exhibit 10.1 to the Company’s Form 8-K filed on August 1, 2012 (SEC File No. 001-13455)).
10.31*** Employee Equity Award Agreement dated August 15, 2012 by and between TETRA Technologies, Inc. and Elijio V. Serrano (incorporated by reference to Exhibit 10.1 to the Company’s Form 8-K filed on August 16, 2012 (SEC File No. 001-13455)).
10.32+ Purchase and Sale Agreement dated December 31, 2012 by and between TETRA Technologies, Inc. and Tetris Property LP.
10.33+ Lease Agreement dated December 31, 2012 by and between Tetris Property LP and TETRA Technologies, Inc.
10.34*** TETRA Technologies, Inc. 2011 Amended and Restated Long Term Incentive Compensation Plan (incorporated by reference to Exhibit 4.9 to the Company’s Registration Statement on Form S-8 filed on May 9, 2013 (SEC File No. 333-188494)).
71
10.35*** Forms of Employee Incentive Stock Option Agreement, Employee Nonqualified Stock Option Agreement, Employee Restricted Stock Agreement, Non-Employee Director Restricted Stock Agreement, Non-Employee Nonqualified Stock Option Agreement and Non-Employee Restricted Stock Agreement under the TETRA Technologies, Inc. 2011 Amended and Restated Long Term Incentive Compensation Plan (incorporated by reference to Exhibits 4.10, 4.11, 4.12, 4.13, 4.14 and 4.15, respectively to the Company’s Registration Statement on Form S-8 filed on May 9, 2013 (SEC File No. 333-188494)).
10.36*** Form of Change in Control Agreement (incorporated by reference to Exhibit 10.1 to the Company’s Form 8-K filed on June 4, 2013 (SEC File No. 001-13455)).
10.37 Credit Agreement, dated October 15, 2013, by and among Compressco Partners, L.P., Compressco Partners Operating, LLC, Compressco Partners Sub, Inc., Compressco Holdings, LLC, Compressco Leasing, LLC, Compressco Field Services International, LLC, and Compressco International, LLC, as the borrowers, JP Morgan Chase Bank, N.A., as Administrative Agent, and JPMorgan Chase Bank, N.A., Bank of America, N.A., and PNC Bank, National Association, as lenders (incorporated by reference to Exhibit 10.1 to Compressco Partners, L.P.’s Current Report on Form 8-K filed on October 18, 2013 (SEC File No. 001-35195)).
10.38*** Employee Restricted Stock Award Agreement dated June 16, 2014 by and between TETRA Technologies, Inc. and Joseph Elkhoury (incorporated by reference to Exhibit 10.1 to the Company's Form 8-K filed on June 16, 2014 (SEC File No. 001-13455)).
10.39 First Amendment to Omnibus Agreement, dated June 20, 2014, by and among TETRA Technologies, Inc., Compressco Partners, L.P., and Compressco Partners GP Inc. (incorporated by reference to Exhibit 10.1 to the Company's Form 8-K filed on June 26, 2014 (SEC File No. 001-13455)).
10.40 Stock Purchase Agreement, dated as of July 20, 2014, by and between Warren Equipment Company and Compressco Partners Sub, Inc. (incorporated by reference to Exhibit 2.1 to the Company's Form 8-K filed on July 21, 2014 (SEC File No. 001-13455)).
10.41 Indenture, dated as of August 4, 2014, by and among Compressco Partners, L.P., Compressco Finance Inc., the Guarantors party thereto and U.S. Bank National Association, as Trustee (incorporated by reference to Exhibit 4.1 to the Company's Form 8-K filed on August 5, 2014 (SEC File No. 001-13455)).
10.42 Registration Rights Agreement, dated as of August 4, 2014, by and among Compressco Partners, L.P., Compressco Finance Inc., the Guarantors party thereto and Merrill Lynch, Pierce, Fenner & Smith Incorporated, as representative of the Initial Purchasers named therein (incorporated by reference to Exhibit 4.2 to the Company's Form 8-K filed on August 5, 2014 (SEC File No. 001-13455)).
10.43 Guaranty, dated July 20, 2014, by Compressco Partners, L.P. in favor of Warren Equipment Company (incorporated by reference to Exhibit 10.1 to the Company's Form 8-K filed on July 21, 2014 (SEC File No. 001-13455)).
10.44 Contribution and Unit Purchase Agreement, dated as of July 20, 2014, by and among Compressco Partners, L.P., Compresso Partners GP, Inc. and TETRA Technologies, Inc. (incorporated by reference to Exhibit 10.2 to the Company's Form 8-K filed on July 21, 2014 (SEC File No. 001-13455)).
10.45 Purchase Agreement, dated as of July 29, 2014, by and among Compressco Partners, L.P., Compressco Finance Inc., the Guarantors party thereto and Merrill Lynch, Pierce, Fenner & Smith Incorporated as representative of the Initial Purchasers named therein (incorporated by reference to Exhibit 10.1 to the Company's Form 8-K filed on August 5, 2014 (SEC File No. 001-13455)).
10.46 Purchase Agreement Joinder, dated as of August 4, 2014, by and among the Guarantors party thereto and Merrill Lynch, Pierce, Fenner & Smith Incorporated, as Representative of the Initial Purchasers named therein (incorporated by reference to Exhibit 10.2 to the Company's Form 8-K filed on August 5, 2014 (SEC File No. 001-13455)).
10.47 Credit Agreement, dated as of August 4, 2014, by and among Compressco Partners, L.P., Compressco Partners Sub, Inc., the lenders from time to time party thereto, Bank of America, N.A., in its capacity as administrative agent for the lenders and collateral agent, and the other parties thereto (incorporated by reference to Exhibit 10.3 to the Company's Form 8-K filed on August 5, 2014 (SEC File No. 001-13455)).
10.48 Agreement and Third Amendment to Credit Agreement dated as of September 30, 2014, among TETRA Technologies, Inc. and certain of its subsidiaries as borrowers, JPMorgan Chase Bank, N.A., as administrative agent, Bank of America, National Association, as syndication agent, Comerica Bank, as documentation agent, and the lender parties thereto (incorporated by reference to Exhibit 10.1 to the Company's Form 8-K filed on October 6, 2014 (SEC File No. 001-13455)).
21+ Subsidiaries of the Company. 23.1+ Consent of Ernst & Young, LLP. 31.1+ Certification Pursuant to Rule 13(a)-14(a) or 15(d)-14(a) of the Exchange Act, As Adopted Pursuant to Section
302 of the Sarbanes-Oxley Act of 2002.
31.2+ Certification Pursuant to Rule 13(a)-14(a) or 15(d)-14(a) of the Exchange Act, As Adopted Pursuant to Section 302 of the Sarbanes-Oxley Act of 2002.
32.1** Certification Furnished Pursuant to 18 U.S.C. Section 1350, As Adopted Pursuant to Section 906 of the Sarbanes-Oxley Act of 2002 (Chief Executive Officer).
72
32.2** Certification Furnished Pursuant to 18 U.S.C. Section 1350, As Adopted Pursuant to Section 906 of the Sarbanes-Oxley Act of 2002 (Chief Financial Officer).
101.INS++ XBRL Instance Document.
101.SCH++ XBRL Taxonomy Extension Schema Document.
101.CAL++ XBRL Taxonomy Extension Calculation Linkbase Document.
101.LAB++ XBRL Taxonomy Extension Label Linkbase Document.
101.PRE++ XBRL Taxonomy Extension Presentation Linkbase Document.
101.DEF++ XBRL Taxonomy Extension Definition Linkbase Document. + Filed with this report ** Furnished with this report. *** Management contract or compensatory plan or arrangement. ++ Attached as Exhibit 101 to this report are the following documents formatted in XBRL (Extensible Business Reporting Language): (i)
Consolidated Statements of Operations for the years ended December 31, 2014, 2013 and 2012; (ii) Consolidated Balance Sheets as of December 31, 2014 and December 31, 2013; (iii) Consolidated Statements of Comprehensive Income for the years ended December 31, 2014, 2013 and 2012; (iv) Consolidated Statements of Cash Flows for the years ended December 31, 2014, 2013 and 2012; (v) Consolidated Statements of Stockholders’ Equity for the years ended December 31, 2014, 2013 and 2012; and (vi) Notes to Consolidated Financial Statements for the year ended December 31, 2014.

73
SIGNATURES Pursuant to the requirements of Section 13 or 15(d) of the Securities Exchange Act of 1934, TETRA
Technologies, Inc. has duly caused this report to be signed on its behalf by the undersigned, thereunto duly authorized.
TETRA Technologies, Inc.
Date: March 2, 2015 By: /s/Stuart M. Brightman
Stuart M. Brightman, President & CEO Pursuant to the requirements of the Securities Exchange Act of 1934, this report has been signed below by the following persons on behalf of the Registrant and in the capacities and on the dates indicated:
Signature Title Date
/s/Ralph S. Cunningham Chairman of March 2, 2015Ralph S. Cunningham the Board of Directors
/s/Stuart M. Brightman President, Chief Executive March 2, 2015Stuart M. Brightman Officer and Director (Principal Executive Officer) /s/Elijio V. Serrano Senior Vice President and March 2, 2015Elijio V. Serrano Chief Financial Officer (Principal Financial Officer) /s/Ben C. Chambers Vice President – Accounting March 2, 2015Ben C. Chambers and Controller (Principal Accounting Officer) /s/Mark E. Baldwin Director March 2, 2015Mark E. Baldwin
/s/Thomas R. Bates, Jr. Director March 2, 2015Thomas R. Bates, Jr. /s/Paul D. Coombs Director March 2, 2015Paul D. Coombs
/s/John F. Glick Director March 2, 2015John F. Glick /s/Kenneth P. Mitchell Director March 2, 2015Kenneth P. Mitchell /s/William D. Sullivan Director March 2, 2015William D. Sullivan /s/Kenneth E. White, Jr. Director March 2, 2015Kenneth E. White, Jr.
Exhibit 31.1 Certification Pursuant to
Rule 13a-14(a) or 15d-14(a) of the Exchange Act As Adopted Pursuant to
Section 302 of the Sarbanes-Oxley Act of 2002 I, Stuart M. Brightman, certify that:
1. I have reviewed this annual report on Form 10-K for the fiscal year ended December 31, 2014, of TETRA Technologies, Inc.;
2. Based on my knowledge, this report does not contain any untrue statement of a material fact or omit to
state a material fact necessary to make the statements made, in light of the circumstances under which such statements were made, not misleading with respect to the period covered by this report;
3. Based on my knowledge, the financial statements, and other financial information included in this report,
fairly present in all material respects the financial condition, results of operations and cash flows of the registrant as of, and for, the periods presented in this report;
4. The registrant’s other certifying officer and I are responsible for establishing and maintaining disclosure
controls and procedures (as defined in Exchange Act Rules 13a–15(e) and 15d–15(e)) and internal control over financial reporting (as defined in Exchange Act Rules 13a–15(f) and 15d–15(f)) for the registrant and have:
a) designed such disclosure controls and procedures, or caused such disclosure controls and procedures to
be designed under our supervision, to ensure that material information relating to the registrant, including its consolidated subsidiaries, is made known to us by others within those entities, particularly during the period in which this report is being prepared;
b) designed such internal control over financial reporting, or caused such internal control over financial reporting to be designed under our supervision, to provide reasonable assurance regarding the reliability of financial reporting and the preparation of financial statements for external purposes in accordance with generally accepted accounting principles;
c) evaluated the effectiveness of the registrant’s disclosure controls and procedures and presented in this report our conclusions about the effectiveness of the disclosure controls and procedures, as of the end of the period covered by this report based on such evaluation; and
d) disclosed in this report any change in the registrant’s internal control over financial reporting that occurred during the registrant’s most recent fiscal quarter (the registrant’s fourth fiscal quarter in the case of an annual report) that has materially affected, or is reasonably likely to materially affect, the registrant’s internal control over financial reporting; and
5. The registrant’s other certifying officer and I have disclosed, based on our most recent evaluation of internal
control over financial reporting, to the registrant’s auditors and the audit committee of the registrant’s board of directors (or persons performing the equivalent functions):
a) all significant deficiencies and material weaknesses in the design or operation of internal control over financial reporting which are reasonably likely to adversely affect the registrant’s ability to record, process, summarize and report financial information; and
b) any fraud, whether or not material, that involves management or other employees who have a significant role in the registrant’s internal control over financial reporting.
Date: March 2, 2015 /s/Stuart M. Brightman
Stuart M. Brightman
President and Chief Executive Officer
Exhibit 31.2 Certification Pursuant to
Rule 13a-14(a) or 15d-14(a) of the Exchange Act As Adopted Pursuant to
Section 302 of the Sarbanes-Oxley Act of 2002 I, Elijio V. Serrano, certify that:
1. I have reviewed this annual report on Form 10-K for the fiscal year ended December 31, 2014, of TETRA Technologies, Inc.;
2. Based on my knowledge, this report does not contain any untrue statement of a material fact or omit to
state a material fact necessary to make the statements made, in light of the circumstances under which such statements were made, not misleading with respect to the period covered by this report;
3. Based on my knowledge, the financial statements, and other financial information included in this report,
fairly present in all material respects the financial condition, results of operations and cash flows of the registrant as of, and for, the periods presented in this report;
4. The registrant’s other certifying officer and I are responsible for establishing and maintaining disclosure
controls and procedures (as defined in Exchange Act Rules 13a–15(e) and 15d–15(e)) and internal control over financial reporting (as defined in Exchange Act Rules 13a–15(f) and 15d–15(f)) for the registrant and have:
a) designed such disclosure controls and procedures, or caused such disclosure controls and procedures to be designed under our supervision, to ensure that material information relating to the registrant, including its consolidated subsidiaries, is made known to us by others within those entities, particularly during the period in which this report is being prepared;
b) designed such internal control over financial reporting, or caused such internal control over financial reporting to be designed under our supervision, to provide reasonable assurance regarding the reliability of financial reporting and the preparation of financial statements for external purposes in accordance with generally accepted accounting principles;
c) evaluated the effectiveness of the registrant’s disclosure controls and procedures and presented in this report our conclusions about the effectiveness of the disclosure controls and procedures, as of the end of the period covered by this report based on such evaluation; and
d) disclosed in this report any change in the registrant’s internal control over financial reporting that occurred during the registrant’s most recent fiscal quarter (the registrant’s fourth fiscal quarter in the case of an annual report) that has materially affected, or is reasonably likely to materially affect, the registrant’s internal control over financial reporting; and
5. The registrant’s other certifying officer and I have disclosed, based on our most recent evaluation of internal
control over financial reporting, to the registrant’s auditors and the audit committee of the registrant’s board of directors (or persons performing the equivalent functions):
a) all significant deficiencies and material weaknesses in the design or operation of internal control over financial reporting which are reasonably likely to adversely affect the registrant’s ability to record, process, summarize and report financial information; and
b) any fraud, whether or not material, that involves management or other employees who have a significant role in the registrant’s internal control over financial reporting.
Date: March 2, 2015 /s/Elijio V. Serrano
Elijio V. Serrano
Senior Vice President and Chief Financial Officer
Exhibit 32.1
Certification Pursuant to 18 U.S.C. Section 1350
As Adopted Pursuant to Section 906 of the Sarbanes-Oxley Act of 2002
In connection with the Annual Report of TETRA Technologies, Inc. (the “Company”) on Form 10-K for the
year ending December 31, 2014 as filed with the Securities and Exchange Commission on the date hereof (the “Report”), I, Stuart M. Brightman, President and Chief Executive Officer of the Company, certify, pursuant to 18 U.S.C. Section 1350, as adopted pursuant to Section 906 of the Sarbanes-Oxley Act of 2002, that: (1) The Report fully complies with the requirements of Section 13(a) or 15(d) of the Securities Exchange Act of 1934; and (2) The information contained in the Report fairly presents, in all material respects, the financial condition and results of operations of the Company.
Dated: March 2, 2015 /s/Stuart M. Brightman
Stuart M. Brightman
President and Chief Executive Officer
TETRA Technologies, Inc.
A signed original of this written statement required by Section 906 has been provided to the Company and will be retained by the Company and furnished to the Securities and Exchange Commission or its staff upon request.
Exhibit 32.2
Certification Pursuant to 18 U.S.C. Section 1350
As Adopted Pursuant to Section 906 of the Sarbanes-Oxley Act of 2002
In connection with the Annual Report of TETRA Technologies, Inc. (the “Company”) on Form 10-K for the
year ending December 31, 2014 as filed with the Securities and Exchange Commission on the date hereof (the “Report”), I, Elijio V. Serrano, Senior Vice President and Chief Financial Officer of the Company, certify, pursuant to 18 U.S.C. Section 1350, as adopted pursuant to Section 906 of the Sarbanes-Oxley Act of 2002, that:
(1) The Report fully complies with the requirements of Section 13(a) or 15(d) of the Securities Exchange Act
of 1934; and (2) The information contained in the Report fairly presents, in all material respects, the financial condition
and results of operations of the Company.
Dated: March 2, 2015 /s/Elijio V. Serrano
Elijio V. Serrano
Senior Vice President and Chief Financial Officer
TETRA Technologies, Inc.
A signed original of this written statement required by Section 906 has been provided to the Company and will be retained by the Company and furnished to the Securities and Exchange Commission or its staff upon request.
F-1
REPORT OF INDEPENDENT REGISTERED PUBLIC ACCOUNTING FIRM
Board of Directors and Stockholders of TETRA Technologies, Inc. We have audited the accompanying consolidated balance sheets of TETRA Technologies, Inc. and subsidiaries as of December 31, 2014 and 2013, and the related consolidated statements of operations, comprehensive income (loss), equity, and cash flows for each of the three years in the period ended December 31, 2014. Our audits also included the financial statement schedule listed in the Index at Item 15(a). These financial statements and schedule are the responsibility of the Company's management. Our responsibility is to express an opinion on these financial statements and schedule based on our audits. We conducted our audits in accordance with the standards of the Public Company Accounting Oversight Board (United States). Those standards require that we plan and perform the audit to obtain reasonable assurance about whether the financial statements are free of material misstatement. An audit includes examining, on a test basis, evidence supporting the amounts and disclosures in the financial statements. An audit also includes assessing the accounting principles used and significant estimates made by management, as well as evaluating the overall financial statement presentation. We believe that our audits provide a reasonable basis for our opinion. In our opinion, the financial statements referred to above present fairly, in all material respects, the consolidated financial position of TETRA Technologies, Inc. and subsidiaries at December 31, 2014 and 2013, and the consolidated results of their operations and their cash flows for each of the three years in the period ended December 31, 2014, in conformity with U.S. generally accepted accounting principles. Also, in our opinion, the related financial statement schedule, when considered in relation to the basic financial statements taken as a whole, presents fairly in all material respects the information set forth therein. We also have audited, in accordance with the standards of the Public Company Accounting Oversight Board (United States), TETRA Technologies, Inc.’s internal control over financial reporting as of December 31, 2014, based on criteria established in Internal Control-Integrated Framework issued by the Committee of Sponsoring Organizations of the Treadway Commission (2013 framework) and our report dated March 2, 2015 expressed an unqualified opinion thereon.
/s/ERNST & YOUNG LLP Houston, Texas March 2, 2015
F-2
REPORT OF INDEPENDENT REGISTERED PUBLIC ACCOUNTING FIRM
Board of Directors and Stockholders of TETRA Technologies, Inc. We have audited TETRA Technologies, Inc. and subsidiaries’ internal control over financial reporting as of December 31, 2014, based on criteria established in Internal Control-Integrated Framework issued by the Committee of Sponsoring Organizations of the Treadway Commission (2013 framework) (the COSO criteria). TETRA Technologies, Inc. and subsidiaries’ management is responsible for maintaining effective internal control over financial reporting, and for its assessment of the effectiveness of internal control over financial reporting included in the accompanying Management’s Report on Internal Control over Financial Reporting. Our responsibility is to express an opinion on the company’s internal control over financial reporting based on our audit. We conducted our audit in accordance with the standards of the Public Company Accounting Oversight Board (United States). Those standards require that we plan and perform the audit to obtain reasonable assurance about whether effective internal control over financial reporting was maintained in all material respects. Our audit included obtaining an understanding of internal control over financial reporting, assessing the risk that a material weakness exists, testing and evaluating the design and operating effectiveness of internal control based on the assessed risk, and performing such other procedures as we considered necessary in the circumstances. We believe that our audit provides a reasonable basis for our opinion. A company’s internal control over financial reporting is a process designed to provide reasonable assurance regarding the reliability of financial reporting and the preparation of financial statements for external purposes in accordance with generally accepted accounting principles. A company’s internal control over financial reporting includes those policies and procedures that (1) pertain to the maintenance of records that, in reasonable detail, accurately and fairly reflect the transactions and dispositions of the assets of the company; (2) provide reasonable assurance that transactions are recorded as necessary to permit preparation of financial statements in accordance with generally accepted accounting principles, and that receipts and expenditures of the company are being made only in accordance with authorizations of management and directors of the company; and (3) provide reasonable assurance regarding prevention or timely detection of unauthorized acquisition, use, or disposition of the company’s assets that could have a material effect on the financial statements. Because of its inherent limitations, internal control over financial reporting may not prevent or detect misstatements. Also, projections of any evaluation of effectiveness to future periods are subject to the risk that controls may become inadequate because of changes in conditions, or that the degree of compliance with the policies or procedures may deteriorate. As indicated in the accompanying Management’s Report on Internal Control over Financial Reporting, management’s assessment of and conclusion on the effectiveness of internal control over financial reporting did not include the internal controls of Compressor Systems, Inc. (CSI) which is included in the 2014 consolidated financial statements of TETRA Technologies, Inc. and subsidiaries and constituted 46.5% and 62.7% of total and net assets, respectively, as of December 31, 2014 and 14.2% of revenues for the year then ended. Our audit of internal control over financial reporting of TETRA Technologies, Inc. and subsidiaries also did not include an evaluation of the internal control over financial reporting of Compressor Systems, Inc. In our opinion, TETRA Technologies, Inc. and subsidiaries maintained, in all material respects, effective internal control over financial reporting as of December 31, 2014, based on the COSO criteria. We also have audited, in accordance with the standards of the Public Company Accounting Oversight Board (United States), the consolidated balance sheets of TETRA Technologies, Inc. and subsidiaries as of December 31, 2014 and 2013, and the related consolidated statements of operations, comprehensive income (loss), equity, and cash flows for each of the three years in the period ended December 31, 2014 and our report dated March 2, 2015 expressed an unqualified opinion thereon.
/s/ERNST & YOUNG LLP Houston, Texas March 2, 2015
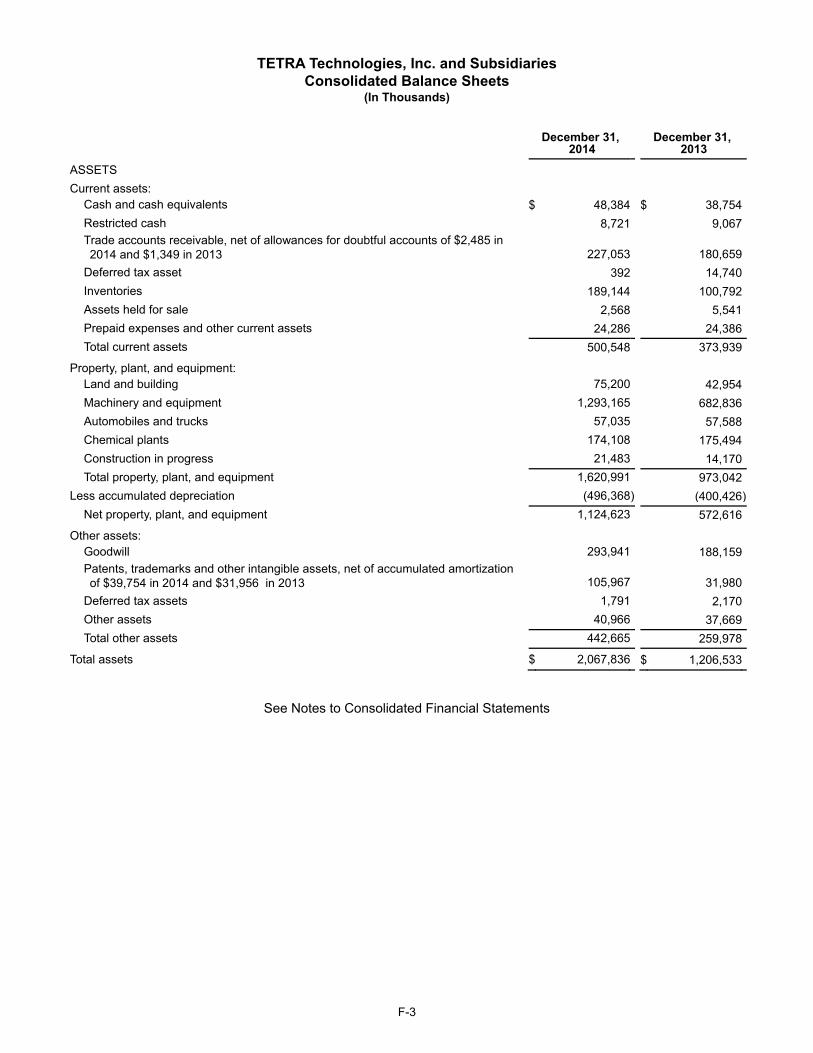
F-3
TETRA Technologies, Inc. and Subsidiaries Consolidated Balance Sheets
(In Thousands)
December 31,
2014 December 31,
2013ASSETS Current assets:
Cash and cash equivalents $ 48,384 $ 38,754Restricted cash 8,721 9,067Trade accounts receivable, net of allowances for doubtful accounts of $2,485 in 2014 and $1,349 in 2013 227,053
180,659
Deferred tax asset 392 14,740Inventories 189,144 100,792Assets held for sale 2,568 5,541Prepaid expenses and other current assets 24,286 24,386Total current assets 500,548 373,939
Property, plant, and equipment: Land and building 75,200 42,954Machinery and equipment 1,293,165 682,836Automobiles and trucks 57,035 57,588Chemical plants 174,108 175,494Construction in progress 21,483 14,170Total property, plant, and equipment 1,620,991 973,042
Less accumulated depreciation (496,368) (400,426)Net property, plant, and equipment 1,124,623 572,616
Other assets: Goodwill 293,941 188,159Patents, trademarks and other intangible assets, net of accumulated amortization of $39,754 in 2014 and $31,956 in 2013 105,967
31,980
Deferred tax assets 1,791 2,170Other assets 40,966 37,669Total other assets 442,665 259,978
Total assets $ 2,067,836 $ 1,206,533
See Notes to Consolidated Financial Statements
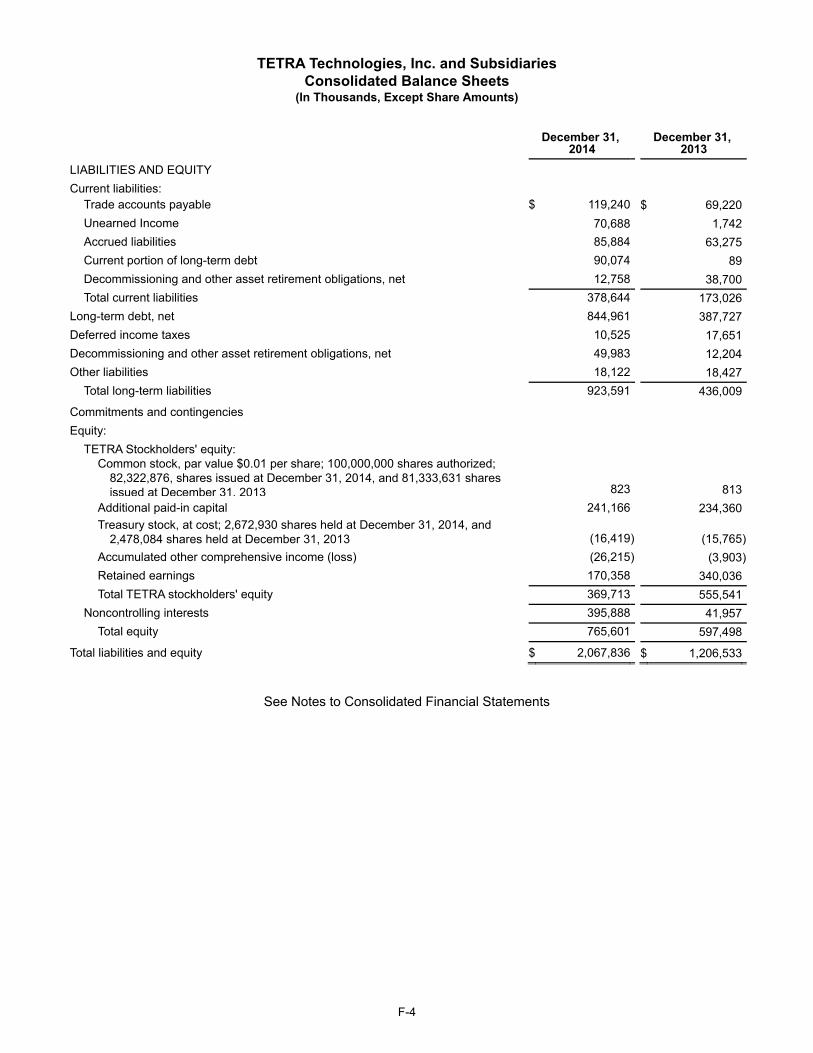
F-4
TETRA Technologies, Inc. and Subsidiaries Consolidated Balance Sheets
(In Thousands, Except Share Amounts)
December 31,
2014 December 31,
2013LIABILITIES AND EQUITY Current liabilities:
Trade accounts payable $ 119,240 $ 69,220Unearned Income 70,688 1,742Accrued liabilities 85,884 63,275Current portion of long-term debt 90,074 89Decommissioning and other asset retirement obligations, net 12,758 38,700Total current liabilities 378,644 173,026
Long-term debt, net 844,961 387,727Deferred income taxes 10,525 17,651Decommissioning and other asset retirement obligations, net 49,983 12,204Other liabilities 18,122 18,427
Total long-term liabilities 923,591 436,009
Commitments and contingencies Equity:
TETRA Stockholders' equity: Common stock, par value $0.01 per share; 100,000,000 shares authorized;
82,322,876, shares issued at December 31, 2014, and 81,333,631 shares issued at December 31, 2013 823
813Additional paid-in capital 241,166 234,360Treasury stock, at cost; 2,672,930 shares held at December 31, 2014, and
2,478,084 shares held at December 31, 2013 (16,419) (15,765)Accumulated other comprehensive income (loss) (26,215) (3,903)Retained earnings 170,358 340,036Total TETRA stockholders' equity 369,713 555,541
Noncontrolling interests 395,888 41,957Total equity 765,601 597,498
Total liabilities and equity $ 2,067,836 $ 1,206,533
See Notes to Consolidated Financial Statements
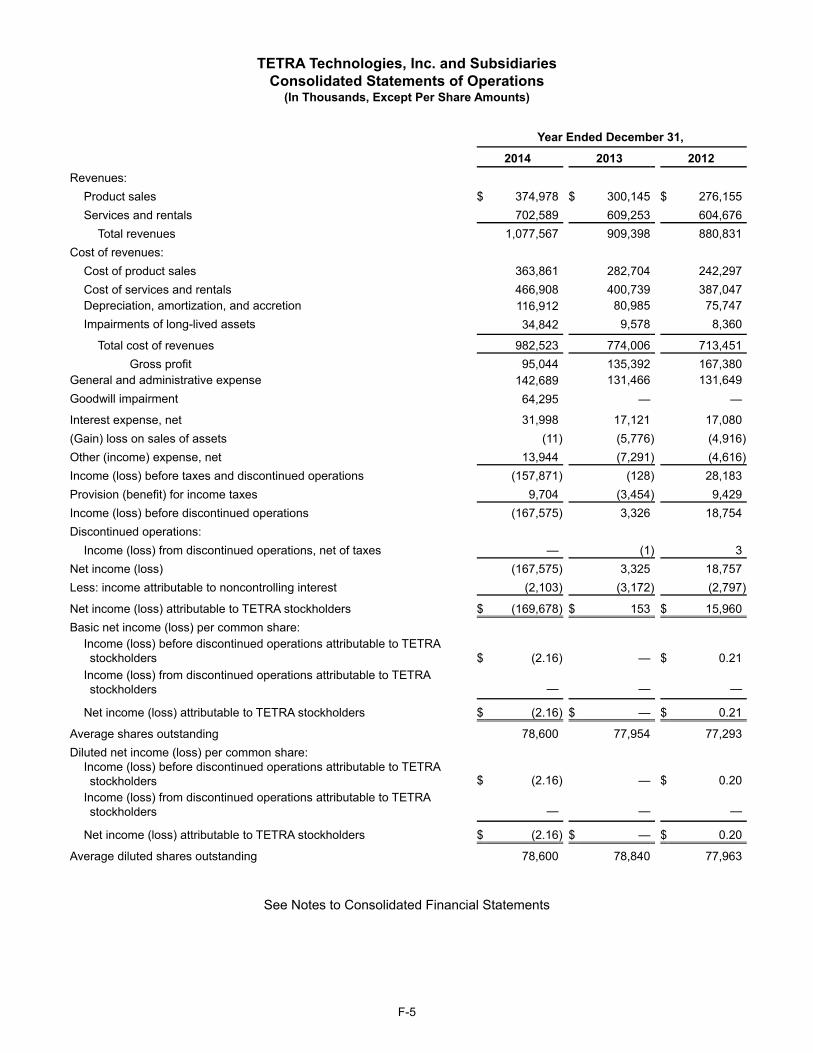
F-5
TETRA Technologies, Inc. and Subsidiaries Consolidated Statements of Operations
(In Thousands, Except Per Share Amounts)
Year Ended December 31, 2014 2013 2012Revenues:
Product sales $ 374,978 $ 300,145 $ 276,155Services and rentals 702,589 609,253 604,676
Total revenues 1,077,567 909,398 880,831Cost of revenues:
Cost of product sales 363,861 282,704 242,297Cost of services and rentals 466,908 400,739 387,047Depreciation, amortization, and accretion 116,912 80,985 75,747Impairments of long-lived assets 34,842 9,578 8,360
Total cost of revenues 982,523 774,006 713,451Gross profit 95,044 135,392 167,380
General and administrative expense 142,689 131,466 131,649Goodwill impairment 64,295 — —
Interest expense, net 31,998 17,121 17,080(Gain) loss on sales of assets (11) (5,776) (4,916)Other (income) expense, net 13,944 (7,291) (4,616)Income (loss) before taxes and discontinued operations (157,871) (128) 28,183Provision (benefit) for income taxes 9,704 (3,454) 9,429Income (loss) before discontinued operations (167,575) 3,326 18,754Discontinued operations:
Income (loss) from discontinued operations, net of taxes — (1) 3Net income (loss) (167,575) 3,325 18,757Less: income attributable to noncontrolling interest (2,103) (3,172) (2,797)
Net income (loss) attributable to TETRA stockholders $ (169,678) $ 153 $ 15,960Basic net income (loss) per common share:
Income (loss) before discontinued operations attributable to TETRA stockholders $ (2.16) —
$ 0.21
Income (loss) from discontinued operations attributable to TETRA stockholders — —
—
Net income (loss) attributable to TETRA stockholders $ (2.16) $ — $ 0.21
Average shares outstanding 78,600 77,954 77,293Diluted net income (loss) per common share:
Income (loss) before discontinued operations attributable to TETRA stockholders $ (2.16) —
$ 0.20
Income (loss) from discontinued operations attributable to TETRA stockholders — —
—
Net income (loss) attributable to TETRA stockholders $ (2.16) $ — $ 0.20
Average diluted shares outstanding 78,600 78,840 77,963
See Notes to Consolidated Financial Statements
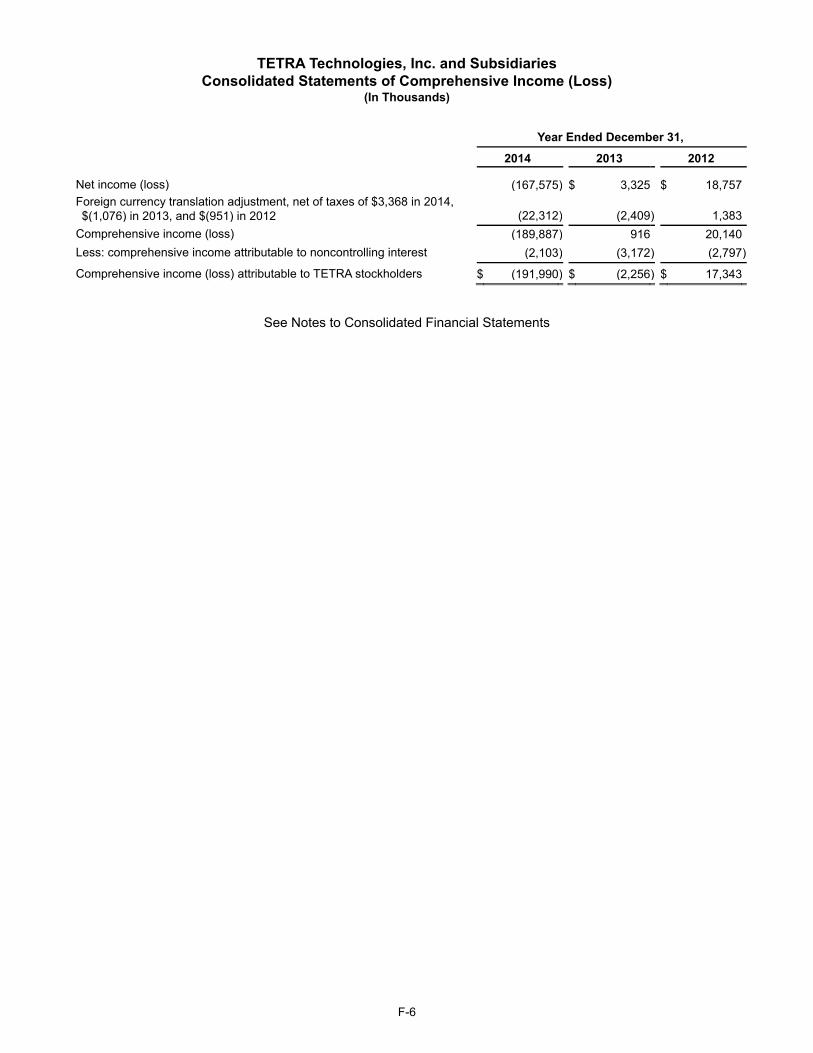
F-6
TETRA Technologies, Inc. and Subsidiaries Consolidated Statements of Comprehensive Income (Loss)
(In Thousands)
Year Ended December 31, 2014 2013 2012
Net income (loss) (167,575) $ 3,325 $ 18,757Foreign currency translation adjustment, net of taxes of $3,368 in 2014, $(1,076) in 2013, and $(951) in 2012 (22,312) (2,409) 1,383
Comprehensive income (loss) (189,887) 916 20,140Less: comprehensive income attributable to noncontrolling interest (2,103) (3,172) (2,797)
Comprehensive income (loss) attributable to TETRA stockholders $ (191,990) $ (2,256) $ 17,343
See Notes to Consolidated Financial Statements

F-7
TETRA Technologies, Inc. and Subsidiaries Consolidated Statements of Equity
(In Thousands)
Common Stock
Par Value
Additional Paid-In Capital
Accumulated Other
Comprehensive Income (L )
Treasury
StockCurrency
TranslationRetained Earnings
Noncontrolling Interest
Total Equity
Balance at December 31, 2011 $ 797 $ 220,144 (14,841) $ (2,877) 323,923 $ 41,942 569,088
Net income for 2012 15,960 2,797 18,757Translation adjustment, net of taxes of $(951)
1,383
1,383
Comprehensive income
20,140
Distributions to public unitholders (4,489) (4,489)
Exercise of common stock options 7 943 (19)
931
Grants of restricted stock, net (167) (167)
Equity compensation expense 7,536 1,905 9,441
Other noncontrolling interests 33 33Tax adjustment related to equity-based compensation, net
(1,669)
(1,669)
Balance at December 31, 2012 $ 804 $ 226,954 $ (15,027) $ (1,494) $ 339,883 $ 42,188 $ 593,308
Net income for 2013 153 3,172 3,325Translation adjustment, net of taxes of $(1,076)
(2,409)
(2,409)
Comprehensive income 916
Distributions to public unitholders (4,846) (4,846)
Exercise of common stock options 9 2,245 (276) 1,978
Grants of restricted stock, net (462) (462)
Equity compensation expense 5,265 1,459 6,724
Other noncontrolling interests (16) (16)Tax adjustment related to equity- based compensation, net
(104)
(104)
Balance at December 31, 2013 $ 813 $ 234,360 $ (15,765) $ (3,903) $ 340,036 $ 41,957 $ 597,498
Net loss for 2014 (169,678) 2,103 (167,575)Translation adjustment, net of taxes of $3,368
(22,312)
(22,312)
Comprehensive loss (189,887)
Distributions to public unitholders (12,569) (12,569)
Exercise of common stock options 10 1,678 (78) 1,610
Grants of restricted stock, net (576) (576)Proceeds from issuance of CCLP common units, net of underwriters' discount
363,149 363,149
Equity compensation expense 5,231 1,544 6,775
Other noncontrolling interests (296) (296)Tax adjustment related to equity- based compensation, net
(103)
(103)
Balance at December 31, 2014 $ 823 $ 241,166 $ (16,419) $ (26,215) $ 170,358 $ 395,888 $ 765,601
See Notes to Consolidated Financial Statements
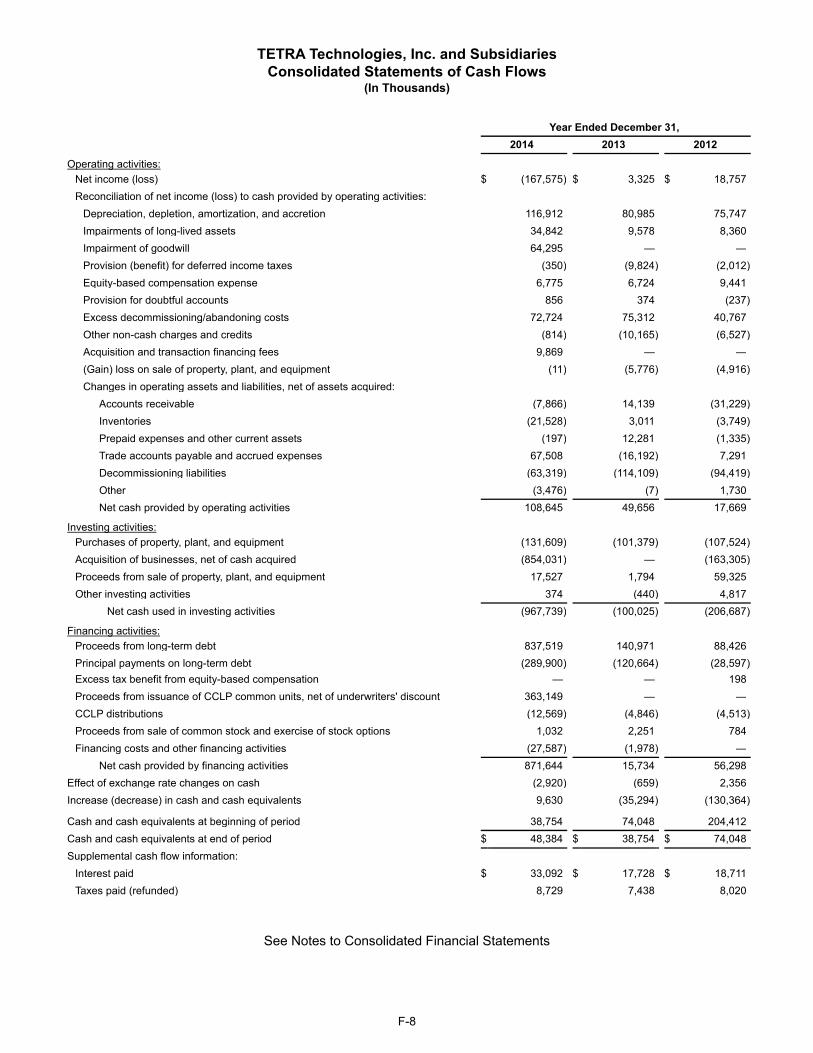
F-8
TETRA Technologies, Inc. and Subsidiaries Consolidated Statements of Cash Flows
(In Thousands)
Year Ended December 31, 2014 2013 2012
Operating activities: Net income (loss) $ (167,575) $ 3,325 $ 18,757Reconciliation of net income (loss) to cash provided by operating activities:
Depreciation, depletion, amortization, and accretion 116,912 80,985 75,747Impairments of long-lived assets 34,842 9,578 8,360Impairment of goodwill 64,295 — —Provision (benefit) for deferred income taxes (350) (9,824) (2,012)Equity-based compensation expense 6,775 6,724 9,441Provision for doubtful accounts 856 374 (237)Excess decommissioning/abandoning costs 72,724 75,312 40,767Other non-cash charges and credits (814) (10,165) (6,527)Acquisition and transaction financing fees 9,869 — —(Gain) loss on sale of property, plant, and equipment (11) (5,776) (4,916)Changes in operating assets and liabilities, net of assets acquired:
Accounts receivable (7,866) 14,139 (31,229)Inventories (21,528) 3,011 (3,749)Prepaid expenses and other current assets (197) 12,281 (1,335)Trade accounts payable and accrued expenses 67,508 (16,192) 7,291Decommissioning liabilities (63,319) (114,109) (94,419)Other (3,476) (7) 1,730Net cash provided by operating activities 108,645 49,656 17,669
Investing activities: Purchases of property, plant, and equipment (131,609) (101,379) (107,524)Acquisition of businesses, net of cash acquired (854,031) — (163,305)Proceeds from sale of property, plant, and equipment 17,527 1,794 59,325Other investing activities 374 (440) 4,817
Net cash used in investing activities (967,739) (100,025) (206,687)
Financing activities: Proceeds from long-term debt 837,519 140,971 88,426Principal payments on long-term debt (289,900) (120,664) (28,597)Excess tax benefit from equity-based compensation — — 198Proceeds from issuance of CCLP common units, net of underwriters' discount 363,149 — —CCLP distributions (12,569) (4,846) (4,513)Proceeds from sale of common stock and exercise of stock options 1,032 2,251 784Financing costs and other financing activities (27,587) (1,978) —
Net cash provided by financing activities 871,644 15,734 56,298Effect of exchange rate changes on cash (2,920) (659) 2,356Increase (decrease) in cash and cash equivalents 9,630 (35,294) (130,364)
Cash and cash equivalents at beginning of period 38,754 74,048 204,412Cash and cash equivalents at end of period $ 48,384 $ 38,754 $ 74,048Supplemental cash flow information:
Interest paid $ 33,092 $ 17,728 $ 18,711Taxes paid (refunded) 8,729 7,438 8,020
See Notes to Consolidated Financial Statements
F-9
TETRA Technologies, Inc. and Subsidiaries Notes to Consolidated Financial Statements
December 31, 2014
NOTE A – ORGANIZATION AND OPERATIONS We are a geographically diversified oil and gas services company, focused on completion fluids and
associated products and services, water management, frac flowback, production well testing, offshore rig cooling, compression services and equipment, and selected offshore services including well plugging and abandonment, decommissioning, and diving. We also have a limited domestic oil and gas production business. We were incorporated in Delaware in 1981 and are composed of five reporting segments organized into four divisions – Fluids, Production Testing, Compression, and Offshore. Unless the context requires otherwise, when we refer to “we,” “us,” and “our,” we are describing TETRA Technologies, Inc. and its consolidated subsidiaries on a consolidated basis.
Our Fluids Division manufactures and markets clear brine fluids, additives, and associated products and
services to the oil and gas industry for use in well drilling, completion, and workover operations in the United States and in certain countries in Latin America, Europe, Asia, the Middle East and Africa. The division also markets liquid and dry calcium chloride products manufactured at its production facilities or purchased from third-party suppliers to a variety of markets outside the energy industry. The Fluids Division also provides North American onshore oil and gas operators with comprehensive water management services.
Our Production Testing Division provides frac flowback, production well testing, offshore rig cooling, and other associated services in many of the major oil and gas producing regions in the United States, Mexico, and Canada, as well as in certain basins in certain regions in South America, Africa, Europe, the Middle East and Australia.
Our Compression Division is a provider of compression services and equipment for natural gas and oil production, gathering, transportation, processing, and storage. The Compression Division also sells standard and custom-designed compressor packages and oilfield fluid pump systems, and provides aftermarket services and compressor package parts and components manufactured by third-party suppliers. The Compression Division provides these compression services and equipment to a broad base of natural gas and oil exploration and production, midstream, transmission, and storage companies operating throughout many of the onshore producing regions of the United States as well as in a number of foreign countries, including Mexico, Canada, and Argentina. As a result of the August 4, 2014, acquisition of Compressor Systems, Inc. ("CSI") (the "CSI Acquisition"), we have significantly expanded the scope of our Compression Division.
Our Offshore Division consists of two operating segments: Offshore Services and Maritech. The Offshore
Services segment provides: (1) downhole and subsea services such as well plugging and abandonment and workover services; (2) decommissioning and certain construction services utilizing heavy lift barges and various cutting technologies with regard to offshore oil and gas production platforms and pipelines; and (3) conventional and saturation diving services.
The Maritech segment is a limited oil and gas production operation. During 2011 and the first quarter of 2012, Maritech sold substantially all of its oil and gas producing property interests. Maritech’s operations consist primarily of the ongoing abandonment and decommissioning associated with its remaining offshore wells and production platforms. Maritech intends to acquire a significant portion of these services from the Offshore Division’s Offshore Services segment.
In late 2014, a significant decrease in oil and natural gas commodity prices has lowered the capital
expenditure and operating plans of many of our customers, creating additional uncertainty regarding the expected demand for our products and services and the resulting cash flows from operating activities for the foreseeable future. In addition, the availability of new borrowings in the current capital markets is becoming more limited and costly. Accordingly, we have implemented strategic cost reduction steps to adjust our cost structure in the current environment. In addition, we are considering certain asset sales and financing transactions with a view of generating additional cash resources to reduce the amount of our outstanding borrowings under our Credit Agreement, and to potentially provide a portion of the funds necessary to repay the $90.0 million principal amount
F-10
repayment of the Series 2008-B Senior Notes, which mature in April 2015. In February 2015, we entered into a commitment letter agreement for the sale of $50.0 million aggregate principal amount of senior secured notes to be issued in April 2015. The proceeds from these notes are expected to provide a portion of the funds necessary to repay the $90.0 million principal amount repayment of the Series 2008-B Senior Notes that mature in April 2015. (See Note G - Long Term Debt and Other Borrowings for further discussion of our debt agreements.) We believe these steps will enhance our liquidity and we further believe, with the current industry environment and activity level, we will have adequate liquidity to fund our operations and debt obligations through December 31, 2015; however, we cannot predict how an extended period of low commodity prices will affect our operations and liquidity levels.
NOTE B – SUMMARY OF SIGNIFICANT ACCOUNTING POLICIES Principles of Consolidation
The consolidated financial statements include the accounts of our wholly owned subsidiaries. We
consolidate the financial statements of CSI Compressco LP ("CCLP", formerly known as Compressco Partners, L.P.) and its subsidiaries as part of our Compression segment. We control CCLP through our ownership of its general partner. The public ownership share of CCLP net assets and earnings is presented as a component of noncontrolling interest in our consolidated financial statements. Our cash flows from our investment in CCLP are limited to the quarterly distributions we receive or the amounts collected for services performed on behalf of CCLP. As our net investment in CCLP's assets exceeds 25.0% of our consolidated net assets, we have provided condensed parent company financial information in a supplemental schedule accompanying these consolidated financial statements.
As a result of CCLP's acquisition of Compressor Systems, Inc. (CSI) on August 4, 2014, our Compression
Division's operations have significantly expanded. Results of operations for 2014 reflect the impact of the CSI acquisition for the portion of the period beginning with the August 4, 2014, closing date of the acquisition. A portion of the acquisition purchase price was funded through the issuance of additional CCLP common units, resulting in the public ownership of CCLP increasing from approximately 17.7% as of December 31, 2013 to 56.3% as of December 31, 2014. See Note C - Acquisitions and Dispositions for further discussion.
Investments in unconsolidated joint ventures in which we participate are accounted for using the equity method. Our interests in oil and gas properties are proportionately consolidated. All significant intercompany accounts and transactions have been eliminated in consolidation. Use of Estimates
The preparation of financial statements in conformity with generally accepted accounting principles requires
management to make estimates and assumptions that affect the reported amounts of assets and liabilities and disclose contingent assets and liabilities at the date of the financial statements and the reported amounts of revenues and expenses during the reporting period. Actual results could differ from those estimates.
Reclassifications
Beginning with the three month period ended September 30, 2013, certain ad valorem tax expenses for
operating equipment of our CCLP segment have been reclassified as cost of revenues instead of being included in general and administrative expense as reported in prior periods. Prior period amounts have been reclassified to conform to the current year period's presentation. The amount of such reclassification is $1.5 million for the year ended December 31, 2012.
Certain other previously reported financial information has been reclassified to conform to the current year's
presentation. The impact of such reclassifications was not significant to the prior year's overall presentation.
Cash Equivalents We consider all highly liquid cash investments, with a maturity of three months or less when purchased, to
be cash equivalents.
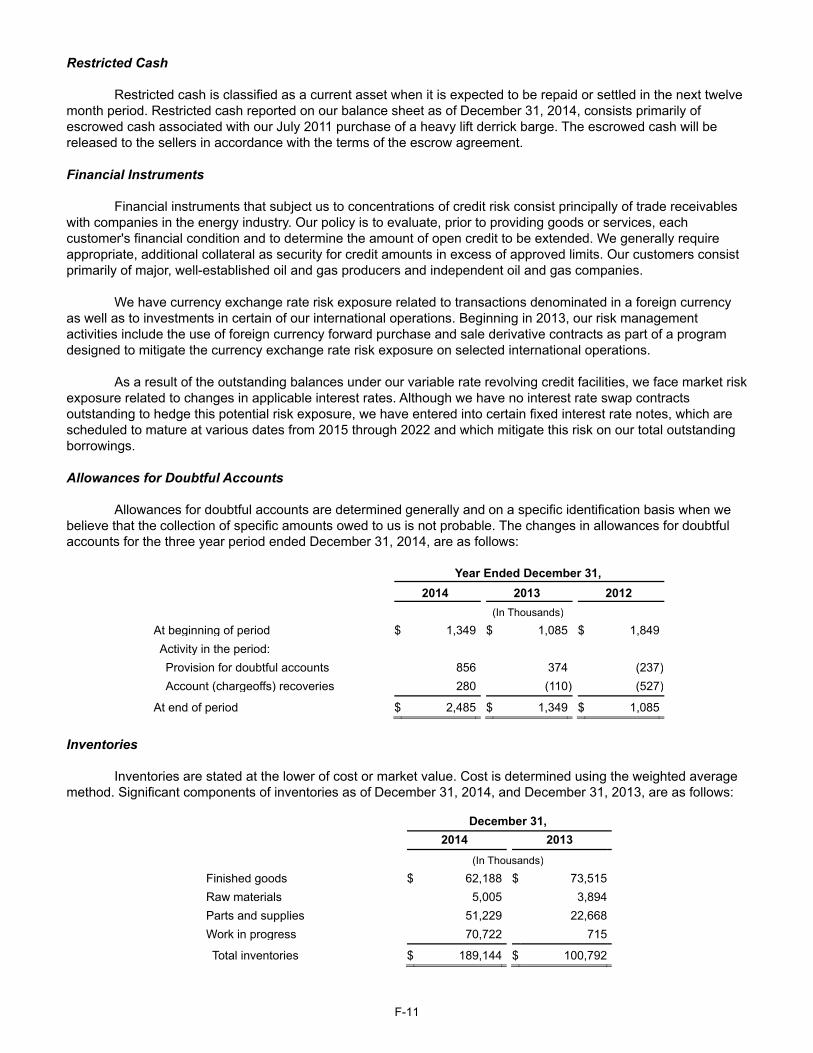
F-11
Restricted Cash Restricted cash is classified as a current asset when it is expected to be repaid or settled in the next twelve
month period. Restricted cash reported on our balance sheet as of December 31, 2014, consists primarily of escrowed cash associated with our July 2011 purchase of a heavy lift derrick barge. The escrowed cash will be released to the sellers in accordance with the terms of the escrow agreement. Financial Instruments
Financial instruments that subject us to concentrations of credit risk consist principally of trade receivables
with companies in the energy industry. Our policy is to evaluate, prior to providing goods or services, each customer's financial condition and to determine the amount of open credit to be extended. We generally require appropriate, additional collateral as security for credit amounts in excess of approved limits. Our customers consist primarily of major, well-established oil and gas producers and independent oil and gas companies.
We have currency exchange rate risk exposure related to transactions denominated in a foreign currency
as well as to investments in certain of our international operations. Beginning in 2013, our risk management activities include the use of foreign currency forward purchase and sale derivative contracts as part of a program designed to mitigate the currency exchange rate risk exposure on selected international operations.
As a result of the outstanding balances under our variable rate revolving credit facilities, we face market risk
exposure related to changes in applicable interest rates. Although we have no interest rate swap contracts outstanding to hedge this potential risk exposure, we have entered into certain fixed interest rate notes, which are scheduled to mature at various dates from 2015 through 2022 and which mitigate this risk on our total outstanding borrowings.
Allowances for Doubtful Accounts
Allowances for doubtful accounts are determined generally and on a specific identification basis when we
believe that the collection of specific amounts owed to us is not probable. The changes in allowances for doubtful accounts for the three year period ended December 31, 2014, are as follows:
Year Ended December 31, 2014 2013 2012 (In Thousands)
At beginning of period $ 1,349 $ 1,085 $ 1,849Activity in the period: Provision for doubtful accounts 856 374 (237)Account (chargeoffs) recoveries 280 (110) (527)
At end of period $ 2,485 $ 1,349 $ 1,085
Inventories
Inventories are stated at the lower of cost or market value. Cost is determined using the weighted average method. Significant components of inventories as of December 31, 2014, and December 31, 2013, are as follows:
December 31, 2014 2013 (In Thousands)
Finished goods $ 62,188 $ 73,515
Raw materials 5,005 3,894
Parts and supplies 51,229 22,668
Work in progress 70,722 715
Total inventories $ 189,144 $ 100,792
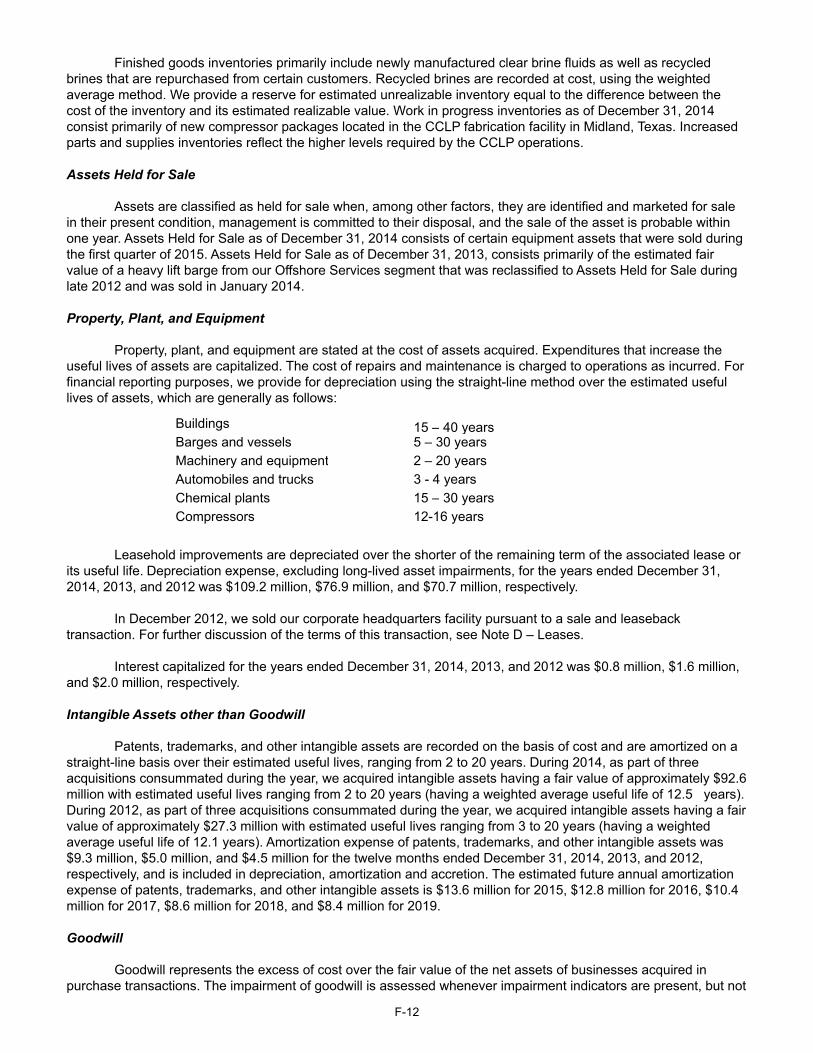
F-12
Finished goods inventories primarily include newly manufactured clear brine fluids as well as recycled brines that are repurchased from certain customers. Recycled brines are recorded at cost, using the weighted average method. We provide a reserve for estimated unrealizable inventory equal to the difference between the cost of the inventory and its estimated realizable value. Work in progress inventories as of December 31, 2014 consist primarily of new compressor packages located in the CCLP fabrication facility in Midland, Texas. Increased parts and supplies inventories reflect the higher levels required by the CCLP operations.
Assets Held for Sale
Assets are classified as held for sale when, among other factors, they are identified and marketed for sale in their present condition, management is committed to their disposal, and the sale of the asset is probable within one year. Assets Held for Sale as of December 31, 2014 consists of certain equipment assets that were sold during the first quarter of 2015. Assets Held for Sale as of December 31, 2013, consists primarily of the estimated fair value of a heavy lift barge from our Offshore Services segment that was reclassified to Assets Held for Sale during late 2012 and was sold in January 2014. Property, Plant, and Equipment
Property, plant, and equipment are stated at the cost of assets acquired. Expenditures that increase the
useful lives of assets are capitalized. The cost of repairs and maintenance is charged to operations as incurred. For financial reporting purposes, we provide for depreciation using the straight-line method over the estimated useful lives of assets, which are generally as follows:
Buildings 15 – 40 yearsBarges and vessels 5 – 30 yearsMachinery and equipment 2 – 20 yearsAutomobiles and trucks 3 - 4 yearsChemical plants 15 – 30 yearsCompressors 12-16 years
Leasehold improvements are depreciated over the shorter of the remaining term of the associated lease or
its useful life. Depreciation expense, excluding long-lived asset impairments, for the years ended December 31, 2014, 2013, and 2012 was $109.2 million, $76.9 million, and $70.7 million, respectively.
In December 2012, we sold our corporate headquarters facility pursuant to a sale and leaseback
transaction. For further discussion of the terms of this transaction, see Note D – Leases. Interest capitalized for the years ended December 31, 2014, 2013, and 2012 was $0.8 million, $1.6 million,
and $2.0 million, respectively. Intangible Assets other than Goodwill
Patents, trademarks, and other intangible assets are recorded on the basis of cost and are amortized on a
straight-line basis over their estimated useful lives, ranging from 2 to 20 years. During 2014, as part of three acquisitions consummated during the year, we acquired intangible assets having a fair value of approximately $92.6 million with estimated useful lives ranging from 2 to 20 years (having a weighted average useful life of 12.5 years). During 2012, as part of three acquisitions consummated during the year, we acquired intangible assets having a fair value of approximately $27.3 million with estimated useful lives ranging from 3 to 20 years (having a weighted average useful life of 12.1 years). Amortization expense of patents, trademarks, and other intangible assets was $9.3 million, $5.0 million, and $4.5 million for the twelve months ended December 31, 2014, 2013, and 2012, respectively, and is included in depreciation, amortization and accretion. The estimated future annual amortization expense of patents, trademarks, and other intangible assets is $13.6 million for 2015, $12.8 million for 2016, $10.4 million for 2017, $8.6 million for 2018, and $8.4 million for 2019.
Goodwill
Goodwill represents the excess of cost over the fair value of the net assets of businesses acquired in
purchase transactions. The impairment of goodwill is assessed whenever impairment indicators are present, but not
F-13
less than once annually. We perform the annual test of goodwill impairment following the fourth quarter of each year. The annual assessment for goodwill impairment begins with a qualitative assessment of whether it is “more likely than not” that the fair value of each reporting unit is less than its carrying value. This qualitative assessment requires the evaluation, based on the weight of evidence, of the significance of all identified events and circumstances for each reporting unit. Based on this qualitative assessment, we determined that due to the significant decrease in oil and natural gas commodity prices and the resulting expected negative impact on demand for the products and services for each of our reporting units, it was “more likely than not” that the fair value of each of our reporting units were less than their carrying values as of December 31, 2014. When the qualitative analysis indicates that it is “more likely than not” that a reporting unit’s fair value is less than its carrying value, the resulting goodwill impairment test consists of a two-step accounting test performed on a reporting unit basis. If the estimated fair value of the reporting unit is higher than the recorded net book value, no impairment is deemed to exist and no further testing is required. If, however, the estimated fair value of the reporting unit is below the recorded net book value, then a second step must be performed to determine the goodwill impairment required, if any. In this second step, the estimated fair value from the first step is used as the purchase price in a hypothetical acquisition of the reporting unit. Purchase business combination accounting rules are followed to determine a hypothetical purchase price allocation to the reporting unit’s assets and liabilities. The residual amount of goodwill that results from this hypothetical purchase price allocation is compared to the recorded amount of goodwill for the reporting unit, and the recorded amount is written down to the hypothetical amount, if lower. The application of this second step under goodwill impairment testing may also result in impairments of other long-lived assets, including identified intangible assets. See Impairment of Long-Lived Assets section below for a discussion of other asset impairments that were identified as part of the testing of goodwill as of December 31, 2014.
Because quoted market prices for our reporting units other than Compression are not available,
management must apply judgment in determining the estimated fair value of these reporting units for purposes of performing the goodwill impairment test. Management uses all available information to make these fair value determinations, including the present value of expected future cash flows using discount rates commensurate with the risks involved in the assets. The resultant fair values calculated for the reporting units are then compared to observable metrics for other companies in our industry or on mergers and acquisitions in our industry, to determine whether those valuations, in our judgment, appear reasonable.
During the last half of 2014, global oil and natural gas commodity prices, particularly crude oil, decreased significantly. This decrease in commodity prices has had, and is expected to continue to have, a negative impact on industry drilling and capital expenditure activity, which affects the demand for products and services of each of our reporting units. The accompanying decrease in our stock price during the last half of 2014 has also resulted in an overall reduction in our market capitalization. As of December 31, 2014, our market capitalization was below the recorded net book value of our balance sheet, including all goodwill. The accounting principles regarding goodwill acknowledge that the observed market prices of individual trades of a company’s stock (and thus its computed market capitalization) may not be representative of the fair value of the company as a whole. Substantial value may arise from the ability to take advantage of synergies and other benefits that flow from control over another entity. Consequently, measuring the fair value of a collection of assets and liabilities that operate together in a controlled entity is different from measuring the fair value of a single share of that entity’s common stock. Therefore, once the fair value of the reporting units was determined, we also added a control premium to the calculations. This control premium is judgmental and is based on observed mergers and acquisitions in our industry.
As part of our internal annual business outlook for each of our reporting units that we performed during the
fourth quarter, we considered changes in the global economic environment which affected our stock price and market capitalization. As part of the first step of goodwill impairment testing, we updated our assessment of the future cash flows for each of our reporting units, applying expected long-term growth rates, discount rates, and terminal values that we consider reasonable for each reporting unit. Our Maritech reporting unit is excluded because it does not contain goodwill. We have calculated a present value of the respective cash flows for each of the other reporting units to arrive at an estimate of fair value under the income approach, and then used the market approach to corroborate these values. Based on these assumptions, we determined that the fair value of our Fluids Division was significantly in excess of its carrying value, which includes approximately $6.6 million of goodwill. Because the fair value of our Compression Division exceeded its carrying value by approximately 4%, there is a reasonable possibility that the $233.6 million of goodwill for this reporting unit may be impaired in a future period, and the amount of such impairment may be material. Specific uncertainties affecting the estimated fair value of our Compression reporting unit includes the impact of competition, the price of oil and natural gas, future overall activity levels in the regions in which we operate, the activity levels of our significant customers, and other factors affecting the rate of future growth of this reporting unit. These factors will continue to be reviewed and assessed going
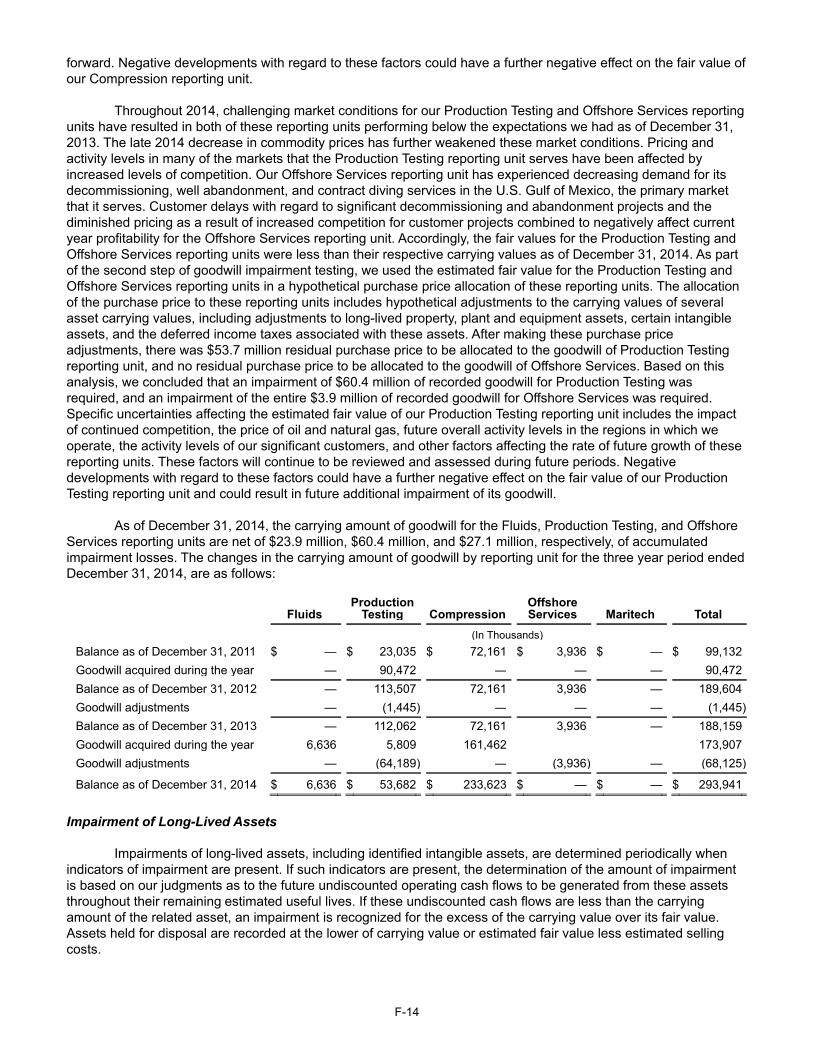
F-14
forward. Negative developments with regard to these factors could have a further negative effect on the fair value of our Compression reporting unit.
Throughout 2014, challenging market conditions for our Production Testing and Offshore Services reporting
units have resulted in both of these reporting units performing below the expectations we had as of December 31, 2013. The late 2014 decrease in commodity prices has further weakened these market conditions. Pricing and activity levels in many of the markets that the Production Testing reporting unit serves have been affected by increased levels of competition. Our Offshore Services reporting unit has experienced decreasing demand for its decommissioning, well abandonment, and contract diving services in the U.S. Gulf of Mexico, the primary market that it serves. Customer delays with regard to significant decommissioning and abandonment projects and the diminished pricing as a result of increased competition for customer projects combined to negatively affect current year profitability for the Offshore Services reporting unit. Accordingly, the fair values for the Production Testing and Offshore Services reporting units were less than their respective carrying values as of December 31, 2014. As part of the second step of goodwill impairment testing, we used the estimated fair value for the Production Testing and Offshore Services reporting units in a hypothetical purchase price allocation of these reporting units. The allocation of the purchase price to these reporting units includes hypothetical adjustments to the carrying values of several asset carrying values, including adjustments to long-lived property, plant and equipment assets, certain intangible assets, and the deferred income taxes associated with these assets. After making these purchase price adjustments, there was $53.7 million residual purchase price to be allocated to the goodwill of Production Testing reporting unit, and no residual purchase price to be allocated to the goodwill of Offshore Services. Based on this analysis, we concluded that an impairment of $60.4 million of recorded goodwill for Production Testing was required, and an impairment of the entire $3.9 million of recorded goodwill for Offshore Services was required. Specific uncertainties affecting the estimated fair value of our Production Testing reporting unit includes the impact of continued competition, the price of oil and natural gas, future overall activity levels in the regions in which we operate, the activity levels of our significant customers, and other factors affecting the rate of future growth of these reporting units. These factors will continue to be reviewed and assessed during future periods. Negative developments with regard to these factors could have a further negative effect on the fair value of our Production Testing reporting unit and could result in future additional impairment of its goodwill.
As of December 31, 2014, the carrying amount of goodwill for the Fluids, Production Testing, and Offshore
Services reporting units are net of $23.9 million, $60.4 million, and $27.1 million, respectively, of accumulated impairment losses. The changes in the carrying amount of goodwill by reporting unit for the three year period ended December 31, 2014, are as follows:
Fluids Production
Testing CompressionOffshore Services Maritech Total
(In Thousands)Balance as of December 31, 2011 $ — $ 23,035 $ 72,161 $ 3,936 $ — $ 99,132Goodwill acquired during the year — 90,472 — — — 90,472Balance as of December 31, 2012 — 113,507 72,161 3,936 — 189,604Goodwill adjustments — (1,445) — — — (1,445)Balance as of December 31, 2013 — 112,062 72,161 3,936 — 188,159Goodwill acquired during the year 6,636 5,809 161,462 173,907Goodwill adjustments — (64,189) — (3,936) — (68,125)
Balance as of December 31, 2014 $ 6,636 $ 53,682 $ 233,623 $ — $ — $ 293,941
Impairment of Long-Lived Assets
Impairments of long-lived assets, including identified intangible assets, are determined periodically when
indicators of impairment are present. If such indicators are present, the determination of the amount of impairment is based on our judgments as to the future undiscounted operating cash flows to be generated from these assets throughout their remaining estimated useful lives. If these undiscounted cash flows are less than the carrying amount of the related asset, an impairment is recognized for the excess of the carrying value over its fair value. Assets held for disposal are recorded at the lower of carrying value or estimated fair value less estimated selling costs.
F-15
During the fourth quarter of 2012, the Offshore Services segment began pursuing the sale of the TETRA DB-1 heavy lift barge due to decreased demand in the shallow waters of the Outer Continental Shelf of the Gulf of Mexico, where it historically operated. In connection with this decision, an impairment of approximately $7.7 million was recorded to reduce the carrying value of the TETRA DB-1 to its estimated fair value, less estimated cost to sell.
During the first quarter of 2014, the Offshore Services segment sold the TETRA DB-1 heavy lift barge for a
sales price of $3.0 million. As a result, an additional impairment of approximately $9.3 million was recorded in December 2013 to reduce the carrying value of the TETRA DB-1 to the sales price.
During the fourth quarter of 2014, including assets whose fair values were determined to be less than their
carrying value pursuant to our annual assessment of goodwill, our Offshore Services segment recorded impairments of approximately $13.7 million, primarily associated with a portion of the carrying value of certain of its dive services vessels and equipment and other long lived assets due to expected decreased demand. Our Production Testing segment also recorded impairments of approximately $14.5 million, primarily associated with a portion of the carrying value of certain of its production testing equipment and certain identified intangible assets. Our Fluids Division also recorded impairments of approximately $5.2 million associated with certain of its water management business assets. Decommissioning Liabilities
Related to Maritech’s remaining oil and gas property decommissioning liabilities, we estimate the third-party
fair values (including an estimated profit) to plug and abandon wells, decommission the pipelines and platforms, and clear the sites, and we use these estimates to record Maritech’s decommissioning liabilities, net of amounts allocable to joint interest owners.
In estimating the decommissioning liabilities, we perform detailed estimating procedures, analysis, and
engineering studies. Whenever practical and cost effective, Maritech will utilize the services of its affiliated companies to perform well abandonment and decommissioning work. When these services are performed by an affiliated company, all recorded intercompany revenues are eliminated in the consolidated financial statements. The recorded decommissioning liability associated with a specific property is fully extinguished when the property is completely abandoned. The recorded liability is first reduced by all cash expenses incurred to abandon and decommission the property. If the recorded liability exceeds (or is less than) our actual out-of-pocket costs, the difference is credited (or charged) to earnings in the period in which the work is performed. We review the adequacy of our decommissioning liabilities whenever indicators suggest that the estimated cash flows underlying the liabilities have changed materially. The amount of work performed or estimated to be performed on a Maritech property asset retirement obligation may often exceed amounts previously estimated for numerous reasons. Property conditions encountered, including subsea, geological, or downhole conditions, may be different from those anticipated at the time of estimation due to the age of the property and the quality of information available about the particular property conditions. Additionally, the cost of performing work at locations damaged by hurricanes is particularly difficult to estimate due to the unique conditions encountered, including the uncertainty regarding the extent of physical damage to many of the structures. Lastly, previously plugged and abandoned wells on its properties have later exhibited a build-up of pressure, which is evidenced by gas bubbles coming from the plugged well head. Remediation work at previously abandoned well sites is particularly costly, due to the lack of a platform from which to base these activities. The timing and amounts of these cash flows are subject to changes in the energy industry environment and may result in additional liabilities to be recorded, which, in turn, would result in direct charges to earnings. Decommissioning work performed for the years 2014, 2013, and 2012 was $63.3 million, $119.6 million, and $87.4 million, respectively. For a further discussion of adjustments and other activity related to Maritech’s decommissioning liabilities, including significant adjustments made during 2014, 2013, and 2012, see Note H – Decommissioning and Other Asset Retirement Obligations. Environmental Liabilities
Environmental expenditures that result in additions to property and equipment are capitalized, while other
environmental expenditures are expensed. Environmental remediation liabilities are recorded on an undiscounted basis when environmental assessments or cleanups are probable and the costs can be reasonably estimated. Estimates of future environmental remediation expenditures often consist of a range of possible expenditure amounts, a portion of which may be in excess of amounts of liabilities recorded. In such an instance, we disclose the full range of amounts reasonably possible of being incurred. Any changes or developments in environmental
F-16
remediation efforts are accounted for and disclosed each quarter as they occur. Any recoveries of environmental remediation costs from other parties are recorded as assets when their receipt is deemed probable.
Complexities involving environmental remediation efforts can cause estimates of the associated liability to
be imprecise. Factors that cause uncertainties regarding the estimation of future expenditures include, but are not limited to, the effectiveness of the anticipated work plans in achieving targeted results and changes in the desired remediation methods and outcomes as prescribed by regulatory agencies. Uncertainties associated with environmental remediation contingencies are pervasive and often result in wide ranges of reasonably possible outcomes. Estimates developed in the early stages of remediation can vary significantly. Normally, a finite estimate of cost does not become fixed and determinable at a specific point in time. Rather, the costs associated with environmental remediation become estimable as the work is performed and the range of ultimate cost becomes more defined. It is possible that cash flows and results of operations could be materially affected by the impact of the ultimate resolution of these contingencies.
Revenue Recognition
Revenues are recognized when finished products are shipped or services have been provided to
unaffiliated customers and only when collectability is reasonably assured. Sales terms for our products are FOB shipping point, with title transferring at the point of shipment. Revenue is recognized at the point of transfer of title. With regard to longer-term lump-sum contracts, revenues are recognized using the percentage-of-completion method based on the ratio of costs incurred to total estimated costs at completion. Total project revenue and cost estimates for lump-sum contracts are reviewed periodically as work progresses, and adjustments are reflected in the period in which such estimates are revised. Provisions for estimated losses on such contracts are made in the period such losses are determined. Occasionally we have contracts that contain multiple deliverables, and for such contracts the recognition of revenue is determined based on the realized market values received by the customer as well as the timing of collections under the contract.
Operating Costs Cost of product sales includes direct and indirect costs of manufacturing and producing our products,
including raw materials, fuel, utilities, labor, overhead, repairs and maintenance, materials, services, transportation, warehousing, equipment rentals, insurance, and taxes. In addition, cost of product sales includes oil and gas operating expense. Cost of services and rentals includes operating expenses we incur in delivering our services, including labor, equipment rental, fuel, repair and maintenance, transportation, overhead, insurance, and certain taxes. We include in product sales revenues the reimbursements we receive from customers for shipping and handling costs. Shipping and handling costs are included in cost of product sales. Amounts we incur for “out-of-pocket” expenses in the delivery of our services are recorded as cost of services and rentals. Reimbursements for “out-of-pocket” expenses we incur in the delivery of our services are recorded as service revenues. Depreciation, amortization, and accretion includes depreciation expense for all of our facilities, equipment and vehicles, amortization expense on our intangible assets, and accretion expense related to our decommissioning and other asset retirement obligations.
We include in general and administrative expense all costs not identifiable to our specific product or service
operations, including divisional and general corporate overhead, professional services, corporate office costs, sales and marketing expenses, insurance, and taxes.
Repair Costs and Insurance Recoveries
Our Maritech subsidiary incurred significant damage to the majority of its offshore oil and gas producing
platforms as a result of Hurricane Ike during 2008 and Hurricanes Katrina and Rita during 2005. As of December 31, 2014, the remaining work to be performed consists primarily of decommissioning and debris removal efforts on one of Maritech's production platforms that was destroyed. We estimate that the remaining future decommissioning and debris removal efforts associated with this remaining platform will cost approximately $8.7 million, net to our interest, and has been accrued as part of Maritech’s decommissioning liabilities. The actual cost to complete this hurricane response work could exceed this estimate and could result in significant charges to earnings in future periods.
F-17
When it is economical to purchase, we typically maintain insurance protection that we believe to be customary and in amounts sufficient to reimburse us for a majority of our casualty losses. Our insurance coverage is subject to certain overall coverage limits and deductibles. With regard to costs incurred that we believe will qualify for coverage under our various insurance policies, we recognize anticipated insurance recoveries when collection is deemed probable. Any recognition of anticipated insurance recoveries is used to offset the original charge to which the insurance recovery relates.
During December 2010, we initiated legal proceedings against one of Maritech’s underwriters that had disputed that certain hurricane damage related costs incurred or to be incurred qualified as covered costs pursuant to Maritech's windstorm insurance policies. In February 2013, we entered into a settlement agreement with the underwriter, whereby we received $7.6 million, a portion of which was credited to operating expenses during the quarter ended March 31, 2013.
Repair costs incurred and the net book value of any destroyed assets which are covered under our
insurance policies are anticipated insurance recoveries which are included in accounts receivable. Repair costs not considered probable of collection are charged to earnings. Insurance recoveries in excess of destroyed asset carrying values and repair costs incurred are credited to earnings when received.
Discontinued Operations
We account for our discontinued businesses as discontinued operations and reclassify prior period financial
statements to exclude these businesses from continuing operations.
Income Taxes Deferred tax assets and liabilities are recognized for the future tax consequences attributable to differences
between the financial statement carrying amounts of existing assets and liabilities and their respective tax basis amounts. Deferred tax assets and liabilities are measured using enacted tax rates expected to apply to taxable income in the years in which those temporary differences are expected to be recovered or settled. The effect of a change in tax rates is recognized as income or expense in the period that includes the enactment date. During 2014, a portion of the carrying value of certain deferred tax assets was subjected to a valuation allowance. See Note E - Income Taxes for further discussion.
Income (Loss) per Common Share
The calculation of basic earnings per share excludes any dilutive effects of options. The calculation of
diluted earnings per share includes the dilutive effect of stock options, which is computed using the treasury stock method during the periods such options were outstanding. A reconciliation of the common shares used in the computations of income (loss) per common and common equivalent shares is presented in Note O – Income (Loss) Per Share.
Foreign Currency Translation
We have designated the euro, the British pound, the Norwegian krone, the Canadian dollar, the Brazilian
real, and the Mexican peso as the functional currency for our operations in Finland and Sweden, the United Kingdom, Norway, Canada, Brazil, and certain of our operations in Mexico, respectively. Effective January 1, 2014, we changed the functional currency in Argentina from the U.S. dollar to the Argentina peso. The U.S. dollar is the designated functional currency for all of our other foreign operations. The cumulative translation effects of translating the accounts from the functional currencies into the U.S. dollar at current exchange rates are included as a separate component of equity.
Fair Value Measurements
Fair value is defined as “the price that would be received to sell an asset or paid to transfer a liability in an
orderly transaction between market participants at the measurement date” within an entity’s principal market, if any. The principal market is the market in which the reporting entity would sell the asset or transfer the liability with the greatest volume and level of activity, regardless of whether it is the market in which the entity will ultimately transact for a particular asset or liability or if a different market is potentially more advantageous. Accordingly, this exit price concept may result in a fair value that may differ from the transaction price or market price of the asset or liability.

F-18
Under generally accepted accounting principles, the fair value hierarchy prioritizes inputs to valuation
techniques used to measure fair value. Fair value measurements should maximize the use of observable inputs and minimize the use of unobservable inputs, where possible. Observable inputs are developed based on market data obtained from sources independent of the reporting entity. Unobservable inputs may be needed to measure fair value in situations where there is little or no market activity for the asset or liability at the measurement date and are developed based on the best information available in the circumstances, which could include the reporting entity’s own judgments about the assumptions market participants would utilize in pricing the asset or liability.
We utilize fair value measurements to account for certain items and account balances within our
consolidated financial statements. Fair value measurements are utilized in the allocation of purchase consideration for acquisition transactions to the assets and liabilities acquired, including intangible assets, goodwill, and contingent consideration liabilities. In addition, we utilize fair value measurements in the initial recording of our decommissioning and other asset retirement obligations. Fair value measurements may also be utilized on a nonrecurring basis, such as for the impairment of long-lived assets, including goodwill. The fair value of our financial instruments, which may include cash, temporary investments, accounts receivable, short-term borrowings, and variable-rate long-term debt pursuant to our bank credit agreements, approximate their carrying amounts. The fair value of our long-term Senior Notes at December 31, 2014 and 2013, was approximately $310.7 million and $318.4 million, respectively, compared to a carrying amount of approximately $305.0 million, as current rates as of those dates were more favorable than the Senior Note fixed interest rates. The fair value of the CCLP Senior Notes at December 31, 2014, was approximately $354.9 million, compared to a face amount of approximately $350.0 million (See Note G - Long-Term Debt and Other Borrowings, for further discussion).We calculate the fair value of our Senior Notes internally, using current market conditions and average cost of debt (a Level 2 fair value measurement).
The fair value of the liability for the WIT Water Transfer, LLC (doing business as TD Water Transfer)
contingent purchase price consideration as of December 31, 2014, was $0. We calculate the fair value of the liability for our contingent purchase price consideration obligation in accordance with the TD Water Transfer share purchase agreement based upon a probability weighted calculation using the actual and anticipated earnings of our TD Water Transfer operations (a level 3 fair value measurement). We also utilize fair value measurements on a recurring basis in the accounting for our foreign currency forward sale derivative contracts. For these fair value measurements, we utilize the quoted value as determined by our counterparty financial institution (a Level 2 measurement). A summary of these fair value measurements as of December 31, 2014, is as follows:
Fair Value Measurements Using
Total as of
Dec. 31, 2014
Quoted Prices in Active
Markets for Identical Assets
or Liabilities (Level 1)
Significant Other
Observable Inputs
(Level 2)
Significant Unobservable
Inputs (Level 3)Description
(In Thousands)Asset for foreign currency derivative contracts $ — $ — —
—
Liability for foreign currency derivative contracts (174) — (174) —
Acquisition contingent consideration liability — — —
—
Total $ (174)
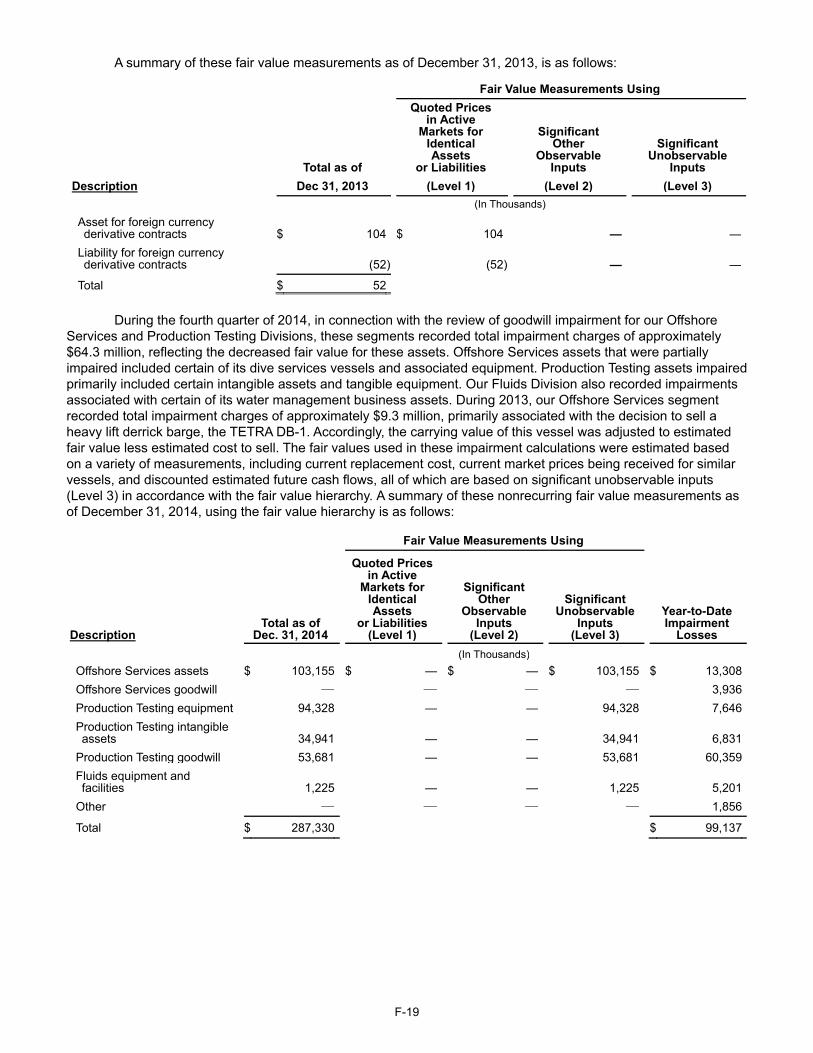
F-19
A summary of these fair value measurements as of December 31, 2013, is as follows:
Fair Value Measurements Using
Total as of
Quoted Prices in Active
Markets for Identical Assets
or Liabilities
Significant Other
Observable Inputs
Significant Unobservable
InputsDescription Dec 31, 2013 (Level 1) (Level 2) (Level 3) (In Thousands)
Asset for foreign currency derivative contracts $ 104 $ 104 —
—
Liability for foreign currency derivative contracts (52) (52) —
—
Total $ 52
During the fourth quarter of 2014, in connection with the review of goodwill impairment for our Offshore Services and Production Testing Divisions, these segments recorded total impairment charges of approximately $64.3 million, reflecting the decreased fair value for these assets. Offshore Services assets that were partially impaired included certain of its dive services vessels and associated equipment. Production Testing assets impaired primarily included certain intangible assets and tangible equipment. Our Fluids Division also recorded impairments associated with certain of its water management business assets. During 2013, our Offshore Services segment recorded total impairment charges of approximately $9.3 million, primarily associated with the decision to sell a heavy lift derrick barge, the TETRA DB-1. Accordingly, the carrying value of this vessel was adjusted to estimated fair value less estimated cost to sell. The fair values used in these impairment calculations were estimated based on a variety of measurements, including current replacement cost, current market prices being received for similar vessels, and discounted estimated future cash flows, all of which are based on significant unobservable inputs (Level 3) in accordance with the fair value hierarchy. A summary of these nonrecurring fair value measurements as of December 31, 2014, using the fair value hierarchy is as follows:
Fair Value Measurements Using
Total as of Dec. 31, 2014
Quoted Pricesin Active
Markets for Identical Assets
or Liabilities (Level 1)
Significant Other
Observable Inputs
(Level 2)
Significant Unobservable
Inputs (Level 3)
Year-to-Date Impairment
LossesDescription (In Thousands)Offshore Services assets $ 103,155 $ — $ — $ 103,155 $ 13,308Offshore Services goodwill — — — — 3,936Production Testing equipment 94,328 — — 94,328 7,646Production Testing intangible assets 34,941 — — 34,941
6,831
Production Testing goodwill 53,681 — — 53,681 60,359Fluids equipment and facilities 1,225 — — 1,225
5,201
Other — — — — 1,856
Total $ 287,330 $ 99,137
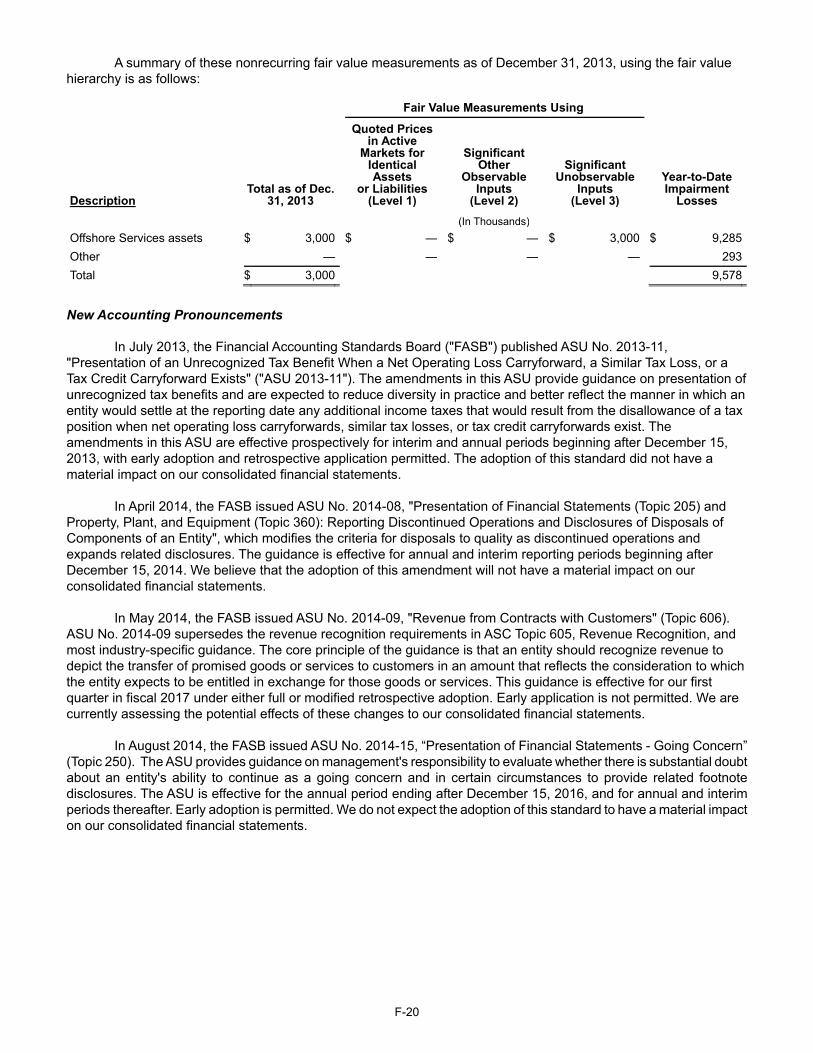
F-20
A summary of these nonrecurring fair value measurements as of December 31, 2013, using the fair value hierarchy is as follows:
Fair Value Measurements Using
Total as of Dec. 31, 2013
Quoted Pricesin Active
Markets for Identical Assets
or Liabilities (Level 1)
Significant Other
Observable Inputs
(Level 2)
Significant Unobservable
Inputs (Level 3)
Year-to-Date Impairment
LossesDescription (In Thousands)Offshore Services assets $ 3,000 $ — $ — $ 3,000 $ 9,285Other — — — — 293Total $ 3,000 9,578
New Accounting Pronouncements
In July 2013, the Financial Accounting Standards Board ("FASB") published ASU No. 2013-11, "Presentation of an Unrecognized Tax Benefit When a Net Operating Loss Carryforward, a Similar Tax Loss, or a Tax Credit Carryforward Exists" ("ASU 2013-11"). The amendments in this ASU provide guidance on presentation of unrecognized tax benefits and are expected to reduce diversity in practice and better reflect the manner in which an entity would settle at the reporting date any additional income taxes that would result from the disallowance of a tax position when net operating loss carryforwards, similar tax losses, or tax credit carryforwards exist. The amendments in this ASU are effective prospectively for interim and annual periods beginning after December 15, 2013, with early adoption and retrospective application permitted. The adoption of this standard did not have a material impact on our consolidated financial statements.
In April 2014, the FASB issued ASU No. 2014-08, "Presentation of Financial Statements (Topic 205) and
Property, Plant, and Equipment (Topic 360): Reporting Discontinued Operations and Disclosures of Disposals of Components of an Entity", which modifies the criteria for disposals to quality as discontinued operations and expands related disclosures. The guidance is effective for annual and interim reporting periods beginning after December 15, 2014. We believe that the adoption of this amendment will not have a material impact on our consolidated financial statements. In May 2014, the FASB issued ASU No. 2014-09, "Revenue from Contracts with Customers" (Topic 606). ASU No. 2014-09 supersedes the revenue recognition requirements in ASC Topic 605, Revenue Recognition, and most industry-specific guidance. The core principle of the guidance is that an entity should recognize revenue to depict the transfer of promised goods or services to customers in an amount that reflects the consideration to which the entity expects to be entitled in exchange for those goods or services. This guidance is effective for our first quarter in fiscal 2017 under either full or modified retrospective adoption. Early application is not permitted. We are currently assessing the potential effects of these changes to our consolidated financial statements. In August 2014, the FASB issued ASU No. 2014-15, “Presentation of Financial Statements - Going Concern” (Topic 250). The ASU provides guidance on management's responsibility to evaluate whether there is substantial doubt about an entity's ability to continue as a going concern and in certain circumstances to provide related footnote disclosures. The ASU is effective for the annual period ending after December 15, 2016, and for annual and interim periods thereafter. Early adoption is permitted. We do not expect the adoption of this standard to have a material impact on our consolidated financial statements.
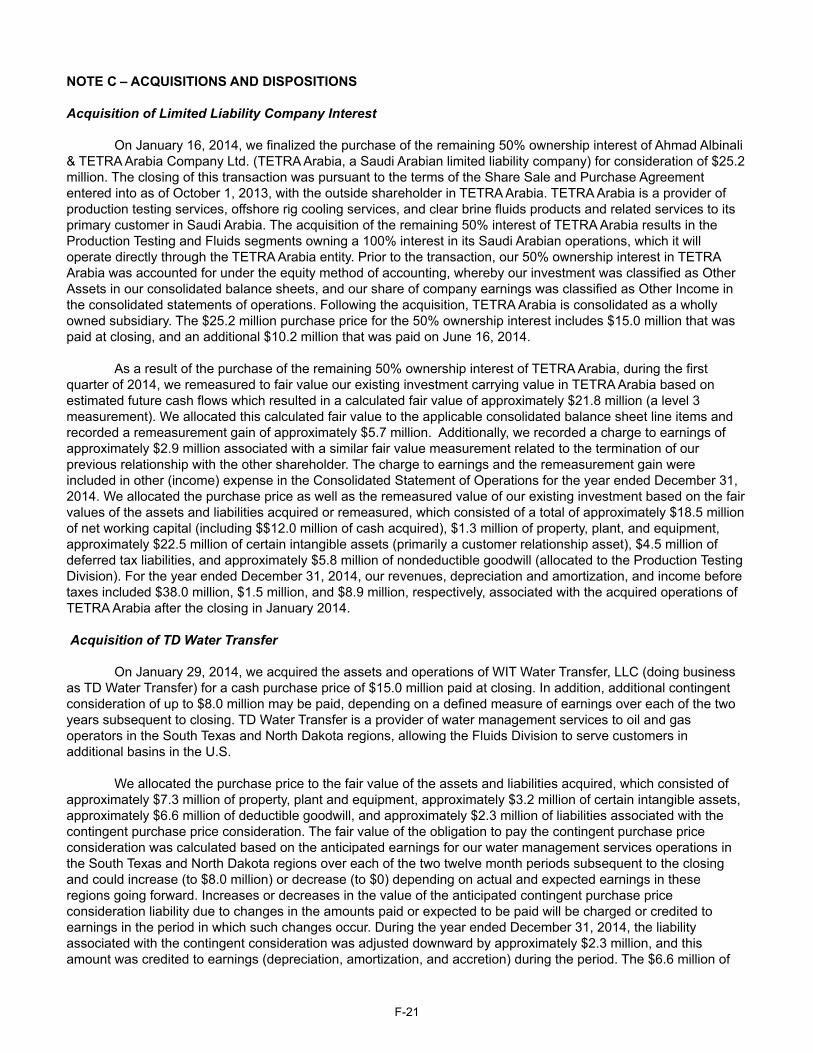
F-21
NOTE C – ACQUISITIONS AND DISPOSITIONS
Acquisition of Limited Liability Company Interest On January 16, 2014, we finalized the purchase of the remaining 50% ownership interest of Ahmad Albinali & TETRA Arabia Company Ltd. (TETRA Arabia, a Saudi Arabian limited liability company) for consideration of $25.2 million. The closing of this transaction was pursuant to the terms of the Share Sale and Purchase Agreement entered into as of October 1, 2013, with the outside shareholder in TETRA Arabia. TETRA Arabia is a provider of production testing services, offshore rig cooling services, and clear brine fluids products and related services to its primary customer in Saudi Arabia. The acquisition of the remaining 50% interest of TETRA Arabia results in the Production Testing and Fluids segments owning a 100% interest in its Saudi Arabian operations, which it will operate directly through the TETRA Arabia entity. Prior to the transaction, our 50% ownership interest in TETRA Arabia was accounted for under the equity method of accounting, whereby our investment was classified as Other Assets in our consolidated balance sheets, and our share of company earnings was classified as Other Income in the consolidated statements of operations. Following the acquisition, TETRA Arabia is consolidated as a wholly owned subsidiary. The $25.2 million purchase price for the 50% ownership interest includes $15.0 million that was paid at closing, and an additional $10.2 million that was paid on June 16, 2014.
As a result of the purchase of the remaining 50% ownership interest of TETRA Arabia, during the first quarter of 2014, we remeasured to fair value our existing investment carrying value in TETRA Arabia based on estimated future cash flows which resulted in a calculated fair value of approximately $21.8 million (a level 3 measurement). We allocated this calculated fair value to the applicable consolidated balance sheet line items and recorded a remeasurement gain of approximately $5.7 million. Additionally, we recorded a charge to earnings of approximately $2.9 million associated with a similar fair value measurement related to the termination of our previous relationship with the other shareholder. The charge to earnings and the remeasurement gain were included in other (income) expense in the Consolidated Statement of Operations for the year ended December 31, 2014. We allocated the purchase price as well as the remeasured value of our existing investment based on the fair values of the assets and liabilities acquired or remeasured, which consisted of a total of approximately $18.5 million of net working capital (including $$12.0 million of cash acquired), $1.3 million of property, plant, and equipment, approximately $22.5 million of certain intangible assets (primarily a customer relationship asset), $4.5 million of deferred tax liabilities, and approximately $5.8 million of nondeductible goodwill (allocated to the Production Testing Division). For the year ended December 31, 2014, our revenues, depreciation and amortization, and income before taxes included $38.0 million, $1.5 million, and $8.9 million, respectively, associated with the acquired operations of TETRA Arabia after the closing in January 2014. Acquisition of TD Water Transfer
On January 29, 2014, we acquired the assets and operations of WIT Water Transfer, LLC (doing business as TD Water Transfer) for a cash purchase price of $15.0 million paid at closing. In addition, additional contingent consideration of up to $8.0 million may be paid, depending on a defined measure of earnings over each of the two years subsequent to closing. TD Water Transfer is a provider of water management services to oil and gas operators in the South Texas and North Dakota regions, allowing the Fluids Division to serve customers in additional basins in the U.S.
We allocated the purchase price to the fair value of the assets and liabilities acquired, which consisted of approximately $7.3 million of property, plant and equipment, approximately $3.2 million of certain intangible assets, approximately $6.6 million of deductible goodwill, and approximately $2.3 million of liabilities associated with the contingent purchase price consideration. The fair value of the obligation to pay the contingent purchase price consideration was calculated based on the anticipated earnings for our water management services operations in the South Texas and North Dakota regions over each of the two twelve month periods subsequent to the closing and could increase (to $8.0 million) or decrease (to $0) depending on actual and expected earnings in these regions going forward. Increases or decreases in the value of the anticipated contingent purchase price consideration liability due to changes in the amounts paid or expected to be paid will be charged or credited to earnings in the period in which such changes occur. During the year ended December 31, 2014, the liability associated with the contingent consideration was adjusted downward by approximately $2.3 million, and this amount was credited to earnings (depreciation, amortization, and accretion) during the period. The $6.6 million of
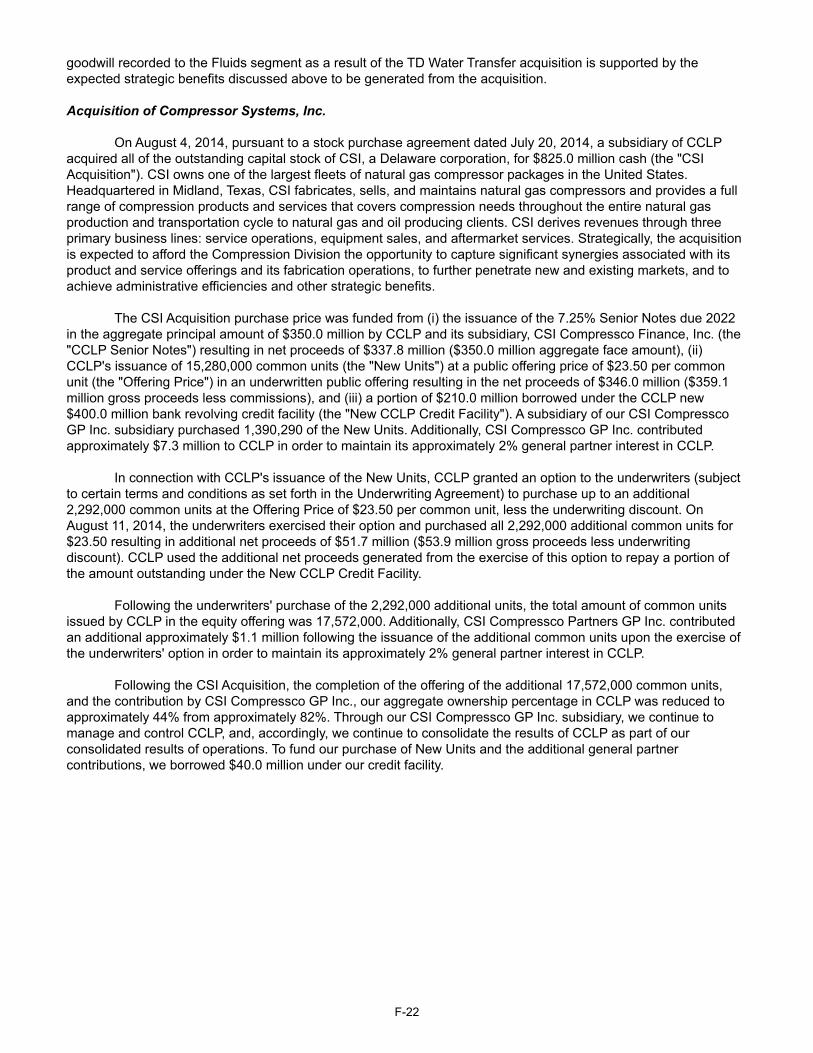
F-22
goodwill recorded to the Fluids segment as a result of the TD Water Transfer acquisition is supported by the expected strategic benefits discussed above to be generated from the acquisition. Acquisition of Compressor Systems, Inc. On August 4, 2014, pursuant to a stock purchase agreement dated July 20, 2014, a subsidiary of CCLP acquired all of the outstanding capital stock of CSI, a Delaware corporation, for $825.0 million cash (the "CSI Acquisition"). CSI owns one of the largest fleets of natural gas compressor packages in the United States. Headquartered in Midland, Texas, CSI fabricates, sells, and maintains natural gas compressors and provides a full range of compression products and services that covers compression needs throughout the entire natural gas production and transportation cycle to natural gas and oil producing clients. CSI derives revenues through three primary business lines: service operations, equipment sales, and aftermarket services. Strategically, the acquisition is expected to afford the Compression Division the opportunity to capture significant synergies associated with its product and service offerings and its fabrication operations, to further penetrate new and existing markets, and to achieve administrative efficiencies and other strategic benefits. The CSI Acquisition purchase price was funded from (i) the issuance of the 7.25% Senior Notes due 2022 in the aggregate principal amount of $350.0 million by CCLP and its subsidiary, CSI Compressco Finance, Inc. (the "CCLP Senior Notes") resulting in net proceeds of $337.8 million ($350.0 million aggregate face amount), (ii) CCLP's issuance of 15,280,000 common units (the "New Units") at a public offering price of $23.50 per common unit (the "Offering Price") in an underwritten public offering resulting in the net proceeds of $346.0 million ($359.1 million gross proceeds less commissions), and (iii) a portion of $210.0 million borrowed under the CCLP new $400.0 million bank revolving credit facility (the "New CCLP Credit Facility"). A subsidiary of our CSI Compressco GP Inc. subsidiary purchased 1,390,290 of the New Units. Additionally, CSI Compressco GP Inc. contributed approximately $7.3 million to CCLP in order to maintain its approximately 2% general partner interest in CCLP. In connection with CCLP's issuance of the New Units, CCLP granted an option to the underwriters (subject to certain terms and conditions as set forth in the Underwriting Agreement) to purchase up to an additional 2,292,000 common units at the Offering Price of $23.50 per common unit, less the underwriting discount. On August 11, 2014, the underwriters exercised their option and purchased all 2,292,000 additional common units for $23.50 resulting in additional net proceeds of $51.7 million ($53.9 million gross proceeds less underwriting discount). CCLP used the additional net proceeds generated from the exercise of this option to repay a portion of the amount outstanding under the New CCLP Credit Facility. Following the underwriters' purchase of the 2,292,000 additional units, the total amount of common units issued by CCLP in the equity offering was 17,572,000. Additionally, CSI Compressco Partners GP Inc. contributed an additional approximately $1.1 million following the issuance of the additional common units upon the exercise of the underwriters' option in order to maintain its approximately 2% general partner interest in CCLP. Following the CSI Acquisition, the completion of the offering of the additional 17,572,000 common units, and the contribution by CSI Compressco GP Inc., our aggregate ownership percentage in CCLP was reduced to approximately 44% from approximately 82%. Through our CSI Compressco GP Inc. subsidiary, we continue to manage and control CCLP, and, accordingly, we continue to consolidate the results of CCLP as part of our consolidated results of operations. To fund our purchase of New Units and the additional general partner contributions, we borrowed $40.0 million under our credit facility.
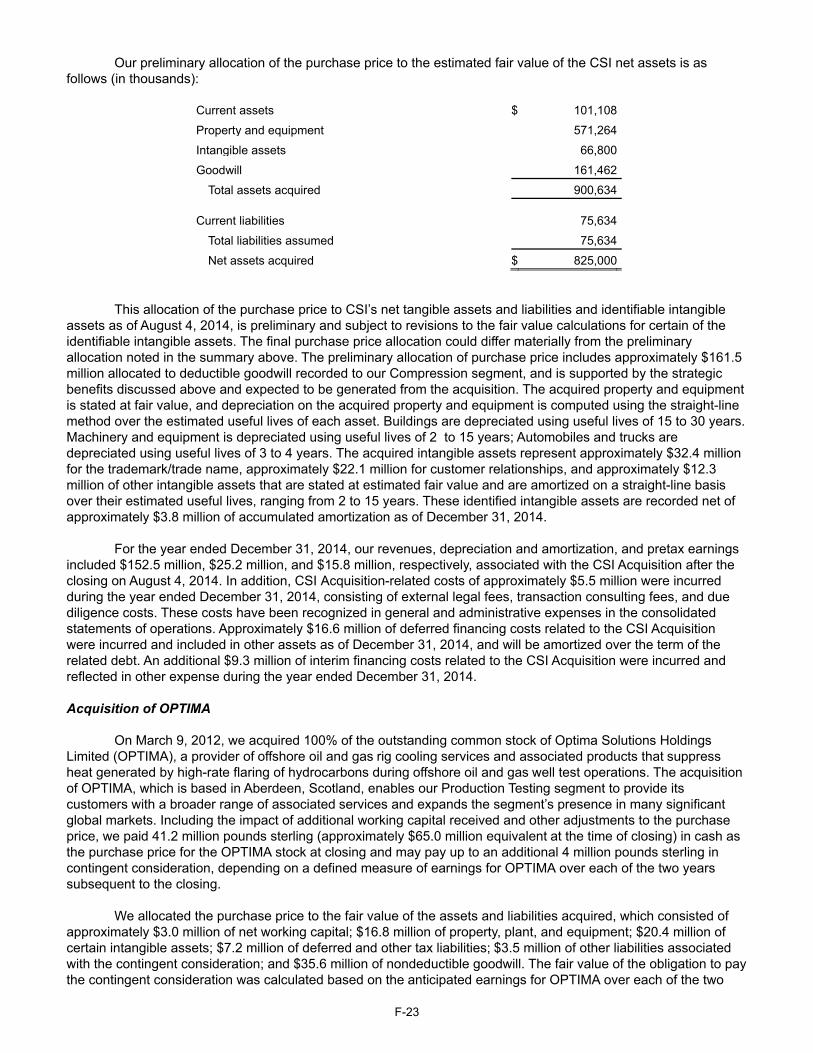
F-23
Our preliminary allocation of the purchase price to the estimated fair value of the CSI net assets is as follows (in thousands):
Current assets $ 101,108
Property and equipment 571,264
Intangible assets 66,800
Goodwill 161,462
Total assets acquired 900,634
Current liabilities 75,634
Total liabilities assumed 75,634
Net assets acquired $ 825,000
This allocation of the purchase price to CSI’s net tangible assets and liabilities and identifiable intangible assets as of August 4, 2014, is preliminary and subject to revisions to the fair value calculations for certain of the identifiable intangible assets. The final purchase price allocation could differ materially from the preliminary allocation noted in the summary above. The preliminary allocation of purchase price includes approximately $161.5 million allocated to deductible goodwill recorded to our Compression segment, and is supported by the strategic benefits discussed above and expected to be generated from the acquisition. The acquired property and equipment is stated at fair value, and depreciation on the acquired property and equipment is computed using the straight-line method over the estimated useful lives of each asset. Buildings are depreciated using useful lives of 15 to 30 years. Machinery and equipment is depreciated using useful lives of 2 to 15 years; Automobiles and trucks are depreciated using useful lives of 3 to 4 years. The acquired intangible assets represent approximately $32.4 million for the trademark/trade name, approximately $22.1 million for customer relationships, and approximately $12.3 million of other intangible assets that are stated at estimated fair value and are amortized on a straight-line basis over their estimated useful lives, ranging from 2 to 15 years. These identified intangible assets are recorded net of approximately $3.8 million of accumulated amortization as of December 31, 2014. For the year ended December 31, 2014, our revenues, depreciation and amortization, and pretax earnings included $152.5 million, $25.2 million, and $15.8 million, respectively, associated with the CSI Acquisition after the closing on August 4, 2014. In addition, CSI Acquisition-related costs of approximately $5.5 million were incurred during the year ended December 31, 2014, consisting of external legal fees, transaction consulting fees, and due diligence costs. These costs have been recognized in general and administrative expenses in the consolidated statements of operations. Approximately $16.6 million of deferred financing costs related to the CSI Acquisition were incurred and included in other assets as of December 31, 2014, and will be amortized over the term of the related debt. An additional $9.3 million of interim financing costs related to the CSI Acquisition were incurred and reflected in other expense during the year ended December 31, 2014. Acquisition of OPTIMA
On March 9, 2012, we acquired 100% of the outstanding common stock of Optima Solutions Holdings
Limited (OPTIMA), a provider of offshore oil and gas rig cooling services and associated products that suppress heat generated by high-rate flaring of hydrocarbons during offshore oil and gas well test operations. The acquisition of OPTIMA, which is based in Aberdeen, Scotland, enables our Production Testing segment to provide its customers with a broader range of associated services and expands the segment’s presence in many significant global markets. Including the impact of additional working capital received and other adjustments to the purchase price, we paid 41.2 million pounds sterling (approximately $65.0 million equivalent at the time of closing) in cash as the purchase price for the OPTIMA stock at closing and may pay up to an additional 4 million pounds sterling in contingent consideration, depending on a defined measure of earnings for OPTIMA over each of the two years subsequent to the closing.
We allocated the purchase price to the fair value of the assets and liabilities acquired, which consisted of
approximately $3.0 million of net working capital; $16.8 million of property, plant, and equipment; $20.4 million of certain intangible assets; $7.2 million of deferred and other tax liabilities; $3.5 million of other liabilities associated with the contingent consideration; and $35.6 million of nondeductible goodwill. The fair value of the obligation to pay the contingent consideration was calculated based on the anticipated earnings for OPTIMA over each of the two
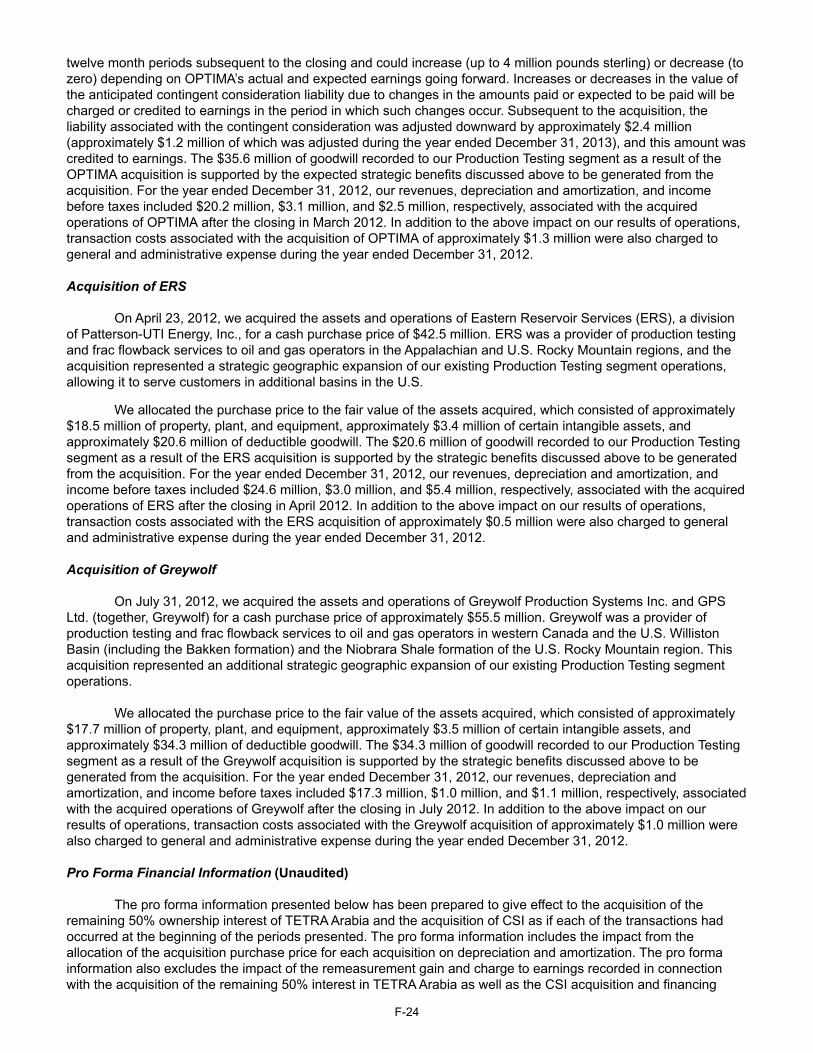
F-24
twelve month periods subsequent to the closing and could increase (up to 4 million pounds sterling) or decrease (to zero) depending on OPTIMA’s actual and expected earnings going forward. Increases or decreases in the value of the anticipated contingent consideration liability due to changes in the amounts paid or expected to be paid will be charged or credited to earnings in the period in which such changes occur. Subsequent to the acquisition, the liability associated with the contingent consideration was adjusted downward by approximately $2.4 million (approximately $1.2 million of which was adjusted during the year ended December 31, 2013), and this amount was credited to earnings. The $35.6 million of goodwill recorded to our Production Testing segment as a result of the OPTIMA acquisition is supported by the expected strategic benefits discussed above to be generated from the acquisition. For the year ended December 31, 2012, our revenues, depreciation and amortization, and income before taxes included $20.2 million, $3.1 million, and $2.5 million, respectively, associated with the acquired operations of OPTIMA after the closing in March 2012. In addition to the above impact on our results of operations, transaction costs associated with the acquisition of OPTIMA of approximately $1.3 million were also charged to general and administrative expense during the year ended December 31, 2012.
Acquisition of ERS
On April 23, 2012, we acquired the assets and operations of Eastern Reservoir Services (ERS), a division of Patterson-UTI Energy, Inc., for a cash purchase price of $42.5 million. ERS was a provider of production testing and frac flowback services to oil and gas operators in the Appalachian and U.S. Rocky Mountain regions, and the acquisition represented a strategic geographic expansion of our existing Production Testing segment operations, allowing it to serve customers in additional basins in the U.S.
We allocated the purchase price to the fair value of the assets acquired, which consisted of approximately $18.5 million of property, plant, and equipment, approximately $3.4 million of certain intangible assets, and approximately $20.6 million of deductible goodwill. The $20.6 million of goodwill recorded to our Production Testing segment as a result of the ERS acquisition is supported by the strategic benefits discussed above to be generated from the acquisition. For the year ended December 31, 2012, our revenues, depreciation and amortization, and income before taxes included $24.6 million, $3.0 million, and $5.4 million, respectively, associated with the acquired operations of ERS after the closing in April 2012. In addition to the above impact on our results of operations, transaction costs associated with the ERS acquisition of approximately $0.5 million were also charged to general and administrative expense during the year ended December 31, 2012. Acquisition of Greywolf
On July 31, 2012, we acquired the assets and operations of Greywolf Production Systems Inc. and GPS Ltd. (together, Greywolf) for a cash purchase price of approximately $55.5 million. Greywolf was a provider of production testing and frac flowback services to oil and gas operators in western Canada and the U.S. Williston Basin (including the Bakken formation) and the Niobrara Shale formation of the U.S. Rocky Mountain region. This acquisition represented an additional strategic geographic expansion of our existing Production Testing segment operations.
We allocated the purchase price to the fair value of the assets acquired, which consisted of approximately $17.7 million of property, plant, and equipment, approximately $3.5 million of certain intangible assets, and approximately $34.3 million of deductible goodwill. The $34.3 million of goodwill recorded to our Production Testing segment as a result of the Greywolf acquisition is supported by the strategic benefits discussed above to be generated from the acquisition. For the year ended December 31, 2012, our revenues, depreciation and amortization, and income before taxes included $17.3 million, $1.0 million, and $1.1 million, respectively, associated with the acquired operations of Greywolf after the closing in July 2012. In addition to the above impact on our results of operations, transaction costs associated with the Greywolf acquisition of approximately $1.0 million were also charged to general and administrative expense during the year ended December 31, 2012. Pro Forma Financial Information (Unaudited)
The pro forma information presented below has been prepared to give effect to the acquisition of the remaining 50% ownership interest of TETRA Arabia and the acquisition of CSI as if each of the transactions had occurred at the beginning of the periods presented. The pro forma information includes the impact from the allocation of the acquisition purchase price for each acquisition on depreciation and amortization. The pro forma information also excludes the impact of the remeasurement gain and charge to earnings recorded in connection with the acquisition of the remaining 50% interest in TETRA Arabia as well as the CSI acquisition and financing
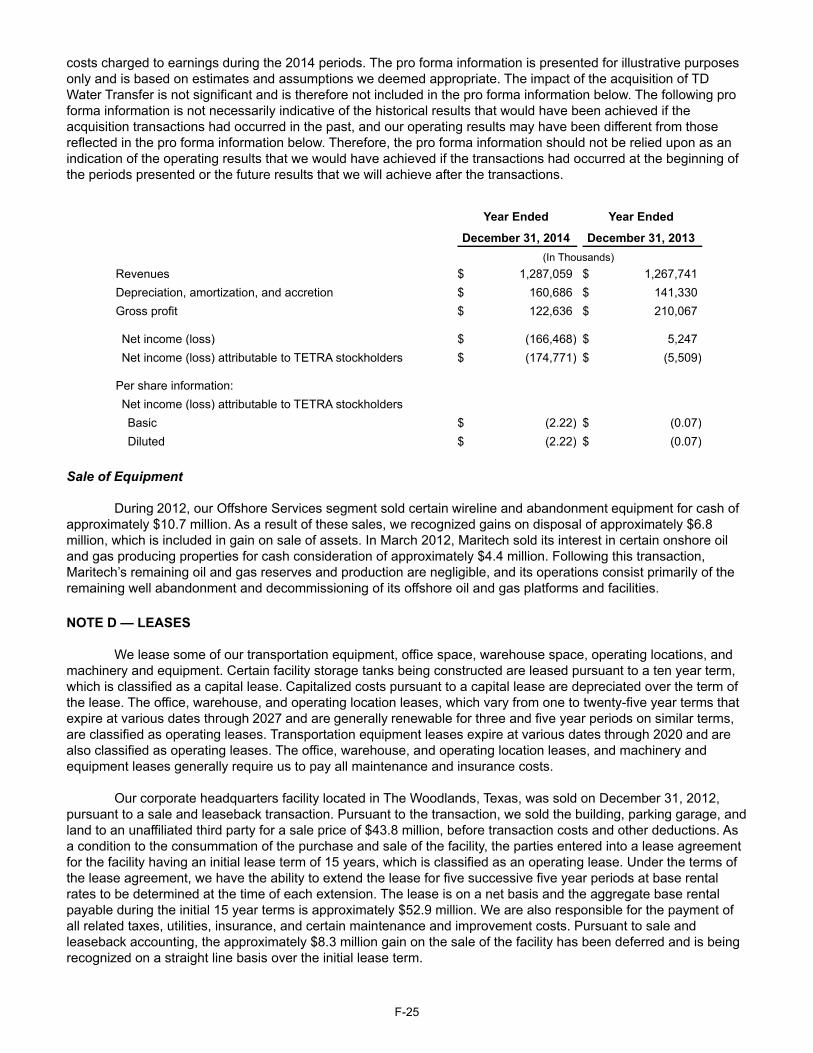
F-25
costs charged to earnings during the 2014 periods. The pro forma information is presented for illustrative purposes only and is based on estimates and assumptions we deemed appropriate. The impact of the acquisition of TD Water Transfer is not significant and is therefore not included in the pro forma information below. The following pro forma information is not necessarily indicative of the historical results that would have been achieved if the acquisition transactions had occurred in the past, and our operating results may have been different from those reflected in the pro forma information below. Therefore, the pro forma information should not be relied upon as an indication of the operating results that we would have achieved if the transactions had occurred at the beginning of the periods presented or the future results that we will achieve after the transactions.
Year Ended Year Ended December 31, 2014 December 31, 2013 (In Thousands) Revenues $ 1,287,059 $ 1,267,741Depreciation, amortization, and accretion $ 160,686 $ 141,330Gross profit $ 122,636 $ 210,067
Net income (loss) $ (166,468) $ 5,247Net income (loss) attributable to TETRA stockholders $ (174,771) $ (5,509)
Per share information: Net income (loss) attributable to TETRA stockholders Basic $ (2.22) $ (0.07)Diluted $ (2.22) $ (0.07)
Sale of Equipment
During 2012, our Offshore Services segment sold certain wireline and abandonment equipment for cash of
approximately $10.7 million. As a result of these sales, we recognized gains on disposal of approximately $6.8 million, which is included in gain on sale of assets. In March 2012, Maritech sold its interest in certain onshore oil and gas producing properties for cash consideration of approximately $4.4 million. Following this transaction, Maritech’s remaining oil and gas reserves and production are negligible, and its operations consist primarily of the remaining well abandonment and decommissioning of its offshore oil and gas platforms and facilities.
NOTE D — LEASES We lease some of our transportation equipment, office space, warehouse space, operating locations, and
machinery and equipment. Certain facility storage tanks being constructed are leased pursuant to a ten year term, which is classified as a capital lease. Capitalized costs pursuant to a capital lease are depreciated over the term of the lease. The office, warehouse, and operating location leases, which vary from one to twenty-five year terms that expire at various dates through 2027 and are generally renewable for three and five year periods on similar terms, are classified as operating leases. Transportation equipment leases expire at various dates through 2020 and are also classified as operating leases. The office, warehouse, and operating location leases, and machinery and equipment leases generally require us to pay all maintenance and insurance costs.
Our corporate headquarters facility located in The Woodlands, Texas, was sold on December 31, 2012,
pursuant to a sale and leaseback transaction. Pursuant to the transaction, we sold the building, parking garage, and land to an unaffiliated third party for a sale price of $43.8 million, before transaction costs and other deductions. As a condition to the consummation of the purchase and sale of the facility, the parties entered into a lease agreement for the facility having an initial lease term of 15 years, which is classified as an operating lease. Under the terms of the lease agreement, we have the ability to extend the lease for five successive five year periods at base rental rates to be determined at the time of each extension. The lease is on a net basis and the aggregate base rental payable during the initial 15 year terms is approximately $52.9 million. We are also responsible for the payment of all related taxes, utilities, insurance, and certain maintenance and improvement costs. Pursuant to sale and leaseback accounting, the approximately $8.3 million gain on the sale of the facility has been deferred and is being recognized on a straight line basis over the initial lease term.
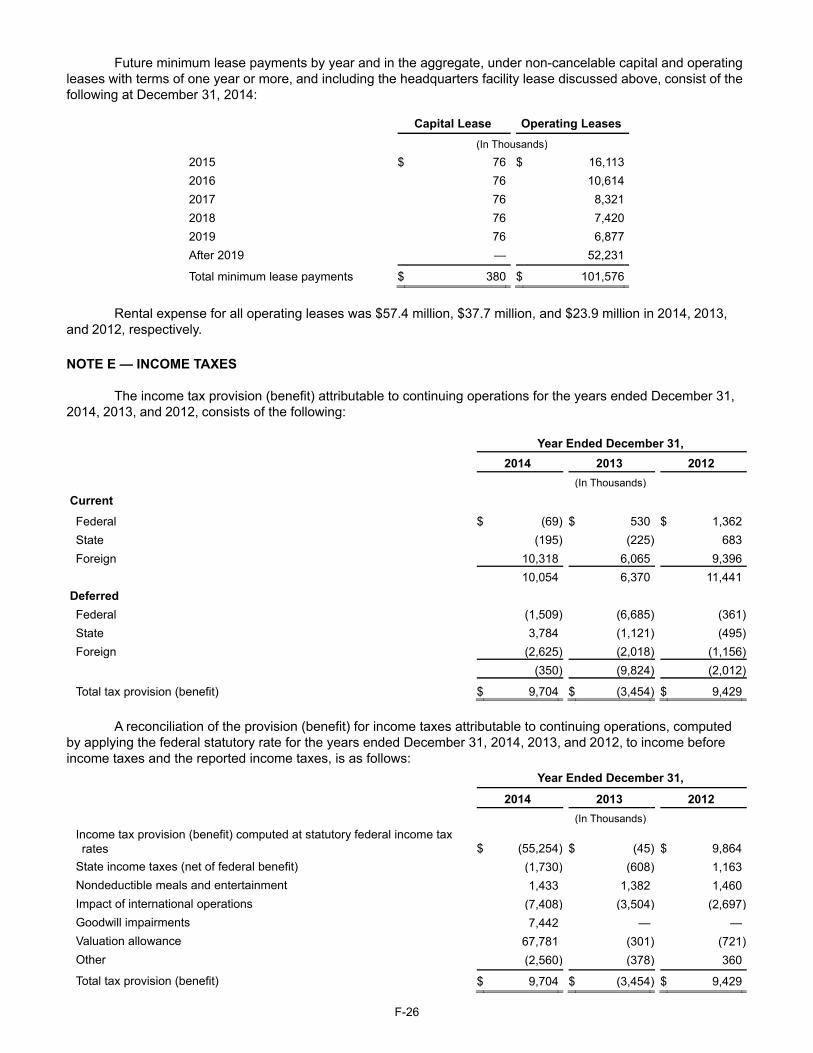
F-26
Future minimum lease payments by year and in the aggregate, under non-cancelable capital and operating leases with terms of one year or more, and including the headquarters facility lease discussed above, consist of the following at December 31, 2014:
Capital Lease Operating Leases (In Thousands)
2015 $ 76 $ 16,113
2016 76 10,614
2017 76 8,321
2018 76 7,420
2019 76 6,877
After 2019 — 52,231
Total minimum lease payments $ 380 $ 101,576
Rental expense for all operating leases was $57.4 million, $37.7 million, and $23.9 million in 2014, 2013,
and 2012, respectively.
NOTE E — INCOME TAXES The income tax provision (benefit) attributable to continuing operations for the years ended December 31,
2014, 2013, and 2012, consists of the following:
Year Ended December 31, 2014 2013 2012 (In Thousands)
Current Federal $ (69) $ 530 $ 1,362State (195) (225) 683Foreign 10,318 6,065 9,396
10,054 6,370 11,441Deferred Federal (1,509) (6,685) (361)State 3,784 (1,121) (495)Foreign (2,625) (2,018) (1,156)
(350) (9,824) (2,012)
Total tax provision (benefit) $ 9,704 $ (3,454) $ 9,429
A reconciliation of the provision (benefit) for income taxes attributable to continuing operations, computed by applying the federal statutory rate for the years ended December 31, 2014, 2013, and 2012, to income before income taxes and the reported income taxes, is as follows: Year Ended December 31, 2014 2013 2012 (In Thousands) Income tax provision (benefit) computed at statutory federal income tax rates $ (55,254) $ (45) $ 9,864
State income taxes (net of federal benefit) (1,730) (608) 1,163Nondeductible meals and entertainment 1,433 1,382 1,460Impact of international operations (7,408) (3,504) (2,697)Goodwill impairments 7,442 — —Valuation allowance 67,781 (301) (721)Other (2,560) (378) 360
Total tax provision (benefit) $ 9,704 $ (3,454) $ 9,429
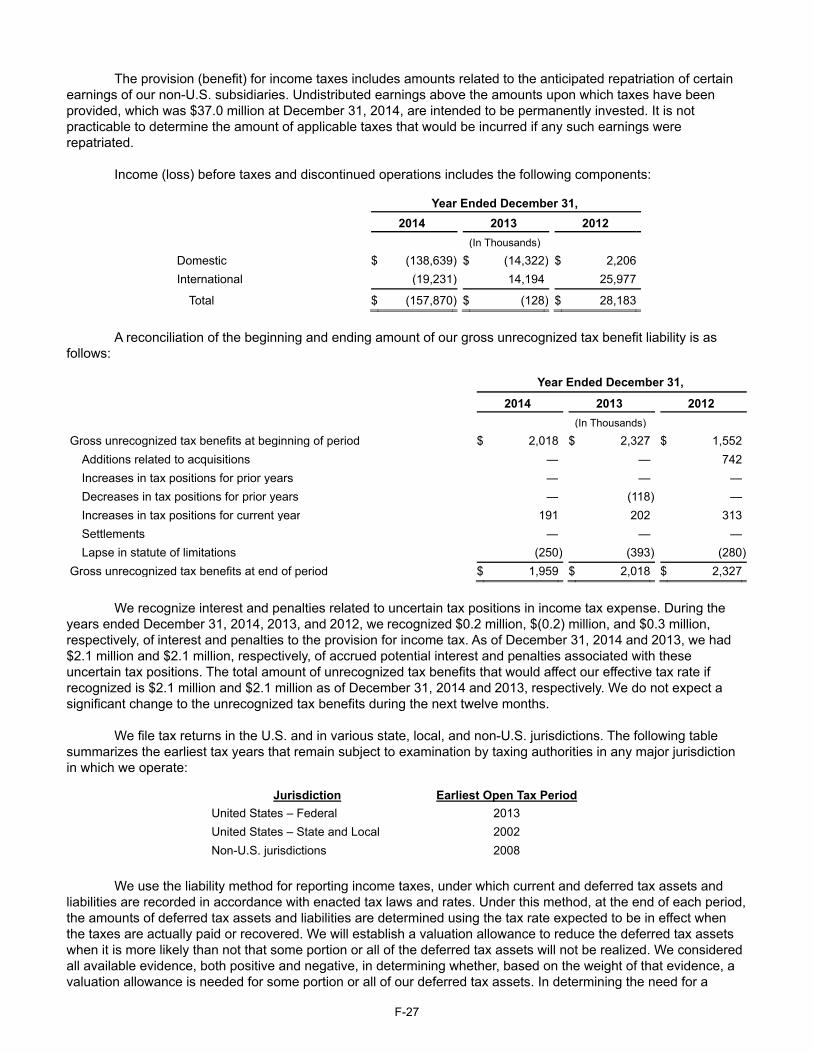
F-27
The provision (benefit) for income taxes includes amounts related to the anticipated repatriation of certain
earnings of our non-U.S. subsidiaries. Undistributed earnings above the amounts upon which taxes have been provided, which was $37.0 million at December 31, 2014, are intended to be permanently invested. It is not practicable to determine the amount of applicable taxes that would be incurred if any such earnings were repatriated.
Income (loss) before taxes and discontinued operations includes the following components:
Year Ended December 31, 2014 2013 2012
(In Thousands)
Domestic $ (138,639) $ (14,322) $ 2,206
International (19,231) 14,194 25,977
Total $ (157,870) $ (128) $ 28,183
A reconciliation of the beginning and ending amount of our gross unrecognized tax benefit liability is as
follows:
Year Ended December 31, 2014 2013 2012 (In Thousands)
Gross unrecognized tax benefits at beginning of period $ 2,018 $ 2,327 $ 1,552Additions related to acquisitions — — 742Increases in tax positions for prior years — — —Decreases in tax positions for prior years — (118) —Increases in tax positions for current year 191 202 313Settlements — — —Lapse in statute of limitations (250) (393) (280)
Gross unrecognized tax benefits at end of period $ 1,959 $ 2,018 $ 2,327
We recognize interest and penalties related to uncertain tax positions in income tax expense. During the
years ended December 31, 2014, 2013, and 2012, we recognized $0.2 million, $(0.2) million, and $0.3 million, respectively, of interest and penalties to the provision for income tax. As of December 31, 2014 and 2013, we had $2.1 million and $2.1 million, respectively, of accrued potential interest and penalties associated with these uncertain tax positions. The total amount of unrecognized tax benefits that would affect our effective tax rate if recognized is $2.1 million and $2.1 million as of December 31, 2014 and 2013, respectively. We do not expect a significant change to the unrecognized tax benefits during the next twelve months.
We file tax returns in the U.S. and in various state, local, and non-U.S. jurisdictions. The following table
summarizes the earliest tax years that remain subject to examination by taxing authorities in any major jurisdiction in which we operate:
Jurisdiction Earliest Open Tax Period United States – Federal 2013 United States – State and Local 2002 Non-U.S. jurisdictions 2008
We use the liability method for reporting income taxes, under which current and deferred tax assets and
liabilities are recorded in accordance with enacted tax laws and rates. Under this method, at the end of each period, the amounts of deferred tax assets and liabilities are determined using the tax rate expected to be in effect when the taxes are actually paid or recovered. We will establish a valuation allowance to reduce the deferred tax assets when it is more likely than not that some portion or all of the deferred tax assets will not be realized. We considered all available evidence, both positive and negative, in determining whether, based on the weight of that evidence, a valuation allowance is needed for some portion or all of our deferred tax assets. In determining the need for a
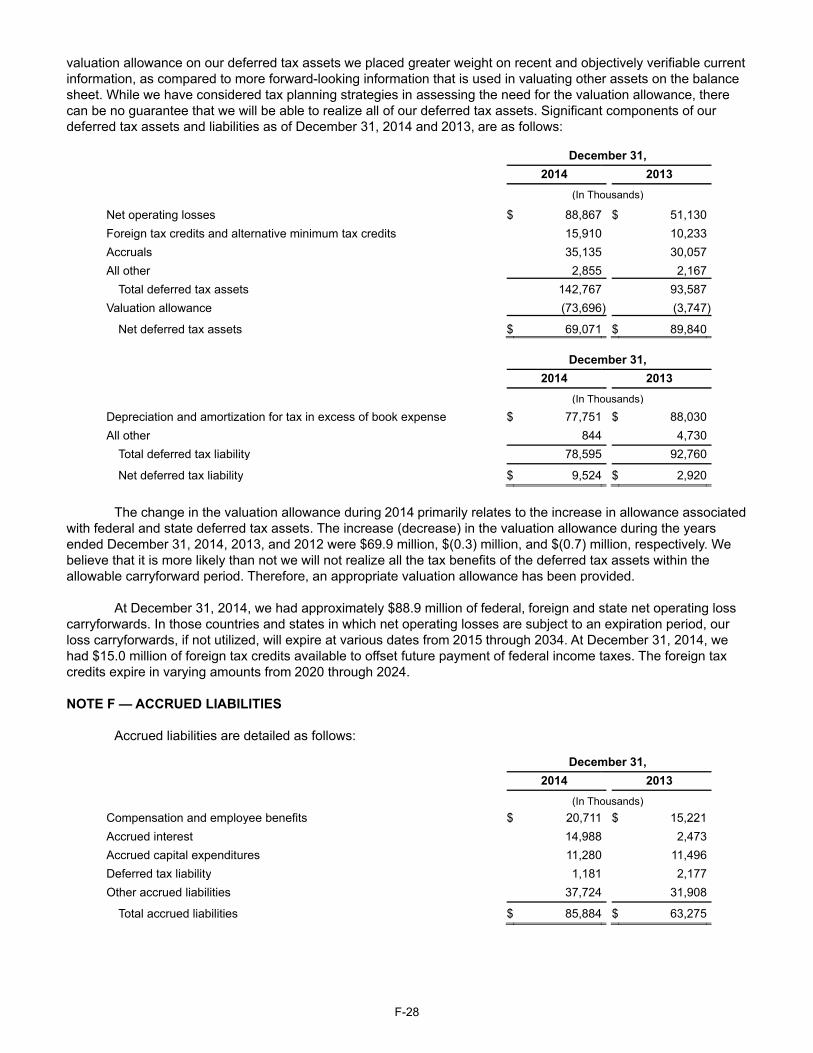
F-28
valuation allowance on our deferred tax assets we placed greater weight on recent and objectively verifiable current information, as compared to more forward-looking information that is used in valuating other assets on the balance sheet. While we have considered tax planning strategies in assessing the need for the valuation allowance, there can be no guarantee that we will be able to realize all of our deferred tax assets. Significant components of our deferred tax assets and liabilities as of December 31, 2014 and 2013, are as follows:
December 31, 2014 2013 (In Thousands)
Net operating losses $ 88,867 $ 51,130Foreign tax credits and alternative minimum tax credits 15,910 10,233Accruals 35,135 30,057All other 2,855 2,167
Total deferred tax assets 142,767 93,587Valuation allowance (73,696) (3,747)
Net deferred tax assets $ 69,071 $ 89,840
December 31, 2014 2013 (In Thousands)
Depreciation and amortization for tax in excess of book expense $ 77,751 $ 88,030All other 844 4,730
Total deferred tax liability 78,595 92,760
Net deferred tax liability $ 9,524 $ 2,920
The change in the valuation allowance during 2014 primarily relates to the increase in allowance associated
with federal and state deferred tax assets. The increase (decrease) in the valuation allowance during the years ended December 31, 2014, 2013, and 2012 were $69.9 million, $(0.3) million, and $(0.7) million, respectively. We believe that it is more likely than not we will not realize all the tax benefits of the deferred tax assets within the allowable carryforward period. Therefore, an appropriate valuation allowance has been provided.
At December 31, 2014, we had approximately $88.9 million of federal, foreign and state net operating loss
carryforwards. In those countries and states in which net operating losses are subject to an expiration period, our loss carryforwards, if not utilized, will expire at various dates from 2015 through 2034. At December 31, 2014, we had $15.0 million of foreign tax credits available to offset future payment of federal income taxes. The foreign tax credits expire in varying amounts from 2020 through 2024. NOTE F — ACCRUED LIABILITIES
Accrued liabilities are detailed as follows:
December 31, 2014 2013 (In Thousands) Compensation and employee benefits $ 20,711 $ 15,221Accrued interest 14,988 2,473Accrued capital expenditures 11,280 11,496Deferred tax liability 1,181 2,177Other accrued liabilities 37,724 31,908
Total accrued liabilities $ 85,884 $ 63,275
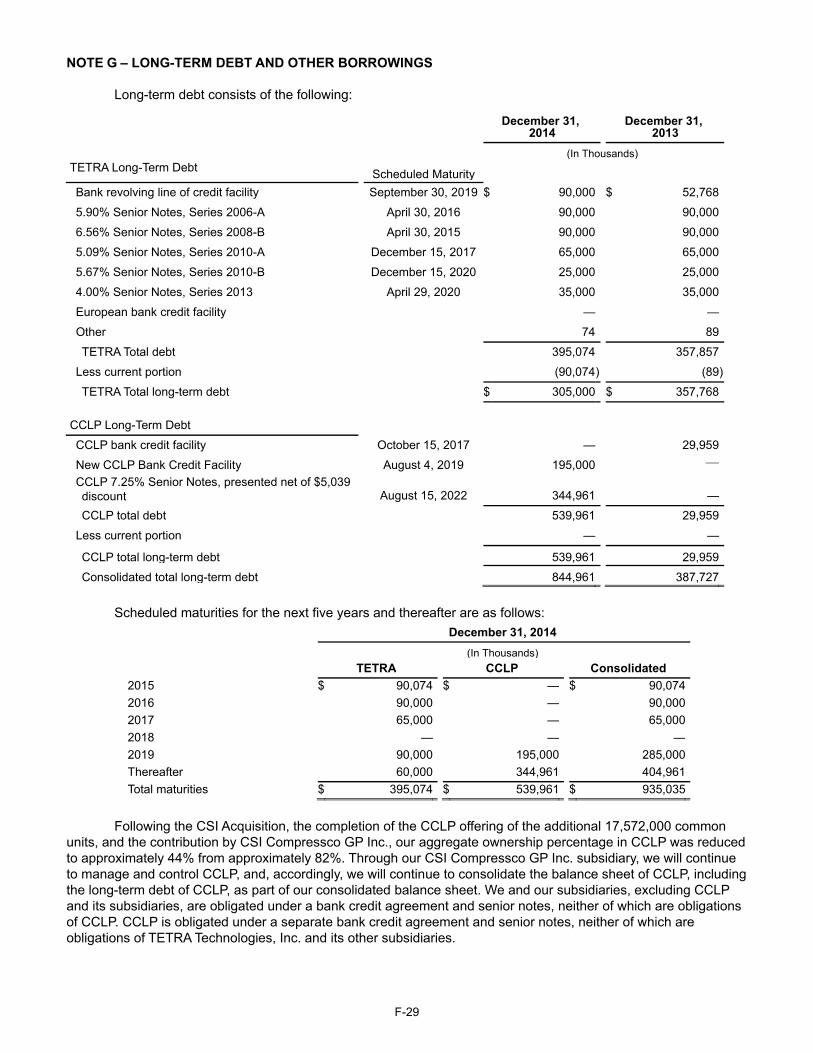
F-29
NOTE G – LONG-TERM DEBT AND OTHER BORROWINGS Long-term debt consists of the following:
December 31,
2014 December 31,
2013 (In Thousands) TETRA Long-Term Debt Scheduled Maturity Bank revolving line of credit facility September 30, 2019 $ 90,000 $ 52,768
5.90% Senior Notes, Series 2006-A April 30, 2016 90,000 90,000
6.56% Senior Notes, Series 2008-B April 30, 2015 90,000 90,000
5.09% Senior Notes, Series 2010-A December 15, 2017 65,000 65,000
5.67% Senior Notes, Series 2010-B December 15, 2020 25,000 25,000
4.00% Senior Notes, Series 2013 April 29, 2020 35,000 35,000
European bank credit facility — —
Other 74 89
TETRA Total debt 395,074 357,857
Less current portion (90,074 ) (89)
TETRA Total long-term debt $ 305,000 $ 357,768 CCLP Long-Term Debt CCLP bank credit facility October 15, 2017 — 29,959
New CCLP Bank Credit Facility August 4, 2019 195,000 —CCLP 7.25% Senior Notes, presented net of $5,039 discount August 15, 2022 344,961
—
CCLP total debt 539,961 29,959
Less current portion — —
CCLP total long-term debt 539,961 29,959
Consolidated total long-term debt 844,961 387,727
Scheduled maturities for the next five years and thereafter are as follows:
December 31, 2014 (In Thousands) TETRA CCLP Consolidated2015 $ 90,074 $ — $ 90,0742016 90,000 — 90,0002017 65,000 — 65,0002018 — — —2019 90,000 195,000 285,000Thereafter 60,000 344,961 404,961Total maturities $ 395,074 $ 539,961 $ 935,035
Following the CSI Acquisition, the completion of the CCLP offering of the additional 17,572,000 common units, and the contribution by CSI Compressco GP Inc., our aggregate ownership percentage in CCLP was reduced to approximately 44% from approximately 82%. Through our CSI Compressco GP Inc. subsidiary, we will continue to manage and control CCLP, and, accordingly, we will continue to consolidate the balance sheet of CCLP, including the long-term debt of CCLP, as part of our consolidated balance sheet. We and our subsidiaries, excluding CCLP and its subsidiaries, are obligated under a bank credit agreement and senior notes, neither of which are obligations of CCLP. CCLP is obligated under a separate bank credit agreement and senior notes, neither of which are obligations of TETRA Technologies, Inc. and its other subsidiaries.
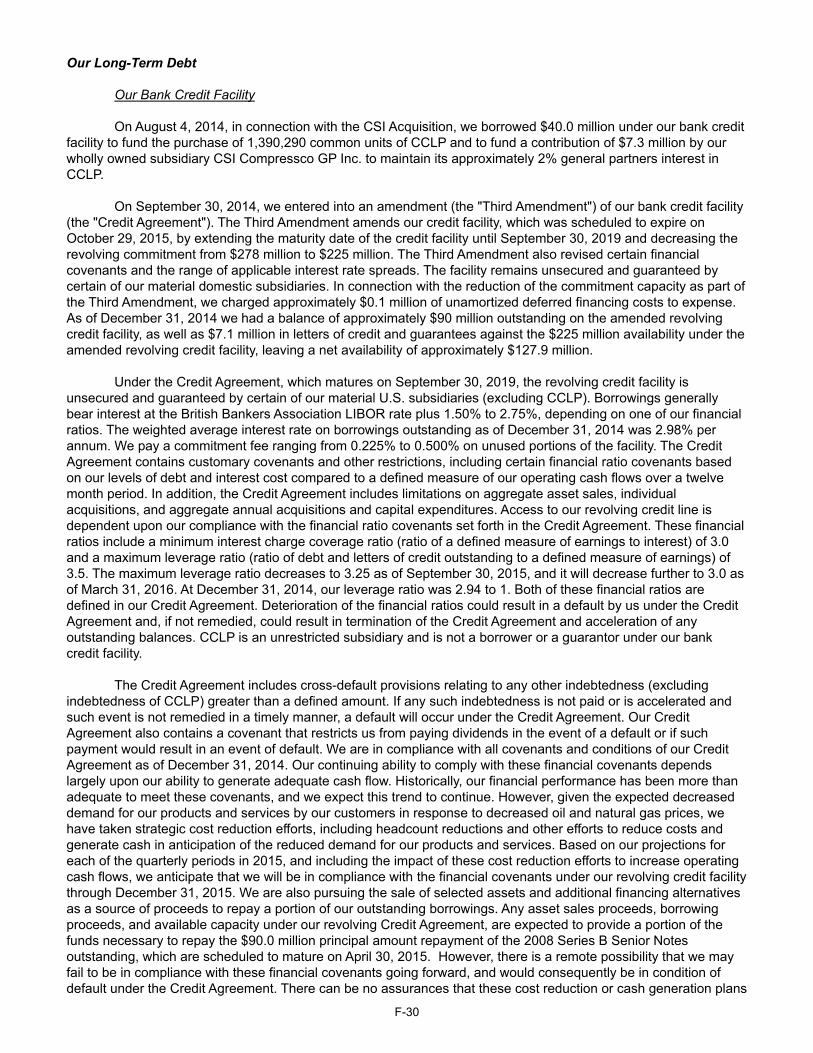
F-30
Our Long-Term Debt Our Bank Credit Facility
On August 4, 2014, in connection with the CSI Acquisition, we borrowed $40.0 million under our bank credit facility to fund the purchase of 1,390,290 common units of CCLP and to fund a contribution of $7.3 million by our wholly owned subsidiary CSI Compressco GP Inc. to maintain its approximately 2% general partners interest in CCLP. On September 30, 2014, we entered into an amendment (the "Third Amendment") of our bank credit facility (the "Credit Agreement"). The Third Amendment amends our credit facility, which was scheduled to expire on October 29, 2015, by extending the maturity date of the credit facility until September 30, 2019 and decreasing the revolving commitment from $278 million to $225 million. The Third Amendment also revised certain financial covenants and the range of applicable interest rate spreads. The facility remains unsecured and guaranteed by certain of our material domestic subsidiaries. In connection with the reduction of the commitment capacity as part of the Third Amendment, we charged approximately $0.1 million of unamortized deferred financing costs to expense. As of December 31, 2014 we had a balance of approximately $90 million outstanding on the amended revolving credit facility, as well as $7.1 million in letters of credit and guarantees against the $225 million availability under the amended revolving credit facility, leaving a net availability of approximately $127.9 million. Under the Credit Agreement, which matures on September 30, 2019, the revolving credit facility is unsecured and guaranteed by certain of our material U.S. subsidiaries (excluding CCLP). Borrowings generally bear interest at the British Bankers Association LIBOR rate plus 1.50% to 2.75%, depending on one of our financial ratios. The weighted average interest rate on borrowings outstanding as of December 31, 2014 was 2.98% per annum. We pay a commitment fee ranging from 0.225% to 0.500% on unused portions of the facility. The Credit Agreement contains customary covenants and other restrictions, including certain financial ratio covenants based on our levels of debt and interest cost compared to a defined measure of our operating cash flows over a twelve month period. In addition, the Credit Agreement includes limitations on aggregate asset sales, individual acquisitions, and aggregate annual acquisitions and capital expenditures. Access to our revolving credit line is dependent upon our compliance with the financial ratio covenants set forth in the Credit Agreement. These financial ratios include a minimum interest charge coverage ratio (ratio of a defined measure of earnings to interest) of 3.0 and a maximum leverage ratio (ratio of debt and letters of credit outstanding to a defined measure of earnings) of 3.5. The maximum leverage ratio decreases to 3.25 as of September 30, 2015, and it will decrease further to 3.0 as of March 31, 2016. At December 31, 2014, our leverage ratio was 2.94 to 1. Both of these financial ratios are defined in our Credit Agreement. Deterioration of the financial ratios could result in a default by us under the Credit Agreement and, if not remedied, could result in termination of the Credit Agreement and acceleration of any outstanding balances. CCLP is an unrestricted subsidiary and is not a borrower or a guarantor under our bank credit facility.
The Credit Agreement includes cross-default provisions relating to any other indebtedness (excluding
indebtedness of CCLP) greater than a defined amount. If any such indebtedness is not paid or is accelerated and such event is not remedied in a timely manner, a default will occur under the Credit Agreement. Our Credit Agreement also contains a covenant that restricts us from paying dividends in the event of a default or if such payment would result in an event of default. We are in compliance with all covenants and conditions of our Credit Agreement as of December 31, 2014. Our continuing ability to comply with these financial covenants depends largely upon our ability to generate adequate cash flow. Historically, our financial performance has been more than adequate to meet these covenants, and we expect this trend to continue. However, given the expected decreased demand for our products and services by our customers in response to decreased oil and natural gas prices, we have taken strategic cost reduction efforts, including headcount reductions and other efforts to reduce costs and generate cash in anticipation of the reduced demand for our products and services. Based on our projections for each of the quarterly periods in 2015, and including the impact of these cost reduction efforts to increase operating cash flows, we anticipate that we will be in compliance with the financial covenants under our revolving credit facility through December 31, 2015. We are also pursuing the sale of selected assets and additional financing alternatives as a source of proceeds to repay a portion of our outstanding borrowings. Any asset sales proceeds, borrowing proceeds, and available capacity under our revolving Credit Agreement, are expected to provide a portion of the funds necessary to repay the $90.0 million principal amount repayment of the 2008 Series B Senior Notes outstanding, which are scheduled to mature on April 30, 2015. However, there is a remote possibility that we may fail to be in compliance with these financial covenants going forward, and would consequently be in condition of default under the Credit Agreement. There can be no assurances that these cost reduction or cash generation plans

F-31
will be successful or that market conditions and our operating performance will not be further decreased compared to our projections.
Our European Credit Agreement We also have a bank line of credit agreement covering the day to day working capital needs of certain of
our European operations (the "European Credit Agreement"). The European Credit Agreement provides borrowing capacity of up to 5 million euros (approximately $6.1 million equivalent as of December 31, 2014), with interest computed on any outstanding borrowings at a rate equal to the lender’s Basis Rate plus 0.75%. The European Credit Agreement is cancellable by either party with 14 business days' notice and contains standard provisions in the event of default. As of December 31, 2014, we had no borrowings pursuant to the European Credit Agreement.
Our Senior Notes In April 2013, we issued $35.0 million in aggregate principal amount of Series 2013 Senior Notes pursuant
to a Note Purchase Agreement dated April 29, 2013. The Series 2013 Senior Notes bear interest at a fixed rate of 4.0% and mature on April 29, 2020. Interest on the Series 2013 Senior Notes is due semiannually on April 29 and October 29 of each year.
Each of the Senior Notes was sold in the United States to accredited investors pursuant to an exemption
from the Securities Act of 1933. We may prepay the Senior Notes, in whole or in part, at any time at a price equal to 100% of the principal amount outstanding, plus accrued and unpaid interest and a “make-whole” prepayment premium. The Senior Notes are unsecured and are guaranteed by substantially all of our wholly owned U.S. subsidiaries. The Note Purchase Agreements and the Master Note Purchase Agreement, as supplemented, contain customary covenants and restrictions and require us to maintain certain financial ratios, including a minimum level of net worth and a ratio between our long-term debt balance and a defined measure of operating cash flow over a twelve month period. These financial ratios include a maximum leverage ratio (ratio of debt and letters of credit outstanding to a defined measure of earnings) of 3.5. Consolidated net earnings under the Note Purchase Agreements and Master Note Purchase Agreement is the aggregate of our net income (or loss) and our consolidated restricted subsidiaries, including cash dividends and distributions (not the return of capital) received from persons other than consolidated restricted subsidiaries (such as CCLP) and after allowances for taxes for such period determined on a consolidated basis in accordance with GAAP, excluding certain items more specifically described therein. Under these note purchase agreements, the financial ratio requirements include a minimum interest coverage ratio of 2.5 and a maximum leverage ratio of 3.5. At December 31, 2014, our leverage ratio was 2.94 to 1.
Both the minimum net worth and the maximum leverage ratio are further defined in our Note Purchase
Agreements and Master Note Purchase Agreement. Deterioration of the financial ratios could result in a default by us under the Note Purchase Agreements and Master Note Purchase Agreement and, if not remedied, could result in termination of the Note Purchase Agreements and Master Note Purchase Agreement and acceleration of any outstanding balances. CCLP is an unrestricted subsidiary and is not a borrower or a guarantor under our Note Purchase Agreements and Master Note Purchase Agreement.
The Note Purchase Agreements and the Master Note Purchase Agreement also contain customary default
provisions as well as a cross-default provision relating to any other of our indebtedness of $20.0 million or more. We are in compliance with all covenants and conditions of the Note Purchase Agreements and the Master Note Purchase Agreement as of December 31, 2014. Our continuing ability to comply with these financial covenants depends largely upon our ability to generate adequate cash flow. Historically, our financial performance has been more than adequate to meet these covenants, and we expect this trend to continue. However, given the expected decreased demand by for our products and services our customers in response to decreased oil and natural gas prices, we are taking strategic cost reduction efforts, including headcount reductions, salary cost reductions, and other efforts to reduce costs and generate cash in anticipation of the reduced demand for our products and services. Based on our projections for each of the quarterly periods in 2015, and including the impact of these cost reduction efforts to increase operating cash flows, we anticipate that we will be in compliance with the financial covenants under our Note Purchase Agreements and Master Note Purchase Agreement through December 31, 2015. We are also pursuing the sale of selected assets and additional financing alternatives as a source of proceeds to repay a portion of our outstanding borrowings. Any asset sales proceeds, borrowing proceeds, and available capacity under our revolving Credit Agreement are expected to provide resources to repay the $90.0 million of 2008 Series B Senior Notes outstanding, which are scheduled to mature on April 30, 2015. However,
F-32
there is a remote possibility that we may fail to be in compliance with these financial covenants in a future period, and would consequently be in condition of default under our Note Purchase Agreements and Master Note Purchase Agreement. There can be no assurances that these cost reduction or cash generation plans will be successful, or that market conditions and our operating performance will not be further decreased compared to our projections. Upon the occurrence and during the continuation of an event of default under the Note Purchase Agreements and the Master Note Purchase Agreements, as supplemented, the Senior Notes may become immediately due and payable, either automatically or by declaration of holders of more than 50% in principal amount of the Senior Notes outstanding at the time.
Secured Note Purchase Commitment In February 2015, we entered into a commitment letter agreement for the sale of $50.0 million aggregate
principal amount of senior secured notes to be issued in April 2015. The proceeds from these notes are expected to provide a portion of the funds necessary to repay the $90.0 million principal amount repayment of the Series 2008-B Senior Notes that mature in April 2015. The notes would be secured by our accounts receivable (excluding CCLP accounts receivable) and our limited partner interest in CCLP, would mature on April 1, 2017, and would include financial covenants consistent with our existing bank revolving credit facility. Closing of the sale and issuance of the notes is subject to the execution of a definitive note purchase agreement and customary conditions.
CCLP Long-Term Debt CCLP Bank Credit Facility
On October 15, 2013, CCLP entered into an asset-based revolving credit facility with a syndicate of lenders including JPMorgan Chase Bank, N.A. as administrative agent (the "CCLP Credit Agreement"). Under the CCLP Credit Agreement, CCLP, along with certain of its subsidiaries, were named as borrowers, and all obligations under the credit agreement were guaranteed by all of its existing and future, direct and indirect, domestic subsidiaries. We were not a borrower or a guarantor under the CCLP Credit Agreement. The CCLP Credit Agreement included a maximum credit commitment of $100.0 million that was available for letters of credit (with a sublimit of $20.0 million) and included an uncommitted $30.0 million expansion feature. On August 4, 2014, in connection with the CSI Acquisition, CCLP entered into a new credit agreement (the "New CCLP Credit Agreement"), and it borrowed $210.0 million, which was used to fund, in part, CCLP's $825.0 million CSI Acquisition purchase price. In addition, the New CCLP Credit Agreement borrowings were used to pay fees and expenses related to the CSI Acquisition, the CCLP Senior Notes offering, and the New CCLP Credit Agreement, and to repay the $38.1 million balance outstanding under the previous CCLP Credit Agreement, which was then terminated. As a result, approximately $0.8 million of unamortized deferred financing costs associated with that terminated CCLP Credit Agreement was charged to earnings and reflected in other expense during 2014. Under the New CCLP Credit Agreement, CCLP and CSI Compressco Sub Inc. were named as the borrowers, and all obligations under the New CCLP Credit Agreement are guaranteed by all of CCLP's existing and future, direct and indirect, domestic restricted subsidiaries, other than domestic subsidiaries that are wholly owned by foreign subsidiaries. We are not a borrower or a guarantor under the New CCLP Credit Agreement. The New CCLP Credit Agreement includes a maximum credit commitment of $400.0 million, and included within such amount is availability for letters of credit (with a sublimit of $20.0 million) and swingline loans (with a sublimit of $60.0 million). During the year ended December 31, 2014, CCLP incurred financing costs of approximately $7.3 million related to the New CCLP Credit Agreement. These costs are included in Other Assets and are being amortized over the term of the New CCLP Credit Agreement. As of December 31, 2014, CCLP had a balance outstanding of $195.0 million, had approximately $7.1 million letters of credit and performance bonds, and had availability under the New CCLP Credit Agreement of approximately $197.9 million. On August 11, 2014, the underwriters exercised their option and purchased 2,292,000 additional common units for the Offering Price of $23.50 per common unit resulting in additional net proceeds of $51.7 million ($53.9 million gross proceeds less underwriting discount). Following the receipt of proceeds from this option exercise, a portion of the outstanding balance under the New CCLP Credit Agreement was repaid. The New CCLP Credit Agreement is available to provide CCLP's working capital needs, letters of credit, and for general partnership purposes, including capital expenditures and potential future expansions or acquisitions. So long as CCLP is not in default thereunder, the New CCLP Credit Agreement can also be used to fund CCLP’s quarterly distributions at the option of the board of directors of CCLP's general partner (provided, that after giving

F-33
effect to such distributions, the borrowers will be in compliance with the financial covenants). Borrowings under the New CCLP Credit Agreement are subject to the satisfaction of customary conditions, including the absence of a default. The maturity date of the New CCLP Credit Agreement is August 4, 2019. Borrowings under the New CCLP Credit Agreement bear interest at a rate per annum equal to, at CCLP's option, either (a) LIBOR (adjusted to reflect any required bank reserves) for an interest period equal to one, two, three, or six months (as selected by CCLP), plus a leverage-based margin or (b) a base rate plus a leverage-based margin; such base rate shall be determined by reference to the highest of (1) the prime rate of interest per annum announced from time to time by Bank of America, N.A. (2) the Federal Funds rate plus 0.50% per annum and (3) LIBOR (adjusted to reflect any required bank reserves) for a one month interest period on such day plus 1.00% per annum. Initially, from the closing date until the delivery of the financial statements for the first full fiscal quarter after closing, LIBOR based loans will have an applicable margin of 2.75% per annum, and base rate loans will have an applicable margin of 1.75% per annum; thereafter, the applicable margin will range between 1.75% and 2.50% per annum for LIBOR based loans and 0.75% and 1.50% per annum for base rate loans based on CCLP's consolidated total leverage ratio when financial statements are delivered. In addition to paying interest on outstanding principal under the New CCLP Credit Agreement, CCLP is required to pay a commitment fee in respect of the unutilized commitments thereunder initially at the rate of 0.50% per annum until the delivery of the financial statements for the first full quarter after the closing date and thereafter at the applicable rate ranging from 0.375% to 0.50% per annum, paid quarterly in arrears based on CCLP's consolidated total leverage ratio. CCLP is also required to pay a customary letter of credit fee equal to the applicable margin on revolving credit LIBOR loans, fronting fees and other fees, agreed to with the administrative agent and lenders.
The New CCLP Credit Agreement requires CCLP to maintain (i) a minimum consolidated interest coverage ratio (ratio of consolidated earnings before interest, taxes, depreciation, and amortization ("EBITDA") to consolidated interest charges) of 3.0 to 1.0, (ii) a maximum consolidated total leverage ratio (ratio of consolidated total indebtedness to consolidated EBITDA) of 5.5 to 1.0 (with step downs to 5.0 to 1.0), and (iii) a maximum consolidated secured leverage ratio (consolidated secured indebtedness to consolidated EBITDA) of 4.0 to 1.0, in each case, as of the last day of each fiscal quarter, calculated on a trailing four quarters basis. In addition, the New CCLP Credit Agreement includes customary negative covenants that, among other things, limit CCLP's ability to incur additional debt, incur, or permit certain liens to exist, or make certain loans, investments, acquisitions, or other restricted payments. The New CCLP Credit Agreement provides that CCLP can make distributions to holders of its common and subordinated units, but only if there is no default or event of default under the facility. CCLP is in compliance with all covenants and conditions of the New CCLP Credit Agreement as of December 31, 2014.
All obligations under the New CCLP Credit Agreement and the guarantees of those obligations are secured,
subject to certain exceptions, by a first lien security interest in substantially all of CCLP's assets and the assets of its existing and future domestic subsidiaries, and all of the capital stock of its existing and future subsidiaries (limited in the case of foreign subsidiaries, to 65% of the voting stock of first tier foreign subsidiaries).
CCLP 7.25% Senior Notes
On July 29, 2014, CCLP, CSI Compressco Finance Inc., a Delaware corporation and an indirect wholly owned subsidiary of CCLP ("CSI Compressco Finance" and, together with CCLP, the "Issuers"), and the guarantors named therein (the "Guarantors" and, together with the Issuers, the "Obligors"), entered into the Note Purchase Agreement (the Note Purchase Agreement) with Merrill Lynch, Pierce, Fenner & Smith Incorporated on behalf of the initial purchasers named therein (collectively, the "Initial Purchasers") related to the issuance and sale by the Issuers to the Initial Purchasers of $350.0 million aggregate principal amount of the Issuers’ 7.25% Senior Notes due 2022 (the "CCLP Senior Notes") in a private offering (the "Offering") exempt from the registration requirements under the Securities Act of 1933, as amended (the "Securities Act"). The Note Purchase Agreement contains customary representations and warranties of the parties thereto and indemnification and contribution provisions under which the Obligors, on one hand, and the Initial Purchasers, on the other, have agreed to indemnify each other against certain liabilities, including liabilities under the Securities Act.
The Issuers closed the Offering on August 4, 2014. Their obligations under the CCLP Senior Notes are
jointly and severally, and fully and unconditionally, guaranteed on a senior unsecured basis initially by each of CCLP’s domestic restricted subsidiaries (other than CSI Compressco Finance) that guarantee CCLP’s other indebtedness. The CCLP Senior Notes and the subsidiary guarantees thereof (together, the "CCLP Securities") were issued pursuant to an indenture described below.

F-34
CCLP used the net proceeds of the Offering of approximately $337.8 million (consisting of $350.0 million aggregate principal amount net of a $5.2 million discount and certain fees and offering expenses) to fund a portion of the $825.0 million cash purchase price for the CSI Acquisition, to pay certain acquisition expenses and to repay a portion of outstanding borrowings under the CCLP’s then existing credit facility. During the year ended December 31, 2014, financing costs of approximately $8.4 million were incurred related to the CCLP Senior Notes. These costs are included in Other Assets and are being amortized over the term of the CCLP Senior Notes. The $5.2 million discount is being amortized using the effective interest method at an interest rate of 7.50% over the term of the CCLP Senior Notes. Approximately $0.2 million of discount amortization expense was recognized during the year ended December 31, 2014.
Pursuant to the Note Purchase Agreement, CSI and any domestic subsidiaries of CSI required to guarantee
the CCLP Senior Notes pursuant to the indenture governing the CCLP Senior Notes were joined as parties to the Note Purchase Agreement pursuant to a purchase agreement joinder, dated August 4, 2014.
The Obligors issued the CCLP Securities pursuant to the Indenture dated as of August 4, 2014 (the
"Indenture") by and among the Obligors and U.S. Bank National Association, as trustee (the "Trustee"). The CCLP Senior Notes accrue interest at a rate of 7.25% per annum. Interest on the CCLP Senior Notes is payable semi-annually in arrears on February 15 and August 15 of each year, beginning February 15, 2015. The CCLP Senior Notes are scheduled to mature on August 15, 2022.
On and after August 15, 2017, CCLP may on one or more occasions redeem the CCLP Senior Notes, in
whole or in part, upon not less than 30-days’ nor more than 60-days’ prior notice, at the following redemption prices (expressed as a percentage of principal amount), plus accrued and unpaid interest and liquidated damages thereon, if any, to the applicable redemption date, subject to the right of holders of record on the relevant record date to receive interest due on the relevant interest payment date, if redeemed during the 12-month period beginning on August 15 of the years indicated below:
Date Price2017 105.438%
2018 103.625%
2019 101.813%
2020 and thereafter 100%
In addition, any time or from time to time before August 15, 2017, CCLP may redeem all or a part of the CCLP Senior Notes at a redemption price equal to 100% of the principal amount of the CCLP Senior Notes redeemed, plus an applicable "make whole" prepayment premium and interest up to the redemption date.
Prior to August 15, 2017, CCLP may, on one or more occasions redeem up to 35% of the principal amount
of the CCLP Senior Notes with an amount of cash not greater than the amount of the net cash proceeds from one or more equity offerings at a redemption price equal to 107.250% of the principal amount of the CCLP Senior Notes to be redeemed, plus accrued and unpaid interest and liquidated damages, if any, to the date of redemption, subject to the right of holders of record on the relevant record date to receive interest due on the relevant interest payment date, as long as (a) at least 65% of the aggregate principal amount of the CCLP Senior Notes originally issued on the issue date (excluding notes held by CCLP and its subsidiaries) remains outstanding after each such redemption; and (b) the redemption occurs within 180 days after the date of the closing of the equity offering.
The Indenture contains customary covenants restricting CCLP’s ability and the ability of its restricted
subsidiaries to: (i) pay dividends and make certain distributions, investments and other restricted payments; (ii) incur additional indebtedness or issue certain preferred shares; (iii) create certain liens; (iv) sell assets; (v) merge, consolidate, sell or otherwise dispose of all or substantially all of its assets; (vi) enter into transactions with affiliates; and (vii) designate its subsidiaries as unrestricted subsidiaries under the Indenture. These covenants are subject to a number of important limitations and exceptions, including certain provisions permitting CCLP, subject to the satisfaction of certain conditions, to transfer assets to certain of its unrestricted subsidiaries. Moreover, if the CCLP Senior Notes receive an investment grade rating from at least two rating agencies and no default has occurred and is continuing under the Indenture, many of the restrictive covenants in the Indenture will be terminated. The Indenture also contains customary events of default and acceleration provisions relating to such events of default, which provide that upon an event of default under the Indenture, the Trustee or the holders of at least 25% in
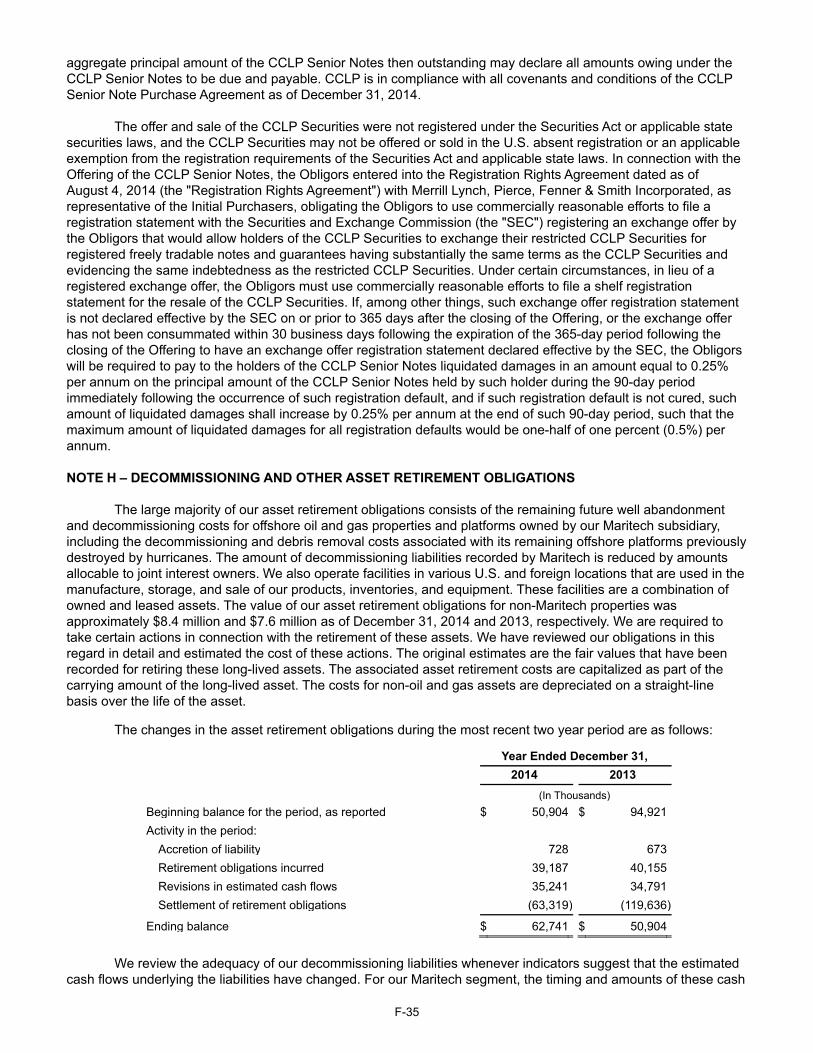
F-35
aggregate principal amount of the CCLP Senior Notes then outstanding may declare all amounts owing under the CCLP Senior Notes to be due and payable. CCLP is in compliance with all covenants and conditions of the CCLP Senior Note Purchase Agreement as of December 31, 2014.
The offer and sale of the CCLP Securities were not registered under the Securities Act or applicable state
securities laws, and the CCLP Securities may not be offered or sold in the U.S. absent registration or an applicable exemption from the registration requirements of the Securities Act and applicable state laws. In connection with the Offering of the CCLP Senior Notes, the Obligors entered into the Registration Rights Agreement dated as of August 4, 2014 (the "Registration Rights Agreement") with Merrill Lynch, Pierce, Fenner & Smith Incorporated, as representative of the Initial Purchasers, obligating the Obligors to use commercially reasonable efforts to file a registration statement with the Securities and Exchange Commission (the "SEC") registering an exchange offer by the Obligors that would allow holders of the CCLP Securities to exchange their restricted CCLP Securities for registered freely tradable notes and guarantees having substantially the same terms as the CCLP Securities and evidencing the same indebtedness as the restricted CCLP Securities. Under certain circumstances, in lieu of a registered exchange offer, the Obligors must use commercially reasonable efforts to file a shelf registration statement for the resale of the CCLP Securities. If, among other things, such exchange offer registration statement is not declared effective by the SEC on or prior to 365 days after the closing of the Offering, or the exchange offer has not been consummated within 30 business days following the expiration of the 365-day period following the closing of the Offering to have an exchange offer registration statement declared effective by the SEC, the Obligors will be required to pay to the holders of the CCLP Senior Notes liquidated damages in an amount equal to 0.25% per annum on the principal amount of the CCLP Senior Notes held by such holder during the 90-day period immediately following the occurrence of such registration default, and if such registration default is not cured, such amount of liquidated damages shall increase by 0.25% per annum at the end of such 90-day period, such that the maximum amount of liquidated damages for all registration defaults would be one-half of one percent (0.5%) per annum.
NOTE H – DECOMMISSIONING AND OTHER ASSET RETIREMENT OBLIGATIONS
The large majority of our asset retirement obligations consists of the remaining future well abandonment
and decommissioning costs for offshore oil and gas properties and platforms owned by our Maritech subsidiary, including the decommissioning and debris removal costs associated with its remaining offshore platforms previously destroyed by hurricanes. The amount of decommissioning liabilities recorded by Maritech is reduced by amounts allocable to joint interest owners. We also operate facilities in various U.S. and foreign locations that are used in the manufacture, storage, and sale of our products, inventories, and equipment. These facilities are a combination of owned and leased assets. The value of our asset retirement obligations for non-Maritech properties was approximately $8.4 million and $7.6 million as of December 31, 2014 and 2013, respectively. We are required to take certain actions in connection with the retirement of these assets. We have reviewed our obligations in this regard in detail and estimated the cost of these actions. The original estimates are the fair values that have been recorded for retiring these long-lived assets. The associated asset retirement costs are capitalized as part of the carrying amount of the long-lived asset. The costs for non-oil and gas assets are depreciated on a straight-line basis over the life of the asset.
The changes in the asset retirement obligations during the most recent two year period are as follows:
Year Ended December 31, 2014 2013 (In Thousands) Beginning balance for the period, as reported $ 50,904 $ 94,921Activity in the period:
Accretion of liability 728 673Retirement obligations incurred 39,187 40,155Revisions in estimated cash flows 35,241 34,791Settlement of retirement obligations (63,319) (119,636)
Ending balance $ 62,741 $ 50,904
We review the adequacy of our decommissioning liabilities whenever indicators suggest that the estimated
cash flows underlying the liabilities have changed. For our Maritech segment, the timing and amounts of these cash
F-36
flows are subject to changes in the energy industry environment and other factors and may result in additional liabilities to be recorded. During 2014 and 2013, we increased the estimated cash flows to decommission these properties by approximately $35.2 million and $34.8 million , respectively, which resulted in approximately $34.0 million and $35.2 million, respectively, of direct charges to expense during these years.
Asset retirement obligations are recorded in accordance with FASB ASC 410, whereby the estimated fair
value of a liability for asset retirement obligations is recorded in the period in which it is incurred and in which a reasonable estimate can be made. Such estimates are based on relevant assumptions that we believe are reasonable. The cost estimates for Maritech asset retirement obligations are considered reasonable estimates consistent with current market conditions, and we believe reflect the amount of work legally obligated to be performed in accordance with Bureau of Safety and Environmental Enforcement (BSEE) standards, as revised from time to time. The amount of work performed or estimated to be performed on a Maritech property asset retirement obligation may often exceed amounts previously estimated for numerous reasons. Property conditions encountered, including subsea, geological, or downhole conditions, may be different from those anticipated at the time of estimation due to the age of the property and the quality of information available about the particular property conditions. Maritech’s remaining oil and gas properties and production platforms were drilled and constructed by other operators many years ago, and frequently there is not a great deal of detailed documentation on which to base the estimated asset retirement obligation for these properties. Appropriate underwater surveys are performed to determine the condition of such properties as part of our due diligence in estimating the costs, but not all conditions have been able to be determined prior to the commencement of the actual work. Certain remaining Maritech properties were damaged by hurricanes in the past, leaving their production platforms leaning or toppled on the seabed and production tubing from the wells (which may be under high pressure) bent under the water. While the basic procedures involved in the plugging and abandonment of wells and decommissioning of platforms and pipelines and removal of debris is generally similar for these properties, the cost of performing work at these damaged locations is particularly difficult to estimate due to the unique conditions encountered, including the uncertainty regarding the extent of physical damage to many of the structures. Maritech has one remaining toppled platform as part of its asset retirement obligation as of December 31, 2014. During the performance of asset retirement activities, unforeseen weather or other conditions may extend the duration and increase the cost of the projects, which are normally not done on a fixed price basis, thereby resulting in costs in excess of the original estimate. In addition, Maritech has encountered situations where previously plugged and abandoned wells on its properties have later exhibited a build-up of pressure, which is evidenced by gas bubbles coming from the plugged well head. We refer to this situation as “wells under pressure” and this can either be discovered when performing additional work at the property or by notification from a third party. Wells under pressure require Maritech to return to the site to perform additional plug and abandonment procedures that were not originally anticipated and included in the estimate of the asset retirement obligation for such property. Remediation work at previously abandoned well sites is particularly costly, due to the lack of a platform from which to base these activities. During 2014 and 2013, Maritech added new decommissioning liabilities for remediation work required on projects previously thought to be completed of approximately $39.2 million and $40.2 million, respectively, for work performed during the year or related to the estimated cost of future work to be performed. This additional amount was directly charged to earnings as an operating expense during 2014. Maritech is the last operator of record for its plugged wells, and bears the risk of additional future work required as a result of wells becoming pressurized in the future.
These increased estimates are included in the revisions in estimated cash flows in the table above. A portion of the excess decommissioning costs recorded during 2014 and 2013 was associated with properties not operated by Maritech and also include additional work incurred and anticipated to be required, including remediation work required on certain wells that had been previously plugged.
Our estimate of remaining hurricane related decommissioning costs is approximately $8.7 million and has
been accrued as part of Maritech’s decommissioning liabilities. Settlements of asset retirement obligations during 2013 include approximately $5.3 million of obligations associated with oil and gas properties that were sold by Maritech during the year.
F-37
NOTE I – COMMITMENTS AND CONTINGENCIES Litigation
We are named defendants in several lawsuits and respondents in certain governmental proceedings arising
in the ordinary course of business. While the outcome of lawsuits or other proceedings against us cannot be predicted with certainty, management does not consider it reasonably possible that a loss resulting from such lawsuits or other proceedings in excess of any amounts accrued has been incurred that is expected to have a material adverse impact on our financial condition, results of operations, or liquidity. Environmental
One of our subsidiaries, TETRA Micronutrients, Inc. (TMI), previously owned and operated a production
facility located in Fairbury, Nebraska. TMI is subject to an Administrative Order on Consent issued to American Microtrace, Inc. (n/k/a/ TETRA Micronutrients, Inc.) in the proceeding styled In the Matter of American Microtrace Corporation, EPA I.D. No. NED00610550, Respondent, Docket No. VII-98-H-0016, dated September 25, 1998 (the "Consent Order"), with regard to the Fairbury facility. TMI is liable for future remediation costs and ongoing environmental monitoring at the Fairbury facility under the Consent Order; however, the current owner of the Fairbury facility is responsible for costs associated with the closure of that facility.
Product Purchase Obligations
In the normal course of our Fluids Division operations, we enter into supply agreements with certain
manufacturers of various raw materials and finished products. Some of these agreements have terms and conditions that specify a minimum or maximum level of purchases over the term of the agreement. Other agreements require us to purchase the entire output of the raw material or finished product produced by the manufacturer. Our purchase obligations under these agreements apply only with regard to raw materials and finished products that meet specifications set forth in the agreements. We recognize a liability for the purchase of such products at the time we receive them. As of December 31, 2014, the aggregate amount of the fixed and determinable portion of the purchase obligation pursuant to our Fluids Division’s supply agreements was approximately $170.9 million, including $15.2 million during 2015, $11.2 million during 2016, $11.2 million during 2017, $9.3 million during 2018, $9.3 million during 2019, and $93.0 million thereafter, extending through 2029. Amounts purchased under these agreements for each of the years ended December 31, 2014, 2013, and 2012, was $21.6 million, $21.3 million, and $17.7 million, respectively.
Other Contingencies
Maritech has encountered situations where previously plugged and abandoned wells on its properties have
later exhibited a build-up of pressure, which is evidenced by gas bubbles coming from the plugged well head. We refer to this situation as “wells under pressure” and this can either be discovered when performing additional work at the property or by notification from a third party. Wells under pressure require Maritech to return to the site to perform additional plug and abandonment procedures that were not originally anticipated and included in the estimate of the asset retirement obligation for such property. Remediation work at previously abandoned well sites is particularly costly, due to the lack of a platform from which to base these activities. Maritech is the last operator of record for its plugged wells, and bears the risk of additional future work required as a result of wells becoming pressurized in the future.
NOTE J — CAPITAL STOCK
Our Restated Certificate of Incorporation authorizes us to issue 100,000,000 shares of common stock, par
value $.01 per share, and 5,000,000 shares of preferred stock, par value $.01 per share. As of December 31, 2014, we had 79,649,946 shares of common stock outstanding, with 2,672,930 shares held in treasury, and no shares of preferred stock outstanding. The voting, dividend, and liquidation rights of the holders of common stock are subject to the rights of the holders of preferred stock. The holders of common stock are entitled to one vote for each share held. There is no cumulative voting. Dividends may be declared and paid on common stock as determined by our Board of Directors, subject to any preferential dividend rights of any then outstanding preferred stock. A summary of

F-38
the activity of our common shares outstanding and treasury shares held for the three year period ending December 31, 2014, is as follows:
Common Shares Outstanding Year Ended December 31, 2014 2013 2012At beginning of period 78,855,547 78,112,032 77,423,415
Exercise of common stock options, net 290,369 373,106 580,097Grants of restricted stock, net 504,030 370,409 108,520
At end of period 79,649,946 78,855,547 78,112,032
Treasury Shares Held Year Ended December 31, 2014 2013 2012At beginning of period 2,478,084 2,334,137 2,249,959
Shares received upon exercise of common stock options 189,469 119,477 81,616Shares received upon vesting of restricted stock, net 5,377 24,470 2,562
At end of period 2,672,930 2,478,084 2,334,137
Our Board of Directors is empowered, without approval of the stockholders, to cause shares of preferred
stock to be issued in one or more series and to establish the number of shares to be included in each such series and the rights, powers, preferences, and limitations of each series. Because the Board of Directors has the power to establish the preferences and rights of each series, it may afford the holders of any series of preferred stock preferences, powers and rights, voting or otherwise, senior to the rights of holders of common stock. The issuance of the preferred stock could have the effect of delaying or preventing a change in control of the Company.
Upon our dissolution or liquidation, whether voluntary or involuntary, holders of our common stock will be
entitled to receive all of our assets available for distribution to our stockholders, subject to any preferential rights of any then outstanding preferred stock.
In January 2004, our Board of Directors authorized the repurchase of up to $20.0 million of our common
stock. During the three years ending December 31, 2014, we made no purchases of our common stock pursuant to this authorization.
NOTE K — EQUITY-BASED COMPENSATION We have various equity incentive compensation plans which provide for the granting of restricted common
stock, options for the purchase of our common stock, and other performance-based, equity-based compensation awards to our executive officers, key employees, nonexecutive officers, consultants, and directors. Stock options are exercisable for periods of up to ten years. Compensation cost for all share-based payments is based on the grant date fair value and is recognized in earnings over the requisite service period. Total equity-based compensation expense, net of taxes, for the three years ended December 31, 2014, 2013, and 2012 was $4.4 million, $4.4 million, and $6.1 million, respectively.
The Black-Scholes option-pricing model is used to estimate option fair values. This option-pricing model
requires a number of assumptions, of which the most significant are: expected stock price volatility, the expected pre-vesting forfeiture rate, and the expected option term (the amount of time from the grant date until the options are exercised or expire). Expected volatility was calculated based upon actual historical stock price movements over the most recent periods ending December 31, 2014, equal to the expected option term. Expected pre-vesting forfeitures were estimated based on actual historical pre-vesting forfeitures over the most recent periods ending December 31, 2014, for the expected option term.
The TETRA Technologies, Inc. 1990 Stock Option Plan (the "1990 Plan") was initially adopted in 1985 and
subsequently amended to change the name, the number, and the type of options that could be granted, as well as the time period for granting stock options. As of December 31, 2004, no further options may be granted under the 1990 Plan. We granted performance stock options under the 1990 Plan to certain executive officers. These granted

F-39
options have an exercise price per share of not less than the market value at the date of issuance and are fully vested and exercisable.
During 1996, we adopted the 1996 Stock Option Plan for Nonexecutive Employees and Consultants (the
"Nonqualified Plan") to enable us to award nonqualified stock options to nonexecutive employees and consultants who are key to our performance. As of May 2, 2006, no further options may be granted under the Nonqualified Plan.
In May 2006, our stockholders approved the adoption of the TETRA Technologies, Inc. 2006 Equity
Incentive Compensation Plan. Pursuant to the TETRA Technologies, Inc. 2006 Equity Incentive Compensation Plan, we were authorized to grant up to 1,300,000 shares in the form of stock options (including incentive stock options and nonqualified stock options); restricted stock; bonus stock; stock appreciation rights; and performance awards to employees, consultants, and non-employee directors. As a result of the May 2006 adoption and approval of the TETRA Technologies, Inc. 2006 Equity Incentive Compensation Plan, no further awards may be granted under our other previously existing plans. As of May 4, 2008, no further awards may be granted under the TETRA Technologies, Inc. 2006 Equity Incentive Compensation Plan.
In May 2007, our stockholders approved the adoption of the TETRA Technologies, Inc. 2007 Equity
Incentive Compensation Plan. In May 2008, our stockholders approved the adoption of the TETRA Technologies, Inc. Amended and Restated 2007 Equity Incentive Compensation Plan, which among other changes, resulted in an increase in the maximum number of shares authorized for issuance. In May 2010, our stockholders approved further amendments to the TETRA Technologies, Inc. Amended and Restated 2007 Equity Incentive Compensation Plan (renamed as the 2007 Long Term Incentive Compensation Plan) which, among other changes, resulted in an additional increase in the maximum number of shares authorized for issuance. Pursuant to the 2007 Long Term Incentive Compensation Plan, we are authorized to grant up to 5,590,000 shares in the form of stock options (including incentive stock options and nonqualified stock options); restricted stock; bonus stock; stock appreciation rights; and performance awards to employees, consultants, and non-employee directors.
In May 2011, our stockholders approved the adoption of the TETRA Technologies, Inc. 2011 Long Term
Incentive Compensation Plan. Pursuant to this plan, we were authorized to grant up to 2,200,000 shares in the form of stock options, restricted stock, bonus stock, stock appreciation rights, and performance awards to employees, consultants, and non-employee directors. On May 3, 2013, shareholders approved the TETRA Technologies, Inc. 2011 Long Term Incentive Compensation Plan which, among other things, increased the number of authorized shares to 5,600,000.
In June 2011, the Compressco Partners, L.P. 2011 Long Term Incentive Plan ("CCLP Long Term Incentive
Plan") was adopted by the board of directors of CCLP’s general partner. The plan is intended to promote CCLP’ s interests by providing to employees, consultants, and directors of its general partner and affiliates incentive compensation based on common units, to encourage superior performance. The CCLP Long Term Incentive Plan provides for grants of restricted units, phantom units, unit awards and other unit-based awards up to a plan maximum of 1,537,122 common units. The plan is also intended to attract and retain the services of individuals who are essential for the growth and profitability of CCLP and its affiliates.
Grants of Restricted Common Stock
During each of the three years ended December 31, 2014, we granted to certain officers, directors and
employees restricted shares, which generally vest over a three to five year period. During 2014, we granted a total of 693,499 restricted shares, having an average market value (equal to the closing price of the common stock on the dates of grant) of $7.62 per share, or an aggregate market value of $5.3 million. During 2013, we granted a total of 490,684 restricted shares, having an average market value (equal to the closing price of the common stock on the dates of grant) of $10.37 per share, or an aggregate market value of $5.1 million. During 2012, we granted a total of 523,096 restricted shares, having an average market value (equal to the closing price of the common stock on the dates of grant) of $6.83 per share, or an aggregate market value of $3.6 million, at the date of grant. The fair value of awards vesting during 2014, 2013, and 2012, was approximately $4.3 million, $3.6 million, and $4.8 million, respectively.
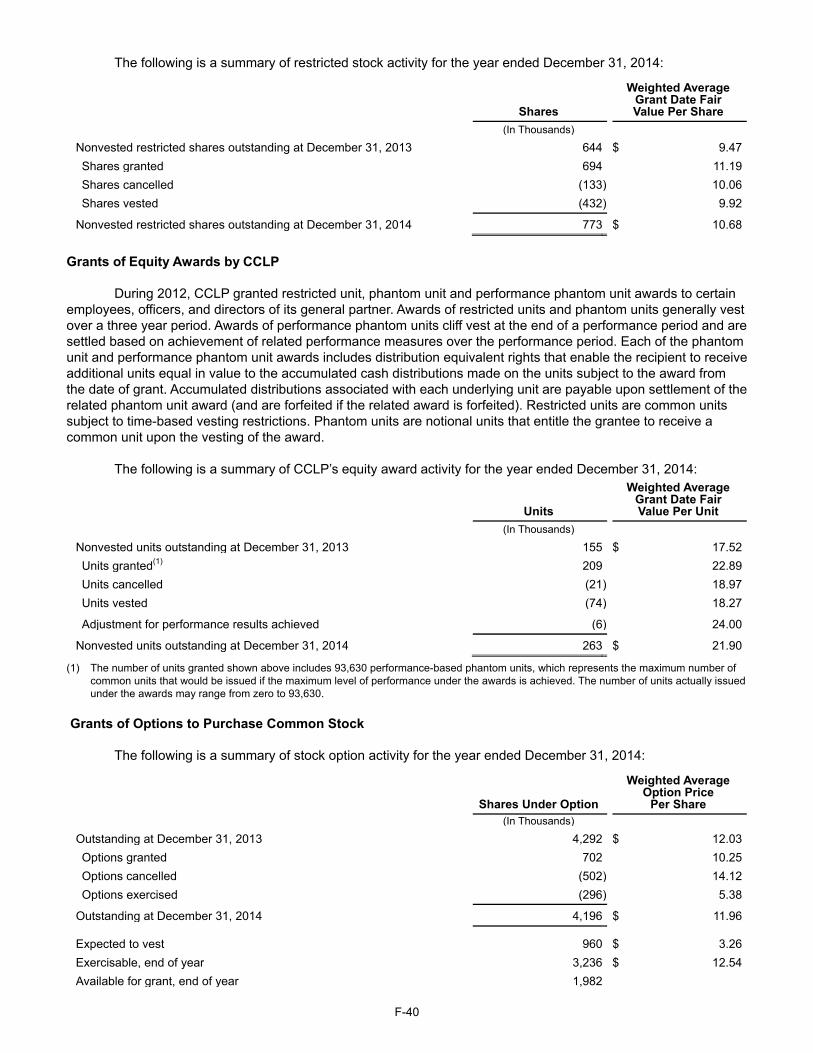
F-40
The following is a summary of restricted stock activity for the year ended December 31, 2014:
Shares
Weighted Average Grant Date Fair Value Per Share
(In Thousands) Nonvested restricted shares outstanding at December 31, 2013 644 $ 9.47Shares granted 694 11.19Shares cancelled (133) 10.06Shares vested (432) 9.92
Nonvested restricted shares outstanding at December 31, 2014 773 $ 10.68
Grants of Equity Awards by CCLP
During 2012, CCLP granted restricted unit, phantom unit and performance phantom unit awards to certain
employees, officers, and directors of its general partner. Awards of restricted units and phantom units generally vest over a three year period. Awards of performance phantom units cliff vest at the end of a performance period and are settled based on achievement of related performance measures over the performance period. Each of the phantom unit and performance phantom unit awards includes distribution equivalent rights that enable the recipient to receive additional units equal in value to the accumulated cash distributions made on the units subject to the award from the date of grant. Accumulated distributions associated with each underlying unit are payable upon settlement of the related phantom unit award (and are forfeited if the related award is forfeited). Restricted units are common units subject to time-based vesting restrictions. Phantom units are notional units that entitle the grantee to receive a common unit upon the vesting of the award.
The following is a summary of CCLP’s equity award activity for the year ended December 31, 2014:
Units
Weighted Average Grant Date Fair Value Per Unit
(In Thousands) Nonvested units outstanding at December 31, 2013 155 $ 17.52Units granted(1) 209 22.89Units cancelled (21) 18.97Units vested (74) 18.27
Adjustment for performance results achieved (6) 24.00
Nonvested units outstanding at December 31, 2014 263 $ 21.90
(1) The number of units granted shown above includes 93,630 performance-based phantom units, which represents the maximum number of common units that would be issued if the maximum level of performance under the awards is achieved. The number of units actually issued under the awards may range from zero to 93,630.
Grants of Options to Purchase Common Stock
The following is a summary of stock option activity for the year ended December 31, 2014:
Shares Under Option
Weighted Average Option Price
Per Share (In Thousands) Outstanding at December 31, 2013 4,292 $ 12.03Options granted 702 10.25Options cancelled (502) 14.12Options exercised (296) 5.38
Outstanding at December 31, 2014 4,196 $ 11.96
Expected to vest 960 $ 3.26Exercisable, end of year 3,236 $ 12.54Available for grant, end of year 1,982
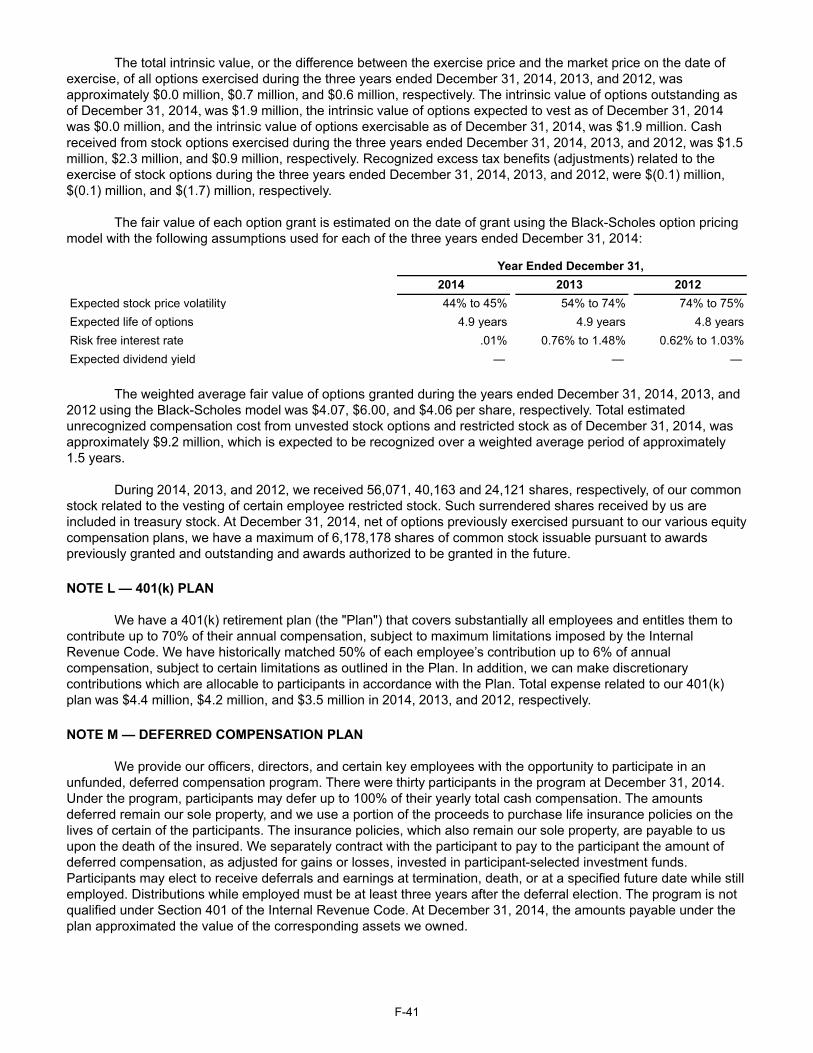
F-41
The total intrinsic value, or the difference between the exercise price and the market price on the date of exercise, of all options exercised during the three years ended December 31, 2014, 2013, and 2012, was approximately $0.0 million, $0.7 million, and $0.6 million, respectively. The intrinsic value of options outstanding as of December 31, 2014, was $1.9 million, the intrinsic value of options expected to vest as of December 31, 2014 was $0.0 million, and the intrinsic value of options exercisable as of December 31, 2014, was $1.9 million. Cash received from stock options exercised during the three years ended December 31, 2014, 2013, and 2012, was $1.5 million, $2.3 million, and $0.9 million, respectively. Recognized excess tax benefits (adjustments) related to the exercise of stock options during the three years ended December 31, 2014, 2013, and 2012, were $(0.1) million, $(0.1) million, and $(1.7) million, respectively.
The fair value of each option grant is estimated on the date of grant using the Black-Scholes option pricing
model with the following assumptions used for each of the three years ended December 31, 2014:
Year Ended December 31, 2014 2013 2012Expected stock price volatility 44% to 45% 54% to 74% 74% to 75%Expected life of options 4.9 years 4.9 years 4.8 yearsRisk free interest rate .01% 0.76% to 1.48% 0.62% to 1.03%Expected dividend yield — — —
The weighted average fair value of options granted during the years ended December 31, 2014, 2013, and 2012 using the Black-Scholes model was $4.07, $6.00, and $4.06 per share, respectively. Total estimated unrecognized compensation cost from unvested stock options and restricted stock as of December 31, 2014, was approximately $9.2 million, which is expected to be recognized over a weighted average period of approximately 1.5 years.
During 2014, 2013, and 2012, we received 56,071, 40,163 and 24,121 shares, respectively, of our common
stock related to the vesting of certain employee restricted stock. Such surrendered shares received by us are included in treasury stock. At December 31, 2014, net of options previously exercised pursuant to our various equity compensation plans, we have a maximum of 6,178,178 shares of common stock issuable pursuant to awards previously granted and outstanding and awards authorized to be granted in the future.
NOTE L — 401(k) PLAN We have a 401(k) retirement plan (the "Plan") that covers substantially all employees and entitles them to
contribute up to 70% of their annual compensation, subject to maximum limitations imposed by the Internal Revenue Code. We have historically matched 50% of each employee’s contribution up to 6% of annual compensation, subject to certain limitations as outlined in the Plan. In addition, we can make discretionary contributions which are allocable to participants in accordance with the Plan. Total expense related to our 401(k) plan was $4.4 million, $4.2 million, and $3.5 million in 2014, 2013, and 2012, respectively.
NOTE M — DEFERRED COMPENSATION PLAN We provide our officers, directors, and certain key employees with the opportunity to participate in an
unfunded, deferred compensation program. There were thirty participants in the program at December 31, 2014. Under the program, participants may defer up to 100% of their yearly total cash compensation. The amounts deferred remain our sole property, and we use a portion of the proceeds to purchase life insurance policies on the lives of certain of the participants. The insurance policies, which also remain our sole property, are payable to us upon the death of the insured. We separately contract with the participant to pay to the participant the amount of deferred compensation, as adjusted for gains or losses, invested in participant-selected investment funds. Participants may elect to receive deferrals and earnings at termination, death, or at a specified future date while still employed. Distributions while employed must be at least three years after the deferral election. The program is not qualified under Section 401 of the Internal Revenue Code. At December 31, 2014, the amounts payable under the plan approximated the value of the corresponding assets we owned.
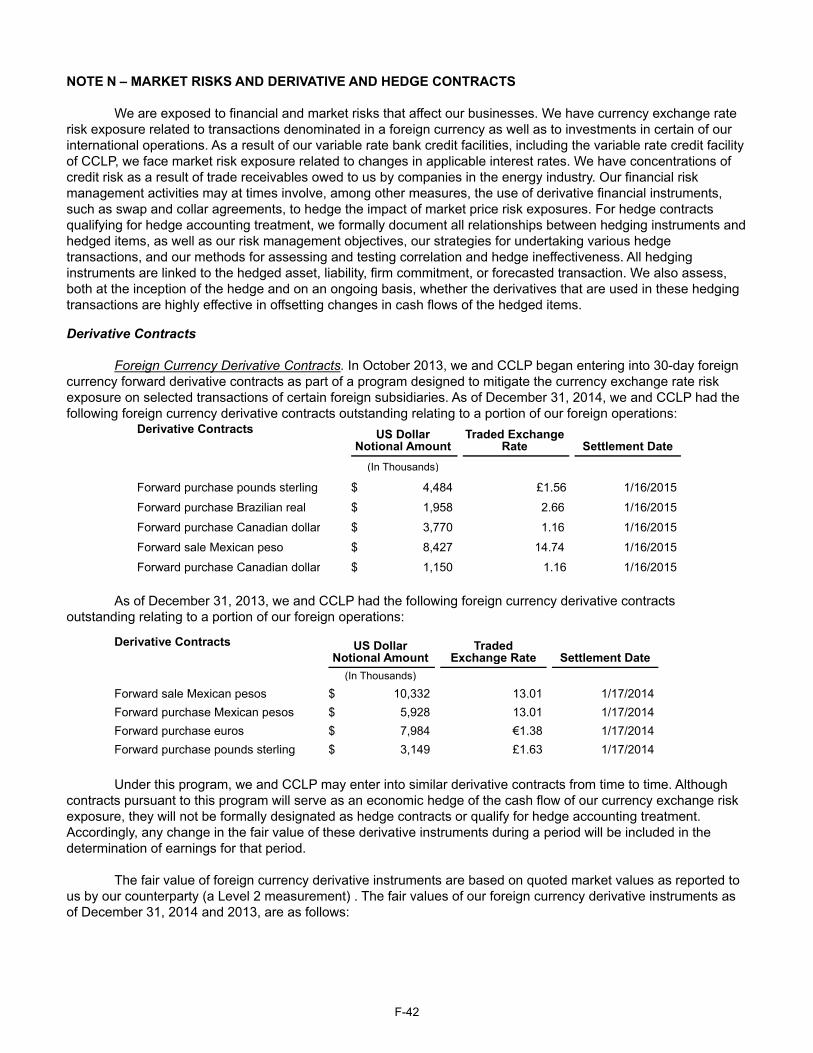
F-42
NOTE N – MARKET RISKS AND DERIVATIVE AND HEDGE CONTRACTS We are exposed to financial and market risks that affect our businesses. We have currency exchange rate
risk exposure related to transactions denominated in a foreign currency as well as to investments in certain of our international operations. As a result of our variable rate bank credit facilities, including the variable rate credit facility of CCLP, we face market risk exposure related to changes in applicable interest rates. We have concentrations of credit risk as a result of trade receivables owed to us by companies in the energy industry. Our financial risk management activities may at times involve, among other measures, the use of derivative financial instruments, such as swap and collar agreements, to hedge the impact of market price risk exposures. For hedge contracts qualifying for hedge accounting treatment, we formally document all relationships between hedging instruments and hedged items, as well as our risk management objectives, our strategies for undertaking various hedge transactions, and our methods for assessing and testing correlation and hedge ineffectiveness. All hedging instruments are linked to the hedged asset, liability, firm commitment, or forecasted transaction. We also assess, both at the inception of the hedge and on an ongoing basis, whether the derivatives that are used in these hedging transactions are highly effective in offsetting changes in cash flows of the hedged items.
Derivative Contracts
Foreign Currency Derivative Contracts. In October 2013, we and CCLP began entering into 30-day foreign
currency forward derivative contracts as part of a program designed to mitigate the currency exchange rate risk exposure on selected transactions of certain foreign subsidiaries. As of December 31, 2014, we and CCLP had the following foreign currency derivative contracts outstanding relating to a portion of our foreign operations:
Derivative Contracts US Dollar Notional Amount
Traded Exchange Rate Settlement Date
(In Thousands)
Forward purchase pounds sterling $ 4,484 £1.56 1/16/2015
Forward purchase Brazilian real $ 1,958 2.66 1/16/2015
Forward purchase Canadian dollar $ 3,770 1.16 1/16/2015
Forward sale Mexican peso $ 8,427 14.74 1/16/2015
Forward purchase Canadian dollar $ 1,150 1.16 1/16/2015
As of December 31, 2013, we and CCLP had the following foreign currency derivative contracts outstanding relating to a portion of our foreign operations:
Derivative Contracts
US Dollar Notional Amount
Traded Exchange Rate Settlement Date
(In Thousands)
Forward sale Mexican pesos $ 10,332 13.01 1/17/2014Forward purchase Mexican pesos $ 5,928 13.01 1/17/2014Forward purchase euros $ 7,984 €1.38 1/17/2014Forward purchase pounds sterling $ 3,149 £1.63 1/17/2014
Under this program, we and CCLP may enter into similar derivative contracts from time to time. Although
contracts pursuant to this program will serve as an economic hedge of the cash flow of our currency exchange risk exposure, they will not be formally designated as hedge contracts or qualify for hedge accounting treatment. Accordingly, any change in the fair value of these derivative instruments during a period will be included in the determination of earnings for that period.
The fair value of foreign currency derivative instruments are based on quoted market values as reported to
us by our counterparty (a Level 2 measurement) . The fair values of our foreign currency derivative instruments as of December 31, 2014 and 2013, are as follows:
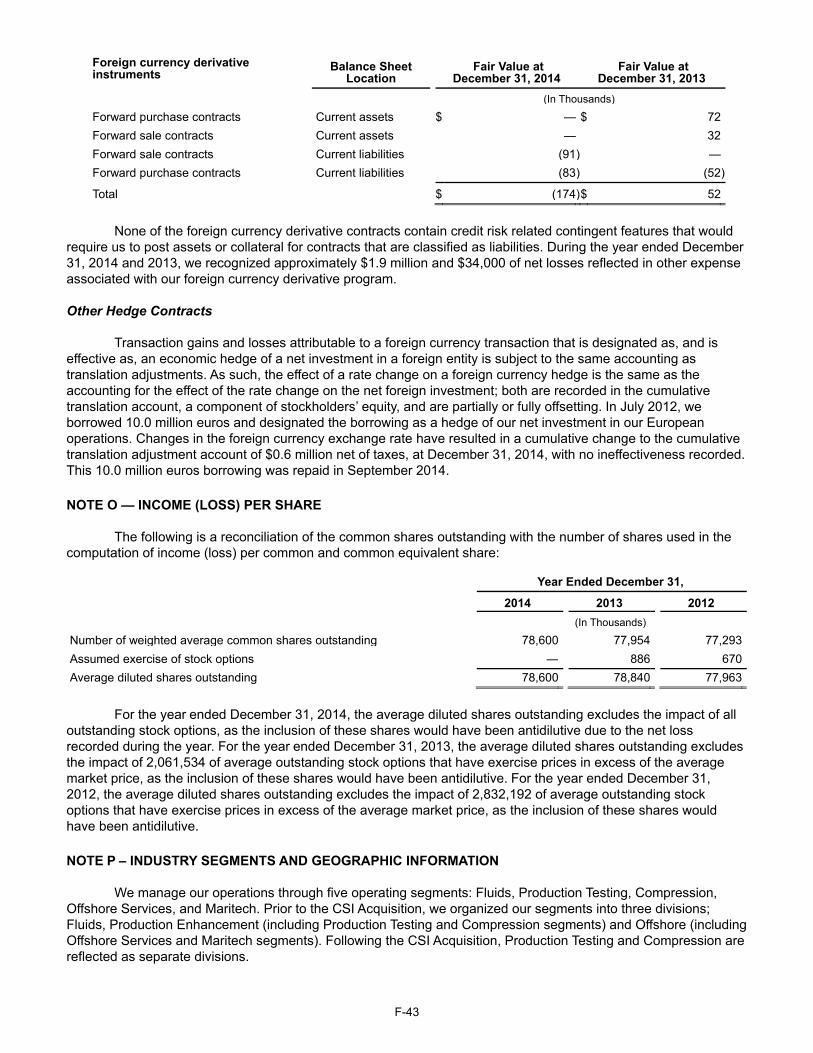
F-43
Foreign currency derivative instruments Balance Sheet
Location Fair Value at
December 31, 2014 Fair Value at
December 31, 2013 (In Thousands)
Forward purchase contracts Current assets $ — $ 72Forward sale contracts Current assets — 32Forward sale contracts Current liabilities (91 ) —Forward purchase contracts Current liabilities (83 ) (52)
Total $ (174) $ 52
None of the foreign currency derivative contracts contain credit risk related contingent features that would
require us to post assets or collateral for contracts that are classified as liabilities. During the year ended December 31, 2014 and 2013, we recognized approximately $1.9 million and $34,000 of net losses reflected in other expense associated with our foreign currency derivative program. Other Hedge Contracts
Transaction gains and losses attributable to a foreign currency transaction that is designated as, and is
effective as, an economic hedge of a net investment in a foreign entity is subject to the same accounting as translation adjustments. As such, the effect of a rate change on a foreign currency hedge is the same as the accounting for the effect of the rate change on the net foreign investment; both are recorded in the cumulative translation account, a component of stockholders’ equity, and are partially or fully offsetting. In July 2012, we borrowed 10.0 million euros and designated the borrowing as a hedge of our net investment in our European operations. Changes in the foreign currency exchange rate have resulted in a cumulative change to the cumulative translation adjustment account of $0.6 million net of taxes, at December 31, 2014, with no ineffectiveness recorded. This 10.0 million euros borrowing was repaid in September 2014.
NOTE O — INCOME (LOSS) PER SHARE The following is a reconciliation of the common shares outstanding with the number of shares used in the
computation of income (loss) per common and common equivalent share:
Year Ended December 31, 2014 2013 2012 (In Thousands)
Number of weighted average common shares outstanding 78,600 77,954 77,293Assumed exercise of stock options — 886 670Average diluted shares outstanding 78,600 78,840 77,963
For the year ended December 31, 2014, the average diluted shares outstanding excludes the impact of all
outstanding stock options, as the inclusion of these shares would have been antidilutive due to the net loss recorded during the year. For the year ended December 31, 2013, the average diluted shares outstanding excludes the impact of 2,061,534 of average outstanding stock options that have exercise prices in excess of the average market price, as the inclusion of these shares would have been antidilutive. For the year ended December 31, 2012, the average diluted shares outstanding excludes the impact of 2,832,192 of average outstanding stock options that have exercise prices in excess of the average market price, as the inclusion of these shares would have been antidilutive.
NOTE P – INDUSTRY SEGMENTS AND GEOGRAPHIC INFORMATION We manage our operations through five operating segments: Fluids, Production Testing, Compression,
Offshore Services, and Maritech. Prior to the CSI Acquisition, we organized our segments into three divisions; Fluids, Production Enhancement (including Production Testing and Compression segments) and Offshore (including Offshore Services and Maritech segments). Following the CSI Acquisition, Production Testing and Compression are reflected as separate divisions.
F-44
Our Fluids Division manufactures and markets clear brine fluids, additives, and associated products and services to the oil and gas industry for use in well drilling, completion, and workover operations in the United States and in certain countries in Latin America, Europe, Asia, the Middle East and Africa. The division also markets liquid and dry calcium chloride products manufactured at its production facilities or purchased from third-party suppliers to a variety of markets outside the energy industry. The Fluids Division also provides North American onshore oil and gas operators with comprehensive water management services.
Our Production Testing Division provides frac flowback, production well testing, offshore rig cooling, and other associated services in many of the major oil and gas producing regions in the United States, Mexico, and Canada, as well as in certain basins in certain regions in South America, Africa, Europe, the Middle East and Australia.
Our Compression Division is a provider of compression services and equipment for natural gas and oil production, gathering, transportation, processing, and storage. The Compression Division's equipment and parts sales business includes the fabrication and sale of standard compressor packages, custom-designed compressor packages, and oilfield pump systems designed and fabricated at the Division's facilities as well as the sale of compressor package parts and components manufactured by third-party suppliers. The Compression Division's aftermarket services business provides compressor package reconfiguration and maintenance services. The Compression Division provides its services and equipment to a broad base of natural gas and oil exploration and production, midstream, transmission, and storage companies operating throughout many of the onshore producing regions of the United States as well as in a number of foreign countries, including Mexico, Canada, and Argentina. As a result of the August 4, 2014, acquisition of CSI, we have significantly expanded the scope of our Compression Division.
Our Offshore Division consists of two operating segments: Offshore Services and Maritech. The Offshore
Services segment provides: (1) downhole and subsea services such as well plugging and abandonment and workover services; (2) decommissioning and certain construction services utilizing heavy lift barges and various cutting technologies with regard to offshore oil and gas production platforms and pipelines; and (3) conventional and saturation diving services.
The Maritech segment is a limited oil and gas production operation. During 2011 and the first quarter of 2012, Maritech sold substantially all of its oil and gas producing property interests. Maritech’s operations consist primarily of the ongoing abandonment and decommissioning associated with its remaining offshore wells and production platforms. Maritech intends to acquire a significant portion of these services from the Offshore Division’s Offshore Services segment.
We generally evaluate the performance of and allocate resources to our segments based on profit or loss from their operations before income taxes and nonrecurring charges, return on investment, and other criteria. Transfers between segments and geographic areas are priced at the estimated fair value of the products or services as negotiated between the operating units. “Corporate overhead” includes corporate general and administrative expenses, corporate depreciation and amortization, interest income and expense, and other income and expense.
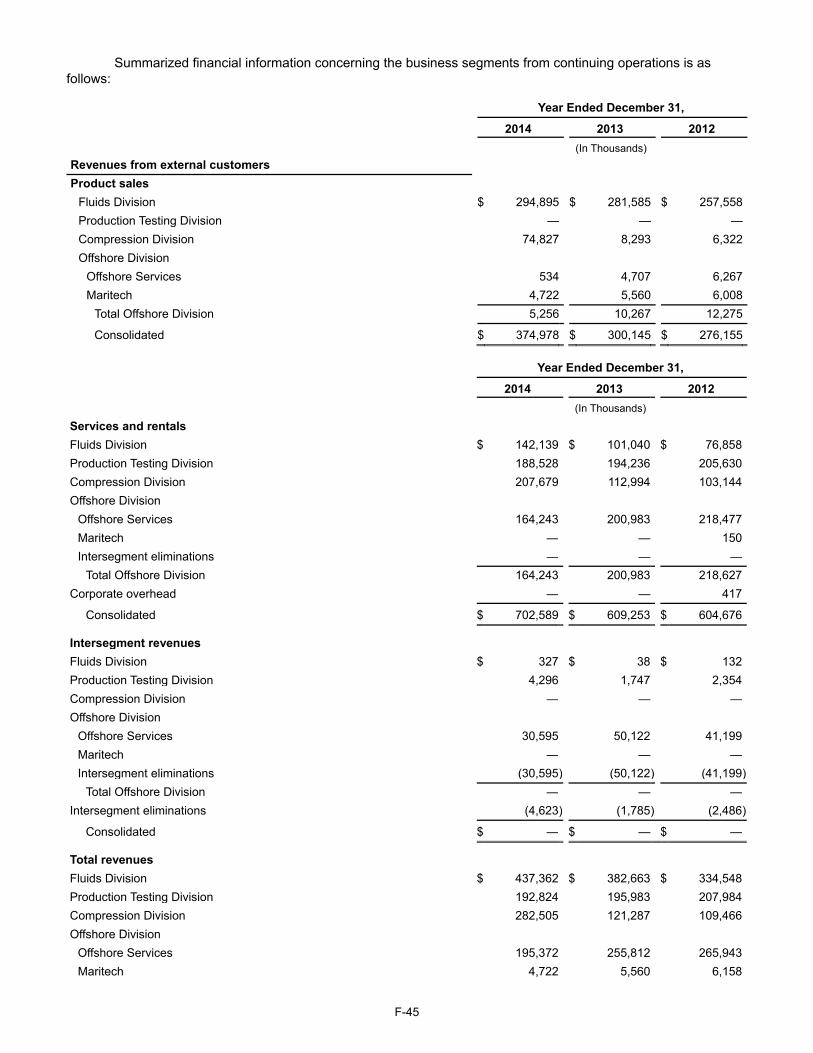
F-45
Summarized financial information concerning the business segments from continuing operations is as follows:
Year Ended December 31, 2014 2013 2012 (In Thousands) Revenues from external customers Product sales
Fluids Division $ 294,895 $ 281,585 $ 257,558Production Testing Division — — —Compression Division 74,827 8,293 6,322Offshore Division
Offshore Services 534 4,707 6,267Maritech 4,722 5,560 6,008
Total Offshore Division 5,256 10,267 12,275
Consolidated $ 374,978 $ 300,145 $ 276,155 Year Ended December 31, 2014 2013 2012 (In Thousands)
Services and rentals Fluids Division $ 142,139 $ 101,040 $ 76,858Production Testing Division 188,528 194,236 205,630Compression Division 207,679 112,994 103,144Offshore Division
Offshore Services 164,243 200,983 218,477Maritech — — 150Intersegment eliminations — — —
Total Offshore Division 164,243 200,983 218,627Corporate overhead — — 417
Consolidated $ 702,589 $ 609,253 $ 604,676
Intersegment revenues Fluids Division $ 327 $ 38 $ 132Production Testing Division 4,296 1,747 2,354Compression Division — — —Offshore Division
Offshore Services 30,595 50,122 41,199Maritech — — —Intersegment eliminations (30,595) (50,122) (41,199)
Total Offshore Division — — —Intersegment eliminations (4,623) (1,785) (2,486)
Consolidated $ — $ — $ —
Total revenues Fluids Division $ 437,362 $ 382,663 $ 334,548Production Testing Division 192,824 195,983 207,984Compression Division 282,505 121,287 109,466Offshore Division
Offshore Services 195,372 255,812 265,943Maritech 4,722 5,560 6,158
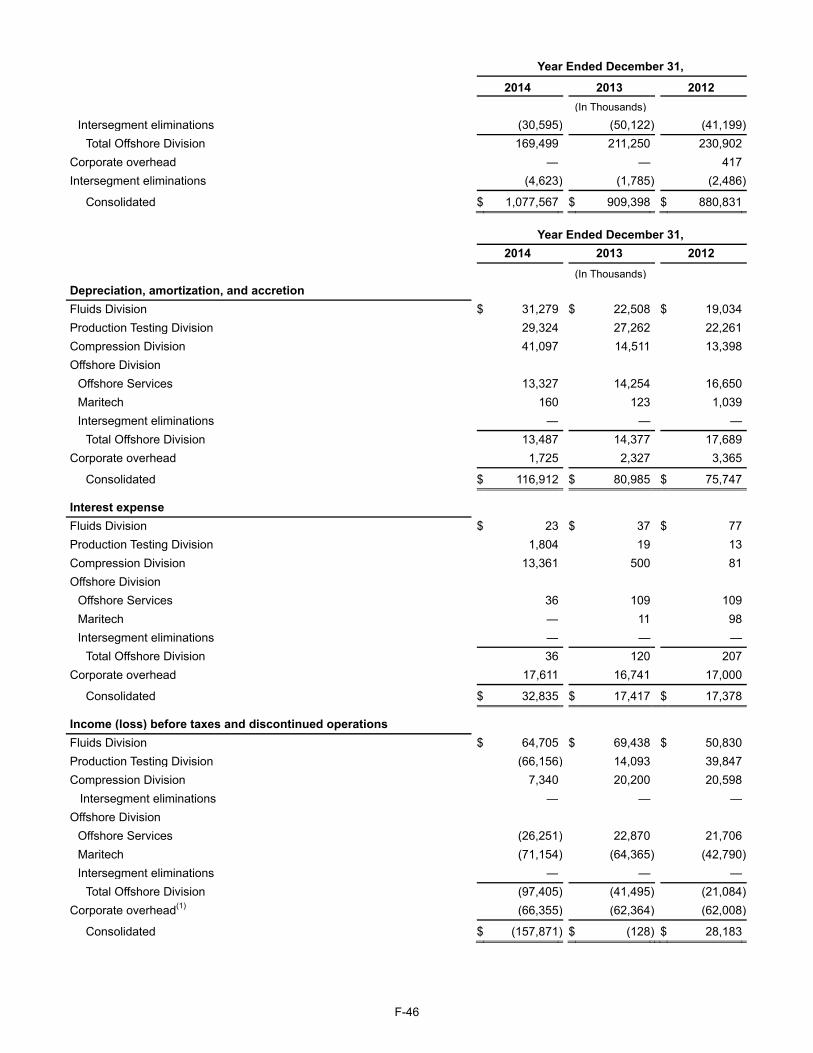
F-46
Year Ended December 31, 2014 2013 2012 (In Thousands)
Intersegment eliminations (30,595) (50,122) (41,199)Total Offshore Division 169,499 211,250 230,902
Corporate overhead — — 417Intersegment eliminations (4,623) (1,785) (2,486)
Consolidated $ 1,077,567 $ 909,398 $ 880,831 Year Ended December 31, 2014 2013 2012 (In Thousands) Depreciation, amortization, and accretion Fluids Division $ 31,279 $ 22,508 $ 19,034Production Testing Division 29,324 27,262 22,261Compression Division 41,097 14,511 13,398Offshore Division
Offshore Services 13,327 14,254 16,650Maritech 160 123 1,039Intersegment eliminations — — —
Total Offshore Division 13,487 14,377 17,689Corporate overhead 1,725 2,327 3,365
Consolidated $ 116,912 $ 80,985 $ 75,747
Interest expense Fluids Division $ 23 $ 37 $ 77Production Testing Division 1,804 19 13Compression Division 13,361 500 81Offshore Division
Offshore Services 36 109 109Maritech — 11 98Intersegment eliminations — — —
Total Offshore Division 36 120 207Corporate overhead 17,611 16,741 17,000
Consolidated $ 32,835 $ 17,417 $ 17,378
Income (loss) before taxes and discontinued operations Fluids Division $ 64,705 $ 69,438 $ 50,830Production Testing Division (66,156) 14,093 39,847Compression Division 7,340 20,200 20,598 Intersegment eliminations — — —Offshore Division
Offshore Services (26,251) 22,870 21,706Maritech (71,154) (64,365) (42,790)Intersegment eliminations — — —
Total Offshore Division (97,405) (41,495) (21,084)Corporate overhead(1) (66,355) (62,364) (62,008)
Consolidated $ (157,871) $ (128) $ 28,183

F-47
Year Ended December 31, 2014 2013 2012 (In Thousands) Total assets Fluids Division $ 423,989 $ 400,028 $ 387,034Production Testing Division 241,640 327,413 337,208Compression Division 1,272,583 230,829 219,838Offshore Division
Offshore Services 129,350 181,617 188,034Maritech 9,924 46,903 75,383Intersegment eliminations — — —
Total Offshore Division 139,274 228,520 263,417Corporate overhead (9,650) 19,743 54,321
Consolidated $ 2,067,836 $ 1,206,533 $ 1,261,818
Capital expenditures Fluids Division $ 41,307 $ 45,238 $ 31,839Production Testing Division 31,226 26,757 40,025Compression Division 37,516 24,103 22,215Offshore Division
Offshore Services 20,013 4,207 12,050Maritech — 21 343Intersegment eliminations — — —
Total Offshore Division 20,013 4,228 12,393Corporate overhead 1,547 1,053 1,052
Consolidated $ 131,609 $ 101,379 $ 107,524
(1) Amounts reflected include the following general corporate expenses:
2014 2013 2012 (In Thousands)
General and administrative expense $ 41,139 $ 40,506 $ 40,005
Depreciation and amortization 1,725 2,327 3,365
Interest expense, net 19,268 16,715 17,000
Other general corporate (income) expense, net 4,223 2,711 1,638
Total $ 66,355 $ 62,259 $ 62,008

F-48
Summarized financial information concerning the geographic areas of our customers and in which we operate at December 31, 2014, 2013, and 2012, is presented below:
Year Ended December 31, 2014 2013 2012 (In Thousands) Revenues from external customers:
U.S. $ 768,688 $ 673,376 $ 625,885Canada and Mexico 73,632 58,080 85,133South America 40,719 31,788 42,482Europe 105,457 102,990 92,882Africa 22,277 15,127 20,194Asia and other 66,794 28,037 14,255
Total $ 1,077,567 $ 909,398 $ 880,831Transfers between geographic areas:
U.S. $ — $ — $ —Canada and Mexico — — —South America — — —Europe 2,871 112 172Africa — — —Asia and other — — —Eliminations (2,871) (112) (172)
Total revenues $ 1,077,567 $ 909,398 $ 880,831Identifiable assets:
U.S. $ 1,763,805 $ 852,483 $ 913,080Canada and Mexico 97,737 104,831 116,059South America 32,267 43,326 51,858Europe 94,209 150,415 135,219Africa 7,895 9,063 13,700Asia and other 71,923 46,351 31,902Eliminations and discontinued operations — 64 —
Total identifiable assets $ 2,067,836 $ 1,206,533 $ 1,261,818
During each of the three years ended December 31, 2014, 2013, and 2012, no single customer accounted
for more than 10% of our consolidated revenues.
NOTE Q — SUPPLEMENTAL OIL AND GAS DISCLOSURES (Unaudited) As part of the Offshore Division activities, Maritech and its subsidiaries previously acquired oil and gas
reserves and operated the properties in exchange for assuming the proportionate share of the well abandonment and decommissioning obligations associated with such properties. Accordingly, our Maritech segment is included within our Offshore Division. During 2011 and the first quarter of 2012, Maritech sold substantially all of its oil and gas producing property interests. Maritech's current operations consist primarily of the ongoing abandonment and decommissioning associated with its remaining offshore wells and production platforms. Accordingly, information regarding costs incurred in property acquisition, exploration, and development activities, capitalized costs related to oil and gas producing activities, estimated quantities of oil and gas reserves, and standardized measure of discounted future net cash flows relating to oil and gas reserves have not been presented as such information is immaterial during each of the three year period ended December 31, 2014.
Results of Operations for Oil and Gas Producing Activities
Results of operations for oil and gas producing activities excludes general and administrative and interest
expenses directly related to such activities as well as any allocation of corporate or divisional overhead.
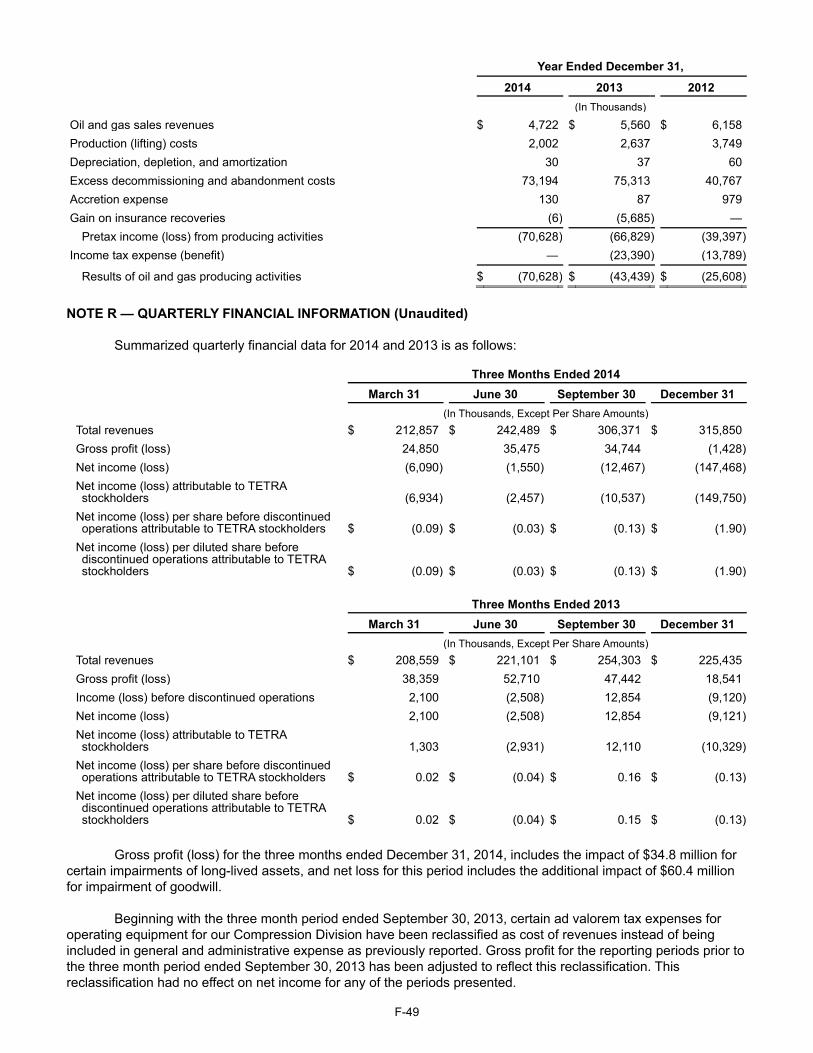
F-49
Year Ended December 31, 2014 2013 2012 (In Thousands)
Oil and gas sales revenues $ 4,722 $ 5,560 $ 6,158Production (lifting) costs 2,002 2,637 3,749Depreciation, depletion, and amortization 30 37 60Excess decommissioning and abandonment costs 73,194 75,313 40,767Accretion expense 130 87 979Gain on insurance recoveries (6) (5,685) —
Pretax income (loss) from producing activities (70,628) (66,829) (39,397)Income tax expense (benefit) — (23,390) (13,789)
Results of oil and gas producing activities $ (70,628) $ (43,439) $ (25,608)
NOTE R — QUARTERLY FINANCIAL INFORMATION (Unaudited)
Summarized quarterly financial data for 2014 and 2013 is as follows:
Three Months Ended 2014 March 31 June 30 September 30 December 31 (In Thousands, Except Per Share Amounts) Total revenues $ 212,857 $ 242,489 $ 306,371 $ 315,850Gross profit (loss) 24,850 35,475 34,744 (1,428)Net income (loss) (6,090) (1,550) (12,467) (147,468)Net income (loss) attributable to TETRA stockholders (6,934) (2,457) (10,537) (149,750)
Net income (loss) per share before discontinued operations attributable to TETRA stockholders $ (0.09) $ (0.03) $ (0.13) $ (1.90)
Net income (loss) per diluted share before discontinued operations attributable to TETRA stockholders $ (0.09) $ (0.03) $ (0.13) $ (1.90)
Three Months Ended 2013 March 31 June 30 September 30 December 31 (In Thousands, Except Per Share Amounts) Total revenues $ 208,559 $ 221,101 $ 254,303 $ 225,435Gross profit (loss) 38,359 52,710 47,442 18,541Income (loss) before discontinued operations 2,100 (2,508) 12,854 (9,120)Net income (loss) 2,100 (2,508) 12,854 (9,121)Net income (loss) attributable to TETRA stockholders 1,303 (2,931) 12,110
(10,329)
Net income (loss) per share before discontinued operations attributable to TETRA stockholders $ 0.02 $ (0.04) $ 0.16
$ (0.13)
Net income (loss) per diluted share before discontinued operations attributable to TETRA stockholders $ 0.02 $ (0.04) $ 0.15
$ (0.13)
Gross profit (loss) for the three months ended December 31, 2014, includes the impact of $34.8 million for certain impairments of long-lived assets, and net loss for this period includes the additional impact of $60.4 million for impairment of goodwill.
Beginning with the three month period ended September 30, 2013, certain ad valorem tax expenses for
operating equipment for our Compression Division have been reclassified as cost of revenues instead of being included in general and administrative expense as previously reported. Gross profit for the reporting periods prior to the three month period ended September 30, 2013 has been adjusted to reflect this reclassification. This reclassification had no effect on net income for any of the periods presented.
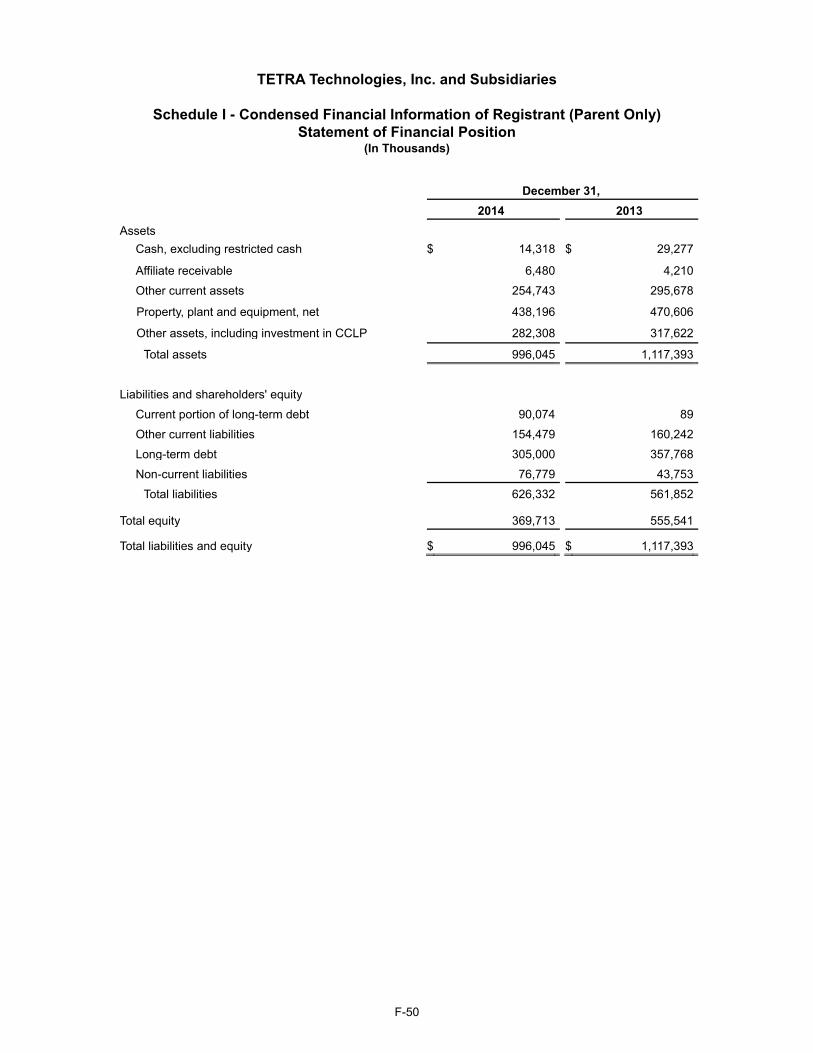
F-50
TETRA Technologies, Inc. and Subsidiaries
Schedule I - Condensed Financial Information of Registrant (Parent Only)
Statement of Financial Position (In Thousands)
December 31, 2014 2013 Assets
Cash, excluding restricted cash $ 14,318 $ 29,277
Affiliate receivable 6,480 4,210
Other current assets 254,743 295,678
Property, plant and equipment, net 438,196 470,606
Other assets, including investment in CCLP 282,308 317,622
Total assets 996,045 1,117,393
Liabilities and shareholders' equity
Current portion of long-term debt 90,074 89
Other current liabilities 154,479 160,242
Long-term debt 305,000 357,768
Non-current liabilities 76,779 43,753
Total liabilities 626,332 561,852
Total equity 369,713 555,541
Total liabilities and equity $ 996,045 $ 1,117,393
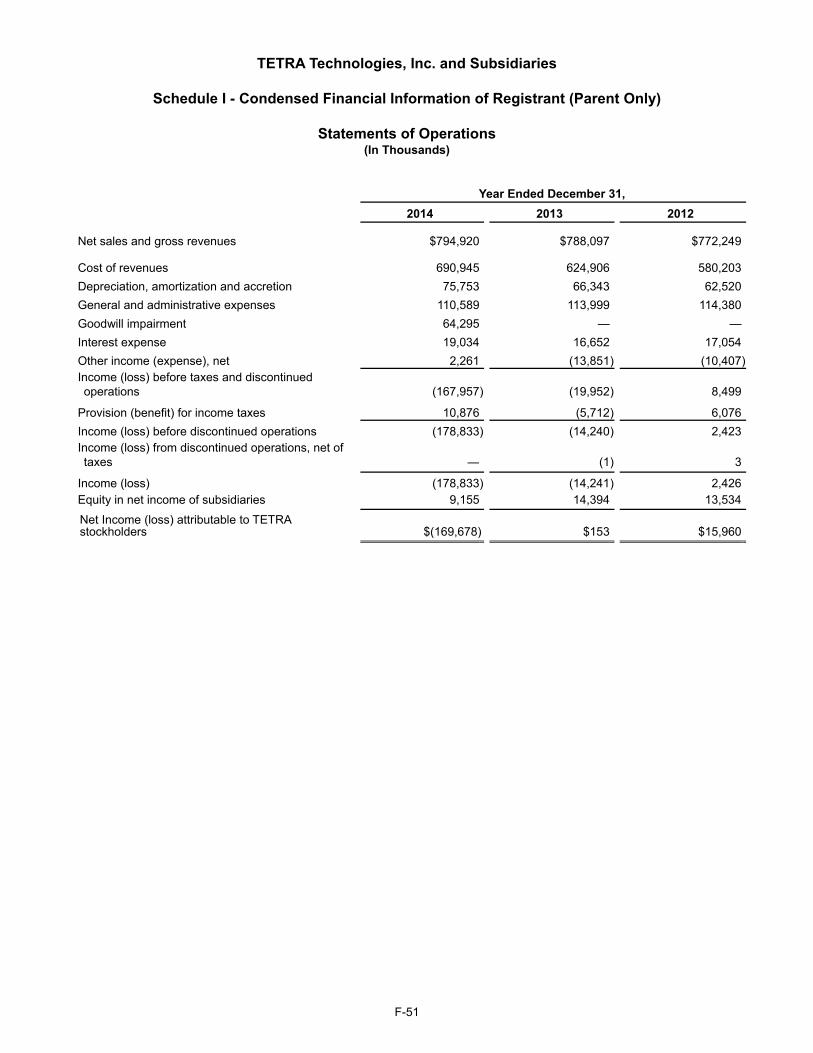
F-51
TETRA Technologies, Inc. and Subsidiaries
Schedule I - Condensed Financial Information of Registrant (Parent Only)
Statements of Operations (In Thousands)
Year Ended December 31, 2014 2013 2012
Net sales and gross revenues $794,920 $788,097 $772,249
Cost of revenues 690,945 624,906 580,203Depreciation, amortization and accretion 75,753 66,343 62,520General and administrative expenses 110,589 113,999 114,380Goodwill impairment 64,295 — —Interest expense 19,034 16,652 17,054Other income (expense), net 2,261 (13,851 ) (10,407)Income (loss) before taxes and discontinued operations (167,957) (19,952 ) 8,499
Provision (benefit) for income taxes 10,876 (5,712 ) 6,076Income (loss) before discontinued operations (178,833) (14,240 ) 2,423Income (loss) from discontinued operations, net of taxes — (1 ) 3
Income (loss) (178,833) (14,241 ) 2,426Equity in net income of subsidiaries 9,155 14,394 13,534
Net Income (loss) attributable to TETRA stockholders $(169,678) $153
$15,960
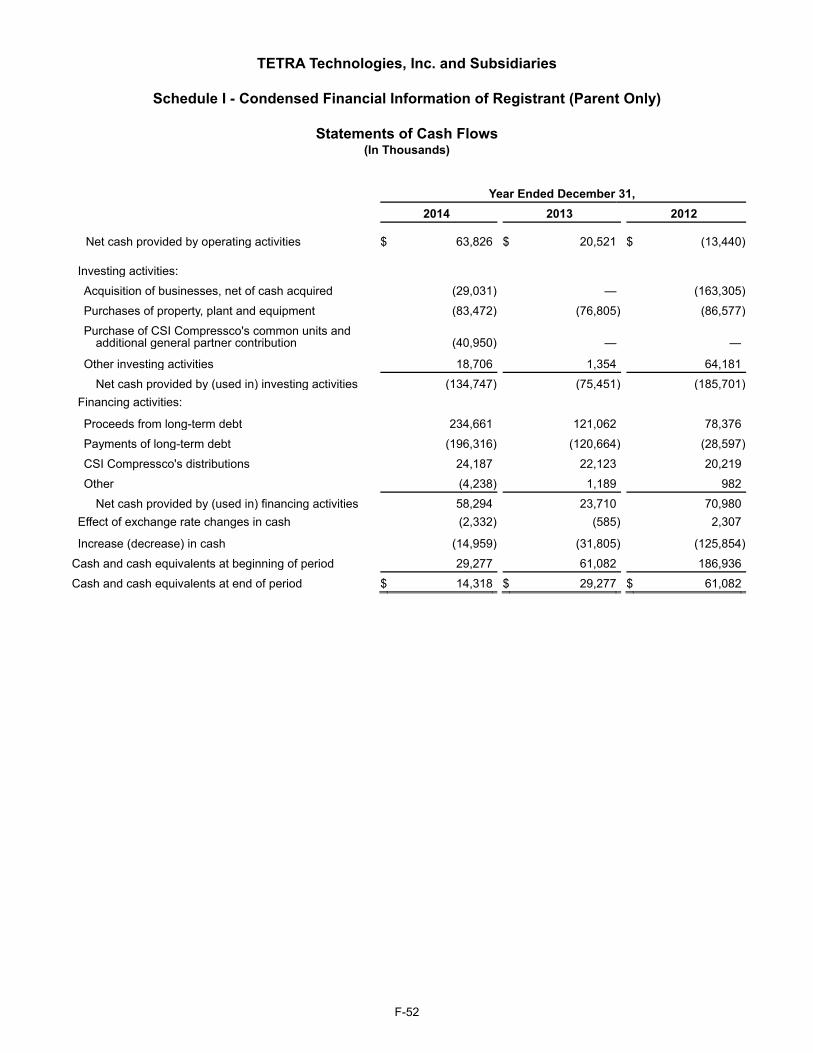
F-52
TETRA Technologies, Inc. and Subsidiaries
Schedule I - Condensed Financial Information of Registrant (Parent Only)
Statements of Cash Flows (In Thousands)
Year Ended December 31, 2014 2013 2012
Net cash provided by operating activities $ 63,826 $ 20,521 $ (13,440)
Investing activities: Acquisition of businesses, net of cash acquired (29,031) — (163,305)
Purchases of property, plant and equipment (83,472) (76,805) (86,577)
Purchase of CSI Compressco's common units and additional general partner contribution (40,950) —
—
Other investing activities 18,706 1,354 64,181
Net cash provided by (used in) investing activities (134,747) (75,451) (185,701)Financing activities:
Proceeds from long-term debt 234,661 121,062 78,376
Payments of long-term debt (196,316) (120,664) (28,597)
CSI Compressco's distributions 24,187 22,123 20,219
Other (4,238) 1,189 982
Net cash provided by (used in) financing activities 58,294 23,710 70,980Effect of exchange rate changes in cash (2,332) (585) 2,307
Increase (decrease) in cash (14,959) (31,805) (125,854)
Cash and cash equivalents at beginning of period 29,277 61,082 186,936
Cash and cash equivalents at end of period $ 14,318 $ 29,277 $ 61,082
F-53
TETRA Technologies, Inc. and Subsidiaries
Schedule I - Condensed Financial Information of Registrant (Parent Only) NOTE A- BASIS OF PRESENTATION In the parent-company-only financial statements, the Company's investment in subsidiaries is stated at cost plus equity in undistributed earnings of subsidiaries since the date of the respective acquisition. The Company's share of net income of its unconsolidated subsidiaries is included in consolidated income using the equity method. The parent-company-only financial statements should be read in conjunction with the Company's consolidated financial statements.

Financial HigHligHts(in thousands, except per share amounts)
(1) For the year ended December 31, 2014, the calculation of average diluted shares outstanding excludes the impact of all outstanding stock options, as the inclusion of these shares would have been antidilutive due the net loss recorded during the year.
(2) For the year ended December 31, 2013, the calculation of average diluted shares outstanding excludes the impact of 2,061,534 average outstanding stock options that would have been antidilutive.
(3) For the year ended December 31, 2012, the calculation of average diluted shares outstanding excludes the impact of 2,832,192 average outstanding stock options that would have been antidilutive.
(4) For the year ended December 31, 2011, the calculation of average diluted shares outstanding excludes the impact of 2,831,118 average outstanding stock options that would have been antidilutive.
(5) For the years ended December 31, 2010, the calculation of average diluted shares outstanding excludes the impact of all of our outstanding stock options, since all were antidilutive due to the net loss for the year.
On
tH
e c
Ov
er
Year Ended December 31, 2014 2013 2012 2011 2010
IncomE StatEmEnt Data
Revenues $ 1,077,567 $ 909,398 $ 880,831 $ 845,275 $ 872,678
Gross profit 95,044 135,392 167,380 89,042 42,447
General and administrative expense 142,689 131,466 131,649 111,805 98,872
Interest expense, net 31,998 17,121 17,080 16,439 17,304
Income (loss) before discontinued operations (167,575) 3,326 18,754 5,482 (43,325)
net income (loss) attributable to tEtRa stockholders (169,678) 153 15,960 4,147 (43,718)
Income (loss) per diluted share, before discontinued operations attributable to tEtRa stockholders $ (2.16) $ 0.00 $ 0.20 $ 0.05 $ (0.57)
average diluted shares 78,600 (1) 78,840 (2) 77,963 (3) 77,991 (4) 75,539 (5)
December 31, 2014 2013 2012 2011 2010
BalancE ShEEt Data
Working capital $ 121,904 $ 200,913 $ 178,294 $ 296,136 $ 198,106
total assets 2,067,836 1,206,533 1,261,818 1,203,310 1,299,628
long-term debt 844,961 387,727 331,268 305,000 305,035
Decommissioning and other long-term liabilities 78,630 48,282 80,427 96,857 261,438
Equity 765,601 597,498 593,308 569,088 516,323
2014 2013
common Stock PRIcE High Low High Low
First Quarter $ 12.84 $ 9.92 $ 10.74 $ 7.72
Second Quarter 13.43 10.87 11.48 8.15
third Quarter 12.11 9.25 12.97 9.41
Fourth Quarter 10.96 4.90 13.41 11.52
BOard OF directOrs
maRk E. BalDWIn (1*)
Retired Executive Vice President and chief Financial officer of Dresser-Rand Group, Inc. Director of kBR, Inc. Director of nine Energy Service. Director of tEtRa technologies, Inc. since 2014.
thomaS R. BatES, JR. (2*)
chairman of the Board of Directors of hercules offshore, Inc. chairman of the Board of Directors of Independence contract Drilling, Inc. adjunct Professor at the neely School of Business, texas christian University. Director of tEtRa technologies, Inc. since 2011.
StUaRt m. BRIGhtmanPresident and chief Executive officer of tEtRa technologies, Inc. chairman of the Board of Directors of cSI compressco GP Inc. Director of tEtRa technologies, Inc. since 2009.
PaUl D. coomBS (3) Director of Balchem corporation. Director of tEtRa technologies, Inc. since 1994.
RalPh S. cUnnInGham (1) chairman of the Board of Directors of tEtRa technologies, Inc. Vice-chairman of the Board of Directors of Enterprise Products company. Director of cenovus Energy Inc. Director of tEtRa technologies, Inc. since 1999.
John F. GlIck (2, 3)
Retired President, chief Executive officer, and a Director of lufkin Industries, Inc. Director of hunting Plc. Director of tEtRa technologies, Inc. since 2014.
kEnnEth P. mItchEll (1, 3)
Retired President and chief Executive officer of oakite Products, Inc. Director of tEtRa technologies, Inc. since 1997.
WIll Iam D. SUll IVan (2, 3*)
Retired Executive Vice President, E&P, anadarko Petroleum corporation. chairman of the Board of Directors of Sm Energy company. Director of legacy Reserves GP, llc. Director of targa Resources Partners GP, llc. Director of cSI compressco GP Inc. Director of tEtRa technologies, Inc. since 2007.
kEnnEth E. WhItE, JR. (1, 2) Retired President and chief operating officer of torch Energy advisors. Director of tEtRa technologies, Inc. since 2002.
cOrpOrate OFFicers
StUaRt m. BRIGhtmanPresident and chief Executive officer
JoSEPh ElkhoURYSenior Vice President and chief operating officer
El IJ Io V. SERRanoSenior Vice President and chief Financial officer
PEtER J. P IntaRSenior Vice President
kEIth l. SchIll InGSenior Vice President
BaSS c. WallacE, JR.Senior Vice President and General counsel
t ImothY a. knoxPresident – cSI compressco GP Inc.
(1 ) m e m b e r, a u d i t c o m m i t t e e(2 ) m e m b e r, c o m p e n s a t i o n c o m m i t t e e(3 ) m e m b e r, n o m i n a t i n g a n d c o r p o r a t e G o v e r n a n c e c o m m i t t e e( * ) I n d i c a t e s c o m m i t t e e c h a i r m a n s h i p
BEn c. chamBERSVice President – accounting and controller
JoSEPh J. mEYERVice President – Finance and treasurer
El ISaBEth k. EVanSVice President – human Resources
stOckHOlder inFOrmatiOn
coRPoRatE hEaDQUaRtERStEtRa technologies, Inc. 24955 Interstate 45 north the Woodlands, tx 77380 281.367.1983 tetratec.com
StockholDER RElatIonStEtRa technologies, Inc. 24955 Interstate 45 north the Woodlands, tx 77380
tRanSFER aGEnt anD REGIStRaRcomputershare Investor Services 350 Indiana Street, Suite 800 Golden, co 80401 303.262.0600
Stock l IStInGShares of common stock of tEtRa technologies, Inc. trade on the new York Stock Exchange under the ticker symbol: ttI.
InDEPEnDEnt aUDItoRSErnst & Young llP 5 houston center 1401 mckinney Street, Suite 1200 houston, tx 77010
FoRm 10-kthe company’s Form 10-k for the year ended December 31, 2014 is included in this annual Report. additional copies may be obtained free of charge by visiting the company’s website (tetratec.com) or by writing to:
Stockholder Relations tEtRa technologies, Inc. 24955 Interstate 45 north the Woodlands, tx 77380
annUal mEEtInGthe annual meeting of stockholders will be held at 11:00 a.m. local time on tuesday, may 5, 2015, at our corporate headquarters in the Woodlands, texas.
DIScloSURE cERtIF IcatIonas required by the nYSE listing standards, Stuart m. Brightman, our chief Executive officer, certified on may 24, 2014, that he was not aware of any violation by the company of nYSE corporate governance listing standards. the certification required by Section 302 of the Sarbanes-oxley act was filed with the SEc on march 2, 2015, as an exhibit to our annual Report on Form 10-k.
copyright © 2015 tEtRa technologies, Inc. all Rights Reserved.
Water management - TETRA’s engineers responded to our customers’ need for a real-time water management solution by developing real-time water monitoring and blending technologies. Using TETRA’s patented ‘on-the-fly’ water treatment system and blending manifold in combination with TETRA’s proprietary water blending controller enables our clients to take the guesswork out of combining produced water, flowback water, brackish water, or freshwater into a consistent, high-quality blend that meets specifications required for hydraulic fracturing.
manufacturing - Our El Dorado facility achieved new levels of success in safety with zero injuries and environmental incidents. There was also 100% participation in our Employee Hazard Recognition program. Along the way, several production and shipping records were set for liquid calcium chloride (CaCl2), showing that HSEQ and Production go hand-in-hand— a real "DRIVE to ZERO" success story.
Fluids - Our Technology Center continues to exceed customer expectations by delivering creative and innovative completion fluids solutions.
compression Services - CSI Compressco is a provider of compression equipment and services for natural gas and oil production, gathering transportation, processing, and storage. In addition to our fee-based compression services, we design, fabricate, and sell standard and custom compressor packages and oilfield pump systems, and provide aftermarket services.
offshore Services - The TETRA Hedron is one of the most powerful derrick barges in its class, capable of lifting this 1,600-ton platform jacket as part of a permanent abandonment solution in the Gulf of Mexico. Our Heavy Lift group provides integrated and synergistic services to our domestic and international customers with a full-range of abandonment and construction solutions.
Production testing - TETRA performed its first, integrated rigless testing operation in the Middle East. We were the primary supplier for this successful operation, coordinating well testing, coiled tubing, wireline, perforating, and slickline services.
tEtRa technologies, Inc. is a geographically diversified oil and gas services company, focused on completion fluids and associated products and services, water management, frac flowback, production well testing, offshore rig cooling, compression services and equipment, and selected offshore services including well plugging and abandonment, decommissioning, and diving. headquartered in the Woodlands, texas, tEtRa is a global company with employees and operations on six continents.
cSI compressco - This 1,380 Hp compressor package can reduce pressure at the wellhead to improve production, while also boosting the pressure of the gas for delivery to a gathering system, processing plant, or a variety of other applications.
te t ratec.com
TETRA Technologies, Inc.GLOBAL HEADQUARTERS24955 Interstate 45 North
The Woodlands, TX 77380
281.367.1983
TETRA Techno logies , Inc.2014 AnnuAl RepoRt
®
®
DEDICATED TO THE CØRE
EMP
LO Y EE
S
CEØ
CU
S
T OM ER
S
DRIV
E to ZER
O
TETRA
Technolo
gies, Inc. 2014 A
nn
uA
l R
ep
oR
t