texas a&m presentation 2011 suit showdown
TRANSCRIPT

8/6/2019 Texas A&M Presentation 2011 SUIT Showdown
http://slidepdf.com/reader/full/texas-am-presentation-2011-suit-showdown 1/37
Leisure Destinations International
SUIT Ca se Competition – Antaeus Consulting (Team: C3)
Subhankar Banerjee , Efesa Origb o, Ma rtin Knaac k

8/6/2019 Texas A&M Presentation 2011 SUIT Showdown
http://slidepdf.com/reader/full/texas-am-presentation-2011-suit-showdown 2/37
Case Background
Issues Analysis
Candidate Solutions and Analysis
Our Solution
Questions
Agenda

8/6/2019 Texas A&M Presentation 2011 SUIT Showdown
http://slidepdf.com/reader/full/texas-am-presentation-2011-suit-showdown 3/37
Case Background
Analysis of Current State

8/6/2019 Texas A&M Presentation 2011 SUIT Showdown
http://slidepdf.com/reader/full/texas-am-presentation-2011-suit-showdown 4/37
SWOT Analysis: LDI
STRENGTHS
•Regional structure promoting knowledge
sharing
•Strong growth in resort club and
operations .•High customer satisfaction.
•Economies of scale
WEAKNESSES
•Decline in real estate business revenues
• Lack of synergy between corporate and
regional initiatives
OPPORTUNITIES
• Post-recession period marked with
increased willingness to spend by
customers.
• Cross selling and up selling opportunities
to the loyal customer base.
THREATS
• Real estate markets continues to remain
weak.
• Global warming and low snowfall posing
threats to some segments of the
company.
8/6/2019 Texas A&M Presentation 2011 SUIT Showdown
http://slidepdf.com/reader/full/texas-am-presentation-2011-suit-showdown 5/37
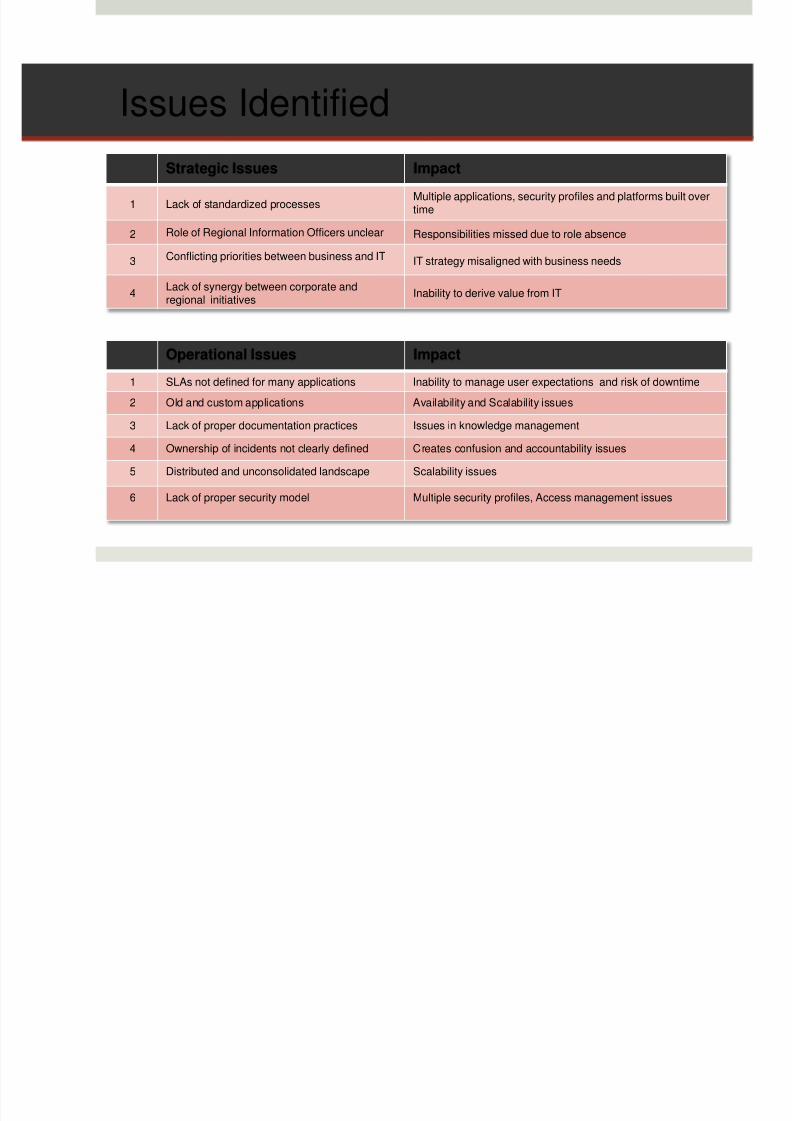
Strategic Issues Impact
1 Lack of standardized processesMultiple applications, security profiles and platforms built overtime
2 Role of Regional Information Officers unclear Responsibilities missed due to role absence
3Conflicting priorities between business and IT
IT strategy misaligned with business needs
4Lack of synergy between corporate andregional initiatives
Inability to derive value from IT
Operational Issues Impact
1 SLAs not defined for many applications Inability to manage user expectations and risk of downtime
2 Old and custom applications Availability and Scalability issues
3 Lack of proper documentation practices Issues in knowledge management
4 Ownership of incidents not clearly defined Creates confusion and accountability issues
5 Distributed and unconsolidated landscape Scalability issues
6 Lack of proper security model Multiple security profiles, Access management issues
Issues Identified

8/6/2019 Texas A&M Presentation 2011 SUIT Showdown
http://slidepdf.com/reader/full/texas-am-presentation-2011-suit-showdown 6/37
People
Lack of synergy between corporate and regional initiatives
Conflicting priorities between business and IT
Role of Regional Information Officers unclear
Process
Non-standardized processes
Absence of proper security model
Lack of SLAs for some applications
Lack of proper knowledge management processes
Ownership of incidents not clearly defined
Technology
Distributed and unconsolidated landscape
Old and Custom applications
Network issues
Root Cause Analysis

8/6/2019 Texas A&M Presentation 2011 SUIT Showdown
http://slidepdf.com/reader/full/texas-am-presentation-2011-suit-showdown 7/37
Implied Risks
1 Downtime
Old applications posing risks of availability
2 Security IncidentsIn absence of proper security methods, probability of security incidents is high
3 Inefficient processes
Significant loss of time and money
4 Non-Scalability
Lack of standardization is posing risk to scalability of IT
5 Decreased service level
Availability, reliability, maintainability and capacity risks
6 Expectation Management
Absence of proper metrics and SLAs causing issues in Managing expectation
H
H
H
M
H
L
Risks Imposed by Current Situation

8/6/2019 Texas A&M Presentation 2011 SUIT Showdown
http://slidepdf.com/reader/full/texas-am-presentation-2011-suit-showdown 8/37
“March Madness” Reflects Top 3 Risks
LDI cannot afford another “March Madness”!
DowntimeOne hour downtime on
major internal and externalsystems
SecurityIncident
Possible security breach
(Denial of Service Attack?)
Possible loss of customer dataintegrity
InefficientProcesses
Poor crisis managementprocedures

8/6/2019 Texas A&M Presentation 2011 SUIT Showdown
http://slidepdf.com/reader/full/texas-am-presentation-2011-suit-showdown 9/37
Analysis of Potential Solutions

8/6/2019 Texas A&M Presentation 2011 SUIT Showdown
http://slidepdf.com/reader/full/texas-am-presentation-2011-suit-showdown 10/37
Options Available

8/6/2019 Texas A&M Presentation 2011 SUIT Showdown
http://slidepdf.com/reader/full/texas-am-presentation-2011-suit-showdown 11/37
AlternativesCurrent
State
Centralized
Architecture
Distributed
Architecture
Hybrid
(Centralized/Distributed)
Architecture
Standardization
Data
Consolidation
Server
Consolidation
IT Service
Management
Web 2.0
Cloud
Computing
Outsourcing
Potential Solutions

8/6/2019 Texas A&M Presentation 2011 SUIT Showdown
http://slidepdf.com/reader/full/texas-am-presentation-2011-suit-showdown 12/37
Eva lua tion Matrix
Evaluation Criteria Weight Status Quo Centralized Distributed HybridAddresses Current Issues
1. Non-standardized IT Infrastructure and processes
30%
√ √ √
2. Lack of synergy between regions and headquarters √
3. Absence of enterprise-wide solutions √ √
Score 0 2 1 3
Resolves Symptoms
1. Strategic Level
20%
√
2. Operational level √ √ √
Score 0 1 1 2
Respects Restrictions
1. Rapid business growth10%
√ √ √
2. Cautious post-recession IT investments √
Score 2 0 1 1
Accomplishes Goals
1. Improve IT service levels
20%
√ √ √
2. Improve collaboration and knowledge utilizationto drive future growth√ √
3. Economies of scale for applications and data √
Score 0 3 1 2
Provides Long-term Benefits
Benefits: Scalability, Availability, Performance 20% √ √
Score 0 1 0 1
Ranking 100% 0.2 1.6 0.8 2.0

8/6/2019 Texas A&M Presentation 2011 SUIT Showdown
http://slidepdf.com/reader/full/texas-am-presentation-2011-suit-showdown 13/37
Hybrid System Architecture

8/6/2019 Texas A&M Presentation 2011 SUIT Showdown
http://slidepdf.com/reader/full/texas-am-presentation-2011-suit-showdown 14/37
Current Architecture

8/6/2019 Texas A&M Presentation 2011 SUIT Showdown
http://slidepdf.com/reader/full/texas-am-presentation-2011-suit-showdown 15/37
Target Architecture
Database

8/6/2019 Texas A&M Presentation 2011 SUIT Showdown
http://slidepdf.com/reader/full/texas-am-presentation-2011-suit-showdown 16/37
Implementation Plan
Timeline Measures Results
Short
•Consolidation•Applications•Databases
•Email• Improve Network capacity
•Consolidated IT landscape•Better availability and security forapplications like RESERVE
•Faster communication to remote sites
Medium
• Enterprise solutions• Knowledge portal (web 2.0)•Mobile Apps•Video Conferencing
•Improved collaboration and knowledgeutilization•Economies of scale.
Long
•Green-IT initiatives•Evaluate
•Cloud Computing•Outsourcing (HR, Finance)
•Reduced cost for IT operations•Focus on value providing services.

8/6/2019 Texas A&M Presentation 2011 SUIT Showdown
http://slidepdf.com/reader/full/texas-am-presentation-2011-suit-showdown 17/37
IT Service Management

8/6/2019 Texas A&M Presentation 2011 SUIT Showdown
http://slidepdf.com/reader/full/texas-am-presentation-2011-suit-showdown 18/37
IT Service Management
Severa l proc ess issues c anbe solved using ITSM
Identified 12 ITIL p roc essesto be imp lemented
Phased ap proa c h
0
1
2
3
4
5
IncidentManagement
ProblemManagement
Service Desk
ChangeManagement
ReleaseManagement
AccessManagement
Service AssetsService LevelManagement
AvailabilityManagement
CapacityManagement
IT SecurityManagement
KnowledgeManagement
Service Continuity
0- None 1- Weak 2- Fair 3- Capable 4- Mature 5- World Class Current State
Target State

8/6/2019 Texas A&M Presentation 2011 SUIT Showdown
http://slidepdf.com/reader/full/texas-am-presentation-2011-suit-showdown 19/37
ITSM - Roadmap
Baselineassessment
Identifyingkey painpoints
Prioritizationdepending onbusinesscriticality
ITIL proc esses toeradicate painpoints
Identify ke yme trics ,po lic ies ,proc ess ownersand resources
Redesignidentifiedprocesses toeliminate gap s
Identifying k eyme trics, proc essowne rs andresources
Implementide ntified ITILprocess
Track key me tricsto evaluateproc ess efficienc y
Businessdriven ITvision
SetupInitiative
Current StateAnalysis
StrategyDevelopment
Process
Re-Design
Implement &Measure
Continuous Business Process Improvement Cycle

8/6/2019 Texas A&M Presentation 2011 SUIT Showdown
http://slidepdf.com/reader/full/texas-am-presentation-2011-suit-showdown 20/37
Prioritizing ITSM processes
Process Criticality Vulnerability Score
IT Security Management 5 4 20
Service ContinuityManagement
4 4 16
Problem Management 4 4 16
Service Level Mgmt 4 4 16
Incident Management 5 3 15
Availability Management 3 4 12
Capacity Management 3 4 12
Access Management 3 4 12
Asset Management 5 2 10
Release Management 3 3 9
Knowledge Management 3 3 9
Change Management 2 4 8

8/6/2019 Texas A&M Presentation 2011 SUIT Showdown
http://slidepdf.com/reader/full/texas-am-presentation-2011-suit-showdown 21/37
Implementation Timeline
Timeline Measures Results
Short
•Centralize service desks• Implement ITIL processes:
•Incident
•Problem•IT Security•Service Level and•Service Continuity
•Disaster recovery plan• Ownership of incidents• Centralized help desk
• SLAs clearly defined for all applications• Strong security procedures and policies
Medium
• Review and test all implementedprocesses• Implement ITIL processes:
•Availability•Capacity and•Access management
• Mature IT Service Management processes• Optimized capacity plan and high availability• Proper management of user profiles
Long
•Implement Release, Change andKnowledge Management• Evaluate other ITIL processes
•Proper developing and testing procedures.• Optimized and flexible IT services.

8/6/2019 Texas A&M Presentation 2011 SUIT Showdown
http://slidepdf.com/reader/full/texas-am-presentation-2011-suit-showdown 22/37
Timeline
1 year 3 years 5 years
Medium Term
Short Term
Long Term
Current

8/6/2019 Texas A&M Presentation 2011 SUIT Showdown
http://slidepdf.com/reader/full/texas-am-presentation-2011-suit-showdown 23/37

8/6/2019 Texas A&M Presentation 2011 SUIT Showdown
http://slidepdf.com/reader/full/texas-am-presentation-2011-suit-showdown 24/37

8/6/2019 Texas A&M Presentation 2011 SUIT Showdown
http://slidepdf.com/reader/full/texas-am-presentation-2011-suit-showdown 25/37
Financial Analysis: Costs
Type of Investment Values*
Initial Investment
Hardware / Software $0.2 million
Consulting / Application
Development
$1.2million
Project Management $0.2 million
IT Service Management $0.7 million
TOTAL $2.3 million
Annual Operating Costs
Hardware/Software $0.9million
IT Service Management $0.07 million
TOTAL (NPV 5 Years) $4.8 million
* For detailed calculations see Exhibits
8/6/2019 Texas A&M Presentation 2011 SUIT Showdown
http://slidepdf.com/reader/full/texas-am-presentation-2011-suit-showdown 26/37
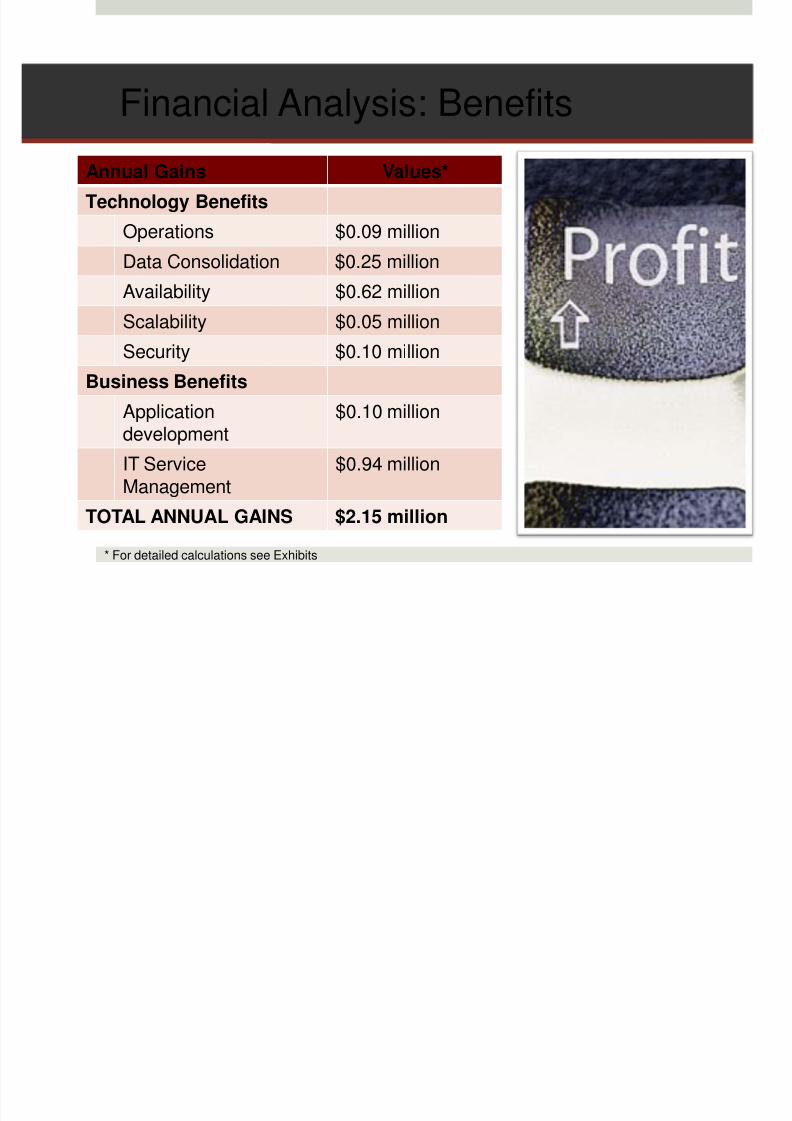
Financial Analysis: Benefits
Annual Gains Values*
Technology Benefits
Operations $0.09 million
Data Consolidation $0.25 millionAvailability $0.62 million
Scalability $0.05 million
Security $0.10 million
Business Benefits
Applicationdevelopment
$0.10 million
IT ServiceManagement
$0.94 million
TOTAL ANNUAL GAINS $2.15 million
* For detailed calculations see Exhibits
8/6/2019 Texas A&M Presentation 2011 SUIT Showdown
http://slidepdf.com/reader/full/texas-am-presentation-2011-suit-showdown 27/37
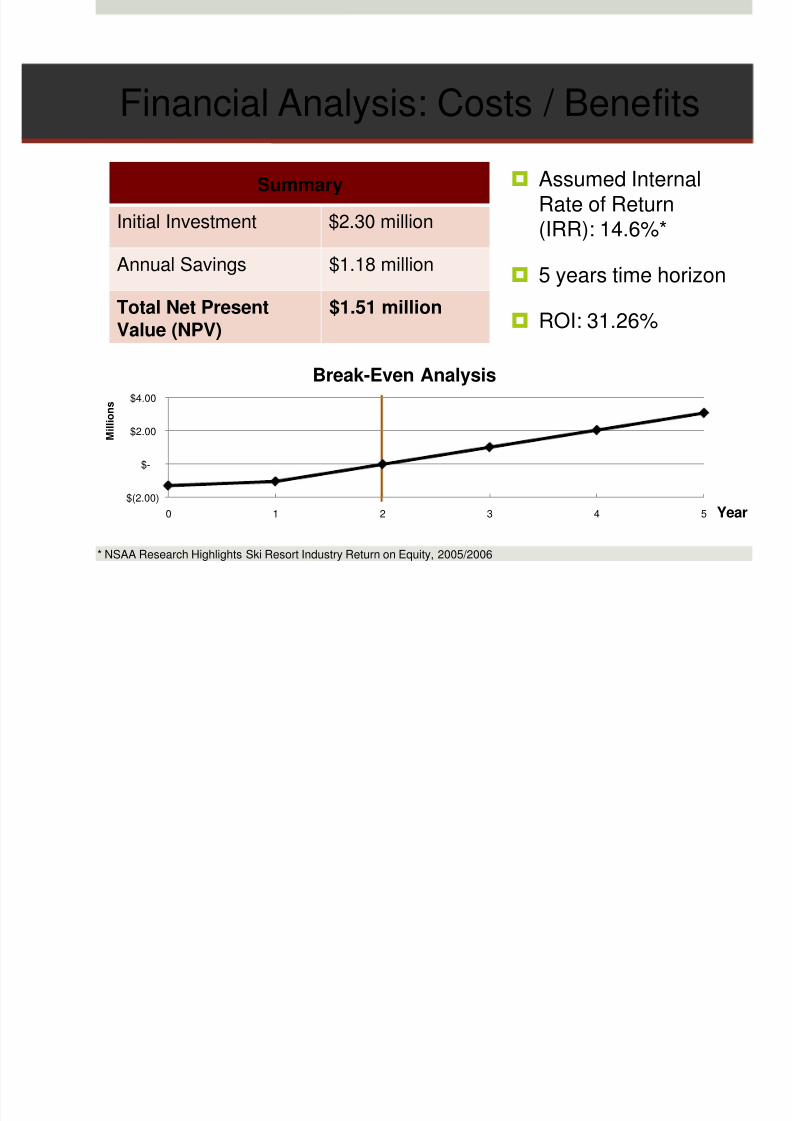
Financial Analysis: Costs / Benefits
$(2.00)
$-
$2.00
$4.00
0 1 2 3 4 5
M i l l i o n s
Break-Even Analysis
Summary
Initial Investment $2.30 million
Annual Savings $1.18 million
Total Net PresentValue (NPV)
$1.51 million
Assumed InternalRate of Return(IRR): 14.6%*
5 years time horizon
ROI: 31.26%
* NSAA Research Highlights Ski Resort Industry Return on Equity, 2005/2006
Year

8/6/2019 Texas A&M Presentation 2011 SUIT Showdown
http://slidepdf.com/reader/full/texas-am-presentation-2011-suit-showdown 28/37
Risk Analysis
Risk Impact Probability Mitigation
Insufficient user
involvement
Gather user requirements
Hold information sessions
Provide required trainings
Constantly communicate benefits
Lack of Management
Support
Assign project champion
Define clear transformation responsibilities and
roles
Align management goals to success of project
Technical
implementation
difficulties
Hire experts from inside or outside the company,
Follow proper testing procedures
Undermining of defined
processes
Have clear escalation procedures in place
Motivate employees with ‘Carrot and stick’
approach.
Regular processes and systems audit
Unable to fully exploit
benefits of
standardized IT
architecture and
systems
Transformation strategy, with rigorous cost-benefit
analysis
Tracking of transformation progress
Focus on reusability, scalability and performance in
architecture and service design
M
H
M
M
M
L
L
L
M
M

8/6/2019 Texas A&M Presentation 2011 SUIT Showdown
http://slidepdf.com/reader/full/texas-am-presentation-2011-suit-showdown 29/37
Change Management
IT steering c ommittee
Inc lude business and ITleaders
Prioritize p rojec ts andalloc ate budgets
More stra teg ic role for
RIOs Inc lude in the steering
committee
Restruc turing IT to
ac commod ate c hanges
Measures Results
Better business ITalignment
Struc tured IT Organiza tion
IT Budget a ligned toBusiness stra tegy

8/6/2019 Texas A&M Presentation 2011 SUIT Showdown
http://slidepdf.com/reader/full/texas-am-presentation-2011-suit-showdown 30/37
Current Organization Chart
Other VPs,Engineering &Technology
SVP, FinancialPlanning & Systems
SVP, Project &Corporate Finance
SVP,Technology & CIO
VP,InformationTechnology
VP,InformationTechnology
Director,IT Solutions
Director,Infrastructure
Director,IT Operations
Director,Strategy & Planning
RetailApplications
LegacyApplications
Team
Oracle Design andSupport
Microsoft Designand Support
Web Design andE-commerce
Internet/IntranetSolutions
Data & AssuranceServices
TechnicalArchitecture
RegionalPlanning and
Support
DesktopManagement
ServerCapacityManagement
NetworkManagement
DatabaseManagement
InfrastructureMonitoring and
Control
MainframeOperations
OperationShift Teams
CentralHelp Desk
Server/ DesktopOperations
DesktopService Desk
IT ServiceManagement
QualityAssurance
Testing
QualityAssurance
Testing
Budgets
ServiceContinuity
Strategic Planning andInvestment Analysis
TechnologyRefreshment

8/6/2019 Texas A&M Presentation 2011 SUIT Showdown
http://slidepdf.com/reader/full/texas-am-presentation-2011-suit-showdown 31/37
Wrap-Up
ITSM raises IT Service Level
Architecture transformation ensures highersecurity
Standardization exploits economies of scale
Proper change management reduces risks
Opportunity to scale IT with business growth

8/6/2019 Texas A&M Presentation 2011 SUIT Showdown
http://slidepdf.com/reader/full/texas-am-presentation-2011-suit-showdown 32/37
Thank you very much for your attention!
Questions?

8/6/2019 Texas A&M Presentation 2011 SUIT Showdown
http://slidepdf.com/reader/full/texas-am-presentation-2011-suit-showdown 33/37
Appendix

8/6/2019 Texas A&M Presentation 2011 SUIT Showdown
http://slidepdf.com/reader/full/texas-am-presentation-2011-suit-showdown 34/37
Exhibit I: Investment Costs

8/6/2019 Texas A&M Presentation 2011 SUIT Showdown
http://slidepdf.com/reader/full/texas-am-presentation-2011-suit-showdown 35/37
Exhibit II: Investment Benefits

8/6/2019 Texas A&M Presentation 2011 SUIT Showdown
http://slidepdf.com/reader/full/texas-am-presentation-2011-suit-showdown 36/37
Exhibit III: Summary Investment
$(2.00)$(1.50)$(1.00)$(0.50)
$-$0.50$1.00$1.50
0 1 2 3 4 5
M i l l i o n s
Cash Flows
Cash Flows
Year

8/6/2019 Texas A&M Presentation 2011 SUIT Showdown
http://slidepdf.com/reader/full/texas-am-presentation-2011-suit-showdown 37/37
People
Synergistic opportunities from collaboration between corporate and regional initiatives
Business/IT Organization alignment
Regional Information officers acting as regional project champions
Process
Standardized processes and systems
Robust and scalable security model
Appropriate SLAs to ensure high system availability
Transparent and accountable project ownership
TechnologyEconomies of scale from enterprise solutions
Efficient, flexible, and high-performing systems
Exhibit IV: Mapping Solution to Problems